
Submitted:
13 January 2025
Posted:
15 January 2025
You are already at the latest version
Abstract
This study evaluates the competitive performance of Mexican fresh grape exports in the United States market from 2002 to 2022. Over this period, Mexican exports exhibited a pronounced declining trend, while competitors such as Chile and Peru significantly increased their market shares. Employing the Revealed Comparative Advantage (RCA) index and the Constant Market Share Analysis (CMSA), the growth dynamics of export performance were systematically decomposed. The findings reveal a substantial contraction in Mexico’s export volumes and market share, which plummeted from 27.5% in 2002 to a mere 6.1% in 2022, alongside a marked decline in its RCA from 2.4 to 0.3. In stark contrast, Peru demonstrated remarkable growth, expanding its market share from 0.7% to 39.4%, driven by structural advantages and superior competitiveness. While Chile maintained consistent export volumes, it experienced a relative decline in market share, ceding ground to emerging players like Peru. The analysis underscores the structural and competitive challenges confronting Mexico in the U.S. fresh grape market, emphasizing the urgent need for strategic policy interventions. These should focus on enhancing productivity, capitalizing on market opportunities, and bolstering agricultural competitiveness. Peru’s success underscores the critical role of dynamic production strategies and alignment with evolving market demands in securing sustained export growth.
Keywords:
competitiveness
; revealed comparative advantage
; constant market share
; fresh grapes
; agricultural sector
1. Introduction
Historically, nations have relied on agricultural and food trade to complement their domestic production capacities. The unequal distribution of critical production factors—land, labor, and capital—combined with the diversity of climatic zones, has played a pivotal role in shaping agricultural output and, consequently, trade flows across countries and continents. Over the past three centuries, global trade has expanded significantly, with international trade emerging as a cornerstone of economic development. This expansion has been particularly pronounced in developing countries, driven by robust global economic growth and a relative reduction in trade barriers. It is important to recognize that the expansion of agricultural trade has not kept pace with the accelerated growth seen in industrial trade. This disparity underscores the persistent structural and policy challenges that constrain the integration of agriculture into the broader framework of global trade dynamics [1].
In 2024, agricultural exports across the Americas, encompassing 35 countries with available data from the FAO, totaled $573.6 million. Notably, five countries dominated the market, collectively contributing 85% of the region’s exports: the United States (34.4%), Brazil (22.4%), Canada (11.7%), Argentina (8.8%), and Mexico (7.7%). Mexico’s prominence as a leading agricultural exporter within the Americas is particularly significant. This achievement reflects the robust growth of its agri-food trade, which has positioned Mexico among the world’s foremost agricultural producers and exporters [2].
Maintaining prestige and market positioning in the agricultural sector necessitates the collective commitment of key stakeholders, including the government, private enterprises, industry associations, and other relevant actors. This effort is further challenged by persistent obstacles such as adverse climatic conditions, labor shortages, shifting consumer preferences, and the limited availability of arable land. In terms of export performance, Mexico achieved an annual growth rate of 3.5% in agricultural exports during the 2001–2011 period. However, this trajectory has largely reversed in subsequent years. Except for sporadic gains, exports have displayed a downward trend characterized by significant fluctuations in growth rates. Between 2012 and 2022, the annual growth rate declined to 2.4%, signaling a potential loss of market share and competitiveness in the global agricultural market. Over the entire 2001–2022 period, the average growth rate stood at 2.5%, reflecting a deceleration in Mexico’s export momentum.
Mexico stands out as one of the leading agricultural exporters to the United States, a position bolstered by its geographic proximity, the superior quality of its products, and its gradual shift toward sustainable agricultural practices. Nevertheless, the competitiveness of Mexico’s agricultural sector in the U.S. market is shaped by various external and internal factors, including trade policies, evolving consumer preferences, seasonal production patterns, and growing competition from other key exporters such as Chile and Peru. As reported by the FAO [2], the United States is the world’s largest importer of fresh grapes, with its primary trading partners—Chile, Mexico, Peru, and Canada—collectively accounting for 97% of total import flows.
Figure 1, illustrates the trends in fresh grape exports to both the United States and the global market from 2002 to 2022, focusing on the leading exporters: Mexico, Chile, and Peru. The data reveal distinct competitive and strategic dynamics among these countries. Mexico has experienced a noticeable decline in its competitiveness within the U.S. market. Meanwhile, Chile, despite retaining its status as a major exporter, faces increasing challenges due to the emergence of new competitors, particularly Peru, which has successfully established itself as a significant and rapidly growing player in this market.
Continuing with the quantitative analysis, Table 1 presents the evolution of Mexico’s fresh grape exports to the United States, highlighting a substantial decline in export volumes from 127,518.8 tons in 2002 to 36,571.4 tons in 2022. This shift corresponds to a dramatic reduction in Mexico’s market share, which fell from 27.5% to 6.1% over the same period. In contrast, Chile, while maintaining consistently high export volumes—321,434.1 tons in 2002 and 309,310.5 tons in 2022—experienced a decline in relative market share, decreasing from 69.2% to 51.8%. Meanwhile, Peru demonstrated remarkable growth, with export volumes increasing from 3,135.7 tons in 2002 to 234,955.3 tons in 2022. This growth translated into a surge in market share, rising from a modest 0.7% to an impressive 39.4%, underscoring Peru’s emergence as a dominant player in the U.S. fresh grape market.
On the global stage, notable trends emerge in the export behavior of fresh grapes. Mexico, which exported 129,010.4 tons in 2002, experienced a sharp decline in total exports to 37,680.4 tons by 2022. This reduction signifies a dramatic drop in its global market share, from 4.6% to a mere 0.7%. In contrast, Chile, while increasing its global export volume from 520,030.6 tons in 2002 to 605,635.7 tons in 2022, saw its market share diminish from 18.5% to 11.5%, highlighting the accelerated growth of other competitors. Peru, on the other hand, has emerged as a dynamic leader, boosting its exports from 11,676.7 tons in 2002 to 526,857.2 tons in 2022, which translates into a significant increase in global market share from 0.4% to 10.0%. These divergent dynamics underscore the ongoing shifts within the fresh grape market, where competition among Mexico, Chile, and Peru continues to intensify. This competitive landscape emphasizes the importance of assessing their market positions using analytical tools such as the Revealed Comparative Advantage (RCA) index and Constant Market Share (CMS) analysis to better understand their evolving roles in the global market.
The aim of this research is to examine the competitiveness of Mexican fresh grapes in the U.S. market over the period 2002–2022. By employing Revealed Comparative Advantage (RCA) and Constant Market Share (CMS) techniques, the study dissects the growth of Mexican exports into critical components, including competitiveness, market structure, and the global demand effect. The findings will not only highlight Mexico’s strengths and areas for improvement to strengthen its position in the U.S. market but also serve as a foundation for enhancing sustainable agricultural practices. This includes optimizing production processes, minimizing post-harvest losses, and fostering practices that align competitiveness with sustainable development in international trade. These insights will support policymakers in designing strategies to sustainably improve agricultural productivity while addressing the growing demands of global markets.
The core hypothesis of this research asserts that, while Mexico has maintained its status as a prominent exporter of fresh grapes to the United States, its competitiveness—evaluated using Revealed Comparative Advantage (RCA) and Constant Market Share (CMS) indicators—faces increasing challenges from the superior export performance of its key competitors. Section 2 of this paper will provide an exhaustive review of the literature on agricultural competitiveness, with a specific focus on the grape industry in various global contexts. This review aims to establish a solid theoretical foundation for a detailed empirical investigation. The research methodology will be systematically outlined in Section 3, followed by the presentation and critical interpretation of the findings in Section 4. The final section, Section 5, will consolidate the results and their broader implications, offering strategic insights to address the emerging challenges and enhance competitiveness in international markets.
2. Literature Review
The theoretical exploration of competitiveness has been extensive and is analyzed from two principal approaches. The first approach focuses on the micro level, grounded in the classical theory of industrial organization. This perspective posits that firms are unable to influence industry conditions or performance, attributing competitive advantage to external factors rather than internal capabilities [3]. The theories of the new industrial organization [4] suggest that a firm’s competitiveness is rooted in its internal strategic decisions. Similarly, the resource-based theory provides additional support at the micro level, with scholars such as Barney [5] and Wernerfelt [6] emphasizing that firms achieve competitiveness by leveraging their unique resources and capabilities.
The second approach focuses on the macro level, drawing from classical economic theories. Smith [7] posited that countries produce and trade goods in which they hold an absolute advantage. Expanding on this, Ricardo [8] later argued that nations produce and trade goods in which they possess a comparative advantage, highlighting the efficiency gains from specialization and trade. In the evolution of macro-level competitiveness theories, the neoclassical economic framework emerges, notably through the contributions of Heckscher [9] and Ohlin [10]. Their theory emphasizes that comparative advantages are determined by a country’s resource endowments, such as labor, capital, and natural resources, which shape its production and trade patterns.
Having outlined the distinctions in how economic theory explains different approaches to competitiveness, it is essential to examine the empirical evidence related to agricultural competitiveness, with a particular focus on grape production. Agriculture plays a pivotal role in fostering economic growth and development, and its competitiveness has been the subject of extensive research across various geographic regions. For instance, in Europe, Capobianco-Uriarte et al. [11] assessed the competitiveness of tomato exports using the Constant Market Share (CMS) methodology from a differentiated demand perspective. Their findings concluded that Spain and Belgium are the most competitive exporters within the European Union.
In Asia, the agri-food sector has garnered increasing importance in recent years, as demonstrated by various competitiveness studies. For example, Méndez-León et al. [12] analyzed the competitive positioning of Mexican meat in the Japanese market, while Tarihoran et al. [13] provided evidence on the competitiveness and export barriers faced by Indonesia in the ornamental fish sector. In China, Zhu et al. [14] analyzed the factors driving fluctuations in tuna product exports, while Zhou et al. [15] contributed to the literature by examining the decomposition of agricultural trade volatility and its implications for food security. A notable commonality among these studies in Asia is the application of the Constant Market Share (CMS) methodology to assess competitiveness and trade dynamics.
Studies on the competitiveness of fresh grapes have been particularly significant in the global literature. Numerous investigations in both Europe and Latin America have provided valuable insights, contributing to the understanding and application of diverse methodologies to assess the competitive positioning of this agricultural product across different regions of the world [16]. Bisson and Tang Tong [17] conducted a study exploring the competitive intelligence (CI) practices of fresh grape exporting firms in Peru. Their research aimed to develop a typology of these practices and examine the relationship between various factors—such as firm size, the proportion of grape exports in total exports, the percentage of the Red Globe variety in total grape exports, and farm size—with levels of CI practice implementation and the average export price received.
Similarly, in Peru, a study analyzed the growth of avocado and grape exports in the Arequipa region, reporting an increase of 42% and 46%, respectively, between 2010 and 2019 [18]. Additionally, Valencia Sandoval and Duana Avila [19] conducted a comparative analysis of grape competitiveness between Mexico and Peru, focusing on differences in agricultural practices and market conditions. Their study also delves into Mexico’s local conditions, examining their impact on the competitiveness of Mexican grapes in the international market.
In North Africa, competitiveness analysis has been conducted in Egypt for the period 2017–2021, aiming to identify the country’s comparative advantages relative to other grape producers and its positioning in the international market. The study employed the market penetration coefficient to assess the acceptance of Egyptian grapes in key markets, including the United Kingdom, the Netherlands, and Germany. The findings highlight significant opportunities for Egypt to expand its grape exports while underscoring the need for enhanced competitiveness to effectively rival other producing countries [20].
In summary, the literature review demonstrates that both microeconomic and macroeconomic theories offer valuable frameworks for understanding competitiveness. Empirical evidence from the agri-food sector, particularly in the case of fresh grapes, underscores the critical role of both internal and external strategic factors in shaping the competitiveness of agricultural exports.
3. Materials and Methods
To assess the competitiveness of fresh grapes in the U.S. market, this study proposes the application of two established metrics to evaluate the export performance of this product. The selection of these metrics is informed by the guidelines and recommendations of the World Economic Forum for measuring competitiveness, ensuring a robust and standardized approach to the analysis [21]. The measures employed in this study are the Revealed Comparative Advantage (RCA) index, as proposed by Vollrath [22], and the Constant Market Share (CMS) method, following the approach of Ahmadi-Esfahani [23]. These techniques are applied to analyze the competitive performance of Mexico, Chile, and Peru—the primary players in this agricultural sector—over the period 2002–2022, using annual data expressed in tons.
The RCA index, a refinement of the measure originally proposed by Balassa [24], quantifies a country’s relative advantage in exporting a specific product. A positive RCA value indicates the presence of a relative competitive advantage, whereas zero or negative values denote a disadvantage. A value of 1 represents competitive neutrality, signifying that the country’s competitiveness is on par with that of its competitors for the given product. Values exceeding 1 reflect a pronounced competitive advantage in the export of the product.
The RCA index is calculated using the following formula:
Where represents the relative export advantage of product a in country i. The variables in the formula are defined as follows:
- : The export value of product a in country i.
- : The total export value of country i excluding product a.
- : The total export value of product a in the global market, excluding country i.
- : The total export value in the global market, excluding product a and country i.
This study employs the version of the RCA index developed by Ahmadi-Esfahani [23], which decomposes changes in exports into two levels: direct effects and the components of each effect. The Constant Market Share (CMS) method allows for the analysis of changes in exports of a specific product by distinguishing between structural and competitiveness components.
The empirical analysis using the CMS methodology relies on the proportional share of exports from the analyzed country, represented by S in Equation 2. In this context:
Where:
- q: Represents the exports of the focus country to the destination market.
- Q: Represents the total exports to the destination market, encompassing all countries exporting to that specific market.
Starting from Equation 2, the value of the country’s exports is isolated, resulting in Equation 3, which represents the market share. By applying the first derivative with respect to time, Equation 4 is obtained. In this formulation, represents the temporal variation, while the terms on the right-hand side correspond to the decomposition of export growth into its constituent components.
The first level of decomposition is formulated as follows:
Where:
- : Structural Effect. This component represents the expected change in exports if the country’s initial share in both the global and U.S. markets remains constant. A positive value indicates that growth in demand for the product positively impacts export growth.
- : Competitiveness or Residual Effect. This term reflects the portion of the change in exports attributable to changes in competitiveness over the analyzed period. A positive value signifies an increase in competitiveness, while a negative value indicates a loss of competitiveness.
- : Interaction or Second-Order Effect. This component captures the influence of the interaction between changes in market share and changes in demand.
The second level of decomposition further refines this analysis by deriving six additional effects from the components outlined in the first level. These effects are structured as follows:
Where:
- : Growth effect. Reflects the part of the increase in exports that is due to an increase in world demand, while the exporting country’s share of the world market remains constant.
- : Market effect. Measures the additional change in exports, while the exporter keeps its share in the target market constant. If the sign is positive, it implies a concentration of exports in a given market.
- : Pure residual effect. Reflects the change in exports that would occur due to a change in overall competitiveness.
- : Static residual structural effect. Reflects the change in exports attributed to a change in competitiveness in a given market.
- : Pure second-order effect. Measures the interaction between the change in the exporter’s share of the target market and the change in world demand.
- : Dynamic structural residual effect. Reflects the interaction between the change in the exporter’s share in the target market with the change in the demand of that market.
Additionally, S represents the (percentage) market share of a specific country, Q the volume of exports of the group of competing countries exporting to the reference market (the standard), the change of the variable over time, 0 the beginning of the period, 1 the end of the period, so that ; likewise, is the share of a country in the world market and the exports of the group of countries to the world market.
These two methodologies provide a robust framework for evaluating a country’s competitive position within a specific market by focusing on a product or group of products over a defined period. While these techniques are commonly employed in numerous studies, recent research, such as that by Caamal-Cauich [25], Ávila Arce et al. [26], Enriqueta Montaño Méndez et al. [27], Arroyo Cossio and Hernández Flores [28], and Méndez-León et al. [12], has comprehensively analyzed Mexico’s export performance in various markets and for specific products.
Similarly, at the global level, studies by Zdráhal et al. [29], Soh et al. [30], Avendaño Ruiz et al. [31], Rani and Immanuel [32], Zhou et al. [15], Cao et al. [33], Zhu et al. [14], Guo and You [34], Fu and Tong [35], and Tarihoran et al. [13] have focused on assessing the international competitiveness of diverse products in various markets. These studies examine export trends and systematically decompose the factors influencing countries’ export performance, providing valuable insights into global trade dynamics.
3.1. Sources of Information
This empirical analysis, conducted with an ex-post approach, utilizes export data from the primary competing countries in the U.S. fresh grape market. The Revealed Comparative Advantage (RCA) indicator was examined for the period 2002–2022, with the data expressed in U.S. dollars. Additionally, the Constant Market Share (CMS) analysis was performed for the same period, with data expressed in tons. The statistical data were sourced from the UN Comtrade Database. According to the Harmonized System of the World Customs Organization [36], fresh grapes are classified under Heading 0806 of Chapter 8: “Fresh or dried grapes.” The specific subheadings included in this study are detailed in Table 2.
4. Results and Discussion
Initially, an analysis of the Revealed Comparative Advantage (RCA) index is conducted, with the results presented in Figure 2 and Table 3. The RCA index is interpreted under the premise that a country exhibits a revealed comparative advantage if the indicator is positive and exceeds a value of 1. Based on this criterion, the three countries analyzed—Mexico, Chile, and Peru—demonstrate competitive advantages in the export of fresh grapes. However, the analysis reveals significant variations over the examined period, emphasizing distinct dynamics, particularly those affecting Mexico, the focal country of this study.
The analysis of the 2002–2022 period indicates a marked decline in Mexico’s Revealed Comparative Advantage (RCA) index, closely aligned with its diminishing market share of fresh grape exports to the United States. In 2002, Mexico’s RCA stood at 2.4, signifying a moderate competitive advantage in the U.S. market. However, this advantage progressively weakened, dropping to 0.3 by 2021 and 2022, reflecting a substantial loss of competitiveness. Notably, since 2005, when the RCA was 1.9, and continuing through 2011 with an RCA of 1.1, Mexico failed to surpass the peak value of 2.2 recorded in 2017, ultimately concluding the period with an almost negligible RCA.
Simultaneously, competition from countries such as Chile and Peru intensified significantly during the same period. In 2002, Chile demonstrated an exceptional RCA of 846.9, underscoring its dominant position in the U.S. market. However, this dominance diminished substantially over time, with Chile’s RCA declining to 163.4 by 2022. This reduction reflects a significant loss of relative market share, particularly since 2004, when its RCA peaked at an impressive 1,368.6. The decline can be partially attributed to Peru’s extraordinary rise in competitiveness.
In stark contrast, Peru began the period with a modest RCA of 4.1 in 2002 but experienced remarkable growth, reaching an RCA of 495.9 in 2022. This exponential increase became particularly evident from 2011 onward, when its RCA stood at 30.0. Peru’s trajectory not only surpassed Mexico but also challenged Chile’s dominance, illustrating its emergence as a highly competitive and dynamic force in the fresh grape market.
Table 4 presents the results of the decomposition of fresh grape export growth from Mexico, Chile, and Peru in the U.S. market, utilizing the Constant Market Share (CMS) technique over the period 2002–2022. The results encompass both the first and second levels of disaggregation, with the signs and values of each effect providing a basis for comparing the export performance of the countries analyzed.
Mexico experienced a substantial decline of -104,638.2 metric tons in fresh grape exports, reflecting a significant loss of market share and a broad reduction in its competitiveness and ability to sustain or expand its position. Chile, while also facing a contraction of -87,060.2 metric tons, shows a slightly less severe decline than Mexico. This contraction indicates that, although Chile remains competitive, its position has weakened, particularly in the face of rising competition from emerging players like Peru. In contrast, Peru recorded a remarkable growth of 270,944.2 metric tons, positioning itself as the only country with positive performance and consolidating its status as the emerging leader in the market.
At the first level of decomposition, the structural effect, which measures the distribution of exports based on the global market structure, reveals distinct dynamics. Mexico registered a value of -24,978.7 metric tons, indicating that part of its competitiveness loss is linked to a reduced concentration in favorable markets. Chile, with a less pronounced structural effect of -8,393.3 metric tons, suggests that the market structure was relatively more favorable for its exports compared to Mexico. In contrast, Peru demonstrated a positive structural effect of 1,565.6 metric tons, reflecting that its growth was supported by a market structure conducive to its exports. The competitiveness effect, which captures changes attributable to a country’s competitive capacity, was negative for both Mexico and Chile, signifying a loss of competitiveness. Conversely, Peru achieved a significant positive value of 179,670.4 metric tons, underscoring its superior competitive performance in the market.
Regarding the second-order effect, which assesses the dynamic interactions between competitiveness and market structure, Mexico recorded 19,405.0 metric tons, suggesting that some dynamic synergies partially offset its losses. Chile exhibited a minimal dynamic impact with a value of 2,109.2 metric tons, reflecting limited positive interactions. Peru, however, displayed a robust second-order effect of 89,708.2 metric tons, reinforcing that its success was further amplified by favorable dynamic synergies between market structure and competitiveness.
At the second level of decomposition, the results reveal distinct dynamics for each country. The growth effect, which indicates changes in demand within existing markets, exhibited negative values for both Mexico and Chile, reflecting a contraction in demand in the markets where they operate. In contrast, the market effect, which assesses the influence of demand in specific markets on exports, was positive for Peru, registering a value of 249.4 tons. This suggests that Peru effectively oriented its export strategy toward expanding markets, such as the United States.
The pure residual effect also contributed positively for Peru, with a value of 301.8 tons. While the increase was modest, Peru’s performance outpaced that of Mexico and Chile, highlighting its export capacity. A similar trend is observed in the static residual structural effect, where Mexico recorded -33,067 tons, indicating that the market structures it operated in did not favor its exports. Chile experienced the strongest negative impact, with -115,452.6 tons, suggesting that the market structures were less advantageous. Conversely, Peru appeared to benefit from operating in markets with favorable structural conditions or, at the very least, avoided markets that posed significant structural disadvantages.
The pure second-order effect, which reflects a country’s ability to capitalize on simultaneous global market transformations, was negative for both Mexico and Chile, underscoring their diminished ability to adapt to changing conditions. In contrast, Peru achieved a positive result of 1,054.5 tons, showcasing its ability to respond effectively to shifts in global demand.
Finally, the dynamic structural residual effect, which examines variations in market structures and relative competitiveness, produced the only significantly positive result for Mexico in the PCM analysis. This suggests that, despite an overall decline in exports and competitiveness, Mexico was able to leverage certain dynamic opportunities in its target markets. Chile also displayed a positive result of 50,705.6 tons, reflecting its capacity to adapt to evolving market conditions, likely benefiting from its established experience as an exporter. Peru, however, achieved the highest value among the three countries, demonstrating its exceptional ability to exploit changing market dynamics and bolster its global competitiveness.
The findings of this study highlight Mexico’s unfavorable position in the U.S. fresh grape market, evidenced by a substantial 71% decline in exports over the analyzed period and a 21% reduction in its market share. Although Mexico remains among the top five exporters, these results underscore significant structural and competitiveness challenges for its fresh grape sector. Conversely, Peru demonstrates superior competitive capacity, not only surpassing its counterparts but also effectively leveraging market dynamics and structural advantages. This has enabled Peru to achieve consistent growth despite the highly competitive landscape. The analysis using the Revealed Comparative Advantage (RCA) index further confirms Peru’s strong comparative advantage over both Chile and Mexico, underscoring its remarkable potential to consolidate its position as the world’s leading fresh grape exporter.
These outcomes can be attributed to the differing production dynamics among the three countries during the study period. Fresh grape production in Mexico grew at an average annual rate of 3%, with an average output of 363,000 tons. Chile and Peru, however, recorded average annual growth rates of 2% and 10%, respectively, with average productions of 2.4 million tons and 431,000 tons. The data suggest that Mexico and Chile have struggled to capitalize on global demand and expand their exports to the United States. In contrast, Peru’s sustained production growth, coupled with its effective utilization of trade agreements with the United States, positions it as a strong and competitive player in the global fresh grape market.
Mexico’s negative performance highlights a distinct dynamic within its fruit and vegetable sector. Despite being one of the primary suppliers of food products to the United States, there is a critical need to enhance competitiveness to fully leverage its geographical proximity to this key market. These findings align with prior research [27,28,37], which has examined Mexico’s competitive position relative to other countries and products in the U.S. market. Although these studies analyzed different contexts and time periods, their conclusions consistently underscore that Mexico faces ongoing challenges in strengthening its competitive position and retaining leadership in products where it exhibits comparative advantages.
While the United States remains Mexico’s primary export destination, weaknesses in meeting the demand of this market have allowed new competitors to enter and gradually erode Mexico’s market share. This underscores the importance of addressing structural and competitiveness gaps to safeguard and expand Mexico’s position in the U.S. market.
5. Conclusions
The analysis of the Revealed Comparative Advantage (RCA) index and the decomposition of export growth using the Constant Market Share (CMS) technique in the U.S. fresh grape market reveals distinct dynamics among Mexico, Chile, and Peru during the period 2002–2022. These findings shed light on the strengths and challenges encountered by each country in their export performance. The RCA analysis indicates that, while all three countries exhibit competitive advantages in fresh grape exports, Mexico experienced a significant decline in this indicator over the study period. In 2002, Mexico’s RCA was 2.4, reflecting a moderate competitive advantage in the U.S. market. However, this advantage steadily diminished, reaching a value of 0.3 in 2021 and 2022, signaling a substantial loss of competitiveness.
This decline corresponds with a sharp reduction in Mexico’s market share, which fell from 21% at the beginning of the period to 6% in 2022. In contrast, Peru demonstrated a dramatic improvement in its RCA, increasing from 4.1 in 2002 to an impressive 495.9 in 2022, thereby consolidating its position as the emerging leader in this market. Chile, while retaining a significant presence, also faced a decline in its relative advantage, with its RCA decreasing from 846.9 in 2002 to 163.4 in 2022. The CMS analysis corroborates these findings. Mexico experienced a loss of 104,638.2 tons in the North American market, while Chile’s exports decreased by 87,060.2 tons. By contrast, Peru demonstrated remarkable growth, with an increase of 270,944.2 tons, underscoring its ability to capitalize on market opportunities in the United States.
At the first level of decomposition, the structural effect highlights that both Mexico and Chile faced negative values, suggesting a disadvantage in the distribution of their exports across favorable markets. Conversely, Peru recorded a positive structural effect, indicating that its market structure was conducive to export growth. These results emphasize the contrasting trajectories of these countries in leveraging their competitiveness and structural advantages within the U.S. fresh grape market.
In terms of competitiveness, the findings reveal a decline for both Mexico and Chile, while Peru stands out with a markedly positive performance. This outcome underscores Peru’s superior capacity to adapt and respond effectively to competitive market dynamics. Additionally, the second-order effects demonstrate that Mexico and Chile made limited use of dynamic synergies within their respective markets. In contrast, Peru effectively leveraged these interactions, further strengthening its competitive position. These differences can be partly attributed to the dynamics of fresh grape production in the three countries. Mexico achieved an average annual production growth of 3%, with an average output of 363,000 tons. Chile and Peru, on the other hand, recorded production increases of 2% and 10%, respectively, with averages of 2.4 million and 431,000 tons. Peru’s sustained growth reflects a well-executed strategy, effectively utilizing trade agreements and meeting the growing demand in the United States.
In summary, the analysis highlights a critical challenge for Mexico in enhancing its competitiveness in the U.S. fresh grape market. Meanwhile, Peru emerges as the undisputed leader, demonstrating its ability to adapt to market dynamics and capitalize on structural advantages. Chile, while still a significant player, faces challenges similar to those of Mexico, albeit to a lesser extent. These findings underscore the importance of implementing strategies aimed at improving competitiveness and diversifying markets, particularly for Mexico, to reverse its negative trend and fully capitalize on opportunities in international markets.
Author Contributions
Conceptualization, D.C.-E., and J.R.M.-L.; methodology, D.C.-E.; formal analysis, D.C.-E.; resources, D.C.-E.; writing—original draft, D.C.-E.; preparation, D.C.-E.; validation, D.C.-E., and J.R.M.-L.; writing—review and editing, D.C.-E., and J.R.M.-L.; visualization, D.C.-E.; supervision, J.R.M.-L. All authors have read and agreed to the published version of the manuscript.
Funding
This research received no external funding.
Institutional Review Board Statement
Not applicable.
Informed Consent Statement
Not applicable.
Data Availability Statement
Dataset available on request from the authors.
Conflicts of Interest
The authors declare no conflicts of interest.
References
- Jambor, A.; Babu, S. The Competitiveness of Global Agriculture. In Competitiveness of Global Agriculture: Policy Lessons for Food Security; Springer International Publishing: Cham, 2016; pp. 99–129. [Google Scholar] [CrossRef]
- FAO. Food and Agriculture Organization of the United Nations, 2024.
- Bain, J.S. Relation of Profit Rate to Industry Concentration: American Manufacturing, 1936–1940. The Quarterly Journal of Economics 1951, 65, 293–324. [Google Scholar] [CrossRef]
- Hansen, G.S.; Wernerfelt, B. Determinants of firm performance: The relative importance of economic and organizational factors. Strategic Management Journal 1989, 10, 399–411. [Google Scholar] [CrossRef]
- Barney, J.B. Organizational Culture: Can It Be a Source of Sustained Competitive Advantage? Academy of Management Review 1986, 11, 656–665. [Google Scholar] [CrossRef]
- Wernerfelt, B. A resource-based view of the firm. Strategic Management Journal 1984, 5, 171–180. [Google Scholar] [CrossRef]
- Smith, A. An Inquiry into the Nature and Causes of the Wealth of Nations (set); Methuen & Co.,London, 1776.
- Ricardo, D. On the Principles of Political Economy and Taxation, 3rd edition ed.; London: John Murray, 1817. [Google Scholar]
- Heckscher, E.F. The effect of foreign trade on the distribution of income. Ekonomisk Tidskrift (Economic Journal) 1919, 21, 497–512. [Google Scholar]
- Ohlin, B. Interregional and International Trade; Harvard University Press: Cambridge, Massachusetts, 1933. [Google Scholar]
- Capobianco-Uriarte, M.d.l.M.; Aparicio, J.; De Pablo-Valenciano, J.; Casado-Belmonte, M.d.P. The European tomato market. An approach by export competitiveness maps. PLOS ONE 2021, 16, 1–27. [Google Scholar] [CrossRef]
- Méndez-León, J.R.; Camarena-Gómez, D.M.J.; Salgado-Beltrán, L. Competitive Positioning of Mexican Pork in Japan. Agriculture 2023, 13. [Google Scholar] [CrossRef]
- Tarihoran, A.D.B.; Hubeis, M.; Jahroh, S.; Zulbainarni, N. Competitiveness of and Barriers to Indonesia’s Exports of Ornamental Fish. Sustainability 2023, 15. [Google Scholar] [CrossRef]
- Zhu, L.; Yang, C.; Yang, Z.; Lv, Z.; Wu, F.; Zhu, J. Analysis of Driving Factors for Fluctuations in China’s Tuna Product Exports from 2002 to 2022. Fishes 2024, 9. [Google Scholar] [CrossRef]
- Zhou, L.; Tong, G.; Qi, J.; He, L. China and Countries along the “Belt and Road”: Agricultural Trade Volatility Decomposition and Food Security. Agriculture 2022, 12. [Google Scholar] [CrossRef]
- Balogh, J.M.; Jámbor, A. The global competitiveness of European wine producers. British Food Journal 2017, 119, 2076–2088. [Google Scholar] [CrossRef]
- Bisson, C.; Tang Tong, M.M. Investigating the competitive intelligence practices of Peruvian fresh grapes exporters. Journal of Intelligence Studies in Business 2018, 8. [Google Scholar] [CrossRef]
- Aroquipa, O.; Meza, M. Medición De La Competitividad De Las Exportaciones De Palta Y Uvas Con El Índice De Ventaja Comparativa Revelada; Para La Región De Arequipa, Perú 2010-2019. Véritas 2021, 22, 31–39. [Google Scholar] [CrossRef]
- Valencia Sandoval, K.; Duana Avila, D. La competitividad del comercio de uva en el mercado internacional y en Estados Unidos: el caso de México y Perú. Revista Cimexus 2019, 14. [Google Scholar] [CrossRef]
- Allam, A.; Mahmoud, M.; Mahmoud, S. The Competitiveness of Egyptian Grapes Crop in the Most Important Global Markets. International Journal of Environmental Studies and Researches 2022, 1, 285–299. [Google Scholar] [CrossRef]
- Forum, W.E. Global Competitiveness Report 2019. Technical report, 2020.
- Vollrath, T.L. Competitiveness and Protection in World Agriculture; U.S. Department of Agriculture, Economic Research Service, 1989. Google-Books-ID: 8Y8wAAAAYAAJ.
- Ahmadi-Esfahani, F.Z. Wheat market shares in the presence of Japanese import quotas. Journal of Policy Modeling 1995, 17, 315–323. [Google Scholar] [CrossRef]
- Balassa, B. Trade Liberalisation and “Revealed” Comparative Advantage. The Manchester School 1995, 33, 99–123. [Google Scholar] [CrossRef]
- Caamal-Cauich, I. VENTAJA COMPARATIVA REVELADA DE LA FRESA (Fragaria spp.) MEXICANA EN LOS MERCADOS IMPORTADORES. Agro Productividad 2018, 11. [Google Scholar]
- Ávila Arce, A.; González Milán, D.d.J.; Montaño Méndez, I.E.; Vizcaíno Villareal, L.A.; Ávila Arce, A.; González Milán, D.d.J.; Montaño Méndez, I.E.; Vizcaíno Villareal, L.A. Análisis de la competitividad y comercialización de nuez pecanera mexicana en el mercado internacional. Revista mexicana de ciencias agrícolas 2020, 11, 895–904. [Google Scholar] [CrossRef]
- Enriqueta Montaño Méndez, I.; Avendaño Ruíz, B.; ÁvilaArce, A.; González Milán, D.d.J. Competitividad y el desequilibrio comercial de México en el mercado mundial de carne de bovino, 1990-2016. Ciencia y Tecnología Agropecuaria 2021, 22, 1–19. [Google Scholar] [CrossRef]
- Arroyo Cossio, A.J.; Hernández Flores, A.A. Competitividad de la fresa mexicana en el mercado estadounidense de 1992 a 2017. Ciencia y Tecnología Agropecuaria 2021, 22, 1–15. [Google Scholar] [CrossRef]
- Zdráhal, I.; Lategan, F.S.; Van Der Merwe, M. A constant market share analysis of the competitiveness of the Czech Republic’s agrifood exports (2002-2020) to the European Union. Agricultural Economics (Zemědělská ekonomika) 2023, 69, 498–509. [Google Scholar] [CrossRef]
- Soh, B.H.; Lim, G.T.; Chua, S.Y. Competitiveness of Malaysian fisheries exports: A constant market share analysis. Malaysian Journal of Economic Studies 2021, 58, 175–198. [Google Scholar] [CrossRef]
- Avendaño Ruiz, B.D.; Sierra López, O.A.; Cabezas Mora, W.F.; Avendaño Ruiz, B.D.; Sierra López, O.A.; Cabezas Mora, W.F. Competitividad de las empresas exportadoras de flores cortadas desde Colombia en el mercado de Estados Unidos de América, 2000-2019. Ciencia y Tecnología Agropecuaria 2023, 24. [Google Scholar] [CrossRef]
- Rani, P.; Immanuel, S. Export destinations for Indian ornamental fish: Constant market share analysis*. The Indian Journal of Animal Sciences 2015, 85, 533–537. [Google Scholar] [CrossRef]
- Cao, X.; Yang, S.; Huang, X.; Tong, J. Dynamic Decomposition of Factors Influencing the Export Growth of China’s Wood Forest Products. Sustainability 2018, 10, 2780. [Google Scholar] [CrossRef]
- Guo, Q.; You, W. Evaluating the International Competitiveness of RCEP Countries’ Biomass Products in the Context of the New Development Paradigm. Sustainability 2023, 15, 4102. [Google Scholar] [CrossRef]
- Fu, J.; Tong, G. Status of Sino–Russian Trade in Agricultural Products: Dual Consideration Based on Characteristics and Growth. Sustainability 2024, 16, 822. [Google Scholar] [CrossRef]
- USITC. United States International Trade Commission, 2024.
- Avendaño Ruiz, B.D. Globalización y competitividad en el sector hortofrutícola: México, el gran perdedor. El Cotidiano 2008, pp. 91–98. Publisher: Universidad Autónoma Metropolitana Unidad Azcapotzalco.
Figure 1.
United States: Global Imports of Fresh Grapes (millions of USD), 2002–2022. Source: Author’s elaboration based on data from (UN Comtrade, 2024).
Figure 1.
United States: Global Imports of Fresh Grapes (millions of USD), 2002–2022. Source: Author’s elaboration based on data from (UN Comtrade, 2024).
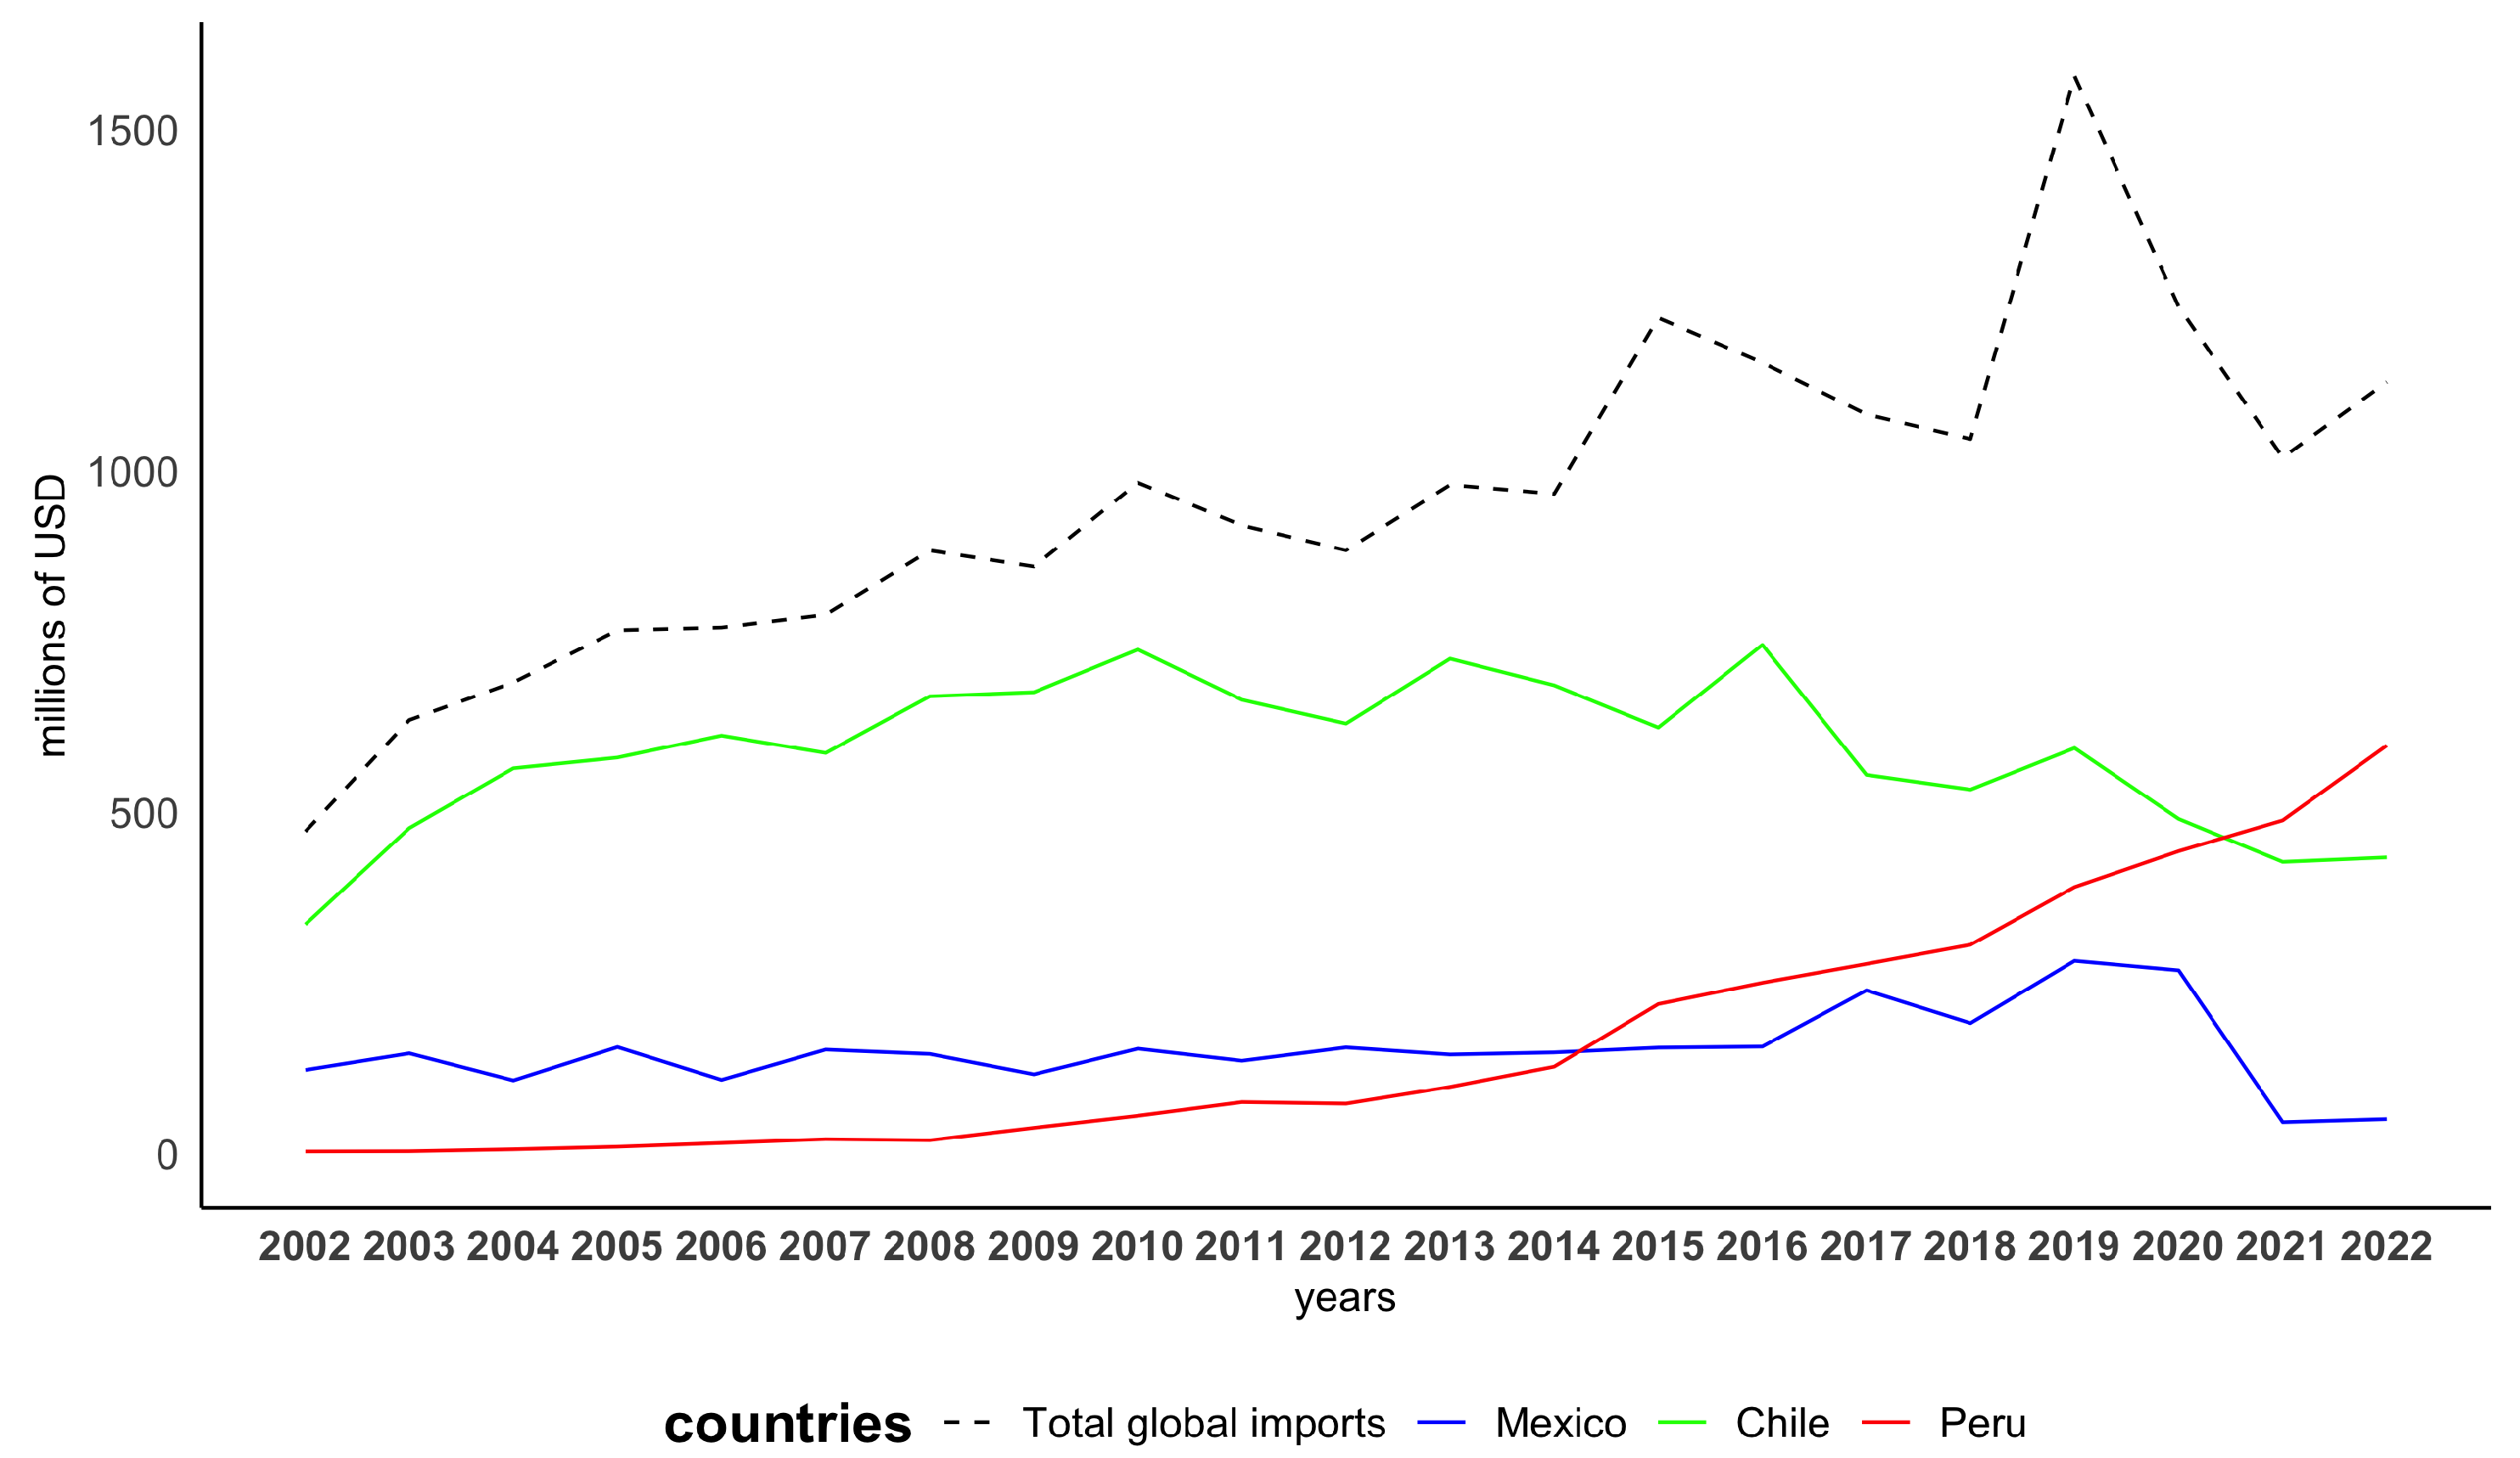
Figure 2.
RCA Index of the Leading Competitors in the North American Fresh Grapes Market Source: Author’s elaboration based on data from (UN Comtrade, 2024).
Figure 2.
RCA Index of the Leading Competitors in the North American Fresh Grapes Market Source: Author’s elaboration based on data from (UN Comtrade, 2024).
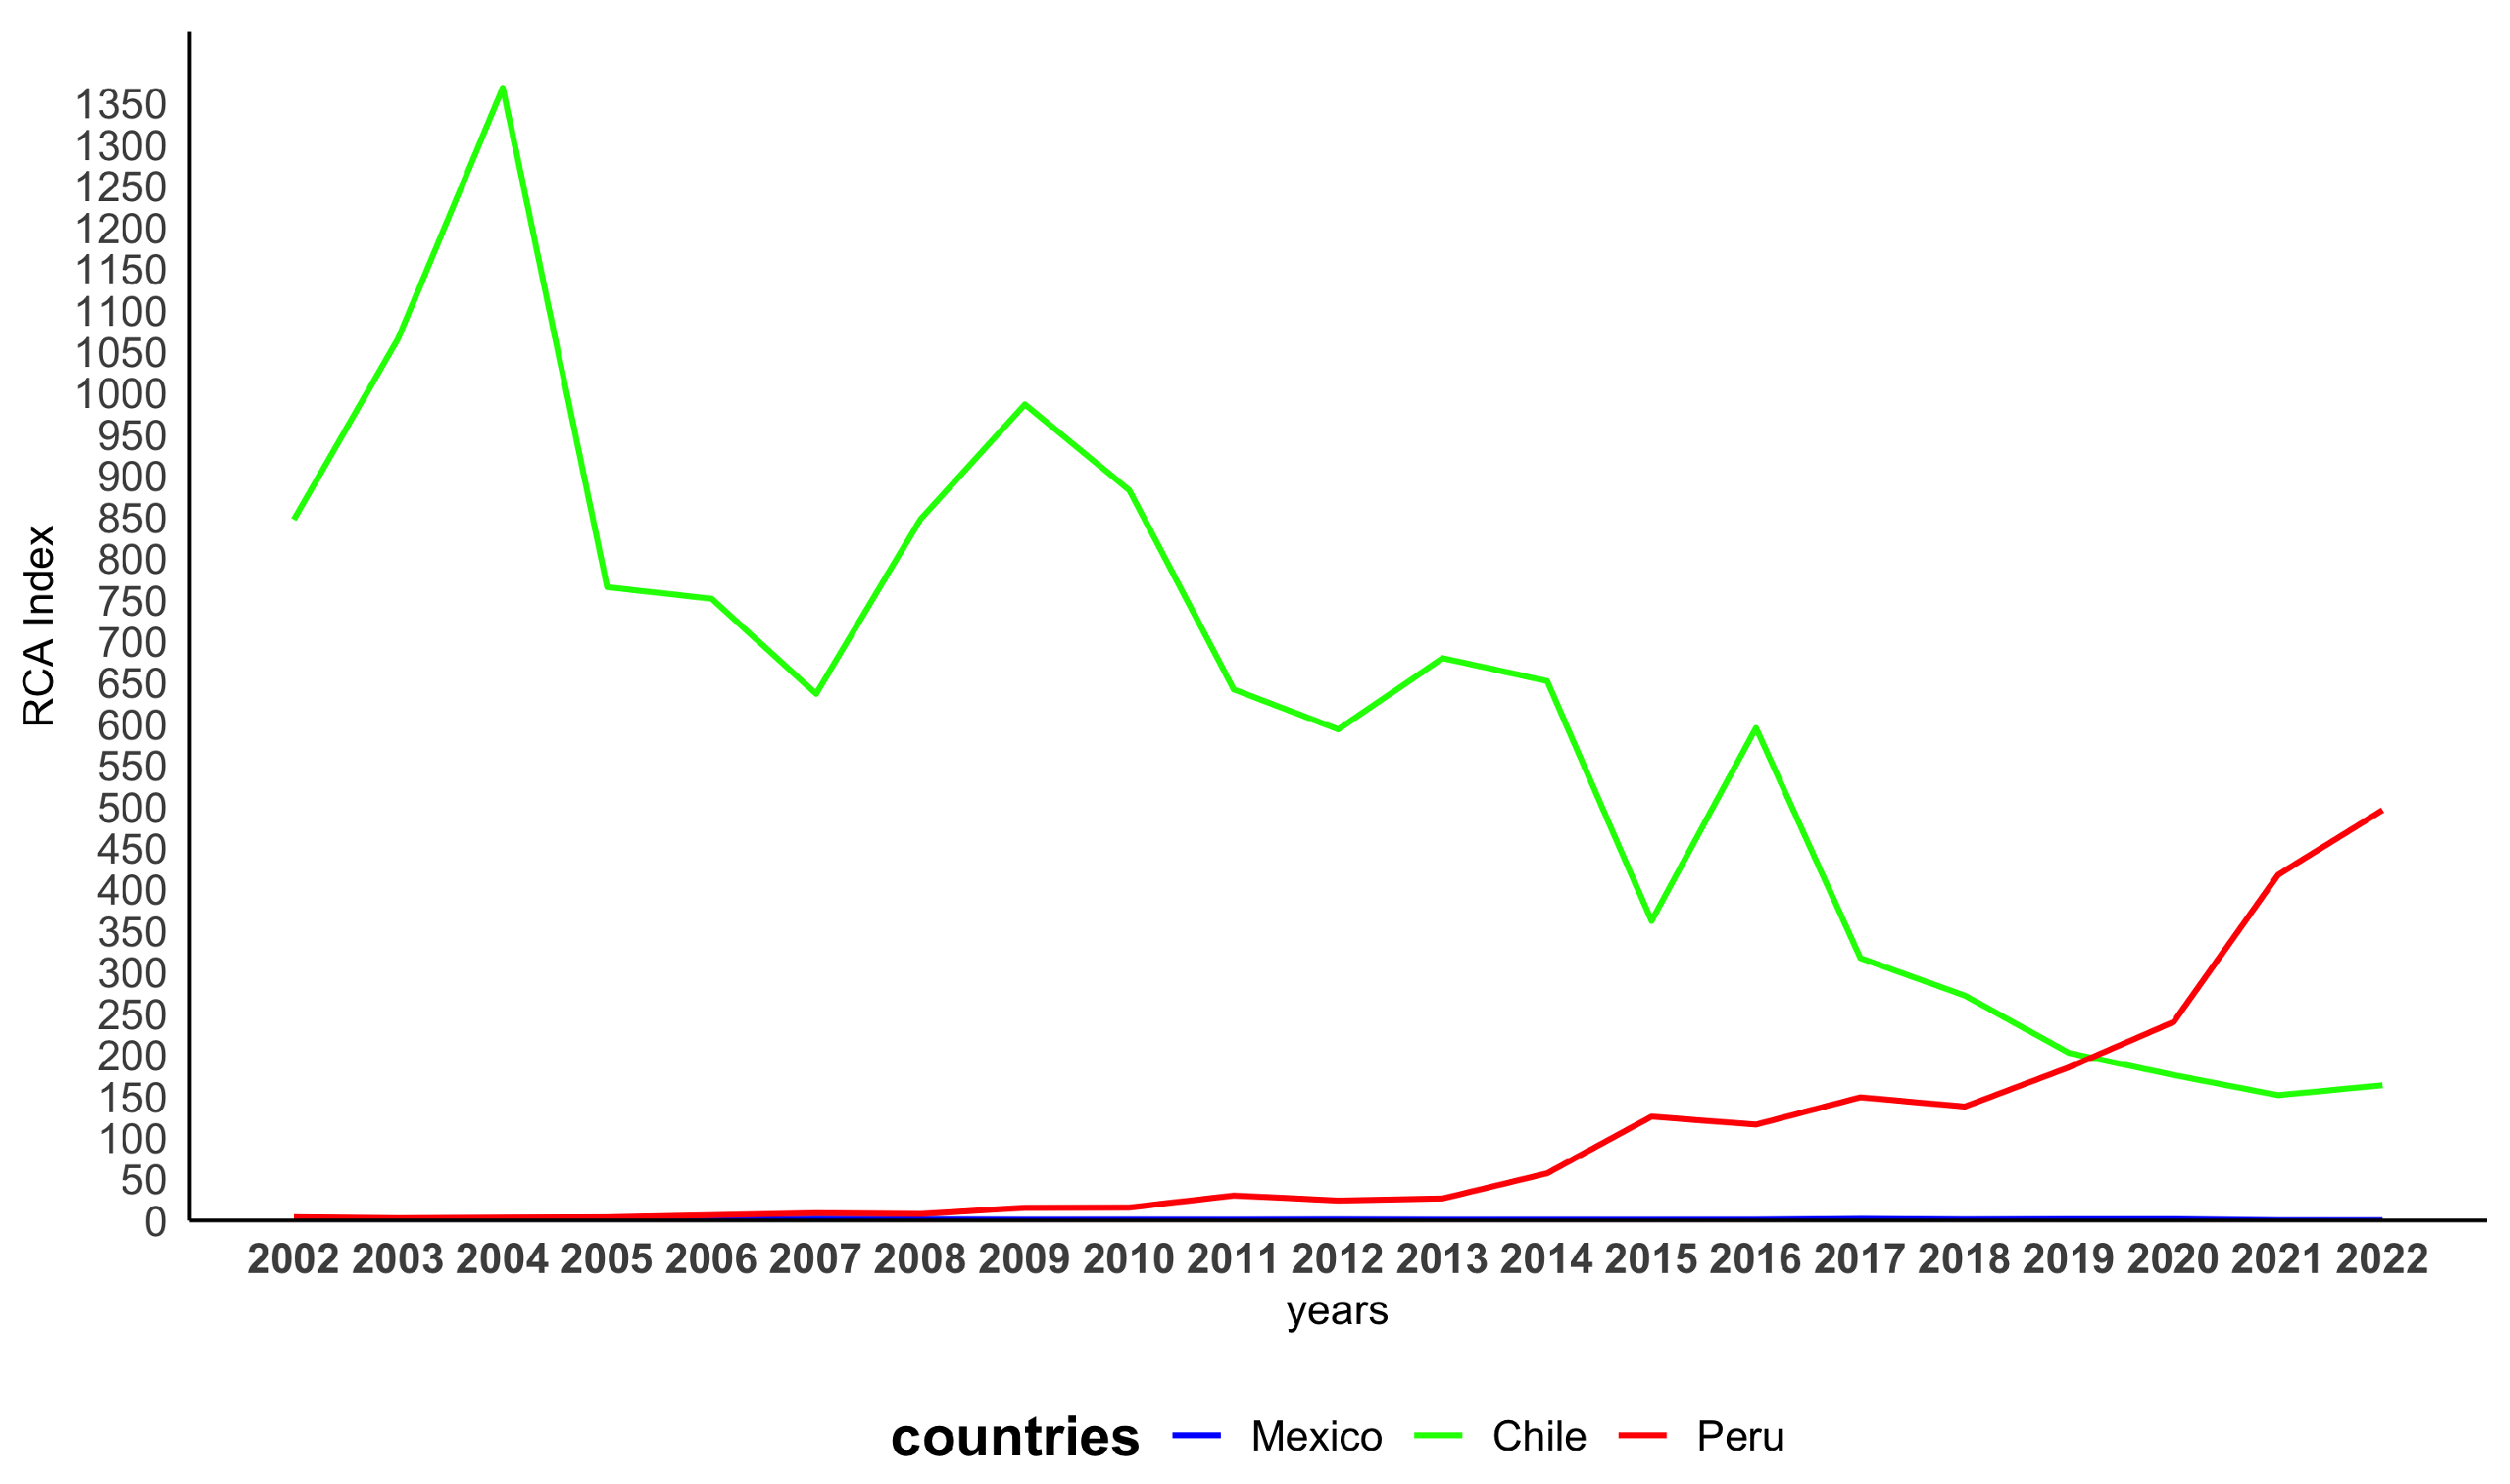

Table 1.
Export Indicators and Market Share for Fresh Grapes, 2002–2022
| Indicator | Mexico | Chile | Peru |
|---|---|---|---|
| Fresh grape exports to the U.S. in 2002 (tons) | 127,518.8 | 321,434.1 | 3,135.7 |
| Fresh grape exports to the U.S. in 2022 (tons) | 36,571.4 | 309,310.5 | 234,955.3 |
| U.S. market share of fresh grapes in 2002 (%) | 27.5 | 69.2 | 0.7 |
| U.S. market share of fresh grapes in 2022 (%) | 6.1 | 51.8 | 39.4 |
| Global exports of fresh grapes in 2002 (tons) | 129,010.4 | 520,030.6 | 11,676.7 |
| Global exports of fresh grapes in 2022 (tons) | 37,680.4 | 605,635.7 | 526,857.2 |
| Total Global Exports | |||
| In 2002 (tons) | 2,807,879.8 | ||
| In 2022 (tons) | 5,247,948.0 | ||
| Global market share in 2002 (%) | 4.6 | 18.5 | 0.4 |
| Global market share in 2022 (%) | 0.7 | 11.5 | 10.0 |
Source: Author’s elaboration based on data from (UN Comtrade, 2024).
Table 2.
Harmonized System Subheadings for Heading 0806: Grapes, Fresh or Dried.
| Product Code | Description |
|---|---|
| 0806 | Grapes; fresh or dried |
| 080610 | Fruit, edible; grapes, fresh |
| 080620 | Fruit, edible; grapes, dried |
Table 3.
RCA Index of the Main Competitors in the U.S. Fresh Grape Market
| Year | Mexico | Chile | Peru |
|---|---|---|---|
| 2002 | 2.4 | 846.9 | 4.1 |
| 2003 | 2.1 | 1066.3 | 3.0 |
| 2004 | 1.3 | 1368.6 | 3.6 |
| 2005 | 1.9 | 765.4 | 4.0 |
| 2006 | 1.2 | 751.3 | 6.4 |
| 2007 | 1.7 | 636.5 | 9.1 |
| 2008 | 1.5 | 847.4 | 8.0 |
| 2009 | 1.1 | 986.2 | 15.3 |
| 2010 | 1.2 | 882.4 | 15.6 |
| 2011 | 1.1 | 641.7 | 30.0 |
| 2012 | 1.4 | 593.6 | 24.0 |
| 2013 | 1.1 | 679.5 | 26.5 |
| 2014 | 1.1 | 651.9 | 57.0 |
| 2015 | 1.1 | 362.0 | 125.5 |
| 2016 | 1.2 | 595.2 | 115.9 |
| 2017 | 2.2 | 317.0 | 148.8 |
| 2018 | 1.4 | 271.8 | 137.5 |
| 2019 | 1.8 | 202.3 | 185.2 |
| 2020 | 1.8 | 175.8 | 239.9 |
| 2021 | 0.3 | 151.3 | 417.8 |
| 2022 | 0.3 | 163.4 | 495.9 |
Source: Author’s elaboration based on data from (UN Comtrade, 2024)
Table 4.
CMS and Its Decomposition in the U.S. Fresh Grape Market, 2002–2022
| Components | Mexico | Chile | Peru |
|---|---|---|---|
| Export Growth | -104,638.2 | -87,060.2 | 270,944.2 |
| First Level of Decomposition | |||
| Effects | |||
| Structural Effect | -24,978.7 | -8,393.3 | 1,565.6 |
| Competitiveness or Residual Effect | -99,064.5 | -80,776.2 | 179,670.4 |
| Second-Order Effect | 19,405.0 | 2,109.2 | 89,708.2 |
| Second Level of Decomposition | |||
| Effects | |||
| Growth Effect | -4,178.7 | -2,245.3 | 964.0 |
| Market Effect | -23,029.4 | -53,676.4 | 249.4 |
| Pure Residual Effect | -4,943.4 | -22,436.0 | 301.8 |
| Static Residual Structural Effect | -33,067.0 | -115,452.6 | 1,200.4 |
| Pure Second-Order Effect | -23,644.0 | -48,596.4 | 1,054.5 |
| Dynamic Residual Structural Effect | 43,049.0 | 50,705.6 | 88,653.7 |
Source: Author’s elaboration based on data from (UN Comtrade, 2024)
Disclaimer/Publisher’s Note: The statements, opinions and data contained in all publications are solely those of the individual author(s) and contributor(s) and not of MDPI and/or the editor(s). MDPI and/or the editor(s) disclaim responsibility for any injury to people or property resulting from any ideas, methods, instructions or products referred to in the content. |
© 2025 by the authors. Licensee MDPI, Basel, Switzerland. This article is an open access article distributed under the terms and conditions of the Creative Commons Attribution (CC BY) license (http://creativecommons.org/licenses/by/4.0/).
Copyright: This open access article is published under a Creative Commons CC BY 4.0 license, which permit the free download, distribution, and reuse, provided that the author and preprint are cited in any reuse.


