
Submitted:
14 April 2025
Posted:
15 April 2025
You are already at the latest version
Abstract
In recent years, Uzbekistan has been expanding its export product basket and introducing new products to the world market. One of these products is fresh and dried grapes. Uzbekistan is one of the world's main grape producing countries. Uzbekistan also accounts for 1.9% of the world's grape exports. In the article, we will examine whether Uzbekistan's fresh and dried grape exports are competitive in the world market. During the study, calculations will be made on the Balassa and Vollrath indices using data from 2017-2023. The International Trade Center database will be used during the calculation.
Keywords:
Uzbekistan
; competitiveness
; Balassa index
; Vollrath index
; grape export
Introduction
Grapes, one of the main horticultural products, are spread in various parts of the world. China, India, Türkiye, Uzbekistan, Egypt, Brazil, EU, USA, Peru and Chile produce 97% of the global production (https://www.fas.usda.gov/data/production/commodity/0575100). The fact that its content is rich in vitamins, minerals and sugar increases its use. Grapes are consumed fresh and dried. They also play a role as raw materials in the production of wine, vinegar, behmaz and other products (Kayali and Kalayci, 2017). As one of the important horticultural products, grapes occupy a special place among food products. This also affects its trade. Grape exports are increasing year by year. It is also seen that grape-producing countries are also major importing countries. The fact that middle-income countries have also become markets for grapes increases the export prospects of grapes. This is also important in terms of the diversity of export countries of the producing country. Exporting to more countries means protecting against future risks.
As you can see, Uzbekistan is one of the main grape producing countries. Grapes also have a special place in Uzbekistan's exports. Grapes accounted for an average of 1.5% of the country's total exports in 2017-2023. At the same time, Uzbekistan's share in world grape exports in 2017-2023 was an average of 1.9%.
Methodology
The main materials of the study are data obtained from the International Trade Center for the years 2017-2023. During those years, data on Uzbekistan's dried and fresh grape exports under HS code 0806 were collected, and export statistics under HS codes 080610 and 080620 were shown.
One of the methods used to measure the competitiveness of countries in the world market for the products they export is the index of revealed comparative advantage. This method, created by Balassa in 1965, measures specialization in international trade. It is calculated using the following formula:
RCA = ( Xij/Xj)/(Xiw/Xw)
After Balassa's index, many new indices have emerged over time. One of them is the index created by Vollrath. In Balassa's index, the same product is also taken into account in total exports when calculating it, while the Vollrath index prevents this. Similarly, the Balassa Index is calculated using only export data, while the Vollrath indices also take into account imports. One of them is the Relative Export Advantage (RXA) index (Bashimov, 2016; Tağıyev, 2024).
RXA = (Xij/Xnj)/(Xir/Xnr)
RMAij=(Mij/Mnj)/(Mir/Mnr)
RTAij = RXAij-RMAij
RC = Ln(RXA) – Ln(RMA)
When calculating the Balassa and Vollrath indices, the Index of Revealed Comparative Advantages and the Index of Relative Export Advantage may show similar results. When Vollrath indices receive a positive result, it is considered that the country is competitive in those products, and when it receives negative values, it is considered that it is not competitive.
Export of fresh and dried grapes in the world and Uzbekistan
Grapes, one of the oldest horticultural crops, are produced in most countries of the world. Grapes, which are used both dried and fresh, are also a raw material for wine production. The share of the above-mentioned countries in grape production is 97%. Due to the importance of grapes, their trade is also increasing year by year. Given the rapid urbanization and income growth, middle-income countries have also become relevant markets for grapes (Seccia et al., 2015). The growth of markets has stimulated the growth of exports, with exports increasing from $9.7 billion in 2017 to $11.4 billion in 2023. Population growth and rising personal incomes will also increase the demand for all grape products (Alston and Sambucci, 2019).

Table 1.
Top 10 countries exporting grapes (0806) in the world (in million dollars).
| 2017 | 2018 | 2019 | 2020 | 2021 | 2022 | 2023 | |
|---|---|---|---|---|---|---|---|
|
Worldwide; including TOP-10 countries |
9713.6 | 10120.6 | 10434.3 | 11063.5 | 11412.5 | 11531.01 | 11425.2 |
| Peru | 654.6 | 763.7 | 813.2 | 992.1 | 1197.3 | 1352.2 | 1752.6 |
| Chile | 1112.7 | 1237.5 | 1108.2 | 1057.8 | 954.3 | 1861.7 | 954.1 |
| USA | 1211.2 | 1210.5 | 1112.6 | 1048.7 | 1001.5 | 987.9 | 943.1 |
| Netherlands | 679.6 | 809.2 | 761.4 | 831.4 | 953.3 | 776.8 | 942.5 |
| Italy | 867.2 | 801.9 | 726.1 | 842.2 | 894.1 | 774.2 | 894.2 |
| China | 764.6 | 735.3 | 1061.4 | 1267.3 | 798.2 | 763.2 | 883.1 |
| South Africa | 641.5 | 693.6 | 639.9 | 645 | 828.9 | 874.7 | 714.4 |
| Türkiye | 603.6 | 611.3 | 724.3 | 671.9 | 683.8 | 654.8 | 647.5 |
| Mexico | 247.9 | 200.3 | 292.8 | 279.6 | 329.8 | 302.2 | 410.1 |
| Australia | 312.2 | 315.4 | 429.6 | 473.7 | 393.2 | 345.9 | 407.4 |
As can be seen from the table above, the upward trend in world grape exports continues during 2017-2023. There was a decrease in world trade during the Covid-19 pandemic (Tağıyev, 2023). Despite this, Uzbekistan's grape exports have not decreased.
Agricultural products occupy a special place in Uzbekistan's exports. Cotton, fruits and vegetables are the main agricultural export products. One of the exported agricultural products is grapes.
Chart 1.
Uzbekistan's exports of grapes (HS code 0806) (in million dollars). Source: Trademap(24.03.2025).
Chart 1.
Uzbekistan's exports of grapes (HS code 0806) (in million dollars). Source: Trademap(24.03.2025).
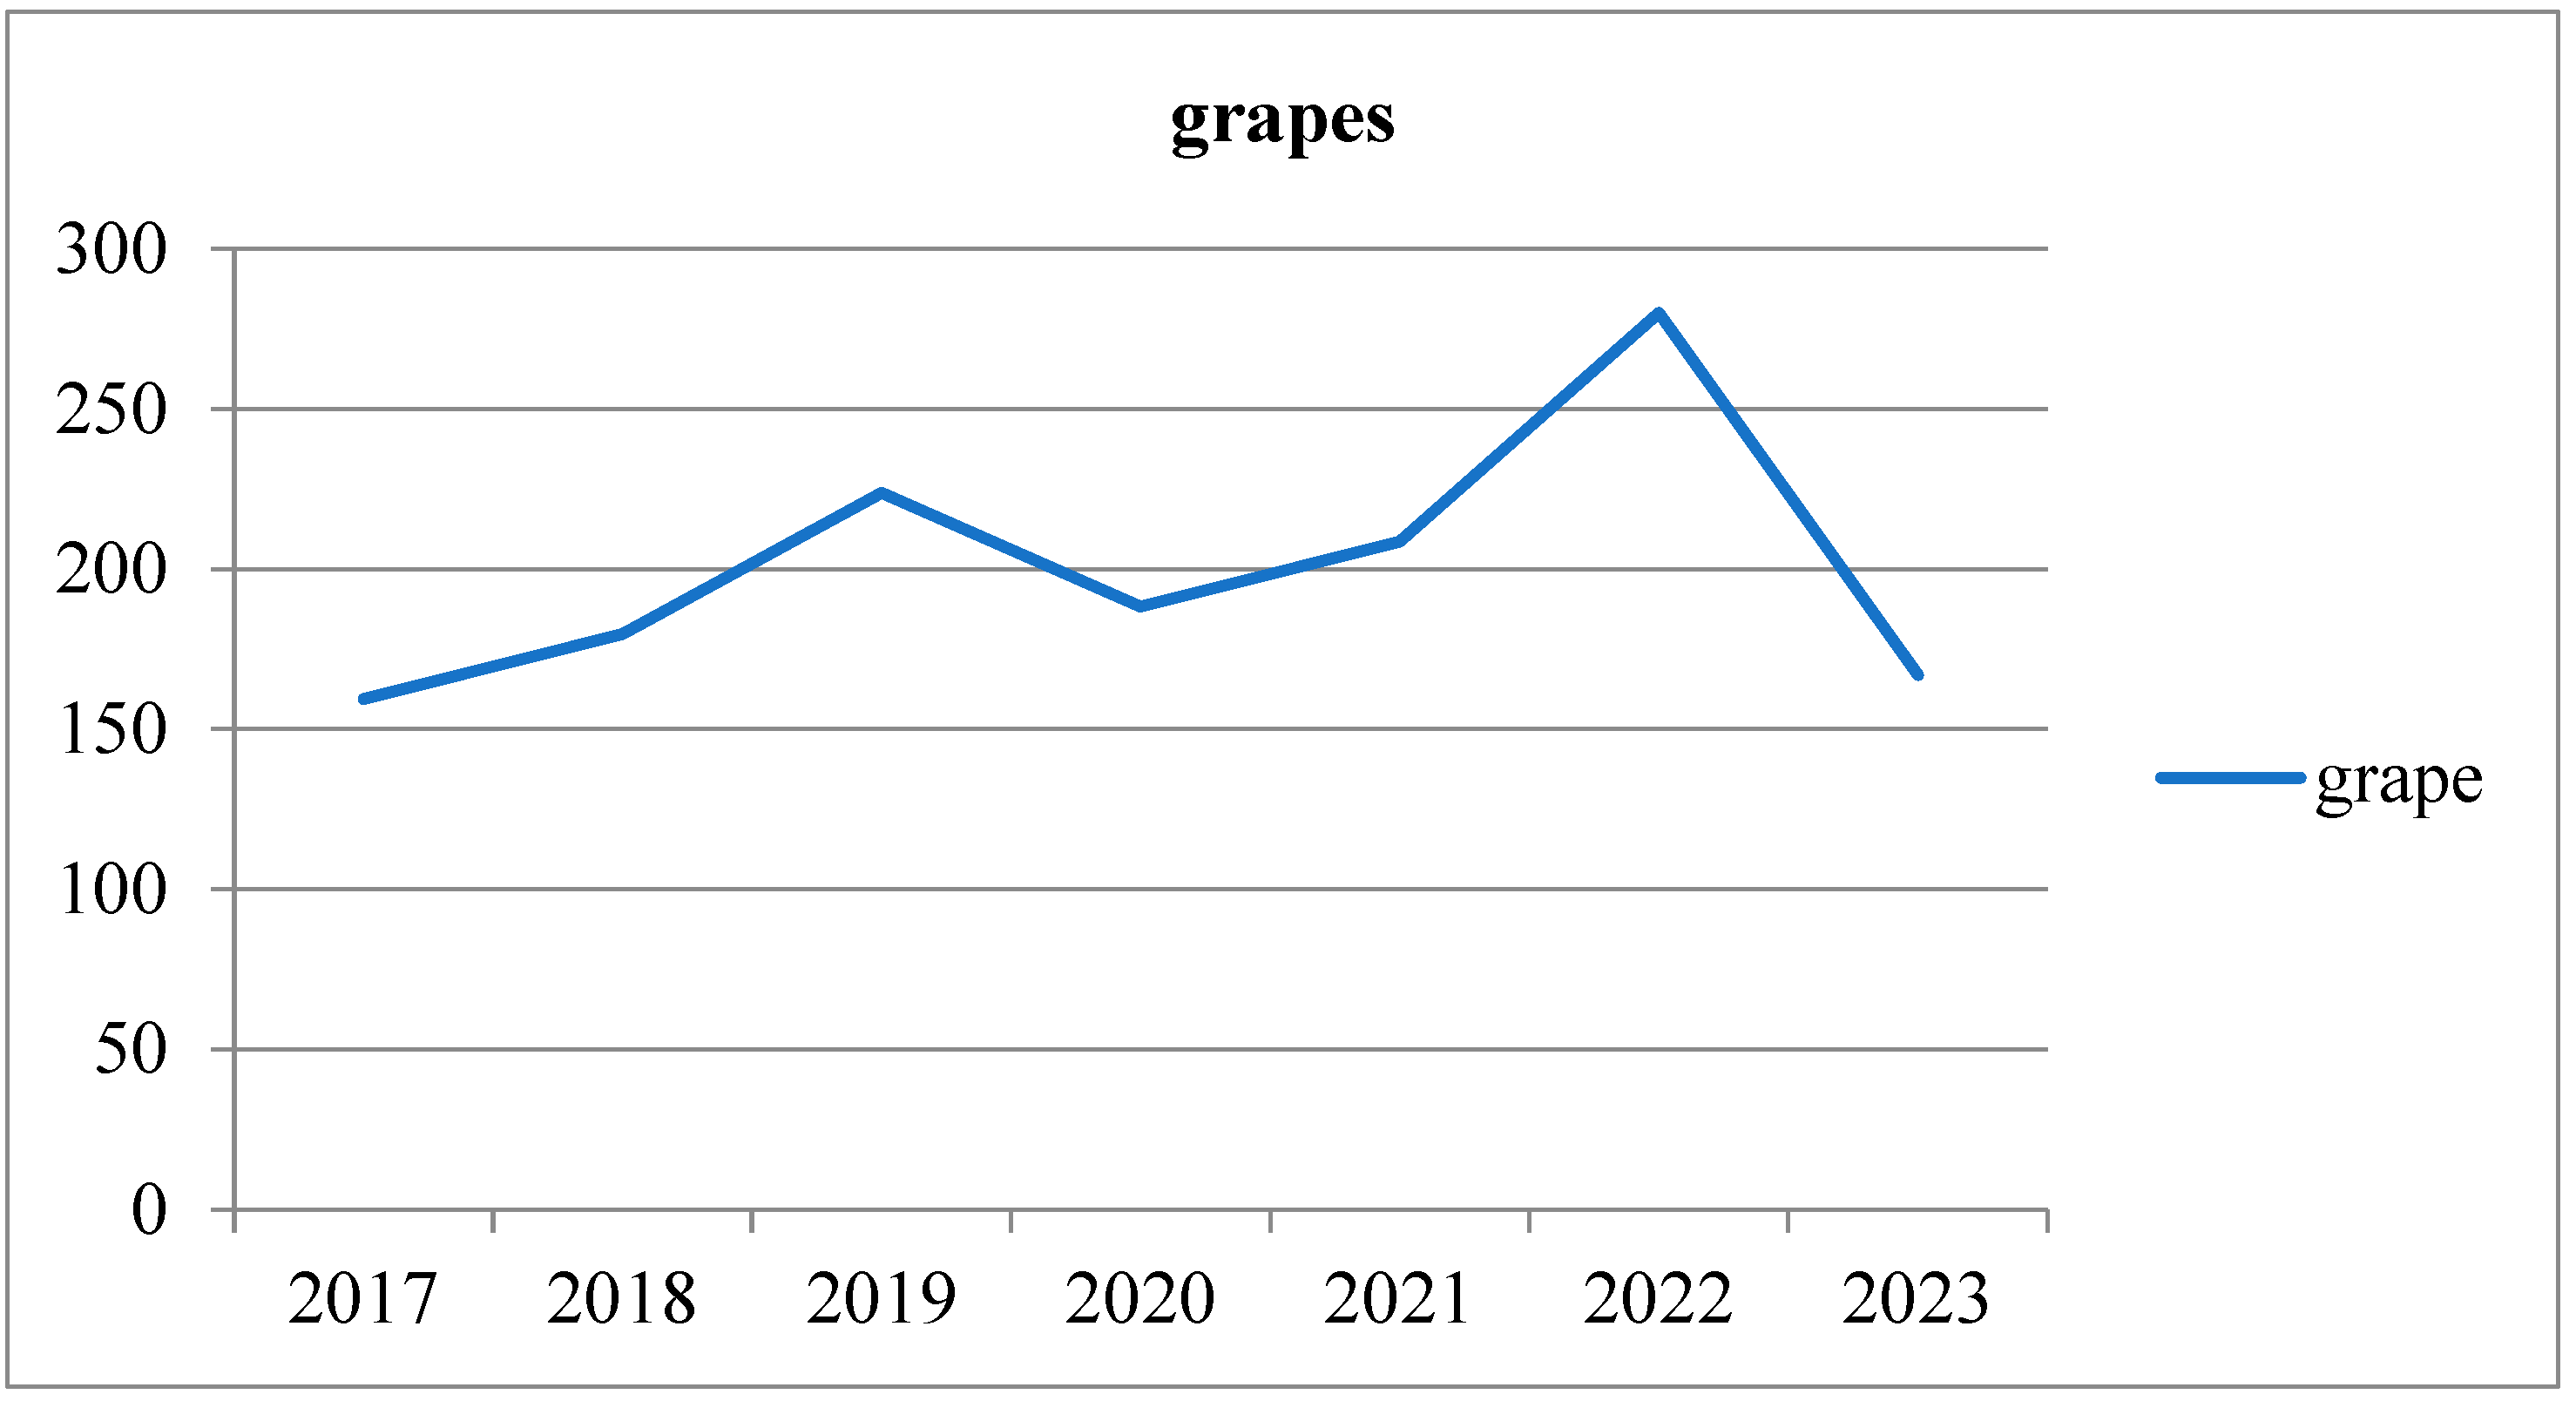
Although Uzbekistan's grape exports fluctuated in 2017-2023, an increase in quantity is observed. Thus, while dried and fresh grapes worth $159.5 million were exported in 2017, it increased to $280.1 million in 2022. This is an increase of 75.6%. Each kilogram of grapes exported in 2017 was sold for $0.75, which is much lower than the world export price. During the same period, each kilogram of grapes was sold for $1.7 in world grape exports. Of the countries to which Uzbekistan exported the most, the most expensive price was to Azerbaijan in 2023, and the least expensive was to Kyrgyzstan. Looking at the variety of export countries, 4 of the 10 countries to which it exported the most are Turkish states. These are Kazakhstan, Turkey, Azerbaijan and Kyrgyzstan. The strengthening of economic integration between Turkic states also increases their cooperation in foreign trade (Taghiyev, 2022; Taghiyev, 2023). Since 2023, along with the decreasing level of exports to Russia, there has been an increase in exports to different countries. Thus, in the year in question, 2516 tons of fresh and dried grapes worth 2.1 million dollars were exported to Brazil.
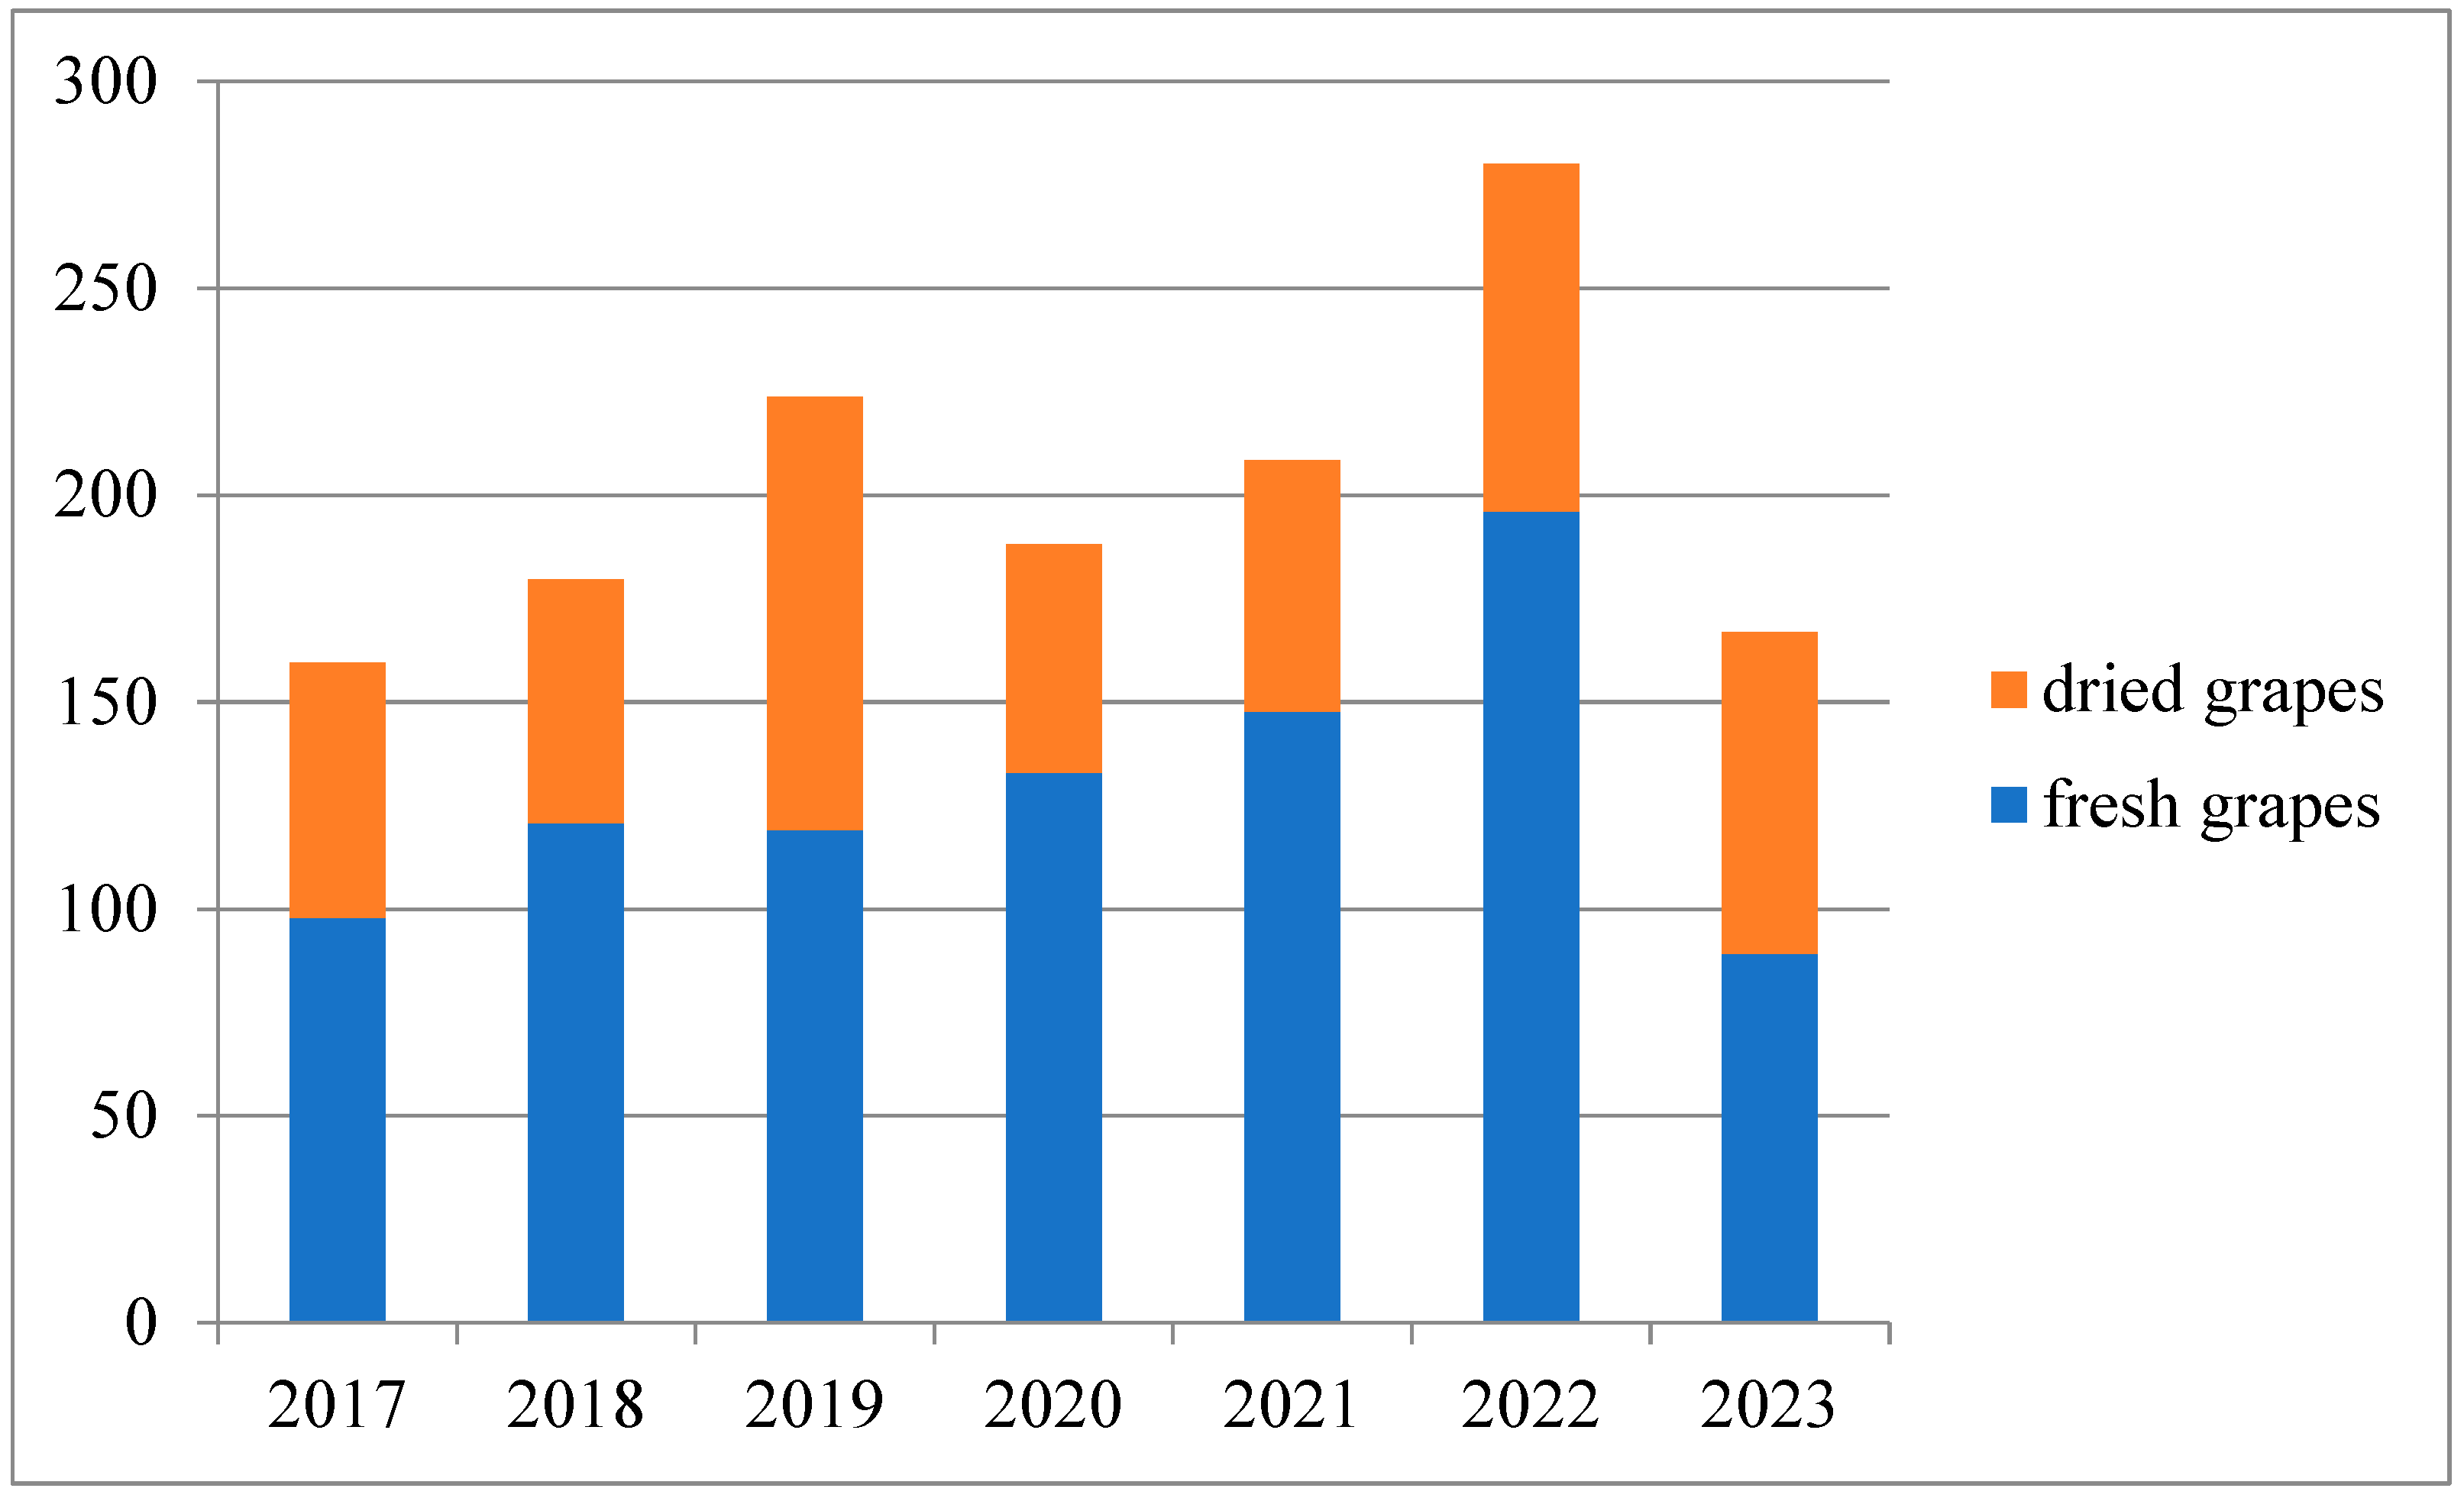
Looking at Uzbekistan's dried and fresh grape exports separately, $97.9 million was exported in 2017, $120.9 million in 2018, $119.2 million in 2019, $133 million in 2020, $147.7 million in 2021, $196 million in 2022, and $89.3 million in 2023. During the same period, dried grapes were exported worth $61.6 million in 2017, $58.8 million in 2018, $104.6 million in 2019, $55.1 million in 2020, $60.8 million in 2021, $84 million in 2022, and $77.5 million in 2023. ( https://www.trademap.org/Country_SelProductCountry_TS.aspx?nvpm=1%7c860%7c%7c%7c%7c080620%7c%7c%7c6%7c1%7c1%7c2%7c2%7c1%7c2%7c1%7c1%7c1)
Chart 2.
Uzbekistan's exports of dried and fresh grapes (in million dollars). Source: trademap(24.03.2025).
Chart 2.
Uzbekistan's exports of dried and fresh grapes (in million dollars). Source: trademap(24.03.2025).
Competitiveness analysis
The competitiveness of Uzbekistan's dried and fresh grape exports in the world market is shown in Table 2. It has been highly competitive in the world market since 2017, when it started exporting. The RCA and RTA indices are greater than 1 in each of the years 2017-2023. Although there was a high result for the RCA and RTA indices during the years 2017-2022, a decrease is observed in 2023.
Conclusion
In each of the years indicated, Uzbekistan has a high competitiveness in the world trade of dried and fresh grapes. However, a sharp decline is observed in 2023.
Looking at the statistics on Uzbekistan's grape exports, it can be seen that the bulk of exports were made to several countries. Up to half of exports in 2023 were made to Russia. Of the $89.3 million in fresh grape exports in 2023, $71.7 million was exported to Russia. This increases dependence on one market and risks. In 2021, exports to Russia accounted for 41.7% of total grape exports and accounted for 22.5% of Russia's grape imports. The country needs to maintain balance by increasing the variety of export countries. In 2023, the balance level in the markets is seen to be moving towards parity.
References
- Alston, J. M., & Sambucci, O. (2019). Grapes in the world economy. The grape genome, 1-24.
- Bashimov, G. (2016). Türkiye’nin domates ihracat performansı ve rekabet gücü. Alınteri Dergisi, 31, 1-8. [CrossRef]
- Seccia, A., Santeramo, F. G., & Nardone, G. (2015). Trade competitiveness in table grapes: A global view. Outlook on AGRICULTURE, 44(2), 127-134. [CrossRef]
- https://www.fas.usda.gov/data/production/commodity/0575100.
- Kayalı, H., & Kalaycı, M. (2017). Orta Asya Cumhuriyetleri’nde üzüm yetiştiriciliği. Marmara Türkiyat Araştırmaları Dergisi, 4(1), 87-105.
- Taghiyev, J. (2025). Analysis of the competitiveness of persimmon export in Azerbaijan. Scientific Collection «InterConf+», (54(236), 61–69. [CrossRef]
- Tağıyev, C. (2024). Yaşıl enerjinin Azərbaycanın enerji istehsalında artan rolu: Elektrik enerjisi ixracı və rəqabətqabiliyyətlilik təhlili. ISCEMR.
- Tağıyev, C. (2023). Pandemiya Və Postpandemiya Dövründə Dünya İqtisadiyyatı Və Beynəlxalq Ticarətin Vəziyyəti. Gənc Tədqiqatçıların VII Beynəlxalq Elmi Konfransının materialları.
- Tağıyev, C. (2022). Azərbaycanın türk dövlətlərinə ixracının müasir vəziyyəti. Ümummilli lider Heydər Əlirza oğlu Əliyevin anadan olmasının 99-cu ildönümünə həsr olunmuş “İqtisadi inkişafda qlobal çağırışlar və perspektivlər” Respublika elmi-praktik konfransı.
- https://www.trademap.org/Country_SelProductCountry_TS.aspx?nvpm=1%7c860%7c%7c%7c%7c0806%7c%7c%7c4%7c1%7c1%7c2%7c2%7c1%7c2%7c1%7c1%7c1.
Table 2.
Competitiveness analysis (2017-2023).
| Years | RCA | RXA | RTA | RC |
|---|---|---|---|---|
| 2017 | 28.6 | 29.5 | 29.5 | 8.16 |
| 2018 | 31.4 | 32.5 | 32.5 | 8.01 |
| 2019 | 28.05 | 29.1 | 29.1 | 7.74 |
| 2020 | 22.7 | 23.4 | 23.4 | 6.92 |
| 2021 | 28.8 | 29.8 | 29.8 | 7.68 |
| 2022 | 39.3 | 41 | 41 | 7.08 |
| 2023 | 16.4 | 16.8 | 16.6 | 4.66 |
Source: Calculated by the author.
Disclaimer/Publisher’s Note: The statements, opinions and data contained in all publications are solely those of the individual author(s) and contributor(s) and not of MDPI and/or the editor(s). MDPI and/or the editor(s) disclaim responsibility for any injury to people or property resulting from any ideas, methods, instructions or products referred to in the content. |
© 2025 by the authors. Licensee MDPI, Basel, Switzerland. This article is an open access article distributed under the terms and conditions of the Creative Commons Attribution (CC BY) license (http://creativecommons.org/licenses/by/4.0/).
Copyright: This open access article is published under a Creative Commons CC BY 4.0 license, which permit the free download, distribution, and reuse, provided that the author and preprint are cited in any reuse.


