
Submitted:
14 January 2025
Posted:
14 January 2025
You are already at the latest version
Abstract
The work is devoted to the study of the dynamics of changes in the composition of the heap of cereal crops during maturation and identifying the optimal stage at which the grain heap has a high feed value. The grain heap of winter wheat of the Admiral variety, perennial winter wheat (trititrigia) of the Pamyati Lyubimovoy variety and gray wheat grass of the Sova variety was studied for amino acid composition, protein content, moisture, iron, phosphorus, selenium, zinc, starch and Vitamin E. The heap of cereal crops harvested at the stage of hard wax ripeness has a higher protein content - by 3-4% on average, some amino acids, minerals (iron, selenium) and other useful nutrients. The grain heap of hard waxy ripeness wheat was studied for prebiotic properties. It was found that it causes an increase in the number of lactic acid bacteria in the intestinal microbiota and therefore is a promising prebiotic for agriculture. Based on the studies, the recommended concentration of grain heap of waxy ripeness wheat as a feed additive is 1%.
Keywords:
wheat
; wax ripeness
; feed
; compound feed
; feed raw materials
; prebiotics
; vegetable protein
1. Introduction
Cereal crops play an important role in the feed industry. They are a source of carbohydrates; in some feed recipes their share is more than 50% of all components. Due to its properties [1], wheat is used more often than others in feed recipes: wheat protein has high digestibility compared to other cereal crops (barley, rye, oats); gluten contained in wheat acts not only as a source of protein, but also as a binding component, which is especially important in the production of granulated fish feed; extrusion of wheat leads to starch hydrolysis, resulting in the formation of sugars and dextrins, which are easily absorbed by the animal's body; in addition, extrusion improves the organoleptic properties of the product. Wheat grain with a low protein content is used for feed - fodder (feed) grain. The results of previous studies obtained by scientists from different countries [2,3,4,5,6,7,8,9,10] show that wheat grain at early stages of maturity (from early milk to late wax ripeness) has an increased content of protein and gluten – on average, by 3–4%. These data allow us to state that it is advisable to use grain before full maturity for the production of compound feed.
In the work [2] the authors presented the results of the study of the dynamics of changes in the grain nature, vitreousness, mass fraction of protein and gluten of spring soft wheat variety Baganskaya 85 (mid-season variety). The studies have shown that the highest content of protein and gluten is observed at the stage of late wax ripeness. With the onset of full ripeness, the content of protein and gluten decreases sharply. Also, the indicators of nature and vitreousness at the stage of late wax ripeness were the best. The authors conclude that harvesting wheat grain earlier or later than the stage of late wax ripeness worsens the quality of the crop. In addition, the authors conducted research for two years - in 2010 and 2011, as a result of which they made the following conclusions: the chemical composition of the grain depends on meteorological conditions; at low positive temperatures and high air humidity during the earing phase and exit into the pipe, the protein content decreases by 2-4%. However, despite the change in chemical composition depending on weather conditions, higher quality indicators of wheat grain in 2010 and 2011 were observed at the late wax ripeness stage. In another study [3], Polish scientists compared the chemical composition of three spelt varieties at the milk ripeness stage and the full ripeness stage. They examined spelt for minerals (micro (Cu, Zn, Mn, Fe, Na, B) – and macronutrients (N, P, K, Mg, Ca), replaceable and essential amino acids, and fatty acid composition. The results of the study showed that the content of minerals differed depending on the spelt variety: thus, the content of Zn and K in all three varieties was higher at the milk ripeness stage; the amount of other minerals varied depending on the variety. Table 1 presents the characteristics of the mineral composition of spelt of different varieties at the milk ripeness stage and the full ripeness stage.
An analysis of the amino acid composition of all three varieties of spelt showed that the content of lysine, methionine, alanine and tyrosine in the grain at the milk ripeness stage is higher than at the stage of full ripeness. The amount of other proteinogenic replaceable and essential amino acids increases with the onset of full grain ripeness.
Similar studies were conducted on spelt at the milk and full ripeness stages by scientists from Germany and Greece [4]. The studies showed that at the milk ripeness stage, spelt grain has a higher protein content and a lower carbohydrate content than at the stage of full ripeness.
As a result of changes in the composition of wheat grain during ripening, scientists from Turkey [5] made the following conclusions: the accumulation of protein and functional compounds (proteins, fiber, fructans, phenolic substances, antioxidants) occurs before the milk ripeness stage, after which they are spent on grain growth and ripening and proportionally decrease by the stage of full ripeness. The considered research results do not allow us to draw reliable conclusions about the dynamics of changes in grain composition during ripening and identify the optimal stage at which the highest content of the maximum possible nutrients is observed: some studies indicate higher quality indicators of grain at the milk ripeness stage, other studies - at the stage of late wax ripeness; the studies were conducted in different years, in different territories, different scales are indicated denoting the ripeness phase. A large number of authors used the BBCH scale to analyze changes in grain composition during ripening [6,7,8,9,10]. The use of this scale in the present study will allow us to unify the data on changes in grain composition during ripening and obtain a more general picture of the results obtained. In addition to grain, an additional source of feed raw materials can be the non-grain part of the crop - chaff. Previously, this type of feed raw material was actively used in the feed industry. Chaff was a secondary raw material that was obtained after cleaning the grain heap at stationary grain processing points. Currently, the cleaning of the mown grain mass is carried out directly in grain harvesters and the non-grain part remains in the field. In addition to nutritional value, such feed raw materials may have prebiotic properties. According to data [11,12,13,14], prebiotics should be resistant to digestion in the upper gastrointestinal tract, stimulate the growth of beneficial bacteria, and have a positive effect on consumer health.
Thus, the aim of the study is to identify the optimal stage of grain maturation, at which the highest content of beneficial nutrients is observed, and to conduct an analysis for the presence of prebiotic properties in such potentially valuable feed raw materials.
2. Materials and Methods
2.1. Sowing and Harvesting Grain Crops
To study the changes in grain composition during ripening, three types of grain were taken: winter wheat of the Admiral variety, perennial winter wheat (trititrigia) of the Pamyati Lyubimovoy variety, and blue wheat grass of the Sova variety. Perennial grain crops are promising feed and food raw materials, since they are drought-resistant, resistant to many diseases, and have a positive effect on the condition of the soil, increasing its fertility. More detailed information on perennial crops is presented in previous studies [15]. The sowing of the studied crops was carried out in the fields of the educational and experimental site of Don State Technical University in the village of Rassvet, Rostov Region, Russian Federation. The soil of the experimental plots is ordinary carbonate heavy loamy chernozem. The composition of the soil of the experimental plots is presented in Table 2.

Table 1.
Analysis of experimental soil plots and methods for their determination.
| Indicator | Determination method | Meanings |
| Humus content, % | I. V. Tyurin's method. Based on the oxidation of organic matter with chromic acid to form carbon dioxide. | 3.5 |
| Total nitrogen, mg/kg | Ionometric method. Consists of extracting nitrates from the soil with a 1% solution of potassium alum and measuring the activity of the nitrate ion using an ion-selective electrode. | 29.1 |
| Mobile phosphorus, mg/kg | Method for determining mobile compounds of phosphorus and potassium according to Kirsanov. Based on the extraction of mobile compounds of phosphorus and potassium from the soil with a solution of hydrochloric acid of molar concentration 0.2 mol/dm³ and subsequent determination of phosphorus on a photoelectrocolorimeter and potassium on a flame photometer. | 19.2–24.8 |
| Mobile potassium, mg/kg | 325–339 | |
| pH of salt extract | The method is based on obtaining an aqueous extract by extracting cations, nitrates and mobile sulfur from the soil with a solution of potassium chloride and potentiometric determination of pH using a glass electrode. | 7.2 |
During the entire vegetation period, three soil fertilizations were performed: when sowing seeds, using ammophos in the amount of 100 kg/ha; in the tillering phase and in the pipe emergence phase, using ammonium nitrate in the amount of 70 kg/ha. Harvesting was carried out in 5 stages (growth phases are presented according to the BBCH scale [6,7,8,9,10]): 77 – late milk ripeness (Figure 1), 83 – early wax ripeness phase, 87 – hard wax ripeness, 89 – full ripeness, 92 – overripeness. Harvesting of grain crops at the early stages of ripeness cannot be carried out with a classic grain harvester. For this purpose, a new stripper-threshing unit was used for harvesting grain crops of different ripeness phases [16,17].
As a result of harvesting, a heap of wheat grain was obtained (Fig. 1b), which was crushed and subjected to physicochemical analysis.
2.2. Physicochemical Analysis of Harvested Grain Heap
The obtained grain heap samples were thoroughly mixed, ground in a laboratory mill and tested for the quality indicators indicated in Table 2.
Table 2.
List of quality indicators of grain heap of analyzed crops of different stages of maturity and methods of their implementation.
Table 2.
List of quality indicators of grain heap of analyzed crops of different stages of maturity and methods of their implementation.
| Quality indicator | Determination method, normative document of the methodology for determining the indicator |
|---|---|
| Mass fraction of moisture, % | Drying method at 105 °C, GOST 31640 |
| Mass fraction of crude protein, % | Kjeldahl method, GOST 32044.1 (ISO 5983-1:2005) |
| Mass fraction of phosphorus, % | Photometric method for determination of phosphorus content, GOST 26657 |
| Mass fraction of proteinogenic amino acids (lysine, arginine, tyrosine, phenylalanine, histidine, leucine, isoleucine, methionine, valine, proline, threonine, serine, alanine, cystine, aspartic acid, glutamic acid, tryptophan), % | Capillary electrophoresis method, GOST R 55569 |
| Iron and zinc content, mg/kg | Atomic absorption method, GOST 30178 |
| Selenium content, mg/kg | Fluorimetric method on the Fluorat-02 liquid analyzer, GOST R 55449 |
| Mass fraction of starch, % | Bertrand method, GOST 26176 |
| Vitamin E, mg/kg | Method of high performance liquid chromatography with fluorimetric detection, GOST 34616 |
Each sample was analyzed within 24 hours after harvesting. Each sample was analyzed in duplicate. The final result was the arithmetic mean of two repeated determinations. The difference between parallel measurements did not exceed the values characteristic of each method.
2.3. Study of Grain Heap of Wheat of Early Stages of Maturity for Prebiotic Activity
After physicochemical analysis, samples of wheat grain heaps of different maturity stages were frozen to conduct studies of prebiotic activity.
The effect of wheat grain heaps of early maturity stages on the microbiota of birds was studied in an artificial intestinal environment, which allows obtaining a model of the microbiota of the cecum of birds.
Liquid artificial intestinal medium was poured into sterile 250 ml flasks at 100 ml to ensure minimal contact with air and the height of the liquid column. In each of the flasks, except for the control, wheat grain heaps of early maturity stages were added at a concentration of 0.1%, 0.25%, 0.5%, 0.75%, 1%, 2%, 5% (depending on the experimental variant). Then, intestinal bacteria were added to the flasks in the form of a suspension prepared from the starter. The starter was the contents of the cecum of several birds that did not receive pro- and prebiotics, as well as antibiotics, about 1 cm3 in volume, stored at -80°C. For each experiment, the cecum of a new bird was used. The contents were diluted with 10 ml of sodium chloride at a concentration of 0.9% and added to flasks in 1 ml portions. The flasks were then incubated at 42°C for 3 days, and the microbiota growth data were recorded on the 3rd day. The pH level was also measured.
The amount of intestinal bacteria was determined by the surface seeding method, in the amount of 3 replicates for each nutrient medium for each dilution under study. The amount of bifidobacteria was studied by seeding the suspension in a semi-liquid nutrient medium.
To determine the amount of Lactobacillus bacteria, we used the MRS medium (LenReaktiv), Bifidobacterium – a medium for isolating bifidobacteria (HiMedia), Enterococcus – a medium for isolating enterococci (HiMedia), E.coli – Endo medium (HiMedia), Staphylococcus – medium No. 10 (LenReaktiv). The microorganisms were counted on the second day.
In order to evaluate the effect of milk ripeness wheat on the microbiota of other birds, a model of the microbiota of the cecum of quail was studied. To determine the effect of the grain heap of early ripeness wheat on lactobacilli, the grain heap of early ripeness wheat with actual moisture content at a concentration of 0.5%, 0.75% and 1% was added to the artificial intestinal nutrient medium of quail.
In order to check whether the activity of milk ripeness wheat changes after drying, wheat in the amount of 1 g, 0.75 g and 0.5 g (which corresponds to 1%, 0.75% and 0.5% concentration) was dried in a dry-heat oven at a temperature of 80 ° C. MRS medium was also prepared. Then a daily culture of Limosilactobacillus frumenti KL31 was added and incubated for 2 days at a temperature of 42 ° C. The pH level was then determined.
3. Results
3.1. Subsection
The results of the amino acid composition of the grain heap are presented in Figure 2, Figure 3 and Figure 4.
The results of the study show that the milk ripeness stage (stage 77 on the BBCH scale) has the highest content of glutamic acid, glutamine and tryptophan, and during the transition to wax ripeness there is a sharp decrease, which continues after full ripeness.
The content of aspartic acid and asparagine in the early wax ripeness phase (83 on the BBCH scale) reaches its peak values, after which, like glutamic acid, glutamine and tryptophan, they decrease before and after full ripeness.
The highest amount of amino acids lysine, tyrosine, phenylalanine, methionine, alanine, glycine, cystine in the grain heap of wheat of the Admiral variety is observed at the stage of hard wax ripeness (stage 88 on the BBCH scale), after which there is a smooth decrease before and after full ripeness. The content of histidine, leucine, isoleucine, valine, proline, threonine, and serine increases throughout the growing season.
The dynamics of changes in the amino acid composition of the grain heap of perennial winter wheat (trititrigia) of the Pamyati Lyubimovoy variety is similar to the dynamics of annual winter wheat of the Admiral variety. The amino acid composition of perennial wheat is higher than that of annual winter wheat of the Admiral variety by an average of 1.5-2.0 times. In addition, the accumulation of amino acids in perennial wheat occurs more smoothly than in annual wheat.
In terms of the content and dynamics of amino acid changes, the Sova variety of blue wheat grass is similar to the Admiral variety of annual winter wheat. The Sova variety of blue wheat grass, in comparison with the previous two analyzed crops, has a lower content of amino acids. It contains a low amount of lysine and tyrosine – more than 2 times. The dynamics of changes in the amino acid composition of the Sova variety of blue wheat grass is similar to the previous crops – the Admiral variety of annual winter wheat and the Pamyati Lyubimovoy variety of trititrigia wheat, with the exception of aspartic acid and asparagine. Its amount reaches peak values at the stage of late milk ripeness and continues to decrease until full ripeness. Table 3, Table 4, Table 5, Table 6, Table 7, Table 8, Table 9 and Table 10 present the results of the study of the content of protein, moisture, iron, phosphorus, selenium, zinc, starch and Vitamin E in a heap of cereal crops.
Table 3 shows that all three studied crops have higher peak protein values at the hard wax ripeness stage (stage 87 on the BBCH scale), after which they decrease by 0.1–0.5%. Also, after full ripeness, the protein content in the grain heap decreases by 0.3–0.4%.
The dynamics of moisture change in the heap of cereal crops demonstrates a smooth decrease to the wax ripeness stage and a sharp decrease in moisture before the onset of full ripeness. The grain of winter wheat of the Admiral variety is larger than that of the other two studied crops, as a result of which the grain heap of wheat of the Admiral variety has higher moisture.
The iron content increases smoothly up to the stage of hard wax ripeness. Then, having reached peak values in this phase of 51–53 mg/kg, there is a sharp decrease in the grain heap of annual winter wheat of the Admiral variety and perennial winter wheat (trititrigia) of the Pamyati Lyubimovoy variety. In these crops, the iron content in the phase of full ripeness is lower than in the stage of late milk ripeness. In the grain heap of the Sova variety of blue wheatgrass, iron accumulates up to the onset of full ripeness and only slightly decreases after the onset of full ripeness (stage 92 on the BBCH scale).
The phosphorus content increases slowly throughout all the stages under study. A sharp increase (almost 2 times) occurs after full ripeness and reaches 0.37–0.49%.
Selenium content reaches its peak values at the stage of hard wax ripeness. After full ripeness, selenium content decreases almost by 2 times in two studied samples - grain heap of annual winter wheat of the Admiral variety and grain heap of perennial winter wheat (trititrigia) of the Pamyati Lyubimovoy variety. In grain heap of the Sova variety of wheatgrass, selenium content practically does not change after full ripeness. This is probably due to the presence of a large amount of non-grain part in the grain heap of the Sova variety of wheatgrass, which is typical for this type of crop (Sova variety of wheatgrass has a large amount of green mass in comparison with other grain crops [15]).
The zinc content at early stages of ripeness (milk and wax 77–87) remains practically unchanged. After full ripeness, the amount decreases slightly by 4–9 mg/kg.
Starch accumulation in grain occurs throughout the growing season and reaches peak values at full maturity. The grain heap of the Sova variety of wheatgrass contains 1.6 times less starch than the other two analyzed samples.
The content of Vitamin E also increases after full ripeness. Vitamin E is fat-soluble and is found mainly in the embryo, so its amount increases sharply after full ripeness – when the embryo is fully formed (increase from 4.71 to 30.22 mg/kg). The change in the quality indicators of grain is similar in all three samples.
3.2. Results of the Study of Prebiotic Activity of Grain Heap of Wheat of Early Stages of Maturity
To study the prebiotic activity, we used a grain heap of Admiral wheat of the hard wax ripeness stage (87 on the BBCH scale), since it is at this stage that the highest content of all the nutrients studied in this work is observed.
3.2.1. Study of the Effect of High Concentrations of Milk Ripeness Wheat in the Chicken Microbiota Model
An artificial intestinal environment of a chicken was used as a model medium. Concentrations of 5%, 2% and 1% were used, since concentrations of 2% were the most effective in our previous studies with essential oil plant cakes. The results are presented in Table 11.
The presented data show that the waxy wheat grain heap had a significant effect on the chicken microbiota. The number of lactic acid bacteria increased, the pH level of the medium decreased. The number of opportunistic microorganisms decreased, the number of E. coli fell to values below the threshold for this technique. On the other hand, the concentration of bifidobacteria and bacilli also decreased.
In general, an excessively high concentration of waxy wheat grain heap, despite the increase in the number of lactic acid bacteria, has a negative effect on the microbiota, reducing diversity and completely suppressing some groups of microorganisms. Nevertheless, such shifts show the high potential of waxy wheat grain heap as a prebiotic.
3.2.2. Study of Low Concentrations of Milky Ripeness Wheat in the Chicken Microbiota Model
An artificial chicken intestinal environment was used as a model medium. Concentrations of 0.1%, 0.25%, 0.5% were used. The addition of sugar at a concentration of 0.1% was also used as a positive control. It was necessary to determine whether the observed effect was based on the content of prebiotic components or only on the content of simple sugars in the composition of the wheat grain heap. The results obtained are presented in Table 12.
The presented data show that the microbiota responded weaker to the introduction of waxy wheat grain heap: concentrations of 0.1% and 0.25% did not have a reliable effect on the number and ratio of microorganism groups in the chicken microbiota. A concentration of 0.5% led to an increase in the number of lactobacilli and a decrease in the number of enterococci.
Sugar, even in a deliberately overestimated concentration, did not have a reliable effect on the chicken microbiota, which means that the effect we observed is not associated with the presence of simple sugars in wheat.
3.2.3. Study of Average Concentrations of Milk-Ripe Wheat in the Chicken Microbiota Model
At this stage, the concentrations that seemed the most promising after the first two stages were evaluated - 0.5%, 0.75% and 1%. The results are presented in Table 13.
The presented data show that the effect of introducing waxy wheat grain heap is weaker than the first experiment and is comparable to the second. All three concentrations caused an increase in the number of lactobacilli. At a concentration of 0.5%, a decrease in the number of E. coli and bacilli is noted, at concentrations of 0.75% and 1% - E. coli, enterococci and bacilli.
3.2.4. Study of Waxy Wheat Grain Heap in the Quail Microbiota Model
To assess the effect of waxy wheat grain heap on the microbiota of other birds, a model of quail cecum microbiota was studied. Milky ripeness wheat was used at a concentration of 0.5%, 0.75% and 1%. The obtained data are presented in Table 14.
The presented data show that the effect of waxy wheat grain heap on the microbiota of quails is weaker than on the microbiota of chickens. Among the groups representing opportunistic microorganisms, no reliable change in the number was noted when introducing waxy wheat grain heap. No change in the number of bifidobacteria was noted either. At the same time, the number of lactobacilli and other lactic acid bacteria increased significantly, by more than two orders of magnitude, which repeats the trend noted in experiments on the model chicken environment. 3.2.5 Study of dry grain heap of waxy ripeness wheat for the number of microorganisms of different groups under the conditions of the quail microbiota model, CFU/ml
In order to check whether the activity of the grain heap of waxy ripeness wheat changes after drying, wheat in the amount of 1 g, 0.75 g and 0.5 g (which corresponds to 1%, 0.75% and 0.5% concentration) was dried in a dry-heat oven at a temperature of 80 ° C. The moisture content of the wheat was 32%. The results obtained are shown in Table 15. The concentrations are recalculated for the actual moisture content of the grain heap of waxy ripeness wheat.
As in the previous case, no reliable differences were noted in the number of microorganism groups from the control values, with the exception of the number of lactic acid bacteria, which increased by two orders of magnitude.
3.2.6. Effect of Waxy Wheat Grain Heap on Lactobacilli
Data on the effect of waxy wheat grain heap on the pH of the medium after incubation with Limosilactobacillus frumenti KL31 are presented in Table 16.
It can be noted that on the nutrient medium rich in sugars (MRS) a significant decrease in the pH level is observed during the incubation of Limosilactobacillus frumenti KL31. On the artificial intestinal medium containing trace amounts of simple sugars, the pH remains neutral. At the same time, the introduction of both wet and dry grain heap of waxy ripeness wheat leads to an increase in the production of lactic acid by Limosilactobacillus frumenti KL31. This means that the grain heap of waxy ripeness wheat contains carbohydrates that can serve as an energy source for lactobacilli.
4. Discussion
The obtained data confirmed the results of previous studies [2,3,4,5,6,7,8,9,10]: the protein content is higher at the early stages of maturity, by 3–4% on average. In addition, data were obtained confirming the negative impact of increasing the harvesting time on the volume and quality of the crop: in addition to the problem of self-shedding, which is a natural process of agricultural crops that results in significant losses, the quality of such grain also deteriorates. Therefore, timely harvesting of cereal crops will allow you to get a high-quality crop with minimal losses [17]. It is at the stage of hard wax ripeness that the grain accumulates the maximum amount of protein, which is consistent with the results of studies [2]. The results of the analysis of changes in the amino acid composition of cereal crops showed similar dynamics: at the stage of milk ripeness (stage 77 on the BBCH scale), the maximum content of glutamic acid, glutamine and tryptophan is observed; the content of aspartic acid and asparagine at the stage of the early phase of wax ripeness (83 on the BBCH scale) reaches its peak values; The greatest amount of amino acids lysine, tyrosine, phenylalanine, methionine, alanine, glycine, cystine in a heap of grain crops is observed at the stage of hard wax ripeness (stage 87 on the BBCH scale); the content of histidine, leucine, isoleucine, valine, proline, threonine, and serine increases throughout the growing season. This is consistent with the data [3], where scientists studied spelt at the milk and full ripeness stages. They found that in the grain at the milk ripeness stage, the content of lysine, methionine, alanine and tyrosine is higher than at the stage of full ripeness. In our studies, the obtained data were clarified, as a result of which it was revealed that these amino acids continue to increase until hard wax ripeness (stage 87 on the BBCH scale).
It is important to note that such amino acids as lysine and methionine are among the most important essential amino acids that participate in various oxidation-reduction processes in the animal body, contribute to increased productivity and strengthening of the immune system [18,19]. Limiting (critical) amino acids play an important role in the nutrition of animals and fish, the deficiency or excess of which affects the absorption of other amino acids. Limiting amino acids differ in different animal species. Thus, for birds, the limiting amino acids are methionine and cystine, for pigs - lysine. These amino acids reach their peak values at wax ripeness (stage 87 on the BBCH scale). In plant materials, tryptophan, methionine and lysine most often act as limiting amino acids. A deficiency of limiting amino acids in feed can lead to metabolic disorders, decreased immunity, obesity and greater feed consumption [18,19]. Therefore, it is advisable to use a heap of cereal crops at the stage of hard wax ripeness, when their quantity at this stage is maximum. The iron content in the grain heap of annual winter wheat of the Admiral variety and perennial winter wheat (trititrigia) of the Pamyati Lyubimovoy variety peak values are observed at the stage of hard wax ripeness. In the grain heap of the Sova variety of blue wheat grass, the iron concentration increases towards the stage of full ripeness (stage 89 on the BBCH scale), which is consistent with the data on the change in the amount of iron in spelt [3].
In two of the three spelt varieties, the phosphorus content is higher at the milk stage of ripeness [3]. According to our data, the phosphorus content slowly increases throughout all the studied stages. A sharp increase (almost 2 times) occurs after full ripeness and reaches 0.37–0.49%.
The zinc content at the early stages of ripeness (milk and wax 77–87) remains virtually unchanged. After full ripeness, the amount decreases slightly by 4–9 mg/kg. This is consistent with the data on zinc changes in spelt [3].
Thus, the dynamics of changes in the main nutritional nutrients of cereal crops, such as starch and protein, are similar for both wheat (annual and perennial) and spelt [2,3,4,5,6,7,8,9,10], regardless of the conditions and growing zone.
The dynamics of changes in mineral substances vary somewhat, which may be due to weather conditions, soil composition, and fertilization [20,21,22]. The introduction of a grain heap of waxy ripeness wheat stably led to an increase in the number of lactic acid bacteria. The number of opportunistic microorganisms decreased; the number of E. coli fell to values below the threshold for this method. On the other hand, the concentration of bifidobacteria and bacilli also decreased.
5. Conclusions
The grain heap of eared crops, harvested at the stage of hard wax ripeness, has a higher content of protein, some amino acids, namely lysine, tyrosine, phenylalanine, methionine, alanine, glycine, cystine, mineral substances (iron, selenium) and other useful nutrients. Studies have shown that harvesting grain at early stages of ripeness will not only allow obtaining valuable feed raw materials, but also reduce grain losses from self-shedding, which occurs as a result of untimely harvesting. In addition to nutritional properties, the grain heap of waxy ripeness wheat causes an increase in the number of lactic acid bacteria in the intestinal microbiota and is therefore a promising prebiotic for agriculture. Based on the studies, the recommended concentration of the grain heap of waxy ripeness wheat as a feed additive is 1%. The grain heap of waxy ripeness wheat has a high moisture content (about 40%) and does not lose its prebiotic properties when dried. In further research, it is planned to conduct a series of experiments aimed at developing a method for determining the purpose of grain that has not yet reached full maturity (forage or food purposes) in field conditions.
Author Contributions
Conceptualization, B.M., V.P. and D.R.; methodology, D.R., T.M. and M.M.; investigation, D.R., T.M., M.M. and A.O.; resources, B.M. and V.P.; data curation, D.R., T.M., M.M., and A.O.; writing–original draft preparation T.M., M.M and A.O.; writing–review and editing, V.P., D.R. and T.M.; visualization, D.R., T.M. and A.O.; supervision, B.M. and V.P. All authors have read and agreed to the published version of the manuscript.
Funding
This work is carried out as part of the project “Development of personalized feeds of a new generation with plant and probiotic additives to increase the survival rate and improve the health of fish” (FZNE-2023-0003).
Data Availability Statement
Data are contained within the article.
Conflicts of Interest
The authors declare no conflict of interest.
References
- Ponomarev, S.V.; Grozescu, Y.N.; Bakhareva, A.A. Industrial fish farming: textbook, 2nd ed., revised. and additional; Publishing house "Lan": St. Petersburg, Russian Federation, 2022; 448 p. URL: https://e.lanbook.com/book/211118 (access date: 11/27/2024). (In Russian).
- Sandrykin, D.V.; Kondratenko, E.P.; Egushova, E.A.; Pinchuk L.G. Dynamics of dry matter accumulation and changes in the chemical composition of grain during ripening. Achievements of science and technology of the agro-industrial complex, 2011, 12, pp. 32-33. (In Russian).
- Kraska, P.; Andruszczak, S.; Dziki, D.; Stocki, M.; Stocka, N.; Kwiecińska-Poppe, E.; Różyło, K.; Gierasimiuk, P. Green grain of spelt (Triticum aestivum ssp. spelta) harvested at the stage of milk-dough as a rich source of valuable nutrients. Emirates Journal of Food and Agriculture, 2019, 31(4), pp. 263-270. [CrossRef]
- Berihuete-Azorín, M.; Stika, H.-P.; Hallama, M.; Valamoti, S.M. Distinguishing ripe spelt from processed green spelt (Grünkern) grains: Methodological aspects and the case of early La Tène Hochdorf (Vaihingen a.d. Enz, Germany). Journal of Archaeological Science, 2020, 118, 105143. [CrossRef]
- Özkaya, B.; Turksoy, S.; Özkaya, H.; Baumgartner, B.; Özkeser, İ.; Köksel, H. Changes in the functional constituents and phytic acid contents of firiks produced from wheats at different maturation stages. Food Chemistry, 2018, 246. pp. 150-155. [CrossRef]
- Wollmer, A.C.; Pitann, B.; Mühling, K.H. Grain storage protein concentration and composition of winter wheat (Triticum aestivum L.) as affected by waterlogging events during stem elongation or ear emergence. Journal of Cereal Science. 2018. 83. pp. 9-15. [CrossRef]
- Martínez-Núñez, M.; Ruiz-Rivas, M.; Vera-Hernández, P.F.; Bernal-Muñoz, R.; Luna-Suárez, S.; Rosas-Cárdenas, F.F. The phenological growth stages of different amaranth species grown in restricted spaces based in BBCH code. South African Journal of Botany, 2019, 124. pp. 436-443. [CrossRef]
- Brandán, J. P.; Curti, R.N.; Acreche, M.M. Phenological growth stages in chia (Salvia hispanica L.) according to the BBCH scale. Scientia Horticulturae, 2019, 255, pp. 292-297. [CrossRef]
- Hernández D.P.M.; Aranguren, M.; Reig, C.; Galván, D.F.; Mesejo, C.; Fuentes, A.M.; Saúco, V.G.; Agustí, M. Phenological growth stages of mango (Mangifera indica L.) according to the BBCH scale. Scientia Horticulturae, 2011, 130 (3), pp. 536-540. [CrossRef]
- Miedaner, T.; Haffke, S.; Siekmann, D.; Fromme, F.J.; Roux, S.R.; Hackauf, B. Dynamic quantitative trait loci (QTL) for plant height predict biomass yield in hybrid rye (Secale cereale L.). Biomass and Bioenergy, 2018, 115, pp. 10-18. [CrossRef]
- Guerreiro, I.; Oliva-Teles, A; Enes, P. Prebiotics as functional ingredients: Focus on Mediterranean fish aquaculture. Reviews in Aquaculture, 2018, 10 (4), pp. 800-832, 10.1111/raq.12201.
- Khanjani, M.H.; Mozanzadeh, M.T.; Gisbert, E.; Hoseinifar, S.H. Probiotics, prebiotics, and synbiotics in shrimp aquaculture: Their effects on growth performance, immune responses, and gut microbiome. Aquaculture Reports, 2024, 38, 102362. [CrossRef]
- Fangueiro, J.F.; de Carvalho, N.M.; Antunes, F.; Mota, I.F.; Pintado, M.E.; Madureira, A.R.; Costa, P.S. Lignin from sugarcane bagasse as a prebiotic additive for poultry feed. International Journal of Biological Macromolecules. 2023, 239, 124262. [CrossRef]
- Serradell, A.; Torrecillas, S.; Soares, F.; Silva, T.; Montero, D. Modelling the effect of prebiotics, probiotics and other functional additives on the growth, feed intake and feed conversion of European sea bass (Dicentrarchus labrax) juveniles. Aquaculture Reports, 2023, 32, 101729. [CrossRef]
- Rudoy, D.; Pakhomov, V.; Olshevskaya, A.; Maltseva, T.; Ugrekhelidze, N.; Zhuravleva, A.; Babajanyan, A. Review and analysis of perennial cereal crops at different maturity stages. IOP Conf. Series: Earth and Environmental Science, 2021, 937, 022111. [CrossRef]
- Lachuga, Y.F.; Meskhi, B.C.; Pakhomov, V.I.; Rudoy, D.V. Harvesting Machine. Patent of the Russian Federation No 206314 U1, 6 September 2021.
- Pakhomov, V.; Rudoy, D.; Kambulov, S.; Maltseva, T. Research on Energy Intensity of Wheat Harvesting at Different Ripeness Phases with a New Stripping–Threshing Unit. AgriEngineering 2024, 6, 3159–3173. [CrossRef]
- Kolmakov, V.I.; Kolmakova, A.A. Amino acids in promising feeds for fish aquaculture: a review of experimental data. Journal of Siberian Federal University. Biology, 2020, 13(4), 424–442. (In Russian). [CrossRef]
- Abrosimova N. A., Abrosimov S. S., Saenko E. M. Feed raw materials and additives for aquaculture objects. Publishing house "Media-Polis": Rostov-on-Don, Russian Federation, 2006; 147 p. URL: http://dspace.vniro.ru/handle/123456789/1645?show=full (date of access: 27.11.2024). (In Russian).
- Aleshin, M.A.; Mikhailova, L.A. Changes in the yield and biochemical composition of grain of field crops in mixed crops when using mineral fertilizers. Fertility. 2020, 2(113). P. 9-13. (In Russian). [CrossRef]
- Gao, L.; Haesaert, G.; Bockstaele, F.V.; Vermeir, P.; Skirtach, A.; Eeckhout, M. Combined effects of nitrogen and sulfur fertilizers on chemical composition, structure and physicochemical properties of buckwheat starch. Food Chemistry. 2024, 459, 140351. [CrossRef]
- Lu, T.; Shi, J.; Zonglin Lu, Zhengchao Wu, Yan Wang, Peiyu Luo, Xiaori Han, Appropriate application of organic fertilizer enhanced yield, microelement content, and quality of maize grain under a rotation system. Annals of Agricultural Sciences. 2024, 69(1), pp. 19-32. [CrossRef]
Figure 1.
Harvesting of cereal crops at early stages of maturity: (a) Stripping and threshing unit for harvesting cereal crops; (b) Grain heap of wheat at early stages of maturity.
Figure 1.
Harvesting of cereal crops at early stages of maturity: (a) Stripping and threshing unit for harvesting cereal crops; (b) Grain heap of wheat at early stages of maturity.
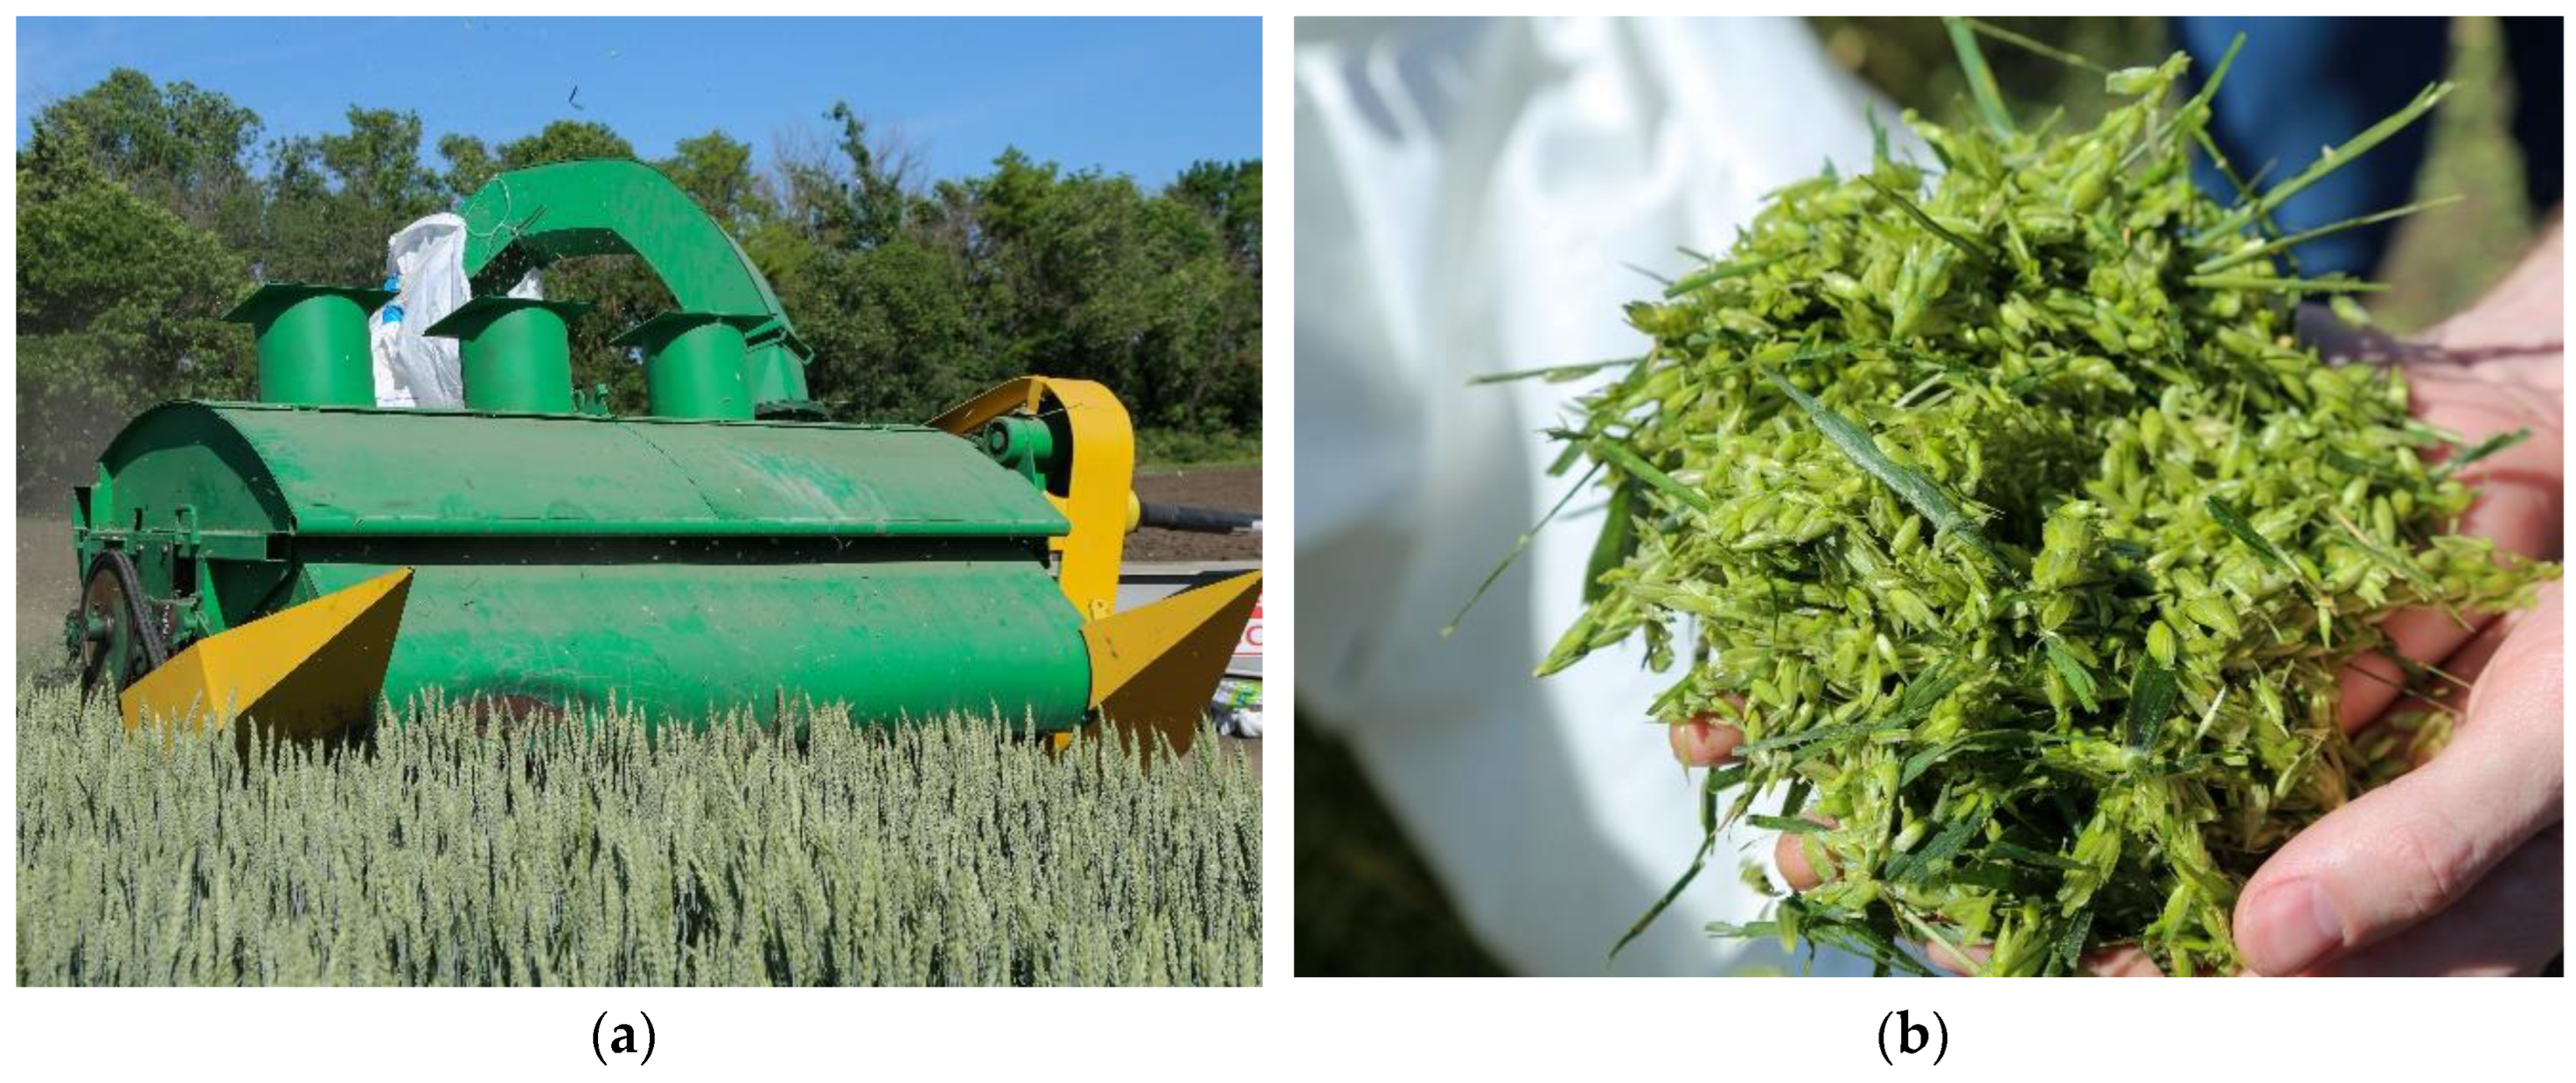
Figure 2.
Changes in the amino acid composition of the grain heap of the Admiral wheat variety during the ripening process: 77 – late milk ripeness, 83 – early wax ripeness phase, 87 – hard wax ripeness, 89 – full ripeness, 92 – overripeness. Confidence probability p=0.95.
Figure 2.
Changes in the amino acid composition of the grain heap of the Admiral wheat variety during the ripening process: 77 – late milk ripeness, 83 – early wax ripeness phase, 87 – hard wax ripeness, 89 – full ripeness, 92 – overripeness. Confidence probability p=0.95.
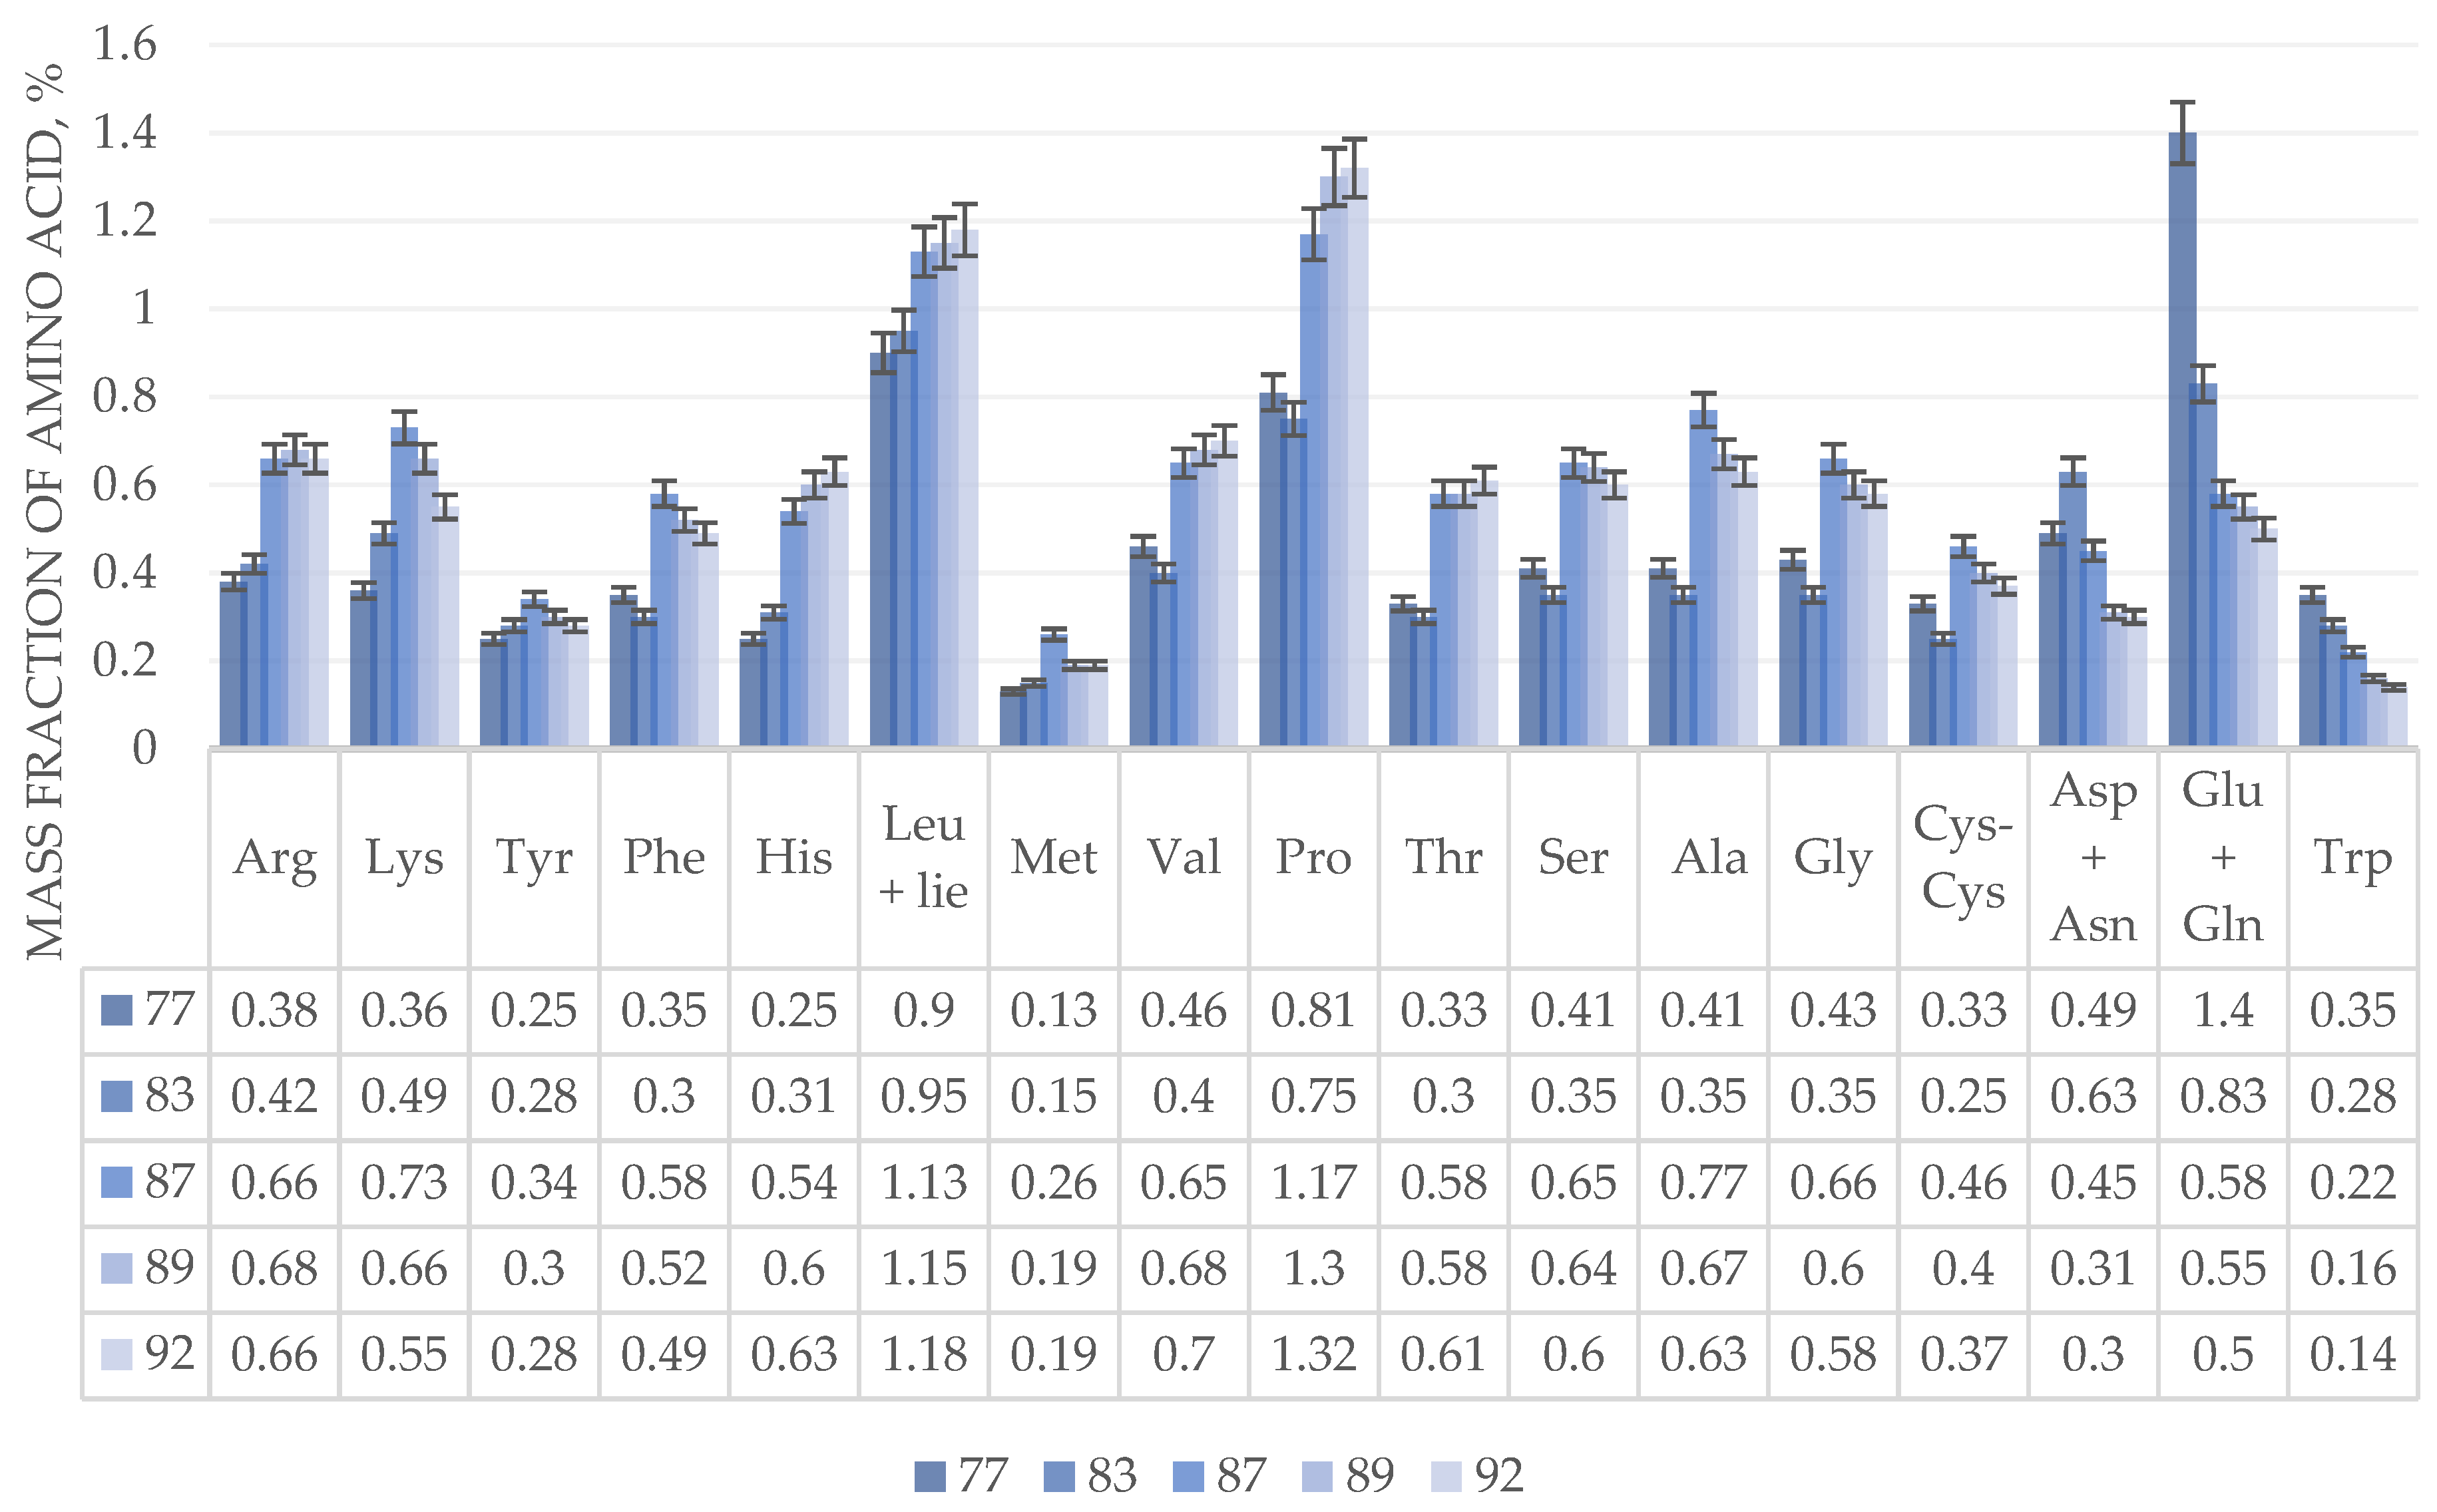
Figure 3.
Changes in the amino acid composition of the grain heap of perennial winter wheat (trititrigia) of the Pamyati Lyubimovoy variety during the ripening process: 77 – late milky ripeness, 83 – early wax ripeness phase, 87 – hard wax ripeness, 89 – full ripeness, 92 – overripeness.
Figure 3.
Changes in the amino acid composition of the grain heap of perennial winter wheat (trititrigia) of the Pamyati Lyubimovoy variety during the ripening process: 77 – late milky ripeness, 83 – early wax ripeness phase, 87 – hard wax ripeness, 89 – full ripeness, 92 – overripeness.
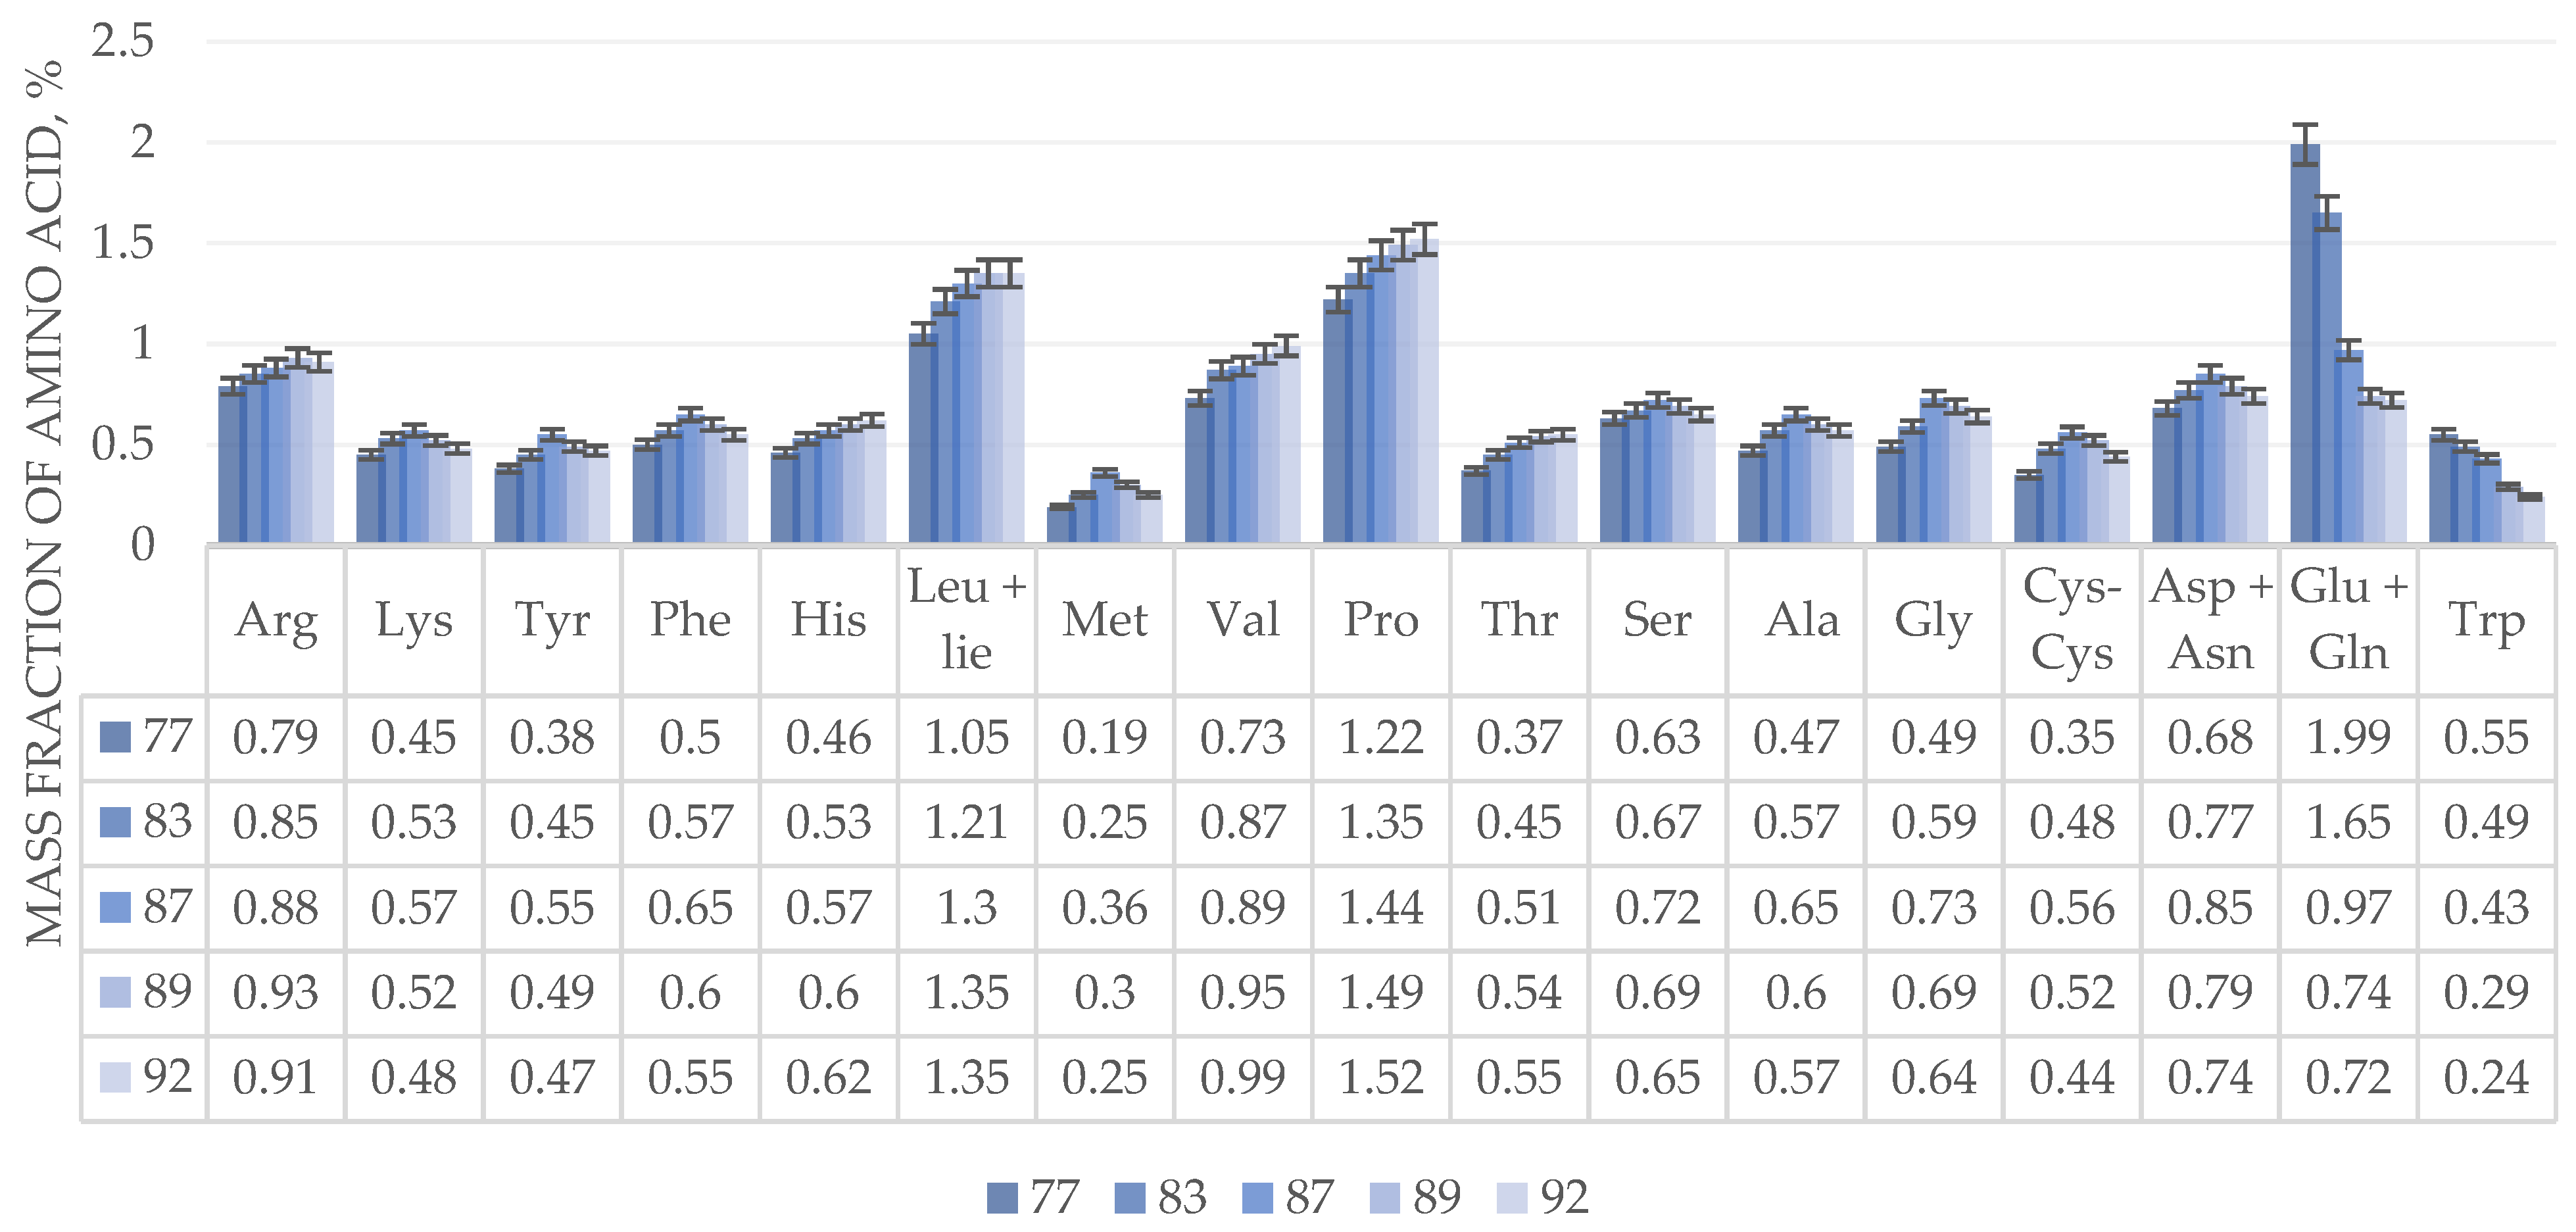
Figure 4.
Changes in the amino acid composition of the grain heap of the perennial wheatgrass variety Sova during the ripening process: 77 – late milky ripeness, 83 – early wax ripeness phase, 87 – hard wax ripeness, 89 – full ripeness, 92 – overripeness.
Figure 4.
Changes in the amino acid composition of the grain heap of the perennial wheatgrass variety Sova during the ripening process: 77 – late milky ripeness, 83 – early wax ripeness phase, 87 – hard wax ripeness, 89 – full ripeness, 92 – overripeness.
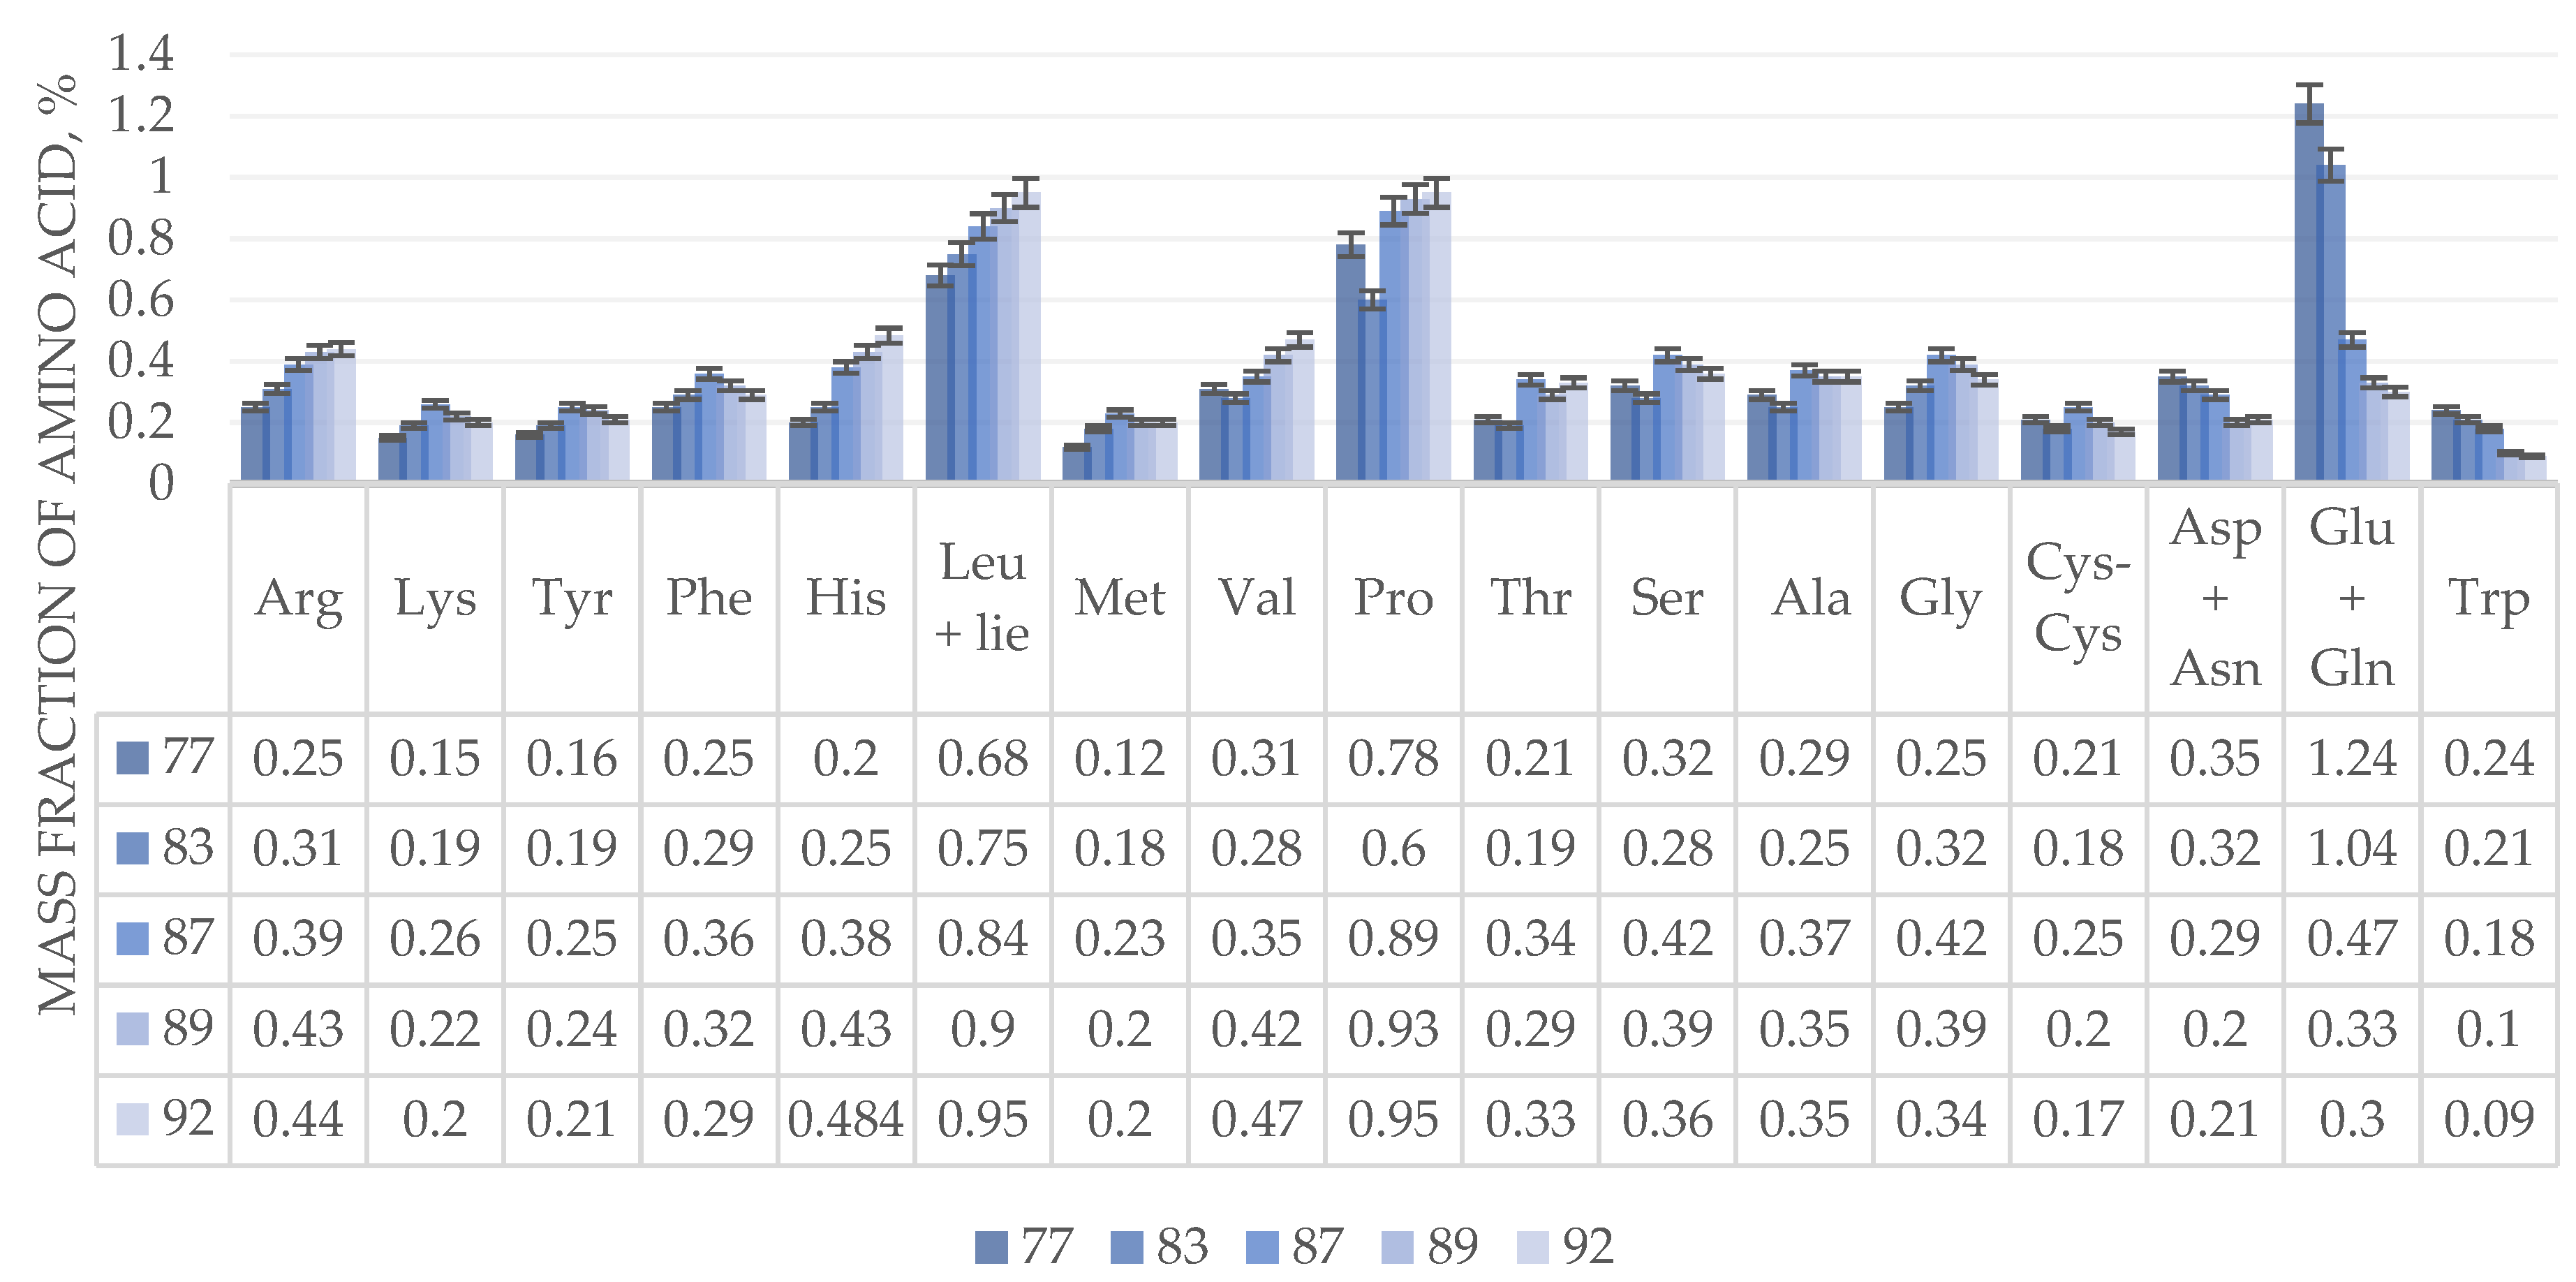
Table 1.
Comparative characteristics of the composition of spelt (mineral substances) of different varieties at the stage of milk ripeness and the stage of full ripeness.
Table 1.
Comparative characteristics of the composition of spelt (mineral substances) of different varieties at the stage of milk ripeness and the stage of full ripeness.
| Name of the spelt variety | Oberkulmer Rotkorn | Rokosz | Wirtas |
|---|---|---|---|
| Minerals | Cu, Zn*, Mn, Fe*, Na*, B*, N, P*, K*, Mg, Ca* | Cu, Zn*, Mn*, Fe, Na*, B, N*, P, K*, Mg, Ca | Cu, Zn*, Mn*, Fe, Na, B*, N, P*, K*, Mg*, Ca* |
* - highest content in the milk ripeness stage.
Table 3.
Change in the mass fraction of protein (%) in a heap of cereal crops during the maturation process (Confidence probability p=0.95).
Table 3.
Change in the mass fraction of protein (%) in a heap of cereal crops during the maturation process (Confidence probability p=0.95).
| Sample name, % | Growth phase according to BBCH scale | ||||
|---|---|---|---|---|---|
| 77 | 83 | 87 | 89 | 92 | |
| Grain heap of one-year winter wheat of the "Admiral" variety | 12.65±0.41 | 12.32±0.40 | 13.49±0.43 | 13.17±0.42 | 12.87±0.41 |
| Grain heap of perennial winter wheat (trititrigia) of the "Pamyati Lyubimovoy" variety | 12.93±0.41 | 15.01±0.47 | 16.11±0.50 | 15.76±0.49 | 15.41±0.48 |
| Grain heap of the blue wheatgrass variety "Sova" | 8.74±0.30 | 8.78±0.30 | 9.12±0.31 | 9.0±0.30 | 8.45±0.29 |
Table 4.
Change in moisture content (%) in a heap of cereal crops during ripening (Confidence probability p=0.95).
Table 4.
Change in moisture content (%) in a heap of cereal crops during ripening (Confidence probability p=0.95).
| Sample name | Growth phase according to BBCH scale | ||||
|---|---|---|---|---|---|
| 77 | 83 | 87 | 89 | 92 | |
| Grain heap of one-year winter wheat of the Admiral variety | 66.58±1.88 | 46.40±2.03 | 41.20±2.00 | 15.80±1.37 | 11.90±0.92 |
| Grain heap of perennial winter wheat (trititrigia) of the Pamyati Lyubimovoy variety | 65.78±1.90 | 44.32±2.02 | 40.31±1.99 | 14.92±1.34 | 10.60±0.92 |
| Grain heap of the Sova variety of wheatgrass | 55.12±2.02 | 39.78±1.98 | 35.22±1.92 | 13.78±1.29 | 10.40±0.95 |
Table 5.
Change in iron content (mg/kg) in a heap of cereal crops during maturation (Confidence probability p=0.95).
Table 5.
Change in iron content (mg/kg) in a heap of cereal crops during maturation (Confidence probability p=0.95).
| Sample name | Growth phase according to BBCH scale | ||||
|---|---|---|---|---|---|
| 77 | 83 | 87 | 89 | 92 | |
| Grain heap of one-year winter wheat of the Admiral variety | 43.65±4.37 | 46.25±4.63 | 51.39±5.14 | 34.30±3.43 | 33.23±3.32 |
| Grain heap of perennial winter wheat (trititrigia) of the Pamyati Lyubimovoy variety | 44.08±4.41 | 46.17±4.62 | 51.97±5.20 | 36.19±3.62 | 35.78±3.58 |
| Grain heap of the Sova variety of wheatgrass | 46.45±4.65 | 49.21±4.92 | 53.14±5.31 | 55.68±5.57 | 54.12±5.41 |
Table 6.
Change in phosphorus content (%) in a heap of cereal crops during maturation (Confidence probability p=0.95).
Table 6.
Change in phosphorus content (%) in a heap of cereal crops during maturation (Confidence probability p=0.95).
| Sample name | Growth phase according to BBCH scale | ||||
|---|---|---|---|---|---|
| 77 | 83 | 87 | 89 | 92 | |
| Grain heap of one-year winter wheat of the Admiral variety | 0.12±0.03 | 0.15±0.03 | 0.17±0.04 | 0.18±0.04 | 0.37±0.05 |
| Grain heap of perennial winter wheat (trititrigia) of the Pamyati Lyubimovoy variety | 0.17±0.04 | 0.21±0.04 | 0.23±0.04 | 0.27±0.05 | 0.4±0.05 |
| Grain heap of the Sova variety of wheatgrass | 0.22±0.04 | 0.27±0.05 | 0.30±0.05 | 0.36±0.05 | 0.49±0.05 |
Table 7.
Change in selenium content (mg/kg) in a heap of cereal crops during maturation (Confidence probability p=0.95).
Table 7.
Change in selenium content (mg/kg) in a heap of cereal crops during maturation (Confidence probability p=0.95).
| Sample name | Growth phase according to BBCH scale | ||||
|---|---|---|---|---|---|
| 77 | 83 | 87 | 89 | 92 | |
| Grain heap of one-year winter wheat of the Admiral variety | 0.23±0.06 | 0.34±0.07 | 0.51±0.08 | 0.36±0.07 | 0.29±0.07 |
| Grain heap of perennial winter wheat (trititrigia) of the Pamyati Lyubimovoy variety | 0.20±0.04 | 0.31±0.07 | 0.45±0.08 | 0.31±0.07 | 0.25±0.07 |
| Grain heap of the Sova variety of wheatgrass | 0.32±0.07 | 0.40±0.08 | 0.55±0.08 | 0.49±0.08 | 0.44±0.08 |
Table 8.
Change in zinc content (mg/kg) in a heap of cereal crops during maturation (Confidence probability p=0.95).
Table 8.
Change in zinc content (mg/kg) in a heap of cereal crops during maturation (Confidence probability p=0.95).
| Sample name | Growth phase according to BBCH scale | ||||
|---|---|---|---|---|---|
| 77 | 83 | 87 | 89 | 92 | |
| Grain heap of one-year winter wheat of the Admiral variety | 34.16±3.42 | 31.09±3.11 | 35.61±3.56 | 26.34±2.63 | 23.07±2.31 |
| Grain heap of perennial winter wheat (trititrigia) of the Pamyati Lyubimovoy variety | 38.47±3.85 | 35.49±3.55 | 37.98±3.80 | 32.74±3.27 | 30.55±3.06 |
| Grain heap of the Sova variety of wheatgrass | 40.12±4.01 | 38.22±3.82 | 41.03±4.10 | 37.12±3.71 | 35.54±3.55 |
Table 9.
Change in starch content (%) in a heap of cereal crops during maturation (Confidence probability p=0.95).
Table 9.
Change in starch content (%) in a heap of cereal crops during maturation (Confidence probability p=0.95).
| Sample name | Growth phase according to BBCH scale | ||||
|---|---|---|---|---|---|
| 77 | 83 | 87 | 89 | 92 | |
| Grain heap of one-year winter wheat of the Admiral variety | 59.65±9.34 | 61.22±9.57 | 63.71±9.95 | 67.83±10.56 | 67.23±10.47 |
| Grain heap of perennial winter wheat (trititrigia) of the Pamyati Lyubimovoy variety | 55.17±8.67 | 59.74±9.35 | 62.95±9.83 | 65.12±10.16 | 64.75±10.10 |
| Grain heap of the Sova variety of wheatgrass | 30.17±4.92 | 32.23±5.22 | 38.47±6.16 | 38.95±6.23 | 40.70±6.50 |
Table 10.
Change in Vitamin E content (mg/kg) in a heap of cereal crops during the maturation process (Confidence probability p=0.95).
Table 10.
Change in Vitamin E content (mg/kg) in a heap of cereal crops during the maturation process (Confidence probability p=0.95).
| Sample name | Growth phase according to BBCH scale * | ||||
|---|---|---|---|---|---|
| 77 | 83 | 87 | 89 | 92 | |
| Grain heap of one-year winter wheat of the Admiral variety | 6.63±1.14 | 3.35±0.58 | 4.71±0.81 | 30.22±5.21 | 38.98±6.72 |
| Grain heap of perennial winter wheat (trititrigia) of the Pamyati Lyubimovoy variety | 6.78±1.17 | 3.55±0.61 | 5.02±0.87 | 35.77±6.17 | 41.44±7.14 |
| Grain heap of the Sova variety of wheatgrass | 6.25±1.08 | 2.91±0.50 | 3.76±0.65 | 25.84±4.46 | 33.72±5.81 |
Table 11.
The effect of high concentrations of waxy wheat grain heap on the number of microorganisms of different groups under the conditions of the chicken microbiota model, CFU/ml.
Table 11.
The effect of high concentrations of waxy wheat grain heap on the number of microorganisms of different groups under the conditions of the chicken microbiota model, CFU/ml.
| Name of bacteria | Control | 1% | 2% | 5% |
|---|---|---|---|---|
| Lactic acid bacteria | 1.2·107 | 4.7·108 | 4.4·108 | 2.0·108 |
| Bifidobacterium | 106 | 104 | 104 | 104 |
| Enterococcus | 4.0·106 | 9.4·104 | 1.3·104 | 1.1·103 |
| E.coli | 5.7·106 | - | - | - |
| Staphylococcus | 6.1·106 | 9.6·104 | 3.3·104 | 3.0·103 |
| Bacillus | 3.2·106 | 6.0·103 | 7.3·102 | - |
| pH | 7.1 | 6.2 | 5.9 | 5.2 |
Table 12.
The effect of low concentrations of waxy wheat grain heap on the number of microorganisms of different groups under the conditions of the chicken microbiota model, CFU/ml.
Table 12.
The effect of low concentrations of waxy wheat grain heap on the number of microorganisms of different groups under the conditions of the chicken microbiota model, CFU/ml.
| Name of bacteria | Control | 0.1% | 0.25% | 0.5% | Sugar |
|---|---|---|---|---|---|
| Lactic acid bacteria | 1.8·107 | 1.0·107 | 7.0·107 | 1.4·108 | 3.3·107 |
| Bifidobacterium | 108 | 108 | 108 | 108 | 108 |
| Enterococcus | 1.2·108 | 1.2·108 | 1.3·108 | 6.0·107 | 9.1·107 |
| E.coli | 1.1·108 | 6.0·107 | 1.0·108 | 1.0·108 | 1.6·108 |
| Staphylococcus | 5.5·107 | 6.0·107 | 9.7·107 | 3.2·107 | 5.2·107 |
| Bacillus | 1.3·107 | 9.5·106 | 8.0·106 | 2.3·107 | 1.7·107 |
| pH | 7.0 | 6.9 | 7.2 | 6.7 | 7.1 |
Table 13.
The effect of a grain heap of waxy wheat on the number of microorganisms of different groups under the conditions of the chicken microbiota model, CFU/ml.
Table 13.
The effect of a grain heap of waxy wheat on the number of microorganisms of different groups under the conditions of the chicken microbiota model, CFU/ml.
| Name of bacteria | Control | 0.5% | 0.75% | 1% |
|---|---|---|---|---|
| Lactic acid bacteria | 4.5·107 | 1.3·108 | 1.5·108 | 7.6·108 |
| Bifidobacterium | 108 | 108 | 108 | 108 |
| Enterococcus | 3.5·107 | 2.7·107 | 7.4·106 | 8.0·106 |
| E.coli | 2.5·108 | 1.2·107 | 2.0·106 | 4.0·106 |
| Staphylococcus | 9.4·106 | 2.2·106 | 4.0·106 | 6.6·106 |
| Bacillus | 3.1·107 | 4.0·106 | 3.4·106 | 1.0·106 |
| pH | 6.9 | 6.6 | 6.4 | 6.0 |
Table 14.
The influence of a grain heap of waxy ripeness wheat on the number of microorganisms of different groups under the conditions of the quail microbiota model, CFU/ml.
Table 14.
The influence of a grain heap of waxy ripeness wheat on the number of microorganisms of different groups under the conditions of the quail microbiota model, CFU/ml.
| Name of bacteria | Control | 0.5% | 0.75% | 1% |
|---|---|---|---|---|
| Lactic acid bacteria | 1.3·105 | 2.2·107 | 2.9·107 | 7.4·107 |
| Bifidobacterium | 106 | 106 | 106 | 106 |
| Enterococcus | 6.5·108 | 6.9·108 | 6.7·108 | 4.5·108 |
| E.coli | 6.5·108 | 5.2·108 | 6.1·108 | 8.9·108 |
| Staphylococcus | 1.2·108 | 1.8·108 | 2.7·108 | 2.9·108 |
| Bacillus | 1.3·107 | 1.3·107 | 2.3·107 | 1.4·107 |
| pH | 7.2 | 6.8 | 6.5 | 6.4 |
Table 15.
The effect of dry grain heap of waxy wheat on the number of microorganisms of different groups under the conditions of the quail microbiota model, CFU/ml.
Table 15.
The effect of dry grain heap of waxy wheat on the number of microorganisms of different groups under the conditions of the quail microbiota model, CFU/ml.
| Name of bacteria | Control | 0.5% | 0.75% | 1% |
|---|---|---|---|---|
| Lactic acid bacteria | 1.3·105 | 1.0·107 | 1.4·107 | 1.5·107 |
| Bifidobacterium | 106 | 106 | 106 | 106 |
| Enterococcus | 6.5·108 | 5.0·108 | 8.2·108 | 7.4·108 |
| E.coli | 6.5·108 | 2.3·108 | 7.1·108 | 6.2·108 |
| Staphylococcus | 1.2·108 | 3.4·108 | 4.5·108 | 3.5·108 |
| Bacillus | 1.3·107 | 1.0·107 | 2.4·107 | 6.3·107 |
| pH | 7.2 | 6.7 | 6.4 | 6.3 |
Table 16.
pH of media with and without the addition of waxy wheat grain heap during incubation of Limosilactobacillus frumenti KL31 in an artificial intestinal medium (AIM).
Table 16.
pH of media with and without the addition of waxy wheat grain heap during incubation of Limosilactobacillus frumenti KL31 in an artificial intestinal medium (AIM).
| Nutrient medium | рН |
|---|---|
| MRS | 3.1 |
| AIM | 6.9 |
| AIM + 0.5% of wet wheat | 6.7 |
| AIM + 0.75% of wet wheat | 6.2 |
| AIM + 1% of wet wheat | 5.9 |
| AIM + 0.5% of dry wheat | 6.6 |
| AIM + 0.75% of dry wheat | 6.3 |
| AIM + 1% of dry wheat | 6.1 |
Disclaimer/Publisher’s Note: The statements, opinions and data contained in all publications are solely those of the individual author(s) and contributor(s) and not of MDPI and/or the editor(s). MDPI and/or the editor(s) disclaim responsibility for any injury to people or property resulting from any ideas, methods, instructions or products referred to in the content. |
© 2025 by the authors. Licensee MDPI, Basel, Switzerland. This article is an open access article distributed under the terms and conditions of the Creative Commons Attribution (CC BY) license (https://creativecommons.org/licenses/by/4.0/).
Copyright: This open access article is published under a Creative Commons CC BY 4.0 license, which permit the free download, distribution, and reuse, provided that the author and preprint are cited in any reuse.


