1. Introduction
Disease Associated Malnutrition (DAM) in hospitalized children is associated with a higher complication rate, longer hospital stay, and consequently a higher cost [
1,
2,
3,
4,
5]. Early recognition and treatment of malnutrition can improve outcome of children during illness. Therefore, adequate evaluation of the nutritional status and nutrition is an obvious step in the management of children during illness. Systematic nutritional screening is recommended as a strategy to identify children with (risk for) malnutrition in a recently published position paper by the Special Interest Group Clinical Malnutrition of the European Society for Paediatric Gastroenterology, Hepatology and Nutrition (ESPGHAN) [
6].
We conducted a nationwide survey amongst Belgian paediatric hospitals in 2014, demonstrating an underestimation of the prevalence of malnutrition by paediatricians and a lack of awareness and knowledge regarding the nutritional screening process [
7]. Almost a decade after this first study, a follow up study was performed.
The purpose of this study was to 1) list the currently available dietetic resources and staffing in Belgian paediatric departments; 2) survey current practices for nutritional screening, assessment, treatment and follow up; and 3) identify possible barriers to adequate nutritional care and follow up.
2. Materials and Methods
Data collection: A cross-sectional questionnaire study was done to collect data on nutritional screening and clinical practice for nutritional assessment and management in paediatric wards of Belgian hospitals. A first draft of the questionnaire was discussed by a group of experts. The questionnaire was set up in Dutch and later translated in French and back translated to Dutch. The English version of the questionnaire is available in Supplement 1 (S1). The 90 department heads of all Belgian paediatric departments of secondary and tertiary-level hospitals were invited to participate in the survey via email and via postal mail in February 2021. A reminder was sent, through the post and by email 2 months later. Participation in the study was on a voluntary basis. Respondents could opt out of the questionnaire at any time and were not compensated for their contribution. Data collecting was conducted between February 2021 and April 2021. Approval of the ethics committee (Medical Ethics Committee UZ Brussel) was obtained prior to commencing the study.
Statistical analysis: In Belgium there are 3 official languages. The two most spoken languages are Dutch and French, while German is the third official language. However, due to the very small size of the German-speaking population, this group is not included in the study. In the northern part of Belgium, Dutch is the predominant language. In the southern part of Belgium, this is French. With these differences in languages comes differences in culture. Therefore, language was considered an important factor in this study. Department heads were divided into French- and Dutch-speaking respondents depending on the language spoken in the hospital. Another important factor in this study was whether the hospitals were secondary- or tertiary level hospitals since there are significant differences in structure and complexity.
Statistical analysis was performed using the statistical software IBM SPSS Statistics 16. A chi-square or a Fisher’s exact test was used to analyze differences in proportion. Continuous variables were compared using a student t-test or Mann Whitney U test where appropriate. A p-value of <0.05 was considered significant.
3. Results
This section may be divided by subheadings. It should provide a concise and precise description of the experimental results, their interpretation, as well as the experimental conclusions that can be drawn.
3.1. Respondent Characteristics
In total, 61 out of 90 (67.8%) Belgian paediatric departments responded, representing 80.1% of all paediatric hospital beds in Belgium. Of the participating departments, 46 (75.4%) were Dutch-speaking, covering 76.0% of all Dutch-speaking pediatric hospital beds, and 15 were French-speaking, covering 87.0% of French-speaking pediatric hospital beds. Overall, 60.7% of respondents were from larger centers (LC; ≥20 beds). There was no significant difference in the proportion of respondents from smaller centers (SC; <20 beds) between Dutch and French-speaking departments (p = 0.363).
Table 1 provides the demographic characteristics of the study population.
3.2. Perceived Prevalence of DAM and Organizational Aspects
The perceived prevalence of malnutrition was significantly different between the Dutch-(DuC) and French-speaking centers (FrC) (p=<0.001): 40.0% of the FrC reported to admit a malnourished child ≥1x/week, in comparison to 2.2% of the DuC. In total, 32.6% of the DuC and 26.7% of the FrC reported admitting a malnourished child between 1x/week to 1x/month. Most of the DuC (65.2%) reported admitting malnourished children less than once per month, compared to 33.3% of FrC. None of the respondents reported never admitting malnourished children.
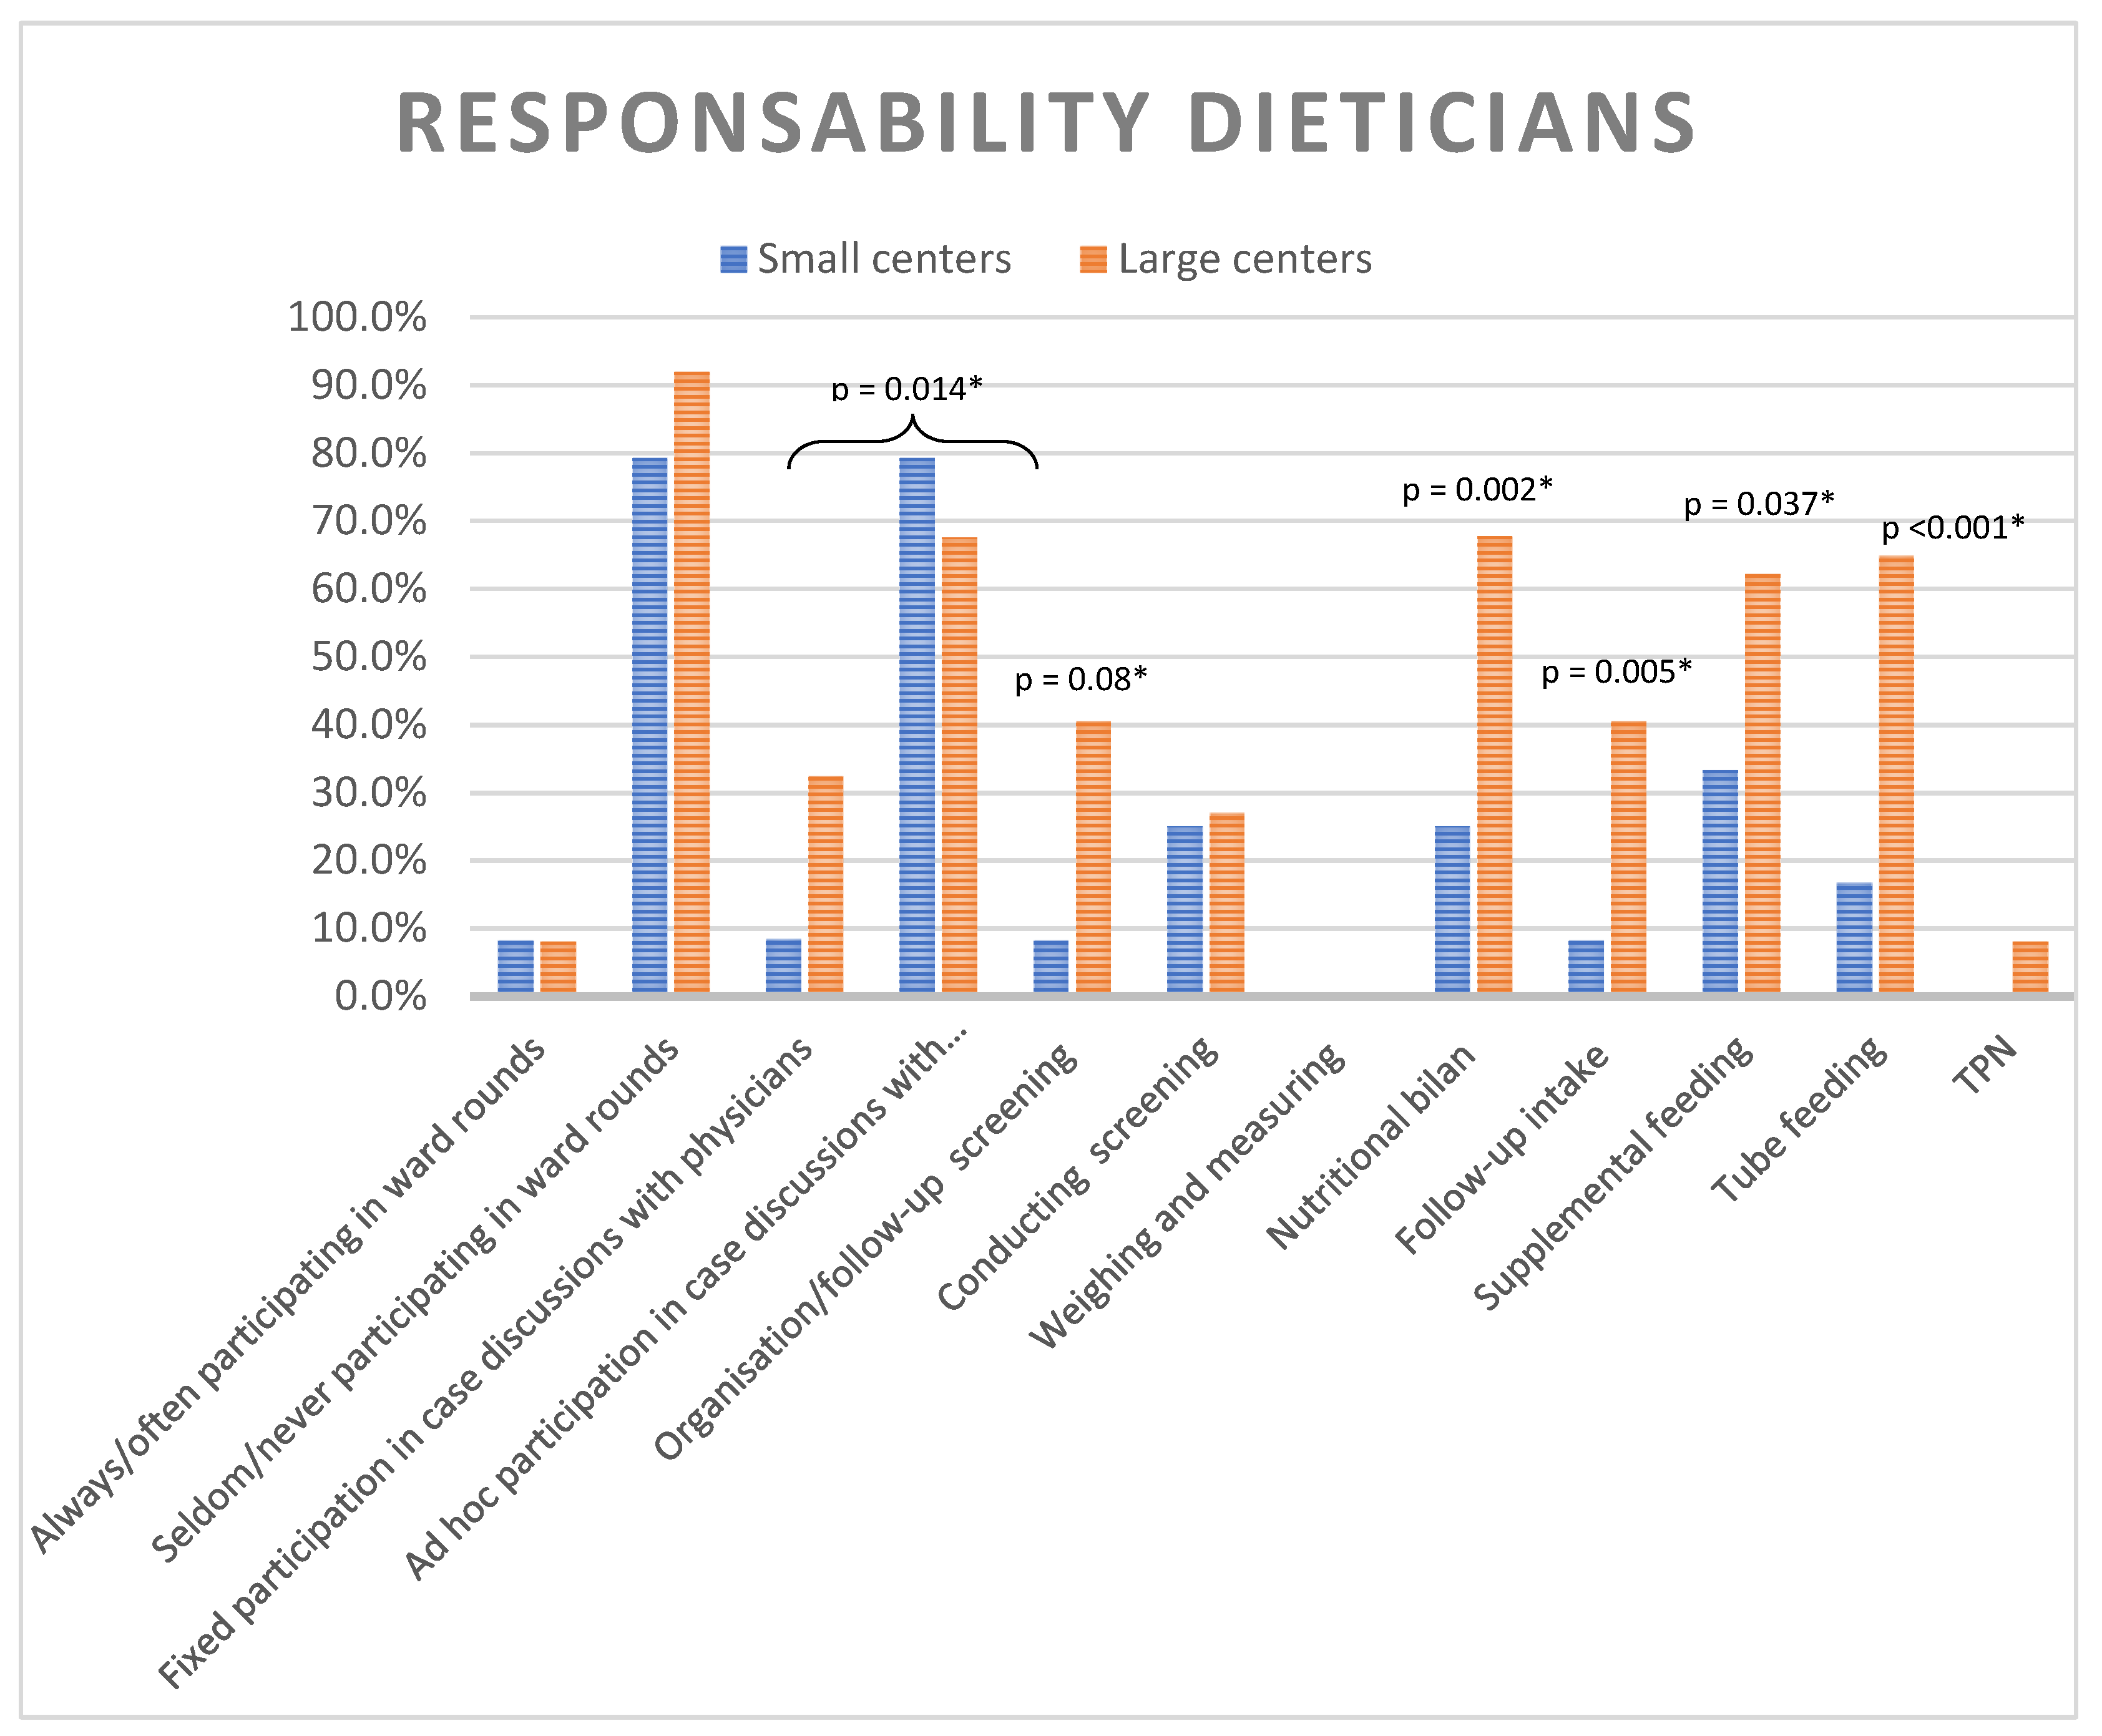
A dietician was present in 80.3% of all responding units with no significant difference between LC and SC. However, there was a significant difference in the number of full-time dietitians: 32.4% of LC had more than one full-time dietitian, compared to only 4.2% of SC (p = 0.016). The clinical responsibilities of dieticians differed significantly between LC and SC (
Figure 1). Although systematic participation of dietitians in ward rounds was rare (8.2%), they were frequently involved on an ad-hoc basis (72.1%). Nutritional interventions such as supplementary feeding and tube feeding generally fell under the dietitians’ responsibilities in larger centers, whereas this was less common in smaller centers. The initiation and follow-up of parenteral nutrition was not within their responsibilities (cfr.
Figure 1).
3.3. Screening
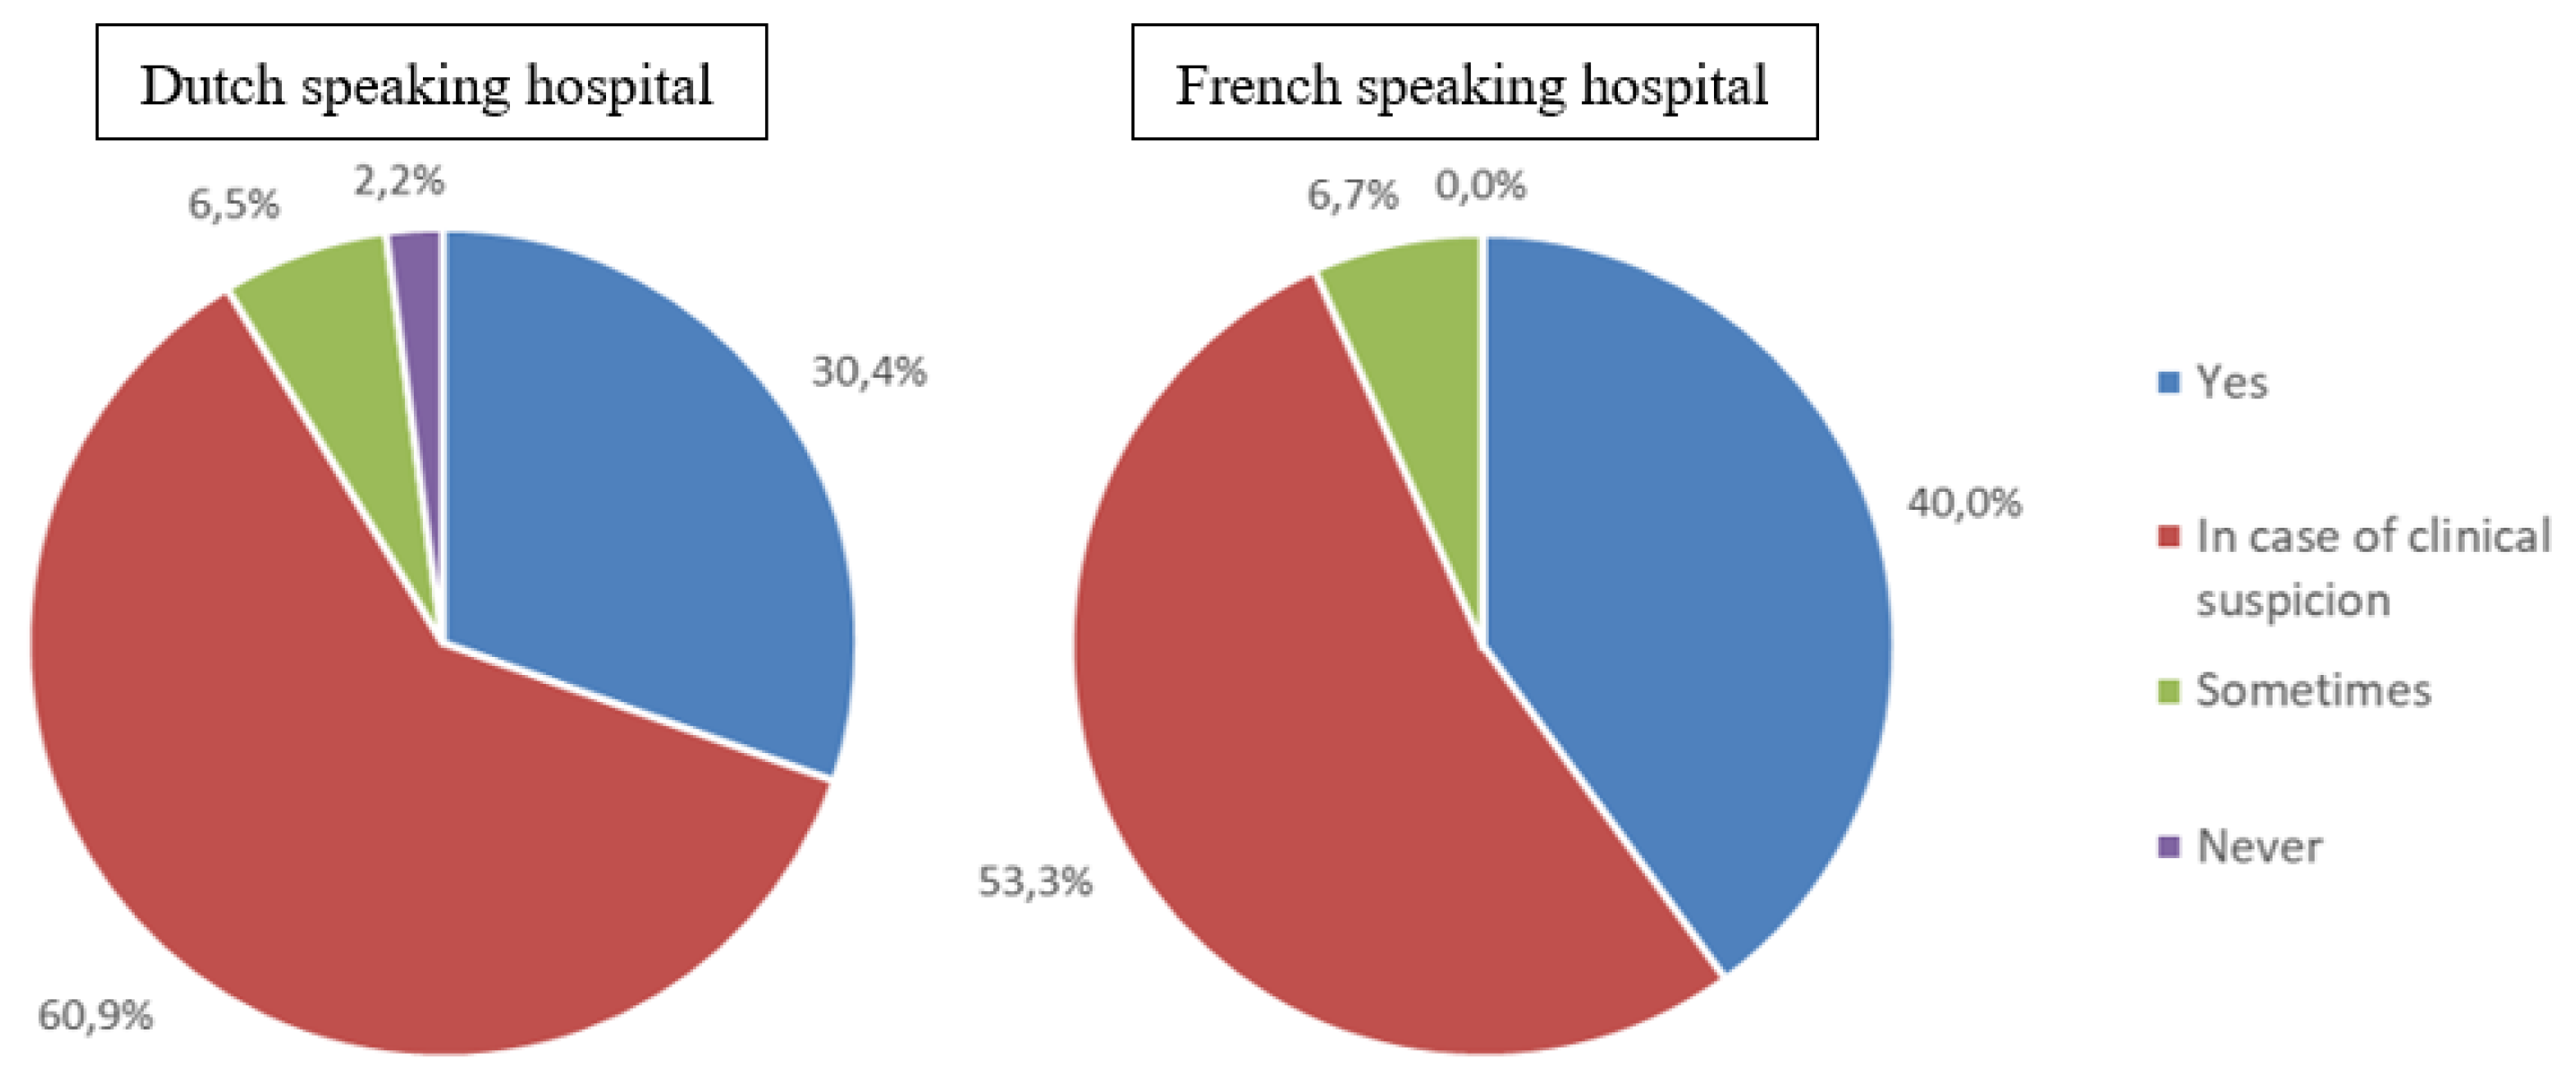
Systematic nutritional screening was conducted in 32.8% of the participating hospitals, with no significant difference between SC and LC, or between FrC and DuC. The majority of hospitals (59.0%) reported to only screen in case of clinical suspicion of malnutrition or feeding difficulties. A small percentage of hospitals screened only occasionally (6.6%), while 2.7% reported never screening (cfr.
Figure 2). The majority (67.2%) did not use any screening tool. When a screening tool was used, STRONG
kids was the most common applied in 29.5% of participating centers. In FrC, a positive screening result most often led to referral to a dietitian (86.7%), whereas in DuC it more frequently resulted in a discussion with the paediatrician about nutritional management (54.3%) or referral to a dietician (34.8%).
3.4. Nutritional Assessment
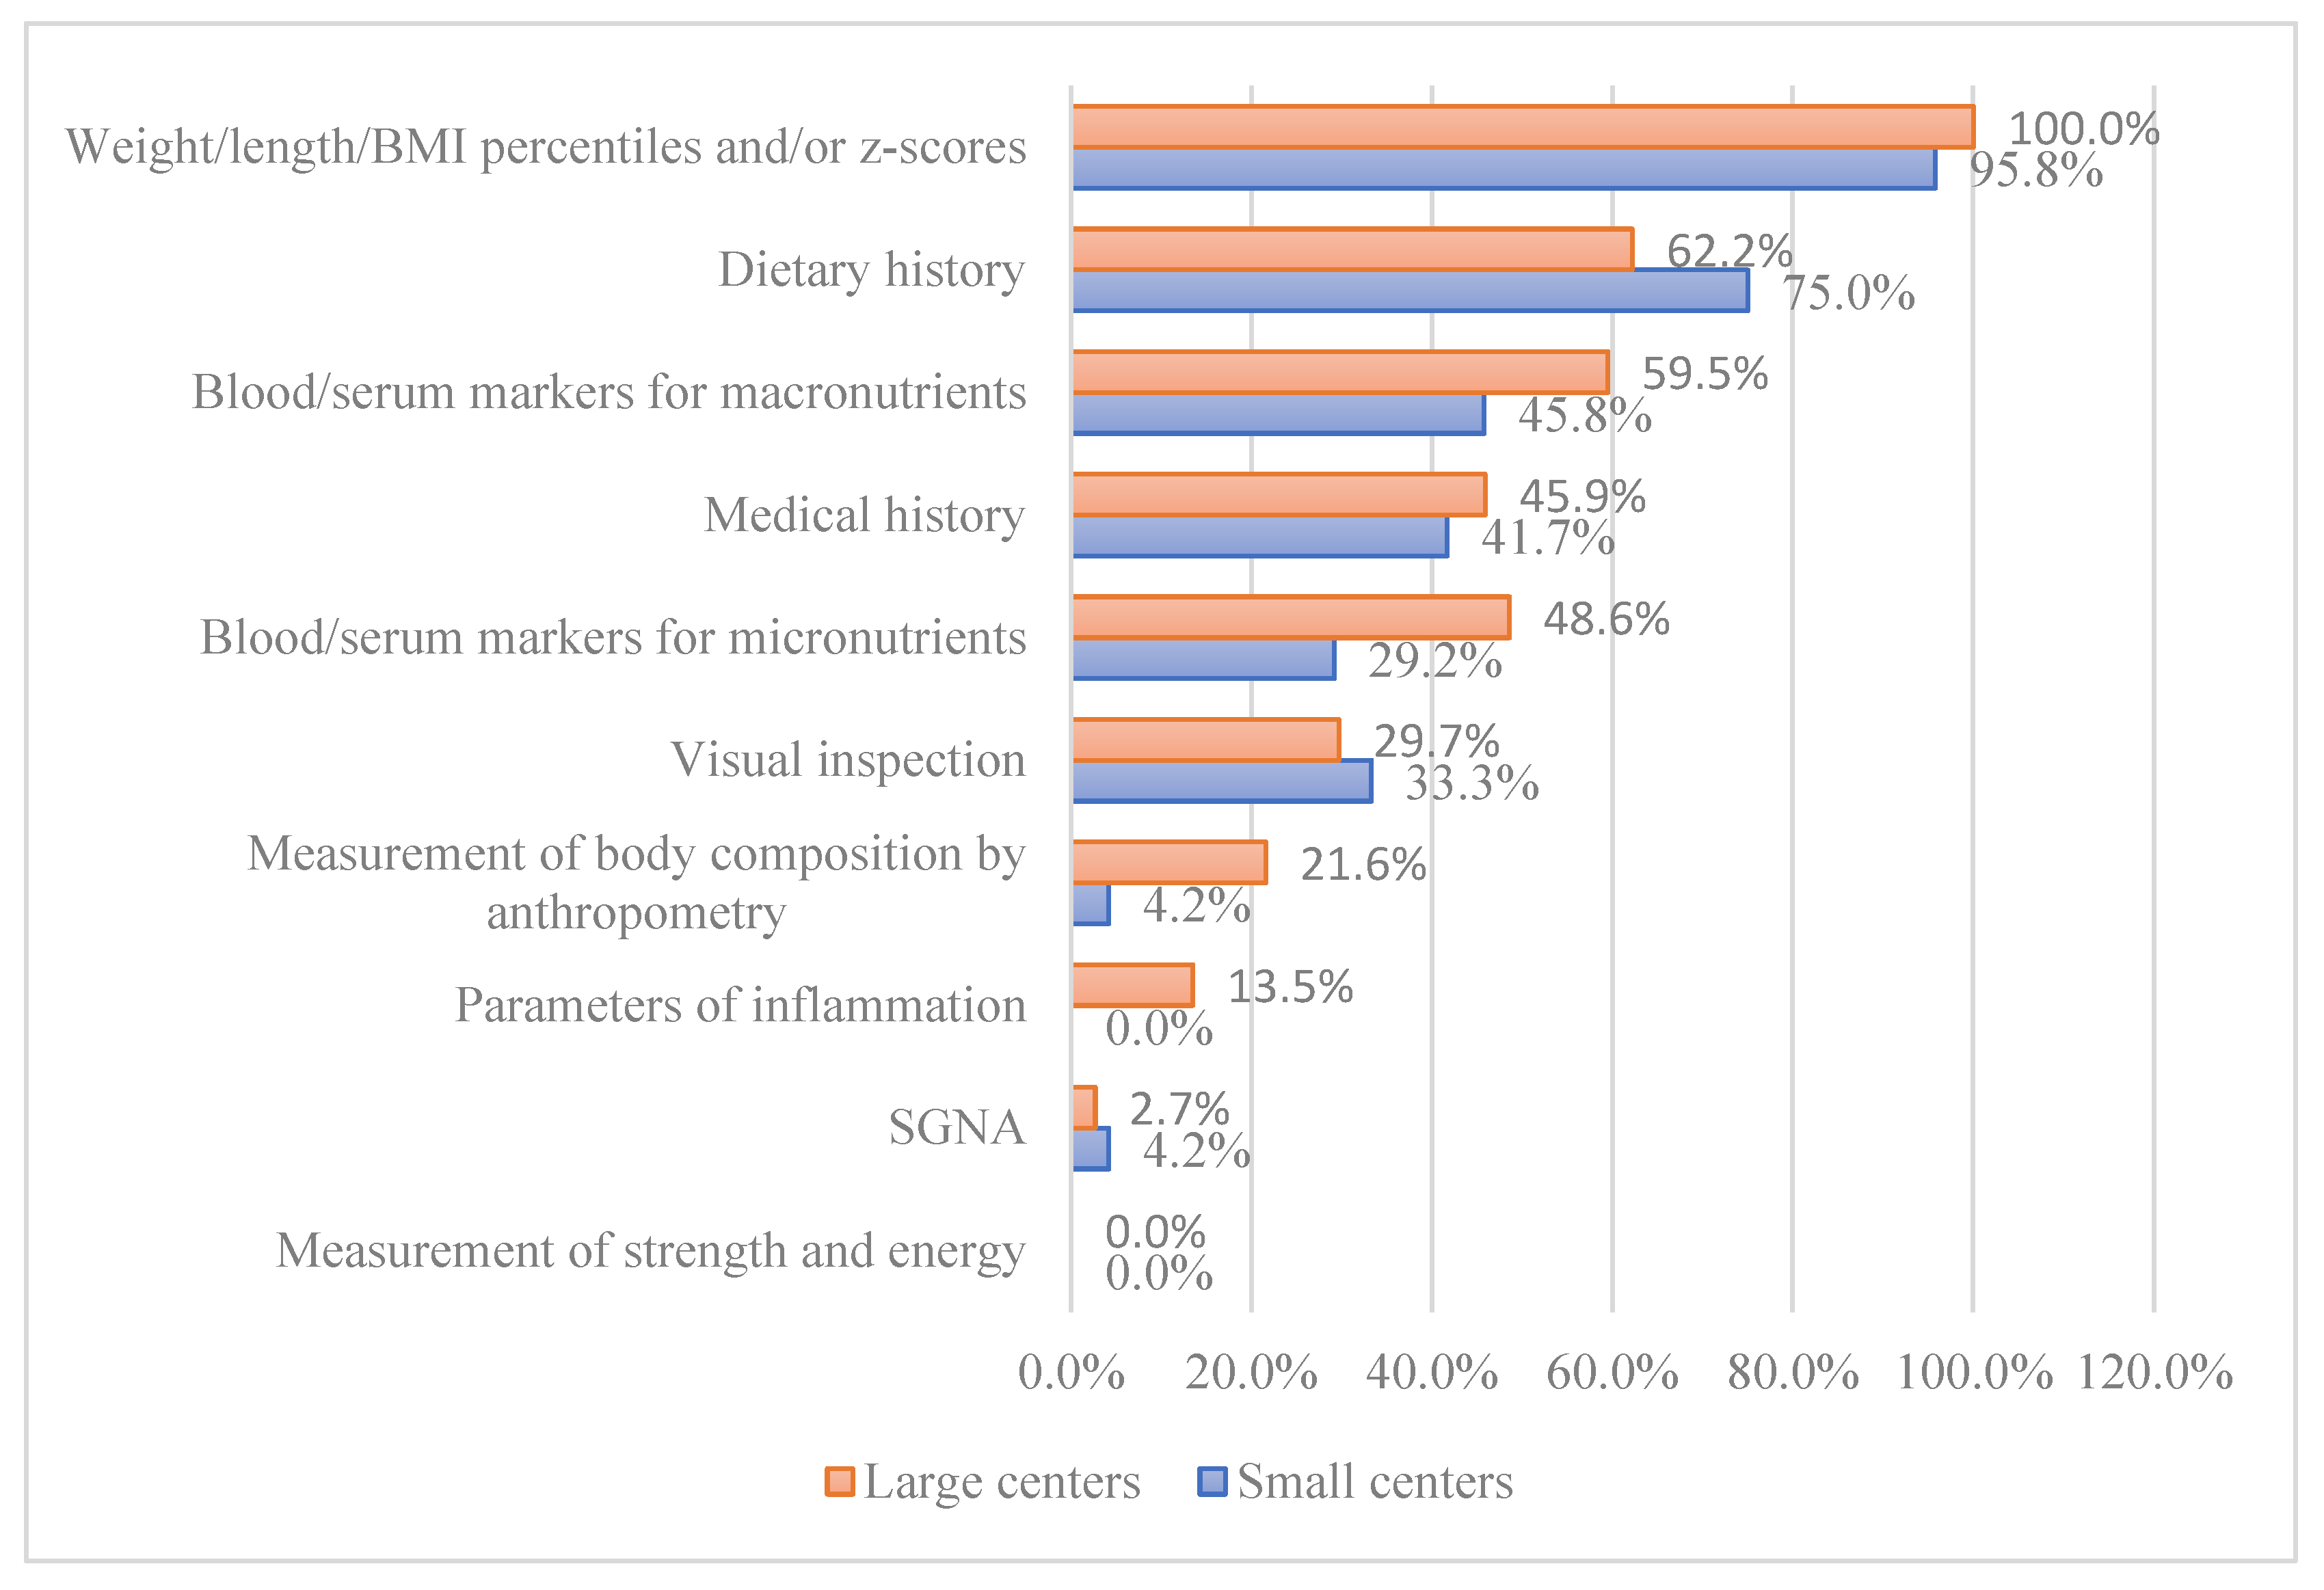
When asked about clinical practices regarding the assessment of malnutrition, 77.0% of respondents reported always using weight and height plotted on a growth curve or calculated as a z-score. Only 26.2% of centers reported to use a protocol for the nutritional assessment, and of these, 14.8% followed the protocol published by the Flemish Paediatric Society (“Vereniging voor Kindergeneeskunde”) (8). When informed about this protocol during the survey, most centers (72.1%) indicated they did not currently use it but expressed interest in implementing it. There was no significant difference between SC and LC.
All participating centers indicated they use age-appropriate weighing scales. For measuring height and length, 86.9% of centers reported using a measuring board for children under 1 meter, 65.6% is using a stadiometer, 9.8% is using a tape measure alongside the child, and only 1.6% is using segmental measurements. No significant difference was found in the methods of measuring children between LC and SC.
For diagnosing malnutrition, 98.4% of centers reported using weight, height, BMI percentiles, and/or z-scores. Notably, half of the participating centers reported using blood or serum markers for assessing macronutrient levels, despite this practice not being supported by current guidelines (6). This practice was significantly more frequent in FrC at 86.7%, compared to 43.5% in DuC (p=0.006). A total of 41.0% of participants reported using blood/serum markers for micronutrients, with no significant difference between DuC and FrC nor between SC and LC. A significant difference was found in the use of anthropometric measurements for body composition between DuC (8.7%) and FrC (33.3%) during nutritional assessments (p = 0.033) (cfr.
Figure 3).
3.5. Management
Only 19.7% of hospitals have a protocol in place for the treatment of malnutrition , with 29.7% of LC and 4.2% of SC having such a protocol (p = 0.049). There was no significant difference in the use of a treatment protocol of malnutrition between DuC and FrC. The majority of respondents (60.7%) reported that their hospitals track the intake of admitted children by estimating how much of each meal was consumed. Only 3.3% count the calories in the food, 4.9% conduct mealtime audits, and 31.1% do not monitor intake routinely. For children at risk of malnutrition, the monitoring of intake is slightly different: half of the participants indicated that they monitor intake by estimating meal consumption, 19.7% counts the calories in the food, 14.8% use mealtime audits, 8.2% employ all three methods, and only 4.9% do not routinely monitor intake for these children (cfr.
Table A1).
3.6. Follow-Up
Only 26.7% of the hospitals indicated that they always provide information on nutritional status and management in the discharge letter. In the majority (52.5%), nutritional status and management are included in the discharge letter only if a nutritional intervention was performed, such as supplementary feeding or the provision of parenteral nutrition. Nutritional follow-up after discharge is most often conducted by a physician, with or without the involvement of a dietician (95.1%), rather than a dietician alone (3.3%). No significant difference was found between SC and LC regarding the follow-up.
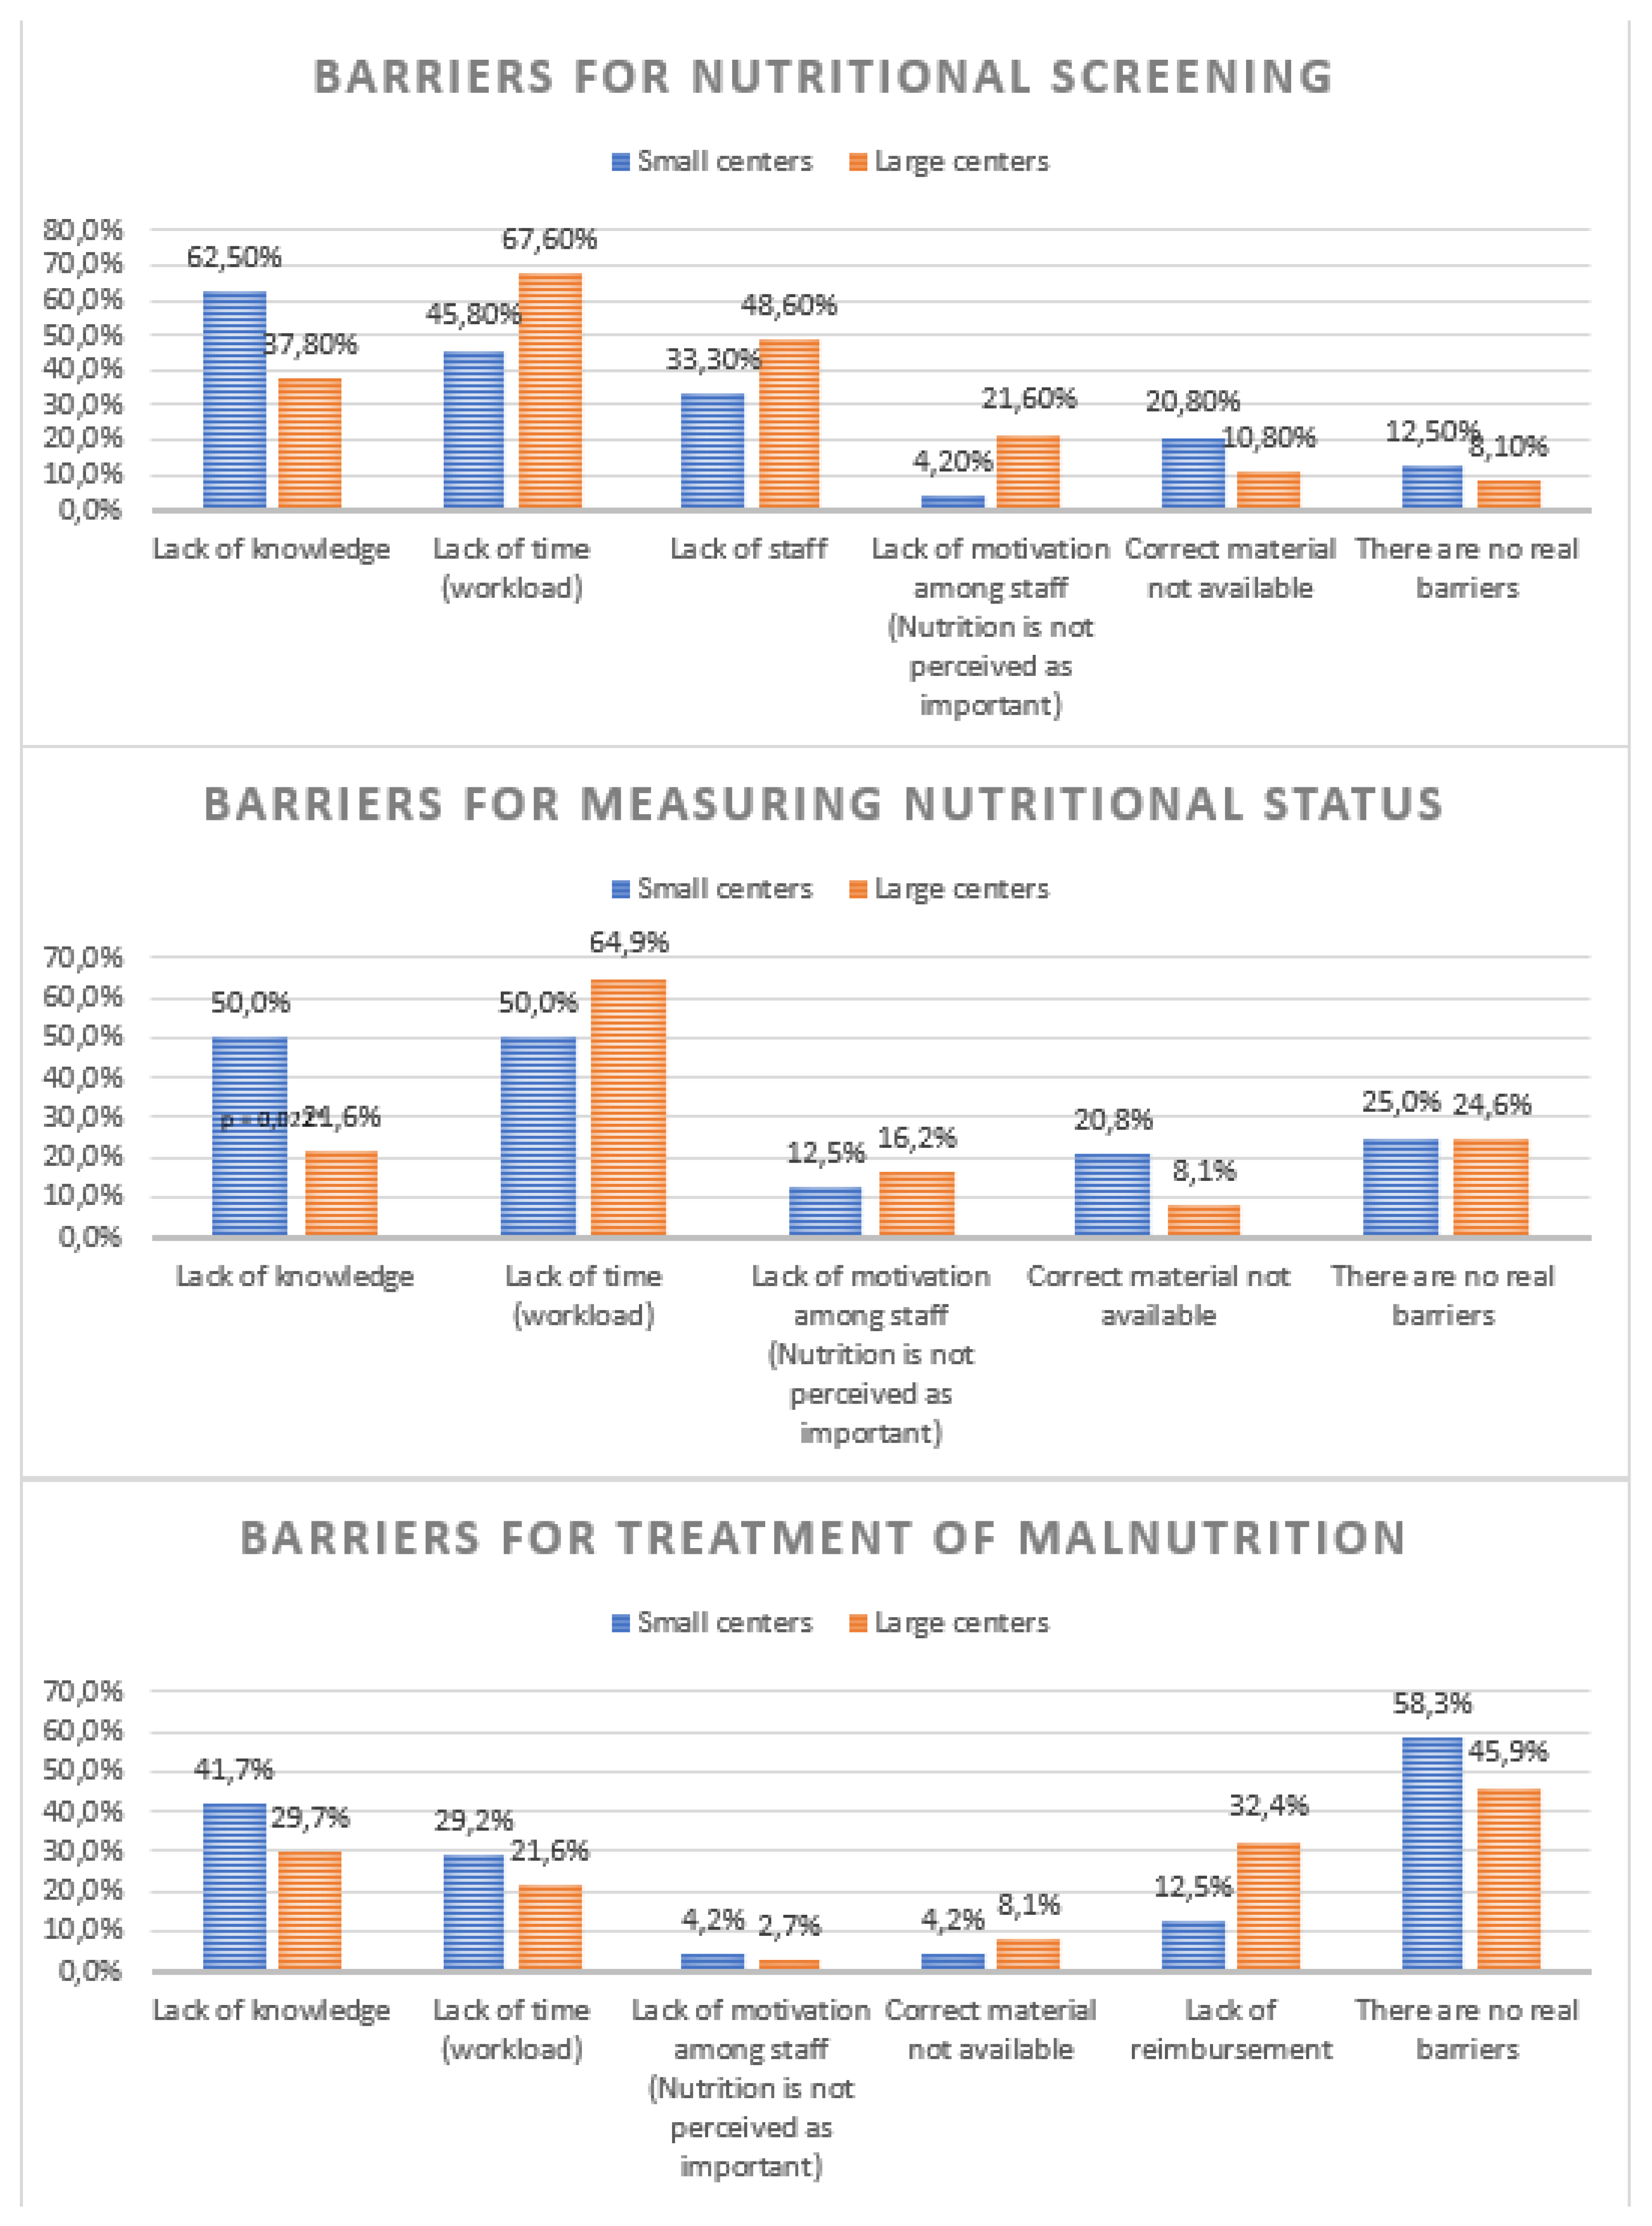
3.7. Barriers
The most common barriers to conducting nutritional screening were lack of time (59.0%), lack of knowledge (47.5%), and lack of staff (42.6%). No significant difference was found between SC and LC regarding barriers for screening. For assessing the nutritional status, the primary barriers were also lack of time (59.0%), lack of knowledge (50.0% in SC, 21.6% in LC; p = 0.022). The most frequent barriers to treating malnutrition included “no barriers” (50.8%), lack of knowledge (34.4%), lack of reimbursement (24.6%) and lack of time (24.6%). No significant difference was found between SC and LC regarding barriers for treatment (cfr.
Figure A1).
3.8. Training
There was a lot of interest in a workshop for optimizing nutritional care (91.8% of participants). A total of 83.6% expressed interest in support for developing and implementing protocol and 82.0% in a clinical training center.
4. Discussion
This nationwide study was conducted to follow up on a similar survey study from 2014 by our group, which examined the clinical practices regarding nutritional screening in Belgian paediatric departments [
7]. As a result of this previous study, it became clear that there was a lack of awareness and knowledge regarding paediatric nutritional care. At that time, no paediatric guidelines for malnutrition screening were available. In 2016, we published an algorithm for screening undernutrition in hospitalized children, in direct response to the 2014 survey [
8]. We aimed to see if practices had changed since that initial study.
In 2014, nutritional screening was not systematically used in paediatric departments in Belgium, with fewer than 1 in 4 DuC screening systematically. Today, systematic nutritional screening has slightly improved in DuC, where 1 in 3 centers now screens regularly. However, FrC appear to have reduced their screening practices, with 4 out of 10 departments currently screening systematically compared to 6 out of 10 in 2014. A possible explanation for this shift is the evolving understanding of “screening”. There is greater awareness today about the use of screening tools, and what was considered screening in 2014 (measuring a child’s nutritional status) may now be understood as using specific screening tools. This is supported by the increased use of screening tools; in 2014, 21% of department heads reported using the STRONGkids screening tool, compared to 30% in 2021.
We also noticed an improvement in the availability of dieticians in paediatric departments. Currently, a dietitian is present in 80% of responding departments, compared to just 47% in 2014. However, there is room for improvement, as ideally, all paediatric departments should have a dietitian, and their involvement in patient management should increase (e.g., participation in ward rounds and discussions with physicians). The importance of this is supported by a recent study conducted by Belanger et demonstrating the impact of nutritional counseling by dieticians on the evolution of body weight during hospitalization [
9]. Recent studies demonstrated that 16-21% of hospitalized children lose weight during their hospital admission [
10,
11].
Awareness of malnutrition has also increased since 2014. At that time, only 2.8% of respondents reported admitting a malnourished child at least once per week, compared to 11.5% in 2021. This number aligns more closely with the reported prevalence in the Belgian population [
12]. Although, in the literature worldwide, the prevalence is highly variable, ranging between 2% and 50%, depending on assessment methods, malnutrition definitions and the study population (could be disease specific or geographically specific) [
1,
13,
14,
15,
16,
17,
18,
19,
20,
21].
Despite improvements in clinical practice, some barriers remain unchanged since 2014. Lack of knowledge continues to be a major barrier to screening, assessment, and treatment of malnutrition. These barriers seem to be universal as similar barriers have been reported in Canada [
22]. However, the participating centers are eager to improve, as evidenced by their interest in workshops and support for developing and implementing a protocol. More than 70% of centers expressed interest in adopting the protocol approved by the Flemish Pediatric Society (VVK), and nearly 15% are already using it. Organizing workshops and providing support for protocol implementation could help address these barriers.
Other barriers include a lack of staff and time. To overcome these, screening should be made as simple, automatic, and time efficient as possible. The STRONGkids tool, recommended in the screening algorithm, is convenient because it does not require anthropometric measurements [
8,
23]. However, it is important to recognize that implementing a screening tool does not necessarily improve staff awareness or patient outcomes, as shown in a study by Marderfeld [
24]. It cannot replace good training of the staff to increase awareness of the importance of screening, assessment and treatment of malnutrition. The use of multidisciplinary unit-based champion teams has shown to lead to an increase in identification of patients at nutritional risk in the USA and a training program by a nutrition support team in France led to an improvement of overall nutritional knowledge amongst staff members and an improvement in the frequency of obtaining anthropometric measurements [
25,
26].
Lack of reimbursement of the supplementary feeding is considered an important barrier for the treatment of malnutrition. This issue should be addressed with the Belgian government. When comparing the 2014 and 2021 studies, it is important to note that tertiary-level hospitals were not included in 2014. Otherwise, the study populations are similar, although there is a slight overrepresentation of Dutch-speaking respondents in the current study. When considering the number of paediatric beds, French-speaking hospitals are well represented. A limitation of this study is that many respondents completed the questionnaire on paper, which led to some skipped questions and multiple answers being provided for certain questions.
5. Conclusions
Our research demonstrates improved nutritional awareness in Belgian paediatric departments, as well as increased paramedic resources and more systematic screening practices. However, barriers to nutritional screening, assessment and treatment remain unchanged since 2014. Despite this, staff in Belgian pediatric departments are motivated to make positive changes.
Therefore, it is time to address these barriers and develop practical solutions. One approach could be to help paediatric centers implement a simple, time-efficient algorithm for screening, assessing, and treating malnutrition. Organizing workshops to improve staff knowledge and supporting the implementation of protocols could also be beneficial.
Supplementary Materials
The following supporting information can be downloaded at the website of this paper posted on Preprints.org. Figure S1: The English version of the questionnaire.
Author Contributions
K.H. and M.D. conducted data collection, data curation and data analysis. M.D. wrote the manuscript. Y.V., M.R., B.H. and E.D.G. performed review. K.H. performed editing of the manuscript and was responsible for the final content. All authors have read and agreed to the published version of the manuscript.
Funding
This research received no external funding.
Institutional Review Board Statement
The study was conducted in accordance with the Declaration of Helsinki, and approved by the Ethics Committee of UZ Brussel (protocol code 1432020000314, approved on December 12, 2020).
Informed Consent Statement
Informed consent was obtained from all subjects involved in the study.
Data Availability Statement
For access to the information/database presented in this research, please contact the corresponding author.
Acknowledgments
The authors thank the participating paediatric centers for completing the survey.
Conflicts of Interest
The authors declare no conflicts of interest.
Appendix A
Table A1.
Treatment of malnutrion.
Table A1.
Treatment of malnutrion.
| |
Total
(N = 61)
N (%) |
SC
(N = 24)
N (%) |
LC
(N = 37)
N (%) |
P-value* |
Protocol treatment malnutrition
- Yes
- No, but it is under development
- No |
12 (19.7%)
11 (18.0%)
38 (62.3%) |
1 (4.2%)
5 (20.8%)
18 (75.0%) |
11 (29.7%)
6 (16.2%)
20 (54.1%) |
0.049 |
Monitoring intake admitted children
- Yes, through tracking/counting of calories in the food
- Yes, by estimating how much of the meal was eaten
- Yes, via mealtime audits
- No, intake is not routinely monitored for all children |
2 (3.3%)
37 (60.7%)
3 (4.9%)
19 (31.1%) |
0 (0.0%)
15 (62.5%)
2 (8.3%)
7 (29.2%) |
2 (5.4%)
22 (59.5%)
1 (2.7%)
12 (32.4%) |
0.511 |
Monitoring intake children at risk for malnutrition
- Yes, through tracking/counting of calories in the food
- Yes, by estimating how much of the meal was eaten
- Yes, via mealtime audits
- Yes, via the 3 methods above
- No, intake is not routinely monitored for all children |
12 (19.7%)
32 (52.5%)
9 (14.8%)
5 (8.2%)
3 (4.9%) |
3 (12.5%)
11 (45.8%)
6 (25.0%)
1 (4.2%)
3 (12.5%) |
9 (24.3%)
21 (56.8%)
3 (8.1%)
4 (10.8%)
0 (0.0%) |
0.054 |
Appendix B
Figure A1.
Barriers for the nutritional screening, measuring nutritional status and treatment of malnutrition. *Difference between small (<20 beds) and large (≥20 beds) paediatric departments.
Figure A1.
Barriers for the nutritional screening, measuring nutritional status and treatment of malnutrition. *Difference between small (<20 beds) and large (≥20 beds) paediatric departments.
References
- Hecht, C.; Weber, M.; Grote, V.; Daskalou, E.; Dell’Era, L.; Flynn, D.; Gerasimidis, K.; Gottrand, F.; Hartman, C.; Hulst, J.; et al. Disease associated malnutrition correlates with length of hospital stay in children. Clin Nutr 2015, 34, 53–59. [Google Scholar] [CrossRef] [PubMed]
- Niseteo, T.; Hojsak, I.; Kolaček, S. Malnourished children acquire nosocomial infections more often and have significantly increased length of hospital stay. Clin Nutr 2020, 39, 1560–1563. [Google Scholar] [CrossRef] [PubMed]
- Pérez Moreno, J.; de la Mata Navazo, S.; López-Herce Arteta, E.; Tolín Hernani, M.; González Martínez, F.; González Sánchez, M. I.; Rodríguez Fernández, R. [Influence of nutritional status on clinical outcomes in hospitalised children]. An Pediatr (Engl Ed) 2019, 91, 328–335. [Google Scholar] [CrossRef]
- Gambra-Arzoz, M.; Alonso-Cadenas, J. A.; Jiménez-Legido, M.; López-Giménez, M. R.; Martín-Rivada, Á.; de Los Ángeles Martínez-Ibeas, M.; Cañedo-Villarroya, E.; Pedrón-Giner, C. Nutrition Risk in Hospitalized Pediatric Patients: Higher Complication Rate and Higher Costs Related to Malnutrition. Nutr Clin Pract 2020, 35, 157–163. [Google Scholar] [CrossRef]
- Freijer, K.; van Puffelen, E.; Joosten, K. F.; Hulst, J. M.; Koopmanschap, M. A. The costs of disease related malnutrition in hospitalized children. Clin Nutr ESPEN 2018, 23, 228–233. [Google Scholar] [CrossRef]
- Hulst, J. M.; Huysentruyt, K.; Gerasimidis, K.; Shamir, R.; Koletzko, B.; Chourdakis, M.; Fewtrell, M.; Joosten, K. F. A Practical Approach to Identifying Pediatric Disease-Associated Undernutrition: A Position Statement from the ESPGHAN Special Interest Group on Clinical Malnutrition. J Pediatr Gastroenterol Nutr 2022, 74, 693–705. [Google Scholar] [CrossRef]
- Huysentruyt, K.; Goyens, P.; Alliet, P.; Bontems, P.; Van Hautem, H.; Philippet, P.; Vandenplas, Y.; De Schepper, J. More training and awareness are needed to improve the recognition of undernutrition in hospitalised children. Acta Paediatr 2015, 104, 801–807. [Google Scholar] [CrossRef]
- Huysentruyt, K.; De Schepper, J.; Bontems, P.; Alliet, P.; Peeters, E.; Roelants, M.; Van Biervliet, S.; Hauser, B.; Vandenplas, Y. Proposal for An Algorithm for Screening for Undernutrition in Hospitalized Children. J Pediatr Gastroenterol Nutr 2016, 63, e86–e91. [Google Scholar] [CrossRef]
- Bélanger, V.; Delorme, J.; Napartuk, M.; Bouchard, I.; Meloche, C.; Curnier, D.; Sultan, S.; Laverdière, C.; Sinnett, D.; Marcil, V. Early Nutritional Intervention to Promote Healthy Eating Habits in Pediatric Oncology: A Feasibility Study. Nutrients 2022, 14. [Google Scholar] [CrossRef]
- Vieira Gonçalves, L.; Oliveira, A. G.; Barracosa, M.; Antunes, J.; Pimenta, J. Nutritional Risk and Malnutrition in Paediatrics: From Anthropometric Assessment to Strongkids® Screening Tool. Acta Med Port 2023, 36, 309–316. [Google Scholar] [CrossRef]
- Omar, O. M.; Tayel, D. I.; Saleh, R. M.; Ramadan, M. A. The malnutrition screening tool STRONGKIDS performed better than other screening tools for children hospitalised in Egypt. Acta Paediatr 2024, 113, 1006–1012. [Google Scholar] [CrossRef] [PubMed]
- Huysentruyt, K.; Alliet, P.; Muyshont, L.; Devreker, T.; Bontems, P.; Vandenplas, Y. Hospital-related undernutrition in children: still an often unrecognized and undertreated problem. Acta Paediatr 2013, 102, e460–466. [Google Scholar] [CrossRef] [PubMed]
- Werner, D.; Zimmer, K. P.; Eckert, G. P.; Laffolie, J. Malnutrition in Paediatrics: Stationary Screening & Follow-up. Klin Padiatr 2020, 232, 20–28. [Google Scholar] [CrossRef] [PubMed]
- Diamanti, A.; Cereda, E.; Capriati, T.; Giorgio, D.; Brusco, C.; Liguori, A.; Raponi, M. Prevalence and outcome of malnutrition in pediatric patients with chronic diseases: Focus on the settings of care. Clin Nutr 2019, 38, 1877–1882. [Google Scholar] [CrossRef]
- De Longueville, C.; Robert, M.; Debande, M.; Podlubnai, S.; Defourny, S.; Namane, S. A.; Pace, A.; Brans, C.; Cayrol, E.; Goyens, P.; De Laet, C. Evaluation of nutritional care of hospitalized children in a tertiary pediatric hospital. Clin Nutr ESPEN 2018, 25, 157–162. [Google Scholar] [CrossRef]
- Kang, M. C.; Kim, J. H.; Ryu, S. W.; Moon, J. Y.; Park, J. H.; Park, J. K.; Baik, H. W.; Seo, J. M.; Son, M. W.; Song, G. A.; et al. Prevalence of Malnutrition in Hospitalized Patients: a Multicenter Cross-sectional Study. J Korean Med Sci 2018, 33, e10. [Google Scholar] [CrossRef]
- Maegawa, Y.; Konishi, Y.; Kubota, M.; Kawate, Y.; Wakazono, Y.; Umeda, K.; Kawaguchi, C. Prevalence of undernutrition in Japanese pediatric patients on admission: Comparison of tertiary, acute-care, and rehabilitation hospitals. Asia Pac J Clin Nutr 2018, 27, 980–985. [Google Scholar] [CrossRef]
- Tuokkola, J.; Heikkilä, A.; Junttila, K.; Orell, H. Prevalence of malnutrition risk and acute malnutrition in pediatric population in a tertiary hospital and their burden on healthcare. Nutr Clin Pract 2021, 36, 1270–1275. [Google Scholar] [CrossRef]
- Price, A. A.; Williams, J. A.; Estes Doetsch, H.; Spees, C. K.; Taylor, C. A. Utilization of Current Diagnostic Indicators to Characterize Pediatric Undernutrition among US Children. Nutrients 2020, 12. [Google Scholar] [CrossRef]
- Beser, O. F.; Cokugras, F. C.; Erkan, T.; Kutlu, T.; Yagci, R. V. Evaluation of malnutrition development risk in hospitalized children. Nutrition 2018, 48, 40–47. [Google Scholar] [CrossRef]
- Joosten, K. F.; Hulst, J. M. Prevalence of malnutrition in pediatric hospital patients. Curr Opin Pediatr 2008, 20, 590–596. [Google Scholar] [CrossRef] [PubMed]
- Huysentruyt, K.; Brunet-Wood, K.; Bandsma, R.; Gramlich, L.; Fleming-Carroll, B.; Hotson, B.; Byers, R.; Lovelace, H.; Persad, R.; Kalnins, D.; et al. Canadian Nationwide Survey on Pediatric Malnutrition Management in Tertiary Hospitals. Nutrients 2021, 13. [Google Scholar] [CrossRef] [PubMed]
- Aponte Borda, A. D.; Pinzón Espitia, O. L.; Aguilera Otalvaro, P. A. [Nutritional screening in hospitalized pediatric patients: systematic review]. Nutr Hosp 2018, 35, 1221–1228. [Google Scholar] [CrossRef] [PubMed]
- Marderfeld, L.; Rub, G.; Hodik, G.; Poraz, I.; Hartman, C.; Ashkenazi, S.; Shamir, R. Validation and impact of paediatric malnutrition screening tool in hospitalised children on awareness of medical staff and health-related outcomes. Nutr Diet 2019, 76, 574–579. [Google Scholar] [CrossRef] [PubMed]
- Persaud, S.; Hron, B. M.; Rudie, C.; Mantell, P.; Kahlon, P. S.; Ariagno, K.; Ozonoff, A.; Trivedi, S.; Yugar, C.; Mehta, N. M.; et al. Improving anthropometric measurements in hospitalized children: A quality-improvement project. Nutr Clin Pract 2024, 39, 685–695. [Google Scholar] [CrossRef]
- Valla, F. V.; Ford-Chessel, C.; Meyer, R.; Berthiller, J.; Dupenloup, C.; Follin-Arbelet, N.; Hubert, A.; Javouhey, E.; Peretti, N. A training program for anthropometric measurements by a dedicated nutrition support team improves nutritional status assessment of the critically ill child. Pediatr Crit Care Med 2015, 16, e82–88. [Google Scholar] [CrossRef]
|
Disclaimer/Publisher’s Note: The statements, opinions and data contained in all publications are solely those of the individual author(s) and contributor(s) and not of MDPI and/or the editor(s). MDPI and/or the editor(s) disclaim responsibility for any injury to people or property resulting from any ideas, methods, instructions or products referred to in the content. |
© 2025 by the authors. Licensee MDPI, Basel, Switzerland. This article is an open access article distributed under the terms and conditions of the Creative Commons Attribution (CC BY) license (http://creativecommons.org/licenses/by/4.0/).