Submitted:
13 January 2025
Posted:
14 January 2025
Read the latest preprint version here
Abstract
The financial market has been at the forefront of machine learning applications since the 1980s, yet accurate stock price prediction remains a significant challenge due to market complexity and inherent volatility. This paper presents a comprehensive approach to stock market prediction through the integration of Linear Regression (LR), Long Short-Term Memory (LSTM), and Autoregressive Integrated Moving Average (ARIMA) methods. We evaluate these approaches using historical data from five major stocks across different market sectors, demonstrating that traditional time series analysis methods can achieve comparable or superior performance to complex deep learning approaches when properly optimized. To validate our findings, we implement an integrated prediction and trading support system that provides automated data processing and real-time updates, enabling effective decision-making in dynamic market conditions. Our results suggest that the combination of multiple prediction approaches, coupled with automated trading support, can significantly enhance investment decision-making capabilities.
Keywords:
stock price prediction
; machine learning
; LSTM
; ARIMA
; Linear Regression
; trading system
1. Introduction
The rapid advancement of information technology and the increasing complexity of financial markets have fundamentally transformed stock trading practices. Traditional stock trading methods, which rely heavily on manual analysis and operations, have become insufficient in handling the massive volume of data generated by modern financial markets. This limitation is particularly evident in markets such as the A-share market, which encompasses between 2,000 to 4,000 stocks with historical trading data spanning half a century.
The emergence of big data analytics and machine learning technologies presents unprecedented opportunities for enhancing stock trading strategies. These advanced computational methods offer the capability to process and analyze vast amounts of historical data, identify complex patterns, and generate predictive insights that would be impossible to achieve through traditional analysis methods.
This research focuses on developing and evaluating a comprehensive stock prediction and trading system that leverages three distinct machine learning approaches: Linear Regression (LR), Long Short-Term Memory (LSTM), and Autoregressive Integrated Moving Average (ARIMA). Our work is motivated by several key objectives:
Development of Robust Prediction Models
We aim to create reliable stock price prediction models that can effectively process historical market data and generate accurate short-term price forecasts. This involves the implementation and optimization of multiple machine learning algorithms, each chosen for their specific strengths in handling time-series data.
Comparative Analysis of Methods
Through rigorous experimentation and analysis, we evaluate the performance of different prediction methods across various stocks and market conditions. This comparison provides valuable insights into the strengths and limitations of each approach.
Practical System Implementation
Beyond theoretical models, we develop a complete web-based trading system that integrates these prediction models into a user-friendly platform. This system provides real-time predictions, visualizations, and trading recommendations, bridging the gap between advanced analytics and practical application.
Trading Strategy Optimization
Based on the predictions generated by our models, we design and implement trading algorithms aimed at maximizing profitability through timely buy and sell decisions.
Our research contributes to both the theoretical understanding of stock price prediction methods and their practical application in real-world trading scenarios. The system we develop demonstrates the feasibility of utilizing machine learning approaches for financial decision-making, while our comparative analysis provides insights into the relative effectiveness of different prediction methods.
2. Related Work
Recent advances in machine learning have led to significant developments in stock price prediction methodologies. This section presents both the theoretical foundations and a comprehensive review of relevant research across the three main approaches employed in our study: LSTM networks, ARIMA models, and Linear Regression methods.
2.1. Deep Learning Approaches with LSTM
The foundation of modern deep learning approaches to financial forecasting lies in Recurrent Neural Networks (RNN) and their advanced variants, as shown in Figure 1. RNNs introduce the concept of memory in neural networks through self-looping mechanisms, allowing information persistence across sequential data processing.
However, traditional RNNs face challenges in maintaining long-term dependencies, leading to the development of Long Short-Term Memory (LSTM) networks. LSTM networks enhance the basic RNN architecture through specialized memory cells containing input, forget, and output gates. Each LSTM unit processes information through these gates, enabling selective information retention and update. We can use a chain to represent the structure of LSTM. Inside each node of this chain, there exists four neural network layers.
The memory cell maintains state information over arbitrary time intervals, while the gates control information flow:
where represents the forget gate, the input gate, and the cell state at time t.
Recent applications of LSTM in stock prediction have demonstrated remarkable success. Di Persio and Honchar (2017) demonstrated LSTM’s superior performance compared to traditional Recurrent Neural Networks (RNN) and Gated Recurrent Units (GRU) in predicting Google stock prices using five-day period data. Their work established LSTM as a particularly effective method for short-term price predictions.
Further validation of LSTM’s effectiveness comes from Roondiwala’s implementation for Nifty price prediction, achieving a remarkably low RMSE of 0.00859. Hossain’s research advanced this further by developing a hybrid model combining LSTM and GRU, analyzing data from 1950 to 2016 and achieving an MSE of just 0.00098.
2.2. Time Series Analysis with ARIMA
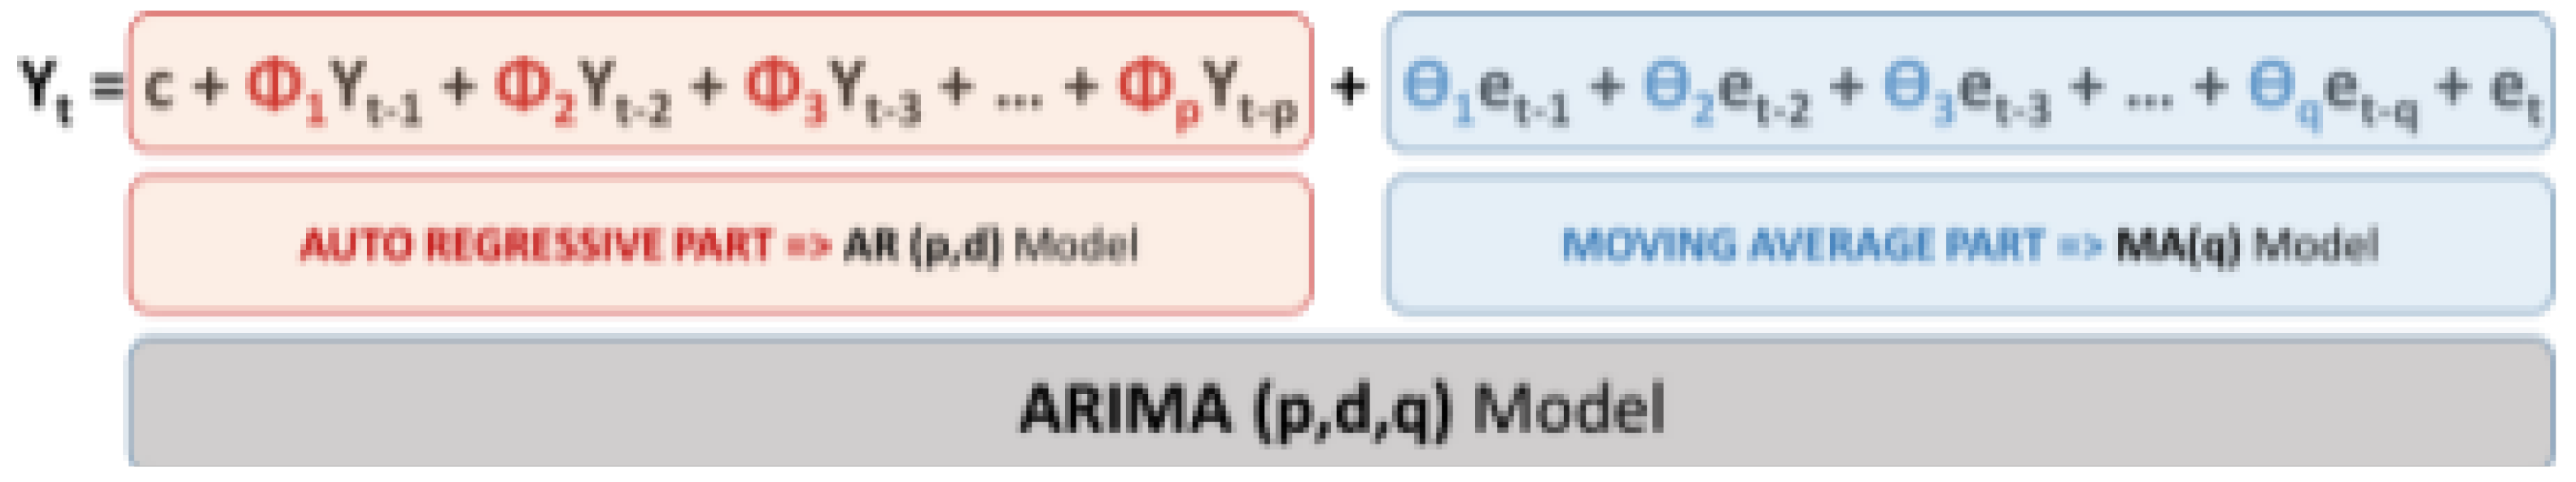
ARIMA models combine three key components - Autoregression (AR), Integration (I), and Moving Average (MA) - to capture different aspects of time series behavior. The AR component models the relationship between current values and their lagged observations, while the MA component incorporates the dependency between observations and residual errors. The Integration component addresses non-stationarity through differencing operations. Figure 3 below shows the brief process of ARIMA model.
Figure 2.
ARIMA Model
ARIMA models have maintained their relevance in stock price prediction despite the emergence of newer methods. Devi’s research with Indian company data demonstrated ARIMA’s effectiveness in addressing dimensional and expectation value challenges, particularly when combined with AICBIC testing for accuracy prediction. Ariyo’s 2014 study provided a systematic approach to ARIMA model selection, utilizing metrics such as Standard Error of Regression (SER), Adjusted R-square values, Bayesian Information Criteria. Wang’s Proposed Hybrid Model (PHM) combined ARIMA with ESM and BPNN, analyzing weekly data to demonstrate superior performance over single-model approaches. Similarly, Rather’s research integrated ARIMA with ESN and RNN, achieving improved performance in both linear and non-linear prediction scenarios.
2.3. Linear Regression Approaches and Variants
Linear Regression approaches in stock prediction assume linear relationships between input features and future prices. The basic model takes the form:
where represents regression coefficients and the error term.
The input X can have more than one dimension and thus the corresponding linear equation could have more coefficients, also, an interception needs to be added into the equation. Thus, the equation can be represented using the format below:
The fundamental concept remains establishing linear relationships between input features and target prices, but the implementation varies significantly across different methods. Figure 3 shows the sample of single LR.
Figure 3.
Caption
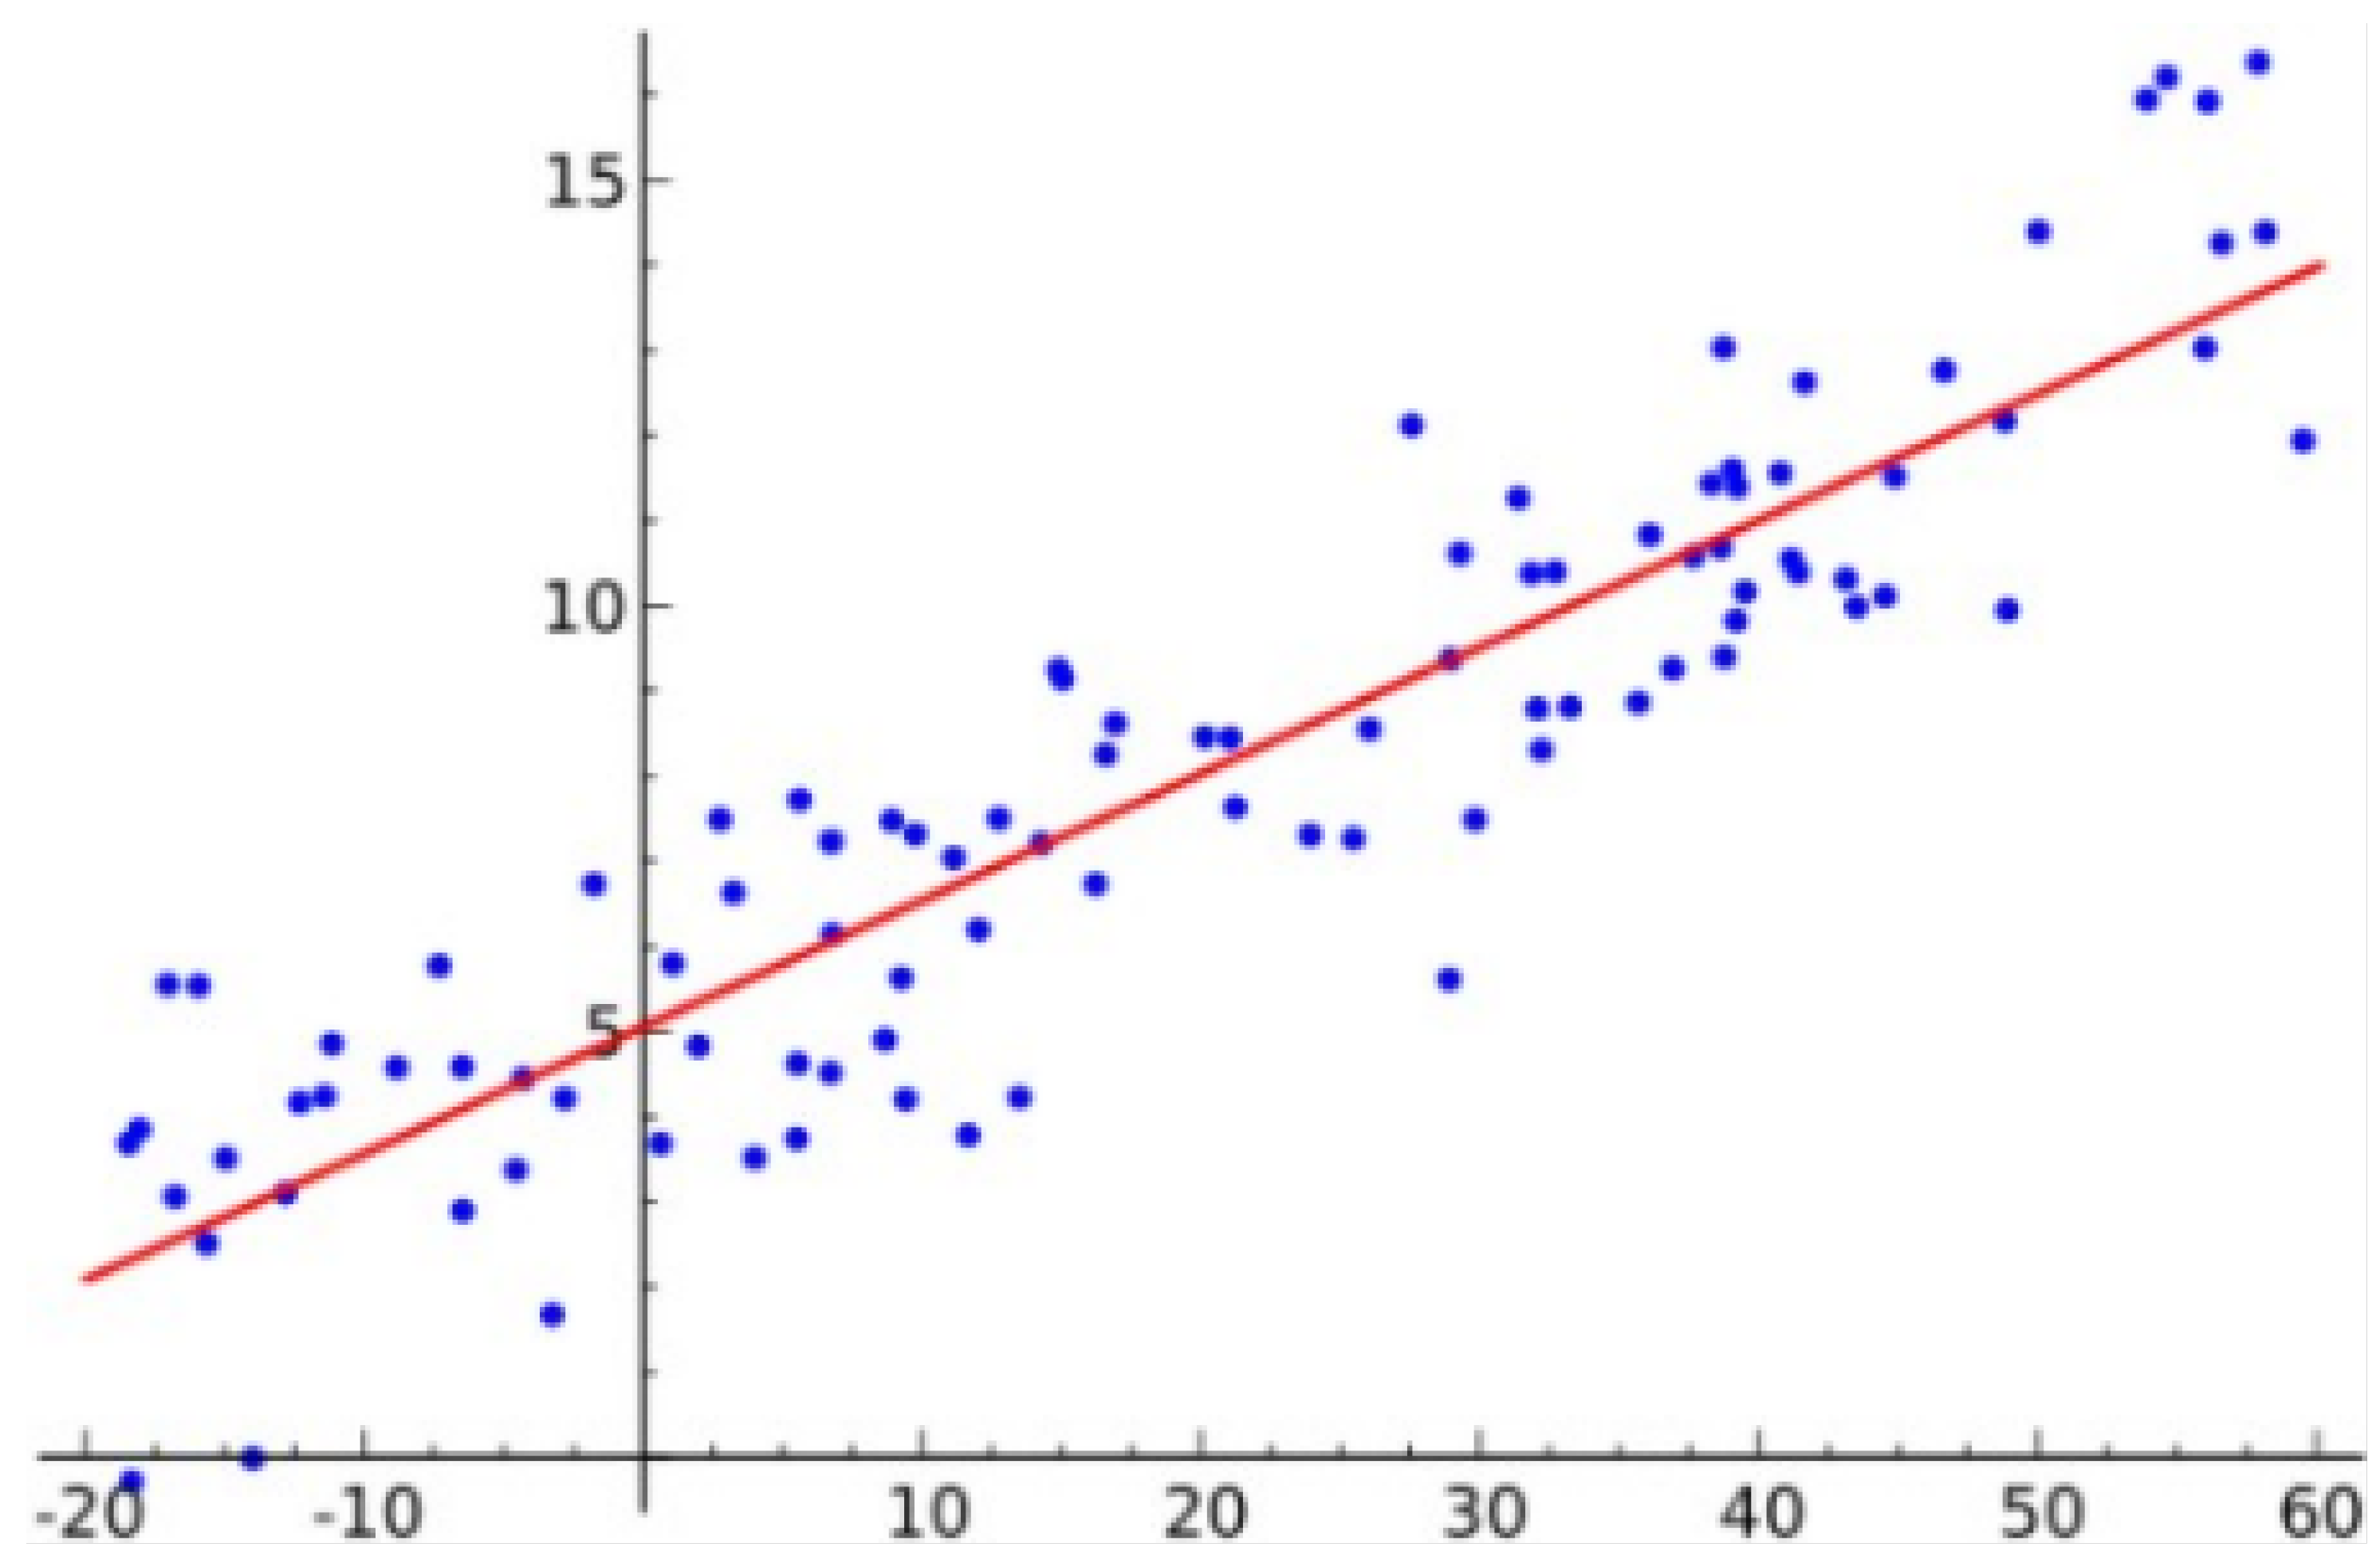
Simple Linear Regression represents the most basic approach, handling one-dimensional input data. As illustrated in Figure 6, this method establishes direct linear relationships between single input features and target values. While conceptually straightforward, this approach demands substantial computational resources and proves limited in handling the multidimensional nature of stock market data.
The least squares method extends Linear Regression to handle multidimensional inputs, making it particularly relevant for stock prediction where multiple features influence price movements. This approach minimizes the sum of squared residuals, effectively fitting a regression hyperplane across multiple dimensions. The method’s matrix-based computation enables efficient handling of high-dimensional feature spaces, crucial for processing comprehensive market data.
Gradient descent offers an iterative optimization approach to Linear Regression, particularly valuable for large-scale stock prediction tasks. This method iteratively refines coefficient values by following the gradient of the error surface. The introduction of a learning rate parameter provides crucial control over convergence behavior, allowing fine-tuned optimization based on specific market characteristics.
Advanced regularization techniques, particularly Lasso and Ridge Regression, further enhance Linear Regression’s applicability to stock prediction. These methods not only minimize prediction error but also address model complexity through parameter regularization. This dual optimization proves especially valuable in financial forecasting, where model simplicity often correlates with improved generalization performance.
Recent work by Bhuriya demonstrated Linear Regression’s competitive performance in stock prediction, achieving accuracy rates of approximately 0.97 through careful method selection and parameter optimization. These findings highlight the continued relevance of Linear Regression approaches in financial forecasting, particularly when enhanced by appropriate variant selection and optimization strategies.
2.4. Hybrid and Comparative Approaches
Recent research has increasingly focused on combining multiple prediction methods to leverage their respective strengths. Key findings from comparative studies include:
LSTM models generally outperform traditional neural networks for long-term predictions ARIMA models show particular strength in handling seasonal patterns Linear regression provides robust baseline performance and interpretability
Our research builds upon these findings by implementing and comparing all three approaches within a single integrated system, allowing for direct performance comparison under identical conditions.
3. Data Collection and Processing
3.1. Dataset Description and Selection
This study employs historical stock price data from five major companies traded on the U.S. stock market, obtained through the Yahoo Finance platform. The selected companies - Apple (AAPL), Coca-Cola (KO), NVIDIA (NVDA), Pfizer (PFE), and Tesla (TSLA) - represent diverse market sectors and exhibit varying patterns of market behavior. These companies were specifically chosen due to their significant market presence, consistent trading volumes, and distinct market characteristics, providing an ideal testbed for evaluating our prediction models across different market conditions.
The primary dataset spans a three-year period, a timeframe carefully selected to balance data recency with sufficient sample size for model training. This duration provides enough historical data to capture meaningful market patterns while avoiding the potential noise from outdated market conditions that might not reflect current trading dynamics. For each trading day, the dataset includes six fundamental metrics: opening price, daily high, daily low, closing price, adjusted closing price, and trading volume. These metrics form the foundation for our predictive analysis and model development.
3.2. Data Preprocessing Methodology
Our preprocessing framework implements distinct strategies for each prediction model, recognizing that different algorithms require specific data representations for optimal performance. This targeted approach to preprocessing represents a key innovation in our methodology, significantly enhancing the prediction accuracy of each model.
3.2.1. Linear Regression Preprocessing
For Linear Regression analysis, we developed a structured approach to feature engineering based on temporal aggregation. The preprocessing involves combining five consecutive trading days into a single observation unit, with the closing price five days ahead serving as the prediction target. This creates a 25-dimensional input vector (5 features × 5 days) for each observation, with a single-dimensional output target. This structure enables the model to capture short-term price patterns while maintaining computational efficiency.
3.2.2. ARIMA Time Series Transformation
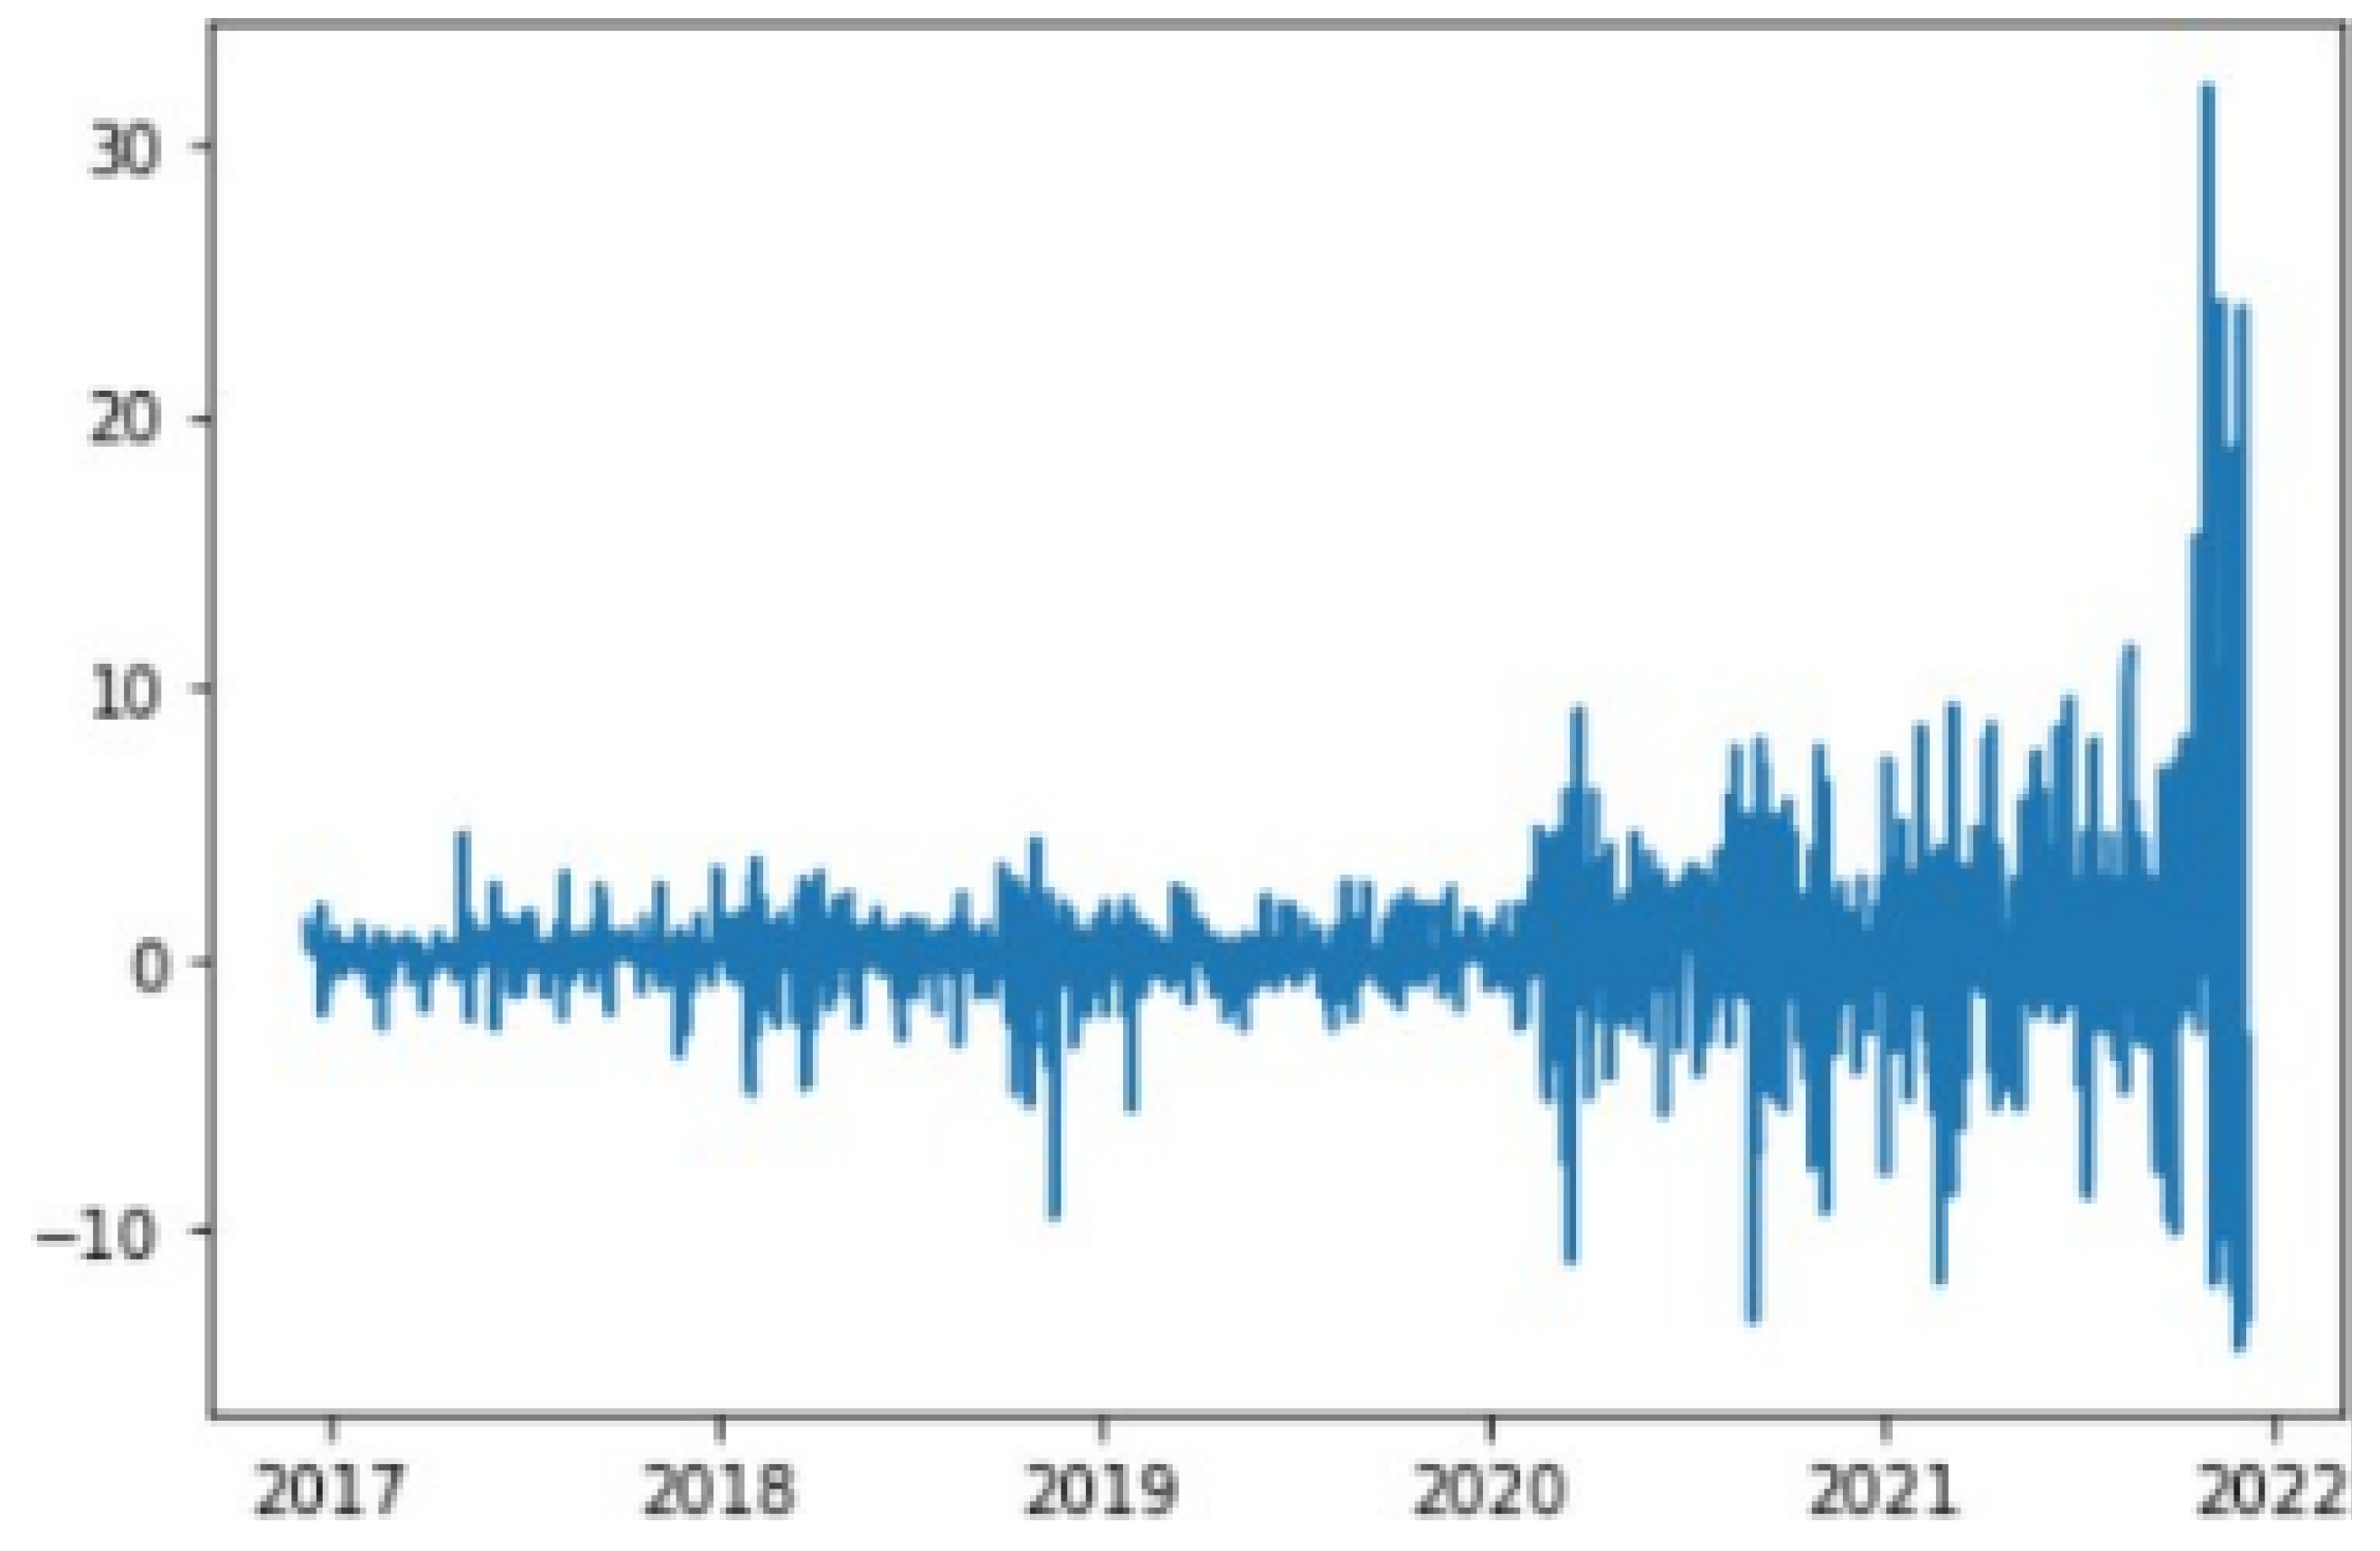
The ARIMA model implementation required careful attention to time series stationarity. We applied first-order differencing to the closing price sequence to generate a stationary time series, as illustrated in Figure 1 & 2 using NVIDIA stock data as an example. The stationarity of the transformed series was rigorously validated through unit root testing, with all stocks showing p-values below . This statistical validation confirmed that first-order differencing was sufficient to achieve stationarity, eliminating the need for higher-order transformations.
Figure 4.
NVIDIA Stock Prices Before Differencing
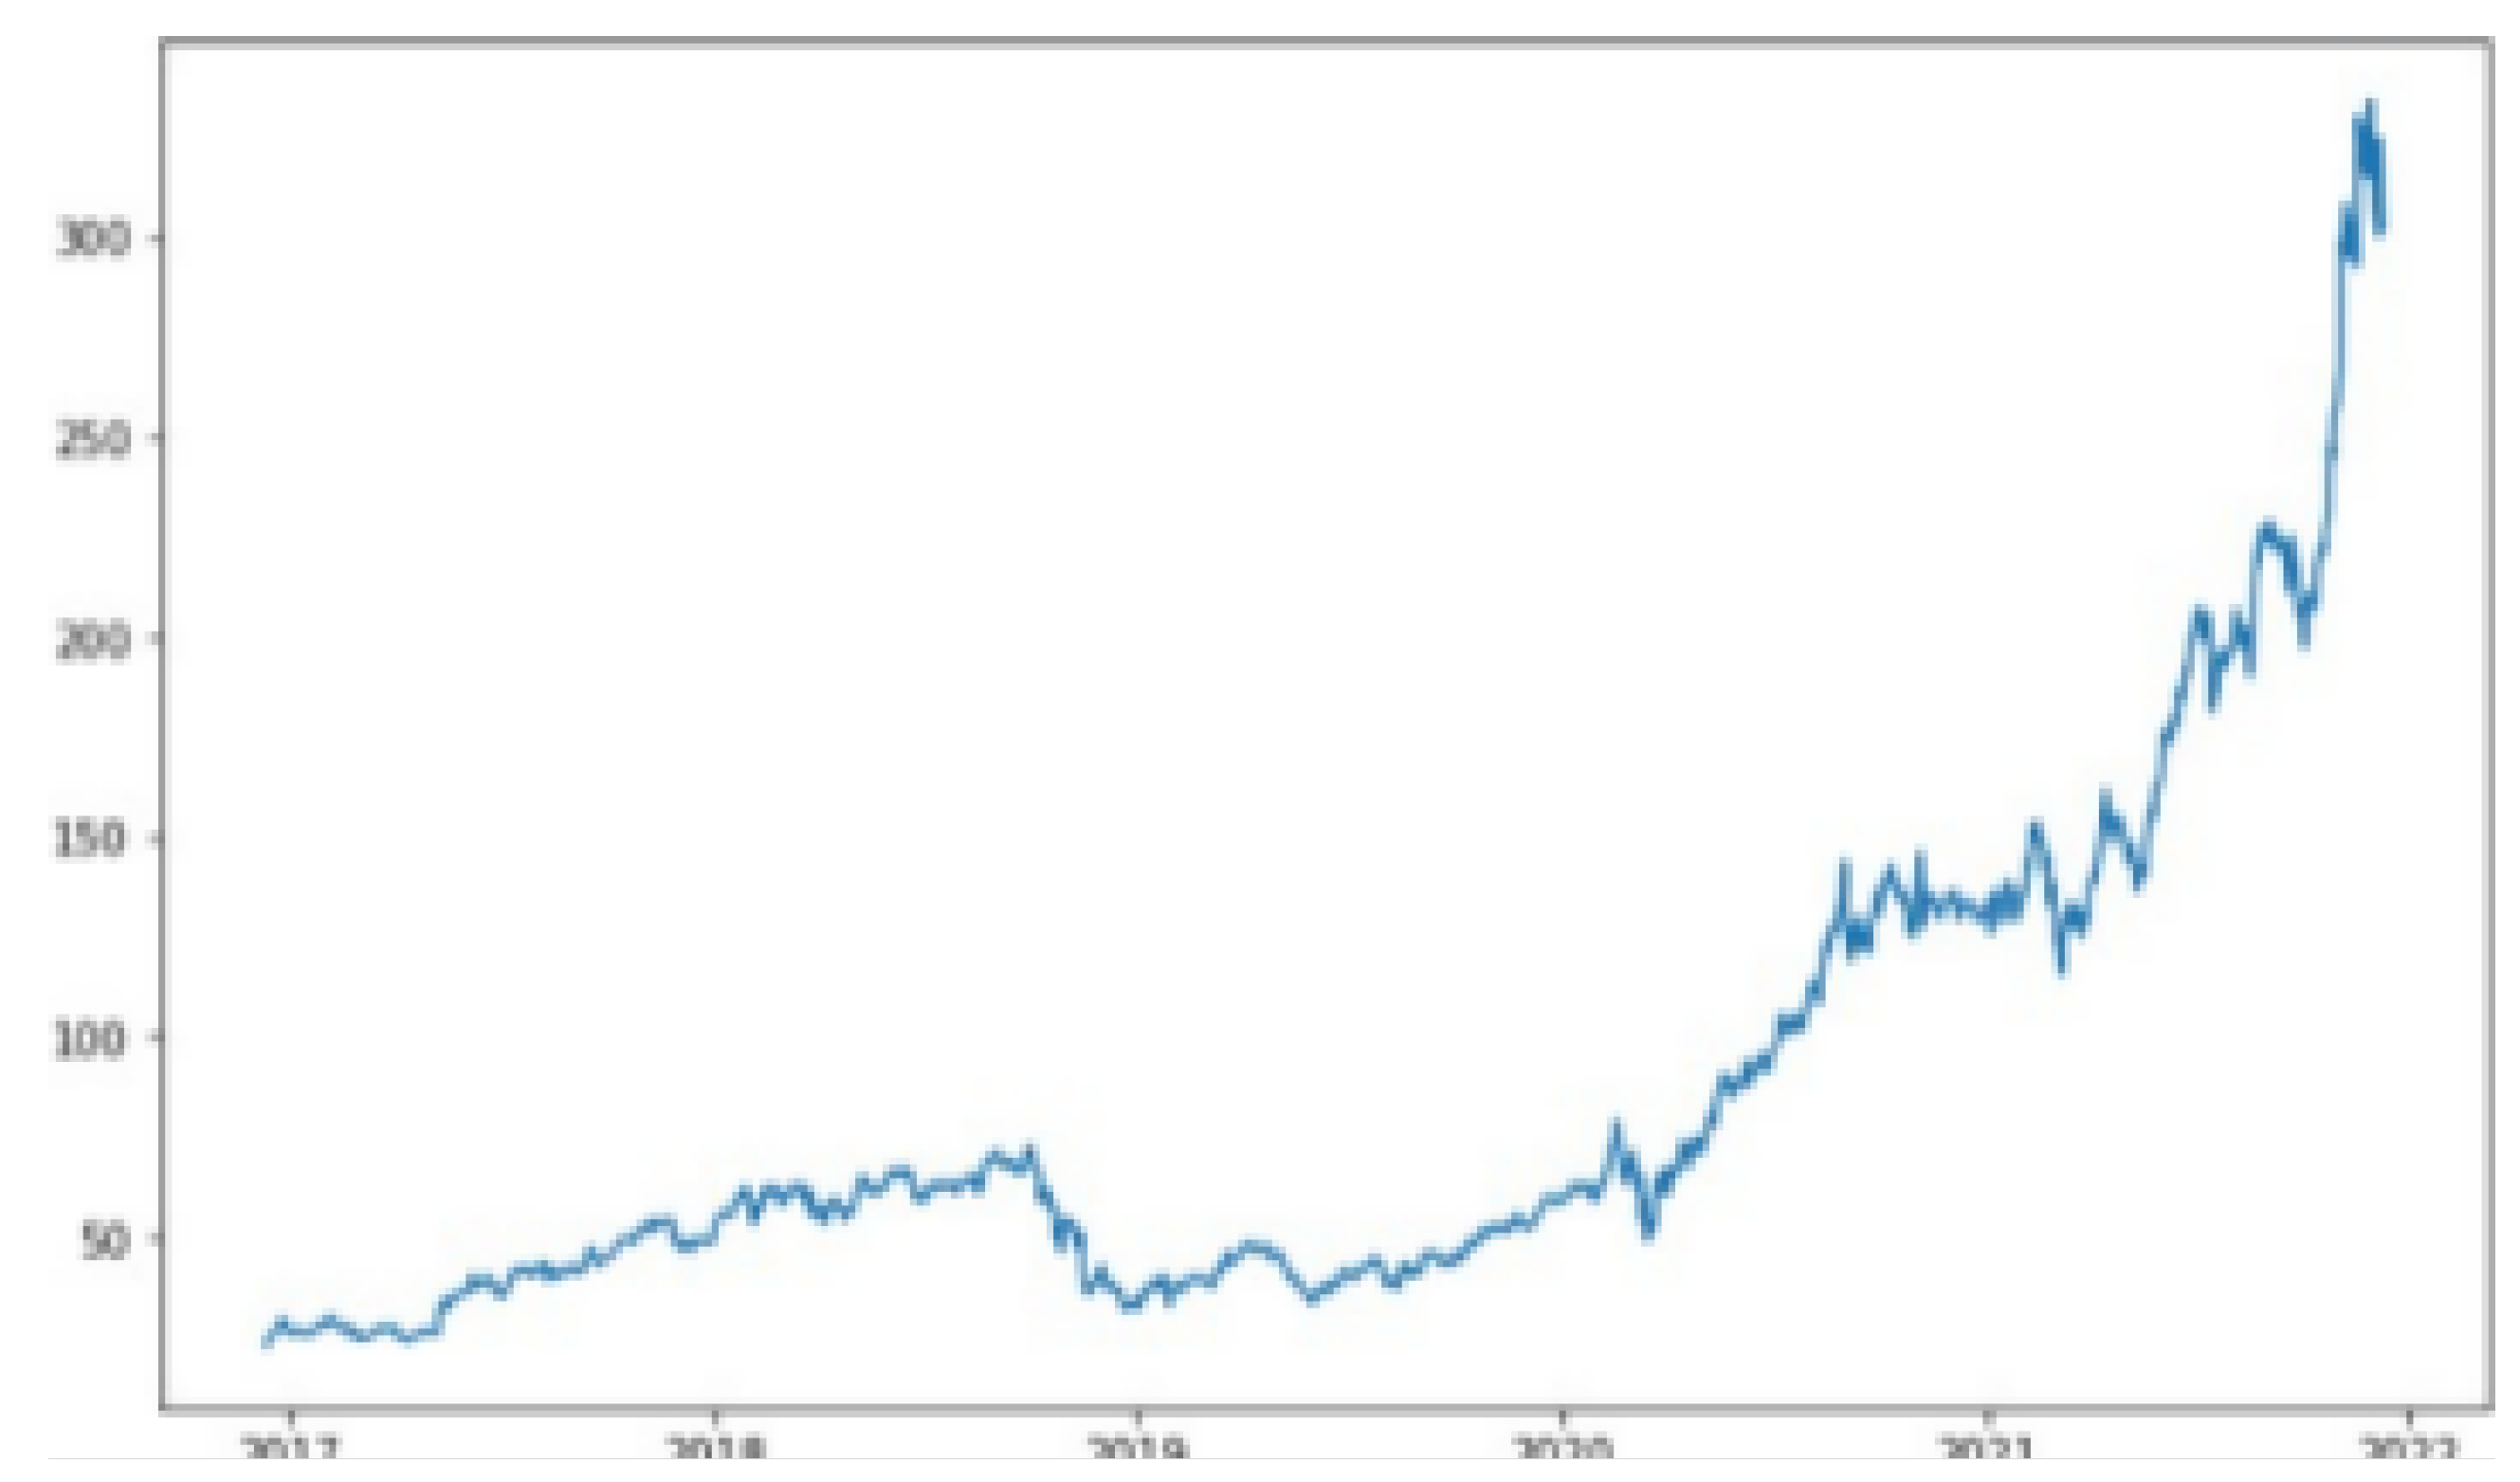
Figure 5.
NVIDIA Stock Prices After First-Order Differencing
3.2.3. LSTM Sequential Data Processing
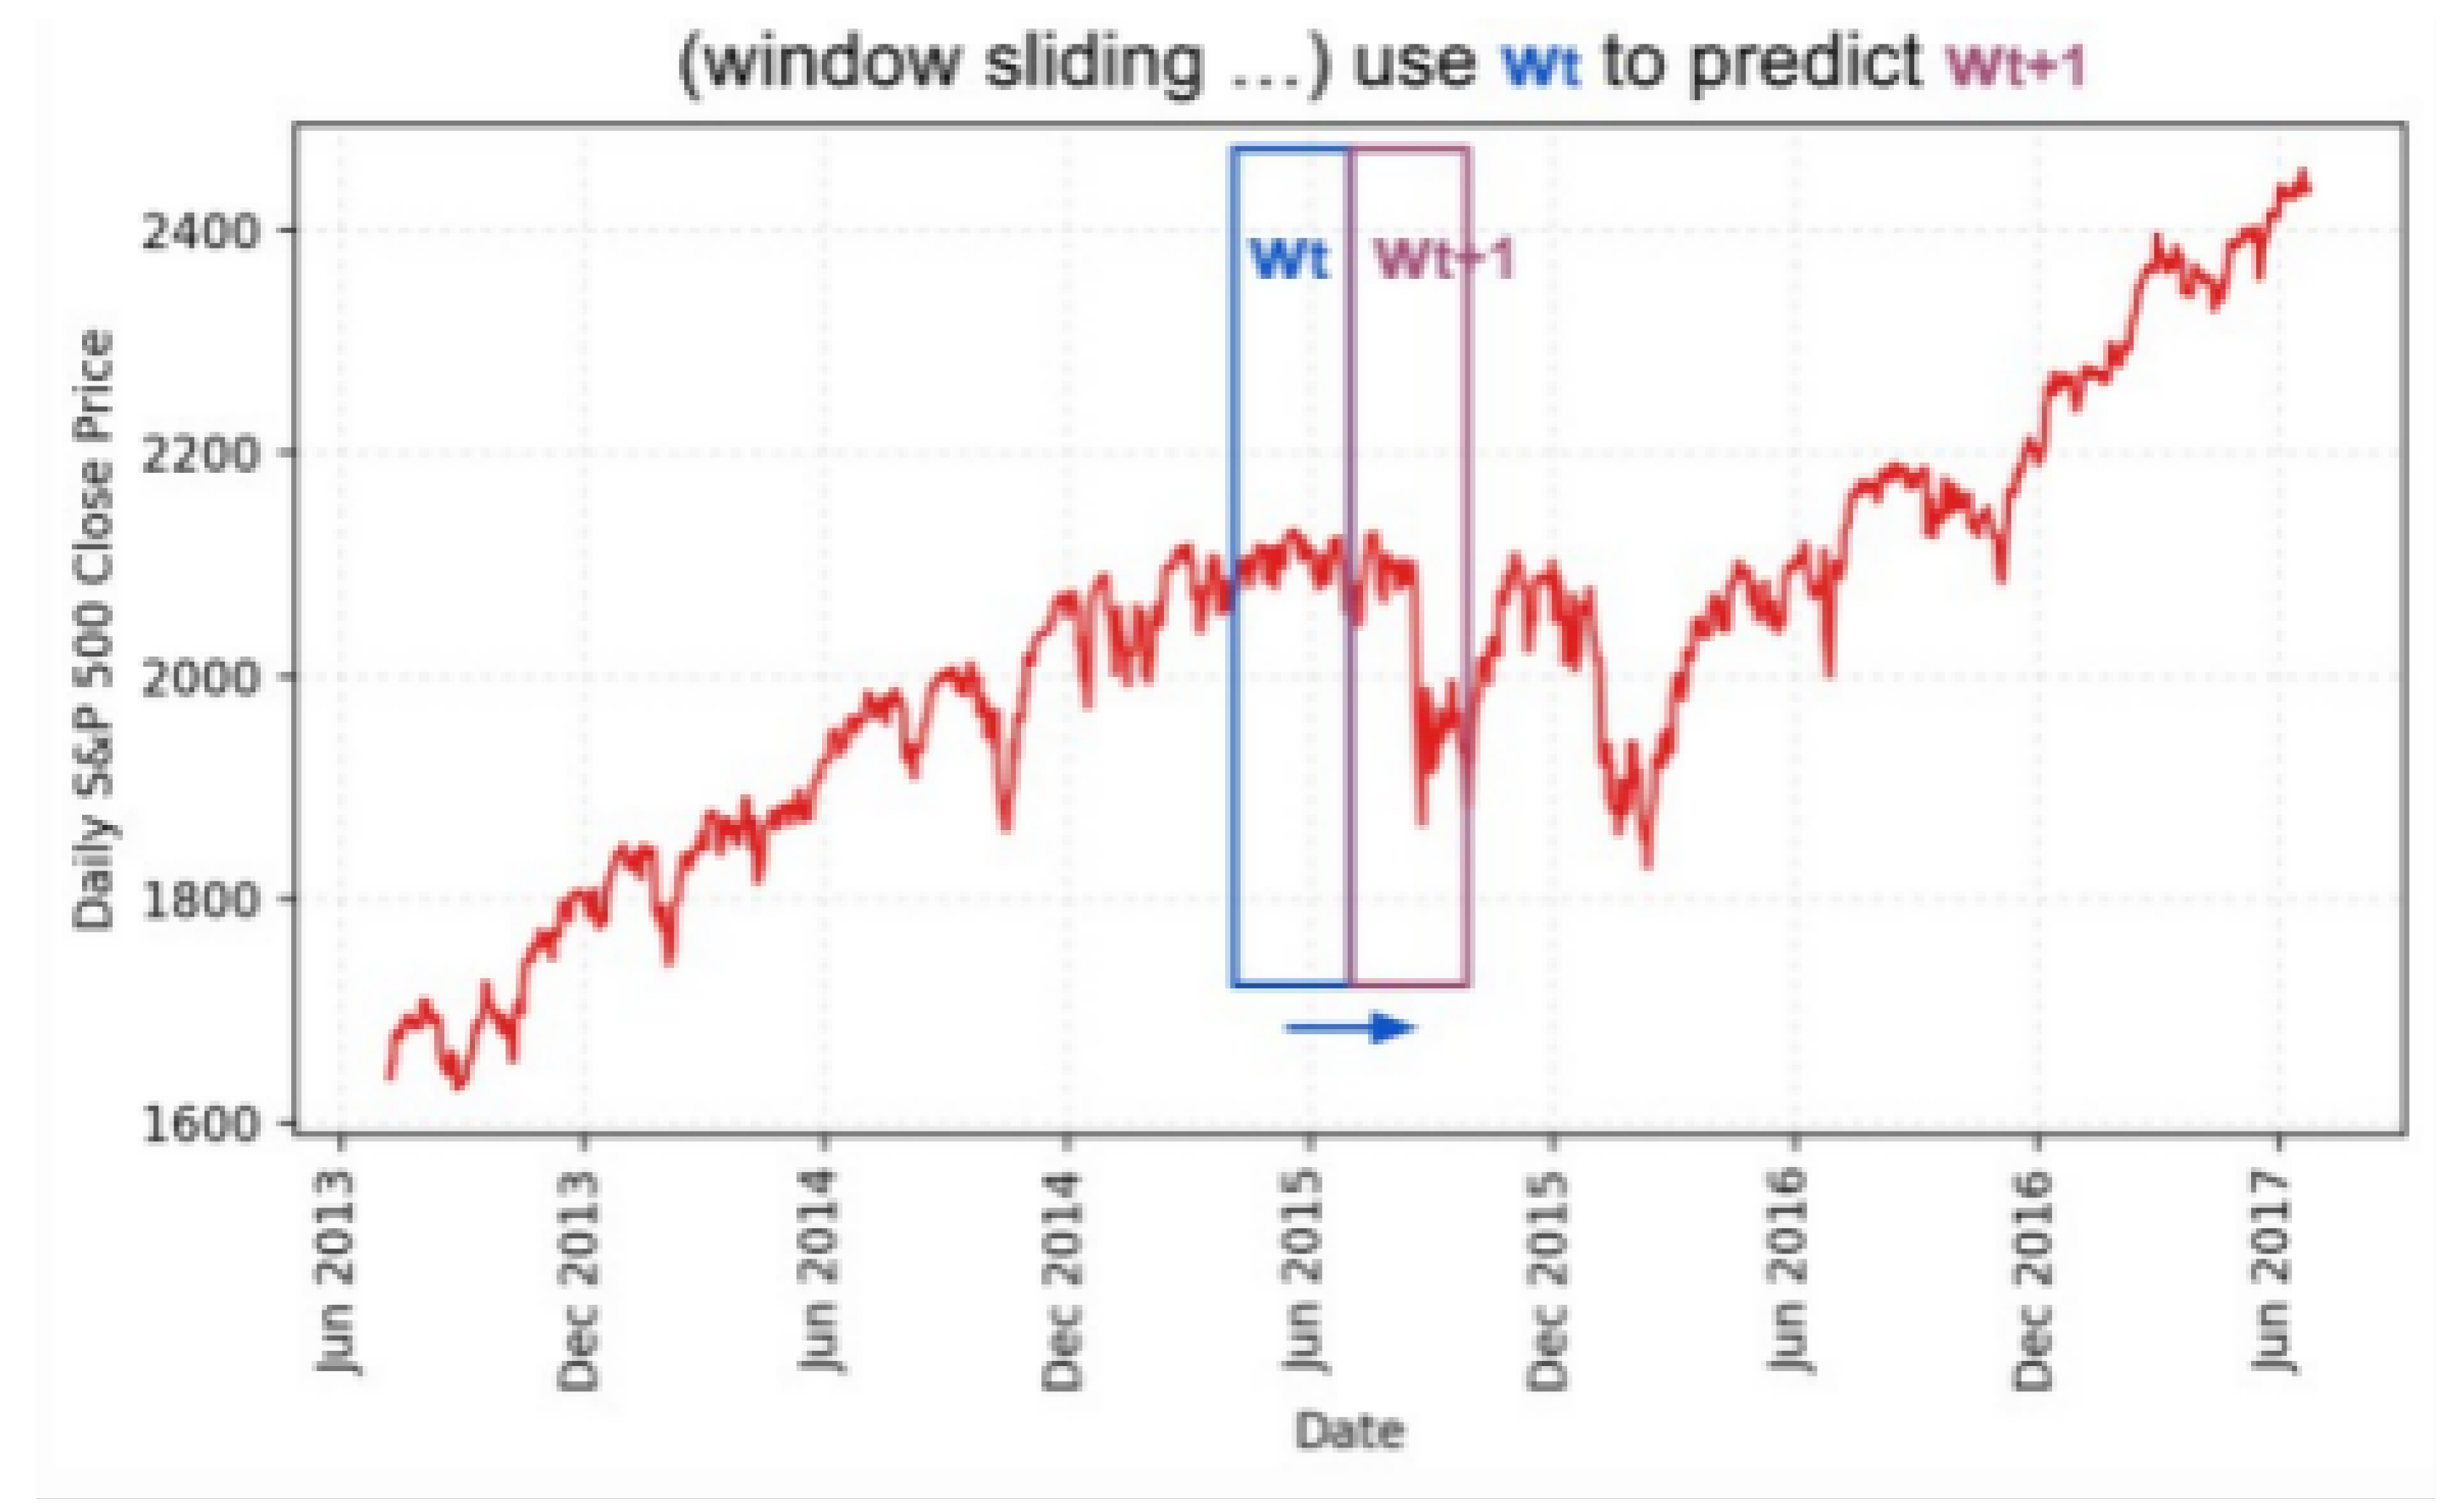
For the LSTM model, we implemented a sophisticated sliding window approach to maintain temporal relationships in the data. Each window contains several continuous trading days with a fixed size w, creating sequential data segments for training. We reserved the most recent 10% of the data for testing purposes, as shown in Figure 3 using S&P 500 data as an illustration.
Figure 6.
S&P 500 price data visualization showing the temporal segmentation approach
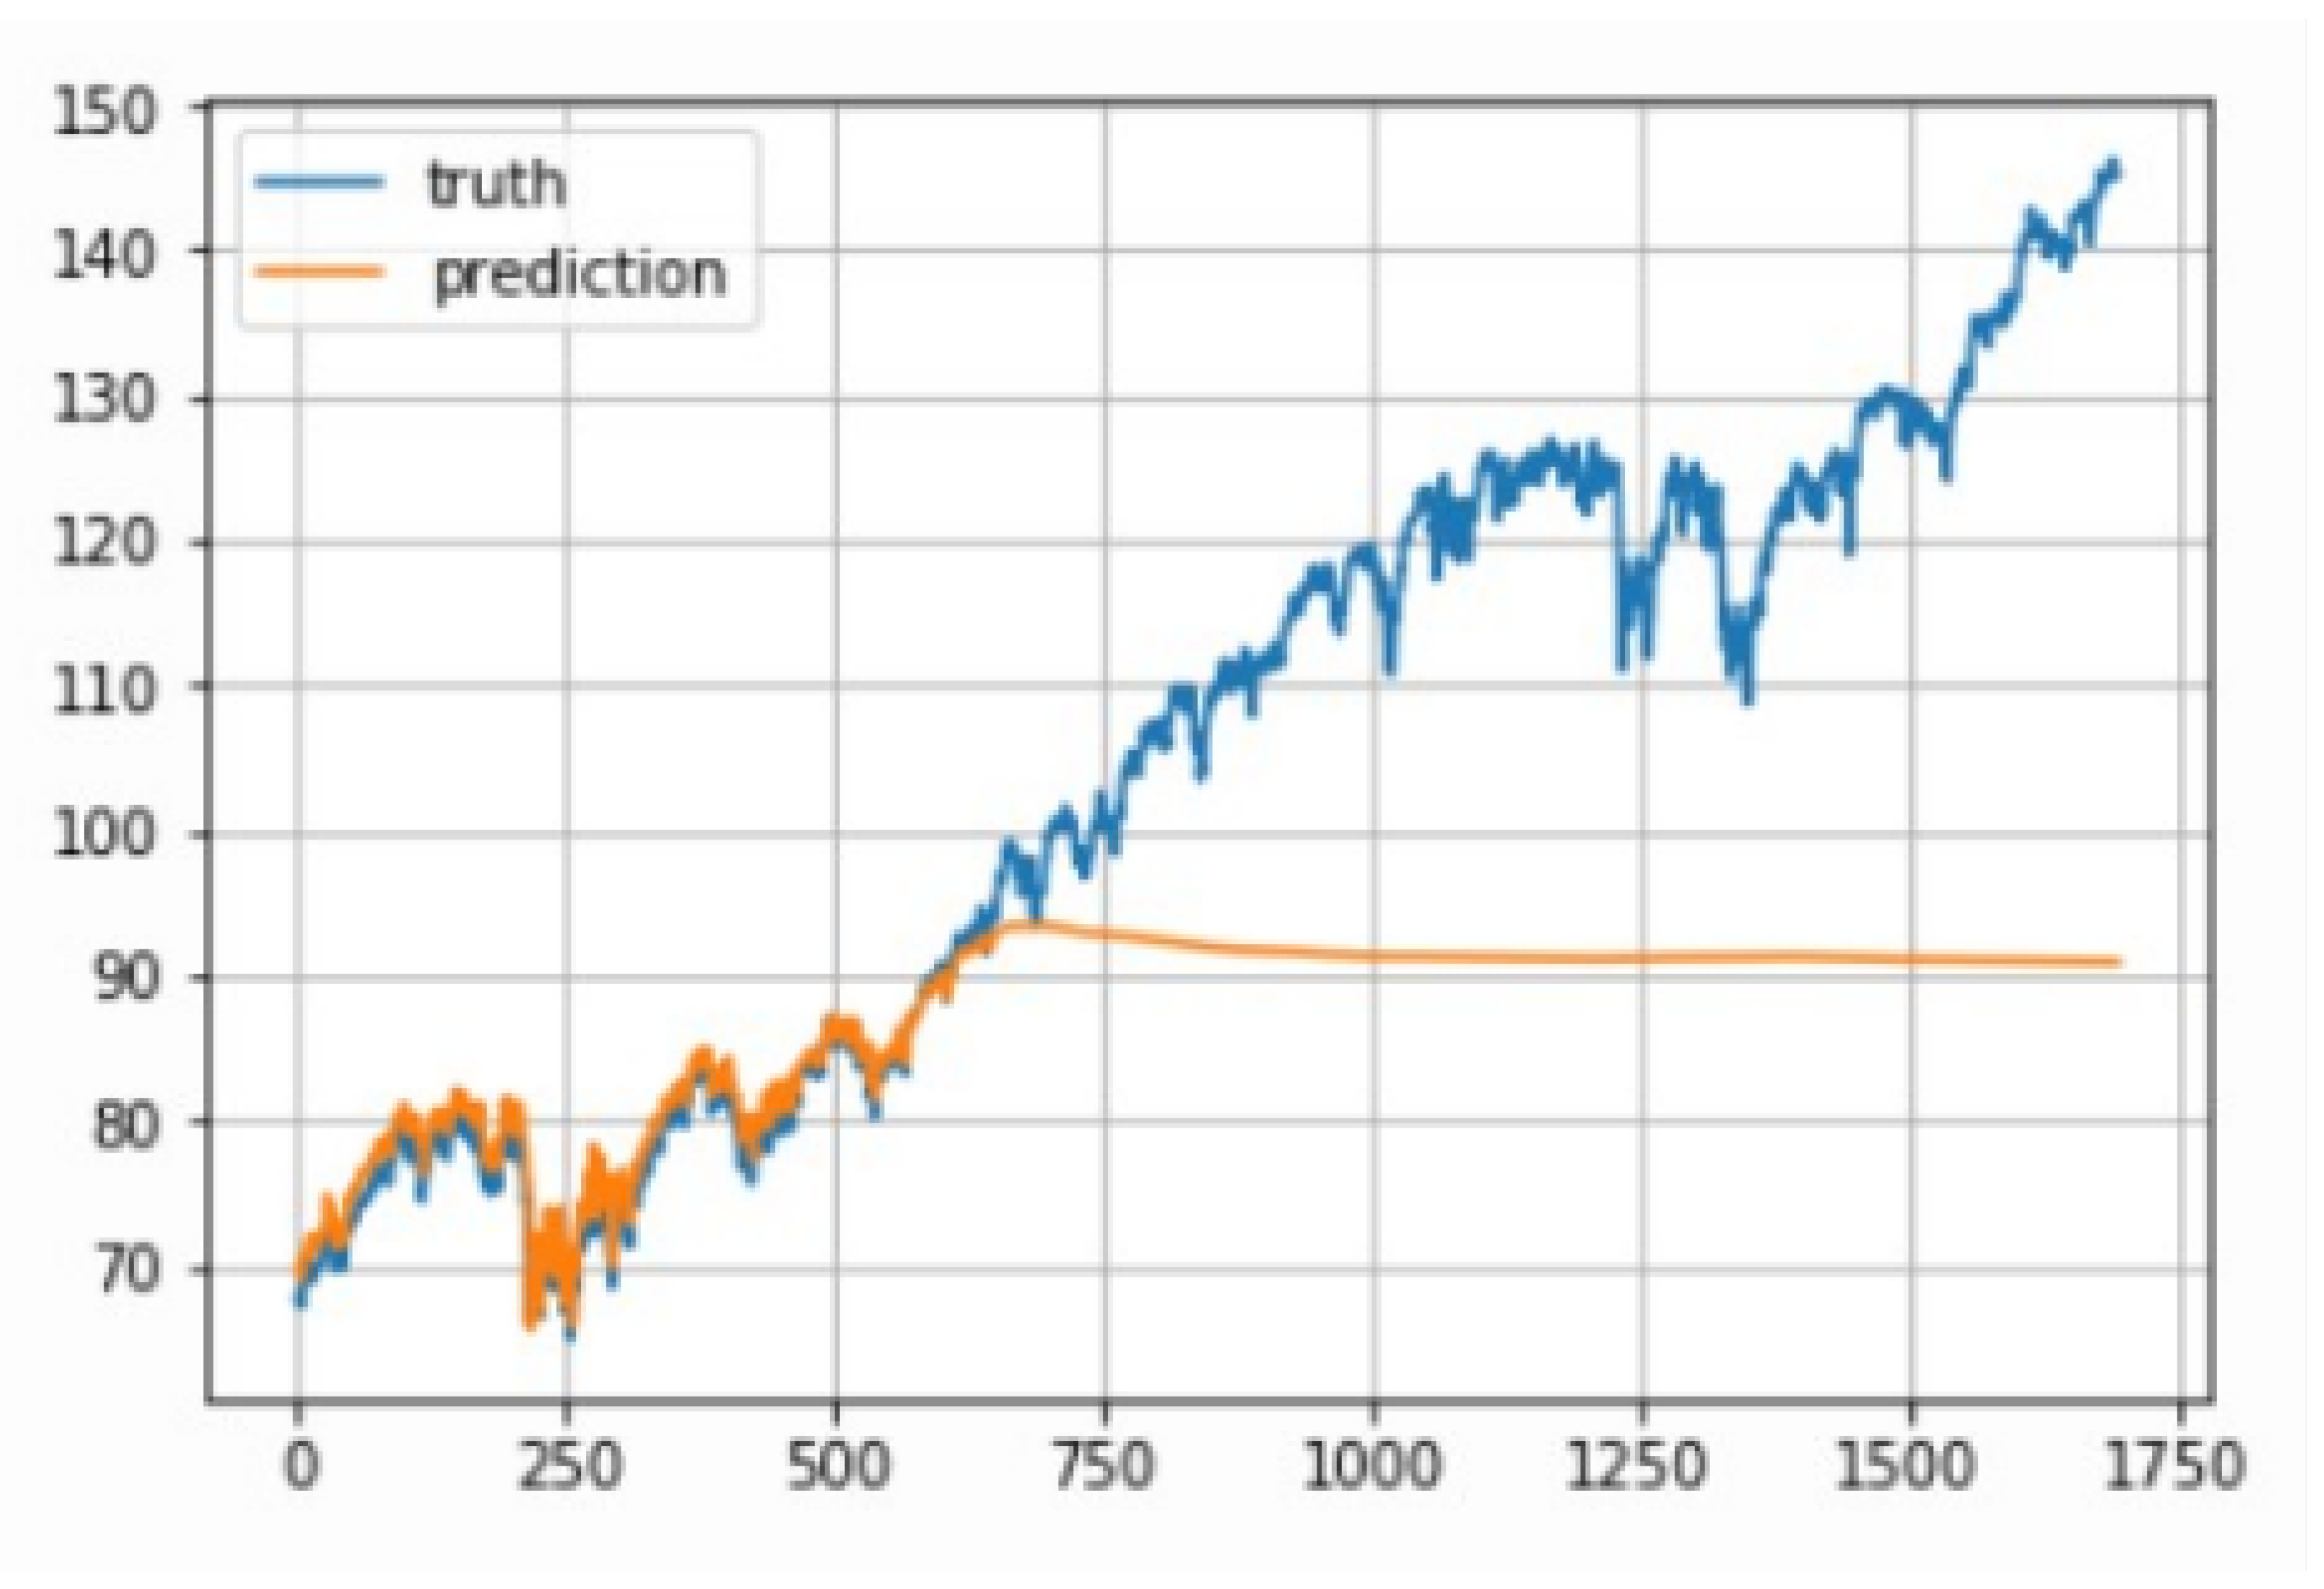
A critical innovation in our LSTM preprocessing was the implementation of window-specific normalization. This step proved essential due to the tendency of stock prices to increase over time, which can result in test data values significantly different from those seen during training. Figure 4 demonstrates the poor prediction performance when using non-normalized data, where the model struggles with previously unseen price levels.
Figure 7.
Comparison showing poor prediction performance with non-normalized data
To address this challenge, we normalized each sliding window’s prices by dividing the values by the last known price (the final price in the previous window ). This transformation converts the prediction task from absolute price forecasting to relative change rate prediction, significantly improving the model’s generalization capability. The normalized sliding window at time t is calculated as:
where P(t-1) represents the last price in the previous window.
3.3. Quality Control and Validation
The reliability of our prediction models depends heavily on the quality of the input data. We implemented a comprehensive quality control framework that addresses common challenges in financial time series data. This framework includes systematic detection and handling of missing values, validation of extreme price movements, and verification of data consistency across multiple sources. Special attention was paid to trading volume validation, ensuring that our analysis focuses on periods of significant market activity.
Additionally, we developed a market calendar alignment procedure to synchronize trading days across all stocks, accounting for market holidays and special trading sessions. This alignment ensures consistency in our cross-stock analysis and model comparisons. The effectiveness of these preprocessing strategies is reflected in the experimental results, where we observe significant improvements in prediction accuracy across all models.
4. Methodology
4.1. Algorithm Selection and Design
Our research implements three complementary approaches for stock price prediction: ARIMA, Linear Regression, and LSTM networks. These methods were selected based on their distinct capabilities in handling different aspects of financial time series analysis.
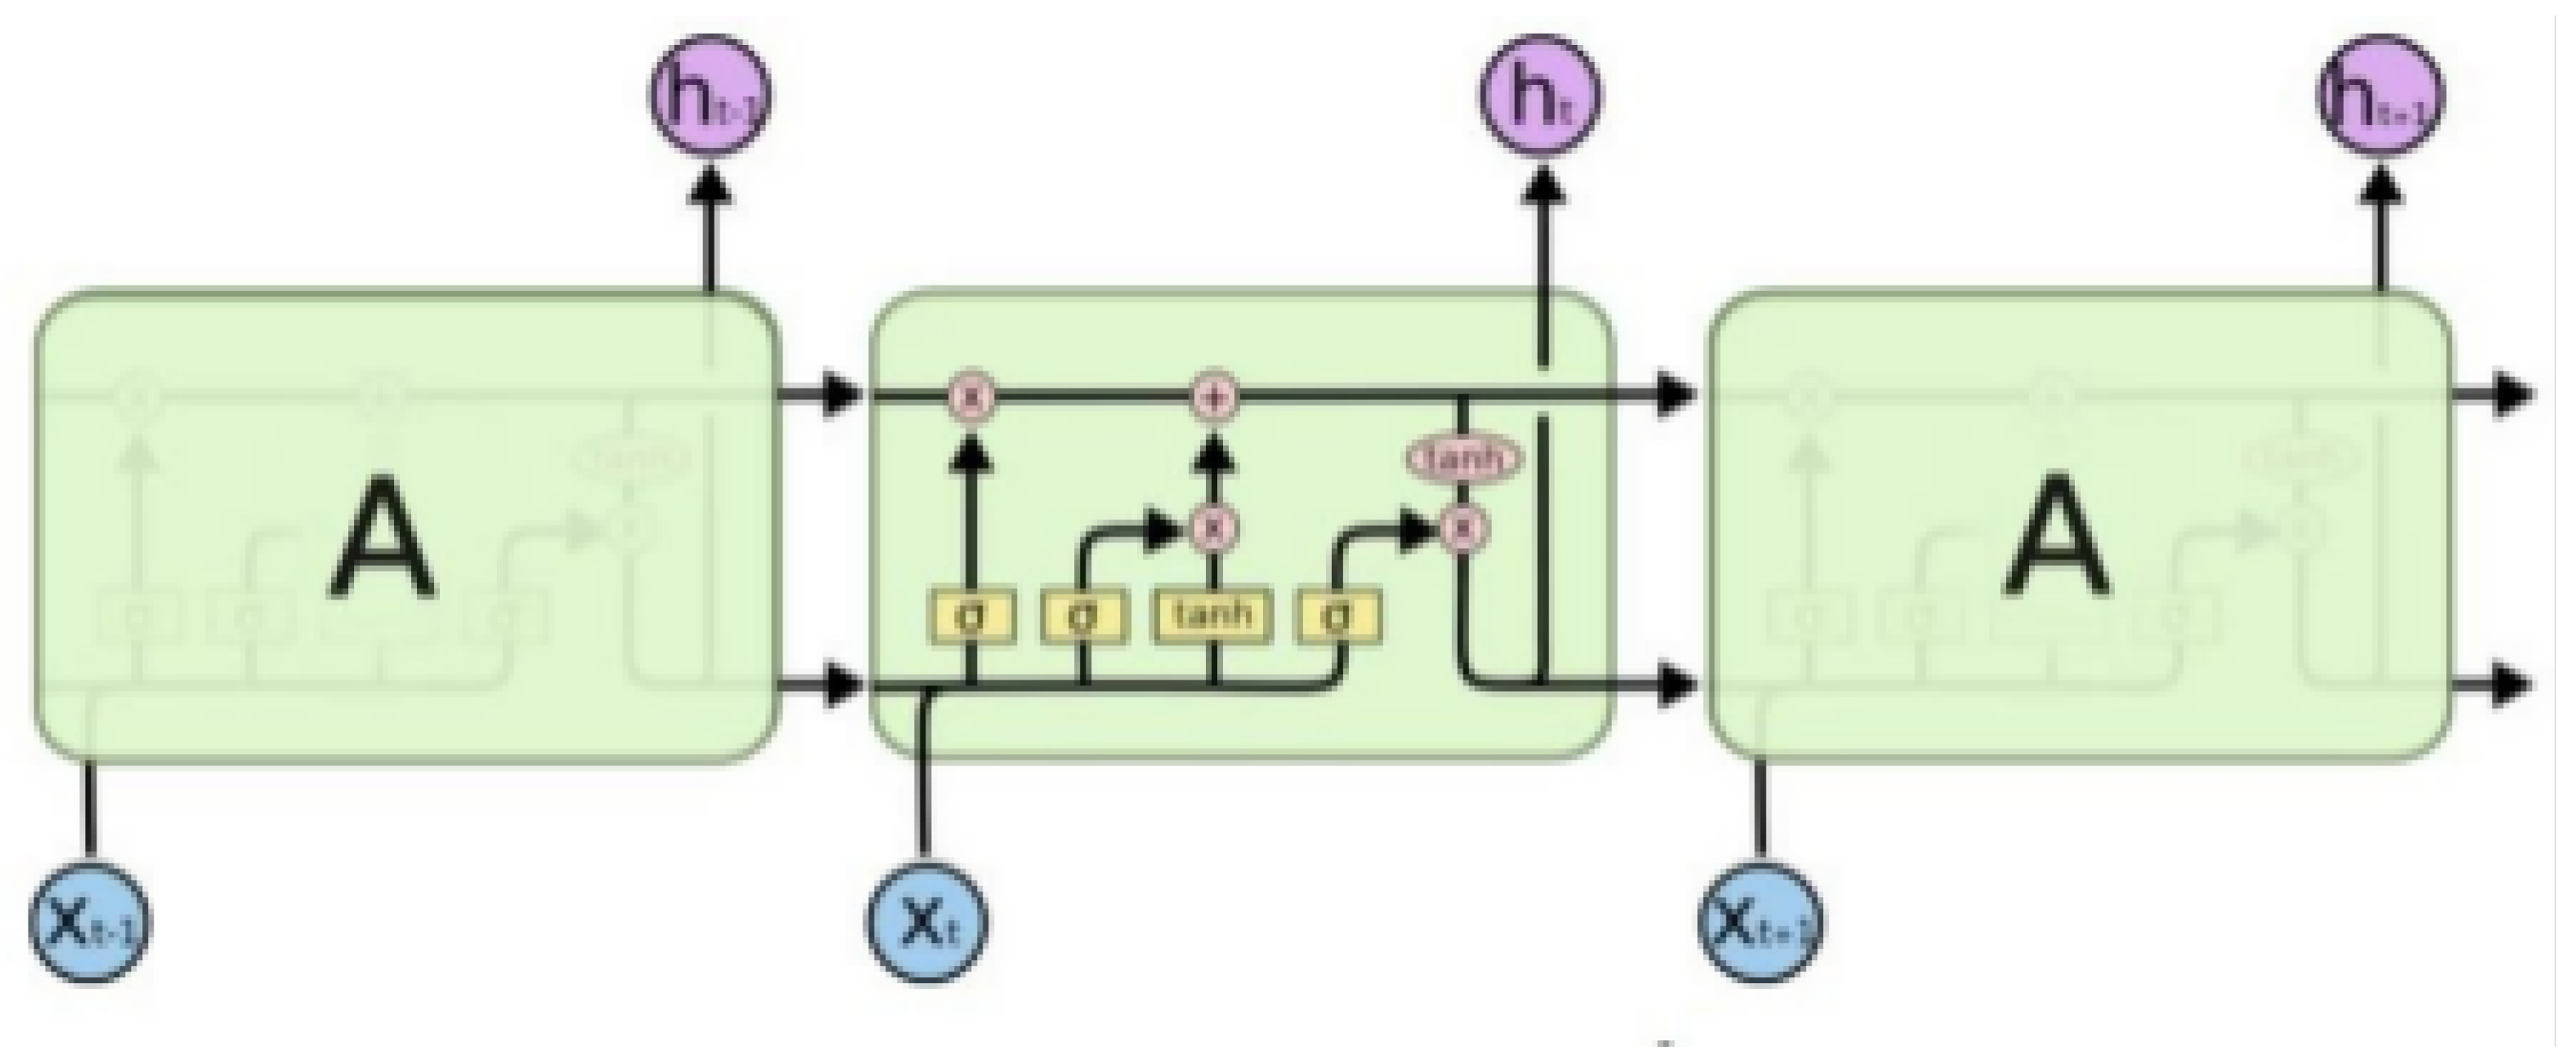
In the LSTM architecture, we leverage the sophisticated memory mechanism illustrated in Figure 4, where each node contains four interacting neural network layers. This structure proves crucial for capturing market patterns across different time scales. The chain-like architecture, with its specialized memory cells containing input, forget, and output gates, enables our model to selectively retain and update information based on market conditions. Figure 5 demonstrates this internal structure, where each gate plays a specific role in processing financial data streams.
Figure 8.
Chain of LSTM and the structure of one node
ARIMA models offer sophisticated time series analysis capabilities through the integration of autoregressive and moving average components. Our implementation focuses on systematic parameter optimization, utilizing statistical validation techniques including unit root testing and information criteria analysis to establish optimal model configurations for varying market conditions.
Linear Regression in our framework extends beyond basic linear models to encompass multiple optimization approaches. The implementation incorporates least squares estimation, gradient descent optimization, and regularization techniques through Lasso and Ridge regression. This comprehensive approach enables effective feature selection while maintaining model interpretability, crucial for practical trading applications.
4.2. Model Selection Rationale
The selection of these three approaches is justified through both theoretical foundations and practical considerations in financial forecasting. ARIMA’s statistical foundation provides robust handling of time series characteristics, particularly valuable for capturing seasonal patterns and trends in market data. The model’s ability to handle non-stationary data through differencing makes it particularly suitable for stock price analysis.
Linear Regression offers computational efficiency and interpretability, with its various implementations providing flexibility in handling different types of market data. The inclusion of regularization techniques addresses the critical challenge of overfitting, while gradient descent optimization enables effective handling of high-dimensional feature spaces.
LSTM’s sophisticated architecture addresses the limitations of traditional neural networks in handling sequential data. The model’s memory cells and gate mechanisms enable capture of both short-term and long-term dependencies in price movements, making it particularly suitable for markets with complex temporal patterns.
4.3. Comparative Framework
Our evaluation framework emphasizes both theoretical capabilities and practical performance metrics. The assessment considers prediction accuracy through standard metrics such as MSE and RMSE, while also evaluating model robustness across different market conditions. This comprehensive approach enables systematic comparison while ensuring practical relevance for trading applications.
The implementation incorporates specific optimizations for each method, with ARIMA parameters dynamically adjusted based on market conditions, Linear Regression models adapting feature selection and regularization strength, and LSTM implementations managing sequence length and batch size for optimal performance.
Through this methodological framework, we establish a systematic approach to stock price prediction that leverages the complementary strengths of statistical analysis and machine learning techniques. The integration of these methods provides a robust foundation for accurate price prediction across various market conditions and time horizons.
5. Experiments
Our experimental study presents a systematic evaluation of three prediction approaches across diverse market conditions and stock characteristics. We focused on comparing the performance of Linear Regression, LSTM, and ARIMA models across five representative stocks: Apple (AAPL), Coca-Cola (KO), NVIDIA (NVDA), Pfizer (PFE), and Tesla (TSLA). The analysis encompasses multiple dimensions of model performance, from feature engineering effectiveness to architectural optimization, revealing significant insights into the relative strengths and limitations of each method.
5.1. Linear Regression Experiments
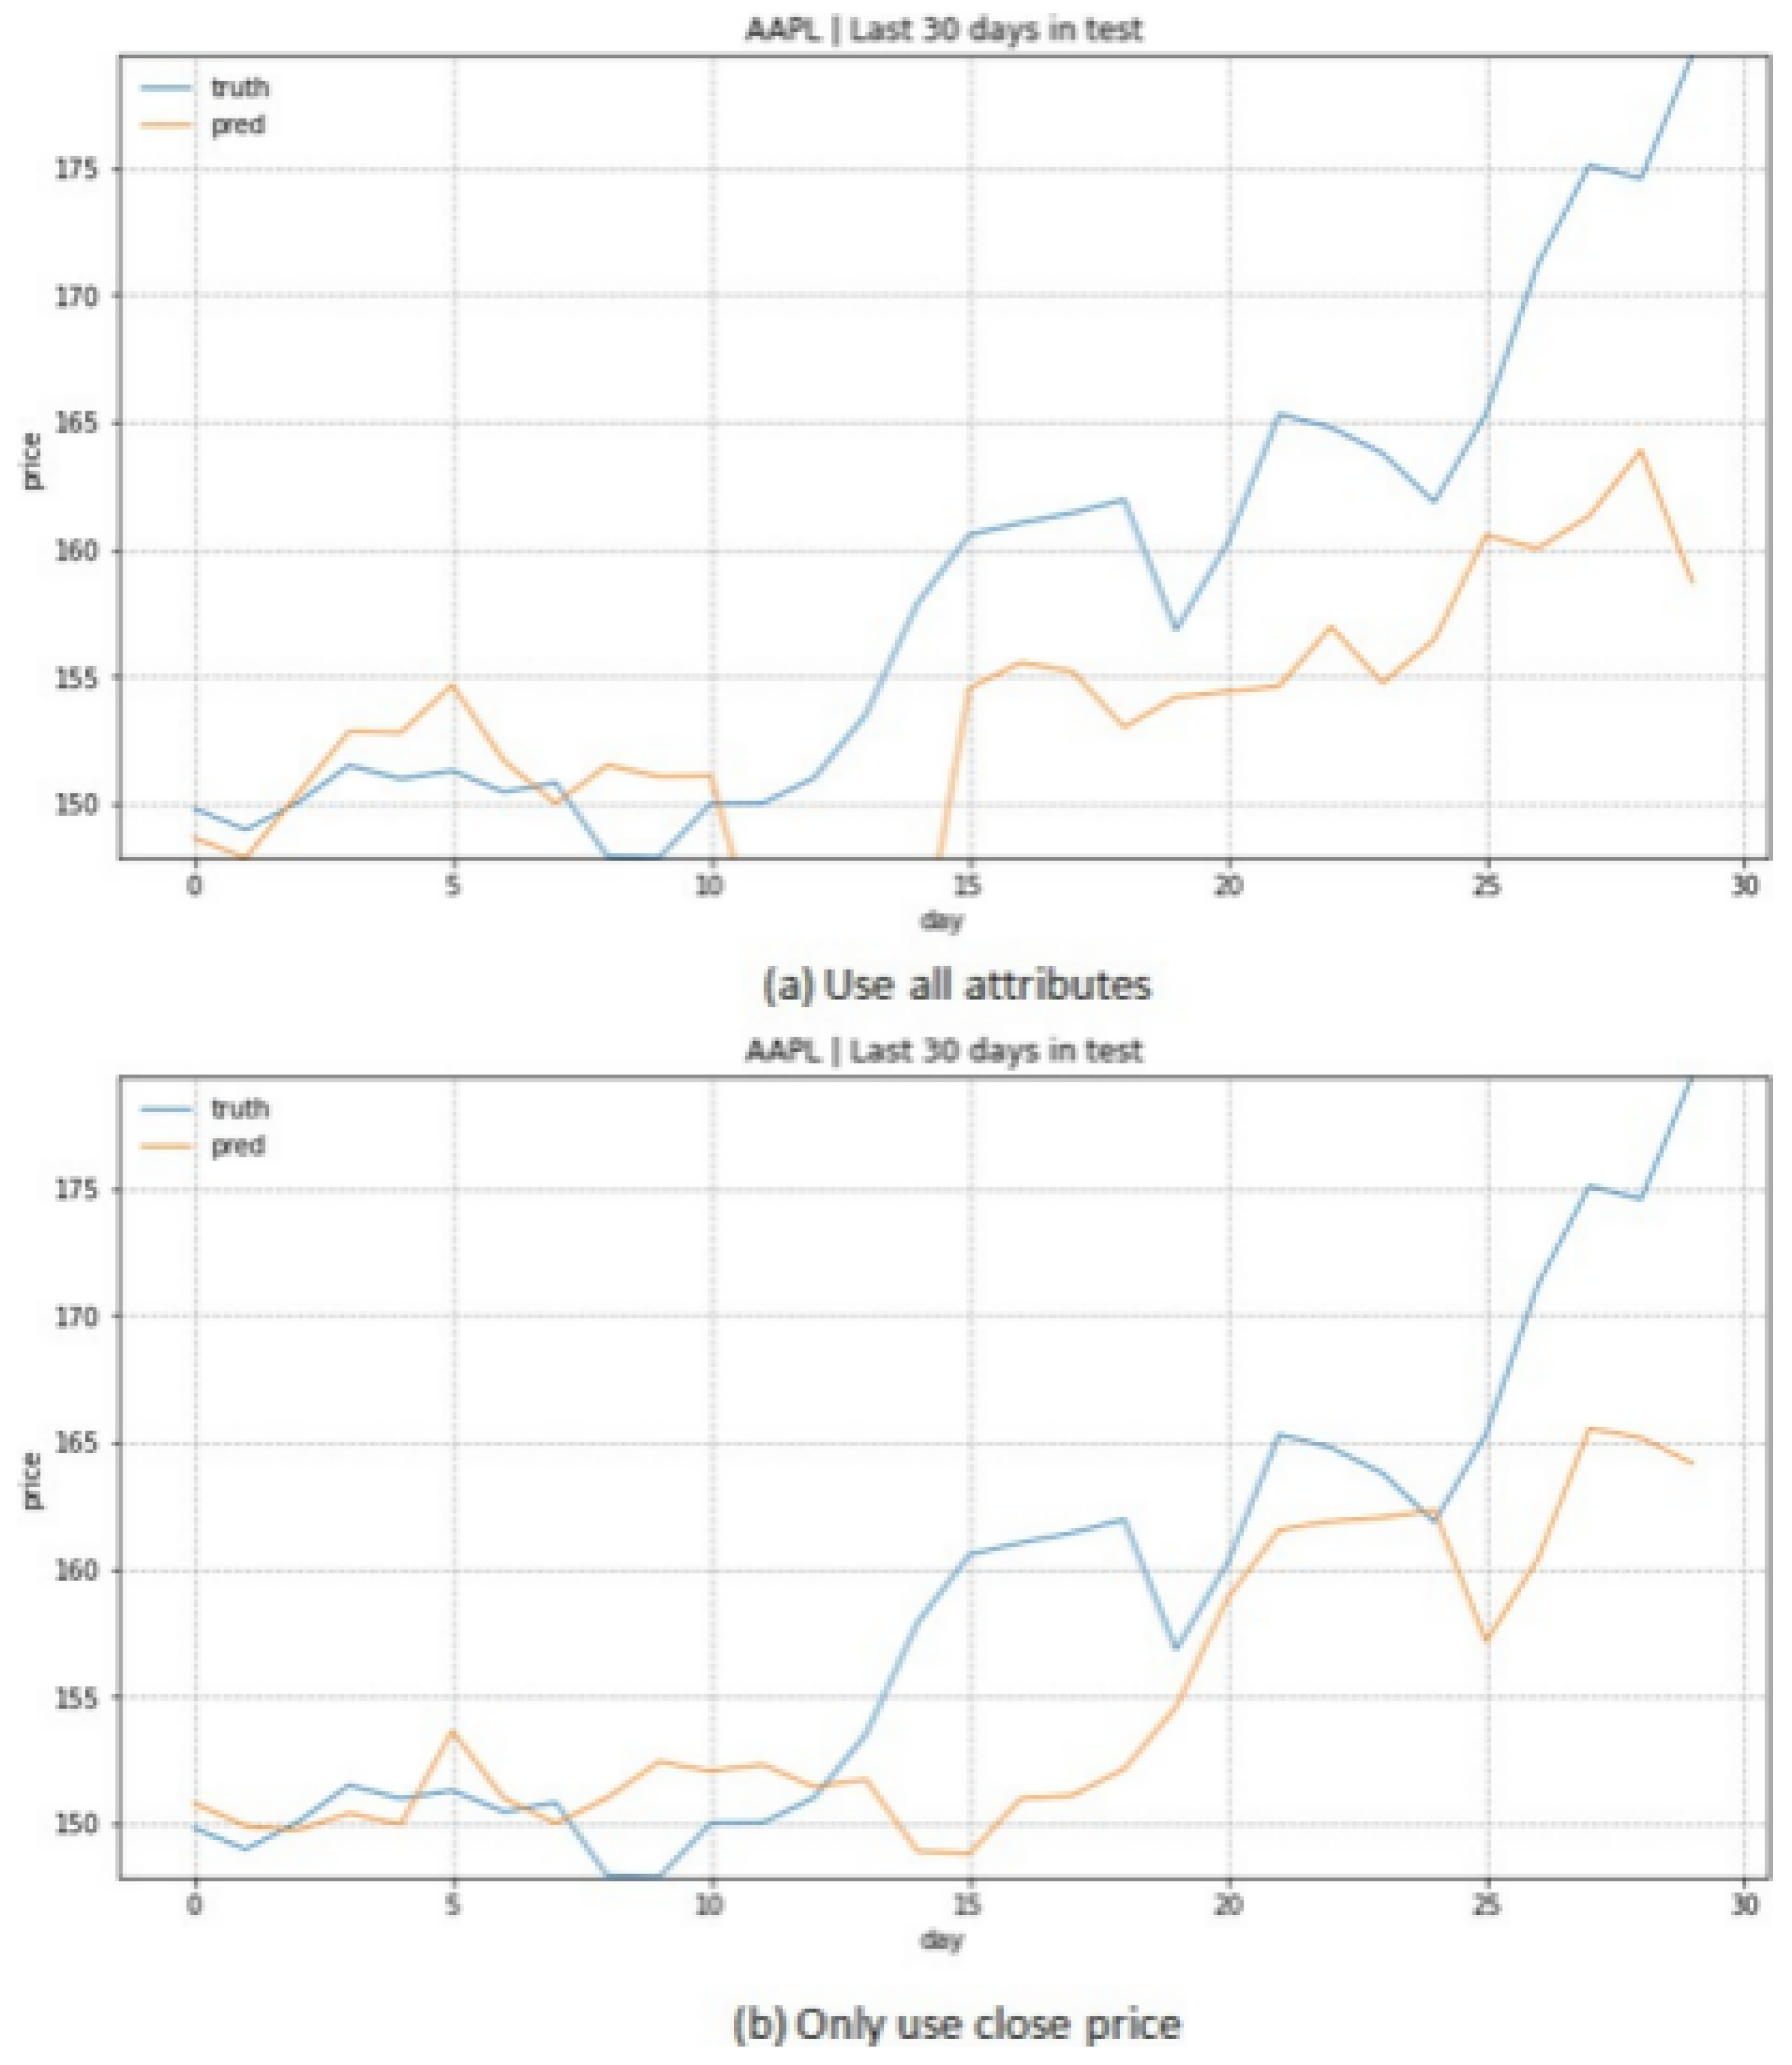
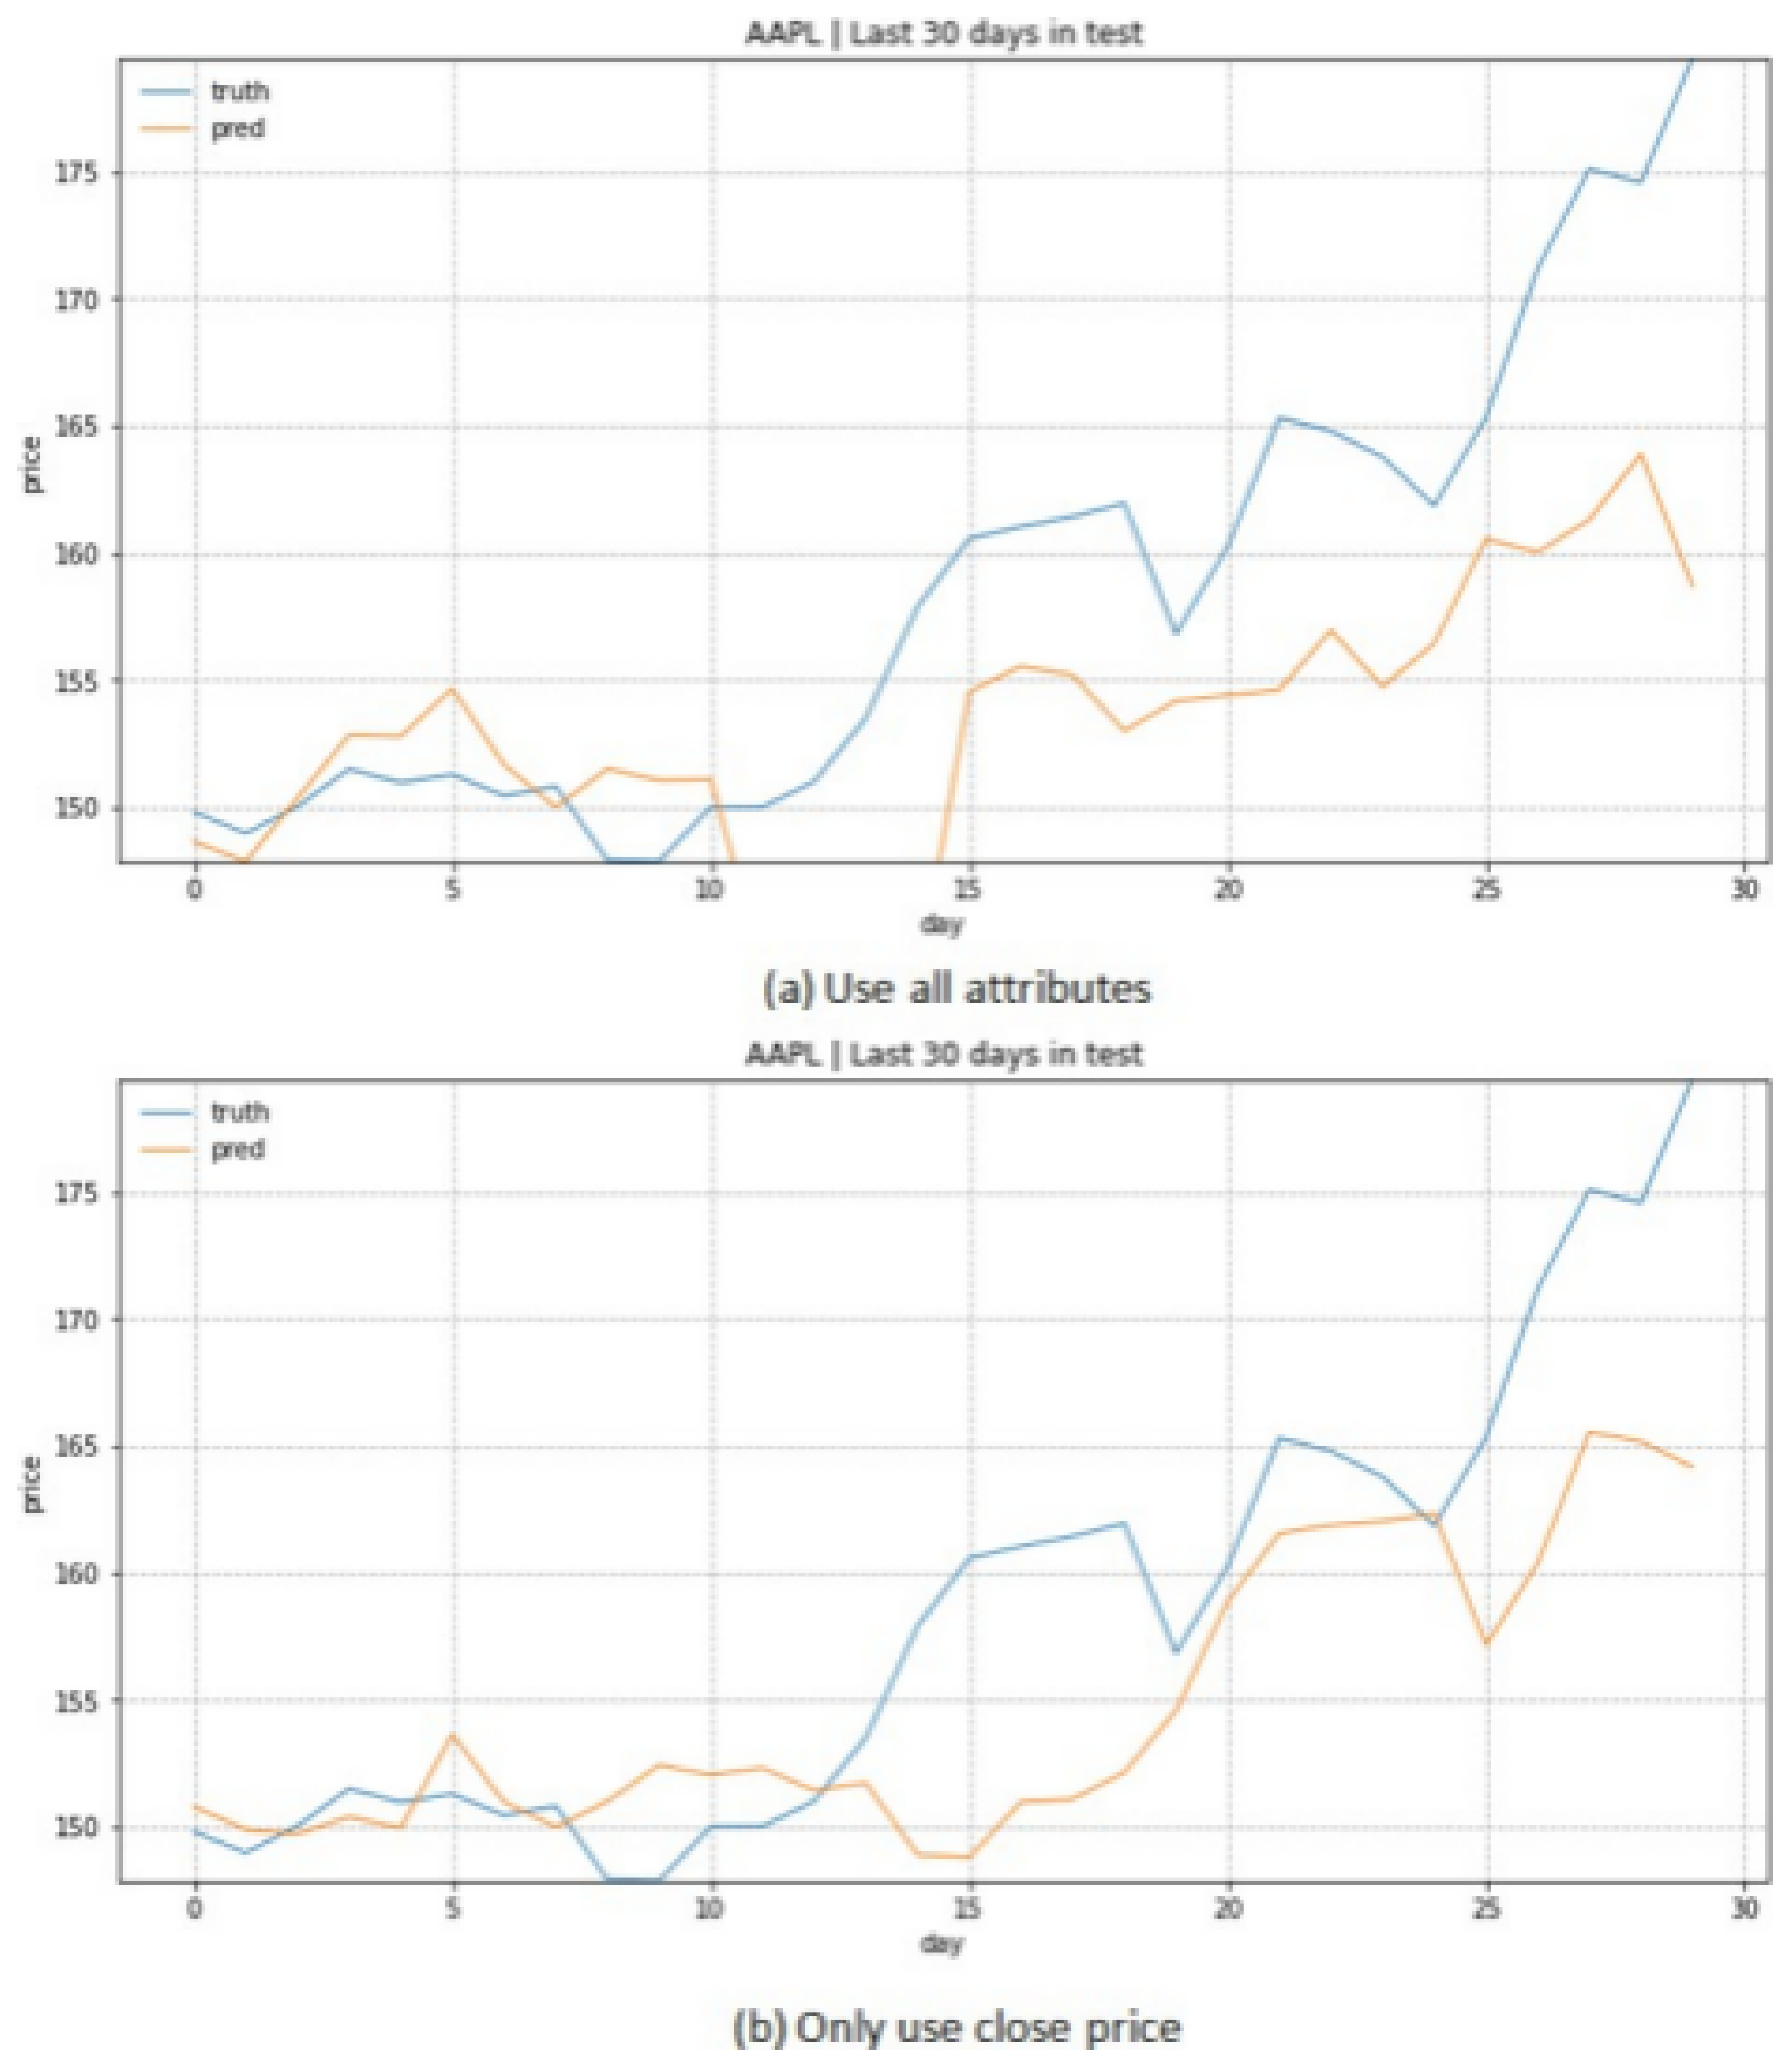
Our initial experiments with Linear Regression focused on the impact of feature selection on prediction accuracy. We investigated two distinct approaches: using all available price metrics versus using only closing prices. This comparison revealed unexpected insights into the relationship between feature complexity and prediction accuracy. Table 1 presents our comprehensive analysis of prediction accuracy across different feature configurations, incorporating both price ranges and trading volumes to contextualize the improvements observed.
As evidenced by the data, technology sector stocks demonstrated particularly notable improvements with feature reduction, with AAPL showing a 36.27% improvement in prediction accuracy when using only closing prices. This pattern of improved performance with simplified feature sets persisted across different market sectors, though with varying magnitudes. The sole exception was PFE, where additional price metrics contributed positively to prediction accuracy, suggesting unique characteristics in pharmaceutical sector price movements.
Figure 9.
prediction comparison in LR
5.2. LSTM Model Optimization
The LSTM implementation revealed complex relationships between network architecture and prediction performance, as detailed in Table 2. Our analysis focused on both architectural configuration and sequence length optimization, with results demonstrating unexpected patterns across different market conditions.
The relationship between network size and prediction accuracy exhibited clear patterns across different stock characteristics. High-volatility stocks showed stronger correlations between trading volume and prediction error, with TSLA demonstrating the highest sensitivity (correlation coefficient: 0.93). This pattern suggests that market volatility amplifies the of network architecture choices on prediction accuracy.
Sequence length optimization revealed equally significant patterns, as shown in Table 3. The optimal sequence length varied systematically with stock characteristics, suggesting a relationship between market behavior and required historical context.
5.3. ARIMA Model Performance
The ARIMA model implementation required careful determination of three key parameters: p (autoregressive order), d (difference order), and q (moving average order). Our parameter selection process followed a systematic approach based on statistical testing and empirical validation.
The first step involved determining the difference order d through unit root testing. As discussed in our data preprocessing analysis, we applied first-order differencing to achieve stationarity in the time series. The unit root tests yielded p-values below 1010 for all stocks after one-time differencing, providing strong statistical evidence to reject the null hypothesis of non-stationarity. This consistent result across all stocks led us to set d=1 for our experiments.
Following the stationarity transformation, we employed Autocorrelation Function (ACF) and Partial Autocorrelation Function (PACF) analysis to determine appropriate values for p and q. Two graphs under these two analysis in NVDA are showed in Figure 8.
Figure 10.
PACF and ACF graph in NVDA
The ACF analysis guided our selection of the moving average order (q), while PACF informed the autoregressive order (p). Figure 9 presents these functions for NVIDIA stock, where the blue zones represent confidence intervals. Our analysis revealed that nearly all correlation values fell within these confidence intervals after the first order, suggesting that both p=1 and q=1 would provide sufficient model complexity. Table 4 presents the comparative analysis of different ARIMA configurations, revealing the superior performance of simpler model structures.
Our analysis of the ARIMA results revealed several significant patterns. Notably, the ARIMA(1,1,1) configuration consistently outperformed more complex models across all stocks, with improvement factors ranging from 1.73x for stable stocks (KO) to an extraordinary 281.54x for highly volatile stocks (TSLA). This pattern suggests that increased model complexity may actually hinder prediction accuracy, particularly in volatile market conditions. The price volatility index, calculated as the standard deviation of daily returns, shows a strong correlation with the magnitude of improvement achieved by simpler models.
5.4. Comparative Analysis
The comprehensive comparison of all three approaches revealed unexpected patterns in prediction accuracy across different market conditions. Table 5 presents the cross-model performance analysis, incorporating both prediction accuracy metrics and market characteristic indicators. And the test prediction graphs are shown in Figure 10.
Figure 11.
Performance Comparison of three algos

The superior performance of ARIMA across all stocks challenges conventional assumptions about the relationship between model complexity and prediction accuracy. ARIMA’s consistent outperformance of both LSTM and Linear Regression suggests that traditional time series methods, when properly implemented and optimized, can capture essential price dynamics more effectively than more complex approaches.
The relationship between model performance and market characteristics reveals interesting patterns. High-volatility stocks (TSLA, NVDA) show larger absolute errors across all models, but maintain consistent relative performance patterns. The influence of trading volume on prediction accuracy varies significantly across models, with LSTM showing particular sensitivity to volume fluctuations as evidenced by the correlation analysis presented in the previous sections.
5.5. Discussion and Implications
Our experimental results challenge several fundamental assumptions in stock price prediction. The consistent superior performance of ARIMA suggests that market prediction accuracy may depend more on appropriate model selection and optimization than on model complexity. The effectiveness of reduced feature sets in Linear Regression and simpler network architectures in LSTM further supports this conclusion.
The relationship between market characteristics and model performance provides valuable insights for practical implementation. High-volatility stocks benefit most significantly from proper model selection, while stable stocks show more consistent performance across different approaches. These findings have significant implications for the design of automated trading systems, suggesting that model selection should be dynamically adjusted based on market conditions rather than following a one-size-fits-all approach.
The experimental results also highlight the importance of proper data preprocessing and model optimization. The success of our stationarity transformation in ARIMA and the impact of sequence length optimization in LSTM demonstrate that careful attention to these technical details can significantly impact prediction accuracy. These findings provide practical guidance for implementing effective stock prediction systems in real-world trading environments.
6. Visualization Implementation
The practical application of our stock prediction models is realized through a comprehensive web-based visualization system. This system integrates real-time data processing, predictive analytics, and interactive visualization components to provide users with actionable trading insights.
Our visualization framework is built upon React with Ant Design Components, offering a responsive and intuitive user interface. The system architecture emphasizes four core functionalities: trend visualization, detailed stock information display, portfolio management, and historical operation tracking. Through the integration of front-end technology and back-end services, we achieve seamless data flow and real-time updates.
6.1. System Structure
The software architecture consists of three main parts: machine learning models, front end and back end as Figure 12 shows.
The ml part contains model training and prediction using three models: Linear Regression, LSTM and ARIMA. Our stock prediction system implements a comprehensive web-based platform that enables users to analyze market trends and make informed trading decisions. The system integrates prediction results with interactive visualizations, providing an intuitive interface for market analysis and trading operations.
6.2. User Interface Design
The system’s entry point features a secure login interface, ensuring personalized access to trading functionalities. Figure 19 demonstrates the login page design,
Figure 13.
User Log in page

which balances security requirements with user accessibility. Upon authentication, users gain access to comprehensive stock analysis tools and personalized portfolio management features.
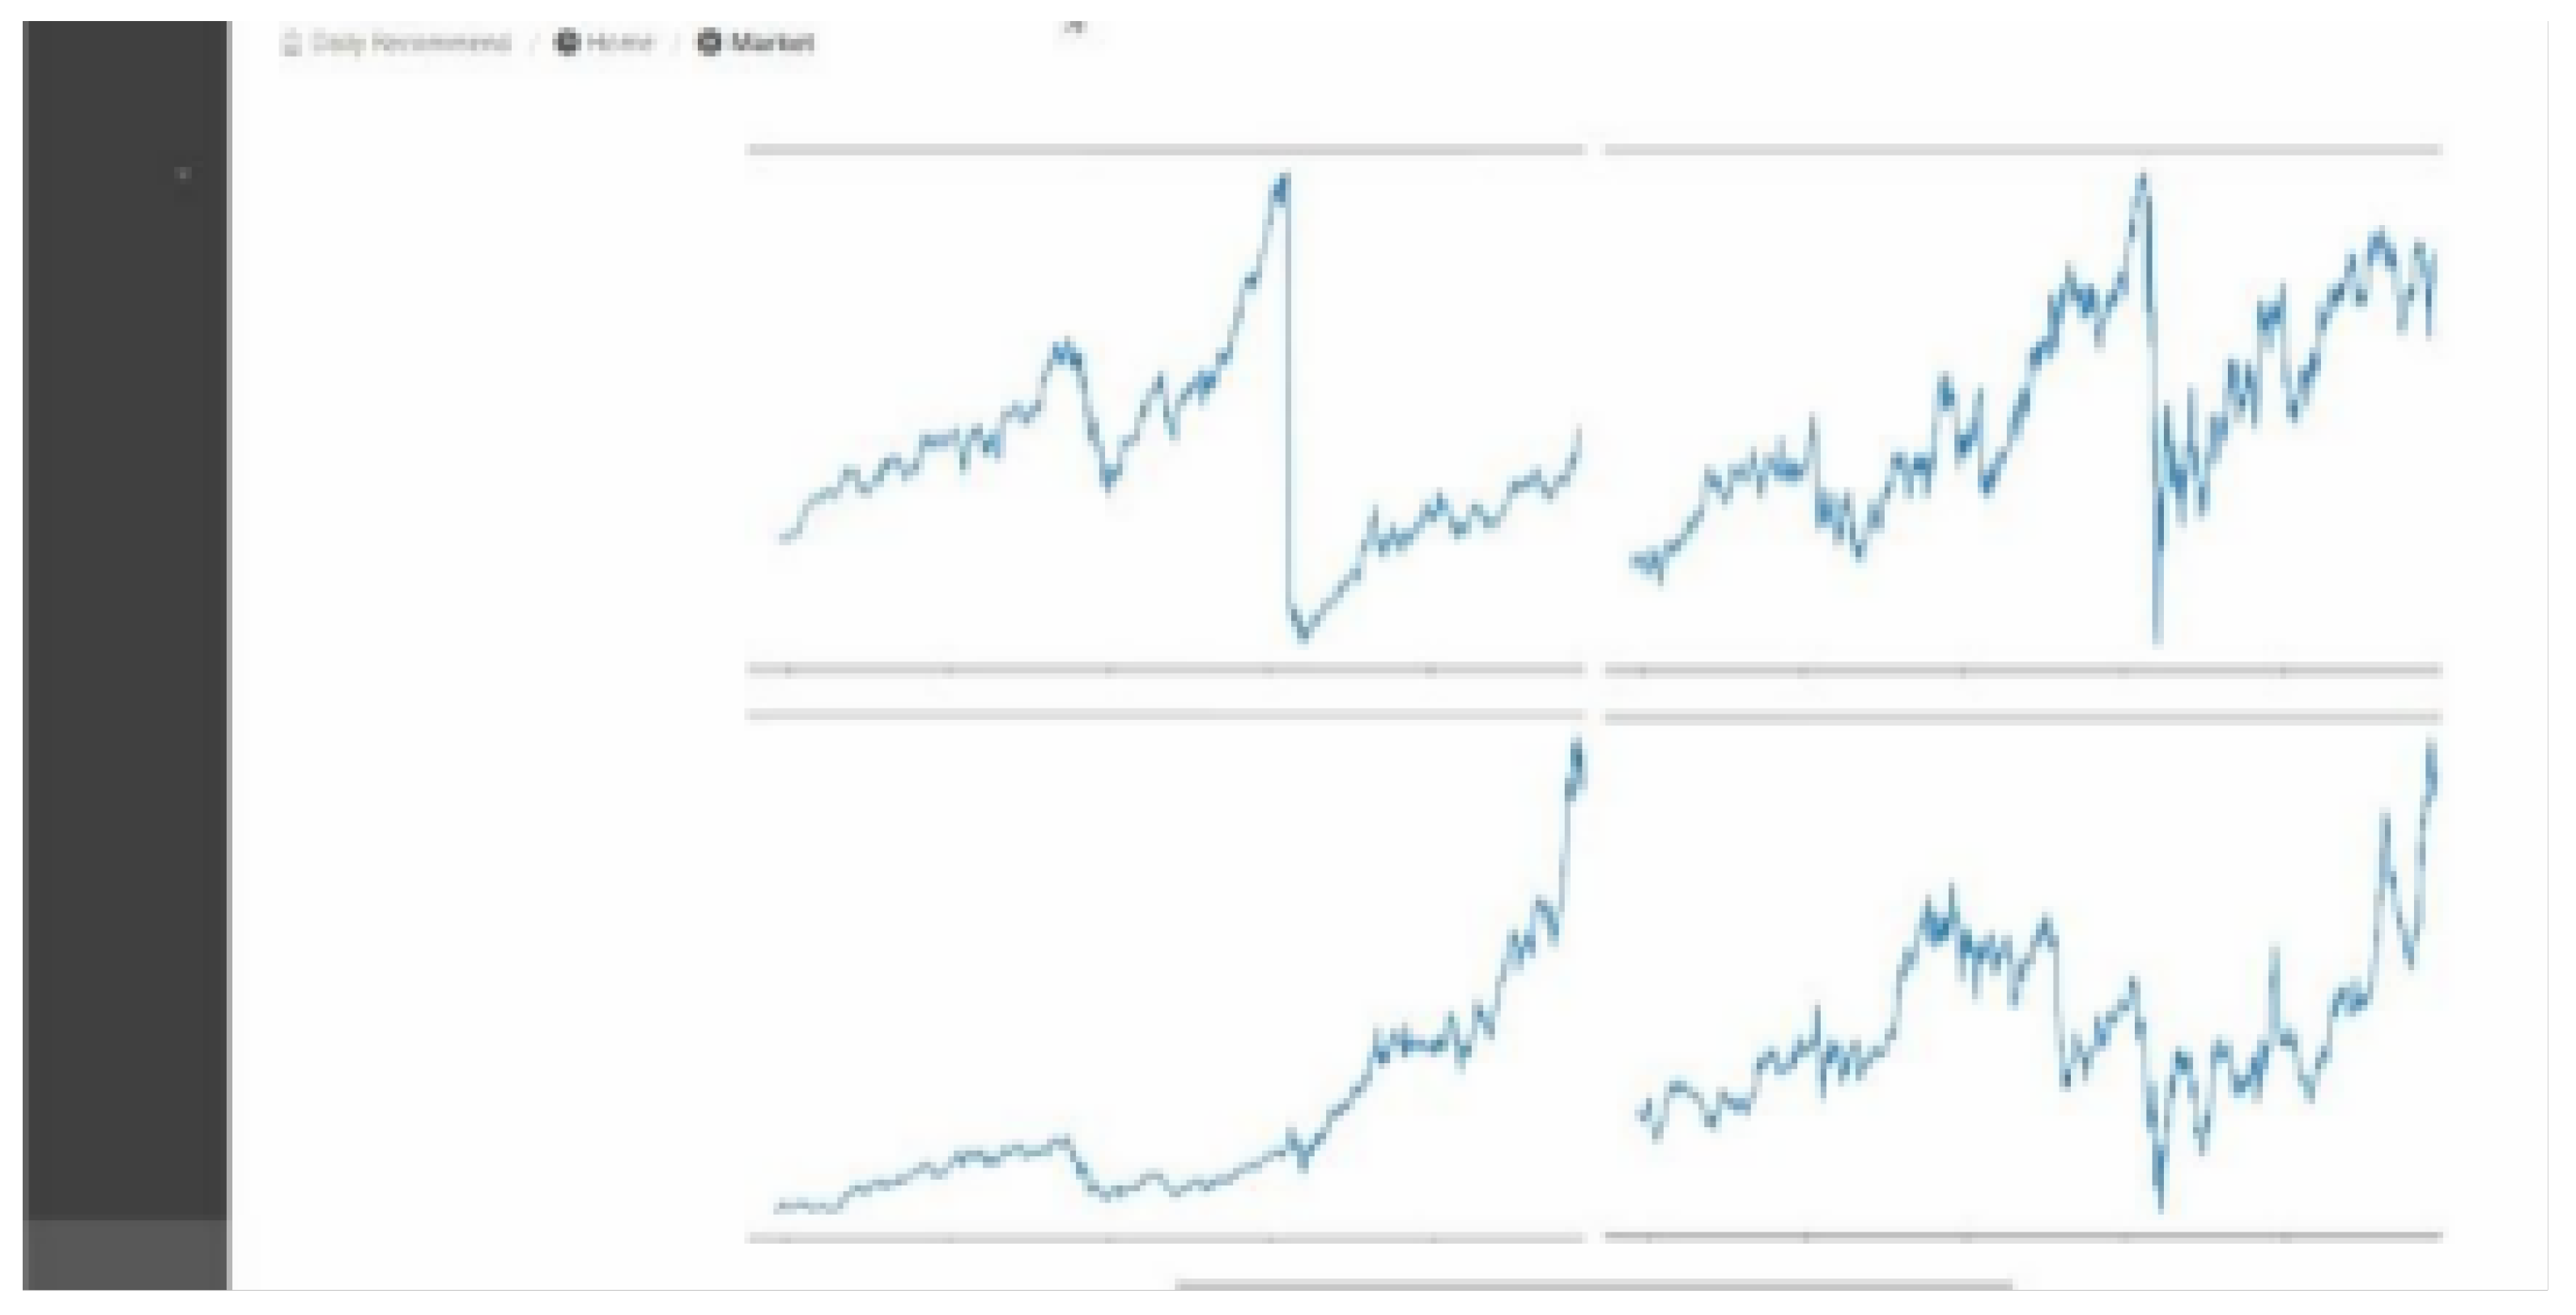
The main dashboard presents stock information through dynamic line charts, leveraging modern visualization libraries to display both historical data and prediction results. Figure 20 showcases the historical price visualization, where five-day trading periods are represented through interactive line charts. This visualization approach enables users to identify trends and patterns effectively while maintaining data clarity.
6.3. Stock Trend Visualization
The core functionality of our system lies in its dynamic visualization of stock trends and predictions. Figure 20 demonstrates the historical price visualization, where market data is presented through interactive line charts. These visualizations enable users to identify market patterns effectively while maintaining data clarity.
Figure 14.
Historical price visualization with five-day trading periods
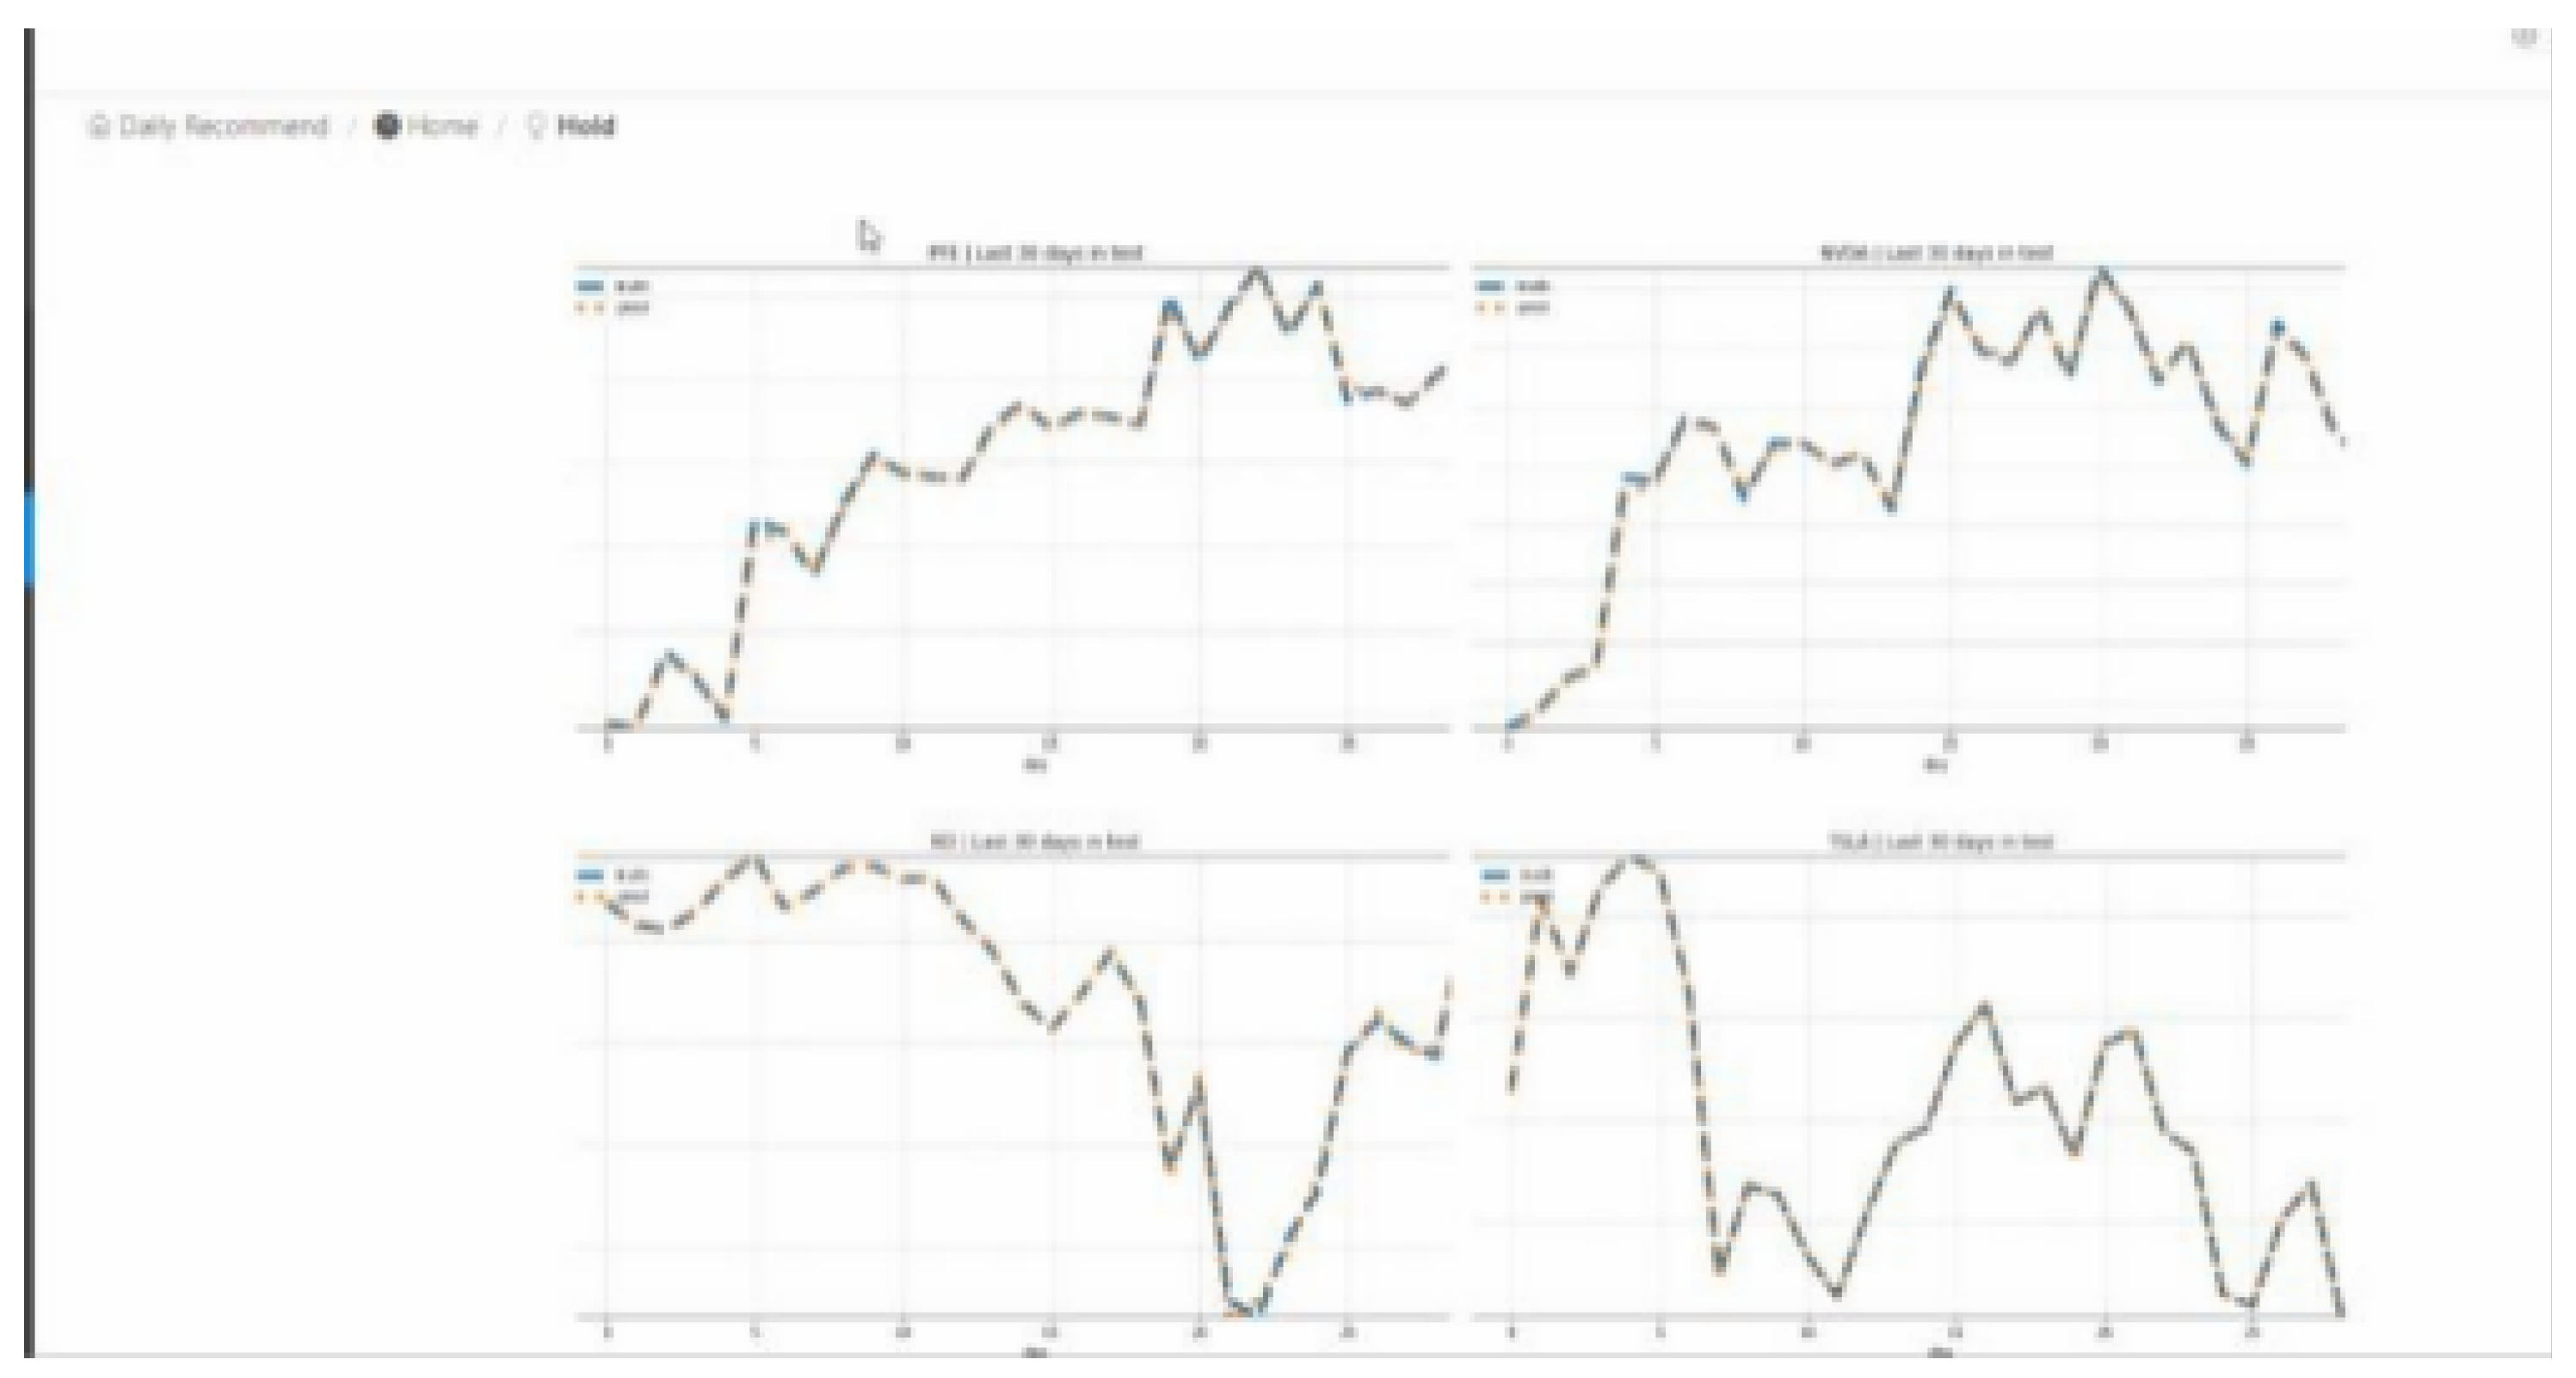
A key innovation in our visualization approach is the integration of predicted trends with historical data, as shown in Figure 21. This dual-display method allows users to compare actual market movements with predicted trends directly, facilitating more informed trading decisions. The system updates these predictions automatically every Monday, ensuring continued accuracy of the trading signals.
Figure 15.
Combined visualization of historical and predicted stock trends
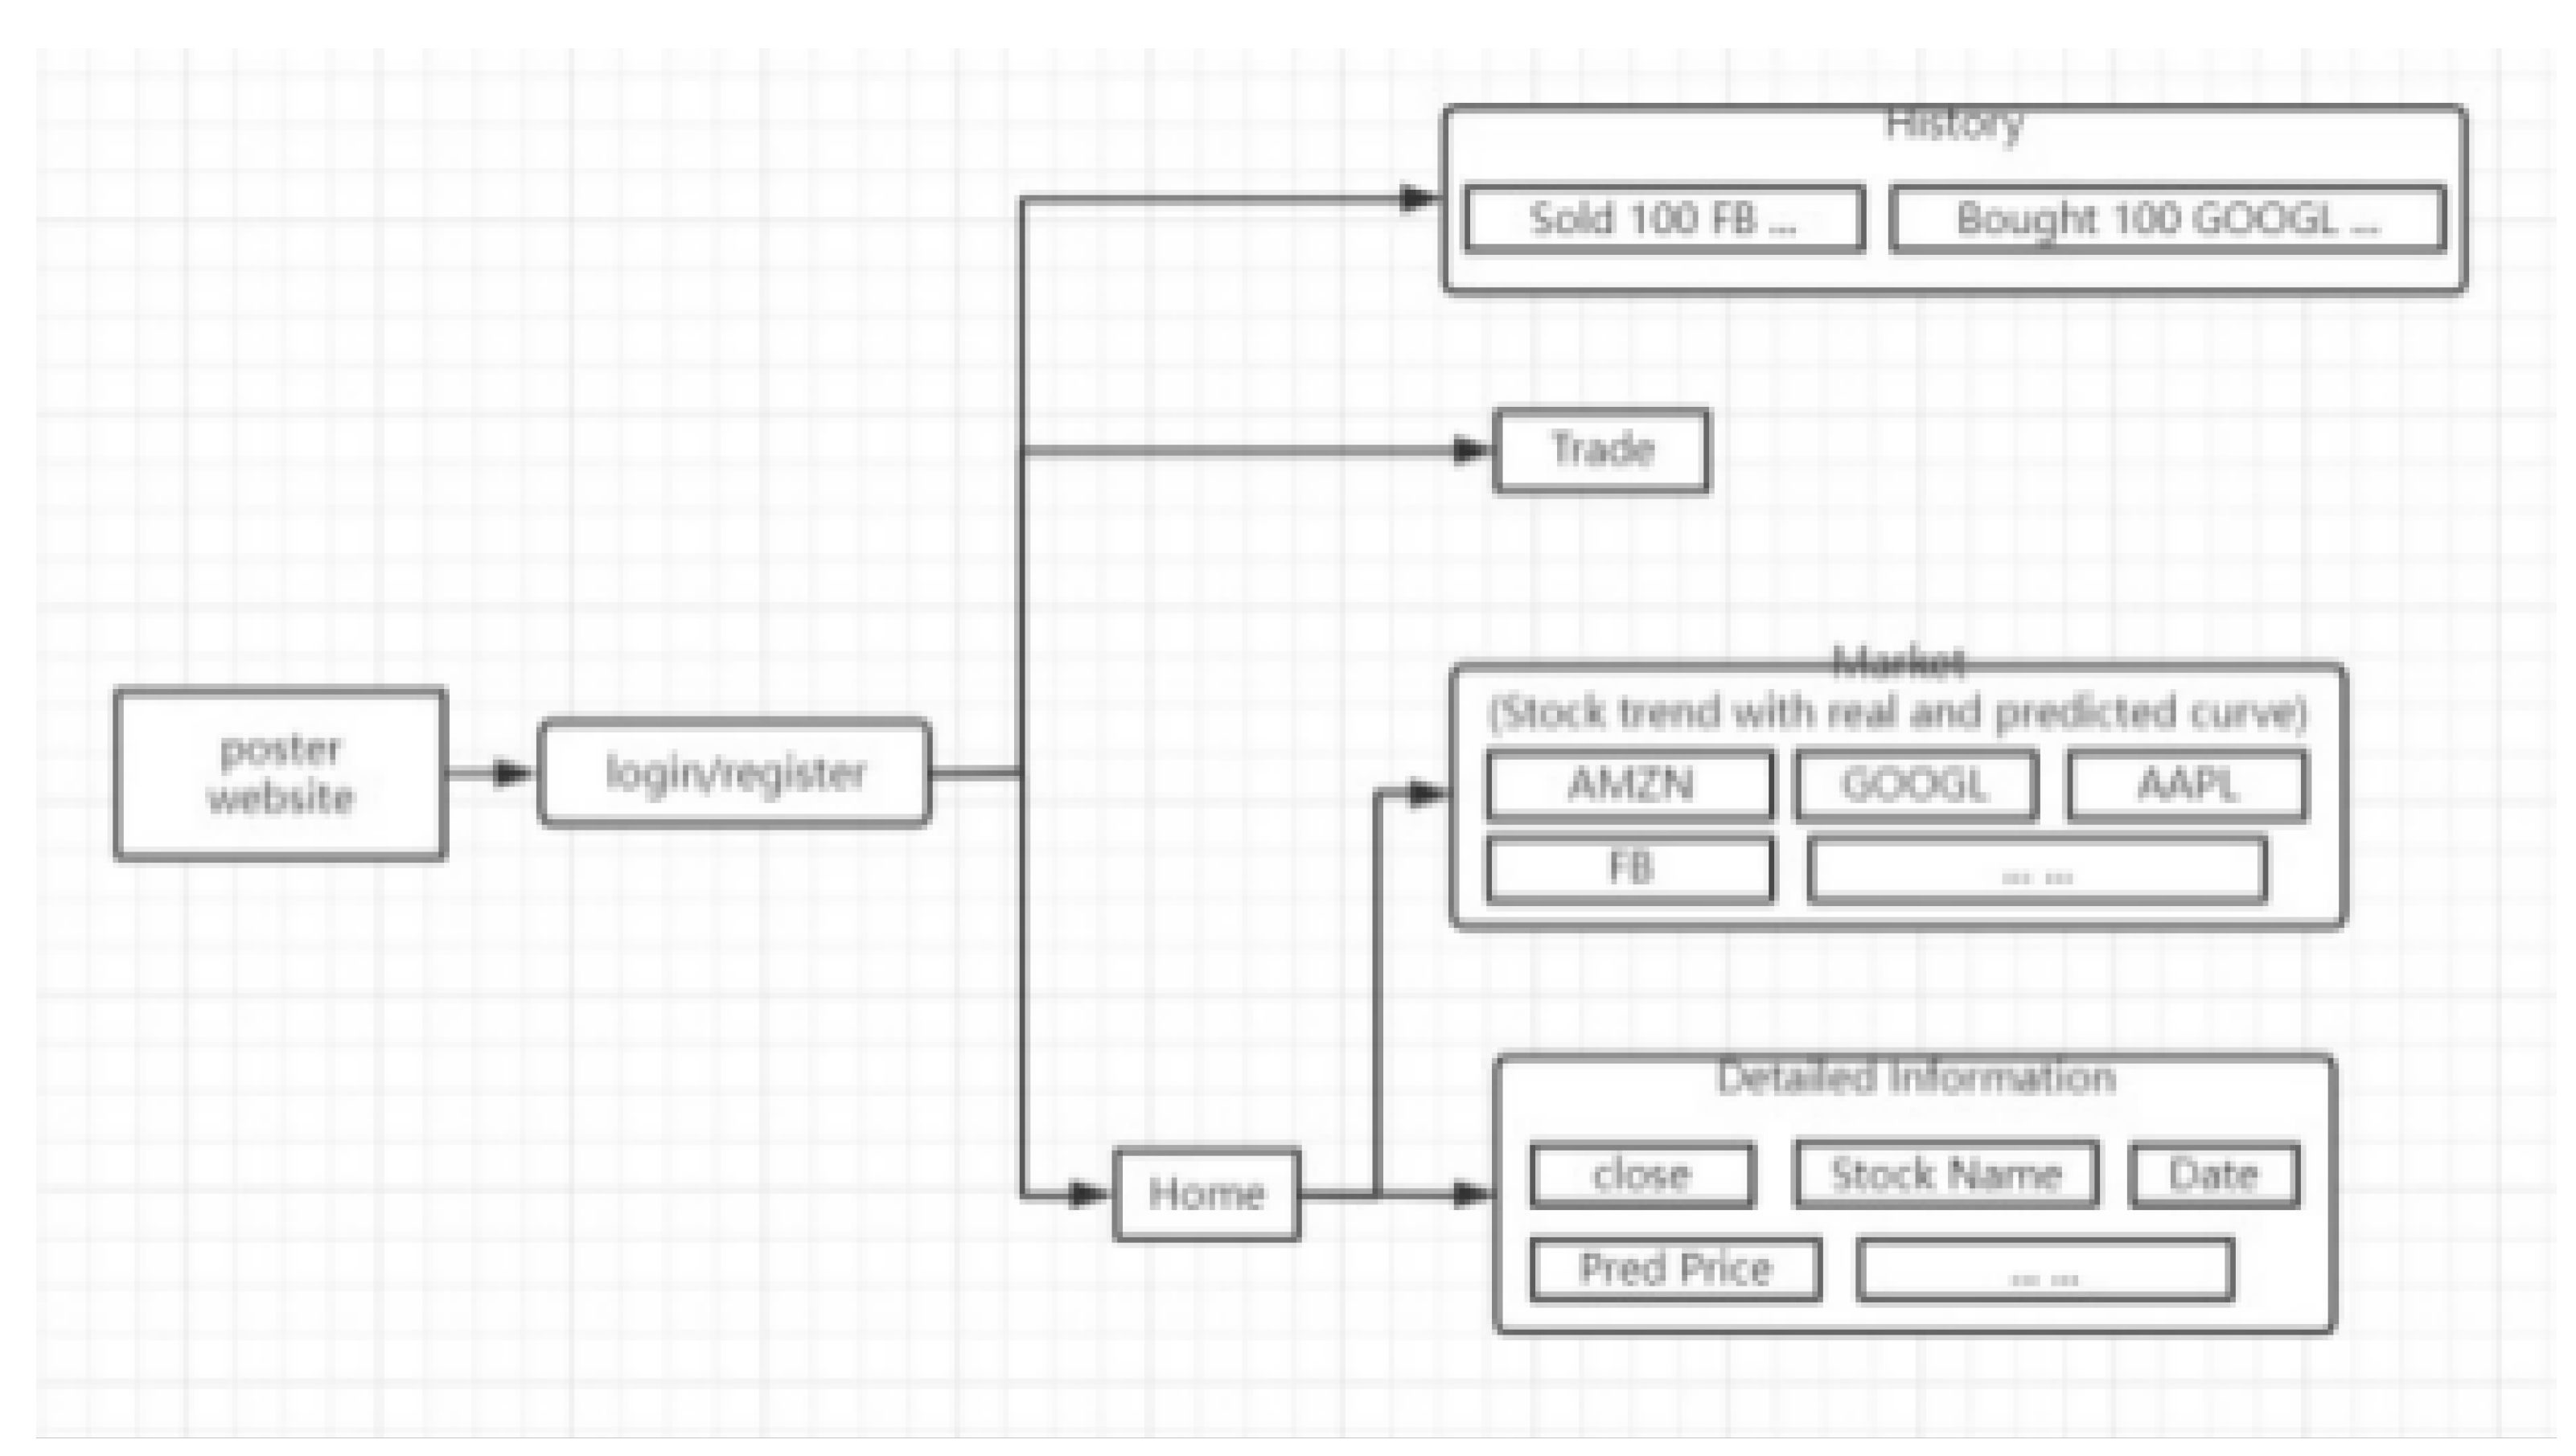
6.4. Trading Interface
The trading interface combines portfolio management capabilities with historical operation tracking. Users can monitor their current holdings and execute trades through an intuitive dashboard. The system’s structure, illustrated in Figure 22, enables seamless integration of real-time market data with user trading operations.
Figure 16.
System architecture and data flow diagram
7. Conclusion
Our research develops an integrated stock prediction system that combines machine learning models with practical trading applications. Through systematic evaluation of ARIMA, LSTM, and Linear Regression approaches, we demonstrate that ARIMA consistently achieves superior prediction accuracy across diverse market conditions. This finding challenges the common assumption that complex deep learning models necessarily provide better financial predictions, suggesting that well-optimized traditional statistical methods remain highly effective for stock price forecasting.
The implementation of our web-based trading platform demonstrates the practical value of integrated prediction systems. Our automated data processing and visualization tools provide traders with actionable insights while maintaining prediction accuracy through regular model updates. However, our analysis also reveals the inherent challenges in stock prediction, as market movements are influenced by numerous factors beyond standard price metrics, including market sentiment, external events, and broader economic indicators.
These findings suggest that future developments in stock prediction should focus on effectively incorporating diverse information sources while maintaining model reliability. As market complexity continues to increase, the balance between model sophistication and practical applicability remains crucial for developing effective trading support systems.
References
- Nicolas Huck, Pairs selection and outranking: An application to the S&P 100 index, European Journal of Operational Research, Volume 196, Issue 2, 2009, Pages 819-825, ISSN 0377-2217. [CrossRef]
- Hochreiter S, Schmidhuber J. Long short-term memory. Neural Comput. 1997 Nov 15;9(8):1735-80. [CrossRef] [PubMed]
- Box, G. E. P., & Jenkins, G. M. (1976). Time series analysis: Forecasting and control. San Francisco: Holden-Day.
- Weiwei Jiang, Applications of deep learning in stock market prediction: Recent progress, Expert Systems with Applications, Volume 184, 2021, 115537, ISSN 0957-4174,. [CrossRef]
- S. Siami-Namini, N. Tavakoli and A. Siami Namin, "A Comparison of ARIMA and LSTM in Forecasting Time Series," 2018 17th IEEE International Conference on Machine Learning and Applications (ICMLA), 2018, pp. 1394-1401. [CrossRef]
- L. Cheng, Y. Huang and M. Wu, "Applied attention-based LSTM neural networks in stock prediction," 2018 IEEE International Conference on Big Data (Big Data), 2018, pp. 4716-4718. [CrossRef]
- Chen, Shun, and Lei Ge. "Exploring the attention mechanism in LSTM-based Hong Kong stock price movement prediction." Quantitative Finance 19.9 (2019): 1507-1515.
- L. Chen, Y. Chi, Y. Guan and J. Fan, "A Hybrid Attention-Based EMD-LSTM Model for Financial Time Series Prediction," 2019 2nd International Conference on Artificial Intelligence and Big Data (ICAIBD), 2019, pp. 113-118. [CrossRef]
- Yan, H., Ouyang, H. Financial Time Series Prediction Based on Deep Learning. Wireless Pers Commun 102, 683–700 (2018). [CrossRef]
- Yaowei Wang, Qing Li, Zhexue Huang, and Junjie Li. 2019. EAN: Event Attention Network for Stock Price Trend Prediction based on Sentimental Embedding. In Proceedings of the 10th ACM Conference on Web Science (WebSci ’19). Association for Computing Machinery, New York, NY, USA, 311–320. DOI:. [CrossRef]
- Wen Long, Zhichen Lu, Lingxiao Cui, Deep learning-based feature engineering for stock price movement prediction, Knowledge-Based Systems, Volume 164, 2019, Pages 163-173, ISSN 0950-7051,. [CrossRef]
- Greff, Klaus, et al. "LSTM: A search space odyssey." IEEE transactions on neural networks and learning systems 28.10 (2016): 2222-2232.
- Baltagi, Badi H., ed. A companion to theoretical econometrics. John Wiley & Sons, 2008.
Figure 1.
RNN with one layer
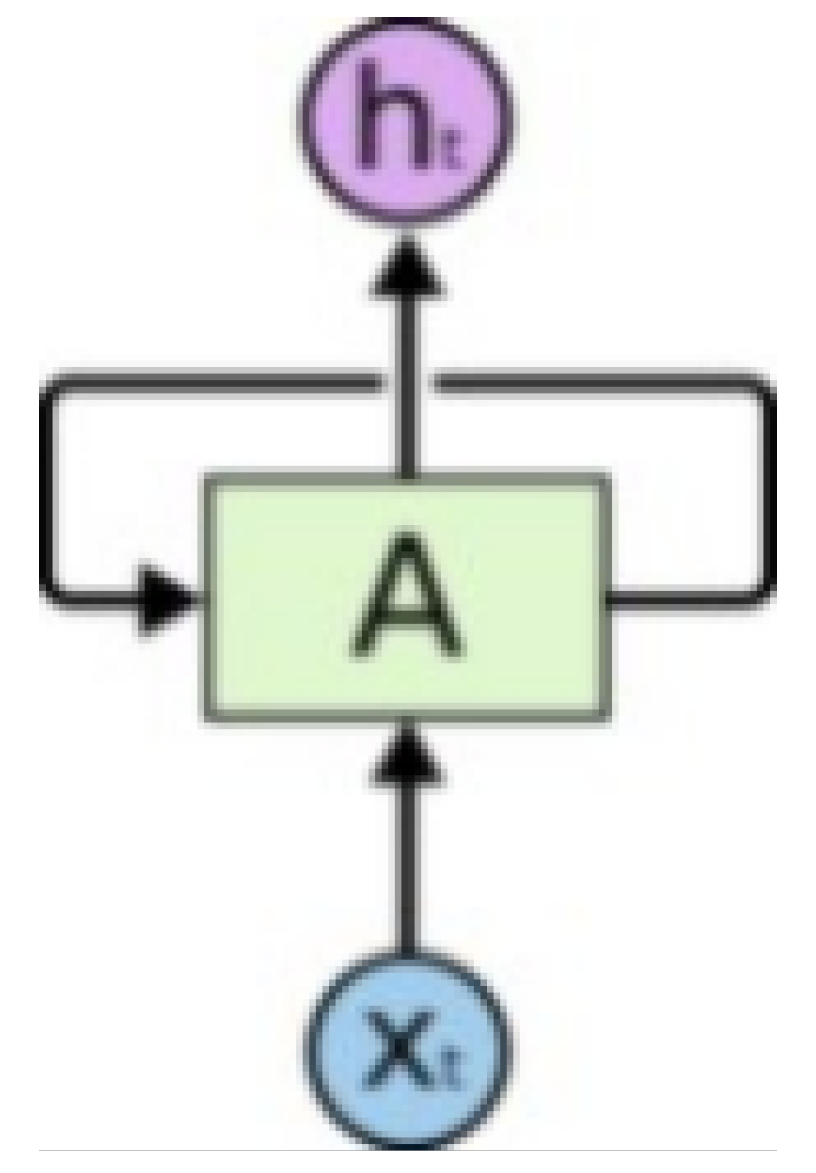
Figure 12.
System Structure
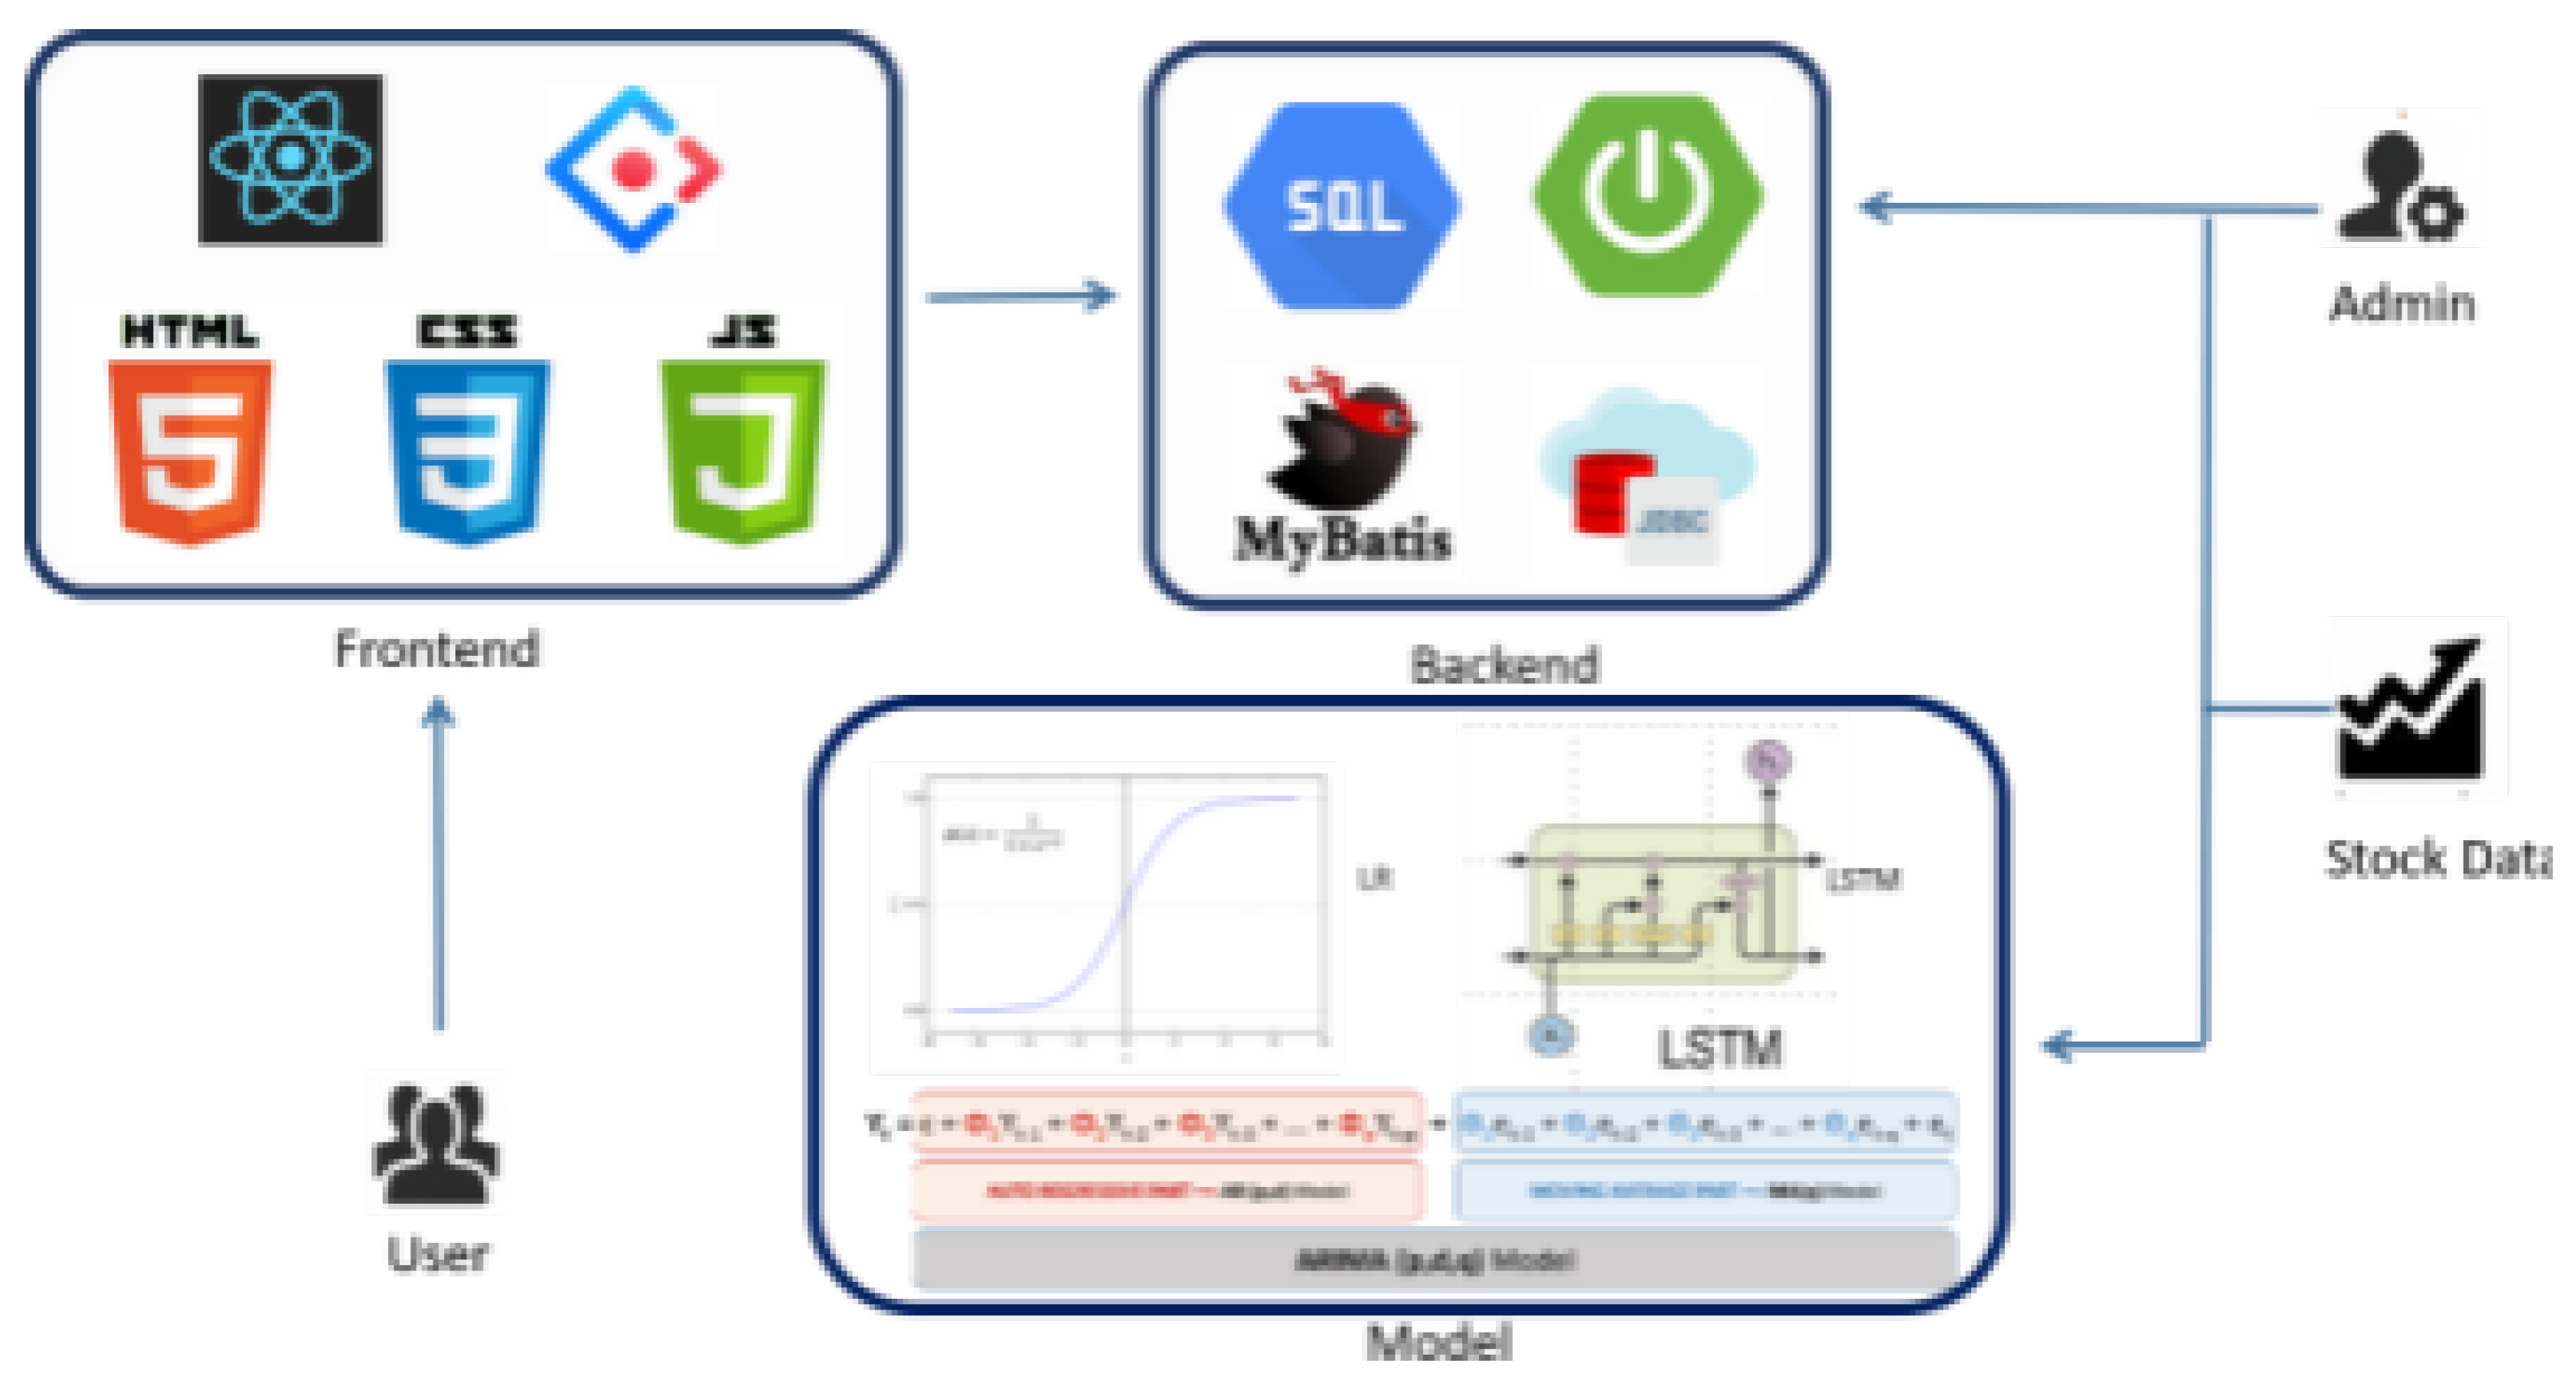

Table 1.
Linear Regression Performance Analysis
| Stock | All Attributes MSE | Close Price MSE | Range-Normalized Improvement | Trading Volume Range |
|---|---|---|---|---|
| AAPL | 63.150 | 40.243 | 36.27% | 2.5M-8.9M |
| KO | 2.722 | 2.717 | 0.18% | 0.8M-2.1M |
| NVDA | 625.501 | 602.997 | 13.60% | 1.2M-5.4M |
| PFE | 8.727 | 9.464 | -8.45% | 1.5M-4.2M |
| TSLA | 18432.795 | 17195.716 | 6.71% | 3.2M-12.5M |
Table 2.
LSTM Performance Across Network Configurations
| Stock | LSTM-64 MSE | LSTM-128 MSE | LSTM-256 MSE | Trading Volume Range |
|---|---|---|---|---|
| AAPL | 5.349 | 8.198 | 9.168 | 0.82 |
| KO | 0.179 | 0.117 | 1.179 | 0.31 |
| NVDA | 20.250 | 29.444 | 48.793 | 0.89 |
| PFE | 0.748 | 0.882 | 1.192 | 0.54 |
| TSLA | 741.964 | 744.730 | 1131.923 | 0.93 |
Table 3.
LSTM Performance Across Network Configurations
| Stock | Steps=20 MSE | Steps=25 MSE | Steps=30 MSE | Optimal Configuration |
|---|---|---|---|---|
| AAPL | 7.236 | 8.193 | 8.198 | 20 |
| KO | 0.186 | 0.176 | 1.117 | 30 |
| NVDA | 39.688 | 16.504 | 29.444 | 25 |
| PFE | 0.869 | 0.931 | 0.882 | 20 |
| TSLA | 653.083 | 1004.143 | 744.73 | 25 |
Table 4.
ARIMA Parameter Configuration Analysis
| Stock | ARIMA(1,1,1) MSE | ARIMA(2,1,2) MSE | Improvement Factor | Price Volatility Index |
|---|---|---|---|---|
| AAPL | 0.0004 | 0.002 | 5.19x | 0.42 |
| KO | 0.004 | 0.008 | 1.73x | 0.18 |
| NVDA | 1.210 | 6.866 | 5.67x | 0.56 |
| PFE | 0.024 | 0.032 | 1.33x | 0.24 |
| TSLA | 0.172 | 48.672 | 281.54x | 0.89 |
Table 5.
Cross-Model Performance Comparison
| Stock | LR MSE | ARIMA MSE | LSTM MSE |
|---|---|---|---|
| AAPL | 40.243 | 0.0004 | 5.349 |
| KO | 2.717 | 0.004 | 0.117 |
| NVDA | 602.997 | 1.210 | 16.504 |
| PFE | 9.464 | 0.024 | 0.748 |
| TSLA | 17195.716 | 0.172 | 653.038 |
Disclaimer/Publisher’s Note: The statements, opinions and data contained in all publications are solely those of the individual author(s) and contributor(s) and not of MDPI and/or the editor(s). MDPI and/or the editor(s) disclaim responsibility for any injury to people or property resulting from any ideas, methods, instructions or products referred to in the content. |
© 2025 by the authors. Licensee MDPI, Basel, Switzerland. This article is an open access article distributed under the terms and conditions of the Creative Commons Attribution (CC BY) license (http://creativecommons.org/licenses/by/4.0/).
Copyright: This open access article is published under a Creative Commons CC BY 4.0 license, which permit the free download, distribution, and reuse, provided that the author and preprint are cited in any reuse.


