
Submitted:
11 January 2025
Posted:
14 January 2025
You are already at the latest version
Abstract
Background: Venous thromboembolism (VTE) is a common chronic disease with a considerable risk of recurrence, and early screening for VTE risk assessment and comprehensive data decision-making analyses can reduce its incidence and harm to a certain extent. We proposed a clustering model based on multi-view learning for VTE incidence risk prediction. Methods: This is a retrospective study of 15,856 orthopedic surgical patients who met the diagnosis in a hospital information system between 1992-2017. The risk of developing venous thromboembolism was analyzed and predicted from multiple views using multi-view learning to improve the accuracy of disease prediction. Results: Five multi-view clustering algorithms were selected as comparison algorithms and the performance of these models was evaluated using metrics such as accuracy, purity, and F-score. After comparing the ACC values for each algorithm, it was found that the proposed algorithm had a significantly higher ACC value (0.9172) than the other comparison algorithms (0.6481, 0.6242, 0.7740, 0.8306, and 0.7844, respectively). Conclusions: The proposed algorithm has high effectiveness for VTE risk prediction. The model can assist healthcare professionals to improve the accuracy and timeliness of VTE risk assessment and identify the risk of VTE in patients as early as possible.
Keywords:
Venous thromboembolism
; Multi-view Clustering
; Anchors
; Subspace Clustering
1. Introduction
Venous thromboembolism (VTE) [1] is a potentially fatal disease due to the formation of deep venous thrombosis, which causes blood return obstruction in the corresponding vessels and a series of related pathophysiological changes, including deep venous thrombosis (DVT) and pulmonary embolism (PE), among cardiovascular-related diseases, VTE is the third leading cause of death in cardiovascular-related diseases after acute myocardial infarction and cerebral infarction [2,3], with a high incidence and insidiousness. embolism (PE). Among cardiovascular-related diseases, VTE is the third cause of death in cardiovascular-related diseases after acute myocardial infarction and cerebral infarction, with high incidence and insidiousness. Currently, VTE has become a preventable global public health problem of continuous growth [4]. VTE is a very insidious disease with a very high rate of sudden death [5,6]. Trauma patients with increased blood viscosity, in a state of hypercoagulable state, with damage to the endothelium of the blood vessels, and most of the fractured limbs need to be braked, coupled with trauma caused by the surgery [7,8,9,10], is an extremely high-risk group for VTE. In addition, the pathogenesis of VTE is complex and the early clinical manifestations have no obvious specificity, and even with effective treatment, it can lead to post-thrombotic syndrome (PTS), which affects the quality of life of patients. If the early completion of VTE risk assessment screening, even if the risk stratification and intervention, can reduce its incidence and harm to a certain extent.
The rapid development of electronic health records (EHR) and healthcare informatics has allowed the complete storage of large numbers of cases, thus becoming an important tool for use in data-driven systems for clinical risk prediction, especially for complication risk analysis. The large amount of real-world data creates unprecedented opportunities for applying machine learning and data mining methods for clinical risk prediction by extracting hidden information from large amounts of data used to aid in the diagnosis and prediction of many diseases, including VTE. But a patient is often represented by different view data, and the traditional approach of data mining methods for such data is either to learn by splicing all the view data, or to learn between individual views. However, learning from a single view ignores the interactions between features in different views, and similarly ignores the structural information of the data, which leads to much less effective predictions in the real world. On the other hand, when integrating all views, the differences between views and the interconnections between features also affect feature selection and effect evaluation. For multi-view data, the main difference between single-view learning and multi-view learning [11,12] is that single-view learning methods process combined features from multi-view data and treat them as a single source data, failing to take advantage of the underlying correlations between different views. Multi-view learning methods construct models directly from multi-view data and consider consensus and complementary information. In order to solve the above problems, this paper chooses to adopt multi-view learning as a way to deal with multi-view data with different scales and representations, and is committed to fully consider the correlations between views as well as between features, so as to achieve more accurate disease prediction.
Multi-view learning [13,14,15,16] has been widely used to integrate different medical images, multi-omics data and multi-view medical data, etc. It avoids incomplete information learning due to high dimensionality and heterogeneous multi-view data, and can use consensus and complementary information between views to describe the data in a more complete and comprehensive way, thus improving model clustering performance. For example, it can integrate data from different medical tests to improve the ability to assess a patient’s condition and treatment outcomes. The application of multi-view learning in the field of medicine provides doctors with more comprehensive and accurate information, which helps to improve medical diagnosis and treatment, and is of great significance in improving the quality and efficiency of medical care.
In this paper, we propose a multi-view clustering algorithm based on anchors to obtain an effective description of the original data by selecting specific anchors learnt from different views, thus reducing the complexity of the model and ensuring that the diversity and flexibility of the data distribution is maintained during the model learning process, which in turn improves the clustering performance.
The remained of the paper is organized as follows: Section II describes related work. Section III details the framework of the paper’s methodology. Section IV presents experimental results on VTE data, and Section V concludes the paper.
2. Materials and Methods
2.1. VTE Datasets and Data Preprocessing
2.1.1. VTE Datasets
The data studied in this paper was obtained from the orthopedic department of a hospital and the data is authentic. The occurrence of venous thromboembolism is closely related to the patient’s ethnic background and history of previous illness. Data from the hospital information system were retrospectively collected from December 1992 to November 2017, and the ICD-10 disease codes of the relevant diseases were used as search terms to select orthopedic surgical patients who met the diagnosis of a total of 15,856 patients, of which 15,328 cases were not suffering from thrombosis in the hospital, and 528 cases were suffering from thrombosis in the hospital, and there were a total of 306 attributes for each case, which included the patient’s family attributes as well as all the attributes about the venous thrombotic disease physical examination indicators and prevalence data.
2.1.2. Data Preprocessing
The data used are real sampling data, in the hospital data entry of patients, it is unavoidable that there will be wrong recording, under-recording and so on. For the database of data incompleteness, data inconsistency, data redundancy and data lack of digital features and other issues, pre-processing:
- Fill in the missing values: if the data value of an attribute ≥ 3 kinds (i.e., non-simple 0 and 1), fill in the mean value; if an attribute of the data value of only 0 and 1, the missing value of the missing value of 0 to make up for the full.
- Conflict data processing: whether the tourniquet is used subject to the time of use; when the operation time is 0, the mean value of the column is used instead; subtype variables 0 and 1, if the thrombosis patients 0 more than all fill in 0, if 1 more than all fill in 1; continuity variables, according to the patient’s average value of this column is filled in, suffering from thrombosis with the thrombosis patients with the average value of the filling in, not suffering from thrombosis with the non-thrombosis patients with the average value of the filling in.
- Generate new data: Difference calculation for date of injury, date of hospitalization and date of surgery to generate two new columns of data; when the proportion of the same data in a single column is <1%, the data in that column will be processed in a discrete manner; columns with Chinese character types are replaced with numerical values.
- Delete useless attributes: data that have nothing to do with whether the patient generates thrombus, such as cost, entry physician, etc.; check by column data, 10% of the total number of rows of data is empty, delete the column; check by row data, 10% of the total number of columns of data is empty, delete the row; observe the label value and content of each column, delete columns of data with similar or the same actual content; retain only the presence of disease in the coexisting disease, delete the specific information field of the disease; delete the direct cause of death. Delete the direct cause of death; when 70 percent or more of the data in a column have missing values, select Delete.
2.2. Views Dividing
In order to more comprehensively consider the information required for the prediction of thrombotic diseases, we divide the VTE dataset into five views based on its characteristic information, namely, basic patient information, first measurement results, last measurement results, first measurement results after surgery and first measurement results 48 hours before hospitalization. Among them, the basic patient information includes the patient’s age, gender, height, weight, disease history, etc.; the first measurement results include the patient’s results at the time of the first thrombosis-related test, including various blood indexes, coagulation function, etc.; the last measurement results refer to the patient’s results at the time of the last thrombosis-related test, which can reflect the changes in the course of the treatment process; and the first measurement results in the postoperative period refer to the patient’s results at the time of the first thrombosis-related test after the surgery. The results of the first postoperative thrombosis-related test are the results of the first postoperative thrombosis-related test, reflecting the effect of surgery on the patient’s blood condition; the results of the first measurement 48 hours before hospitalization are the results of the first thrombosis-related test 48 hours before hospitalization, reflecting the patient’s blood condition before admission. By observing the basic information of patients from different views, the measurement results at different time points, etc., the characteristics and changes related to thrombotic disorders of patients can be better captured, thus improving the accuracy and reliability of prediction.
2.3. The Proposed method
In Multi-View Clustering methods, Multi-View Subspace Clustering (MVSC) represents data from different views as subspaces and tries to find shared cluster structures in these subspaces. The key step is to construct a similarity map between the samples, which helps to determine the relationship between the samples and guides the execution of the clustering algorithm. However, the time and space costs of the construction process limit the scalability of multi-view subspace clustering. To overcome this problem, an anchor-based multi-view clustering algorithm is designed. The similarity relationship between instances is constructed by choosing a set of anchors for different views that is much smaller than the number of samples, which in turn constructs an anchor graph with a scale much smaller than the original association graph, effectively reducing the complexity of clustering.
The focus of the algorithm design is anchor selection. To avoid that the separation of anchor learning and anchor graph construction cannot effectively guide the clustering process, and ensure the diversity and stability of the learning, the proposed algorithm integrates the anchor selection with the anchor graph construction process, which facilitates the effective convergence of the clustering algorithm. At the same time, corresponding anchors are generated for each independent view to learn the consensus anchor graph.
The objective function is constructed as follows:
2.4. Optimization
To solve the above optimization problem, we use an alternating algorithm to optimize each variable, i.e., one variable is optimized with the other variables fixed. Algorithm 1 shows the entire optimization process for solving the objective function.
| Multi-view datasets , the number of views c and the number of cluster k. |
| 1: Initialize , , with zero matrix, |
| 2: not converge |
| 3: Fixed , , , then is updated by singular value decomposition of . |
| 4: Fixed , , , then is updated by singular value decomposition of . |
| 5: Fixed , , , then is updated by solving for, where . |
| 6: Fixed , , , then is updated by , where , . |
| 7: |
| 8: Obtain the left singular vector U by performing SVD on Z. |
| Perform k-means on U to obtain the final results. |
2.5. Datasets
In this paper, the proposed method is evaluated using the VTE dataset, the details of the dataset are shown in Table 2 below:
2.6. Evaluation Metrics
In this paper, we will use metrics such as Accuracy (ACC), Purity (Purity), and F-score to evaluate the performance of the model. Accuracy can help to understand the model is able to correctly assign samples to their view clusters. Purity, on the other hand, can help assess whether each cluster contains samples of the same class, thus revealing the model’s clustering effectiveness for each cluster. F-value can provide a more comprehensive assessment of the clustering effectiveness on data from different views. Through the comprehensive analysis of these metrics, the performance of the multi-view clustering model in thrombus data prediction can be better assessed, thus improving the accuracy of disease prediction.
2.7. Compared Algorithms
To validate our method, five multi-view clustering algorithms were selected as comparison algorithms, namely LMVSC [17], FPMVS-CAG [18], FMVACC [19], and FDAGF [20]. FMVACC(unaligned) indicates that the anchor alignment module is not used, and FMVACC(aligned) indicates that the anchor alignment module is used.
2.8. Experimental Setup
In this paper, , , are initialized as zero matrices, selected from { k, 2k, 3k, 5k, 7k} for the number of anchors m, and the common dimension is set to k.
3. Results
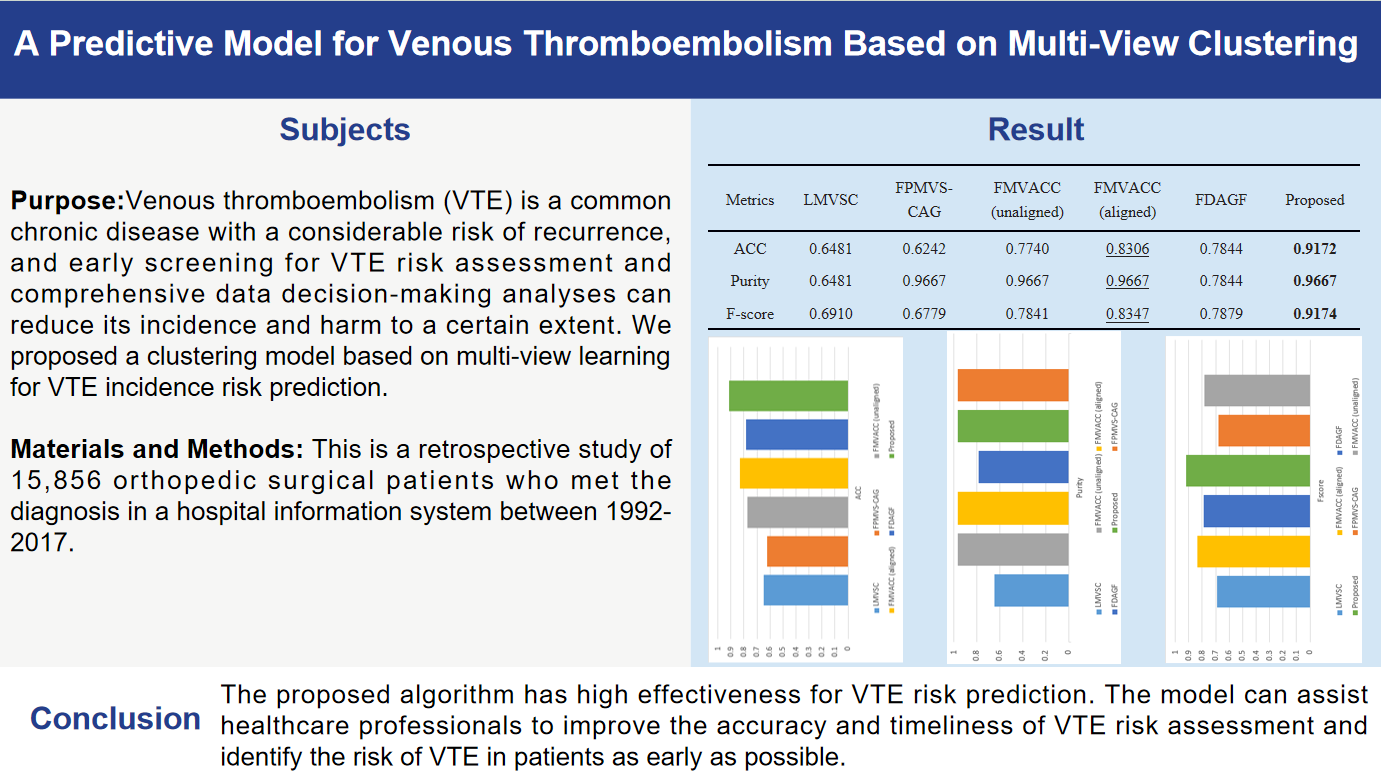
Figure 1 and Table 3 show the ACC, F-score, and Purity performance results for each method on the VTE dataset, respectively, where the optimal results are marked in bold and the sub-optimal results are underlined. Based on the clustering results, it can be seen: Comparing with other multi-view clustering methods, our method achieves the optimal or sub-optimal indexes on the VTE dataset, and obtains ideal clustering effect and high accuracy, which indicates that the proposed algorithm has good effect for VTE risk prediction.
4. Conclusions
In this paper, we propose a multi-view clustering algorithm based on anchors, which is a model that describes a patient’s venous thrombosis disease using the patient’s family data provided by the hospital as well as all the physical examination indexes and disease data about the venous thrombosis disease. The raw data are divided into multiple views, and anchors are used to capture the correlation between the features, effectively extracting meaningful information from different feature views. The experimental results show that for the task of VTE risk clustering prediction, our proposed model has an ideal clustering effect, due to some excellent multi-view clustering models proposed in recent years. It can effectively assist healthcare professionals in VTE risk assessment, prompting and identifying the risk of the disease in time. It is worth mentioning that, unlike common machine learning disease prediction models, this paper is oriented to multiple views to achieve disease risk clustering prediction and obtain a high accuracy rate, which provides new ideas and methods for machine learning methods to serve medical assisted decision-making.
Author Contributions
Conceptualization, Methodology, Validation, Formal analysis, Investigation, Resources, Data curation, Writing—original draft, Writing—review and editing, Visualization, Supervision, Project administration, B.L. All authors have read and agreed to the published version of the manuscript.
Funding
This research received no external funding.
Institutional Review Board Statement
Not applicable.
Informed Consent Statement
Not applicable.
Conflicts of Interest
The authors declare no conflicts of interest.
References
- Khan F, Tritschler T, Kahn S R, et al. Venous thromboembolism. The lancet 2021, 398, 64–77.
- Wendelboe A M, Raskob G E. Global burden of thrombosis: epidemiologic aspects. Circulation research 2016, 118, 1340–1347. [CrossRef] [PubMed]
- Sogaard KK, Schmidt M, Pedersen L, et al. 30-year mortality after venous thromboembolism: a population-based cohort study. Circulation 2014, 130, 829–836. [CrossRef] [PubMed]
- Bell E J, Lutsey P L, Basu S, et al. Lifetime risk of venous thromboembolism in two cohort studies. The American journal of medicine 2016, 129, 339. e19-339. e26.
- Heit J A, Spencer F A, White R H. The epidemiology of venous thromboembolism. Journal of thrombosis and thrombolysis 2016, 41, 3–14. [CrossRef] [PubMed]
- Zöller B, Pirouzifard M N, Svensson P J, et al. Familial segregation of venous thromboembolism in Sweden: a Nationwide family study of heritability and complex segregation analysis. Journal of the American Heart Association 2021, 10, e020323. [CrossRef] [PubMed]
- Lung B E, Kanjiya S, Bisogno M, et al. Risk factors for venous thromboembolism in total shoulder arthroplasty. JSES Open Access 2019, 3, 183–188. [CrossRef] [PubMed]
- Hereford T, Thrush C, Kimbrough M K. Using injury severity score and abbreviated injury score to determine venous thromboembolism risk. Cureus 2019, 11.
- Kaewborisutsakul A, Tunthanathip T, Yuwakosol P, et al. Postoperative venous thromboembolism in extramedullary spinal tumors. Asian Journal of Neurosurgery 2020, 15, 51–58. [CrossRef] [PubMed]
- Kunutsor S K, Barrett M C, Whitehouse M R, et al. Venous thromboembolism following 672,495 primary total shoulder and elbow replacements: meta-analyses of incidence, temporal trends and potential risk factors. Thrombosis Research 2020, 189, 13–23. [CrossRef] [PubMed]
- Sun, S. A survey of multi-view machine learning. Neural computing and applications 2013, 23, 2031–2038. [Google Scholar] [CrossRef]
- Li Y, Yang M, Zhang Z. A survey of multi-view representation learning. IEEE transactions on knowledge and data engineering 2018, 31, 1863–1883.
- Pham T H, Yin C, Mehta L, et al. Cardiac complication risk profiling for cancer survivors via multi-view multi-task learning. In 2021 IEEE International Conference on Data Mining (ICDM). IEEE 2021, 499–508.
- Hu P, Li X, Lu N, et al. Prediction of new-onset diabetes after pancreatectomy with subspace clustering based multi-view feature selection. IEEE Journal of Biomedical and Health Informatics 2023, 27, 1588–1599. [CrossRef] [PubMed]
- Wang Z, Li R, Wang J, et al. An efficient multi-view and multi-channel disease risk prediction model. In 2023 International Conference on Cyber-Physical Social Intelligence (ICCSI). IEEE 2023, 144–149.
- Cao P, Gao J, Zhang Z. Multi-view based multi-model learning for MCI diagnosis. Brain Sciences 2020, 10, 181. [CrossRef] [PubMed]
- Kang Z, Zhou W, Zhao Z, et al. Large-scale multi-view subspace clustering in linear time. In Proceedings of the AAAI conference on artificial intelligence. 2020, 34(04): 4412-4419.
- Wang S, Liu X, Zhu X, et al. Fast parameter-free multi-view subspace clustering with consensus anchor guidance. IEEE Transactions on Image Processing 2021, 31, 556–568.
- Wang S, Liu X, Liu S, et al. Align then fusion: Generalized large-scale multi-view clustering with anchor matching correspondences. Advances in Neural Information Processing Systems 2022, 35, 5882–5895.
- Zhang P, Wang S, Li L, et al. Let the data choose: Flexible and diverse anchor graph fusion for scalable multi-view clustering. Proceedings of the AAAI Conference on Artificial Intelligence 2023, 37, 11262–11269. [CrossRef]
Figure 1.
Comparison results of clustering performance of all algorithms
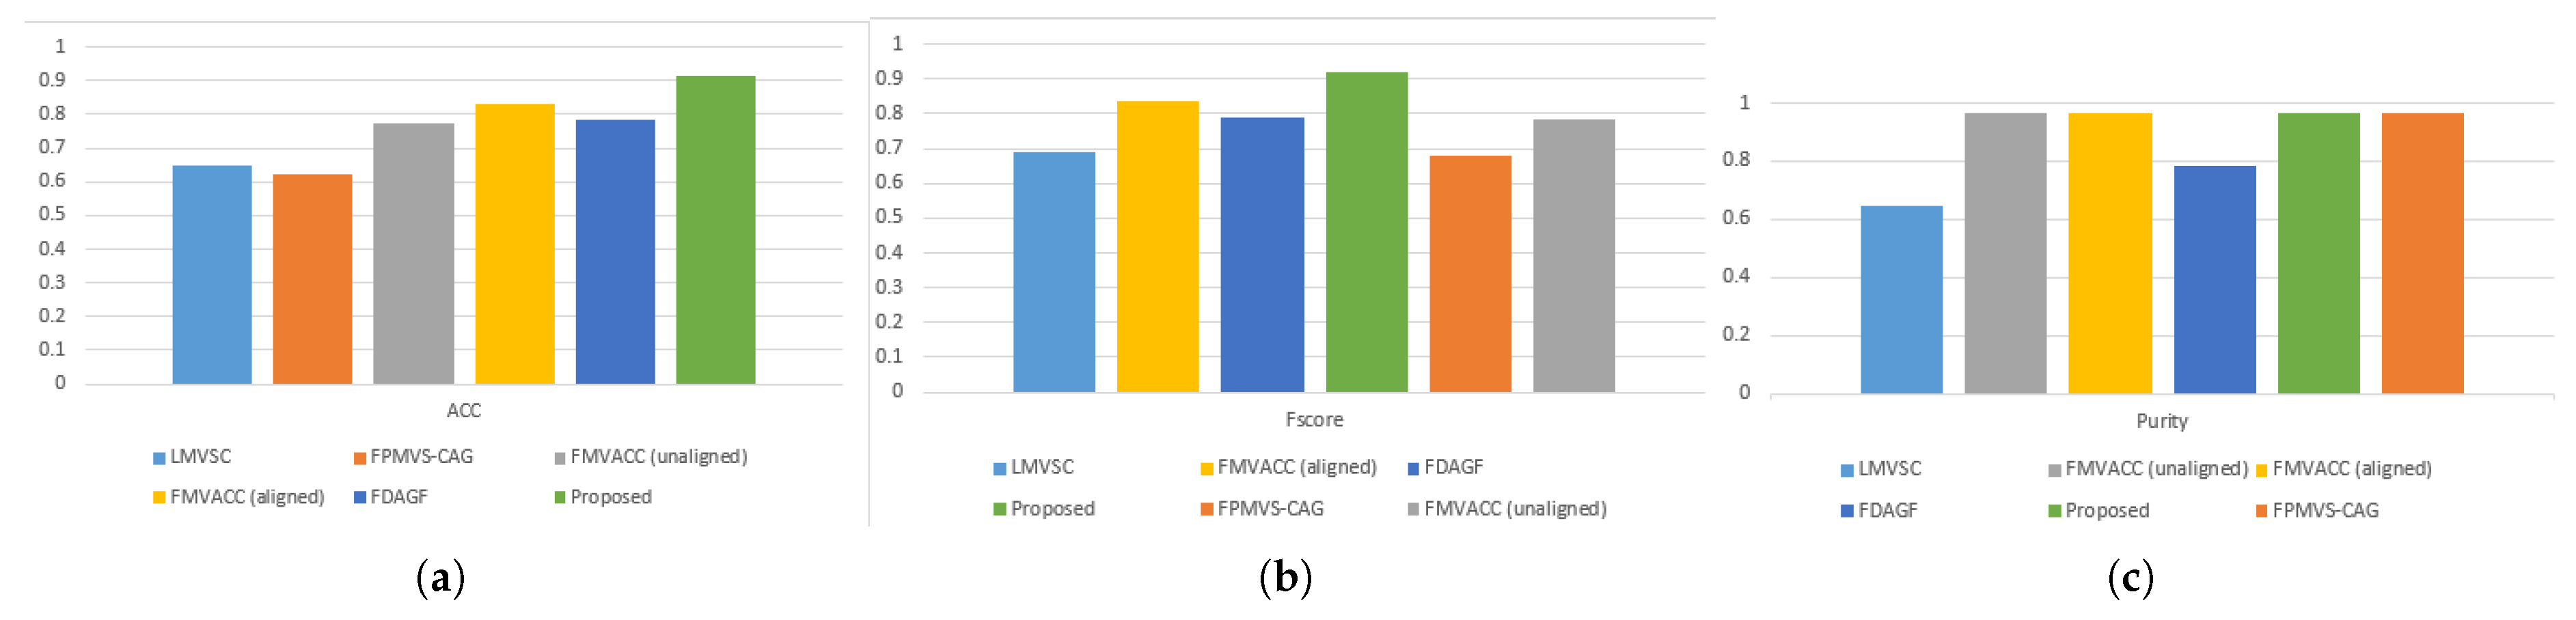

Table 1.
Detailed characteristics of the dataset
| Datasets | Samples | Views | Classes | Features |
|---|---|---|---|---|
| VTE | 15856 | 5 | 2 | 44,44,44,32,133 |
Table 2.
Comparison results of clustering performance of various algorithms.
| Metrics | LMVSC | FPMVS-CAG | FMVACC | FMVACC | FDAGF | Proposed |
|---|---|---|---|---|---|---|
| ACC | 0.6481 | 0.6242 | 0.7740 | 0.8306 | 0.7844 | 0.9172 |
| Purity | 0.6481 | 0.9667 | 0.9667 | 0.9667 | 0.7844 | 0.9667 |
| F-score | 0.6910 | 0.6779 | 0.7841 | 0.8347 | 0.7879 | 0.9174 |
1 FMVACC(unaligned) indicates that the anchor alignment module is not used. 2 FMVACC(aligned) indicates that the anchor alignment module is not used.
Disclaimer/Publisher’s Note: The statements, opinions and data contained in all publications are solely those of the individual author(s) and contributor(s) and not of MDPI and/or the editor(s). MDPI and/or the editor(s) disclaim responsibility for any injury to people or property resulting from any ideas, methods, instructions or products referred to in the content. |
© 2025 by the authors. Licensee MDPI, Basel, Switzerland. This article is an open access article distributed under the terms and conditions of the Creative Commons Attribution (CC BY) license (http://creativecommons.org/licenses/by/4.0/).
Copyright: This open access article is published under a Creative Commons CC BY 4.0 license, which permit the free download, distribution, and reuse, provided that the author and preprint are cited in any reuse.


