Submitted:
15 October 2024
Posted:
16 October 2024
You are already at the latest version
Abstract
Background: The diagnosis of Pulmonary Embolism (PE) is based on the application of a priori probability scales such as the Wells scale or PERC criteria. However, the clinical heterogeneity of this pathology results in the absence of a target population to apply these algorithms. Moreover, these scales do not consider the possible influence of the presence of an objective alternative diagnosis to PE, complicating its clinical assessment and possibly leading to an increase in unnecessary testing or missed diagnoses.
Objective: The aim of this study is to evaluate the discrimination capacity of clinical objective factors with a high negative predictive value for PE, compared to PERC in terms of reducing unnecessary testing across different risk strata of the Wells scale.
Materials and Methods: This was a single-center retrospective cohort study, including patients who underwent chest CT angiography to rule out PE at a University Hospital between 2008 and 2017, considering the presence of PE as the study outcome. The study collected demographic data, comorbidities, and clinical presentation data. The presence of objective criteria for pneumonia, heart failure, exacerbation of COPD, or the use of anticoagulation in non-oncological patients was considered a priori criteria with a high negative predictive value.
Results: The analyses were performed on a cohort of 399 patients with an average age of 65 years and 53% females. A total of 139 patients were diagnosed with PE by CT angiography. The presence of factors with a high NPV showed a sensitivity and NPV of 100% in low-risk patients according to Wells, with sensitivity dropping below 50% in other populations. The association of these factors in the PERC plus criteria would allow a reduction of up to 34% in CT angiographies in patients with low risk according to the Wells scale.
Conclusions: The combination of risk stratification of the Wells scale and PERC plus criteria allows an absolute reduction of 34.3% in the performance of CT angiographies in patients classified as low risk with a sensitivity and a negative predictive value of 100%. The preexistence of an alternative diagnosis does not allow ruling out PE in patients with intermediate or high risk according to the Wells scale.
Keywords:
pulmonary thromboembolism
; clinical decision rule
; wells scale
; pulmonary embolism rule-out criteria
1. Introduction
Pulmonary Embolism (PE) is a prevalent condition, with an annual incidence ranging from 39 to 115 cases per 100,000 inhabitants [1,2,3,4]. It is the third most common cardiovascular disease, following acute myocardial infarction and cerebrovascular accident [5,6,7], with morbidity and mortality rates reaching up to 30% in some reports [2].
The clinical presentation of PE is highly variable and nonspecific [8,9,10,11]. Most commonly, it presents with dyspnea, cough, or chest pain [10,12], symptoms that overlap with other pulmonary and cardiovascular conditions such as pneumonia, exacerbation of COPD, or decompensated congestive heart failure, among others [9,11,13]. Additionally, the average age of PE presentation is between 60 and 70 years, a period when these other pathologies are also prevalent [1,13,14,15,16,17,18,19]. Consequently, establishing a presumptive diagnosis of PE based solely on clinical and epidemiological data can be challenging [8,20,21]. Several risk factors for venous thromboembolic disease (VTE) can modify the probability that a patient's symptoms are due to PE. Notably, cancer, recent surgery, immobility, and estrogen use are associated with an increased risk of PE [22,23,24,25].
Clinical prediction scales have been developed to stratify the risk of PE in patients. Among these, the Wells score is widely used and has demonstrated strong external validation, serving as a primary tool for initial PE risk assessment [7,26]. This scale evaluates signs, symptoms, and risk factors, categorizing patients into low, medium, or high risk [7,26]. Based on this assessment, patients are directed through clinical algorithms to undergo further tests for diagnosis or exclusion of PE [21,27,28,29,30]. However, the Wells score has limitations, including its exclusion of hospitalized patients, lack of a clearly defined target population, inclusion of subjective elements, and dependence on a hospital setting capable of performing necessary tests and procedures [31].
More recently, alternative approaches to diagnosing VTE have emerged. The Pulmonary Embolism Rule-Out Criteria (PERC) is one such model, including eight factors with a high negative predictive value for PE [32]. This model can rule out PE in patients with very low probability, achieving near 100% sensitivity [33,34,35]. Despite its usefulness, PERC's representativeness is limited, affecting approximately 13% of the at-risk population and thereby being inadequate for many patients with suspected PE [36].
In summary, the epidemiological, clinical, and analytical heterogeneity of PE patients, combined with the complexity of diagnostic tests, complicates standardized clinical judgment. While it seems reasonable to rule out PE in patients with a clear alternative diagnosis, such as pneumonia, COPD exacerbation, or congestive heart failure, or those on anticoagulant therapy for other reasons [37], definitive evidence supporting this approach is lacking. Therefore, this study aims to evaluate the discrimination capability of clinical factors with a high negative predictive value for PE and compare them to the PERC scale in terms of screening efficacy and reduction in unnecessary testing.
2. Materials and Methods
This observational, retrospective cohort study included all patients who underwent chest Computed Tomography Angiography (CT Angiography) between 2008 and 2017 at HM Sanchinarro Hospital, a 200-bed university hospital. The study was approved by the center's ethics committee, and informed consent was waived (HM Hospitals CEIm Code: 21.03.1792-GHM).
Patients were identified through a review of digitized medical records. Data collection included demographic information, risk factors, comorbidities, clinical variables, vital signs at the time of the test, and analytical and radiographic data. Variables corresponding to the Wells and PERC scales (Table 1 and Table 2) [26,32] were recorded. The presence of PE on CT Angiography was considered the outcome variable. Exclusion criteria were being under 18 years of age, undergoing CT Angiography for reasons other than suspected PE, having an acute PE diagnosis at the time of the test, and insufficient data for calculating the Wells or PERC scales. This resulted in a final study cohort of 399 patients.
Objective variables with a high negative predictive value were defined based on diagnostic guidelines [38,39,40]: (i) Pneumonia: fever and radiographic consolidation as assessed by the physician; (ii) COPD Exacerbation: smoking habit, cough, and fever; (iii) Congestive Heart Failure (CHF): radiological pattern consistent with heart failure and dyspnea or orthopnea; (iv) Previous Anticoagulation in Non-Oncological Patients: anticoagulated patients without a prior oncological diagnosis at the time of CT Angiography (Table 3).
Statistical analysis employed standard methods. Qualitative variables were analyzed using the chi-square test, and quantitative variables were assessed with t-tests and ANOVA. Sensitivity, specificity, and positive and negative predictive values were calculated for each study variable and the PERC scale. A new scale, PERC plus, incorporating all variables with a 100% negative predictive value, was created. The ability of each criterion and the PERC plus set to reduce diagnostic tests was assessed by calculating the incidence of at-risk patients where CT Angiography could have been avoided. Differences with p < 0.05 were considered statistically significant. Statistical analysis was performed using SPSS version 27.0 (Armonk, NY, 2020).
3. Results
The study evaluated 399 patients who met the inclusion criteria, with 139 (35%) diagnosed with PE by CT Angiography. The cohort had an average age of 65 ± 16 years, and 53% were female (n=214). The average number of comorbidities per patient was 0.8 ± 0.3, with oncological pathology being the most common (n=121, 30%). Risk stratification according to the Wells scale showed that 6 patients with PE (4%) were in the low-risk group, 95 patients (68%) were in the moderate-risk group, and 38 patients (27%) were in the high-risk group. CT Angiography was performed after Emergency Department assessment in 81.20% of patients.
The most frequent symptoms were dyspnea (n=269, 67%), pleuritic pain (n=154, 39%), cough (n=115, 29%), fever (n=66, 17%), lower limb pain (n=43, 11%), orthopnea (n=25, 6%), syncope (n=15, 4%), and hemoptysis (n=11, 3%). At diagnosis, 108 patients (27%) had hemodynamic instability, and 185 patients (46%) had acute respiratory failure. PERC criteria were met by 13 patients (3%), pneumonia criteria by 27 patients (7%), COPD exacerbation criteria by 40 patients (10%), CHF criteria by 18 patients (5%), and 29 patients (7%) were anticoagulated without oncological pathology. The distribution of these patients according to Wells scale risk is shown in Table 4.
Patients with PE (n=139) had an average age of 66 ± 17 years and 47% were female (n=65), while non-PE patients (n=260) had an average age of 64 ± 16 years and 57% were female (n=149), showing no statistically significant differences. The average number of comorbidities in PE patients was 0.9 ± 0.3, with a predominance of oncological pathology (n=45, 32%), similar to the non-PE group. PE patients were more frequently detected in the Emergency Department (n=124, 89.2%), and were associated with lower limb pain (22.30% vs. 4.60%, p <0.001), heart rate > 100 bpm (33.10% vs. 22.70%, p = 0.025), and oxygen saturation < 94% (56.80% vs. 40.80%, p = 0.002). Cough was associated with negative CT Angiography (15.10% vs. 36.20%, p<0.001). Hemodynamic instability and desaturation were more frequent in PE patients. Both the PERC scale and the presence of COPD exacerbation and anticoagulation in non-oncological patients showed discrimination for PE (p<0.05), while pneumonia criteria approached statistical significance (p=0.06). CHF criteria did not show a significant association with PE (p=0.71) (Table 5).
The sensitivity of the Wells scale for diagnosing PE in the low-risk group was 95%, decreasing to 74.68% in hospitalized patients. Evaluating the sensitivity and specificity of conditions with high negative predictive value revealed 100% sensitivity and NPV for patients meeting criteria for alternative diagnoses in low-risk Wells groups. The PERC plus scale, combining objective clinical criteria with PERC, also achieved 100% NPV and sensitivity in low-risk patients according to the Wells scale but showed an NPV of 46.67% and 0% in medium and high-risk groups, respectively (Table 6).
The reduction in CT Angiography use for conditions with high NPV was 9% for pneumonia, 12% for COPD, 5% for CHF, 9% for anticoagulated patients without oncological pathology, and 5% overall (Figure 1).
4. Discussion
The findings highlight the importance of a structured approach to diagnosing Pulmonary Embolism (PE) in acute care settings. The 35% prevalence of PE in our cohort underscores the need for effective and efficient diagnostic strategies. The Wells score remains a valuable tool in risk stratification but has limitations, especially when applied to hospitalized patients and subjective factors.
The PERC scale, effective in ruling out PE in very low-risk patients, has limited applicability due to its low representativeness in the broader at-risk population. Our study demonstrates that integrating PERC with additional clinical criteria, such as alternative diagnoses, creates a more robust tool—PERC plus—with a 100% negative predictive value (NPV) and sensitivity in low-risk groups. This combined approach can potentially reduce unnecessary CT Angiography without compromising diagnostic accuracy.
Implementing the PERC plus scale could significantly decrease unnecessary diagnostic tests, optimizing resource allocation while maintaining diagnostic accuracy. This is particularly relevant for enhancing efficiency in emergency settings.
5. Conclusions
The PERC plus scale shows potential in excluding PE in patients classified as low risk by the Wells scale, potentially reducing the need for further tests in both outpatient and inpatient settings. Combining objective clinical criteria with the PERC scale could improve diagnostic accuracy and reduce unnecessary testing, thus enhancing patient management and resource utilization in acute care environments.
References
- Bělohlávek J, Dytrych V, Linhart A Pulmonary embolism, part I: Epidemiology, risk factors and risk stratification, pathophysiology, clinical presentation, diagnosis and nonthrombotic pulmonary embolism. Exp Clin Cardiol. 2013, 18, 139198.
- Cohen AT, Agnelli G, Anderson FA, Arcelus JI, Bergqvist D, et al. Venous thromboembolism (VTE) in Europe. The number of VTE events and associated morbidity and mortality. Thromb Haemost. 2007, 98, 756–764. [Google Scholar] [CrossRef] [PubMed]
- Wendelboe AM, Raskob GE Global Burden of Thrombosis: Epidemiologic Aspects. Circ Res. 2016, 118, 1340–1347. [CrossRef]
- Keller K, Hobohm L, Ebner M, Kresoja KP, Münzel T, et al. Trends in thrombolytic treatment and outcomes of acute pulmonary embolism in Germany. Eur Heart J. 2020, 41, 522–529. [Google Scholar] [CrossRef]
- Raskob GE, Angchaisuksiri P, Blanco AN, Buller H, Gallus A, et al. Thrombosis: a major contributor to global disease burden. Arterioscler Thromb Vasc Biol. 2014, 34, 2363–2371. [Google Scholar] [CrossRef]
- Anderson FAJ, Spencer FA Risk factors for venous thromboembolism. Circulation 2003, 107, I9–I16.
- Wolf SJ, McCubbin TR, Feldhaus KM, Faragher JP, Adcock DM Prospective validation of Wells Criteria in the evaluation of patients with suspected pulmonary embolism. Ann. Emer Med. 2004, 44, 503–510. [CrossRef]
- Miniati M, Prediletto R, Formichi B, CMarini C, Ricco GD, et al. Accuracy of clinical assessment in the diagnosis of pulmonary embolism. Am J Respir Crit Care Med. 1999, 159, 864–871. [Google Scholar] [CrossRef]
- Doherty S Pulmonary embolism: An update. Aust Fam Physician. 2017, 46, 816–820.
- Pollack CV, Schreiber D, Goldhaber SZ, Slattery D, Fanikos J, et al. Clinical characteristics, management, and outcomes of patients diagnosed with acute pulmonary embolism in the emergency department: initial report of EMPEROR (Multicenter Emergency Medicine Pulmonary Embolism in the Real World Registry). J Am Coll Cardiol.. 2011, 57, 700–706. [Google Scholar] [CrossRef]
- Erkens PMG, Lucassen WAM, Geersing GJ, van Weert HCPM, Kuijs- Augustijn M, et al. Alternative diagnoses in patients in whom the GP considered the diagnosis of pulmonary embolism. Fam Pract. 2014, 31, 670–677. [Google Scholar] [CrossRef] [PubMed]
- Howard L Acute pulmonary embolism. Clin Med (Lond). 2019, 19, 243–247.
- Elliott CG, Goldhaber SZ, Visani L, DeRosa M Chest radiographs in acute pulmonary embolism. Results from the International Cooperative Pulmonary Embolism Registry. Chest. 2000, 118, 33–38. [Google Scholar]
- Ceia F, Fonseca C, Mota T, Morais H, Fernando Matiaset F, et al. Prevalence of chronic heart failure in Southwestern Europe: the EPICA study. Eur J Heart Fail. 2002, 4, 531–539. [Google Scholar] [CrossRef] [PubMed]
- Mosterd A, Hoes AW Clinical epidemiology of heart failure. Heart. 2007, 93, 1137–1146. [CrossRef]
- Jain S, Self WH, Wunderink RG, Fakhran S, Balk R, et al. Community-Acquired Pneumonia Requiring Hospitalization among U.S. Adults. N Engl J Med. 2015, 373, 415–427. [CrossRef]
- Cilloniz C, Martin-Loeches I, Garcia-Vidal C, San Jos A,Torres A Microbial Etiology of Pneumonia: Epidemiology, Diagnosis and Resistance Patterns. Int J Mol Sci. 2016, 17, 2120. [CrossRef]
- Ko FW, Chan KP, Hui DS, Goddard JR, Shaw JG, et al. Acute exacerbation of COPD. Respirology. 2016, 21, 1152–1165. [Google Scholar] [CrossRef]
- Raherison C,Girodet P-O Epidemiology of COPD. Eur Respir Rev. 2009, 18, 213–221. [CrossRef]
- Van Es, Kraaijpoel N, Klok FA, Huisman MV, Exter PLD, et al. The original and simplified Wells rules and age-adjusted D-dimer testing to rule out pulmonary embolism: an individual patient data meta-analysis. J Thromb Haemost. 2017, 15, 678–684. [Google Scholar] [CrossRef]
- Dronkers CEA, Hulle TVD, Gal HL, Kyrle PA, Huisman MV,et al. Towards a tailored diagnostic standard for future diagnostic studies in pulmonary embolism: communication from the SSC of the ISTH. J Thromb Haemost. 2017, 15, 1040–1043. [Google Scholar] [CrossRef] [PubMed]
- Vlieg AVH, Middeldorp S Hormone therapies and venous thromboembolism: where are we now? J. Thromb Haemost. 2011, 9, 257–266. [CrossRef] [PubMed]
- Blanco-Molina A, Rota LL, Micco PD, Brenner B, Trujillo-Santos J, et al. Venous thromboembolism during pregnancy, postpartum or during contraceptive use. Thromb Haemost. 2010, 103, 306–311. [Google Scholar] [CrossRef] [PubMed]
- Bozorgmehr R, Pishgahi M, Mohaghegh P, Bayat M, Khodadadi P, et al. Relationship between Thrombosis Risk Factors, Clinical Symptoms, and Laboratory Findings with Pulmonary Embolism Diagnosis; a Cross-Sectional Study. Arch Acad Emerg Med. 2019, 7, 41. [Google Scholar]
- Streiff MB, Agnelli G, Connors JM, Crowther M, Eichinger S, et al. Guidance for the treatment of deep vein thrombosis and pulmonary embolism. J Thromb Thrombolysis. 2016, 41, 32–67. [Google Scholar] [CrossRef]
- Wells PS, Ginsberg JS, Anderson DR, Kearon C, Gent M, Turpie AG, et al. Use of a clinical model for safe management of patients with suspected pulmonary embolism. Ann Intern Med. 1998, 129, 997–1005. [Google Scholar] [CrossRef]
- Righini M, Robert-Ebadi H Diagnosis of acute Pulmonary Embolism. Hamostaseologie. 2018, 38, 11–21. [CrossRef]
- Konstantinides S, Meyer G Management of acute pulmonary embolism 2019: what is new in the updated European guidelines? Intern Emerg Med. 2020, 15, 957–966. [CrossRef]
- Konstantinides SV, Meyer G, Becattini C, Bueno H, Geersing GJ, et al. ESC Guidelines for the diagnosis and management of acute pulmonary embolism developed in collaboration with the European Respiratory Society (ERS): The Task Force for the diagnosis and management of acute pulmonary embolism of the European Society of Cardiology (ESC). Eur Respir J. 2019, 54, 1901647. [Google Scholar]
- Patel H, Sun H, Hussain AN, Vakde T Advances in the diagnosis of venous thromboembolism: A literature review. Diagnostics. 2020, 10, 1–19.
- Zarabi S, Chan TM, Mercuri M, Kearon C, Turcotte M, et al. Physician choices in pulmonary embolism testing. CMAJ 2021, 193, E38–E46. [Google Scholar] [CrossRef] [PubMed]
- Kline JA, Mitchell AM, Kabrhel C, Richman PB, Courtney DM Clinical criteria to prevent unnecessary diagnostic testing in emergency department patients with suspected pulmonary embolism. J Thromb Haemost. 2004, 2, 1247–1255. [CrossRef] [PubMed]
- Freund Y, Cachanado M, Aubry A, Orsini C, Raynal PA, et al. Effect of the Pulmonary Embolism Rule-Out Criteria on Subsequent Thromboembolic Events Among Low-Risk Emergency Department Patients: The PROPER Randomized Clinical Trial. JAMA. 2018, 319, 559–566. [Google Scholar] [CrossRef] [PubMed]
- Freun Y, Rousseau A, Guyot-Rousseau F, Claessens YE, Hugli O, et al. PERC rule to exclude the diagnosis of pulmonary embolism in emergency low-risk patients: Study protocol for the PROPER randomized controlled study. Trials. 2015, 16, 537. [Google Scholar] [CrossRef]
- Al Dandan O, Hassan A, Alnasr A, Al Gadeeb M, AbuAlola H, et al. The use of clinical decision rules for pulmonary embolism in the emergency department: a retrospective study. Int J Emerg Med. 2020, 13, 23. [Google Scholar] [CrossRef]
- Gorlicki J, Penaloza A, Germeau B, Moumneh T, Philippon AL, et al. Safety of the Combination of PERC and YEARS Rules in Patients With Low Clinical Probability of Pulmonary Embolism: A Retrospective Analysis of Two Large European Cohorts. Acad Emerg Med. 2019, 26, 23–30. [Google Scholar] [CrossRef]
- Blanchard T, Lombrozo T, Nichols S Bayesian Occam’s Razor Is a Razor of the People. Cogn Sci. 2018, 42, 1345–1359. [CrossRef]
- Metlay JP, Waterer GW, Long AC, Anzueto A, Brozek J, et al. Diagnosis and Treatment of Adults with Community-acquired Pneumonia. An Official Clinical Practice Guideline of the American Thoracic Society and Infectious Diseases Society of America. Am J Respir Crit Care Med 2019, 200, e45–e67. [Google Scholar] [CrossRef]
- Ponikowski P, Voors AA, Anker AD, Bueno H, Cleland JGF, et al. ESC Guidelines for the diagnosis and treatment of acute and chronic heart failure: The Task Force for the diagnosis and treatment of acute and chronic heart failure of the European Society of Cardiology (ESC)Developed with the special contribution of the Heart Failure Association (HFA) of the ESC. Eur Heart J. 2016, 37, 2129–2200. [Google Scholar]
- Wedzicha JA, Calverley PMA, Albert RK, Anzueto A, Criner GJ, et al. Management of COPD exacerbations: a European Respiratory Society/American Thoracic Society guideline. Eur Respir J. 2017, 49, 160791. [Google Scholar]
- Klok FA, Zidane M, Djurabi RK, Nijkeuter M, Huisman MV The physician’s estimation ‘alternative diagnosis is less likely than pulmonary embolism’ in the Wells rule is dependent on the presence of other required items. Thromb haemost. 2008, 99, 244–245. [CrossRef] [PubMed]
- Guo D-J, Zhao C, Zou YD, Huang HH, Hu JM, et al. Values of the Wells and revised Geneva scores combined with D-dimer in diagnosing elderly pulmonary embolism patients. Chin Med J (Engl). 2015, 128, 1052–1057. [Google Scholar] [CrossRef] [PubMed]
- Penaloza A, Soulié C, Moumneh T, Delmez Q, Ghuysen A, et al. Pulmonary embolism rule-out criteria (PERC) rule in European patients with low implicit clinical probability (PERCEPIC): a multicentre, prospective, observational study. Lancet Haematol 2017, 4, e615–e621. [Google Scholar] [CrossRef] [PubMed]
- Aydoğdu M, Sinanoğlu NT, N Doğan NO, I Oğuzülgen IK, Demircan A, et al. Wells score and Pulmonary Embolism Rule Out Criteria in preventing over investigation of pulmonary embolism in emergency departments. Tuberk Toraks. 2014, 62, 12–21. [Google Scholar]
- Posadas-Martínez ML, Vázquez FJ, Giunta DH, Waisman GD,Quirós FGBD, et al. Performance of the Wells score in patients with suspected pulmonary embolism during hospitalization: a delayed-type cross sectional study in a community hospital. Thromb Res. 2014, 133, 177–181. [Google Scholar] [CrossRef]
Figure 1.
Percentage reduction of CT angiography with features with high negative predictive value and with PERC plus in patients with low Wells risk with a specificity of 100%.
Figure 1.
Percentage reduction of CT angiography with features with high negative predictive value and with PERC plus in patients with low Wells risk with a specificity of 100%.
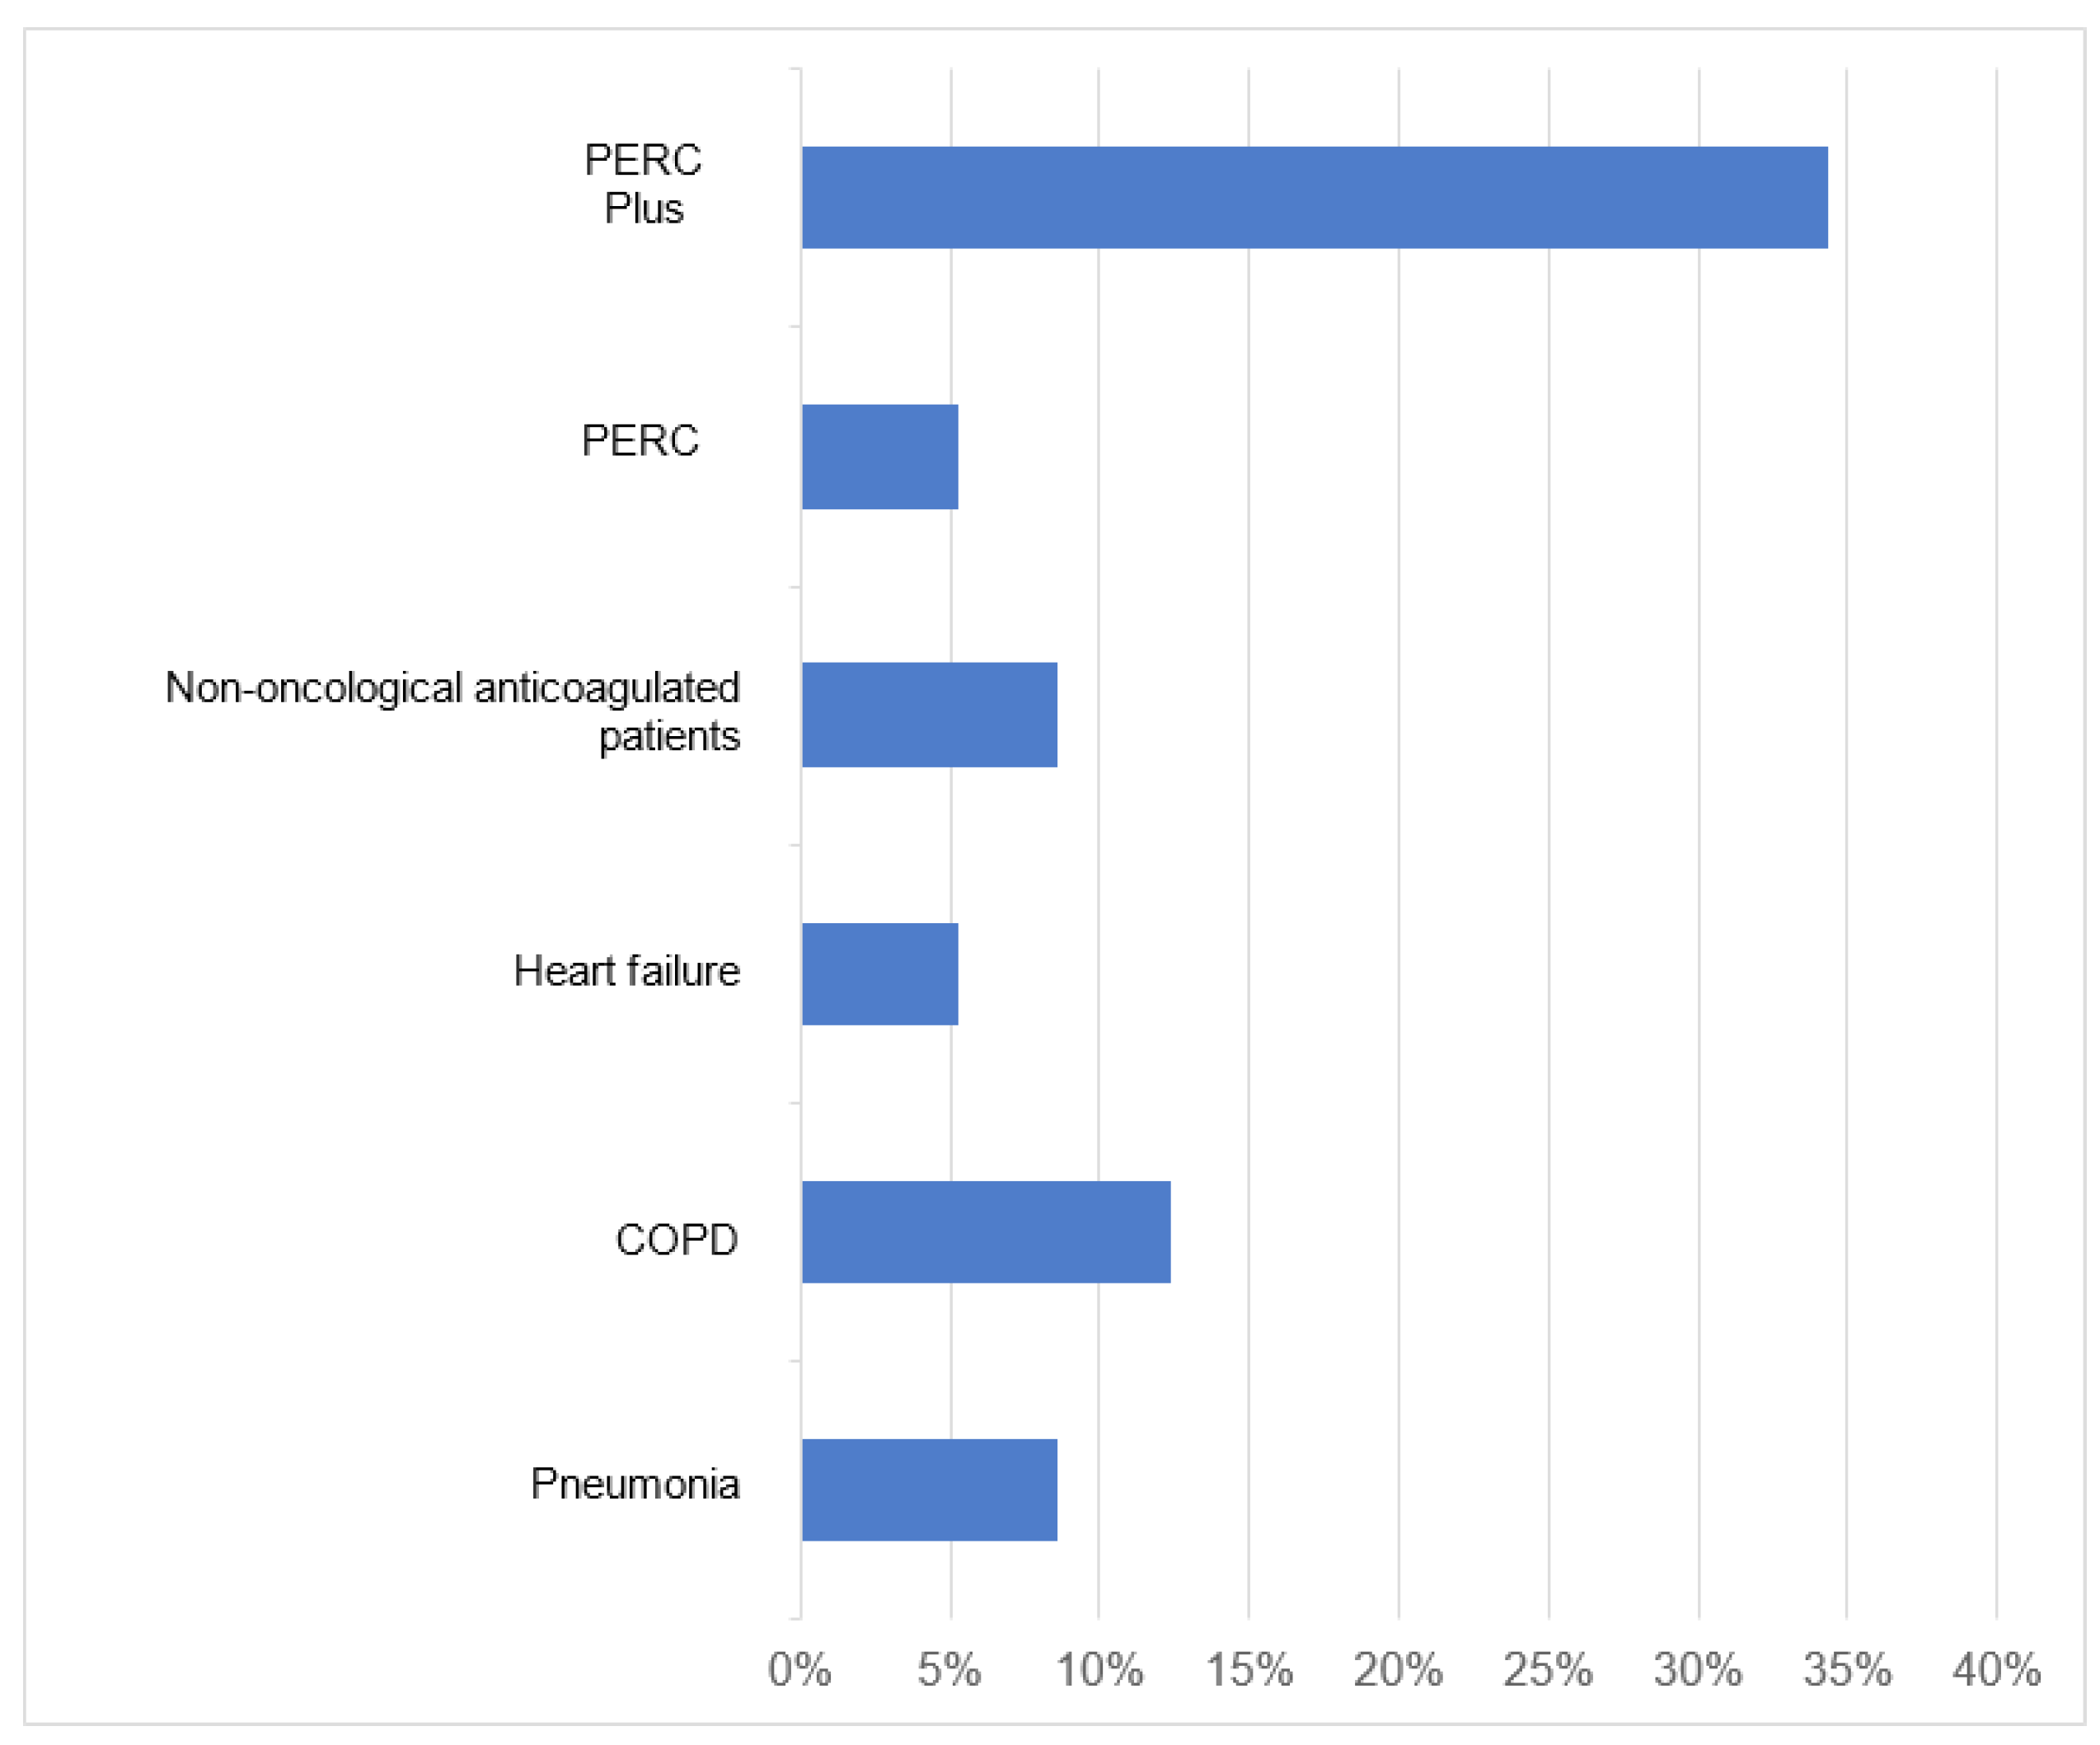

Table 1.
Modified Wells Scale for Pulmonary Thromboembolism.
| Characteristics | Value |
|---|---|
| Clinical Symptoms of Deep Vein Thrombosis | 3 |
| Other Diagnoses Less Likely Than PET | 3 |
| Heart rate greater than 100 bpm | 1.5 |
| Immobilization or surgery within the last 4 weeks | 1.5 |
| Deep vein thrombosis or previous pulmonary thromboembolism |
1.5 |
| Hemoptysis | 1 |
| Cancer | 1 |
| PE: Pulmonary thromboembolism; bpm: Beats per minute | |
Table 2.
PERC Criteria.
| Characteristics |
|---|
| - Under 50 years of age |
| - Pulse < 100 lpm (in tachycardia) |
| - Absence of hypoxia (SatO2 > 95%) |
| - No history of pulmonary embolism or deep vein thrombosis |
| - No trauma or recent surgery |
| - Absence of hemoptysis |
| - Does not use estrogen therapy |
| - Absence of swelling in the legs |
| PERC: Pulmonary Embolism Rule Out Criteria; SatO2: Oxygensaturation; bpm: Beats per minute |
Table 3.
Definition of objective variables with high negative predictive value.
| Pneumonia | Presence of fever. Radiological pattern compatible with respiratory infection and dyspnea or cough. |
|---|---|
| Exacerbation/suspicion of COPD | History of smoking. dyspnea and cough |
| Heart failure | Presence of radiological pattern compatible with heart failure and dyspnea or orthopnea |
| Anticoagulation in non-cancer patients | Previous anticoagulation in non- cancer patients |
| PERC | Those patients who meet the PERC criteria mentioned in Table 2 |
|
COPD: Chronic Obstructive Pulmonary Disease; PERC: Pulmonary Embolism Rule Out Criteria | |
Table 4.
Characteristics of the population.
| Variable | Total | Risk According to the Wells Scale | p | ||
|---|---|---|---|---|---|
| n=399 | Low | Intermediaten=150 | High | ||
| n=210 | n=39 | ||||
| Age, years (SD) | 65±16 | 65±16 | 65±16 | 64±16 | 0.731 |
| Women, % | 214 (53.60%) | 118 (56.20%) | 79 (52.70%) | 17 (43.60%) | 0.334 |
| Comorbidities | |||||
| Patients without comorbidities, % | 46 (11.50%) | 27 (12.90%) | 14 (9.30%) | 5 (12.80%) | 0.567 |
| Smoking, % | 137 (34.30%) | 83 (39.50%) | 49 (32.70%) | 5 (12.80%) | 0.005 |
| Ischemic heart disease, % | 55 (13.79%) | 34 (16.20%) | 17 (11.30%) | 4 (10.30%) | 0.335 |
| COPD, % | 48 (12.00%) | 34 (16.20%) | 14 (9.30%) | 0 (0.00%) | 0.007 |
| Renal insufficiency, % | 17 (4.30%) | 9 (4.30%) | 8 (5.30%) | 0 (0.00%) | 0.34 |
| Oncological Pathology, % | 121 (30.30%) | 48 (22.90%) | 56 (37.30%) | 17 (43.60%) | 0.002 |
| Summa of comorbidities, SD | 0.885 ± 0.32 | 0.871 ± 0.34 | 0.907 ± 0.29 | 0.872 ± 0.34 | 0.569 |
| Symptoms | |||||
| Disnea, % | 269 (67.40%) | 133 (63.30%) | 108 (72.00%) | 28 (71.80%) | 0.186 |
| Hemoptisis, % | 11 (2.80%) | 5 (2.40%) | 5 (3.30%) | 1 (2.60%) | 0.86 |
| Pleuritic pain, % | 154 (38.60%) | 84 (40.00%) | 57 (38.00%) | 13 (33.30%) | 0.721 |
| Lower limb pain, % | 43 (10.80%) | 5 (2.40%) | 18 (12.00%) | 20 (51.30%) | <0.001 |
| Cough, % | 115 (28.80%) | 76 (36.20%) | 33 (22.00%) | 6 (15.40%) | 0.002 |
| Faint, % | 15 (3.80%) | 5 (2.40%) | 8 (5.30%) | 2 (5.10%) | 0.316 |
| Fever, % | 66 (16.50%) | 39 (18.60%) | 23 (15.30%) | 4 (10.30%) | 0.386 |
| Ortopnea, % | 25 (6.30%) | 12 (5.70%) | 11 (7.30%) | 2 (5.10%) | 0.784 |
| Vital Signs | |||||
| Taquicardia > 100 lpm, % | 105 (26.30%) | 36 (17.10%) | 55 (36.70%) | 14 (35.90%) | <0.001 |
| SBP < 90 mmHg, % | 21 (5.30%) | 9 (4.30%) | 8 (5.30%) | 4 (10.30%) | 0.308 |
| Saturation < 94%, % | 185 (46.40%) | 95 (45.20%) | 71 (47.30%) | 19 (48.70%) | 0.882 |
| Variables with high a priori negative predictive value for PE | |||||
| PERC, % | 13 (3.30%) | 11 (5.20%) | 2 (1.30%) | 0 (0.00%) | 0.058 |
| Pneumonia, % | 27 (6.80%) | 18 (8.60%) | 9 (6.00%) | 0 (0.00%) | 0.132 |
| COPD flare-up, % | 40 (10.00%) | 26 (12.40%) | 13 (8.70%) | 1 (2.60%) | 0.135 |
| Heart failure, % | 18 (4.50%) | 11 (5.20%) | 5 (3.30%) | 2 (5.10%) | 0.679 |
| Non-oncology patients on anticoagulation,% | 29 (7.30%) | 18 (8.60%) | 11 (7.30%) | 0 (0.00%) | 0.166 |
| CT angiography result | |||||
| Pulmonary thromboembolism, % | 139 (34.80%) | 6 (2.90%) | 95 (63.30%) | 38 (97.40%) | <0.001 |
| Patients with CT angiography performed in the Emergency Department, % | 324 (81.20%) | 166 (79.00%) | 121 (80.70%) | 37 (94.40%) | 0.066 |
| COPD: Chronic obstructive pulmonary disease; SBP: Systolic blood pressure; bpm: Beats per minute; PERC: Pulmonary Embolism Rule Out Criteria; PE: pulmonary embolism; CT angiography: Computed Tomography Angiography; SD: standard deviation. | |||||
Table 5.
Population characteristics as a function of thoracic CT angiography.
| Variable | PE | Not PE | p |
|---|---|---|---|
| Age, years (SD) | 66 ± 17 | 64 ± 16 | 0.821 |
| Women, % | 65 (46.80%) | 149 (57.30%) | 0.44 |
| Positive CT CT angiography in the Emergency Department, % | 124 (89.20%) | 200 (76.9%) | 0.003 |
| Comorbidities | |||
| Patients without comorbidities, % | 16 (11.50%) | 30 (11.50%) | 0.993 |
| Smoking, % | 31 (22.30%) | 106 (40.80%) | <0.001 |
| Ischemic heart disease, % | 16 (11.50%) | 39 (15.00%) | 0.335 |
| COPD, % | 9 (6.50%) | 39 (15.00%) | 0.013 |
| Renal insufficiency, % | 3 (2.20%) | 14 (5.40%) | 0.128 |
| Oncological Pathology, % | 45 (32.40%) | 76 (29.20%) | 0.515 |
| Summary of comorbidities (SD) | 0.885 ± 0.320 | 0.885 ± 0.320 | 0.993 |
| Symptoms | |||
| Disnea, % | 101 (72.70%) | 168 (64.60%) | 0.102 |
| Hemoptisis, % | 4 (2.90%) | 7 (2.70%) | 0.914 |
| Pleuritic pain, % | 60 (43.20%) | 94 (36.20%) | 0.17 |
| Lower limb pain, % | 31 (22.30%) | 12 (4.60%) | <0.001 |
| Cough, % | 21 (15.10%) | 94 (36.20%) | <0.001 |
| Faint, % | 6 (4.30%) | 9 (3.50 %) | 0.674 |
| Fever, % | 17 (12.20 %) | 49 (18.80%) | 0.09 |
| Ortopnea, % | 6 (4.30%) | 19 (7.30%) | 0.24 |
| Vital Signs | |||
| Taquicardia > 100 lpm, % | 46 (33.10%) | 59 (22.70 %) | 0.025 |
| SBP < 90 mmHg, % | 8 (5.80%) | 13 (5.00%) | 0.747 |
| SatO2 < 94%, % | 79 (56.80%) | 106 (40.80%) | 0.002 |
| Wells Scale | |||
| Low Risk, % | 6 (4.30%) | 204 (78.50%) | <0.001 |
| Moderate Risk, % | 95 (68.30%) | 55 (21.20%) | |
| High Risk, % | 38 (27.30%) | 1 (0.40%) | |
| Variables with high a priori negative predictive value for PE | |||
| PERC, % | 0 (0.00%) | 13 (5.00%) | 0.007 |
| Pneumonia, % | 5 (3.60%) | 22 (8.50%) | 0.065 |
| COPD flare-up, % | 6 (4.30%) | 34 (13.00%) | 0.006 |
| Heart failure, % | 7 (5.00%) | 11 (4.20%) | 0.712 |
| Non-oncology patients on anticoagulation, % | 5 (3.60%) | 24 (9.20%) | 0.039 |
| COPD: Chronic obstructive pulmonary disease; SBP: Systolic blood pressure; SatO2: Oxygen saturation; bpm: Beats per minute; PERC: Pulmonary Embolism Rule Out Criteria; PE: pulmonary embolism; CT angiography: Computed Tomography Angiography; SD: standard deviation. | |||
Table 6.
Study of the ability to discriminate factors with high a priori negative predictive value for the diagnosis of pulmonary thromboembolism.
Table 6.
Study of the ability to discriminate factors with high a priori negative predictive value for the diagnosis of pulmonary thromboembolism.
| Risk | Sensitivity | Specificity | VPP | VPN | % CT Angiography Reduction | |
|---|---|---|---|---|---|---|
| Pneumonia | Low | 100.00% | 8.82% | 3.13% | 100.00% | 8.57% |
| Middle | 94.74% | 7.27% | 63.83% | 44.44% | 2.67% | |
| High | 100.00% | 0.00% | 97.44% | 0.00% | 0.00% | |
| COPD | Low | 100.00% | 12.75%% | 3.26% | 100.00% | 12.38% |
| Middle | 94.74% | 14.55% | 65.69% | 61.54% | 5.33% | |
| High | 97.37% | 0.00% | 97.37% | 0.00% | 0.00% | |
| Heart failure | Low | 100.00% | 5.40% | 3.02% | 100.00% | 5.24% |
| Middle | 94.74% | 0.00% | 62.07% | 0.00% | 0.00% | |
| High | 94.74% | 0.00% | 97.30% | 0.00% | 0.00% | |
| Non-oncologicalanticoagulatedpatients | Low | 100.00% | 8.82% | 3.13% | 100.00% | 8.57% |
| Middle | 94.74% | 10.90% | 64.75% | 54.55% | 4.00% | |
| High | 100.00% | 0.00% | 97.44% | 0.00% | 0.00% | |
| PERC | Low | 100.00% | 5.39% | 3.02% | 100.00% | 5.24% |
| Middle | 100.00% | 3.64% | 64.19% | 100.00% | 1.33% | |
| High | 100.00% | 0.00% | 97.44% | 0.00% | 0.00% | |
| PERC plus | Low | 100.00% | 34.31% | 4.29% | 100.00% | 34.30% |
| Middle | 83.16% | 25.45% | 65.83% | 46.67% | 25.50% | |
| High | 92.11% | 0.00% | 97.22% | 0.00% | 0.00% | |
| COPD: Chronic obstructive pulmonary disease; PERC: Pulmonary Embolism Rule-Out Criteria; PPV: Positive predictive value; NPV: Negative Predictive Value; CT angiography: Computed Tomography Angiography | ||||||
Disclaimer/Publisher’s Note: The statements, opinions and data contained in all publications are solely those of the individual author(s) and contributor(s) and not of MDPI and/or the editor(s). MDPI and/or the editor(s) disclaim responsibility for any injury to people or property resulting from any ideas, methods, instructions or products referred to in the content. |
© 2024 by the authors. Licensee MDPI, Basel, Switzerland. This article is an open access article distributed under the terms and conditions of the Creative Commons Attribution (CC BY) license (http://creativecommons.org/licenses/by/4.0/).
Copyright: This open access article is published under a Creative Commons CC BY 4.0 license, which permit the free download, distribution, and reuse, provided that the author and preprint are cited in any reuse.


