Submitted:
25 February 2025
Posted:
25 February 2025
Read the latest preprint version here
Abstract
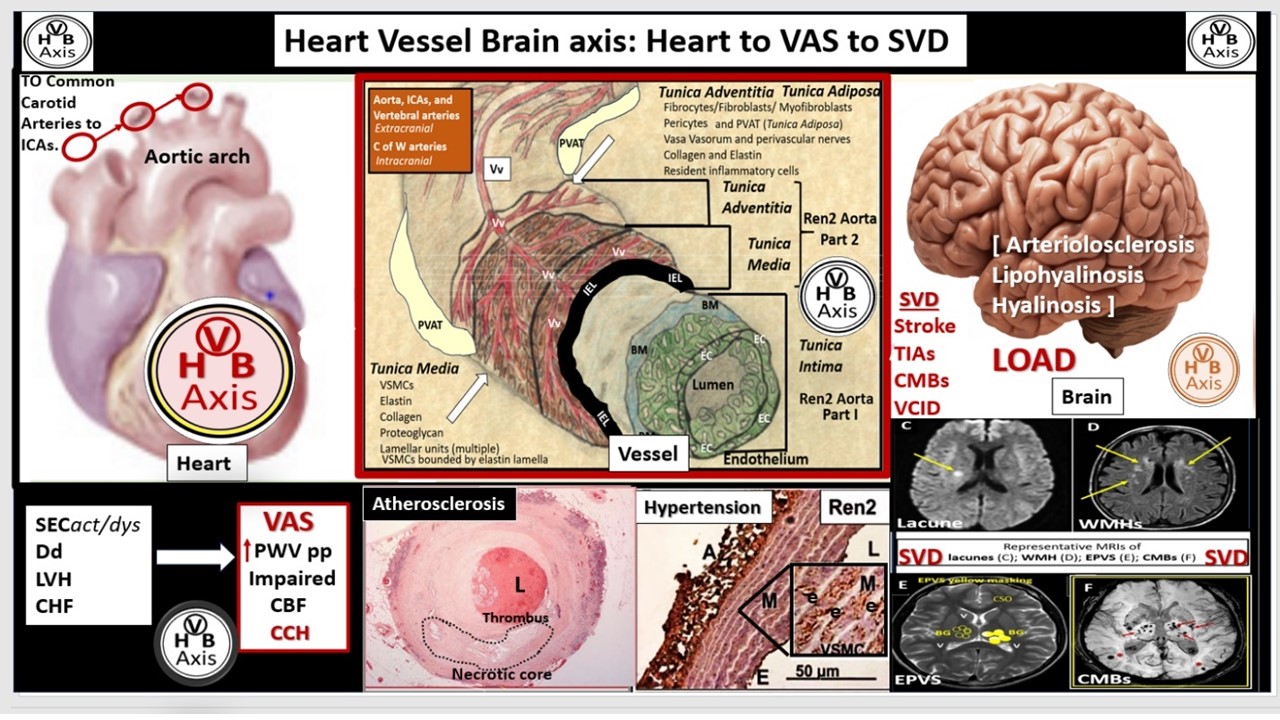
Cerebrocardiovascular disease(s) (CCVD) including coronary artery disease, ischemic heart disease, and stroke are the number one cause of mortality. Structural and functional properties of the vascular arterial wall play an important role in creating extracranial vascular arterial stiffness (VAS). VAS has emerged as a marker of risk for aging, dementia, vascular contributions to impaired cognition and dementia (VCID), stroke (ischemic and hemorrhagic), misfolded proteins (amyloid beta and tau) deposition, neurodegeneration, brain atrophy, and late-onset Alzheimer’s disease. VAS is associated with increased oxidative redox stress, inflammation, vascular remodeling and calcification, increased pulse pressure, increased pulse wave velocity, and systolic hypertension, which serves as part of the multiple injurious stimuli to vulnerable neurovascular unit capillaries with high flow and low resistance. Notably, advanceing age, hypertension, atherosclerosis, and vascular calcification are the most common causes of VAS. VAS contributes to cerebral small vessel disease and chronic cerebral hypoperfusion that is capable of instigating neurodegeneration, brain atrophy, and late onset Alzheimer’s disease. This narrative review discusses the evidence that links VAS and microvessel cerebral small vessel disease (SVD) to brain structural and functional abnormalities via a heart, vascular, brain (HVB) axis, which leads to SVD, neurodegeneration, brain atrophy, impaired cognition, and late-onset Alzheimer’s disease.
Keywords:
Atherosclerosis
; Cerebro-cardiovascular disease
; Cerebral small vessel disease
; Chronic cerebral hypoperfusion
; Dementia
; Extracranial vascular arterial stiffness
; Late-onset Alzheimer’s disease
; Neurodegeneration
; Stroke
; VCID
Graphic Abstract
1. Introduction
Cerebrocardiovascular disease(s) (CCVD) including coronary artery disease, ischemic heart disease, and stroke are the leading cause of mortality globally and are a major cause of disability [1,2,3]. Further, central conduit extracranial vascular arterial stiffness/stiffening (VAS) as measured using carotid-femoral pulse wave velocity (PWV), is an independent predictor of cardiovascular morbidity and mortality [4,5]. Multiple risk factors for the development of VAS include advancing age [5,6,7]; essential hypertension (HTN) [6,8]; metabolic syndrome (MetS) [9]; diabetes-specifically type 2 diabetes mellitus (T2DM) and insulin resistance (IR) [10,11,12]; obesity [13,14], unhealthy lifestyles such as smoking [15], physical inactivity-sedentary lifestyle [16], and high salt, high caloric intake as occurs with the diet-induced obesity Western style diets [17,18]. Importantly, note that the risk factors for the development of VAS parellel the risk factors for the development of CCVD [19,20]. Also, VAS may begin in youth to middle age and some have even reported that VAS may preceed the development of HTN and metabolic risks in youth [21].
Recent evidence obtained from preclinical and clinical studies have demonstrated an intricate connection between extracranial atherosclerotic vascular disease, HTN and VAS in the peripheral circulation [22]. Further, VAS and subsequent cerebral small vessel disease (SVD) with its association to brain endothelial cell activation and dysfunction (BECact/dys) and blood-brain barrier (BBB) dysfunction and disruption (BBBdd) of the neurovascular unit (NVU) with increased permeability result in neurodegeneration and the development and progression of late-onset Alzheimer’s disease (LOAD) [22,23]. The findings of systemic extracranial atherosclerosis, vascular ossification-calcification remodeling, MetS, and HTN inclusive of both essential and the more predominant isolated systolic hypertension are frequent predisposing factors for the development of VAS [6,8,22,23].
The damaging effects of increased pulsatile pulse pressure (pp) due to VAS is known to be one of the many injurious stimuli to both the systemic and brain endothelial cells (SECs, BECs respectively), which result in the development of SVD, neurodegeneration, and LOAD to support a heart-vessel-brain (HVB) axis (Figure 1 and Figure 2) [23,24,25,26,27].
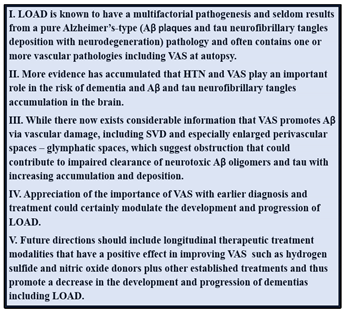
LOAD is known to have a multifactorial pathogenesis and seldom results from a pure Alzheimer’s-type (Aβ plaques and tau neurofibrillary tangles deposition with neurodegeneration) pathology and often contains one or more vascular pathologies including VAS at autopsy [22,23]. A decade has now passed since the trio of Hughes, Craft, and Lopez [23] suggested that there was a potential role of arterial stiffness in the pathogenesis of Alzheimer’s disease and that is the main reason why the authors have chosen to reexamine this issue in this narrative review.
The primary focus of this narrative review is to explore the role of VAS and how it relates to the development of LOAD via the development of SVD with chronic cerebral hypoperfusion and hypometabolism as illustrated in figure two in order to increase our database of knowledge in this field of study. Also, preclinical rodent models representing hypertension, obesity, insulin resistance, and type 2 diabetes will be utilized in some sections to better understand both structural remodeling and functional changes associated with disease and how they relate to the development and progression of VAS. Importantly, neurovascular unit remodeling and impairment of neurovascular unit integrity develop due to the damaging role of increased systemic pp to the brain’s vulnerable capillary NVUs as a result of high flow and low capillary resistance in the brain [22,23,28].
2. Advancing Age and Essential Hypertension (HTN)
Advancing age is the strongest risk factor for the development of VAS [29]. Fatigue and failure from increased pp associates with chronic wall stress that associates with stiffening of systemic endothelial cell(s) (SECs), elastin fragmentation and loss of the internal elastic lamina and elastin lamellar units with increased collagen stiffening, VSMC stiffening, and the accumulation of advanced glycation endproducts (AGE) and its receptor (RAGE) with increased reactive oxygen species with increased matrix metalloproteinases (MMPs) throughout advancing age (30). Aging is associated with a decrease in elastin and increased stiffer collagen within arterial vessels and an increase in PWV with increased pp [29,30]. Advanced aging is followed by HTN, which is the second most common cause of VAS [30].
HTN also increases in prevalence with advancing age and advanced aging and HTN are the two main determinants of VAS [30,31]. Importantly, HTN and VAS are intricately related with bidirectional effects, in that HTN increases VAS and VAS increasingly affects HTN [32]. HTN results in a direct increased mechanical stress and injury to the vascular wall, which includes systemic endothelial activation and dysfunction (SECact/dys) with a proinflammatory phenotype and decreased nitric oxide bioavailability. Additionally, HTN results in oxidative redox stress (OxRS, which includes reactive oxygen, nitrogen, sulfur species and activation of the reactive species interactome (RSI)), inflammation, increased stiffer collagen and elastin degradation and loss of recoil with loss of elastin lamellar units, and activation of the renin-angiotensin-aldosterone system (RAAS). In a like manner, VAS results in a decreased buffering-cushioning effect of the vessel wall, premature arrival of the reflected pulse wave that results in increased systolic blood pressure and increased pp, which results in SEC injury. Further, aging-related HTN may be characterized by a significant increase in systolic blood pressure with little or no change in diastolic blood pressure or even lowering of diastolic blood pressure that it termed ISH [33]. Also, aging associates with increased effects on the MetS and the neurohormonal axis with increased nervous system activity, increased aldosterone and salt sensitivity that result in both increased vascular inflammation with increased tumor necrosis alpha (TNF alpha), monocyte chemoattractant protein-1(MCP-1), interleukin-6 (IL-6), and increased leukocyte infiltration of SECs, which contribute to VAS and subsequent HTN (Figure 3) [33].
Many decades of research have implicated HTN and atherosclerosis as potential modifiable risk factors in the development of VAS, SVD, stroke, with neurodegeneration and LOAD [34,35]. Indeed, both atherosclerosis and HTN are implicated in the development and progression of VAS and SVD; however, they frequently co-exist and may be present simultaneously especially in older individuals. Therefore, it is appropriate to compare and contrast how they each are implicated in the development of VAS to result in SVD (Box 1) [6,36,37].
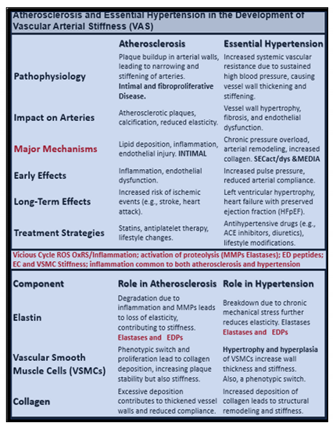
BOX 1. Comparison of atherosclerosis and essential hypertension (HTN) in the development of vascular arterial stiffness (VAS) and cerebral small vessel disease (SVD). Importantly, the vicious cycle of OxRS-ROS and inflammation are strongly involved in both atherosclerosis and HTN. In general atherosclerosis may be considered to be primarily a tunica intima disease; whereas, HTN is primarily considered to be a tunica media disease. Additionally, vascular ossification and calcification (VOC) occur in distinct locations. VOC occurs primarily in the media with HTN, while it occurs in the intima locations with atherosclerosis; however, VOC can be found in either regional location in both atherosclerosis and HTN. Notably, HTN is a major risk factor for the development and progression of atherosclerosis [21,32,33]. ACE, angiotensin converting enzyme; EC, systemic endothelial cell; ED, elastin-derived; EDPs, elastin-derived peptides; MMPs, matrix metalloproteinases; OxRS, oxidative redox stress; ROS, reactive oxygen species.
Additionally, multiple risk factors for the development of atherosclerosis and eHTN including the MetS play an important role (Figure 4) [37,38].
Atherosclerotic calcifications are the most common form of calcific vasculopathy [39]. Plus, vascular calcifications occur in both atherosclerosis and HTN; however, calcification is more strongly associated with atherosclerosis with increasing VAS. Also, HTN is more strongly associated with SVD since HTN is more commonly associated with microvessels in the brain as compared to atherosclerosis [6,40].
Importantly, studies show that HTN is linked to brain amyloid beta (Aβ) deposition in older adults and suggest that VAS plays a central role in this relationship [41,42,43,44]. VAS consists of a reduced capacity of arteries to expand (impaired vasodilation) as a result of stiffness, which impairs their ability to accommodate or cushion the increase in pressure from blood and ejection pressure from the heart during systole. Thus, VAS with decreased compliance allows for the transmission of increased pulsatile pulse pressure deeper into the periphery and microvessels of the distal-end organ systems microvessels present in the brain with high flow and low resistance. Regardless, VAS due to the effects of HTN and atherosclerosis appears to be an important risk factor for the development of SVD, which allows for the unification of several clinical phenotypes including SVD, cerebrovascular disease, stroke, neurodegeneration, impaired cognition, dementia, and LOAD. Indeed, VAS may be considered a potential modifiable risk factor that may even be considered as a nexus for the development of neurodegeneration and LOAD via BECact/dys, BBBdd, OxRS, neuroinflammation, and SVD (Figure 5) [1,2].
3. Atherosclerosis of Extracranial Aorta, Carotids, and Vertebral Arteries
Atherosclerosis is a leading cause of vascular disease (cardiovascular, cerebrovascular, and peripheral vascular disease) globally [45] and is significantly associated with LOAD when utilizing carotid intima-media thickness to assess the degree of atherosclerosis [46]. Additionally, atherosclerosis is a systemic chronic, progressive, and dysfunctional endothelial-intimal disease associated with SECact/dys that initially occurs at side branches, bifurcations and regions of turbulent blood flow. Atherosclerosis typically begins at the extracranial iliac and femoral arterial bifurcations, aorta, and progresses cephalad over time to involve the coronaries, carotids, and vertebral extracranial arteries, which eventually progress to the branching cranial arteries extending from the circle of Willis and its arterial branches to the larger pial arteries of the brain where the smaller arterial microvesssels develop mostly arteriolosclersis, hyalinosis or lipohyalinosis [3,27,47,48]. Atherosclerosis is also a focal occurring, chronic proinflammatory, fibroproliferative, angiogenic, prothrombotic, multifactorial disease beginning in the arterial intima that is facilitated by multiple injurious species as in Figure 1. The development of atherosclerosis is critically dependent on the penetration and retention of atherogenic modified-oxidized low-density lipoprotein-cholesterol (modLDL-C/small dense LDL-C particles and oxLDL-C), triglyceride-rich lipoproteins, and decreased high density lipoproteins (HDL-C) of the atherogenic lipid triad phenotype, hemodynamic stress, OxRS, inflammation via a monocyte to lipid laden macrophage foam cells within the intimal space. Once initiated in the intima the disease progresses to involve the vascular smooth muscle cells (VSMCs) of the tunica media and the proinflammatory aspect of this disease now involves the uptake of inflammatory monocytes that eventually remodel to lipid-laden macrophage foam cells with further intimal growth that may eventually involve the tunica media. These remodeling changes may then initiate VSMC hypertrophy, proliferation, migration that associates with increased collagen, hyaluronan, and proteoglycans along with the fragmentation, degradation, and loss of elastin that contributes to VAS during the progression of atherogenesis (Figure 6 and Figure 7) [3,49,50,51,52,53,54].
There is convincing evidence that T2DM and the MetS are associated with greater arterial stiffness and atherosclerosis as compared to non-diabetic individuals [55]. Importantly, increased VAS may help to explain the increased CCVD risk in individuals with diabetes and the MetS (Figure 7) [55,56].
Interestingly, not only does the elevated glucose in T2DM cause an increase in AGE, which promotes collagen crosslinking but also interacts with its receptor RAGE and gives rise to increased OxRS that can increase the fragmentation of elastin within the media. Concurrently, this increase in glucose and AGE instigate a phenotypic switch in the VSMCs of the media from a contractile type to a synthetic type that increases the synthesis of stiffer collagen, proteoglycan, and hyaluronon ECM components as in Figure 7 to result in increased VAS [57].
Even though atherosclerosis is defined as being a chronic progressive intimal disease, it is important to note that even when there is continued atheroma lipid expansion that these lesions do not usually become clinically symptomatic unless they are superimposed with progressive remodeling changes including the deposition of thrombotic material (intraplaque hemorrhage), inflammation, calcification, and malignant-like invasion via angiogenesis of the atheromatous plaque with plaque hemorrhage and rupture [47,51]. Additionally, current theories regarding dementia pathogenesis currently suggest that there is a continuum between atherosclerotic vascular disease and dementia such as occur in LOAD [58].
In addition to the extracranial arteries the extension of the extracranial internal carotids and the fusion of the vertebral arteries to form the basilar artery allow for the formation of the ultimate collateral circulation of the intracranial arteries known as the circle of Willis [59]. Importantly, Roher et al. have demonstrated that these circle of Willis arteries in older individuals with LOAD have extensive remodeling changes of atherosclerosis with luminal narrowing as compared to those without LOAD [60]. Further, Beach et al. along with others have shown that atherosclerosis of the circle of Willis associate with Aβ neuritic plaques, tau neurofibrillary tangles, and LOAD [61,62].
3.1. Vascular Ossification/Calcification (VOC)
VOC may be defined as the deposition of calcium phosphate complexes in the form of hydroxyapatite [Ca10(PO4)6(OH)2] in vessels, which result in increased VAS [63]. While VOC of arteries is one of the characteristics of atherosclerosis and vascular aging [64,65], it also is capable of being increased in pathological processes such as HTN, diabetes, CKD, and hereditary disorders (Figure 8) [66,67,68].
VOC may occur at different locations (intimal or media calcifications or both) in the arterial wall that are known to be associated with different risk factors and outcomes [63,69]. Indeed, arterial calcification is no longer thought to be just a passive process associated with aging, but involves a reprogramming of the tunica media VSMCs from a contractile state to a synthetic proliferative and migratory phenotype capable of becoming an osteogenic cell within the media and intima [68,70]. Importantly, these local VSMC cues are different for atherosclerotic aortic intimal calcification, which involves inflammation, OxRS, and apoptosis in contrast to medial calcification that associates with aging, HTN, senescence, and uremia of renal failure with multiple elevations of uremic toxins and specifically elevated calcium and phosphate levels [67,70]. Interestingly, elastin degradation/fragmentation results in the release of bioactive elastin degradation products (EDPs), which are capable of inducing an osteogenic switch of VSMCs from a contractile to a synthetic phenotype and once switched these cells are capable of producing calcification in the tunica media that have a predilection to adhere to these damaged elastin lamellae within either the media or the elastin of the internal elastic lamina (IEL) of intima regions [71]. Importantly, McEniery et al., have pointed out that in both preclinical animal and human studies that arterial calcification is associated with aortic stiffness and HTN [72].
4. Endothelial Interface: Systemic Endothelial Cells (SECs) and Brain Endothelial Cells (BECs)
The brain endothelial functional interface is highly selective and acts as a continuous monolayer of gatekeeper BECs with barrier functions that provide tight (specialized occludin, claudin, junctional adherens molecule proteins) and adherens junctions (VE-Cadherins) to create a BBB and prevent paracellular trafficking in contrast to SECs that only have VE-Cadherins. Importantly, both the BECs and SECs interface with their most luminal layer of extracellular matrix (ECM) termed the endothelial glycocalyx (ecGCx) that serves as a protective shield to the vessel contents [73,74] are known to initially separate the circulating blood from the CNS cells and interstitial fluid and further BECs are also known to have a paucity of pinocytosis as compared to SECs [75,76].
SECs and BECs activation indicate an endothelial proinflammatory response, while SECs and BECs dysfunction indicate a decrease in protective (antioxidant, anti-inflammatory, antithrombotic, and vasodilation effects) bioavailable nitric oxide (NO) [36,53,77]. The peripheral SECs are constantly being exposed to numerous injurious stimuli as in Figure 1, which are capable of inducing SECact/dys. These exposures are known to instigate SEC activation of leukocytes to the central nervous system (CNS) neurovascular units BBB with increased permeability but also deliver increased peripheral cytokines and chemokines (pCC). Further, these increased pCC associate with endothelial dysfunction and decreased NO with increased OxRS and neuroinflammation, which eventually create a double vicious cycle between OxRS and inflammation via the nuclear factor-kappa B in SECs and at the NVU BEC BBB interface (Figure 9) [77].
Notably, these double vicious cycles in Figure 5 contribute to a proconstrictive state at the precapillary arterioles and true capillary of the NVU in addition to leukocyte adhesion and even stalling of cerebral blood flow. Also, advanced glycation endproducts and their receptors (AGE/RAGE) activation result in increased OxRS that in turn activates local MMP-2, 9 with increased proteolysis including the BBB tight and adherens junctions with resulting increased permeability. These changes contribute to endothelial nitric oxide synthase (eNOS) uncoupling and decreased NO bioavailability with hypoperfusion and hypometabolism to regional neurons with neurodegeneration, impaired cognition, brain atrophy and LOAD.
NO synthesized and secreted by SECs and BECs is known to function as a vasculo-protectant, in that, it has antiplatelet, antithrombotic, anti-inflammatory, antiatherosclerotic and vasorelaxant effects as a gasotransmitter synthesized by the endothelial nitric oxide synthase (eNOS) enzyme. NO is capable of undergoing paracrine signaling to the immediate surrounding pericytes (at the level of capillary NVUs) and vascular smooth muscle cells (at the level of arterioles and arteries) to result in vasorelaxation due to its activation of soluble guanylyl cyclase to increase the synthesis of 3,5-cyclic guanosine monophosphate [78].
Decreased NO bioavailability as occurs in CCVDs due to endothelial dysfunction is due largely to eNOS uncoupling, wherein increased OxRS results in the excessive oxidation of the essential coenzyme tetrahydrobiopterin (BH4) to the ineffective dihydrobiopterin (BH2). Notebly, the eNOS reaction will only run if its essential coenzyme is fully reduced to its BH4 moiety. Also, elevated asymmetrical dimethyl arginine (ADMA), a known competitive inhibitor of eNOS enzyme reaction) is capable of decreasing bioavailable NO [77,78]. Indeed, SEC and BEC dysfunction with decreased bioavailable NO sound an alarm not only to the SECs and BECs but also other supportive cells of extracranial arteries (VSMCs) and the microvessel NVU mural supportive cells (Pcs and connecting astrocyte endfeet of NVU) as well as the CNS cells (Figure 10) [25,78].
ECs (SECs and BECs) are the first cells to be exposed to multiple injurious species as in figures 1 and 6 and they react to these injuries with an injury response that has multiple phases resulting in structural and functional responses. Over the past decade authors have observed at least 10 ultrastructural remodeling phenotypes in the thoracic aorta and NVU ECs in various models that associate with BECact/dys, BBBdd, SVD, and VAS in aortic ECs and microvascular NVU BECs from various models (Figure 11) [25,26,27].
4.1. Western Diet-Induced Obesity Is Also Known to Contain a High-Salt Component That Increases VAS.
Importantly, the heavily consumed Western diet is consistently known to have not only a high fat and carbohydrate component but also a high sodium-salt component that also contributes to an increase in VAS [74,75]. Elevations of sodium chloride in the Western diet are toxic to the vascular endothelium and are known to result in endothelial glycocalyx dysfunction and damage with attenuation and/or loss, EC OxRS, ECact/dys that induces a proinflammatory endothelium with decreased NO bioavailability, activation of MMP-2, 9, TGFβ, transglutaminase 2, elastin fragmentation and increased collagen with decreased elastin/collagen ratio and crosslinking in addition to activating the RAAS and increase AT-1 receptors along with increased endothelial sodium channel (eNAC) activity to promote VAS as illustrated in Figure 10 [79,80,81].
5. Metabolic Syndrome (MetS): Role in the Development of VAS
The MetS is a metabolic disorder that consists of a cluster of multiple risk factors including hyperlipidemia (obesity), hyperinsulinemia (IR), essential HTN-ISH, hyperglycemia (impaired glucose tolerance (IGT) and T2DM and associated variables. In addition to paralleling the obesity epidemic, the MetS associates with an increased risk for the development of T2DM and cerebrocardiovascular disease [38]. Each of the previous four H (horsemen) risk factor clustering, in addition to the MetS itself, play an important role in the development of VAS and LOAD [9,82,83]. MetS is a strong predictor of CCVD disease and VAS, which is increasingly being recognized as a CCVD risk factor, plus components of the MetS are capable of interacting to synergistically impact carotid intimal media thickness and VAS (Figure 12) [83,84].
While the MetS may be viewed as a risk syndrome, it provides a definite platform for the clustering of multiple risk factors and variables that is now known to associate with VAS and this not only helps to broaden our knowledge but also to further bridge the relationship of MetS, VAS, SVD, and neurodegeneration as outlined in the sequence of events as previously outlined in Figure 2, Figure 4 and Figure 5.
6. Extracellular Matrix (ECM) Elastin, Elastin-Derived Peptides (EDPs), Collagen, and Vascular Smooth Muscle Cells (VSMCs) of the Arterial Tunica Media in Vascular Arterial Stiffening (VAS)
In addition to structural remodeling and functional changes in the ECs, VAS also develops due to remodeling alterations in the vascular extracellular matrix characterized by a degraded and fragmented decrease in the elastic recoil protein elastin via elastinolysis and an increase in the stiffer organized collagen via increased synthesis by media VSMCs [50,85]. These findings are further facilitated by the processes of OxRS, inflammation/metainflammation, and AGEs with increased collagen crosslinking that lead to decreased elasticity and vessel compliance with increased PWV and damaging pulsatile pp [85,86]. The VSMCs also develop a synthetic phenotype responsible for increased synthesis of stiffer collagen and proteoglycans (PGNs) that become synthetic, hypertrophic, and capable of migration in contrast to normal contractile phenotypes, termed phenotypic switching (Figure 13) [50,87].
The ECM of the arterial tunica media is composed of elastin, collagen, glycoproteins and proteoglycans, which confers tensile strength and provides viscoelasticity of the conduit arterial vessel walls [88,89,90]. Importantly, when the elastin undergoes elastinolysis there is the generation of elastin-derived fragments that are a rich source of EDPs [90,91,92]. Elastin fibers can be degraded and fragmented by mechanical fatigue, calcification, glycation, lipid peroxidation, and importantly, protease-elastase digestion with fragmentation-degradation [93]. Elastolysis-elastinolysis or elastin degradation is due primarily to elastases that are comprised by MMPs (MMP-2, 7, 9, and 12) and cathepsin cysteine proteases, such as cathepsin S that are activated in response to OxRS primarily generated within the vessel by ECact/dys, activated macrophages, and synthetic VSMCs (Figure 14) [90,91,92,93,94].
It is known that VSMCs become stiff similar to SECs when examined by atomic force microscopy measurements in addition to increasing synthesis of stiffer collagen and PGN [95]. This VSMC stiffness contributes to the overall global increase in aortic stiffening with aging. Notably, this VSMC stiffness is in addition to the fragmentation of elastin with the loss of elastic recoil, increased collagen and PGN synthesis by the synthetic VSMC phenotypes and the stresses placed upon the VSMCs due to mechanotransduction [96,97]. Phenotypic switching from contractile to synthetic, proliferative, and migratory VSMC in VAS allows these migratory VSMC to become mobile and traverse the media to the IEL where they are capable of degrading the IEL and create a neointimal subendothelial space [90,91]. In the Ren2 models, angiotensin-II (AngII) elevation and OxRS are important for the invasive nature of the IEL with the creation of the neointima (Figure 15) [50].
The phenotypic switch of the VSMCs in hypertension and diabetic obese models as in figures 9, 10, and 11 result in the degradation of elastin lamella and the IEL resulting in the EDFs and the production of bioactive EDPs [97]. Bioactive EDPs (matrikines-elastokines) and interactions with their receptor elastin receptor complex (ERC) result in multiple functions that contribute to VAS. Bioactive EDPs promote inflammation, react with RAGE to increase ROS, NFkappaB, and MMP activation. activate cytokines including TNFα and IL-6, increase crosslinking of collagen, and promote VSMC phenotypic switching. These contributions amplify further elastin degradation all of which, promote VAS in CCVDs [88,97,98].
At this juncture it is noteworthy to point out that transglutaminase 2 (TG2) is an enzyme ubiquitously expressed in the vasculature, which promotes the synthesis and crosslinking of extracellular matrix collagen. Increased transglutaminase 2 (TG2) is a known collagen crosslinker that associates with VAS and affects the extracellular matrix by increasing collagen deposition, and crosslinking (in a calcium-dependent manner) that has been long recognized as critical player in vascular stiffening [99,100]. In this regard it is notable that Ramirez-Perez et al. were able to show that cystamine (a nonspecific TG2 inhibitor) was able to reduce vascular stiffness in Western diet-fed female mice; however, they did not determine the extent of these findings in regards to the role of cystamine also being an antioxidant (cystamine metabolized to cysteine and thiosulfate) that could also contribute to the vascular destiffening effects in these models [100].
7. Conclusion and Future Directions
Recently, there has been considerable epidemiological, clinical-pathological and basic science observations that has allowed the research community to reconsider the important role of vascular factors in cognitive impairment. These observations have made it possible to now identify vascular dysfunction and damage (including VAS and SVD) as being critical components of the pathophysiology of age-related dementias including LOAD (Figure 16) [101,102,103,104].
Over time there has been accumulating and consistent evidence that support and definitely implicate both VAS and SVD in the pathogenesis of impaired cognition, neurodegeneration, and dementia including LOAD (Figure 17) [ 27, 105, 106, 107].
Future directions regarding the importance of extracranial vascular stiffening (VAS) revolve around a resurgence of interest regarding the role of not only VAS but also microvessel remodeling that occurs in VCID and how it relates to the development of neurodegeneration as a co-occurance or mixed dementia (MD) of aging along with the LOAD type dementia. While the authors have focused on the importance of VAS throughout this narrative review, we posit that an integrative approach with somewhat of a paradigm shift of an umbrella approach be strongly entertained to examine these burgeoning age-related dementias (Figure 18) [104].
VCID is the second most common cause of dementia after LOAD [108] and it is a common co-occurring form of dementia. At autopsy seldom does one find just pure changes of LOAD (Aβ neuritic plaques and tau NFTs) dementias [108,109]. Indeed, there is a quite complicated interaction between VCID and LOAD pathologies in the evolution of these two most common causes of global dementia, which includes VAS as one of the early component mechanisms in its development and progression [103,108,109]. Therefore, it is suggested that this problem of age-related dementia be approached in an integrative manner without discriminating between being a strictly sporadic Alzheimer’s disease or LOAD and VCID/VaD and consider their co-occurrence as a MD, since they share so many similar risks factors. As the emerging knowledge continues to grow in the field of VCID and their emerging biomarkers (MarkVCID biomarker consortium: https://markvcid.partners.org/about/news), it is felt that the co-occurrence of LOAD and VaD/VCID (i.e. mixed dementia) will continue to become a more futuristic concept allowing the MD concept to flourish [104,105,106].
Notably, there exists a gender difference in the development of VAS and LOAD, in that female individuals have a greater risk for the development of both VAS and LOAD in older populations that are post-menopausal [110,111]. It is possible that the increased risk for females in the development of LOAD may be due to their increase in VAS. Mechanisms for this relationship may involve how VAS relates to the increased risk of SVD with hypoperfusion, CCH, hypometabolism, and neurodegeneration with atrophy and impaired cognition in LOAD as illustrated and discussed previously in figure legends 16-18.
Limitations include those inherent to any narrative review that is focused primarily on a certain topic such as the role of extracranial VAS and its involvement in the development and progression of LOAD. However, this limitation does allow this review to remain focused on its central theme or focus.
Targeting multiple modifiable risk factors have become the main therapeutic strategy to improve arterial stiffness and the additional use of omega-3 fatty acid intake, RAAS antagonists, metformin, HMG-CoA reductase inhibitors have been found to be useful in those individuals with HTN and diabetes as well as those individuals at high cardiovascular risk [112]. In addition to metformin, both of the antidiabetic drugs (SGLT-2 inhibitors and GLP-1R agonists) have the potential and have been shown to decrease VAS [94,113,114,115]. However, there is currently a lack of therapeutic strategies specifically directed at the treatment of VAS. Notably, Ramirez-Perez, et al. recently found that cystamine (a non-specific TG2 antagonist with antioxidant effects) was able to reduce VAS in female Western diet-fed mice [100] and these results may help to instigate future trials with other treatment modalities to specifically decrease VAS. Additionally, authors have recently suggested that sodium thiosulfate may be an innovative, multi-target repurposed strategy for the treatment of LOAD that is based on sodium thiosulfates capability of having anti-inflammatory, antioxidant, chelating, and possible restorative effects of improving the bioavailability of hydrogen sulfide and NO that could also help to attenuate the deleterious effects of VAS and remodeling of the vessel wall in atherosclerosis and hypertension in peripheral artery disease and the development and progression of LOAD [116].
Additional future directions for the treatment of VAS may include the following five points, which may help to attenuate or delay the onset of the development and progression of SVD and LOAD (Box 2) [20,21,22,23].
Box 2. Five key points regarding the future directions in the treatment of extracranial vascular arterial stiffening (VAS) in order to attenuate or decrease the development and progression of SVD and LOAD. Aβ, amyloid beta; HTN, hypertension; LOAD, late-onset Alzheimer’s disease; SVD, cerebral small vessel disease.
Finally, the authors are in hopes that this narrative review will provide readers with an increased database of knowledge in this field of study such that they can continue to develop novel more specifically targeted therapeutic interventions to improve VAS. Thus, reducing the associated neurological remodeling and functional changes associated with the development of SVD and delay the progression of LOAD in this global and ever-increasing aging society at risk.
Author Contributions
Conceptualization, M.R.H.; methodology, M.R.H. and N.T.; software, M.R.H.; validation, M.R.H. and N.T.; formal analysis, M.R.H. and N.T.; investigation, M.R.H. and N.T.; resources, M.R.H.; data curation, M.R.H.; writing—original draft preparation, M.R.H.; writing—review and editing, M.R.H. and N.T.; visualization, M.R.H.; supervision, M.R.H.; project administration, M.R.H.; funding acquisition, M.R.H. All authors have read and agreed to the published version of the manuscript.
Funding
Authors have not received grants from any funding agency in the public, commercial, or not-for-profit sectors to support this manuscript for publication.
Institutional Review Board Statement
The tissues provided for the representative electron microscopic images utilized in this manuscript were all approved in advance by the University of Missouri Institutional Animal Care and Use Committee (No. 190; 7 July 2017). The animals were cared for in accordance with National Institutes of Health guidelines and by the Institutional Animal Care and Use Committees at the Harry S. Truman Memorial Veterans Hospital and the University of Missouri, Columbia, MO, USA, which conformed to the Guide for the Care and Use of Laboratory Animals published by the National Institutes of Health (NIH).
Informed Consent Statement
Not applicable.
Data Availability Statement
The data and materials can be provided upon reasonable request.
Acknowledgments
The author would like to acknowledge Tatyana Shulyatnikova for the contribution of artistic illustrations and editing of this manuscript. The author would also like to acknowledge DeAna Grant Research Specialist of the Electron Microscopy Core Facility at the Roy Blunt NextGen Precision Health Research Center, University of Missouri, Columbia, Missouri.
Conflicts of Interest
The author declares no conflict of interest.
Abbreviations
Aβ, amyloid beta; AGE, advanced glycation endproducts; ADMA, asymmetrical dimethyl arginine; BBB, blood–brain barrier; BEC(s), brain endothelial cell(s); BECact/dys, brain endothelial cell activation/dysfunction; BBBdd, blood-brain barrier dysfunction disruption; BH4-BH2, tetrahydrobiopterin and dihydrobiopterin; CAA, cerebral amyloid angiopathy; CBF, cerebral blood flow; CCVD, cerebrocardiovascular disease; CL, capillary lumen; CMB(s), cerebral microbleeds; CNS, central nervous system; cnsCC, central nervous system cytokines chemokines; HTN, hypertension; HVB, heart vessel brain; IL-6, interleukin-6; IR, insulin resistance; ECM, extracellular matrix; EDPs, elastin derived peptides; eNOS, endothelial nitric oxide synthase; ERC, elastin receptor complex; LOAD, late-onset Alzheimer’s disease; MCI, mild or minimal cognitive impairment; MCP-1, monocyte chemoattract protine-1; MD(s), mixed dementias; MetS, metabolic syndrome; MMP-2,-9, matrix metalloproteinase-2,-9; MRI, magnetic resonance imaging; mtROS, mitochondrial ROS; NADPH Ox, nicotine adenine diphosphate reduced oxidase; ND, neurodegeneration;, NO, nitric oxide; NVU, neurovascular unit; OxRS, oxidative redox stress; pCC, peripheral cytokines chemokines; PWV, pulse wave velocity; pp, pulsatile pulse pressure; RAGE, receptor for advanced glycation endproducts; RAAS, renin angiotensin aldosterone system; Ren2, transgenic heterozygous (mRen2)27; ROS, reactive oxygen species, RONS, reactive oxygen, nitrogen species; RONSS, reactive oxygen, nitrogen, sulfur species; RSI, reactive species interactome; SECs, systemic endothelial cells; SECact/dys, systemic endothelial cell activation/dysfunction; SVD, cerebral small vessel disease; T2DM, type 2 diabetes mellitus; TEM, transmission electron microscopy; tumor necrosis factor alpha; VaD, vascular dementia; VAS, vascular arterial stiffness; VCID, vascular contributions to cognitive impairment and dementia; VOC, vascular ossification-calcification; VSMC(s), vascular smooth muscle cells; WMH, white matter hyperintensities.
References
- Roth GA, Mensah GA, Johnson CO, Addolorato G, Ammirati E, Baddour LM, et al. Global Burden of Cardiovascular Diseases and Risk Factors, 1990-2019: Update From the GBD 2019 Study. J Am Coll Cardiol. 2020;76(25):2982-3021. [CrossRef]
- Vos, T. , Lim S.S., Abbafati C. Global burden of 369 diseases and injuries in 204 countries and territories, 1990–2019: a systematic analysis for the Global Burden of Disease Study 2019. Lancet. 2020;396:1204–1222. [CrossRef]
- Mensah, G.A. , Roth G.A., Fuster V. The global burden of cardiovascular diseases and risk factors: 2020 and beyond. J Am Coll Cardiol. 2019;74:2529–2532. [CrossRef]
- Cecelja M, Chowienczyk P. Role of arterial stiffness in cardiovascular disease. JRSM Cardiovasc Dis. 2012;1(4):cvd.2012.012016. [CrossRef]
- Mitchell GF, Parise H, Benjamin EJ, et al. “Changes in arterial stiffness and wave reflection with advancing age in the Framingham Heart Study.” Hypertension. 2004;43(6):1239-1245. [CrossRef]
- Safar ME, Asmar R, Benetos A, Blacher J, Boutouyrie P, Lacolley P, et al. Interaction Between Hypertension and Arterial Stiffness. Hypertension. 2018;72(4):796-805. [CrossRef]
- Maier JA, Andrés V, Castiglioni S, Giudici A, Lau ES, Nemcsik J, et al. Aging and Vascular Disease: A Multidisciplinary Overview. J Clin Med. 2023;12(17):5512. [CrossRef]
- Laurent S, Boutouyrie P, Asmar R, Gautier I, Laloux B, Guize L, Ducimetiere P, Benetos A. Aortic stiffness is an independent predictor of all-cause and cardiovascular mortality in hypertensive patients. Hypertension. 2001;37(5):1236-41. [CrossRef]
- Lopes-Vicente WRP, Rodrigues S, Cepeda FX, Jordão CP, Costa-Hong V, Dutra-Marques ACB, et al. Arterial stiffness and its association with clustering of metabolic syndrome risk factors. Diabetol Metabol Syndr. 2017;9:87. [CrossRef]
- Cohen JB, Mitchell GF, Gill D, Burgess S, Rahman M, Hanff TC, Ramachandran VS, Mutalik KM, Townsend RR, Chirinos JA. Arterial Stiffness and Diabetes Risk in Framingham Heart Study and UK Biobank. Circ Res. 2022;131(6):545-554. Epub 2022. [CrossRef]
- Wang M, Huang J, Wu T, Qi L Arterial Stiffness, Genetic Risk, and Type 2 Diabetes: A Prospective Cohort Study. Diabetes Care. 2022;45(4):957-964. [CrossRef]
- Urbina EM, Gao Z, Khoury PR, Martin LJ, Dolan LM. Insulin resistance and arterial stiffness in healthy adolescents and young adults. Diabetologia. 2012;55(3):625-631. [CrossRef]
- Safar ME, Czernichow S, Blacher J. Obesity, arterial stiffness, and cardiovascular risk. J Am Soc Nephrol. 2006;17(4 Suppl 2):S109-11. [CrossRef]
- Aroor AR, Jia G, Sowers JR. Cellular mechanisms underlying obesity-induced arterial stiffness. Am J Physiol Regul Integr Comp Physiol. 2017;314(3):R387–R398. [CrossRef]
- Camplain R, Meyer ML, Takana H, Palta P, Agarwal SK, Aguila D, Butler KR, Heiss G. Smoking Behaviors and Arterial Stiffness Measured by Pulse Wave Velocity in Older Adults: The Atherosclerosis Risk in Communities (ARIC) Study. Am J Hypertens. 2016;29(11):1268-1275. [CrossRef]
- Saladini, F. Effects of Different Kinds of Physical Activity on Vascular Function. J Clin Med. 2023;13(1):152. [CrossRef]
- Ramirez-Perez FI, Cabral-Amador FJ, Whaley-Connell AT, Aroor AR, Morales-Quinones M, Woodford ML, et al. Cystamine reduces vascular stiffness in Western diet-fed female mice. Am J Physiol Heart Circ Physiol. 2022 Feb 1;322(2):H167-H180. [CrossRef]
- Padilla J, Ramirez-Perez FI, Habibi J, Bostick B, Aroor AR, Hayden MR, et al. Regular Exercise Reduces Endothelial Cortical Stiffness in Western Diet-Fed Female Mice. Hypertension. 2016 Nov;68(5):1236-1244. [CrossRef]
- van Sloten TT, Stehouwer CDA. Carotid Stiffness: A Novel Cerebrovascular Disease Risk Factor. Pulse (Basel). Pulse (Basel). 2016;4(1):24–27. [CrossRef]
- Zieman SJ, Melenovsky V, Kass DA. Mechanisms, pathophysiology, and therapy of arterial stiffness. Arterioscler Thromb Vasc Biol. 2005;25(5):932-43. [CrossRef]
- Agbaje, AO. Arterial stiffness precedes hypertension and metabolic risks in youth: a review. Journal of Hypertension. 2022;49(1):1887-1896. [CrossRef]
- Nyúl-Tóth Á, Patai R. Csiszar A, Ungvari A, Gulej R, Mukli P, et al. Linking peripheral atherosclerosis to blood–brain barrier disruption: Elucidating its role as a manifestation of cerebral small vessel disease in vascular cognitive impairment. Geroscience. 2024;46(6):6511-6536. [CrossRef]
- Hughes TM, Craft S, Lopez OL. Review of ‘the potential role of arterial stiffness in the pathogenesis of Alzheimer’s disease’. Neurodegener Dis Manag. 2015;5(2):121–135. [CrossRef]
- Hayden MR, Tyagi SC. Intimal redox stress: accelerated atherosclerosis in metabolic syndrome and type 2 diabetes mellitus. Atheroscleropathy. 2002;1:3. [CrossRef]
- Hayden, MR. Brain endothelial cell activation and dysfunction associate with and contribute to the development of enlarged perivascular spaces and cerebral small vessel disease. Histol Histopathol. 2024;39(12):1565-1586. [CrossRef]
- Hayden, MR. Brain Injury: Response to Injury Wound-Healing Mechanisms and Enlarged Perivascular Spaces in Obesity, Metabolic Syndrome, and Type 2 Diabetes Mellitus. Medicina (Kaunas). 2023;59(7):1337. [CrossRef]
- Hayden MR. Paying Homage to Microvessel Remodeling and Small Vessel Disease in Neurodegeneration: Implications for the Development of Late-Onset Alzheimer’s Disease. J Vasc Dis. 2024;3(4):419-452; [CrossRef]
- Thorin-Trescases N, de Montgolfier O, Pinçon A, Raignault A, Caland L, Labbé P, Thorin E. Impact of pulse pressure on cerebrovascular events leading to age-related cognitive decline. Am J Physiol Heart Circ Physiol. 2018;314(6):H1214–H1224. [CrossRef]
- Mitchell, GF. Arterial Stiffness in Aging: Does It Have a Place in Clinical Practice?: Recent Advances in Hypertension. Hypertension. 2021;77(3):768-780.
- Greenwald, SE. Ageing of the conduit arteries. J Pathol. 2007;211(2):157-172. [CrossRef]
- Laurent S, Boutouyrie P. Arterial Stiffness and Hypertension in the Elderly. Front Cardiovasc Med. 2020;7:544302. [CrossRef]
- Kim, HL. Arterial stiffness and hypertension. Clin Hypertens. 2023;29:31. [CrossRef]
- Sun, Z. Aging, Arterial Stiffness, and Hypertension. Hypertension. 2015;65(2):252-256. [CrossRef]
- MacMahon S, Peto R, Cutler J, Collins R, Sorlie P, Neaton J, et al. Blood pressure, stroke, and coronary heart disease. Part 1: prolonged differences in blood pressure: prospective observational studies corrected for the regression dilution bias. Lancet. 1990;335(8692):765–774. [CrossRef]
- Wiesmann M, Kiliaan AJ, Claassen JA. Vascular aspects of cognitive impairment and dementia. J Cereb Blood Flow Metab. 2013;33(11):1696–1706. [CrossRef]
- Libby, P. Current Concepts of the Pathogenesis of the Acute Coronary Syndromes. Circulation 104(3):365-372. [CrossRef]
- Poznyak AV, Sadykhov NK, Kartuesov AG, Borisov EE, Melnichenko AA, Grechko AV Orekhov AN. Hypertension as a risk factor for atherosclerosis: Cardiovascular risk assessment. Front Cardiovasc Med. 2022;9:959285. [CrossRef]
- Hayden, MR. Overview and New Insights into the Metabolic Syndrome: Risk Factors and Emerging Variables in the Development of Type 2 Diabetes and Cerebrocardiovascular Disease. Medicina (Kaunas). 2023;59(3):561. [CrossRef]
- Demer LL, Tintut Y. Vascular Calcification: Pathobiology of a Multifaceted Disease. Circulation. 2008 ;117(22):2938–2948. [CrossRef]
- Yagita, Y. Distinct pathophysiology of small vessel disease from atherosclerosis. Hypertens Res. 2024;47, 3073–3074 (2024). [CrossRef]
- Langbaum JB, Chen K, Launer LJ, et al. Blood pressure is associated with higher brain amyloid burden and lower glucose metabolism in healthy late middle-age persons. Neurobiol Aging. 2012;33(4):827, e811–e829. [CrossRef]
- Toledo JB, Toledo E, Weiner MW, et al. Cardiovascular risk factors, cortisol, and amyloid-beta deposition in Alzheimer’s Disease Neuroimaging Initiative. Alzheimers Dement. 2012;8(6):483–489. [CrossRef]
- Hughes TM, Kuller LH, Barinas-Mitchell EJM, et al. Pulse wave velocity is associated with β-amyloid deposition in the brains of very elderly adults. Neurology. 2013;81(19):1711–1718. [CrossRef]
- Hughes TM, Kuller LH, Barinas-Mitchell EJM, et al. Arterial stiffness and beta-amyloid progression in nondemented elderly adults. JAMA Neurol. 2014;71(5):562–568. [CrossRef]
- Herrrington W, Lacey B, Sherliker P, Armitage J, Lewington S Epidemiology of Atherosclerosis and the Potential to Reduce the Global Burden of Atherothrombotic Disease. Circ Res. 2016 Feb 19;118(4):535-546. [CrossRef]
- Xie B, Shi X, Xing Y, Tang Y. Association between atherosclerosis and Alzheimer’s disease: A systematic review and meta-analysis. Brain Behav. 2020;10(4):e01601. [CrossRef]
- Stary, HC. Composition and classification of human atherosclerotic lesions. Virchows Arch A Pathology Anat Histopathol. 1992;421(4):277-290. [CrossRef]
- Stary HC, Blankenhorn DH, Chandler AB, Glagov S, Insull Jr W, Richardson M, et al. A definition of the intima of human arteries and of its atherosclerosis-prone regions. A report from the Committee on Vascular Lesions of the Council on Arteriosclerosis, American Heart Association, Circulation. 1992;85(1):391-405. [CrossRef]
- Hayden MR, Habibi J, Joginpally T, Karuparthi PR, Sowers JR. Ultrastructure Study of Transgenic Ren2 Rat Aorta - Part 1: Endothelium and Intima. Cardiorenal Med. 2012;2(1):66-82. [CrossRef]
- Hayden MR, Sowers JR, DeMarco VG. Ultrastructure study of the transgenic REN2 rat aorta – part 2: media, external elastic lamina, and adventitia. Biomed Reviews. 2019;30:111-123. doi: https://journals.mu-varna.bg/index.php/bmr/article/view/6392.
- Hayden MR, Tyagi SC. Vasa vasorum in plaque angiogenesis, metabolic syndrome, type 2 diabetes mellitus, and atheroscleropathy: a malignant transformation. Cardiovasc Diabetol. 2004;3:1. [CrossRef]
- Falk, E. Pathogenesis of atherosclerosis. J Am Coll Cardiol. 2006;47(8 Suppl):C7-12. [CrossRef]
- Libby, P. The changing landscape of atherosclerosis. Nature. 2021;592(7855):524-533. [CrossRef]
- Hayden MR, Reidy M. Many roads lead to atheroma. Nat Med. 1995;1(1):22-23. [CrossRef]
- Stehouwer CD, Henry RM, Ferreira I. Arterial stiffness in diabetes and the metabolic syndrome : a pathway to cardiovascular disease. Diabetologia. 2008;51(4):527-539. [CrossRef]
- Hayden MR, Karuparthi PR, Chaudhury NA, Gorindarajan G, Habibi J,Ortman RA. Autoimmune Vasculitits and Plaque Erosion in the Cardiometabolic Syndrome and Type 2 Diabetes mellitus. J Cardiometabolic Syn. 2007;1(3):228-232. [CrossRef]
- Lorentzen KA, Chai S, Chen H, Danielsen CC, Simonsen U, Wogensen L. Mechanisms involved in extracellular matrix remodeling and arterial stiffness induced by hyaluronan accumulation. Atherosclerosis. 2016:244:195-203. [CrossRef]
- White LR, Edland SD, Hemmy LS, Montine KS, Zarow C, Sonnen JA, et al. Neuropathologic comorbidity and cognitive impairment in the Nun and Honolulu-Asia Aging.
- Denswil NP, van der Wal AC, Ritz K, J de Boer O, Aronica E, Troost D, Daemen MJAP. Atherosclerosis in the circle of Willis: Spatial differences in composition and in distribution of plaques. Atherosclerosis. 2016;251:78-84. [CrossRef]
- Roher AE, Esh C, Kokjohn TA, Kalback W, Luehrs DC, Seward JD, Sue LI, Beach TG. Circle of willis atherosclerosis is a risk factor for sporadic Alzheimer’s disease. Arterioscler Thromb Vasc Biol. 2003;23(11):2055-62. [CrossRef]
- Beach TG, Wilson JR, Sue LI, Newell A, Poston M, Cisneros R, Pandya Y, Esh C, Connor DJ, Sabbagh M, Walker DG, Roher AE. Circle of Willis atherosclerosis: association with Alzheimer’s disease, neuritic plaques and neurofibrillary tangles. Acta Neuropathol. 2007;113(1):13-21. [CrossRef]
- Dearborn JL, Zhang Y, Qiao Y, Suri MFK, Liu L, Gottesman RF, et al. Intracranial atherosclerosis and dementia. The Atherosclerosis Risk in Communities (ARIC) Study. Neurology. 2017;88(16):1556–1563. [CrossRef]
- Wang X, Chen X, Chen Z, Zhang M. Arterial Calcification and Its Association With Stroke: Implication of Risk, Prognosis, Treatment Response, and Prevention. Front Cell Neurosci. 2022;16:845215. [CrossRef]
- Wu XH, Chen XY, Wang LJ, Wong KS. Intracranial Artery Calcification and Its Clinical Significance. J Clin Neurol. 2016;12(3):253-261. [CrossRef]
- Tesauro M, Mauriello A, Rovella V, Annicchiarico-Petruzzelli M, Cardillo C, Melino G, Daniele ND. Arterial ageing: from endothelial dysfunction to vascular calcification. J Intern Med. 2017;281(5):471-482. [CrossRef]
- Wu M, Rementer C, Giachelli CM. Vascular Calcification: an Update on Mechanisms and Challenges in Treatment. Calcif Tissue Int. 2013;93(4):365–373. [CrossRef]
- Hayden MR, Tyagi SC, Kolb L, Sowers JR, Khanna R. Vascular ossification-calcification in metabolic syndrome, type 2 diabetes mellitus, chronic kidney disease, and calciphylaxis-calcific uremic arteriolopathy: the emerging role of sodium thiosulfate. Cardiovasc Diabetol. 2005 Mar 18;4:4. [CrossRef]
- Sowers KM, Hayden MR. Calcific uremic arteriolopathy: Pathophysiology, reactive oxygen species and therapeutic approaches. Oxid Med Cell Longev. 2010;3(2):109–121. [CrossRef]
- Vos A, Van Hecke W, Spliet WGM, Goldschmeding R, Isgum I, Kockelkoren R, et al. Predominance of Nonatherosclerotic Internal Elastic Lamina Calcification in the Intracranial Internal Carotid Artery. Stroke. 2016;47(1):221-223. [CrossRef]
- Durham AL, Speer MY, Scatena M, Giachelli CM, Shanahan CM. Role of smooth muscle cells in vascular calcification: implications in atherosclerosis and arterial stiffness. Cardiovasc Res. 2018;114(4):590-600. [CrossRef]
- Pai A, Leaf EM, Abbadi M, Giachelli CM. Elastin Degradation and Vascular Smooth Muscle Cell Phenotype Change Precede Cell Loss and Arterial Medial Calcification in a Uremic Mouse Model of Chronic Kidney Disease. Am J Pathol. 2011;178(2):764–773. [CrossRef]
- McEniery CM, McDonnell BJ, So A, Aitken S, Bolton CE, Munnery M, et al. Aortic calcification is associated with aortic stiffness and isolated systolic hypertension in healthy individuals. Hypertension. 2009;53:524–531. [CrossRef]
- Hayden, MR. The Brain Endothelial Cell Glycocalyx Plays a Crucial Role in the Development of Enlarged Perivascular Spaces in Obesity, Metabolic Syndrome, and Type 2 Diabetes Mellitus. Life (Basel). 2023;13(10):1955. [CrossRef]
- Dogné S, Flamion B, Caron N. Endothelial glycocalyx as a shield against diabetic vascular complications: Involvement of hyaluronan and hyaluronidases. Arterioscler Thromb Vasc Biol. 2018;38:1427–1439. [CrossRef]
- Banks, WA. From blood–brain barrier to blood–brain interface: new opportunities for CNS drug delivery. Nat Rev Drug Discov. 2016;15(4):275–292. [CrossRef]
- Erickson MA, Wilson ML, Banks WA. In vitro modeling of blood–brain barrier and interface functions in neuroimmune communication. Fluids and Barriers. 2020;17:26. [CrossRef]
- Liao, JK. Linking endothelial dysfunction with endothelial cell activation. J Clin Invest. 2013;123(2):540–541. [CrossRef]
- Jin RC, Loscalzo J. Vascular nitric oxide: formation and function. J Blood Med. 2010;1:147–162. [CrossRef]
- Patik JC, Lennon SL, Farquhar WB, Edwards DG. Mechanisms of Dietary Sodium-Induced Impairments in Endothelial Function and Potential Countermeasures. Nutrients. 2021;13(1):270. [CrossRef]
- Safar ME, Thuilliez C, Richard V, Benetos A. Pressure-independent contribution of sodium to large artery structure and function in hypertension. Cardiovasc Res. 2000;46(2):269-276. [CrossRef]
- Grillo A, Salvi L, Coruzzi P, Salvi P, Parati G. Sodium Intake and Hypertension. Nutrients. 2019;11(9):1970. [CrossRef]
- Milionis HJ, Florentin M, Giannopoulos S. Metabolic syndrome and Alzheimer’s disease: a link to a vascular hypothesis. CNS Spectr. 2008;13(7):606-13. [CrossRef]
- Scuteri A, Najjar SS, Muller DC, Andres R, Hougaku H, Metter J, Lakatta EG. Metabolic syndrome amplifies the age-associated increases in vascular thickness and stiffness. Am Coll Cardiol. 2004;43(8):1388-1395. [CrossRef]
- Schillaci G, Pirro M, Vaudo G, Mannarino MR, Savarese G, Pucci G, Franklin SS, Mannarino E. Metabolic Syndrome Is Associated With Aortic Stiffness in Untreated Essential Hypertension. Hypertension. 2005;45(6):1078-82. [CrossRef]
- Ribeiro-Silva JC, P, Krieger JE, Miyakawa AA. Dynamic Crosstalk between Vascular Smooth Muscle Cells and the Aged Extracellular Matrix. Int J Mol Sci. 2021;22(18):10175. [CrossRef]
- Monnier VM, Mustata GT, Biemel KL, Reihl O, Lederer MO, Zhenyu D, Sell DR. Cross-Linking of the Extracellular Matrix by the Maillard Reaction in Aging and Diabetes: An Update on “a Puzzle Nearing Resolution”. Ann. N. Y. Acad. Sci. 2005;1043:533–544. [CrossRef]
- Tang HY, Chen AQ, Zhang H, Gao XF, Kong XQ, Zhang JJ. Vascular Smooth Muscle Cells Phenotypic Switching in Cardiovascular Diseases. Cells. 2022;11(24):4060. [CrossRef]
- Qiu H, Zhu Y, Sun Z, Trzeciakowski JP, Gansner M, Depre C, et al. Vascular Smooth Muscle Cell Stiffness as a Mechanism for Increased Aortic Stiffness with Aging. Circ Res. 2010 Jul 15;107(5):615–619. [CrossRef]
- Chiquet M, Gelman L, Lutz R, Maier S. From mechanotransduction to extracellular matrix gene expression in fibroblasts. Biochim Biophys Acta. 2009;1793(5):911-20. [CrossRef]
- Katsuda S, Kaji T. Atherosclerosis and extracellular matrix. Atheroscl thromb. 2003;10(5):267-274. [CrossRef]
- Smith R, Tomlinson LA, Ford ML, McMahon LP, Rajkumar C, Holt SG. Elastin Degradation Is Associated With Progressive Aortic Stiffening and All-Cause Mortality in Predialysis Chronic Kidney Disease. Hypertension. 2012;59(5):973-8. [CrossRef]
- Cocciolone AJ, Hawes JZ Staiculescu MC, Johnson EO, Murshed M, Wagenseil JE.Elastin, arterial mechanics, and cardiovascular disease. Am J Physiol Heart Circ Physiol. 2018;315(2):H189–H205. [CrossRef]
- Duca L, Blaise S, Romier B, Laffargue M, Gayral S, El Btaouri G, et al. Matrix ageing and vascular impacts: focus on elastin fragmentation. Cardiovasc Res. 2016;110(3):298-308. [CrossRef]
- Hayden, MR. Empagliflozin Ameliorates Tinica Adiposa Expansion and Vascular Stiffening of the Descending Aorta in Female db db Mice. Adipobiology. 2020;10(2019).1. [CrossRef]
- Louis SF, Zahradka P. Vascular smooth muscle cell motility: From migration to invasion. Exp Clin Cardiol. 2010 Winter;15(4):e75-85.
- Ridley AJ, Schwartz MA, Burridge K, Firtel RA, Ginsberg MH, Borisy G, Parsons JT, Horwitz AR. Cell migration: integrating signals from front to back. Science. 2003;302(5651):1704-1709. [CrossRef]
- Le Page A, Khalil A, Vermette P, Frost EH, Larbi A, Witkowski JM, Fulop T. The role of elastin-derived peptides in human physiology and diseases. Matrix Biol. 2019:84:81-96. [CrossRef]
- Wahart A, Hocine T, Albrecht C, Henry A, Sarazin T, Martiny L, et al. Role of elastin peptides and elastin receptor complex in metabolic and cardiovascular diseases. FEBS J. 2019;286(15):2980-2993. [CrossRef]
- Babici D, Kudej RK, McNulty T, Zhang J, Oydanich M, Berkman T, et al. Mechanisms of increased vascular stiffness down the aortic tree in aging, premenopausal female monkeys. Am J Physiol Heart Circ Physiol.2020;319(1):H222-H234. [CrossRef]
- Ramirez-Perez FI, Cabral-Amador FJ, Whaley-Connell AT, Aroor AR, Morales-Quinones M, Woodford ML, et al. Cystamine reduces vascular stiffness in Western diet-fed female mice. Am J Physiol Heart Circ Physiol. 2022;322(2):H167-H180. [CrossRef]
- Iadecola, C. Neurovascular regulation in the normal brain and in Alzheimer’s disease. Nat Rev Neurosci 2004;5:347–60. [CrossRef]
- Iadecola, C. The neurovascular unit coming of age: a journey through neurovascular coupling in health and disease. Neuron 2017;96:17–42. [CrossRef]
- Iadecola C, Duering M, Hachinski V, Joutel A, Pendlebury ST, Schneider JA, Dichgans M Vascular Cognitive Impairment and Dementia. J Am Coll Cardiol. 2019;73(25):3326–3344. [CrossRef]
- Hayden, MR. Type 2 Diabetes Mellitus Increases the Risk of Late-Onset Alzheimer’s Disease: Ultrastructural Remodeling of the Neurovascular Unit and Diabetic Gliopathy. Brain Sci. 2019;9(10):262. [CrossRef]
- Rabkin, SW. Arterial stiffness: detection and consequences in cognitive impairment and dementia of the elderly. J Alzheimer’s disease. 2012;32(3):541-549. [CrossRef]
- Rabkin SW, Jarvie G. Comparison of vascular stiff-ness in vascular dementia, Alzheimer dementia and cognitive impairment. Blood Pressure. 2011;20(5):274-83do i: 10.3109/08037051.2011.566246.
- O’Rourke MF, Safar ME. Relationship between aortic stiffening and microvascular disease in brain and kidney:Cause and logic of therapy. Hypertension. 2005;46(1):200-204. [CrossRef]
- Hosoki S, Hansra GK, Jayasena T, Poljak A, Mather KA, Catts VS, et al. Molecular biomarkers for vascular cognitive impairment and dementia. Nat Rev Neurol. 2023;19(12):737-753. [CrossRef]
- Gorelick PB, Scuteri A, Black SE, Decarli C, Greenberg SM, Iadecola C, et al.Vascular contributions to cognitive impairment and dementia: a statement for healthcare professionals from the american heart association/american stroke association. Stroke. 2011;42(9):2672-713. [CrossRef]
- Waddell TK, Dart AM, Gatzka CD, Cameron JD, Kingwell BA. Women exhibit a greater age-related increase in proximal aortic stiffness than men. J Hypertens. 2001;19(12):2205–2212. [CrossRef]
- Kehmeier MN, Walker AE. Sex Differences in Large Artery Stiffness: Implications for Cerebrovascular Dysfunction and Alzheimer’s Disease. Front Aging. 2021;2:791208. [CrossRef]
- Kling MA, Trojanowski JQ, Wolk DA, Lee VMY, Arnold SE. Alzheimers Dement. 2012;9(1):76–92. [CrossRef]
- Aroor AR, Das NA, Carpenter AJ, Habibi J, Jia G, Ramirez-Perez FI, et al. Glycemic control by the SGLT2 inhibitor empagliflozin decreases aortic stiffness, renal resistivity index and kidney injury. Cardiovasc Diabetol. 2018;17(1):108. [CrossRef]
- Wu CF, Liu PY, Wu TJ, Hung Y, Yang SP, Lin GM.Therapeutic modification of arterial stiffness: An update and comprehensive review. World J Cardiol. 2015;7(11):742–753. [CrossRef]
- Wang J, Wang Y, Wang Y, Li Y, Zhang J, Zhang H, et al. Effects of first-line antidiabetic drugs on the improvement of arterial stiffness: A Bayesian network meta-analysis. J Diabetes. 2023;15(8):685–698. [CrossRef]
- Hayden MR, Tyagi N. Sodium Thiosulfate: An Innovative Multi-Target Repurposed Treatment Strategy for Late-Onset Alzheimer’s Disease. Pharmaceuticals (Basel). 2024;17(12):1741. [CrossRef]
Figure 1.
Multiple peripheral-systemic injurious species affect the systemic endothelial cells (SECs) and brain endothelial cells (BECs). Notably, these injurious species contribute to SECs and vascular remodeling to result in vascular arterial stiffening (VAS). These injurious species activate not only SECs but also the BECs of the neurovascular unit (NVU), resulting in BEC activation and dysfunction (BECact/dys) and blood–brain barrier dysfunction/disruption (BBBdd). BECact/dys and BBBdd are biomarkers for the development of cerebral small vessel disease (SVD). Importantly, SVDs may serve as biomarkers of BECact/dys and BBBdd). Note the red-dashed line at the top of this image, which designates the EC plasmalemma location of the multiple injurious species that are responsible for initial SEC and BEC injury in multiple clinical diseases and structural remodeling abnormalities including SVD. SEC injurious species result in a SEC fragmentation and attenuation and/or loss of elastin that is replaced with stiffened collagen and accumulation of proteoglycans along with vascular smooth muscle cell hypertrophy and migratory phenotypes in addition to SEC stiffening contributing to VAS. BEC insulin resistance associated with an increase in glucose and the AGE receptor (RAGE) interaction is also important in the development of BECact/dys, BBBdd, and neurodegeneration (not shown). Also, note that angiotensin II (AngII) denotes the activation of the renin-angiotensin-aldosterone system (RAAS) including the endothelial cell mineralocorticoid receptor (ECMR) for aldosterone and that both play a role in the development of arterial stiffening. This modified image is provided with permission by CC 4.0 [3,4,5,6]. AGE, advanced glycation end products; Ang II, angiotensin two; BBB, blood–brain barrier; BEC, brain endothelial cell; BBBdd, blood–brain barrier dysfunction and disruption; BECact/dys, brain endothelial cell activation/dysfunction; BH4, tetrahydrobiopterin; CCL2, chemokine (C-C motif) ligand 2; Cox-2, cyclo-oxygenase-2; Cox-2/PGE2 axis, cyclo-oxygenase-2/prostaglandin E2; downward arrows, arrowheads, denote call outs; ecGCx, endothelial glycocalyx; ICAM-1, intercellular adhesion molecule-1; IL-1β, interleukin-1β; IL-6, interleukin-6; JAMs, junctional adhesion molecules; LDL, low-density lipoprotein cholesterol; LPa, lipoprotein little a; MCP-1, monocyte chemotactic protein-1; NO, nitric oxide; Nox2, nicotinamide adenine dinucleotide phosphate oxidase (NADPH Ox); peroxinitrite (ONOO-); pnsCC, peripheral nervous system cytokines/chemokines; pp, pulsatile-pulse pressure;, NVU, neurovascular unit; RBC, red blood cell; Red arrows, denote increase; RONSS, reactive oxygen, nitrogen, sulfur species; ROS, reactive oxygen species; RSI, reactive species interactome; T, transcytosis; TNFα, tumor necrosis factor alpha; underlining, denotes emphasis; upward arrows, denote increase; VCAM-1, vascular cellular adhesion molecule-1; WBC, white blood cell.
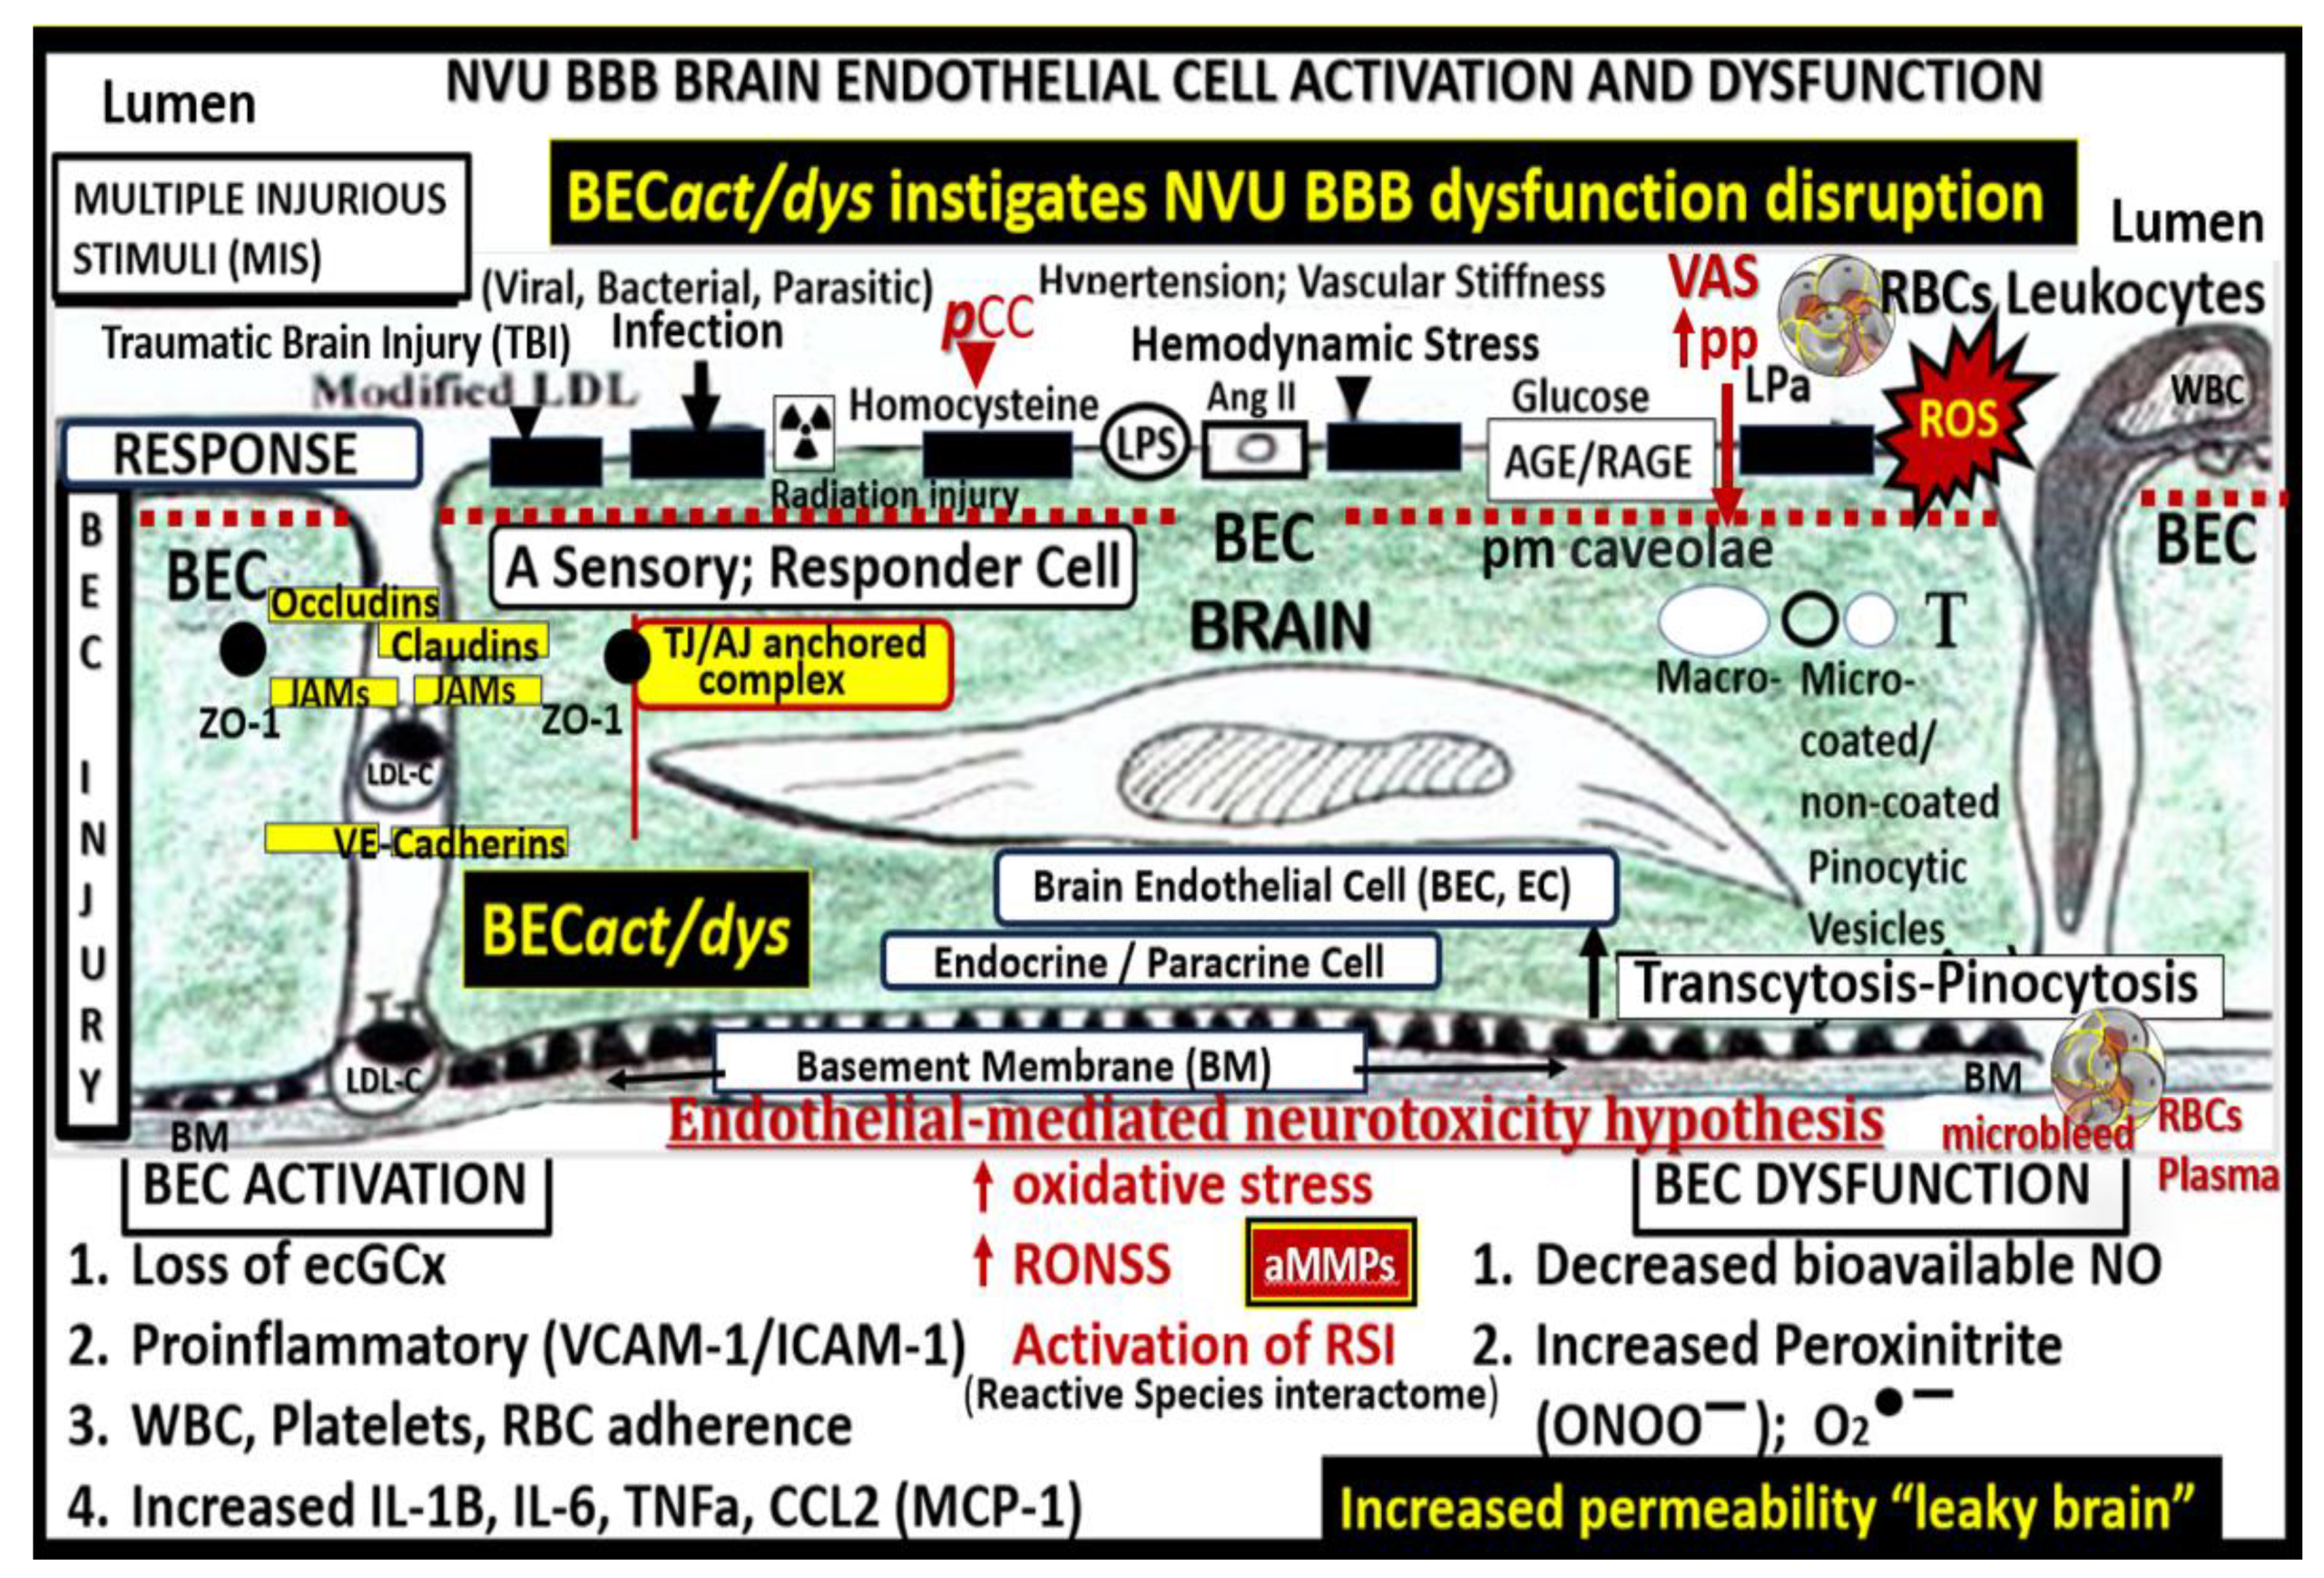
Figure 2.
Possible four-step sequence of events (S1–S4) implicating extracranial vascular arterial stiffening (VAS) in the development and progression of neurodegeneration and late-onset Alzheimer’s disease (LOAD). Step 1. Includes aging, genetics, hypertension inclusive of essential hypertension (eHTN) and the more predominant isolated systolic hypertension (ISH) in the elderly, and atherosclerosis that is inclusive of vascular ossification calcification (VOC), metabolic syndrome (MetS), insulin resistance (IR), and type 2 diabetes mellitus (T2DM). Step 2. Includes extracranial vascular arterial stiffening/stiffness (VAS), oxidative redox stress and vascular inflammation, stroke (primarily ischemic and secondarily hemorrhagic), and vascular contributions to impaired cognition and dementia (VCID). Step 3. Includes small vessel disease (SVD), which includes lacunes, white matter hyperintensities, enlarged perivascular spaces, and cerebral microbleeds that contribute to chronic cerebral hypoperfusion (CCH). Step 4. Includes neurodegeneration, atrophy, and LOAD. ECM, extracellular matrix including both collagen and proteoglycans, CCH, chronic cerebral hypoperfusion and hypometabolism; MCI, mild cognitive impairment; open arrows, represent icons meaning leading to; SECact/dys, systemic endothelial cell activation and dysfunction; VSMC, vascular smooth muscle cell(s).
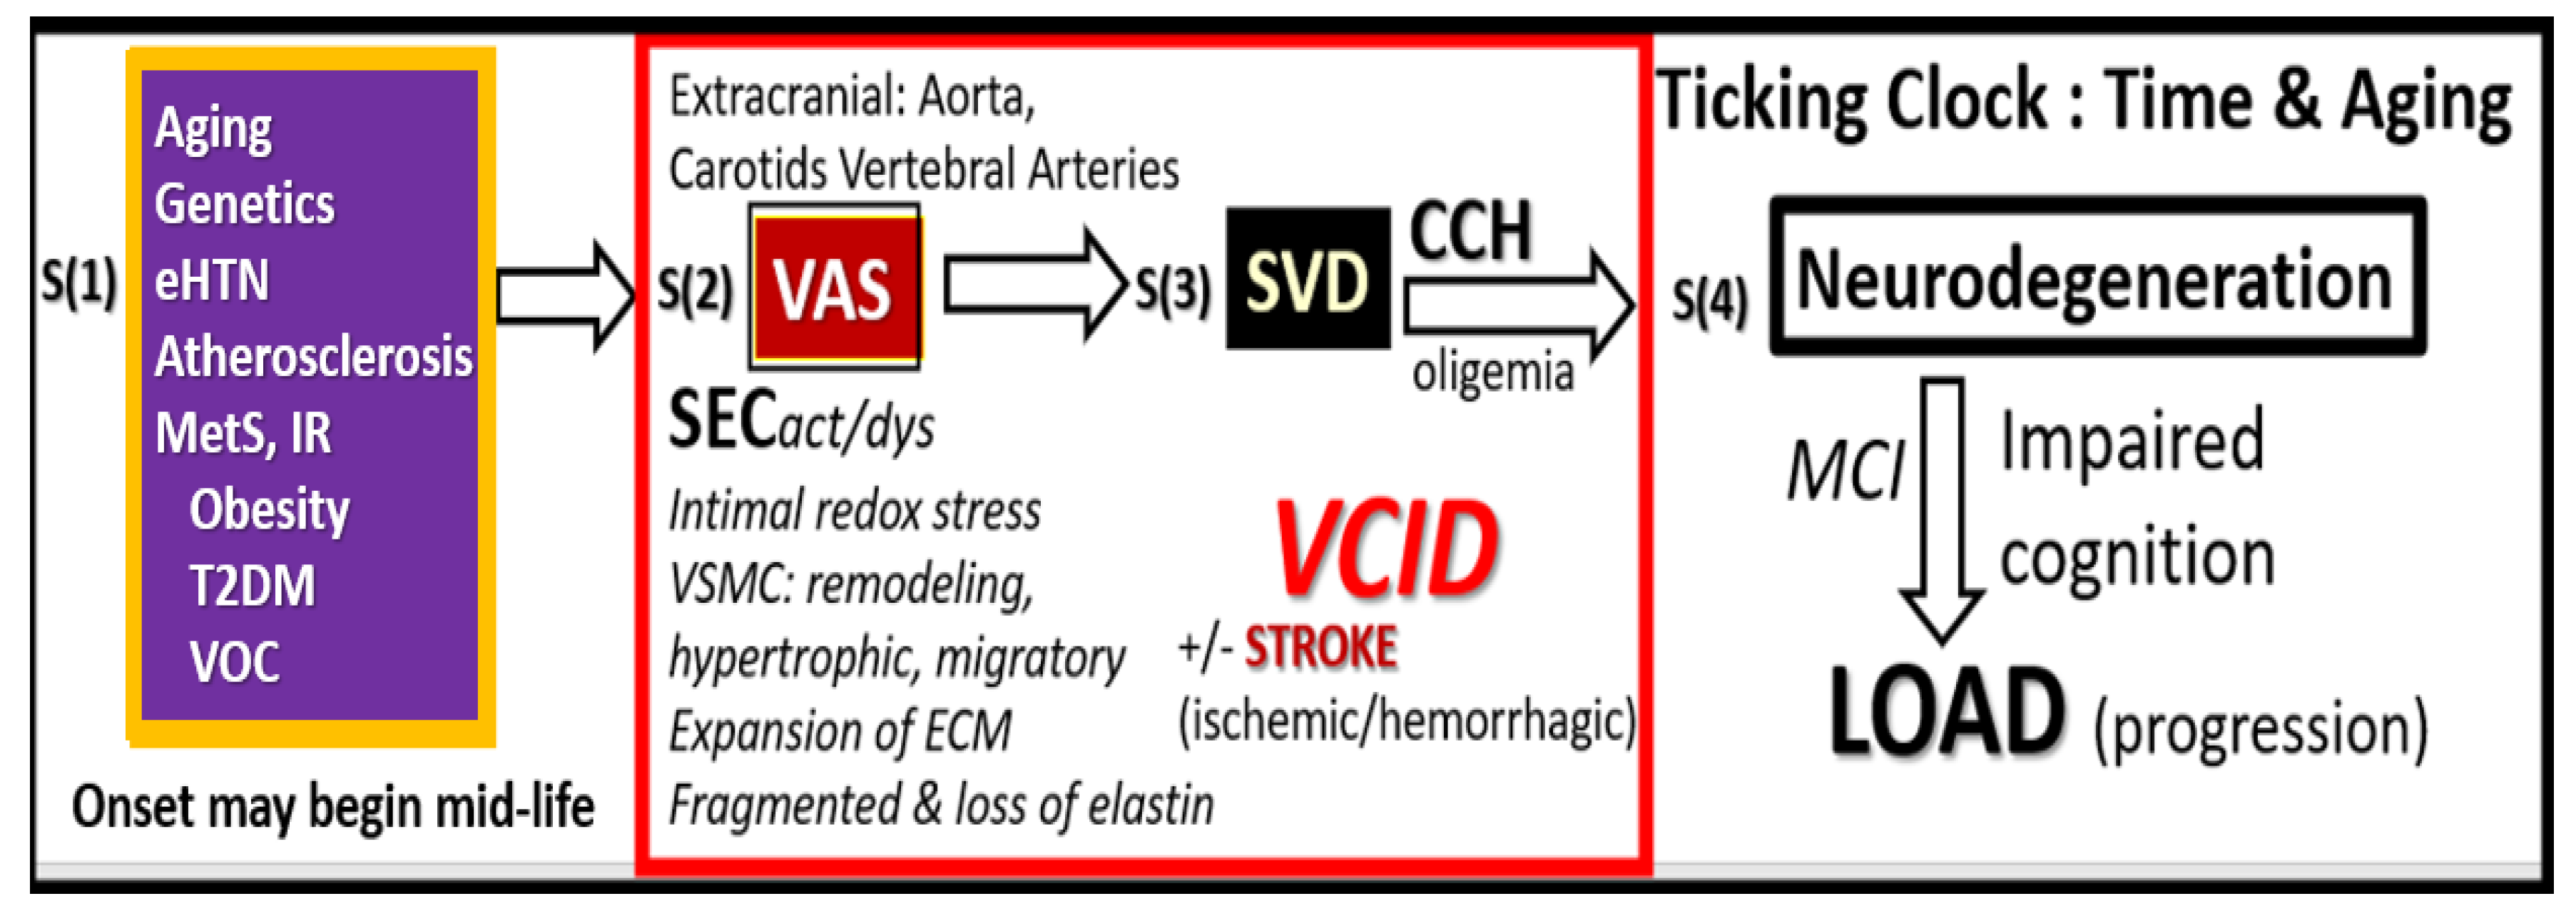
Figure 3.
The essential hypertension (HTN) wheel. This HTN wheel depicts insulin resistance (IR) as a central core feature of the wheel as it is also the central core feature in the metabolic syndrome (MetS). IR is a central mediator for the development of HTN, impaired fasting glucose (IFG), impaired glucose tolerance (IGT), and type two diabetes mellitus (T2DM) along with multiple metabolic and clinical boxed-in conditions that surround the outer positions of this hypertension wheel. Extracranial vascular arterial stiffening (VAS) is placed at the top of the wheel because it is believed to be a driving force behind the subsequent clinical end-organ cerebral small vessel disease (SVD) remodeling in addition to the development of HTN. Systemic and brain endothelial cell activation and dysfunction (SEC and BEC respectively) are represented by ECact/dys at the bottom of the wheel result in increased peroxynitrite (ONOO−) and decreased nitric oxide (NO) bioavailability (asterisk). Also, peroxynitrite is generated by the reaction between superoxide and NO. Note the multiple diseases that are associated with HTN (black boxes surrounding the HTN wheel), and the wheel also depicts the interconnectedness between HTN and the multiple disease states, including vascular stiffening. Thus, obesity, IR, HTN, and T2DM are not to be underestimated. Atheroscleropathy is a term that may be used when discussing accelerated atherosclerosis and macrovascular disease in those individuals with T2DM and the MetS. The wheel was chosen as a background icon because it goes round and round, and over time it just keeps on turning and results in vascular arterial stiffening (VAS) and end-organ damage in the heart-vessel-brain axis that has high capillary flow with low resistance and increased vulnerability to the increased pulsatile pulse pressure and pulse wave velocity associated with vascular stiffening, HTN, and microvascular disease. Modified image provided with permission by CC 4.0 [34]. Asterisk, equals emphasis; CAD, coronary artery disease; CCVD, cerebrocardiovascular disease; CHF, congestive heart failure; CKD, chronic kidney disease; Dd, diastolic dysfunction; eNOS, endothelial nitric oxide synthase; ESRD, end-stage renal disease; LOAD, late-onset Alzheimer’s disease; MASLD, metabolic dysfunction-associated liver disease; MI, myocardial infarction; mtROS, mitochondrial reactive oxygen species; O2•–, superoxide; PAD, peripheral artery disease; TIA, transient ischemic attack.
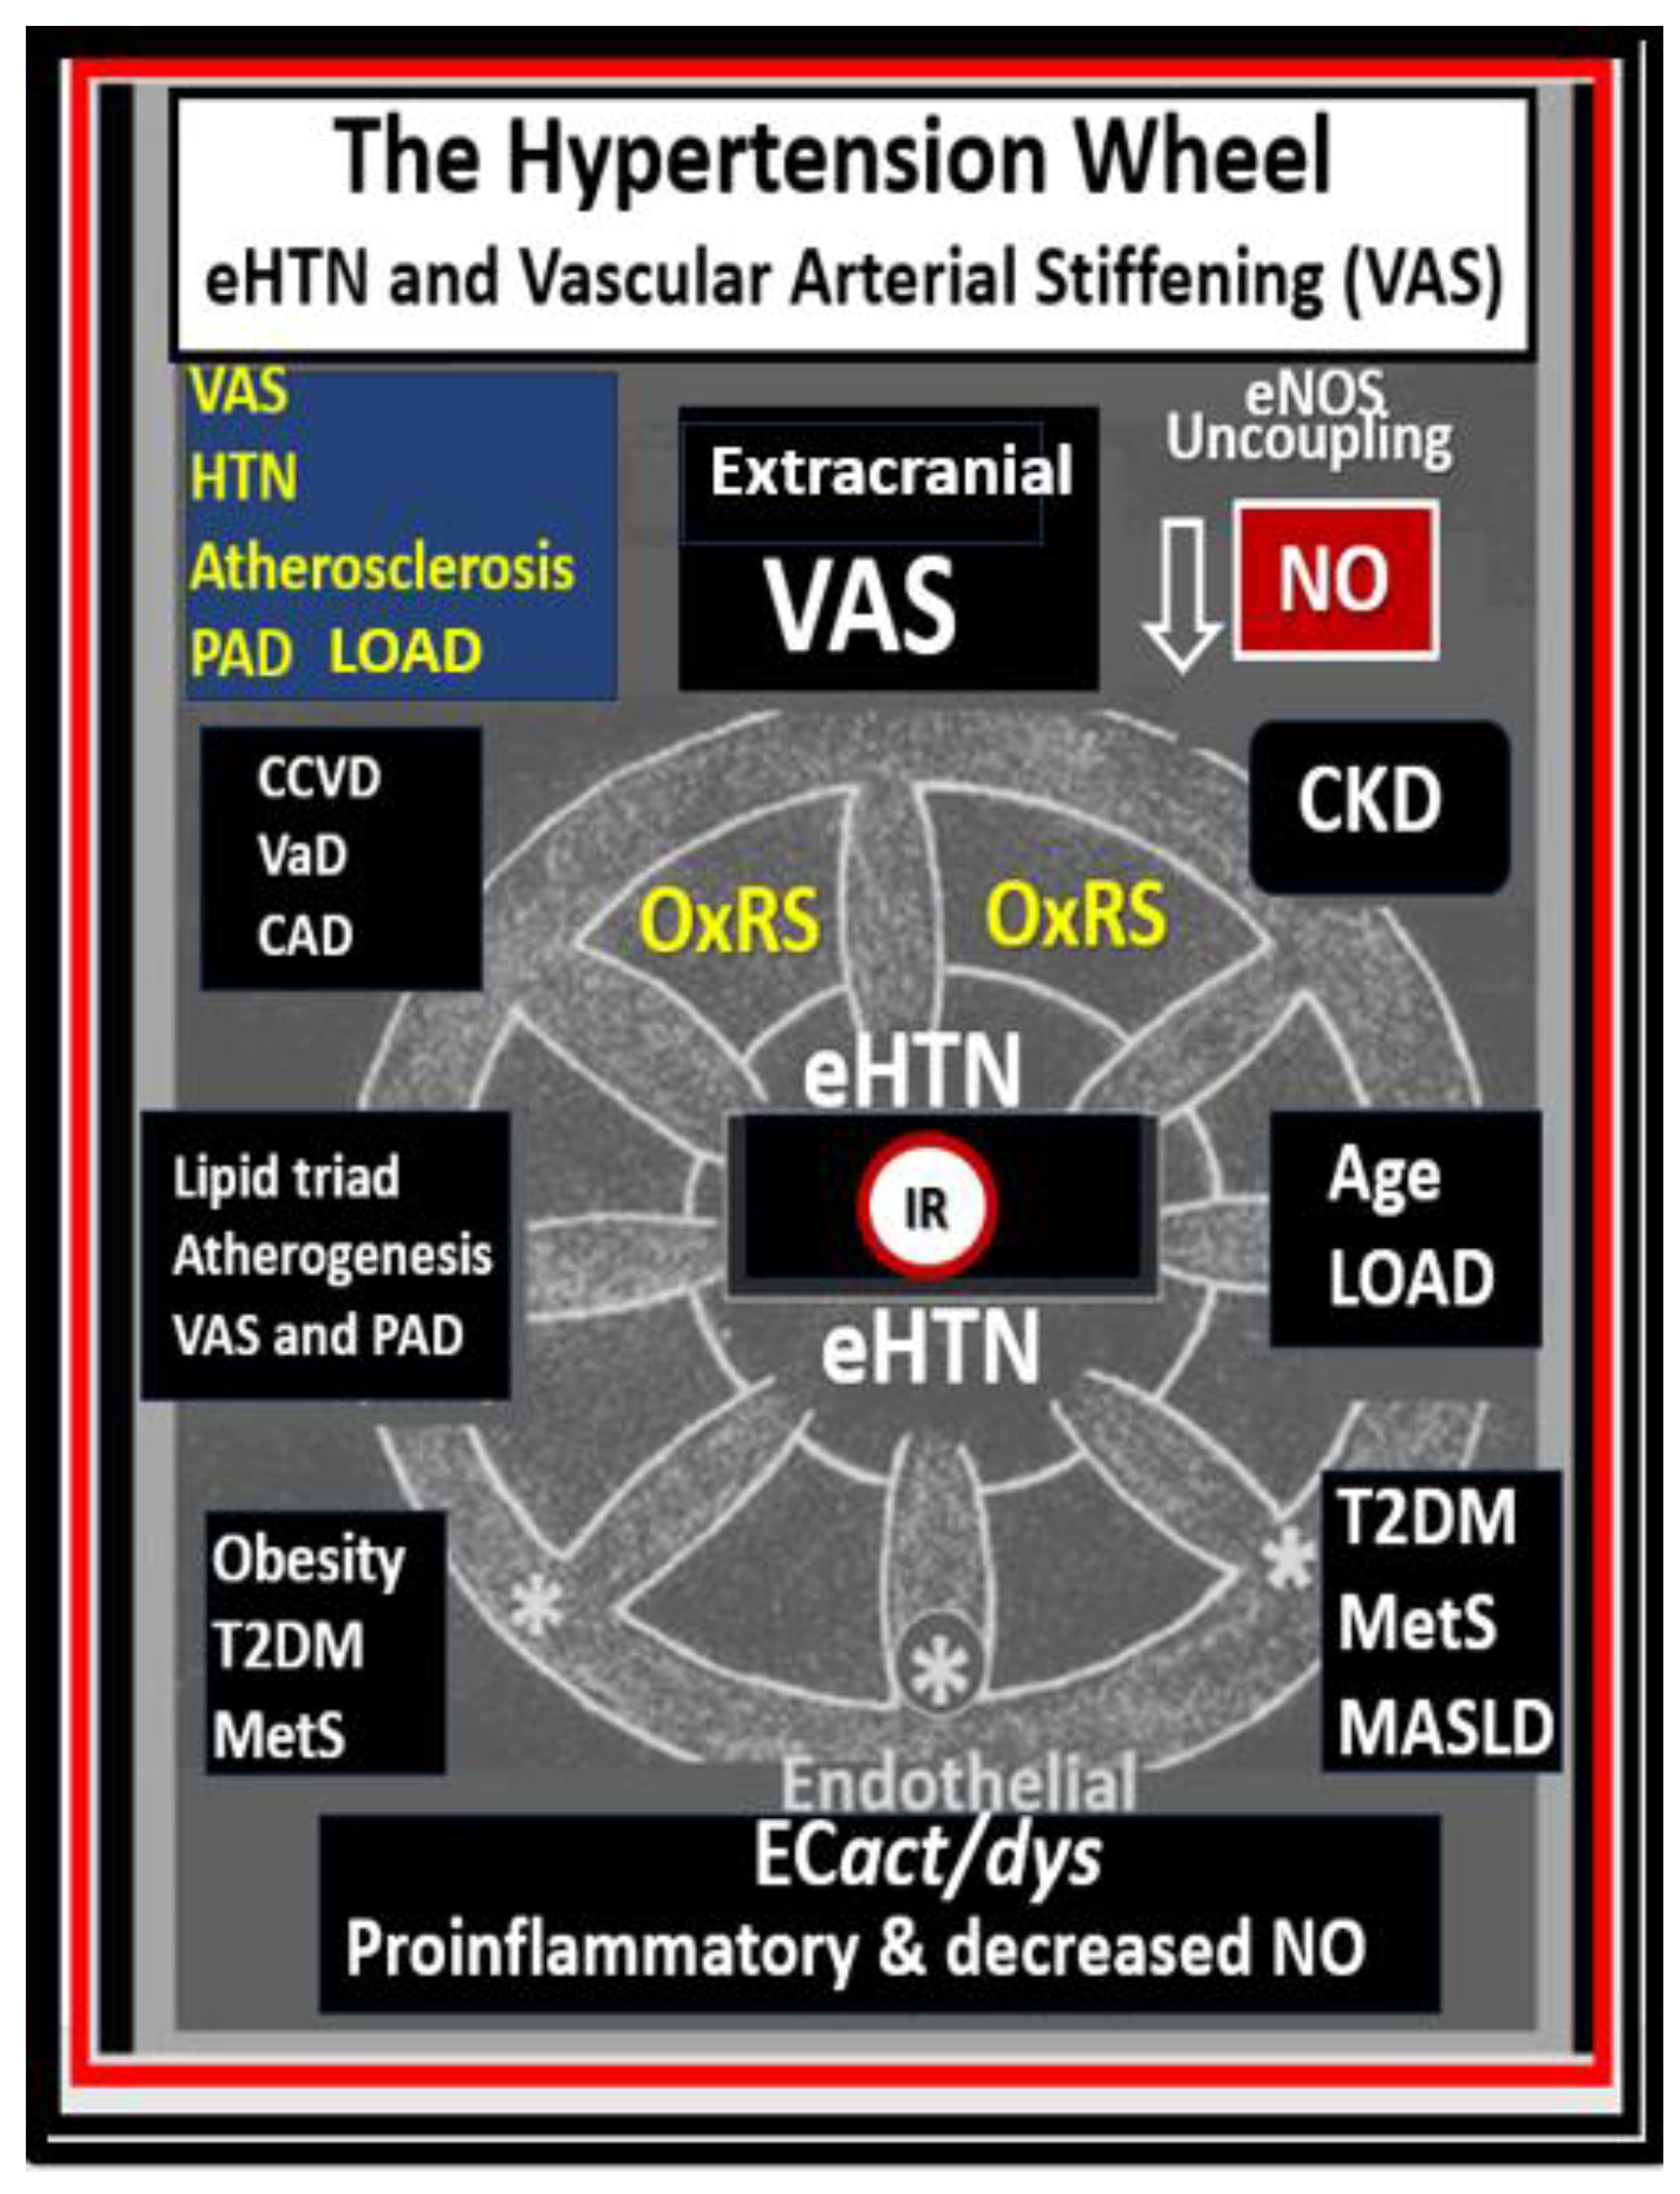
Figure 4.
Multiple risk factors for the development and progression of atherosclerosis. Note the important role of the MetS upper right and also the vicious cycle between atherosclerosis, eHTN and VAS that associates with advancing age. BMI, body mass index; CAD, coronary artery disease; CCVD, cerebrocardiovascular disease; CHF, congestive heart failure; CVDs, cardiovascular diseases; eHTN, essential hypertension; FFA, free fatty acids; IR, insulin resistance; MetS, metabolic syndrome; SVD, small vessel disease. T2DM, type 2 diabetes mellitus; VAS, extracranial vascular arterial stiffness/stiffening. .
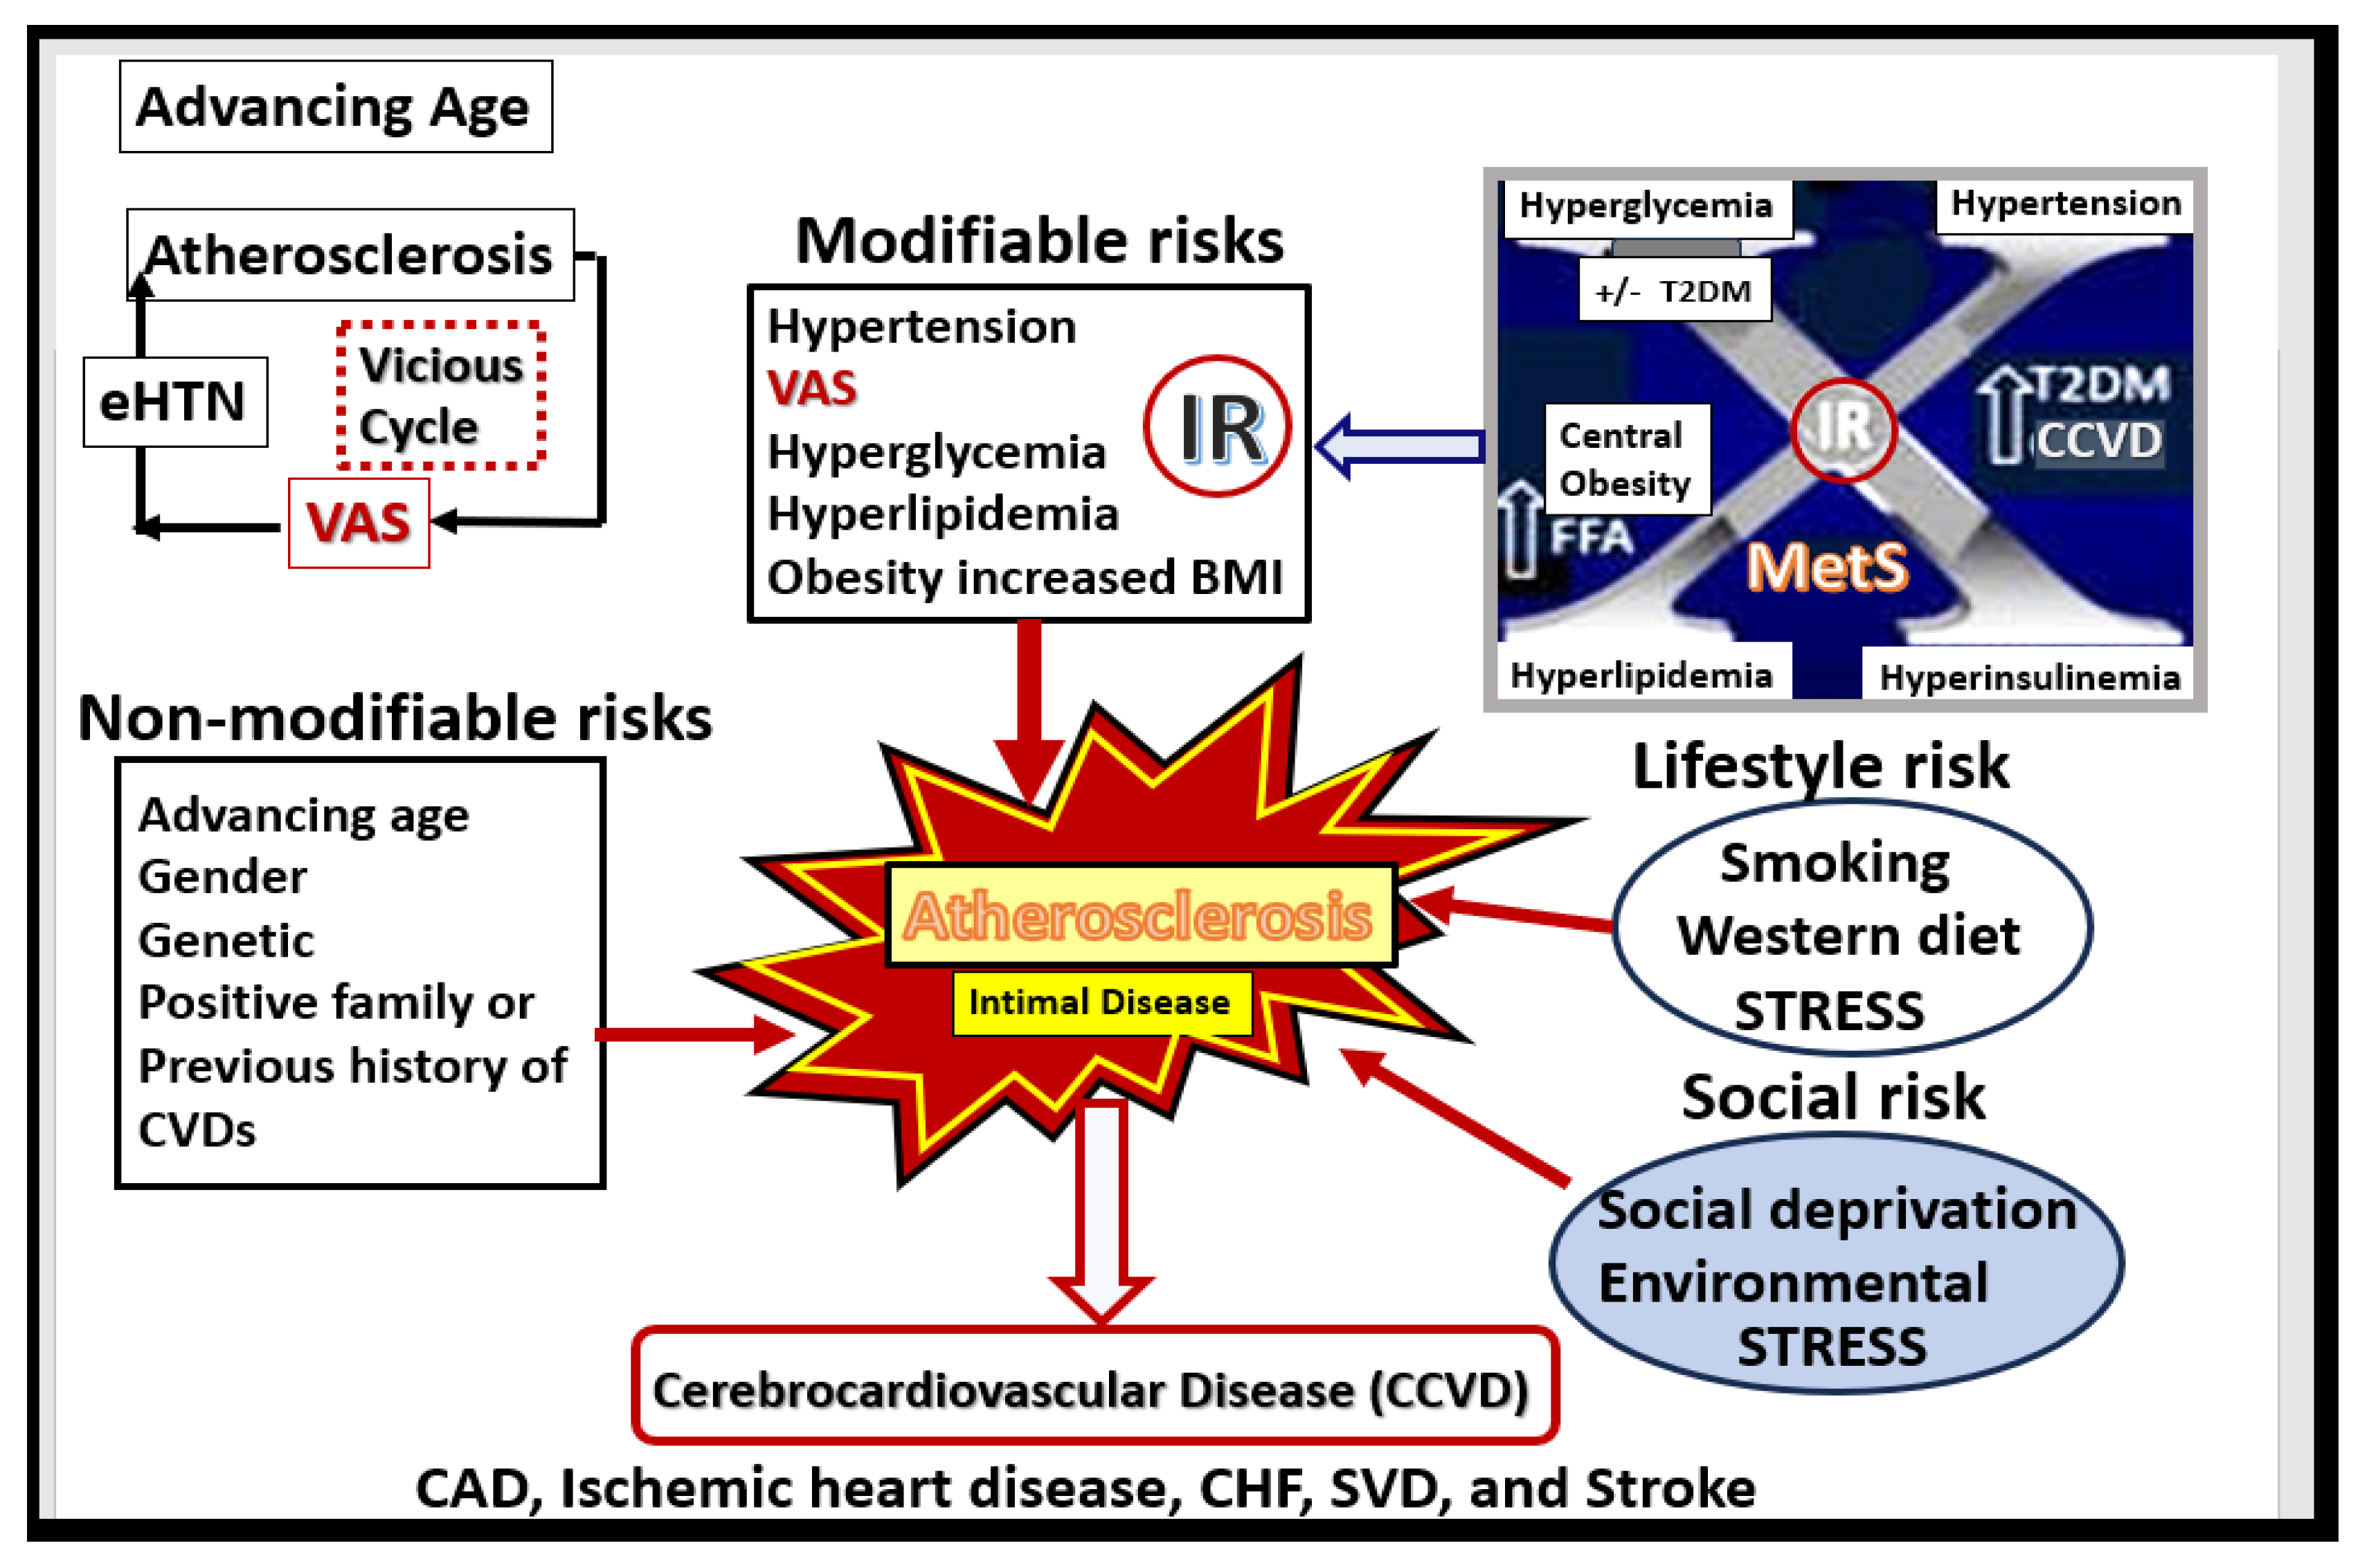
Figure 5.
Possible sequence of events in the development and progression of dementias. Vascular arterial stiffening/stiffness (VAS) may be the Nexus. This figure serves to further expand the information presented in Figure 2. Aβ, amyloid beta, BECact/dys, brain endothelial cell activation/dysfunction; BBBdd, blood-brain barrier dysfunction and disruption; CAA, cerebral amyloid angiopathy; cnsCC, central nervous system cytokines/chemokines; IGT, impaired glucose tolerance; MetS, metabolic syndrome; OxRS, oxidative redox stress; NVU, neurovascular unit; pCC, peripheral cytokines/chemokines; pp, pulse pressure; PWV, pulse wave velocity; SVD, small vessel disease; T2DM, type 2 diabetes mellitus; VCID, vascular contributions to impaired cognition and dementia.
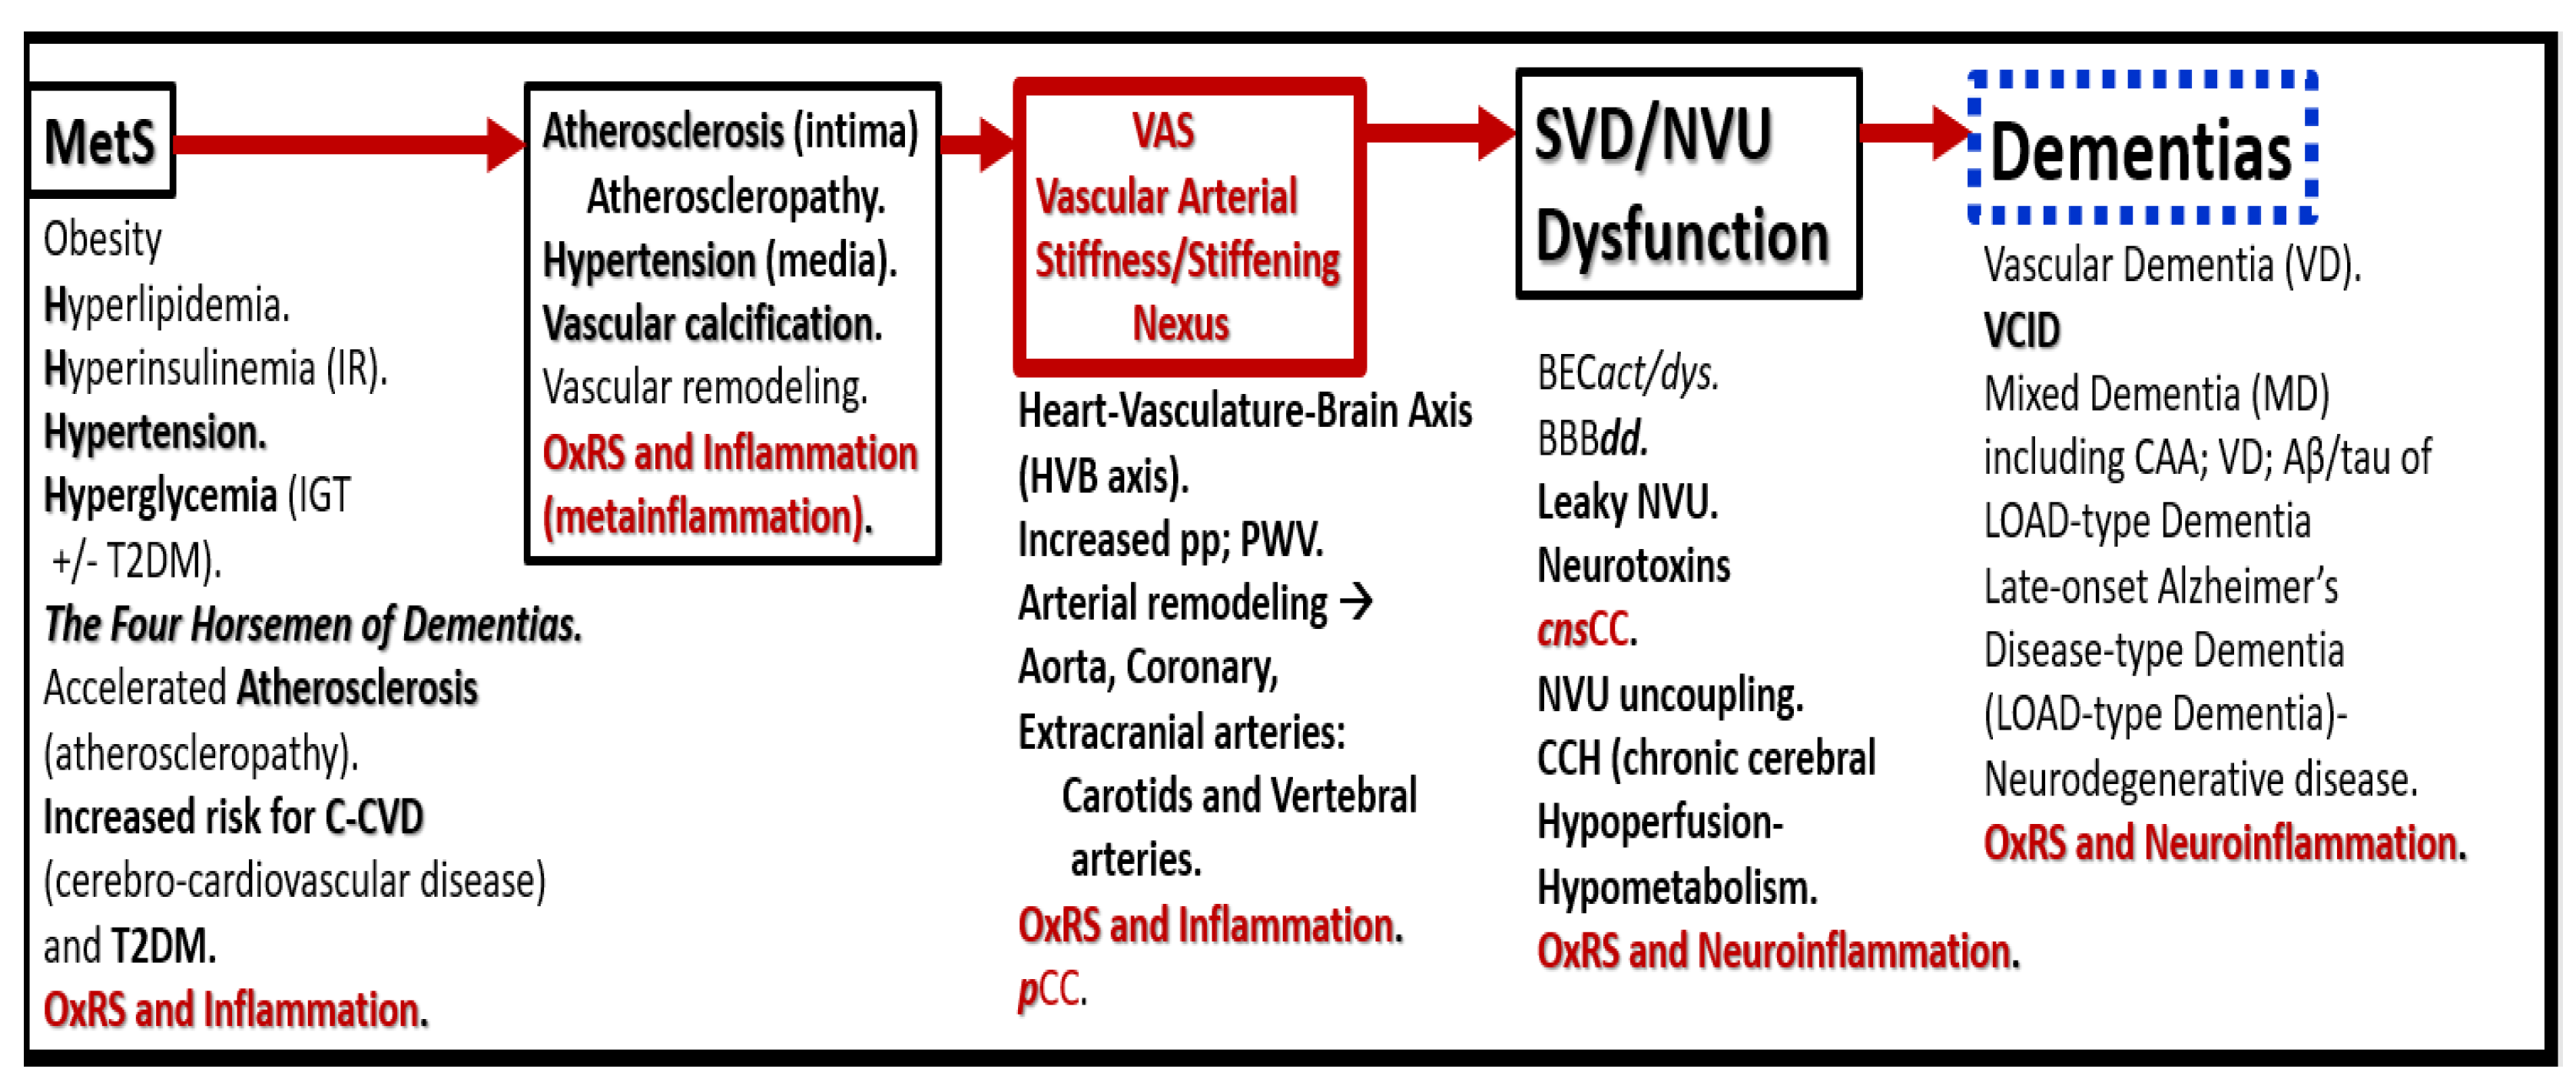
Figure 6.
Arterial pull-out model illustrating the three major tunica layers of arteries and how they are structurally interrelated. This illustration demonstrates the lumen that is surrounded by the monolayer of systemic and brain endothelial cells (SECs and BECs) (pseudo-colored green) that have a basement membrane (BM) pseudo-colored blue, and the proteoglycan (PGN)-rich and hyaluronan subintimal space (SiS noted by double arrows). These three tunica layers begin most luminally with the tunica intima where atherosclerosis is known to begin. Next the thickened black line forms internal elastic lamina (IEL), which is demarcated by the bold white line, which separates the intima from the tunica media that encircles the artery and serves to allow elastic recoil of the artery once it is stretched along with multiple layers of the elastin lamella that bound the lamellar units containing the vascular smooth muscle cell(s) (VSMCs) pseudo-colored red and denoted by open white arrows that comprise the second tunica that is bound abluminally by the external elastic lamina (yellow dashed line). The most abluminal and third tunica is the tunica adventitia, which is demarcated by the yellow dashed line luminally and the perivascular adipose tissue (PVAT) of the tunica adventitia that contains a loose connective tissue with multiple cells including pericytes, mast cells and occasional leukocytes through which, the vasa vasorum (Vv) flows as it penetrates the media to be referred to as the vessel within the vessel. The perivascular adipose tissue (PVAT underlined and pseudo-colored yellow) contains visceral adipocytes and extracellular matrix that is an extension of the tunica adventitia; however, some feel that it merits the distinction to be called the tunica adiposa due to its proinflammatory (metainflammation) potential to result in aberrant arterial remodeling from the outside in. Modified image provided with permission by CC 4.0 [14,34]. C of W, circle of Willis; EL, elastin lamina; HVB, heart-vessel-brain axis; ICAs, internal carotid arteries; PGN, proteoglycan; Ren2 rat part I and II, ultrastructure study of the young male transgenic heterozygous (mRen2)27 (Ren2) rat hypertensive model: Aorta intima Part I and media-adventitia Part II with elevated renin, angiotensin II, angiotensin type-1 (AT-1) receptors, and aldosterone; Vv, vasa vasorum.
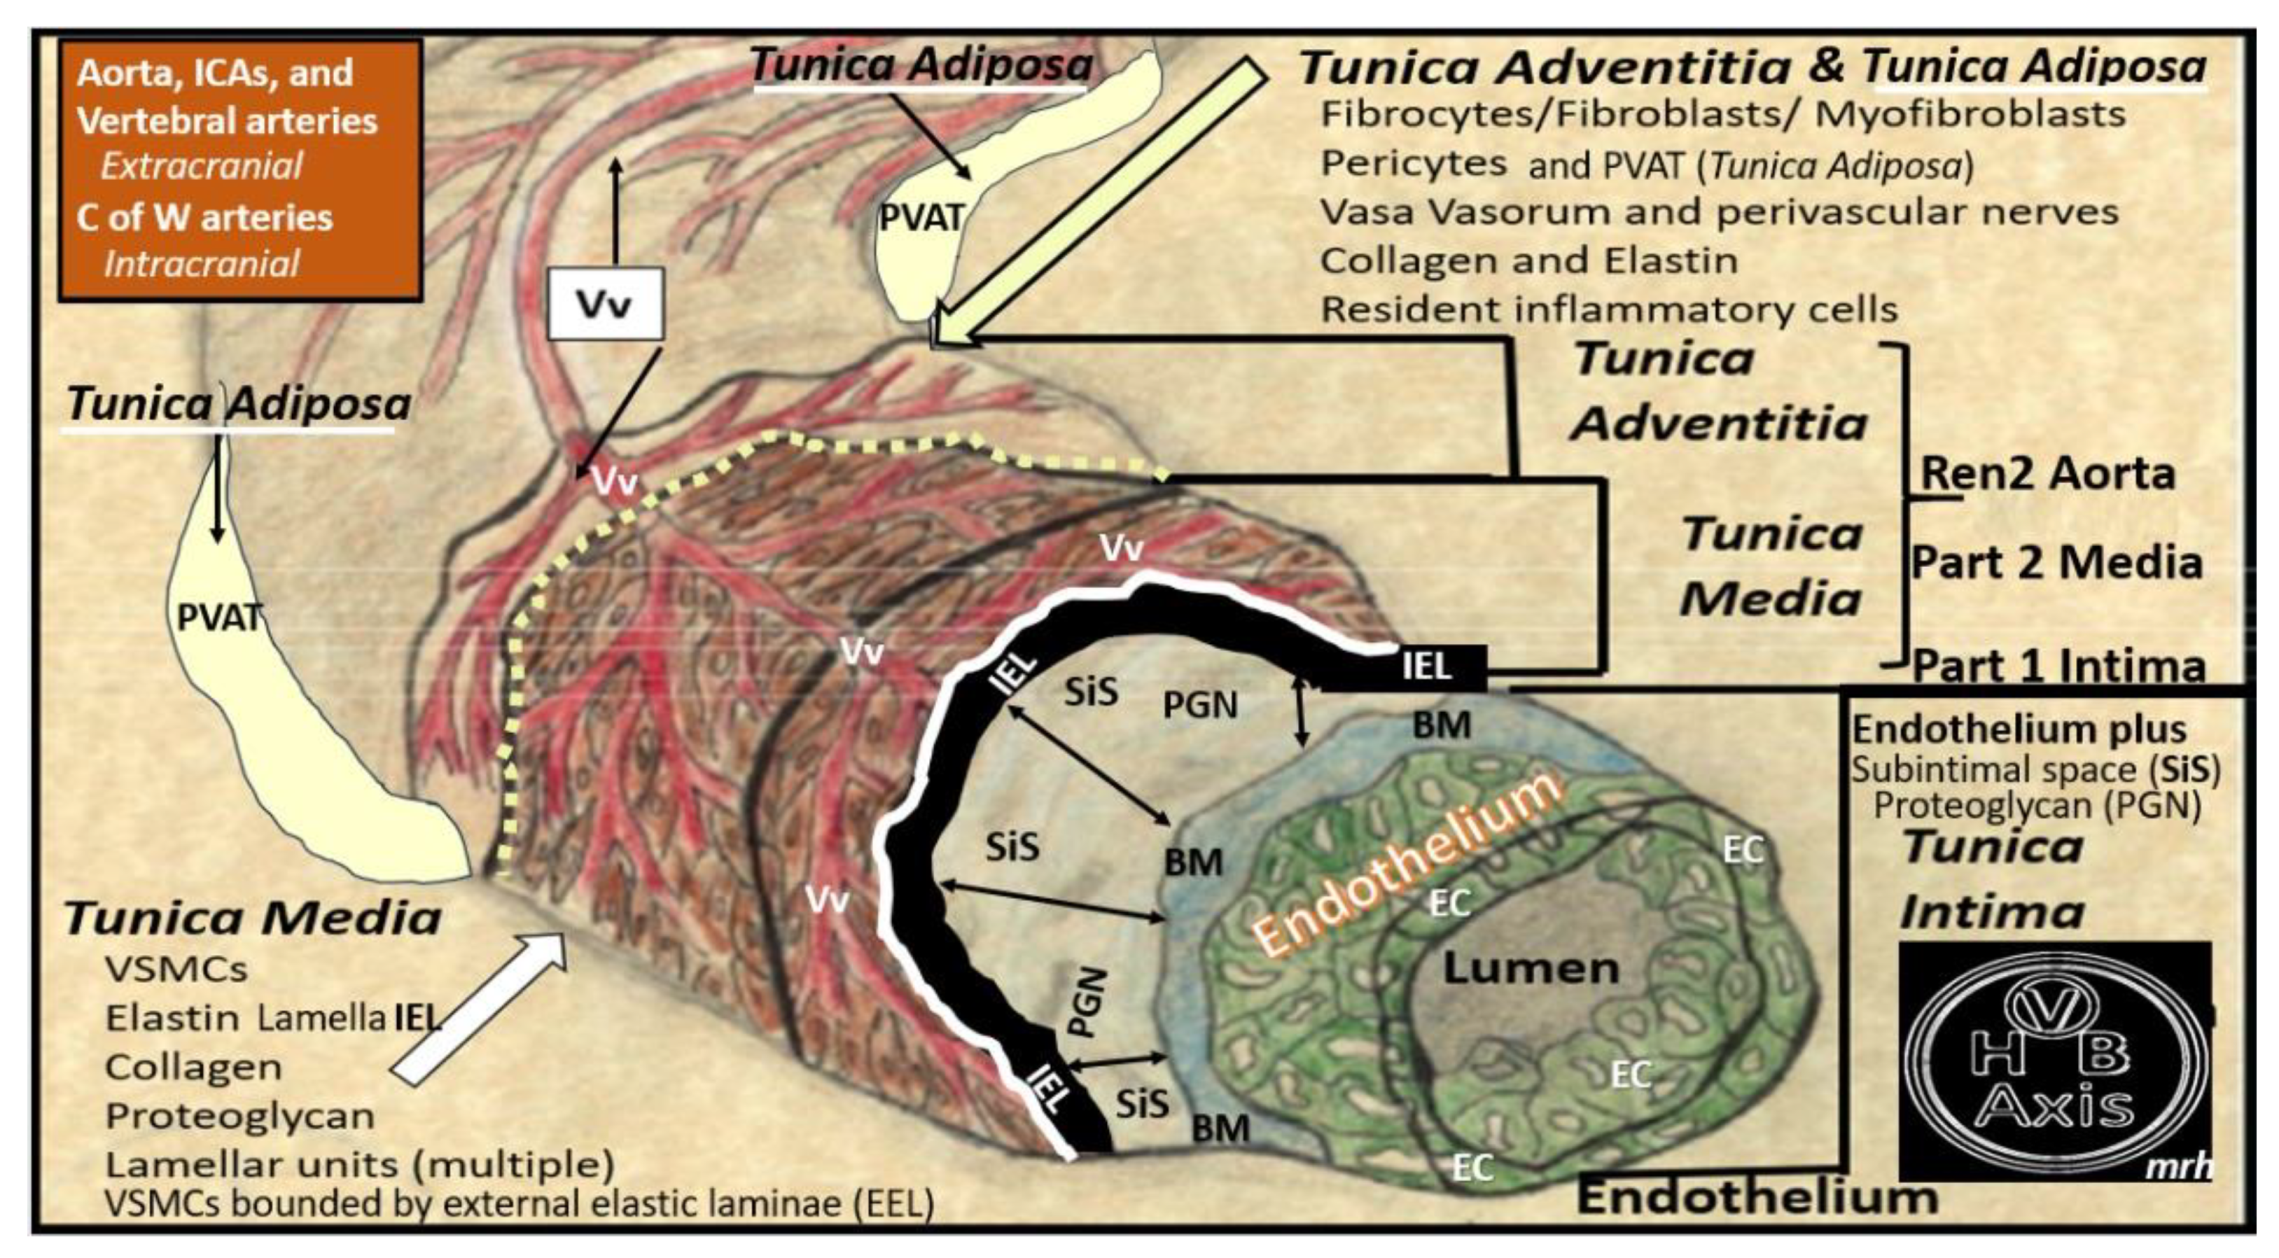
Figure 7.
Comparison of non-diabetic plaque rupture to diabetic (T2DM) plaque erosion to result in atherothrombosis and sudden death. Panel A depicts an erosive plaque in a 58-year-old female individual with history of T2DM, obesity, hypertension, and previous stroke who presented with acute ventricular tachycardia and sudden death due to a left mid-anterior descending coronary occlusion with an erosive concentric plaque [56]. Note the extensive mononuclear vasculitic type adventitial infiltrate associated with this concentric erosive thrombotic plaque. While each of these vulnerable plaques in panels B and A’ associate with increased extracranial vascular arterial stiffness they may result in similar clinical outcomes, i.e. sudden death due to atherothrombosis. However, non-diabetic plaques are more prone to rupture while T2DM individuals are more prone to develop thromboerosion and result in sudden death. Additionally, T2DM individuals are known to have increased vascular stiffness as compared to non-diabetic individuals. Panels A and A’ are hematoxylin and eosin (H&E) and Panel B is H&E stained (pseudo-colored blue in order to contrast colors with A and A’). Modified images provided with permission by CC 4.0 [56]. Asterisks, vasculitic lymphocytic infiltrate within the adventitia; CAD, coronary artery disease; P22 Phox (underlined in red), is the light chain of the NADPHOx enzyme and its positive staining strongly suggests increased oxidative stress within the plaque and the adventitia that may contribute to plaque instability and erosion in T2DM; Vv, vasa vasorum.
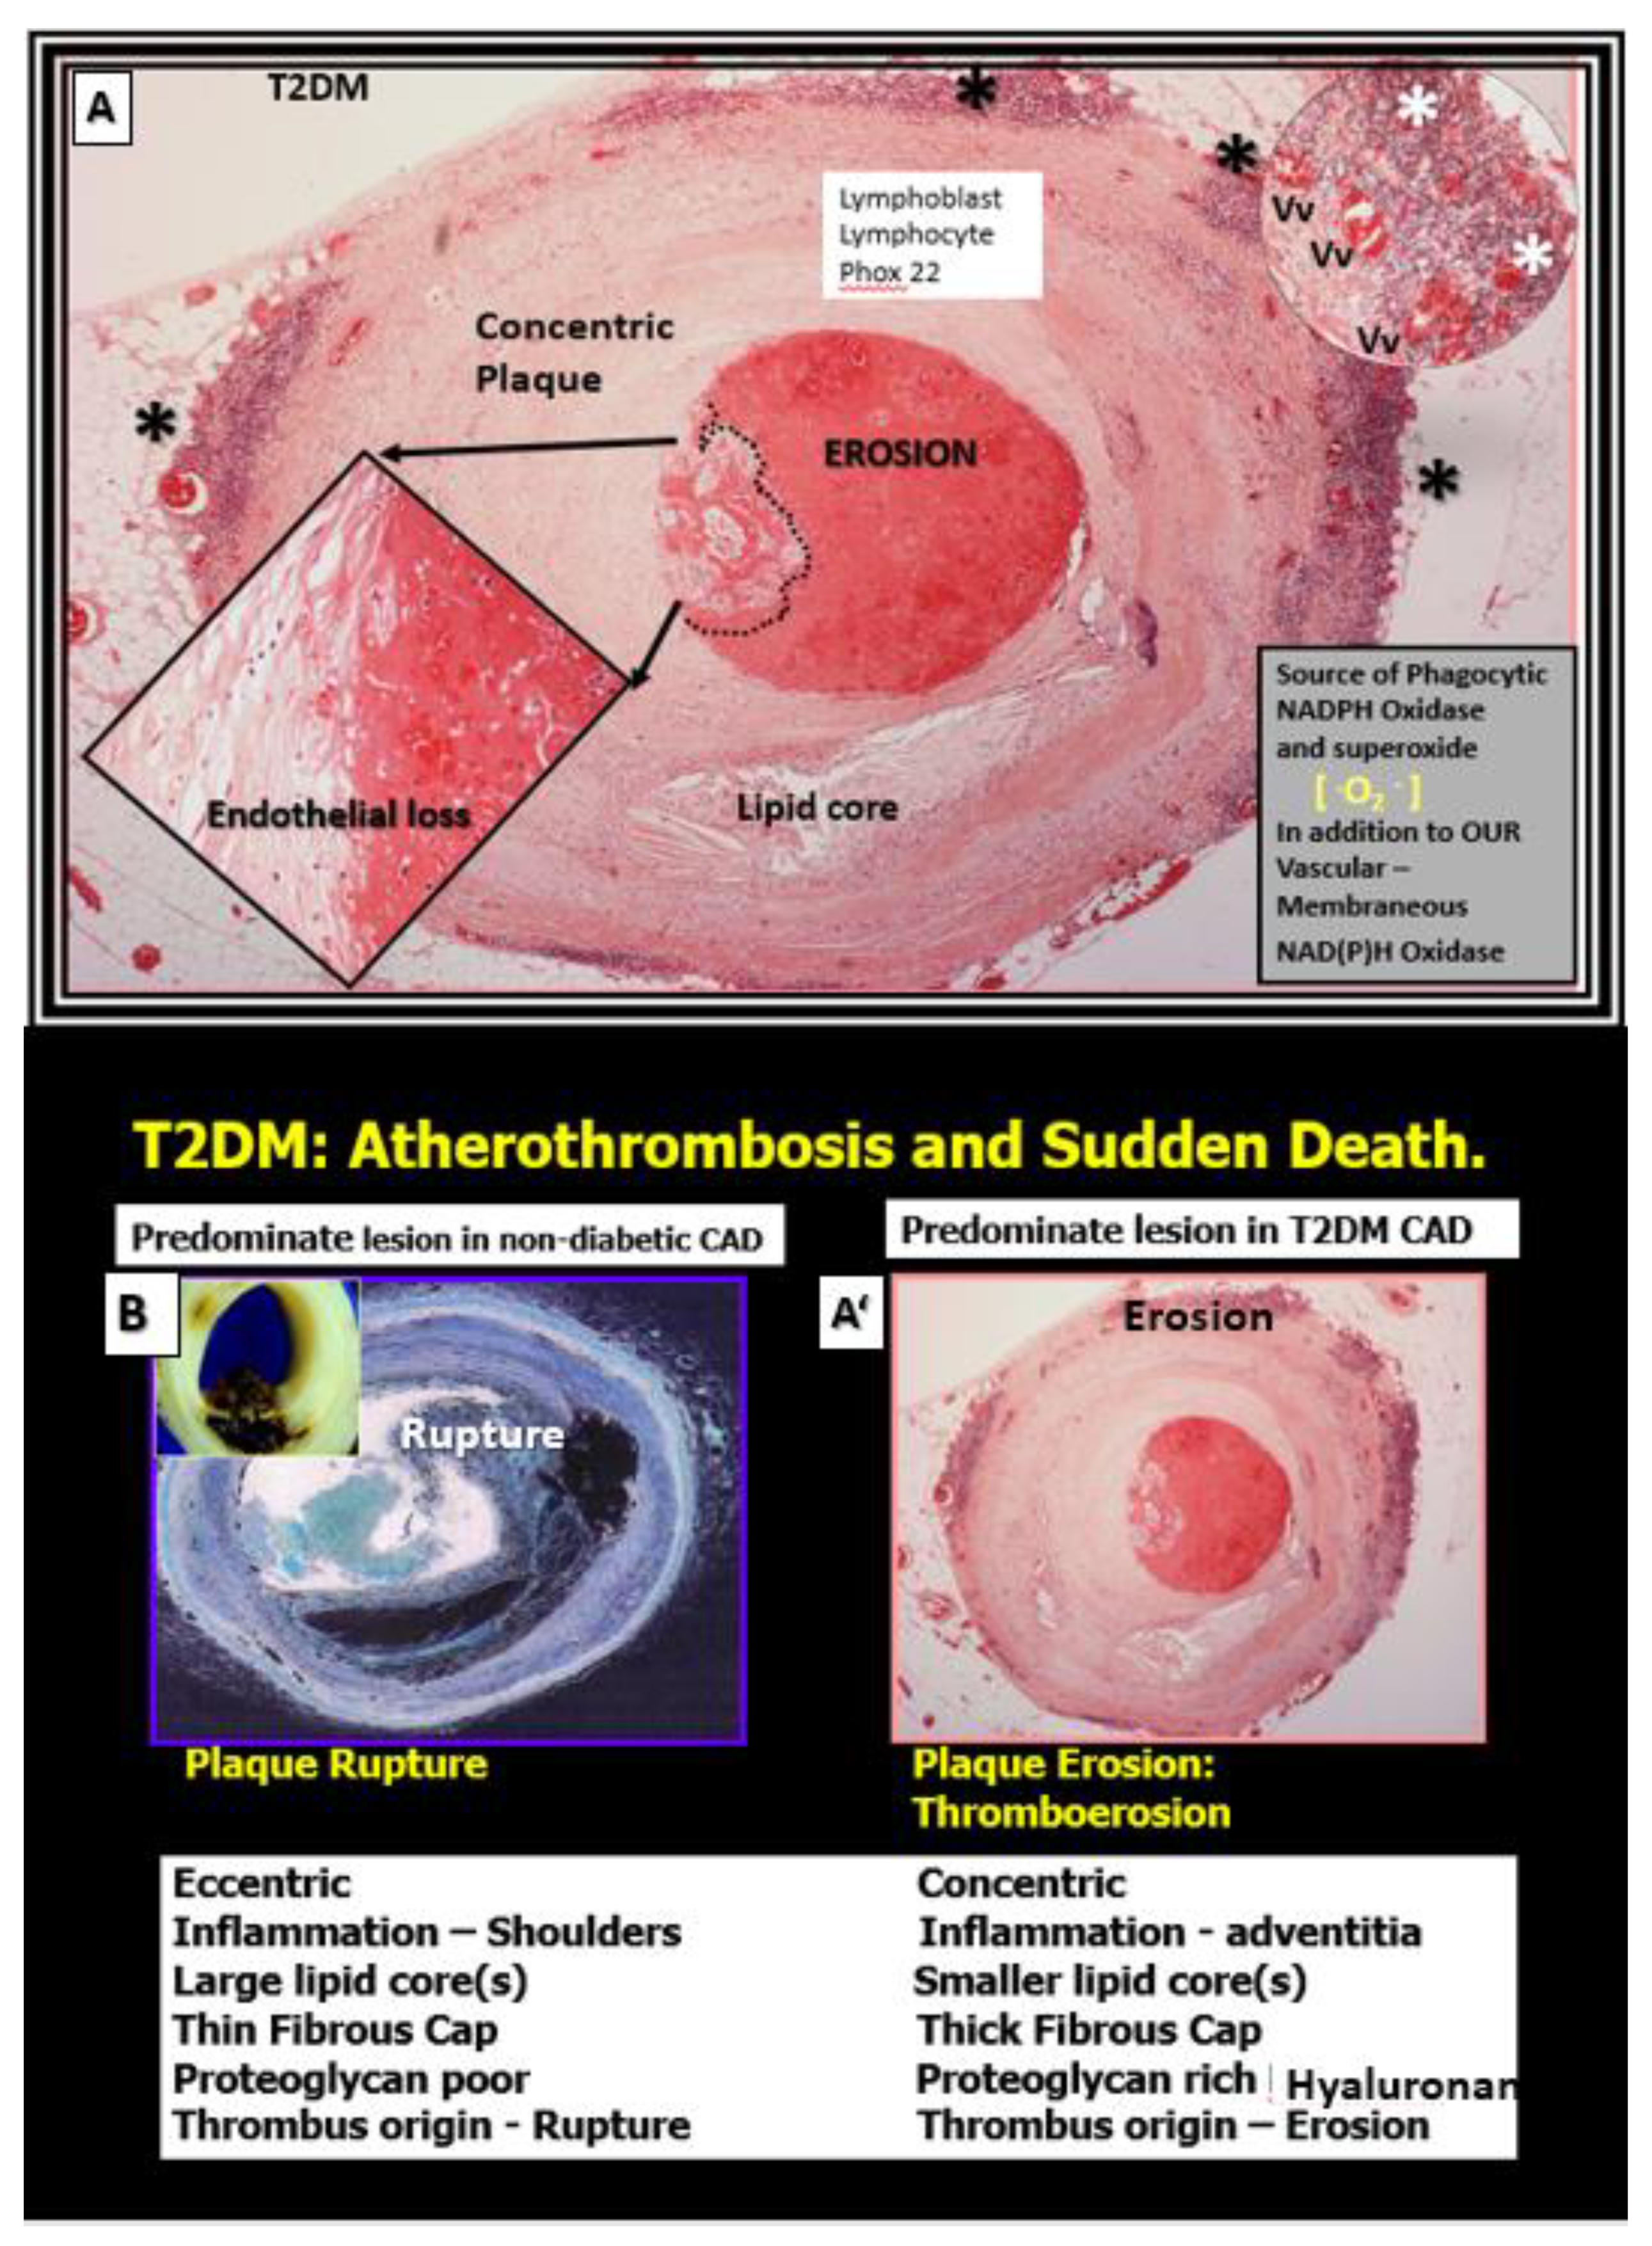
Figure 8.
Potential mechanisms involving uremic toxins and reactive oxygen species (ROS) in vascular calcification. Uremic toxins such as increased parathyroid hormone (PTH), phosphorus (Pi) and phosphate (PO43−), calcium, calcium x phosphorus product, vitamin D3, and oxidative redox stress (OxRS) via reactive oxygen species (ROS) significantly contribute to vascular smooth muscle cell (VSMC) differentiation into osteoblast-like phenotypes. Phosphate absorption into these cells is facilitated by the sodium phosphate cotransporter (Pit-1) resulting in an osteogenic switch due to activation of transcription factors: osteoblast-specific cis-acting element (Osf2)—core binding factor alpha1 (Cbfa-1/Runx2). Osteocalcin, osteonectin, bone morphogenic protein-2alpha and alkaline phosphatase (ALP) are also known inducers of calcification. In contrast, the systemic and local inhibitors of calcification fetuin-A (alpha2-Heremans-Schmid glycoprotein (AHSG) and matrix Gla protein (MGP) are decreased in uremia and calciphylaxis. Further, ROS and inflammatory cytokine surges may contribute to decreased hepatic synthesis of fetuin-A (insert a). Uremic toxins—ROS promote uncoupling of endothelial nitric oxide synthase (eNOS) enzyme via the oxidation of the requisite tetrahydrobiopterin (BH4) cofactor and results in the endothelium becoming a net producer of superoxide—ROS (insert b). Additionally, decreased bioavailable NO due to eNOS enzyme uncoupling promotes a proinflammatory, proconstrictive, prothrombotic vascular endothelium and note the constricted collapse arteriole (insert b). OxRS including ROS are also capable of promoting VSMC apoptosis in the arterial vascular wall (AVW) and when this occurs the matrix vesicles and apoptotic bodies serve as nucleating sites for further calcium deposition in the extracellular matrix of the arteriole media (inserts c–e). Image reproduced with permission by CC 4.0 [68].
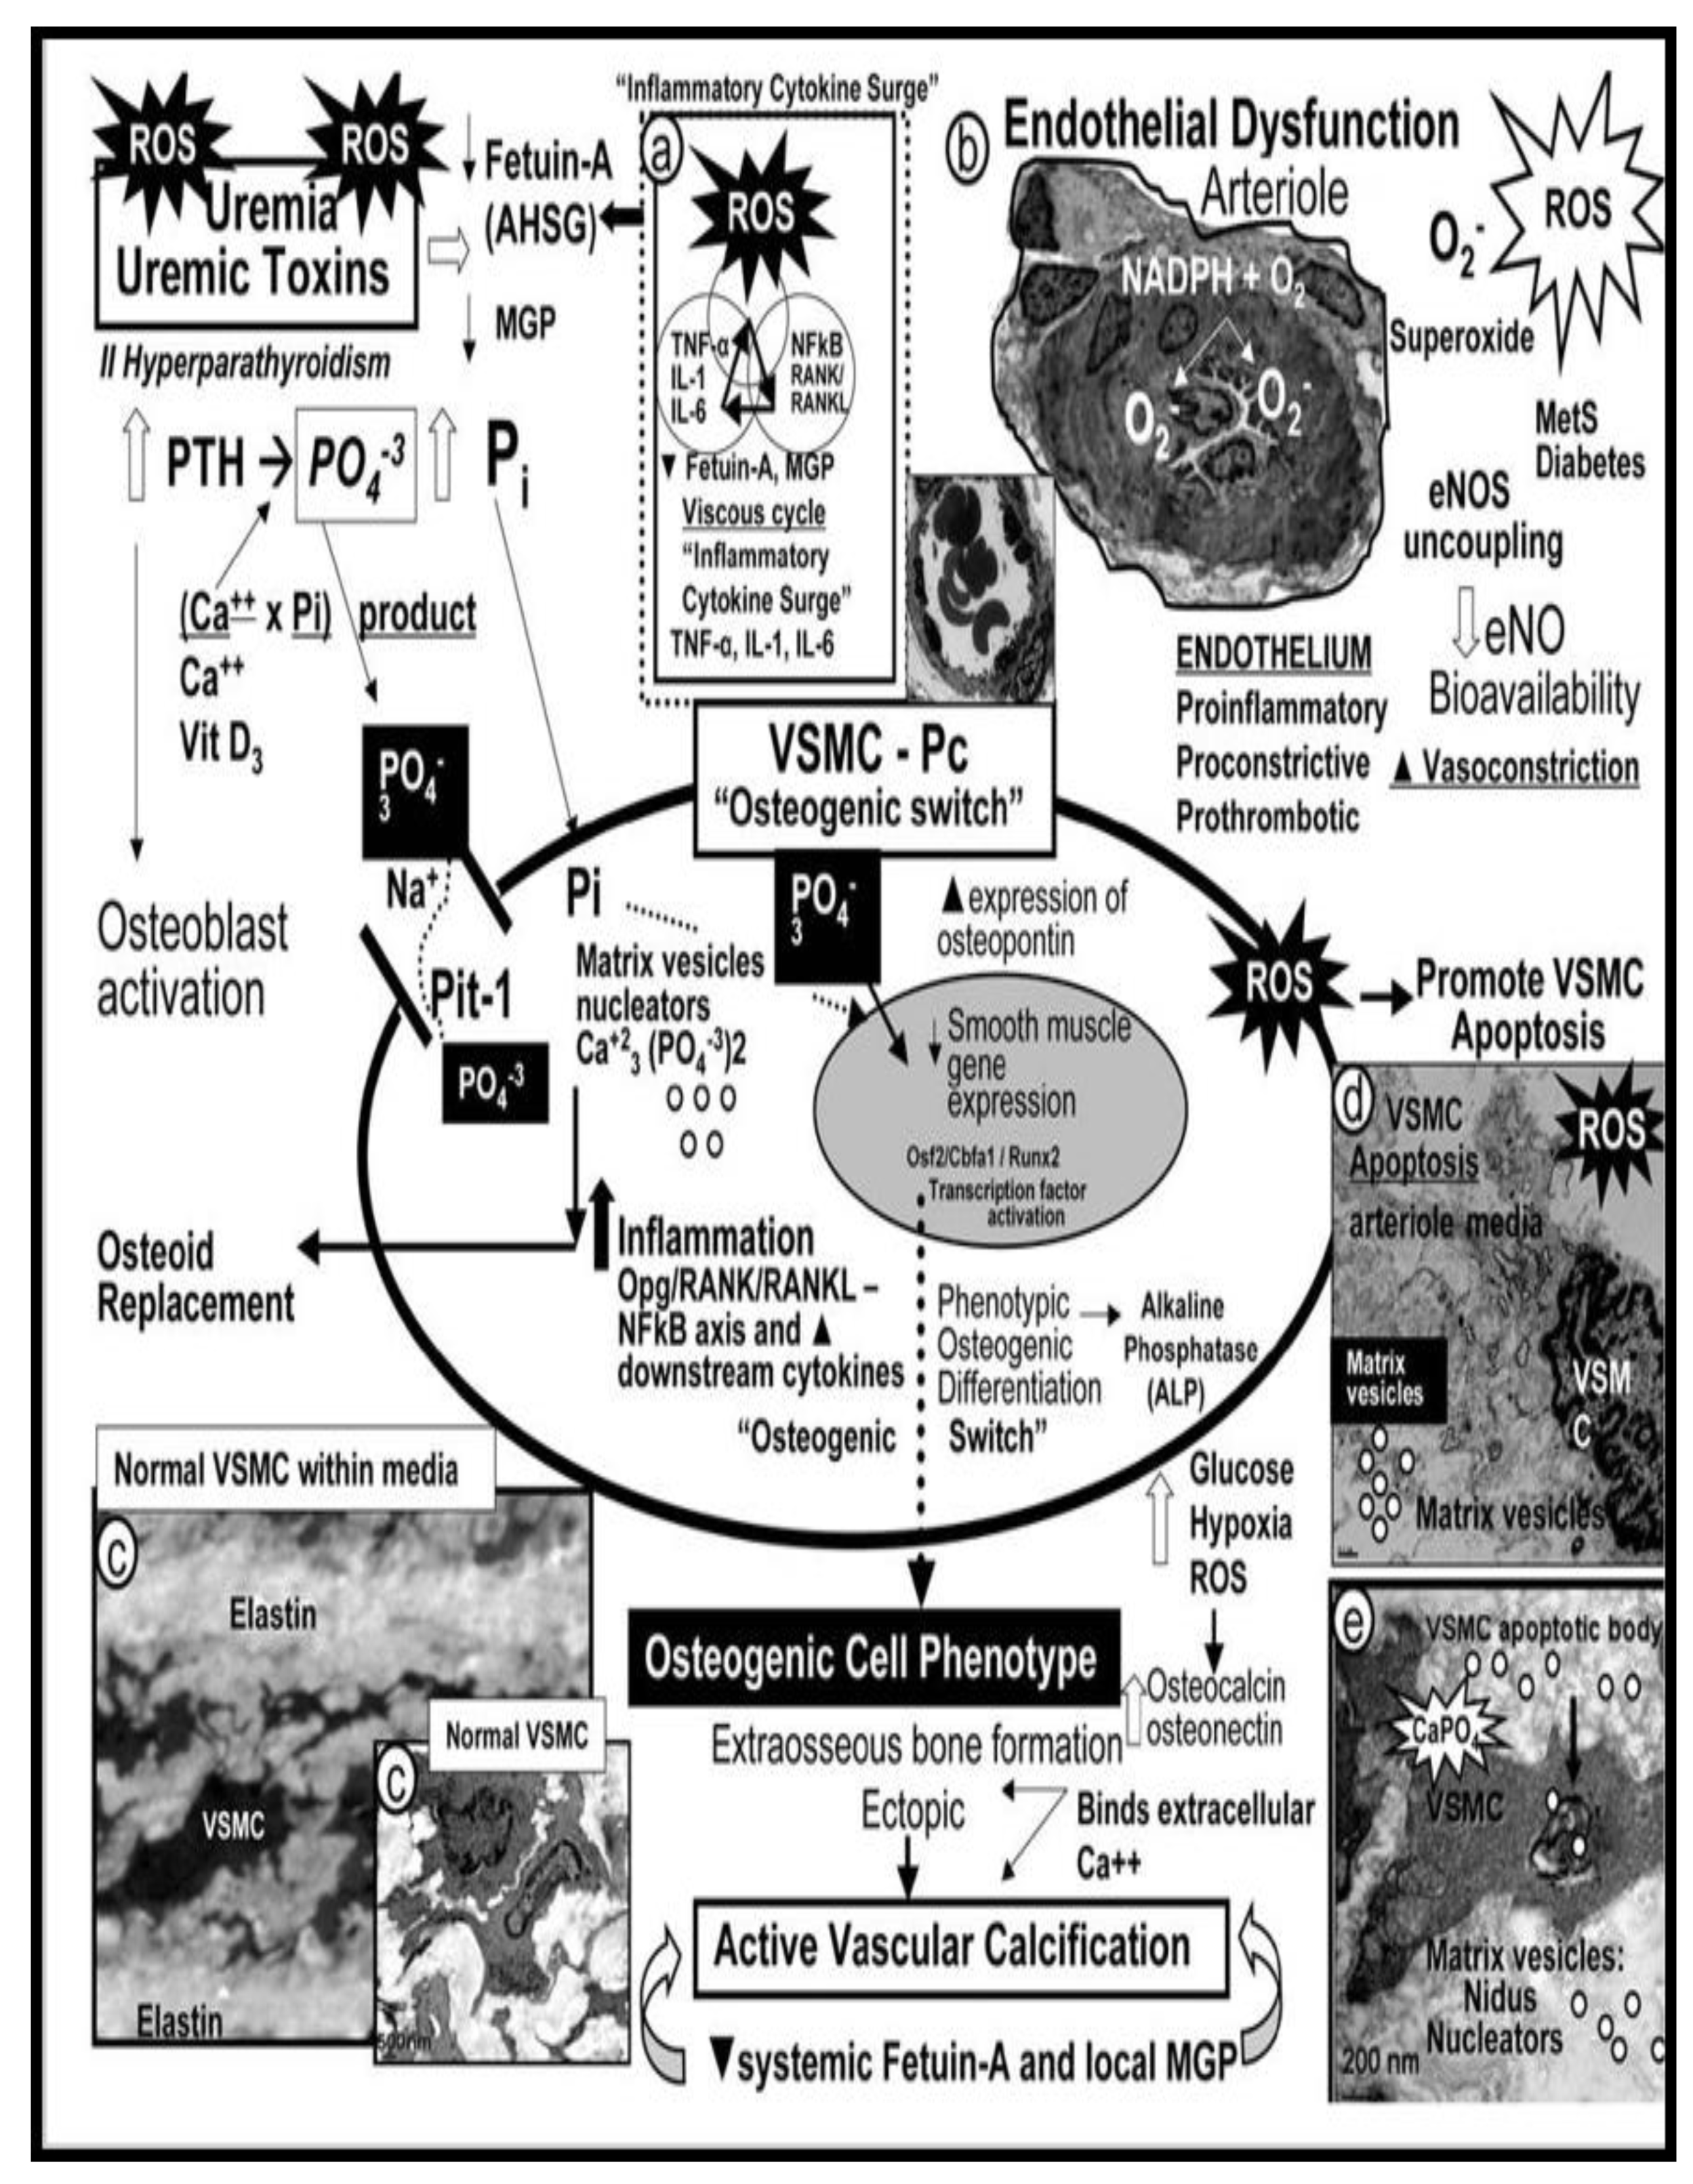
Figure 9.
Double vicious endothelial activation and dysfunction cycles are in play during the development of vascular stiffening and small vessel disease. Panel A depicts the vicious cycle between oxidative redox stress (OxRS), which includes (reactive oxygen (ROS), nitrogen (RONS), sulfur RONSS species of the reactive species interactome (RSI). The systemic endothelial cells (SECs) can be activated via either OxRS or metainflammation induced by peripheral excessive inflammation/metainflammation from the visceral adipose tissue or the visceral perivascular adipose tissue (PVAT) of the vessels as in figures 1 and 4 and gut dysbiosis (pCC, LPS, oxLDL-C plus others). Likewise, this vicious cycle may also be instigated by OxRS. This peripheral inflammation is additionally capable of instigating the vicious cycle in panel B (downward red arrowhead). Panel B depicts the vicious cycle that exists in the development of SECs and/or brain endothelial cells (BECs) activation (proinflammatory endothelium) and in turn cycles with EC dysfunction that is associated with decreased levels of nitric oxide (NO) as a result of endothelial nitric oxide synthase (eNOS) enzyme uncoupling due to a decrease in the essential cofactor of totally reduced BH4, which results from excessive OxRS to oxidize BH4 to BH2 that will not run the eNOS reaction and hence results in eNOS uncoupling making the ECs a net producer of ROS instead of the antioxidant, anti-inflammatory, antithrombotic, antiatherosclerotic, and vasodilation effects of NO in the vasculature. BH2, dihydrobiopterin; BH4, tetrahydrobiopterin; EC, endothelial cell; LPS, lipopolysaccharide; NVU, neurovascular unit; oxLDL-C, oxidized low-density lipoprotein-cholesterol: pCC, peripheral cytokines/chemokines.
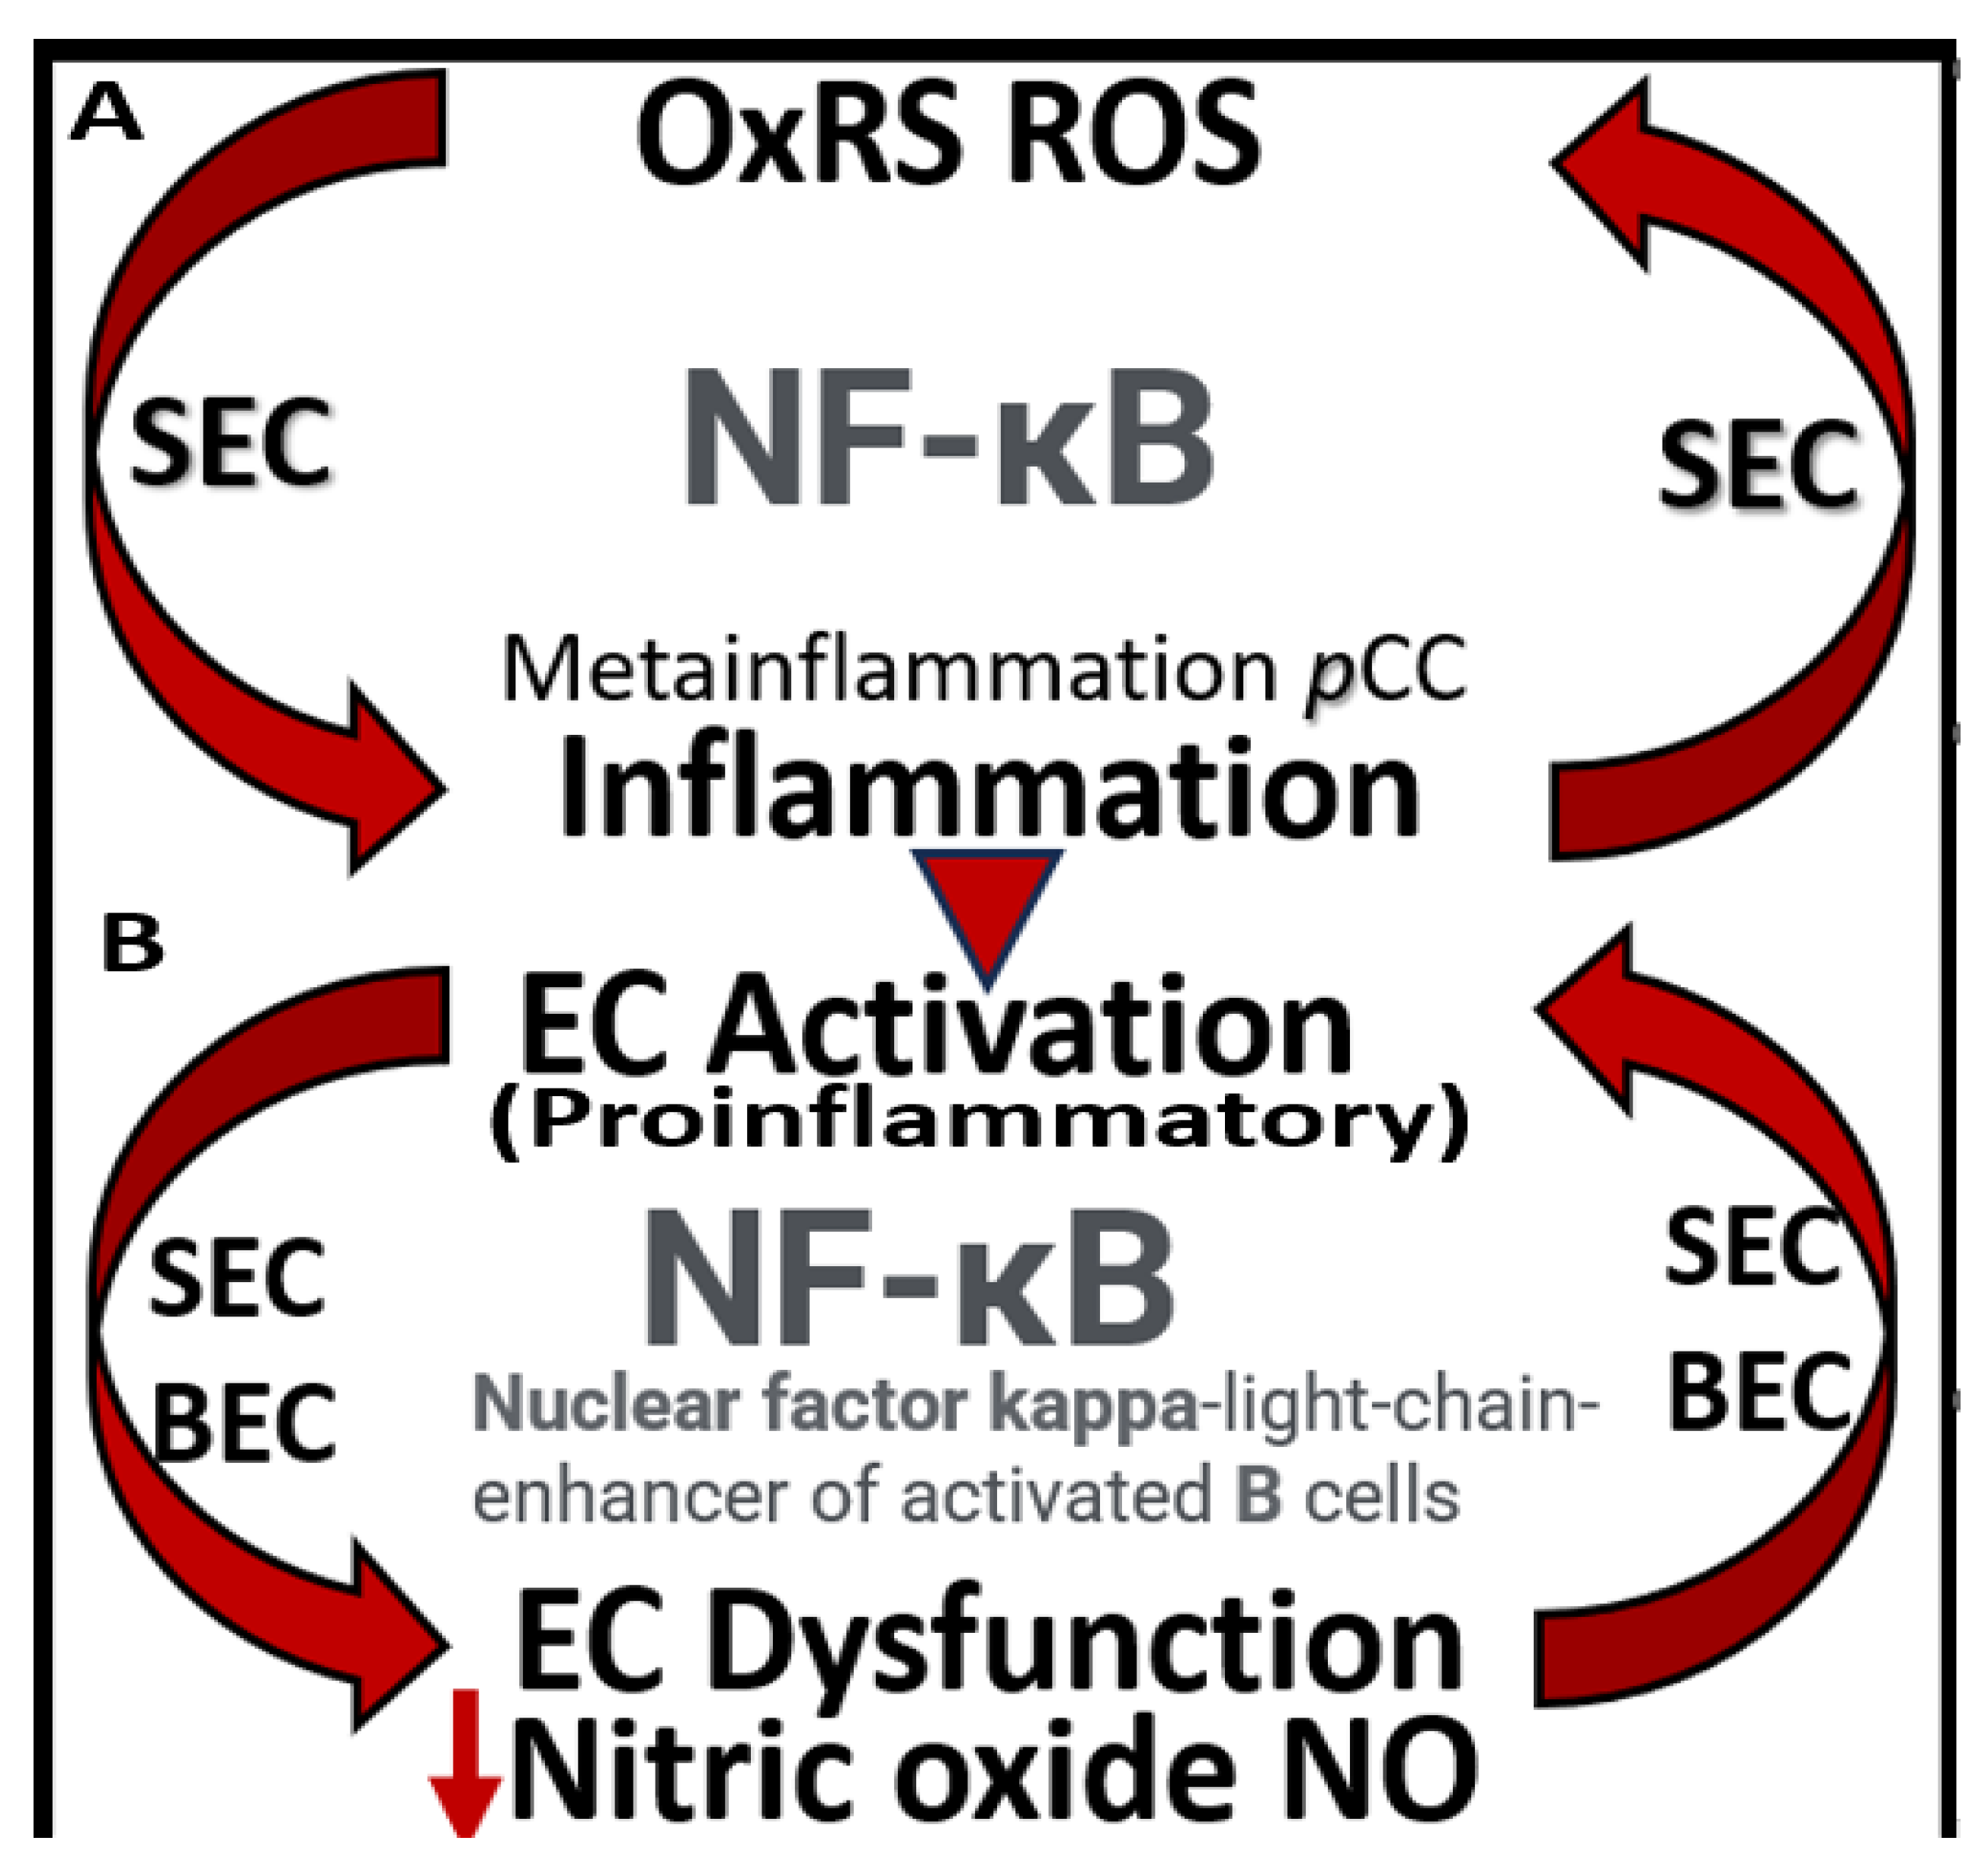
Figure 10.
Systemic endothelial cell and brain endothelial cell activation and dysfunction (BECact/dys) associate with and contribute to the evolution of enlarged perivascular spaces (EPVS)-cerebral small vessel disease (SVD), and hypoperfusion/hypometabolism with ischemia and nutrient deficiency to result in neurodegeneration. Mechanisms 1-4 detail and outline the process of developing the formation via BECact/dys through the development of EPVS-SVD and eventual neurodegeneration that include the increase in pulse wave velocity (PWV) and increased pulsatile pulse pressure (pp) that act as an injurious species to result in neurodegeneration via OxRS vicious cycles to result in neuroinflammation and SVD. Note that the injurious stimuli image of the endothelial cell now contains sodium-salt (red box) that results in EC act/dys resulting in a proinflammatory endothelium and a decrease in nitric oxide (NO) due to eNOS uncoupling as a result of the essential cofactor tetrahydrobiopterin (BH4) oxidation. Modified image provided by CC 4.0 [25]. AGE, advanced glycation end-products; Ang II, angiotensin II; asterisks, denotes and emphasizes that reactive oxygen species are responsible for the activation matrix metalloproteinases (MMPs); BECact/dys, brain endothelial cell activation and dysfunction; BEC, brain endothelial cell; downward arrow, decreased; eNOS, endothelial nitric oxide synthase; ICAM-1, intercellular adhesion molecule; LDL, low density lipoprotein-cholesterol; Lpa, lipoprotein little a; LPS, lipopolysaccharide; MMPs, matrix metalloproteinases; MtROS, mitochondrial reactive oxygen species; NADPH Ox, nicotinamide adenine dinucleotide phosphate reduced oxidase; pnsCC, peripheral nervous system cytokines chemokines RAGE, receptor for AGE: T, transcytosis; upward arrow, increased;VCAM-1. vascular cellular adhesion molecule.
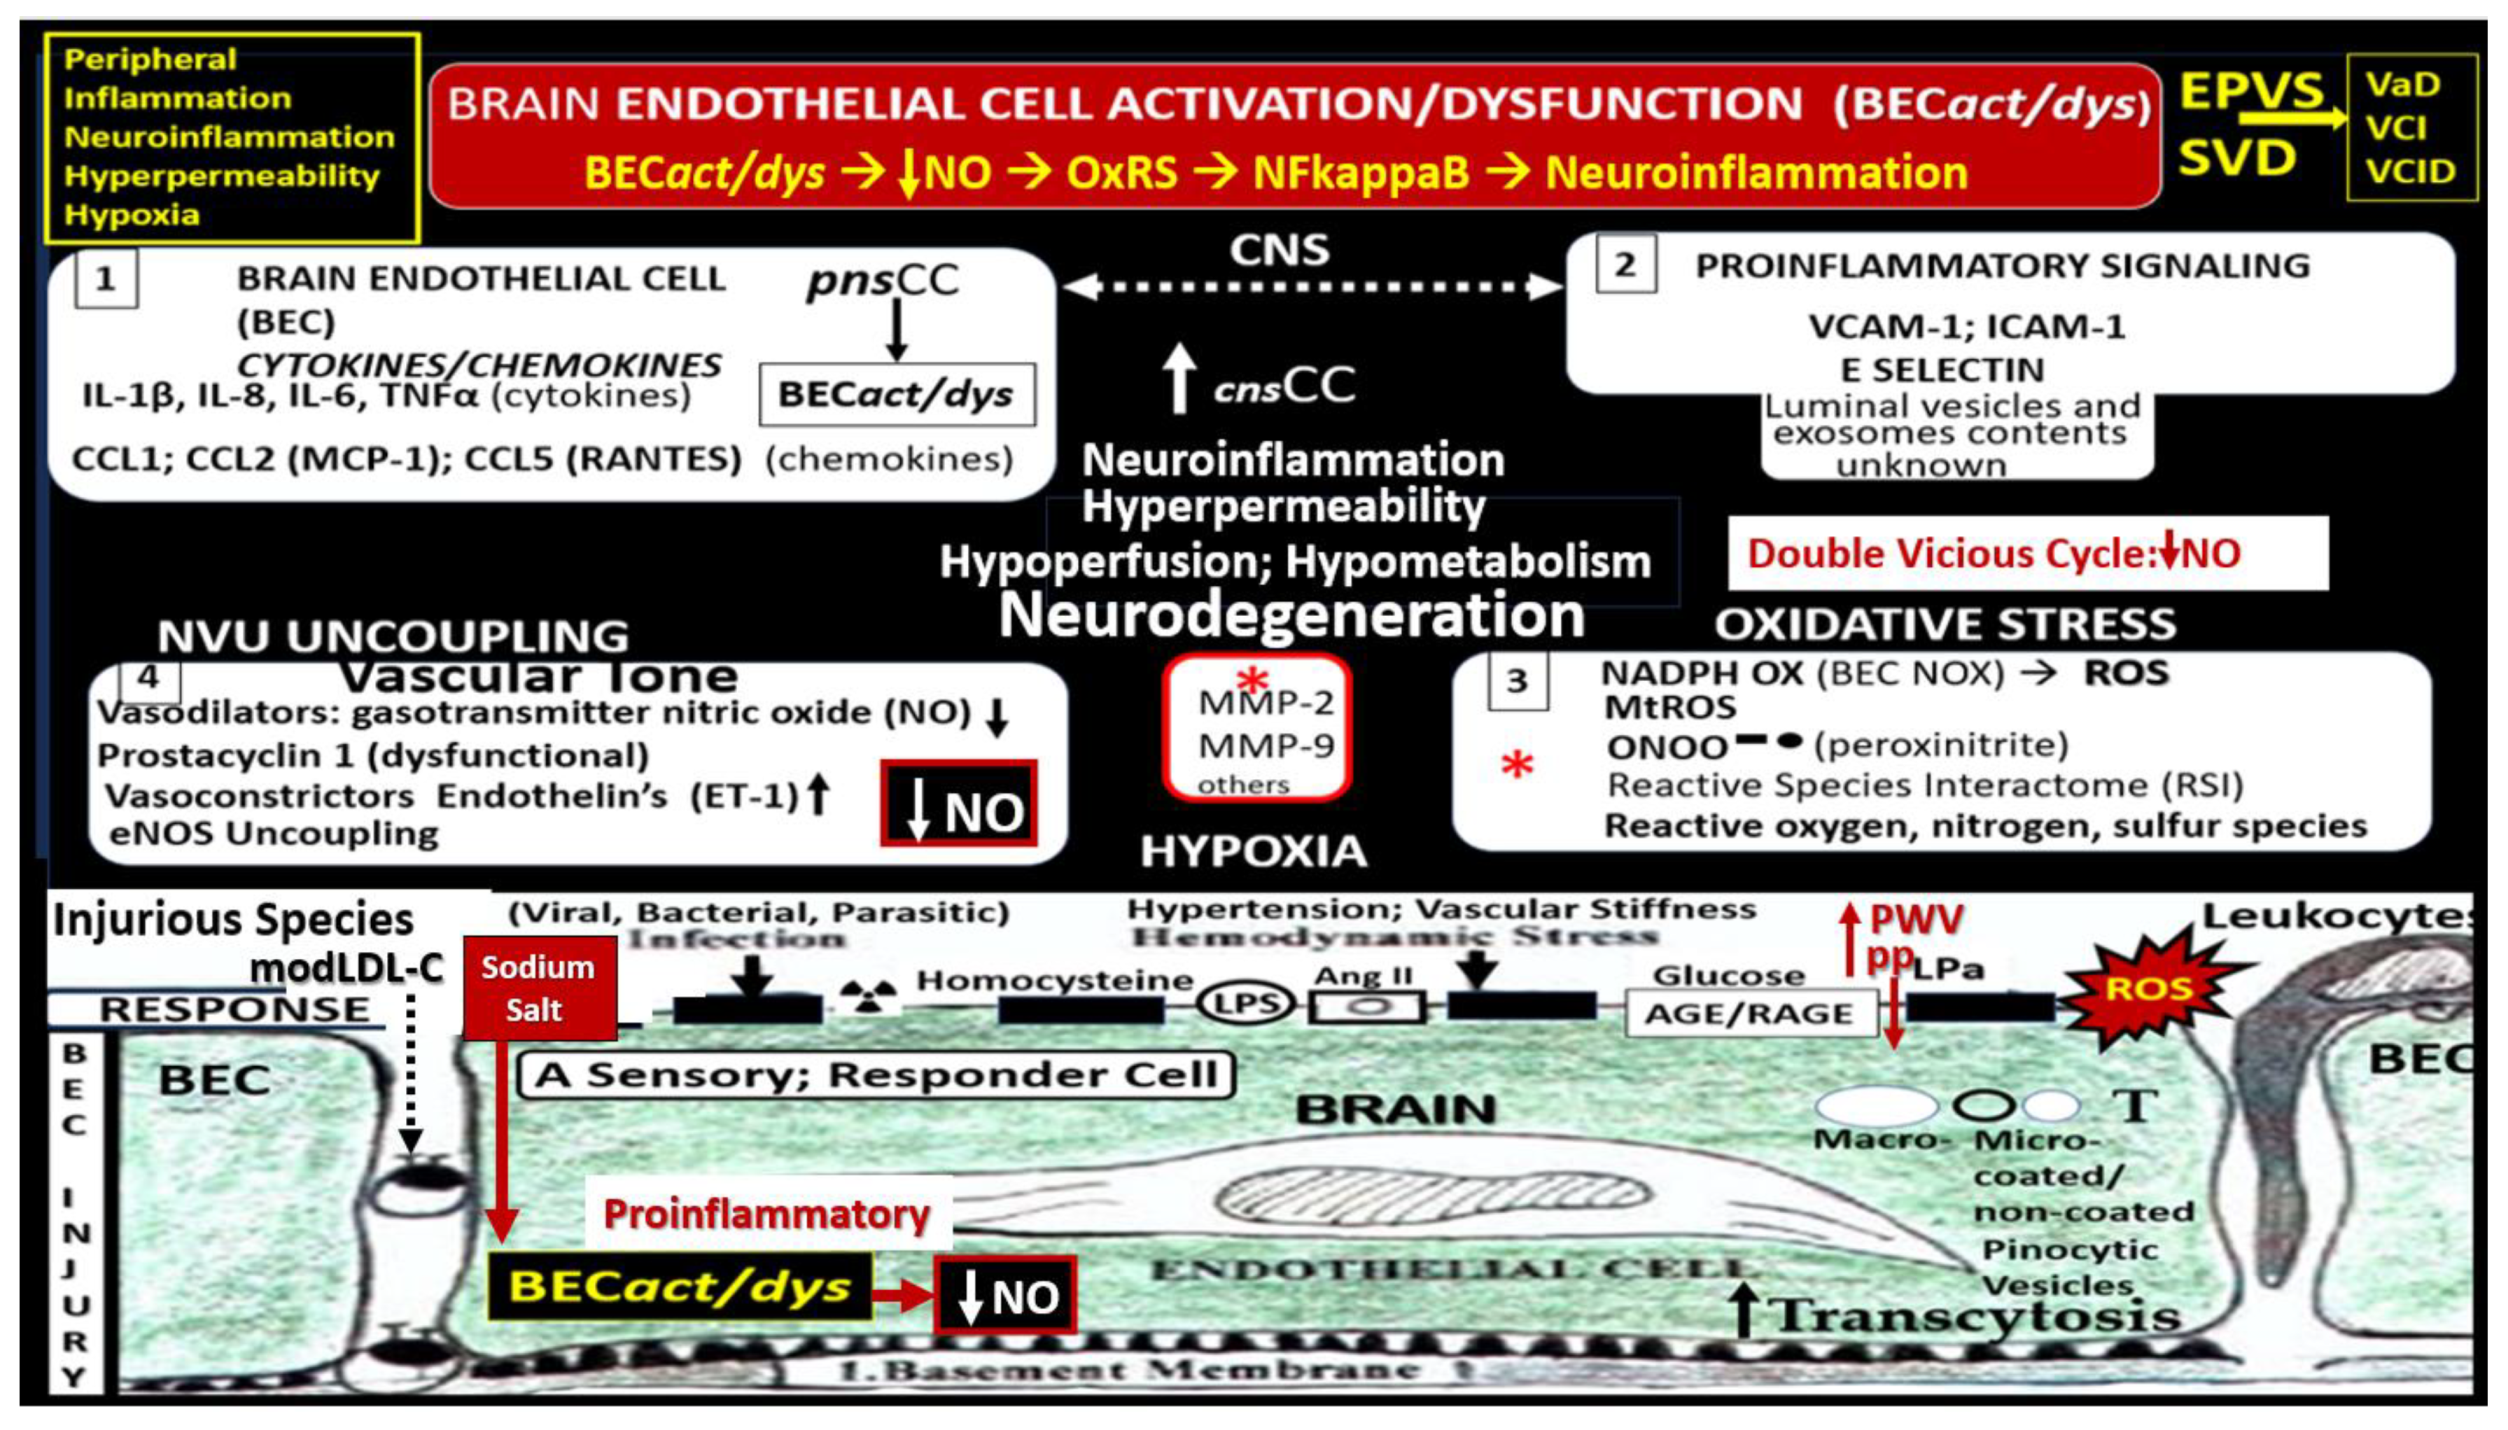
Figure 11.
10 major transmission electron microscopic ultrastructural changes to systemic and brain endothelial cells (SECs and BECs) in various preclinical female rodent models including diet-induced obesity (Western models), obese, insulin resistant, diabetic (db/db mice), lipopolysaccharide neuroinflammatory male mice, and genetic male hypertensive (transgenic heterozygous (mRen2)27 (Ren2) rats.). Notably, BEC stiffening was determined by atomic force microscopy in number 9. Image provided by CC 4.0 [25,26,27]. ecGCx, endothelial cell glycocalyx; LPS, lipopolysaccharide; mtROS, mitochondrial-derived reactive oxygen species. .
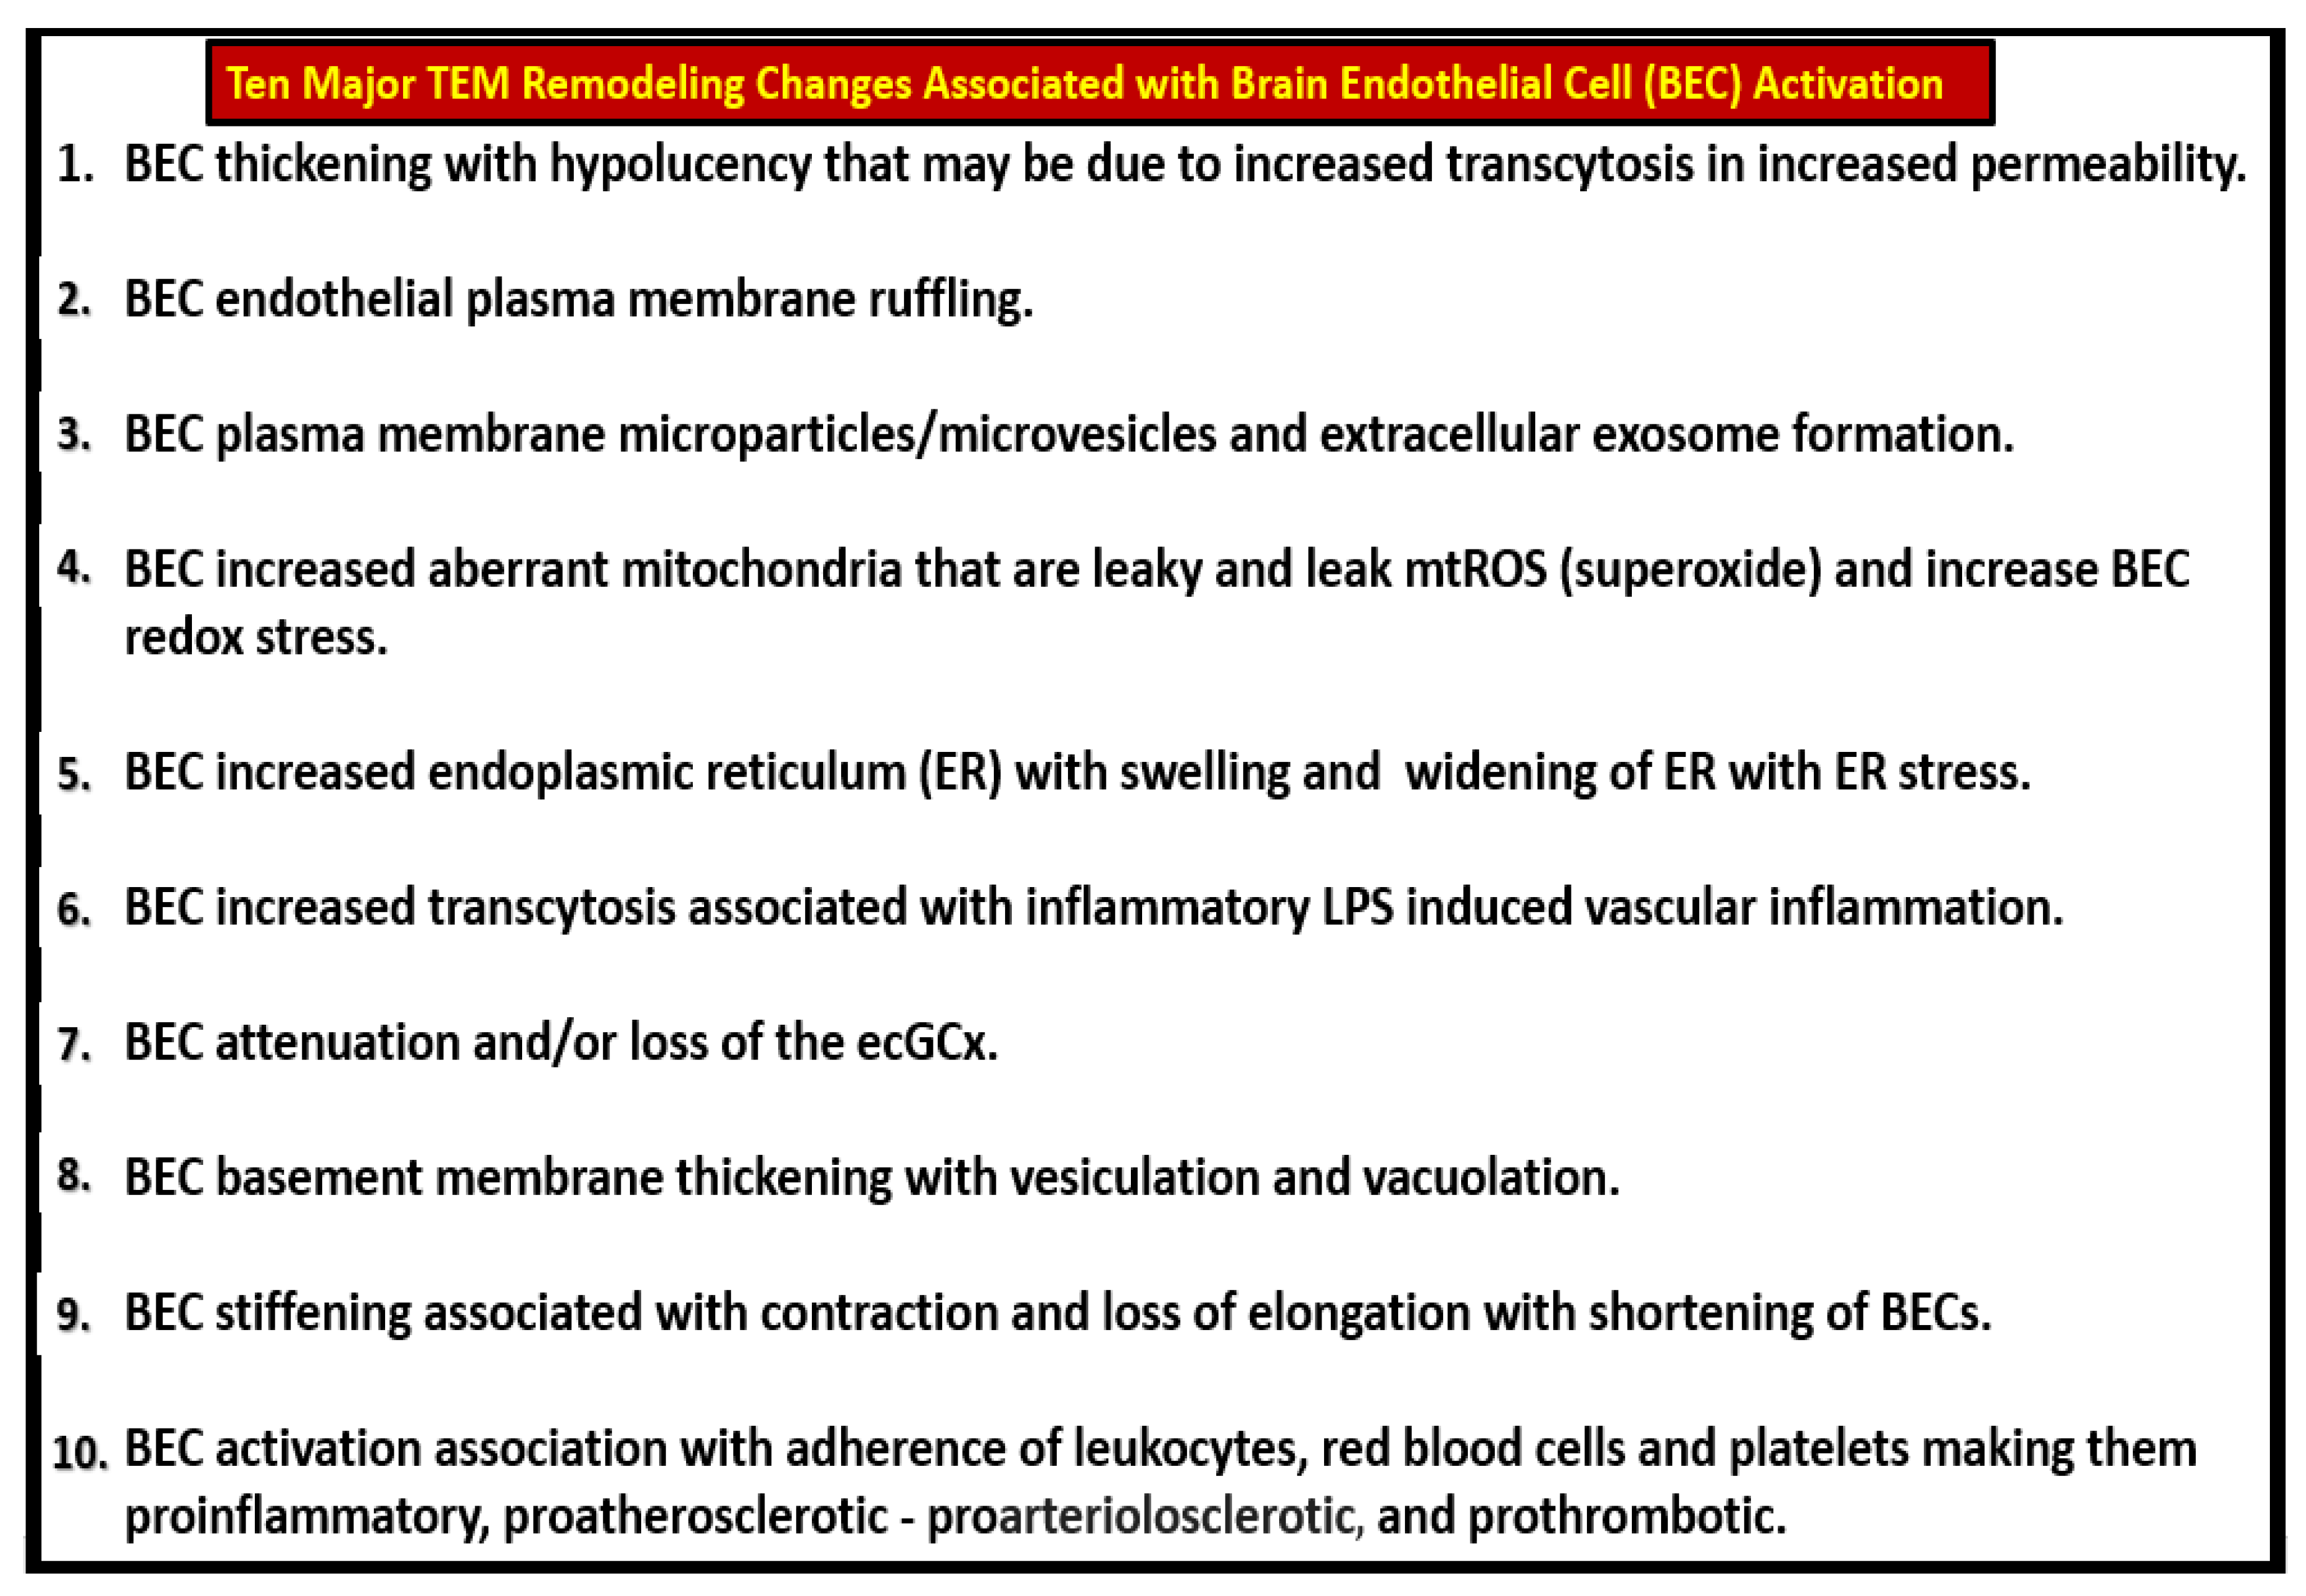
Figure 12.
The “H” phenomenon of the MetS (hyperlipidemia (obesity lipid triad), hyperinsulinemia (IR), hypertension (HTN), and hyperglycemia (impaired glucose tolerance (IGT) +/- type 2 diabetes mellitus (T2DM), as well as, the clustering effect of each of these variables of the MetS itself contribute to extracranial vascular arterial stiffening (VAS). Additionally, IR and LR contribute to vascular stiffening primarily through the actions of obesity on the development of VAS. Modified graphic abstract image provided with permission by CC 4.0 [38Hay]. AAA, abdominal aortic aneurysm; aMt, aberrant mitochondria; CCVD, cerebrocardiovascular disease; CAD, coronary artery disease; CKD, chronic kidney disease; CL, capillary lumen; CVD, cardiovascular disease; BHK, brain-heart-kidney axis; CHF, congestive heart failure; Dd, diastolic dysfunction; EC, endothelial cell; FFA, free fatty acids; H, hyperlipidemia, hyperinsulinemia, hypertension, and hyperglycemia; HCY, homocysteine; HHCY, hyperhomocyteinemia; HVB, heart-vessel-brain axis; IR, insulin resistance; LR, leptin resistance; lncRNAs, long non-coding ribonucleic acids MI, myocardial infarction; miRNAs, micro ribonucleic acids; MΦ, macrophage; NO, nitric oxide; ROS, reactive oxygen species; RONS, reactive oxygen, nitrogen species; RONSS, reactive oxygen, nitrogen, sulfur species; RSI, reactive species interactome; VAS, extracranial vascular arterial stiffness. .
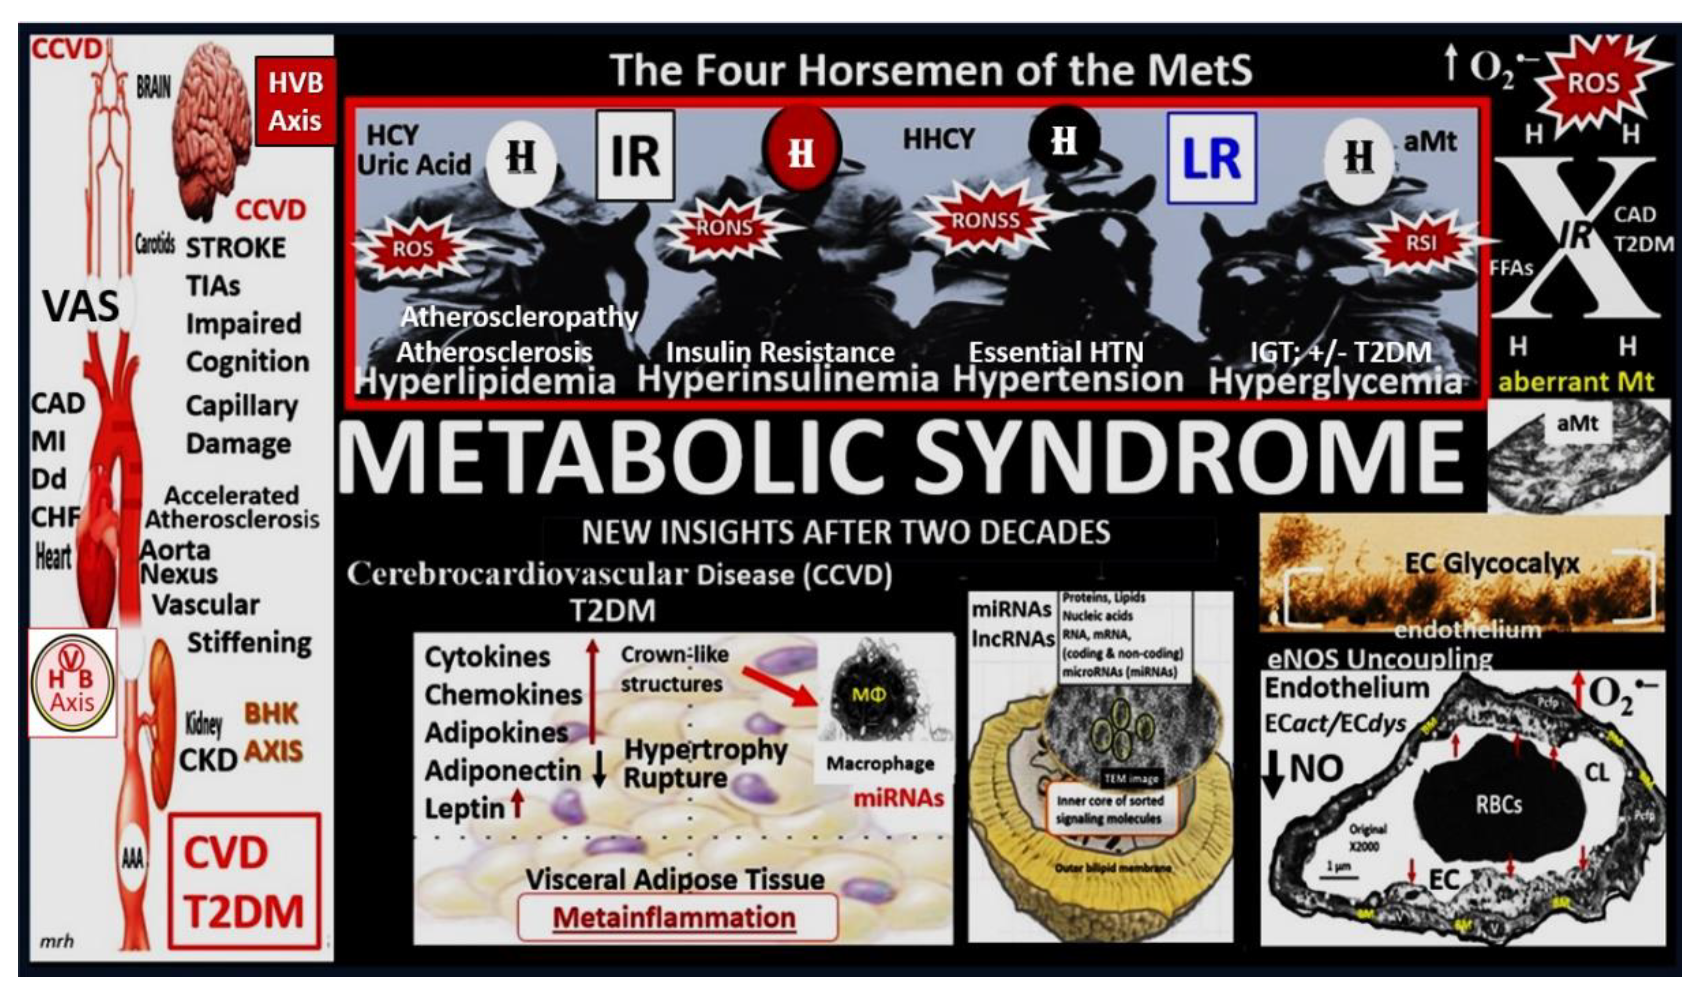
Figure 13.
Media vascular smooth muscle cells (VSMCs), collagen, proteoglycan (PG) and the phenotypic switch from contractile in control models to synthetic phenotypes in the lean hypertensive male transgenic heterozygous (mRen2)27 (Ren2) rats in the upper 1/3 of the descending thoracic aorta at 10-weeks of age. Panel A demonstrates the normal ultrastructure of the endothelium, intima, and media. Note the regular arrangement of internal elastic lamina (IEL) alternating with VSMCs and the elastic lamina (EL) with arrows pointing to aorta endothelial cells. The elastin lamellar unit (dashed yellow oval) is considered to be the basic contractile structural unit of the media. Note that the collagen in control groups is of the loose areolar collagen type. Panel B illustrates the VSMC layer interspersed between the layers of the EL. Panel C depicts the increased organized stiffer collagen 1 in the Ren2 hypertensive models. Panel D also depicts an increase in the matrix proteoglycans (asterisks). Panel E depicts the ‘phenotypic switch’ associated with VAS. The contractile normal phenotype (C) has an abundance of focal adhesion plaques (arrows) that firmly attach to the extracellular matrix (ECM) proteins; however, the phenotypic switch to the synthetic VSMCs (S) have no adhesions and are known to be quite mobile within the media and subintimal spaces of the vascular wall and are also capable of increased synthesis of stiffer collagen and PGN. These synthetic VSMC have a more electron dense cytoplasm that is supportive of increased endoplasmic reticulum (see comparative insets). Also, note the nuclear separation in the synthetic phenotype. Modified images provided with permission by 4.0 [50]. .
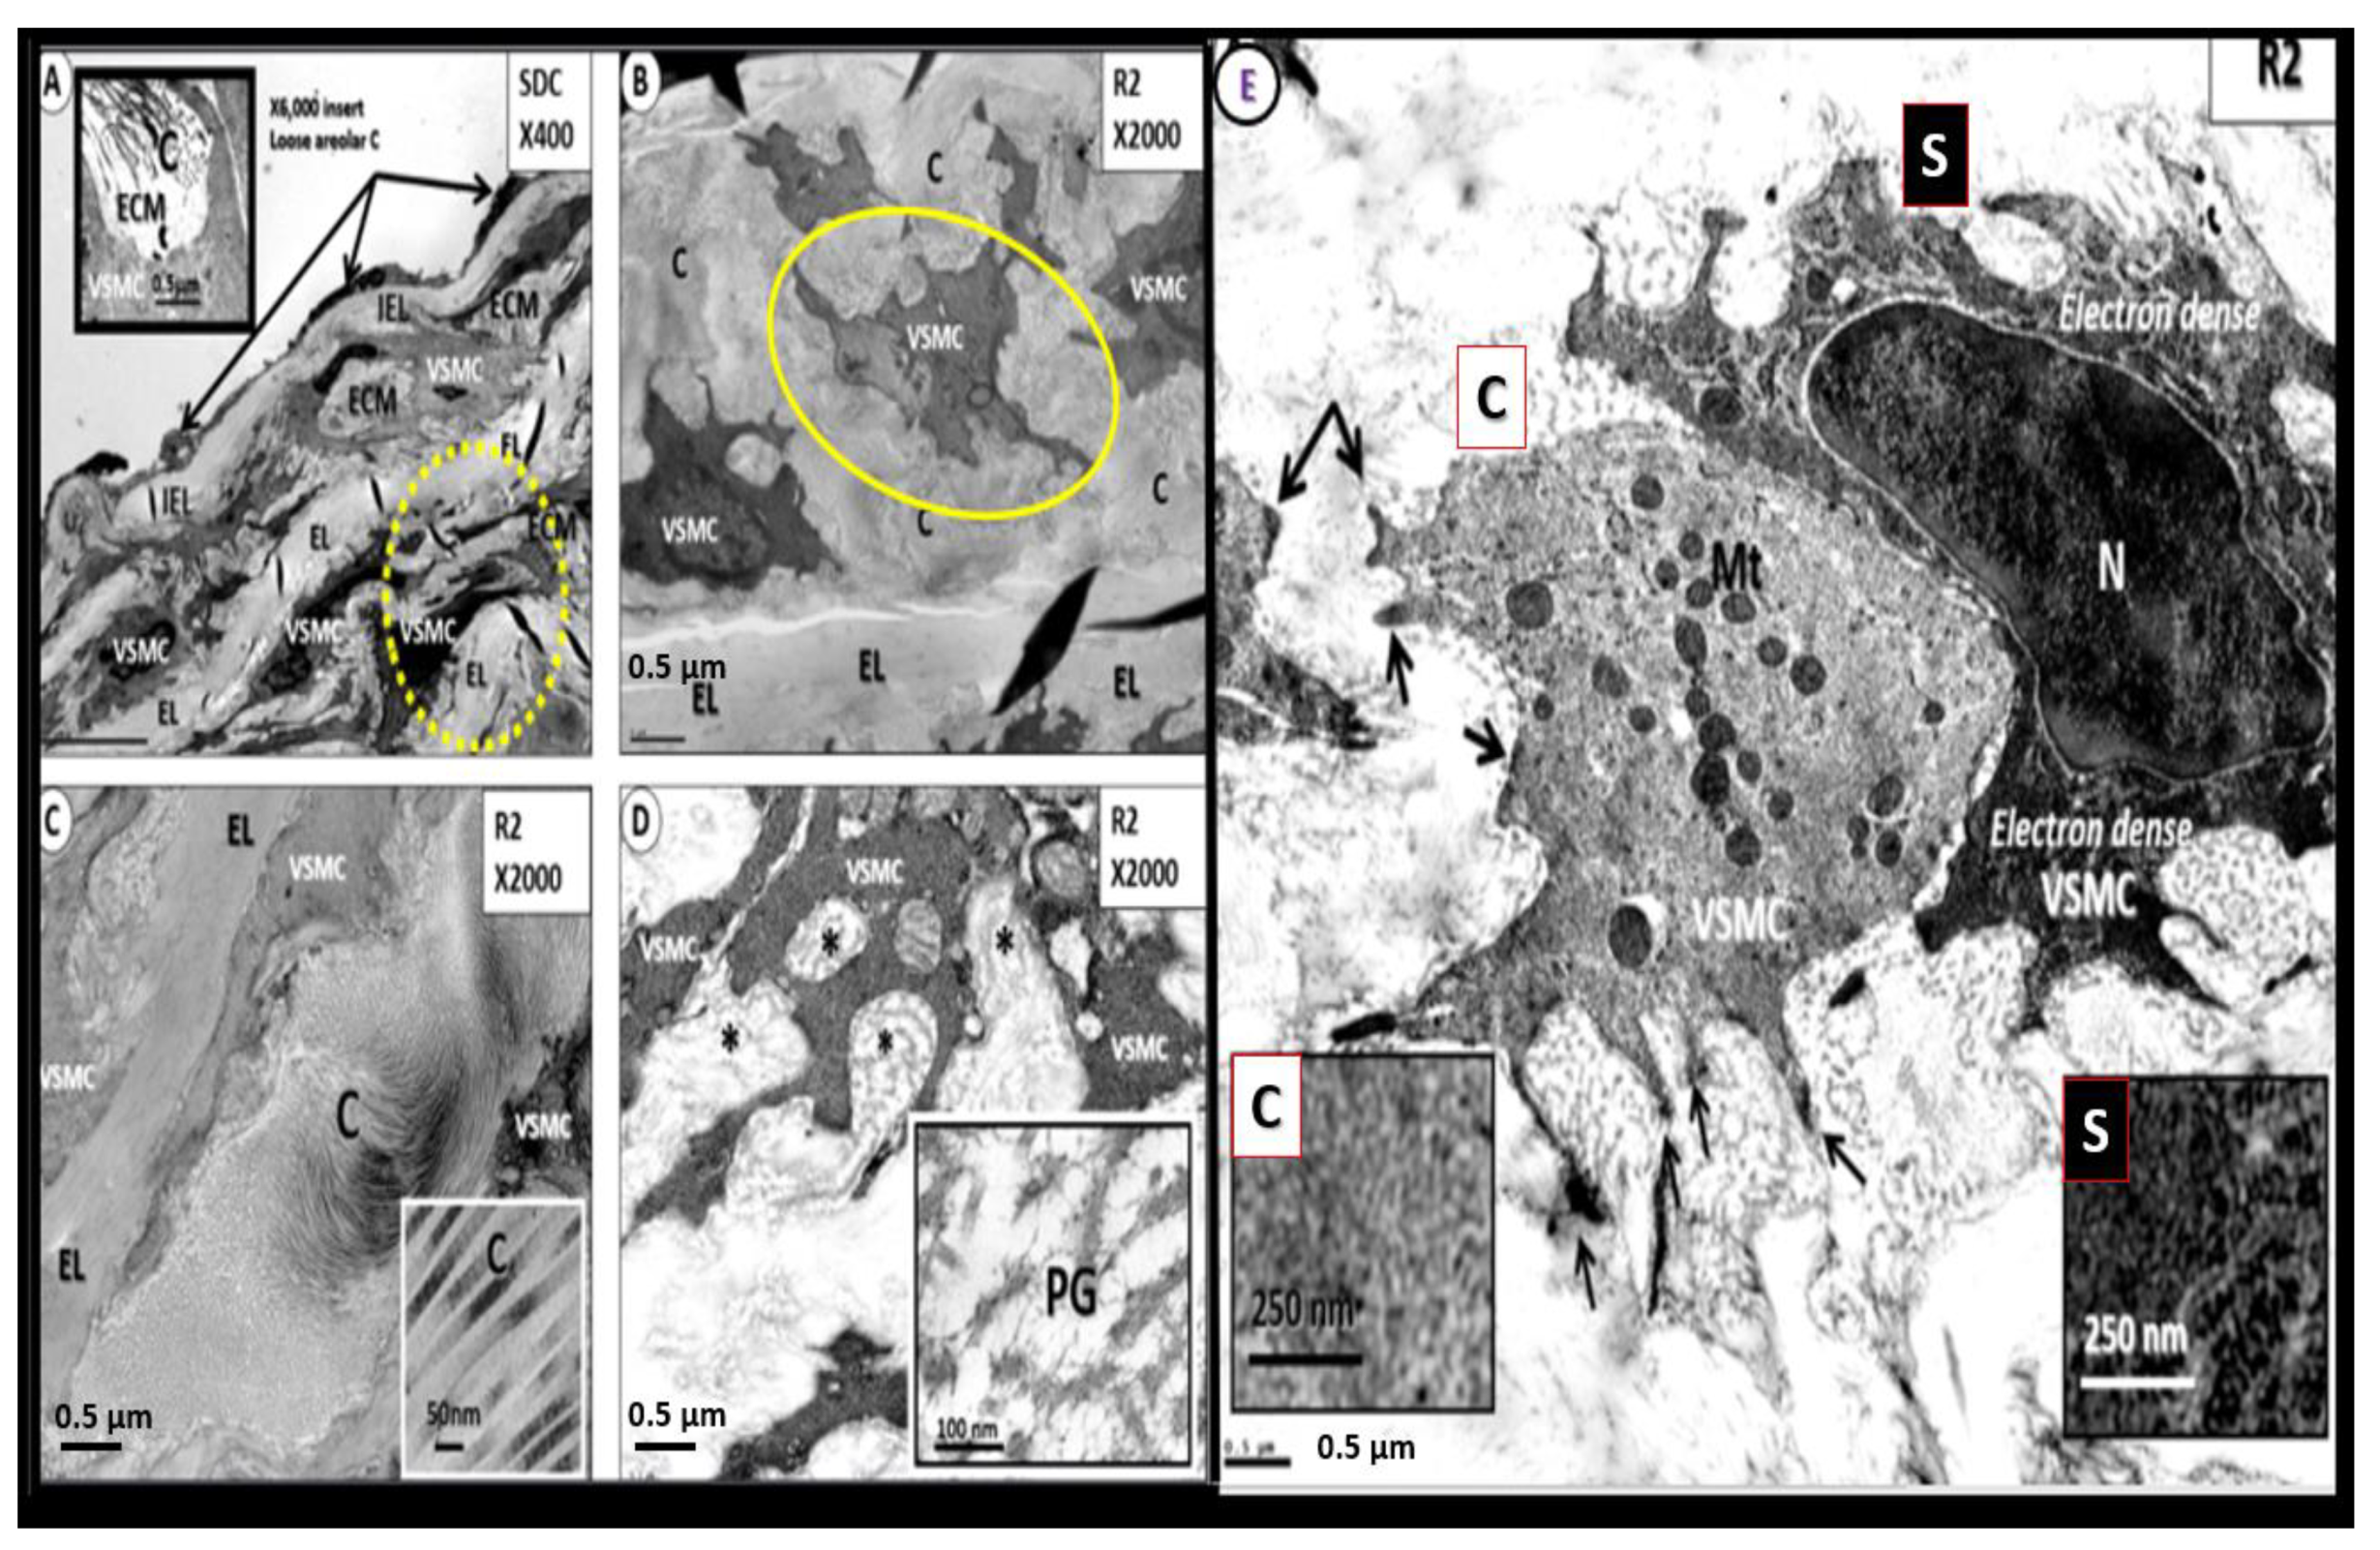
Figure 14.
Descending thoracic aorta endothelial cell lifting and separation from the internal elastic lamina (IEL) and IEL and elastin lamella fragmentation in the female obese insulin resistant diabetic db/db mouse models at 20-weeks of age. Panel A demonstrates the normal tight adherence of the aortic endothelial cells to the underlying IEL in control models. Panel B depicts the abnormal structural remodeling of EC lifting and separation from the IEL in the obese, diabetic db/db models at 10-weeks of age. Panel C depicts the elastolysis of the IEL (outlined by white dashed line) that provides a space in which there resides elastin-derived fragments (a rich source of elastin-derived peptides (EDPs)) in the subendothelial space in the db/db models. Panel D also depicts the EC separation and lifting from the IEL with evidence of elastolysis and elastin fragments. Panel E demonstrates the intact elastin lamina (EL) adjacent to a VSMC with its homogeneous electron dense construct. Panel F depicts elastin lamella that has undergone elastin degradation with separation of elastin filaments with degradation. Importantly once elastin is fragmented or undergoes splitting-separation it loses its ability to lengthen and its important ability to undergo its recoil functions to resume its original length with increased stiffness and less compliance. Revised images provided with permission by 4.0 [94]. .
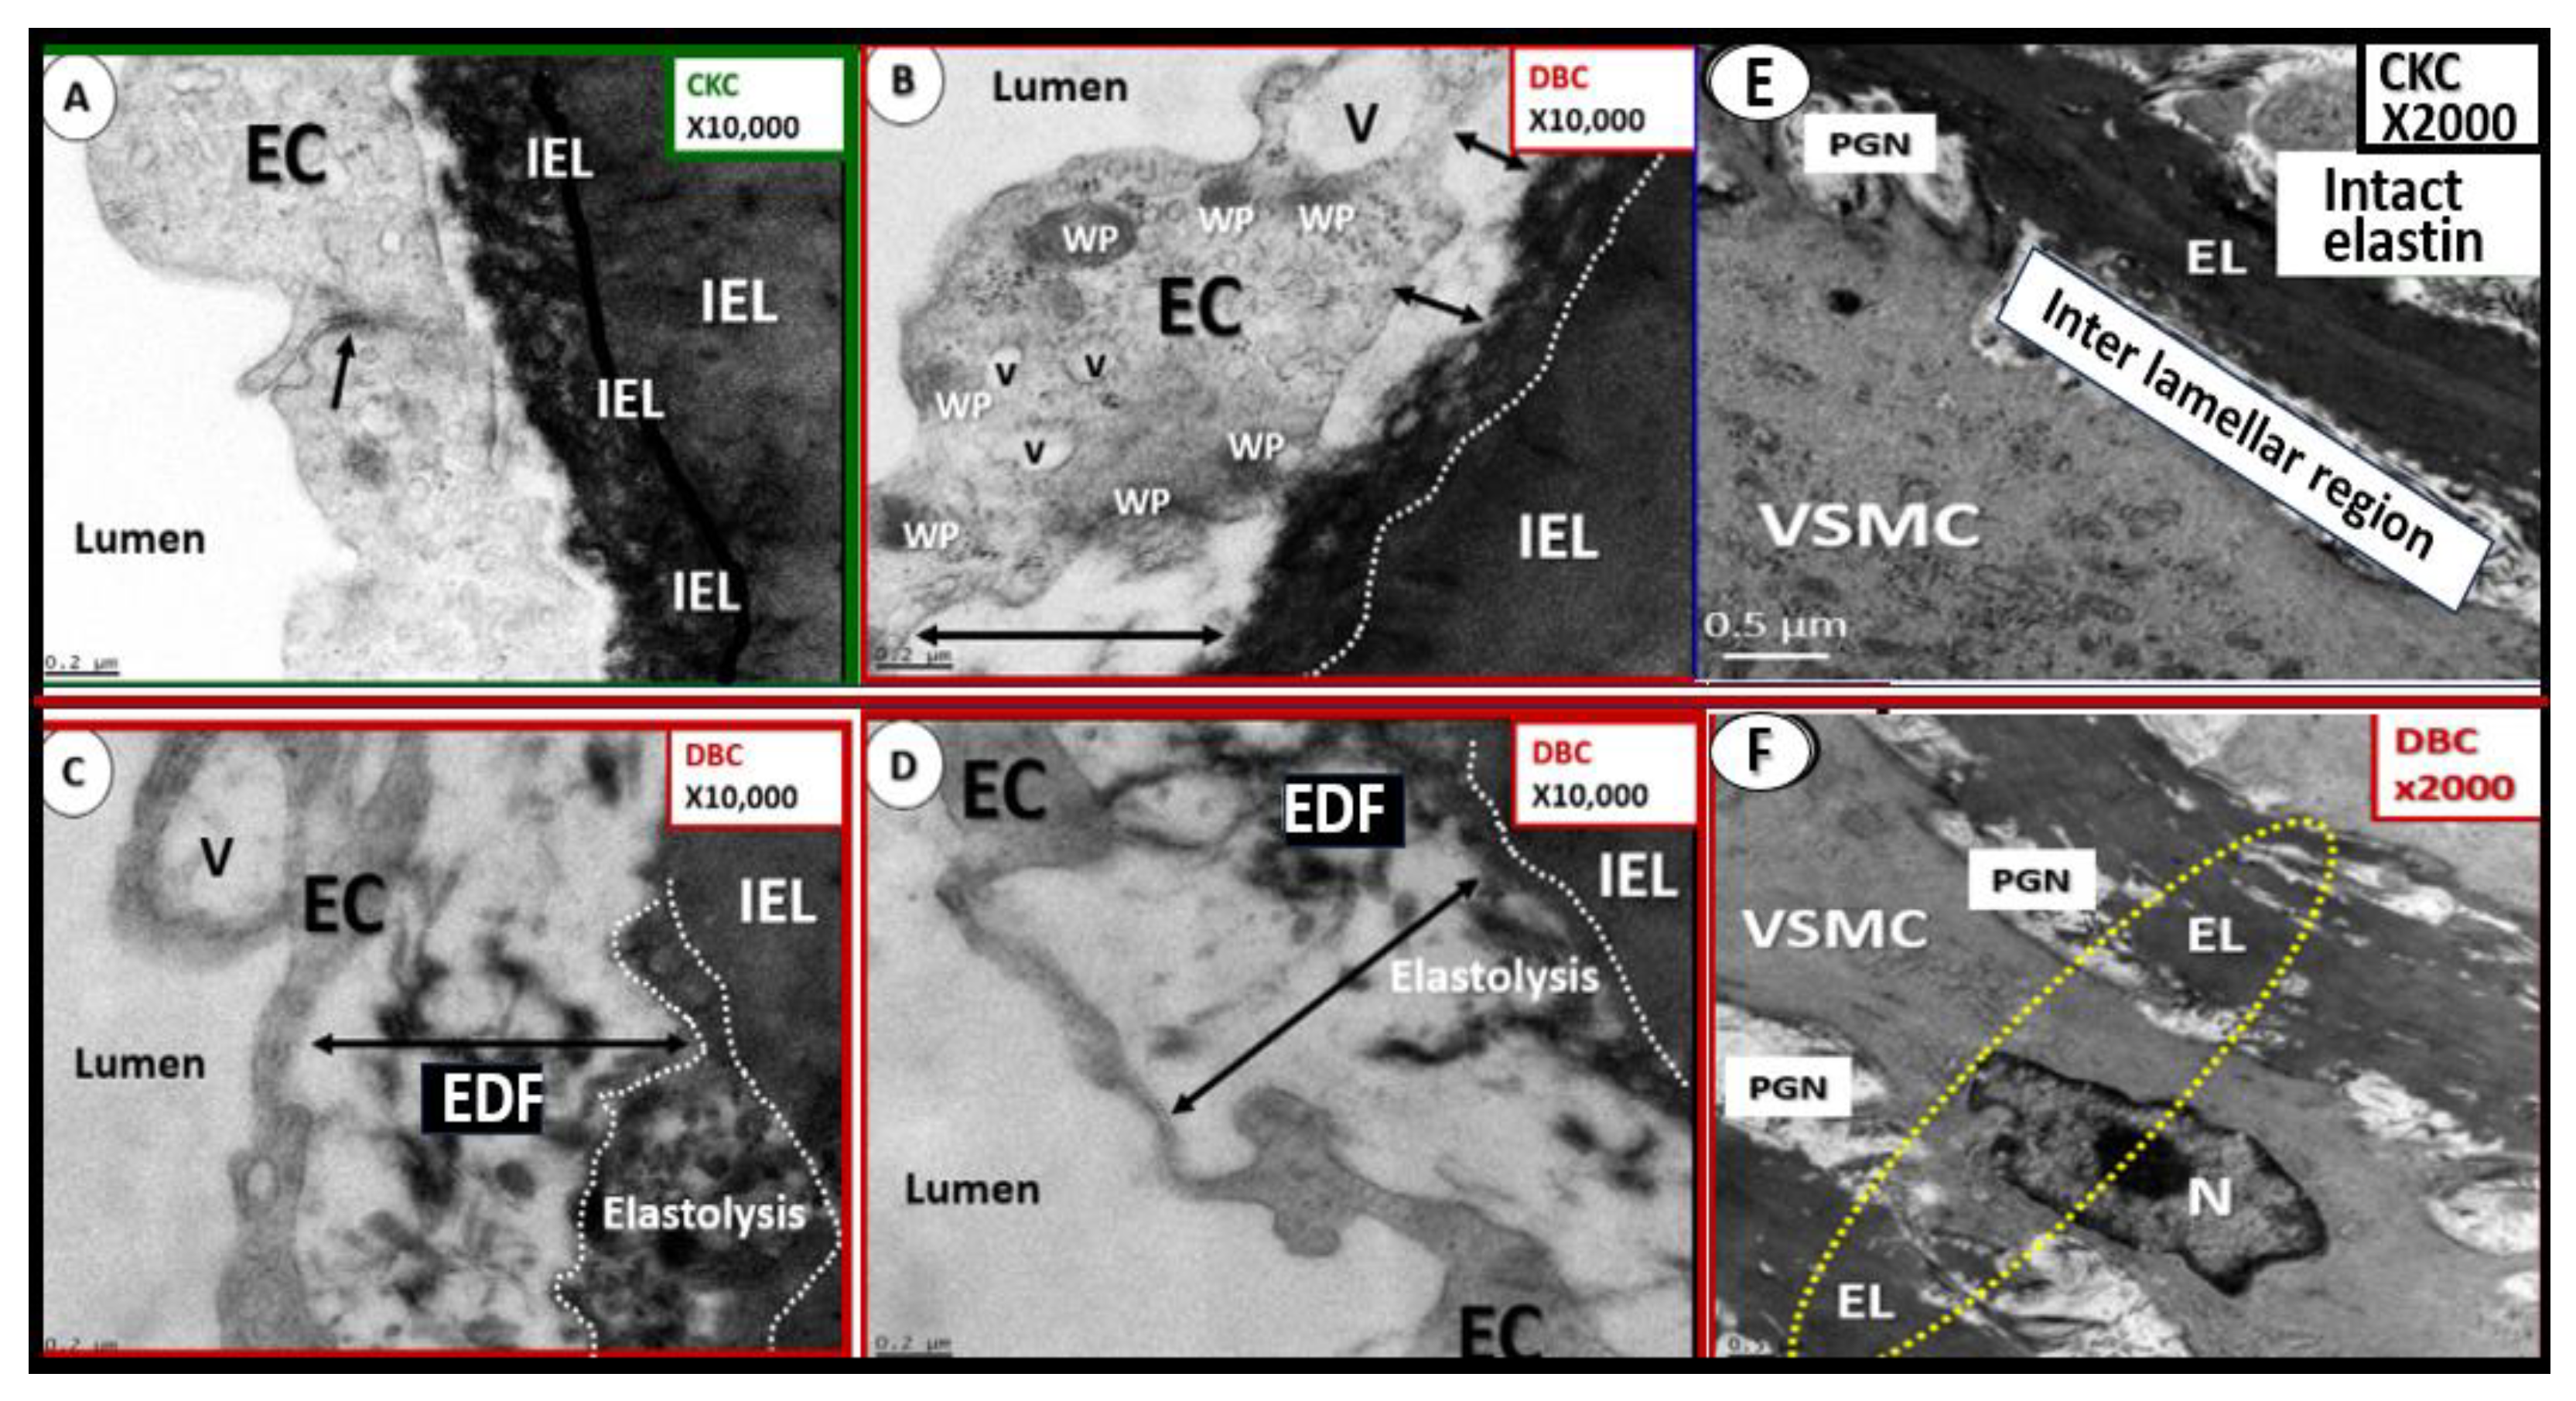
Figure 15.
Genesis of the neointima via the synthetic, migratory vascular smooth muscle cell (VSMC) in the lean hypertensive male transgenic heterozygous (mRen2)27 (Ren2) rat at 10-weeks of age. Panel A depicts the migratory synthetic vascular smooth muscle cell (VSMC) (pseudo-colored red) migrating to the internal elastic lamina (IEL) with elastolysis and breeching of the IEL (pseudo-colored yellow) to form the neointima. Also, note the lifting and separation of the aorta endothelial cell (pseudo-colored green). Panels B through F also depict the migration of VSMCs to create and reside within the neointimal space. Note that panel F is the original TEM of panel A that is pseudo-colored red and nicknamed the ‘red dragon’. Asterisks, denote the VSMCs creating and entering the neointimal-subintimal space. Modified image provided with permission by CC 4.0 [50].
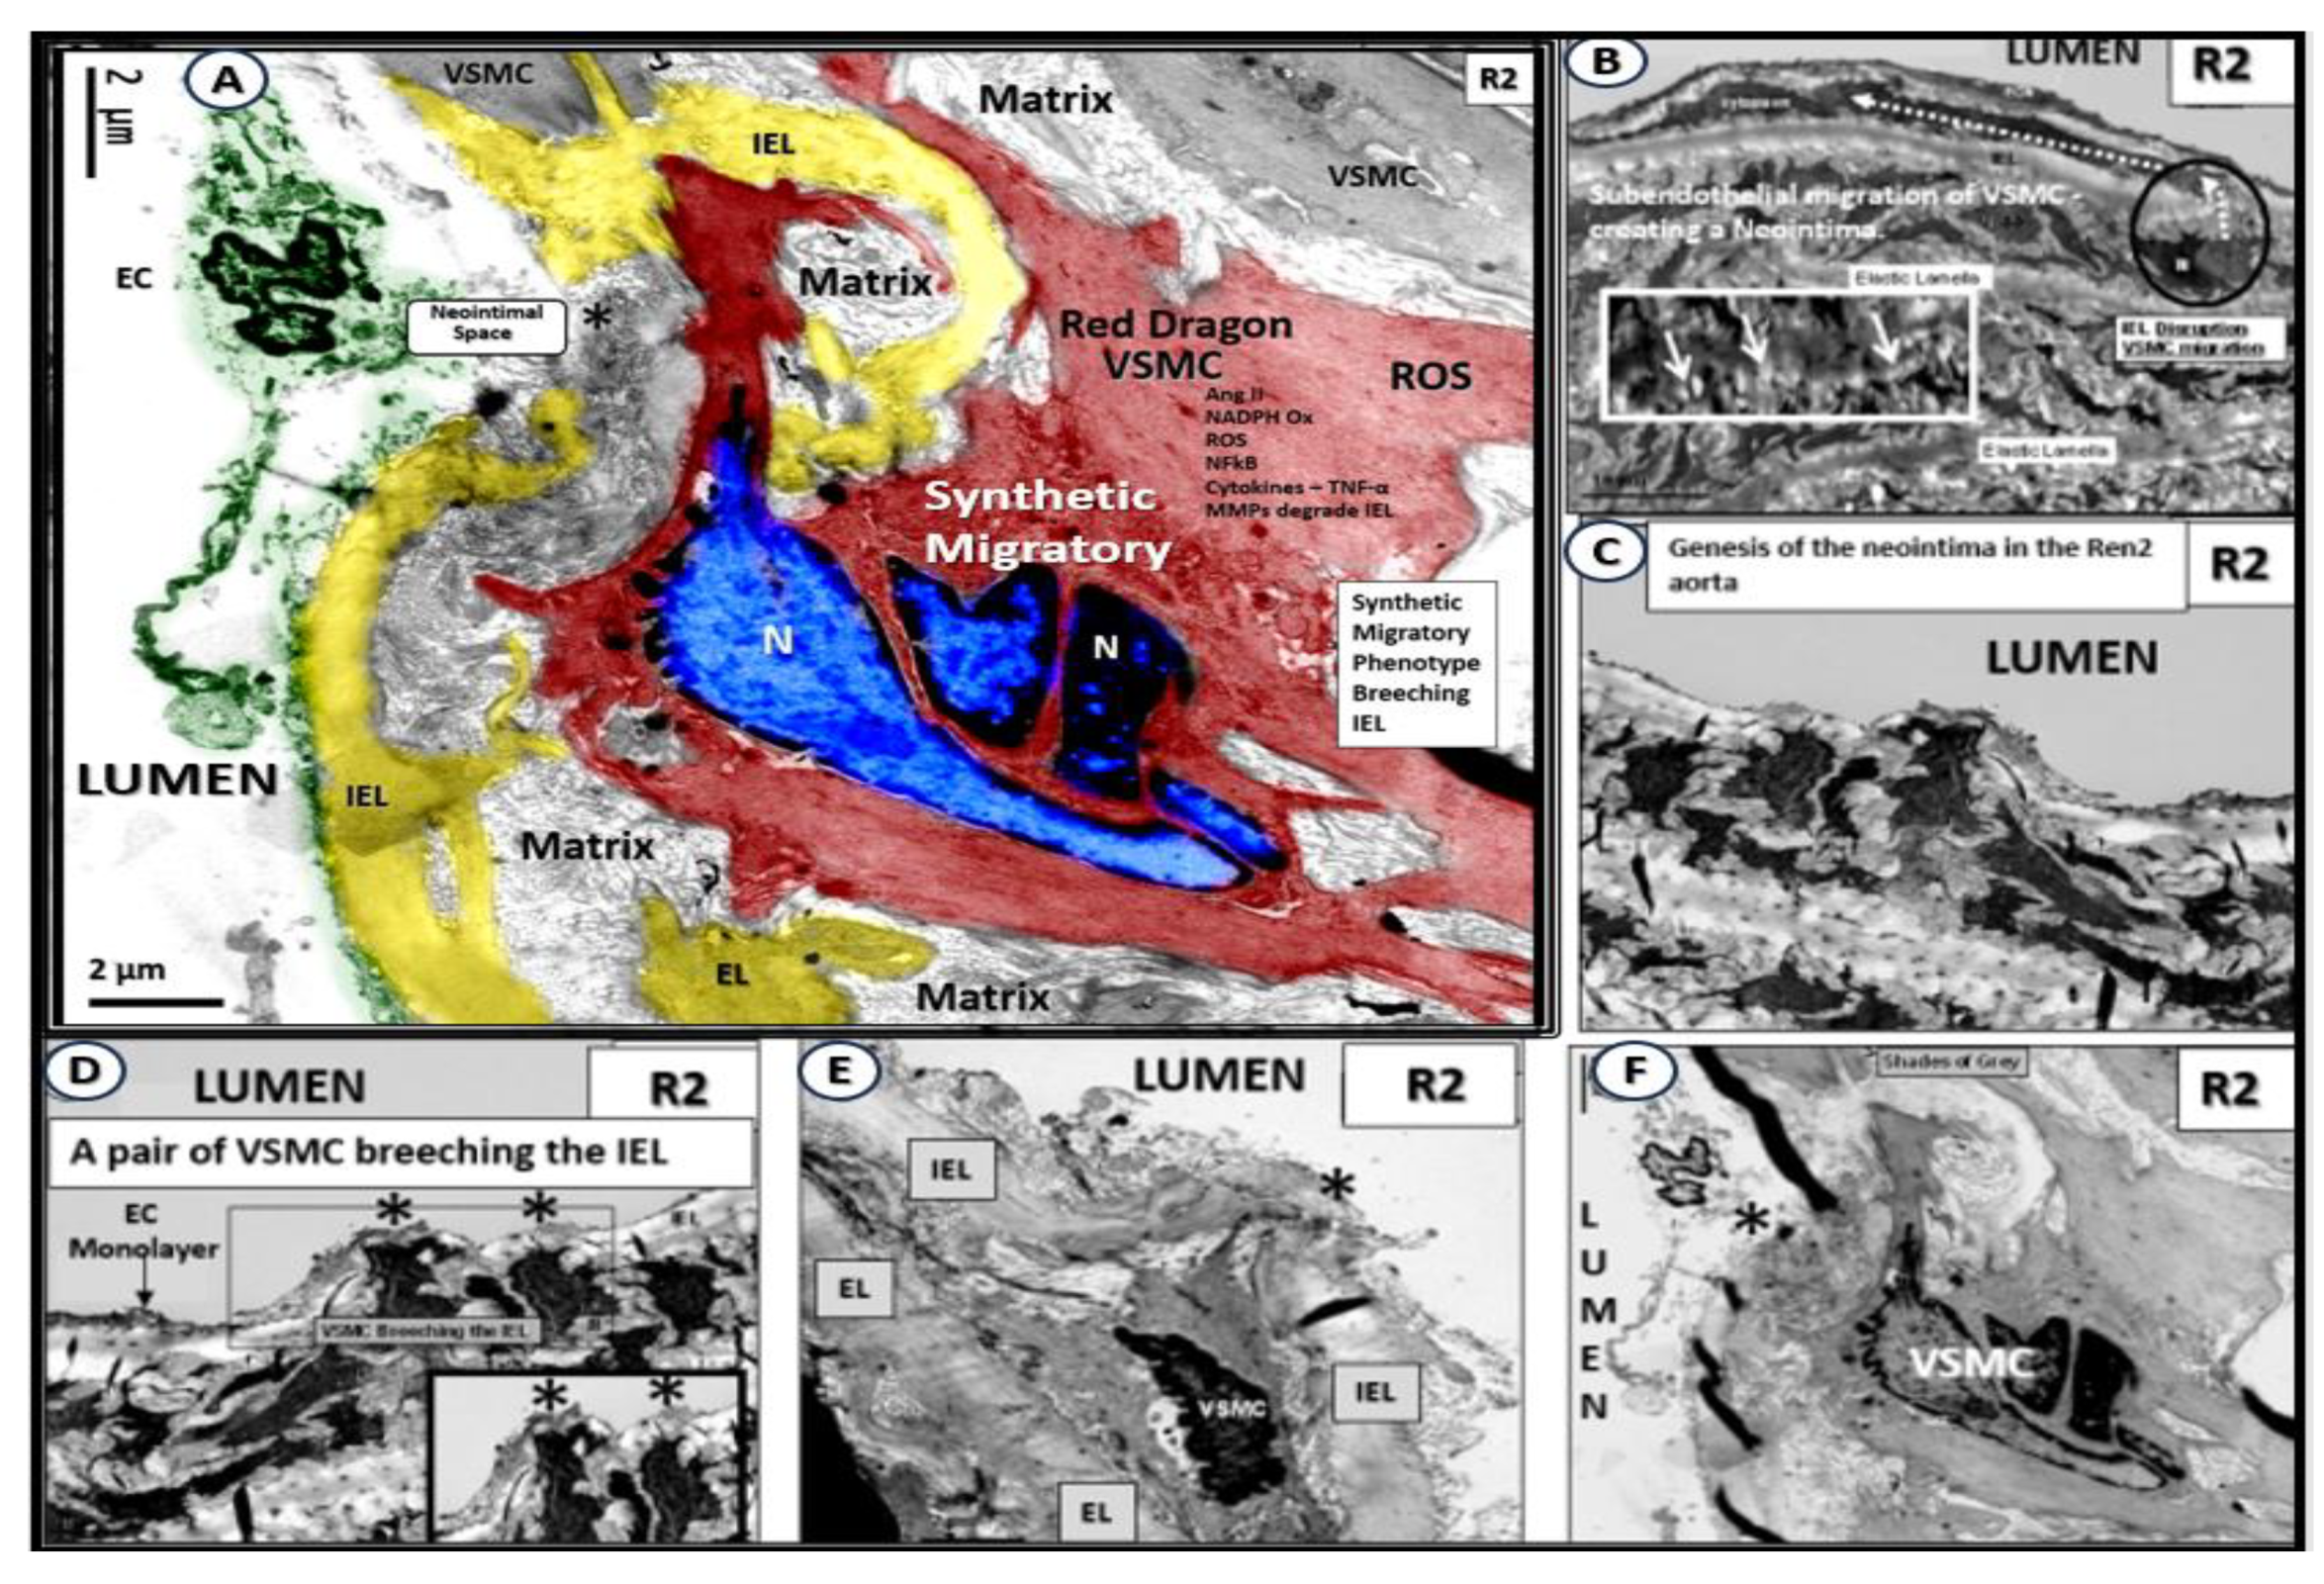
Figure 16.
Panel A illustrates the heart-vessel-brain (HVB) axis and vascular arterial stiffness (VAS) contributions to small vessel disease (SVD) via the damaging pulsatile pulse pressure (pp) to the carotids, vertebral (V) and basilar arteries, and the circle of Willis (C of W) to the central nervous system (CNS) microvessels. Panel B depicts cardio-cerebrovascular diseases including stroke (ischemic or hemorrhagic) that associate with and contribute to brain endothelial cell activation and dysfunction (BECact/dys) with concurrent blood–brain barrier dysfunction and disruption (BBBdd) induced ischemia, hypoxia, and chronic cerebral hypoperfusion (CCH) and hypometabolism via oxidative redox stress (OxRS) and neuroinflammation of the microvessels to result in neurodegeneration, impaired cognition, and dementia in LOAD and MD. Importantly, note how VCID and the brain are centrally placed within the overlapping Venn diagrams representing cardio-cerebrovascular disease (in red circle) and progressive neurodegeneration, cognitive impairment, LOAD (Alzheimer’s dementia), and mixed dementias (LOAD plus VAD) in aging individuals (in blue circle). Modified image in panel B provided with permission by CC 4.0 [27]. CCA, common carotid arteries; ICA, internal carotid; T, thoracic; VAD, vascular dementia.
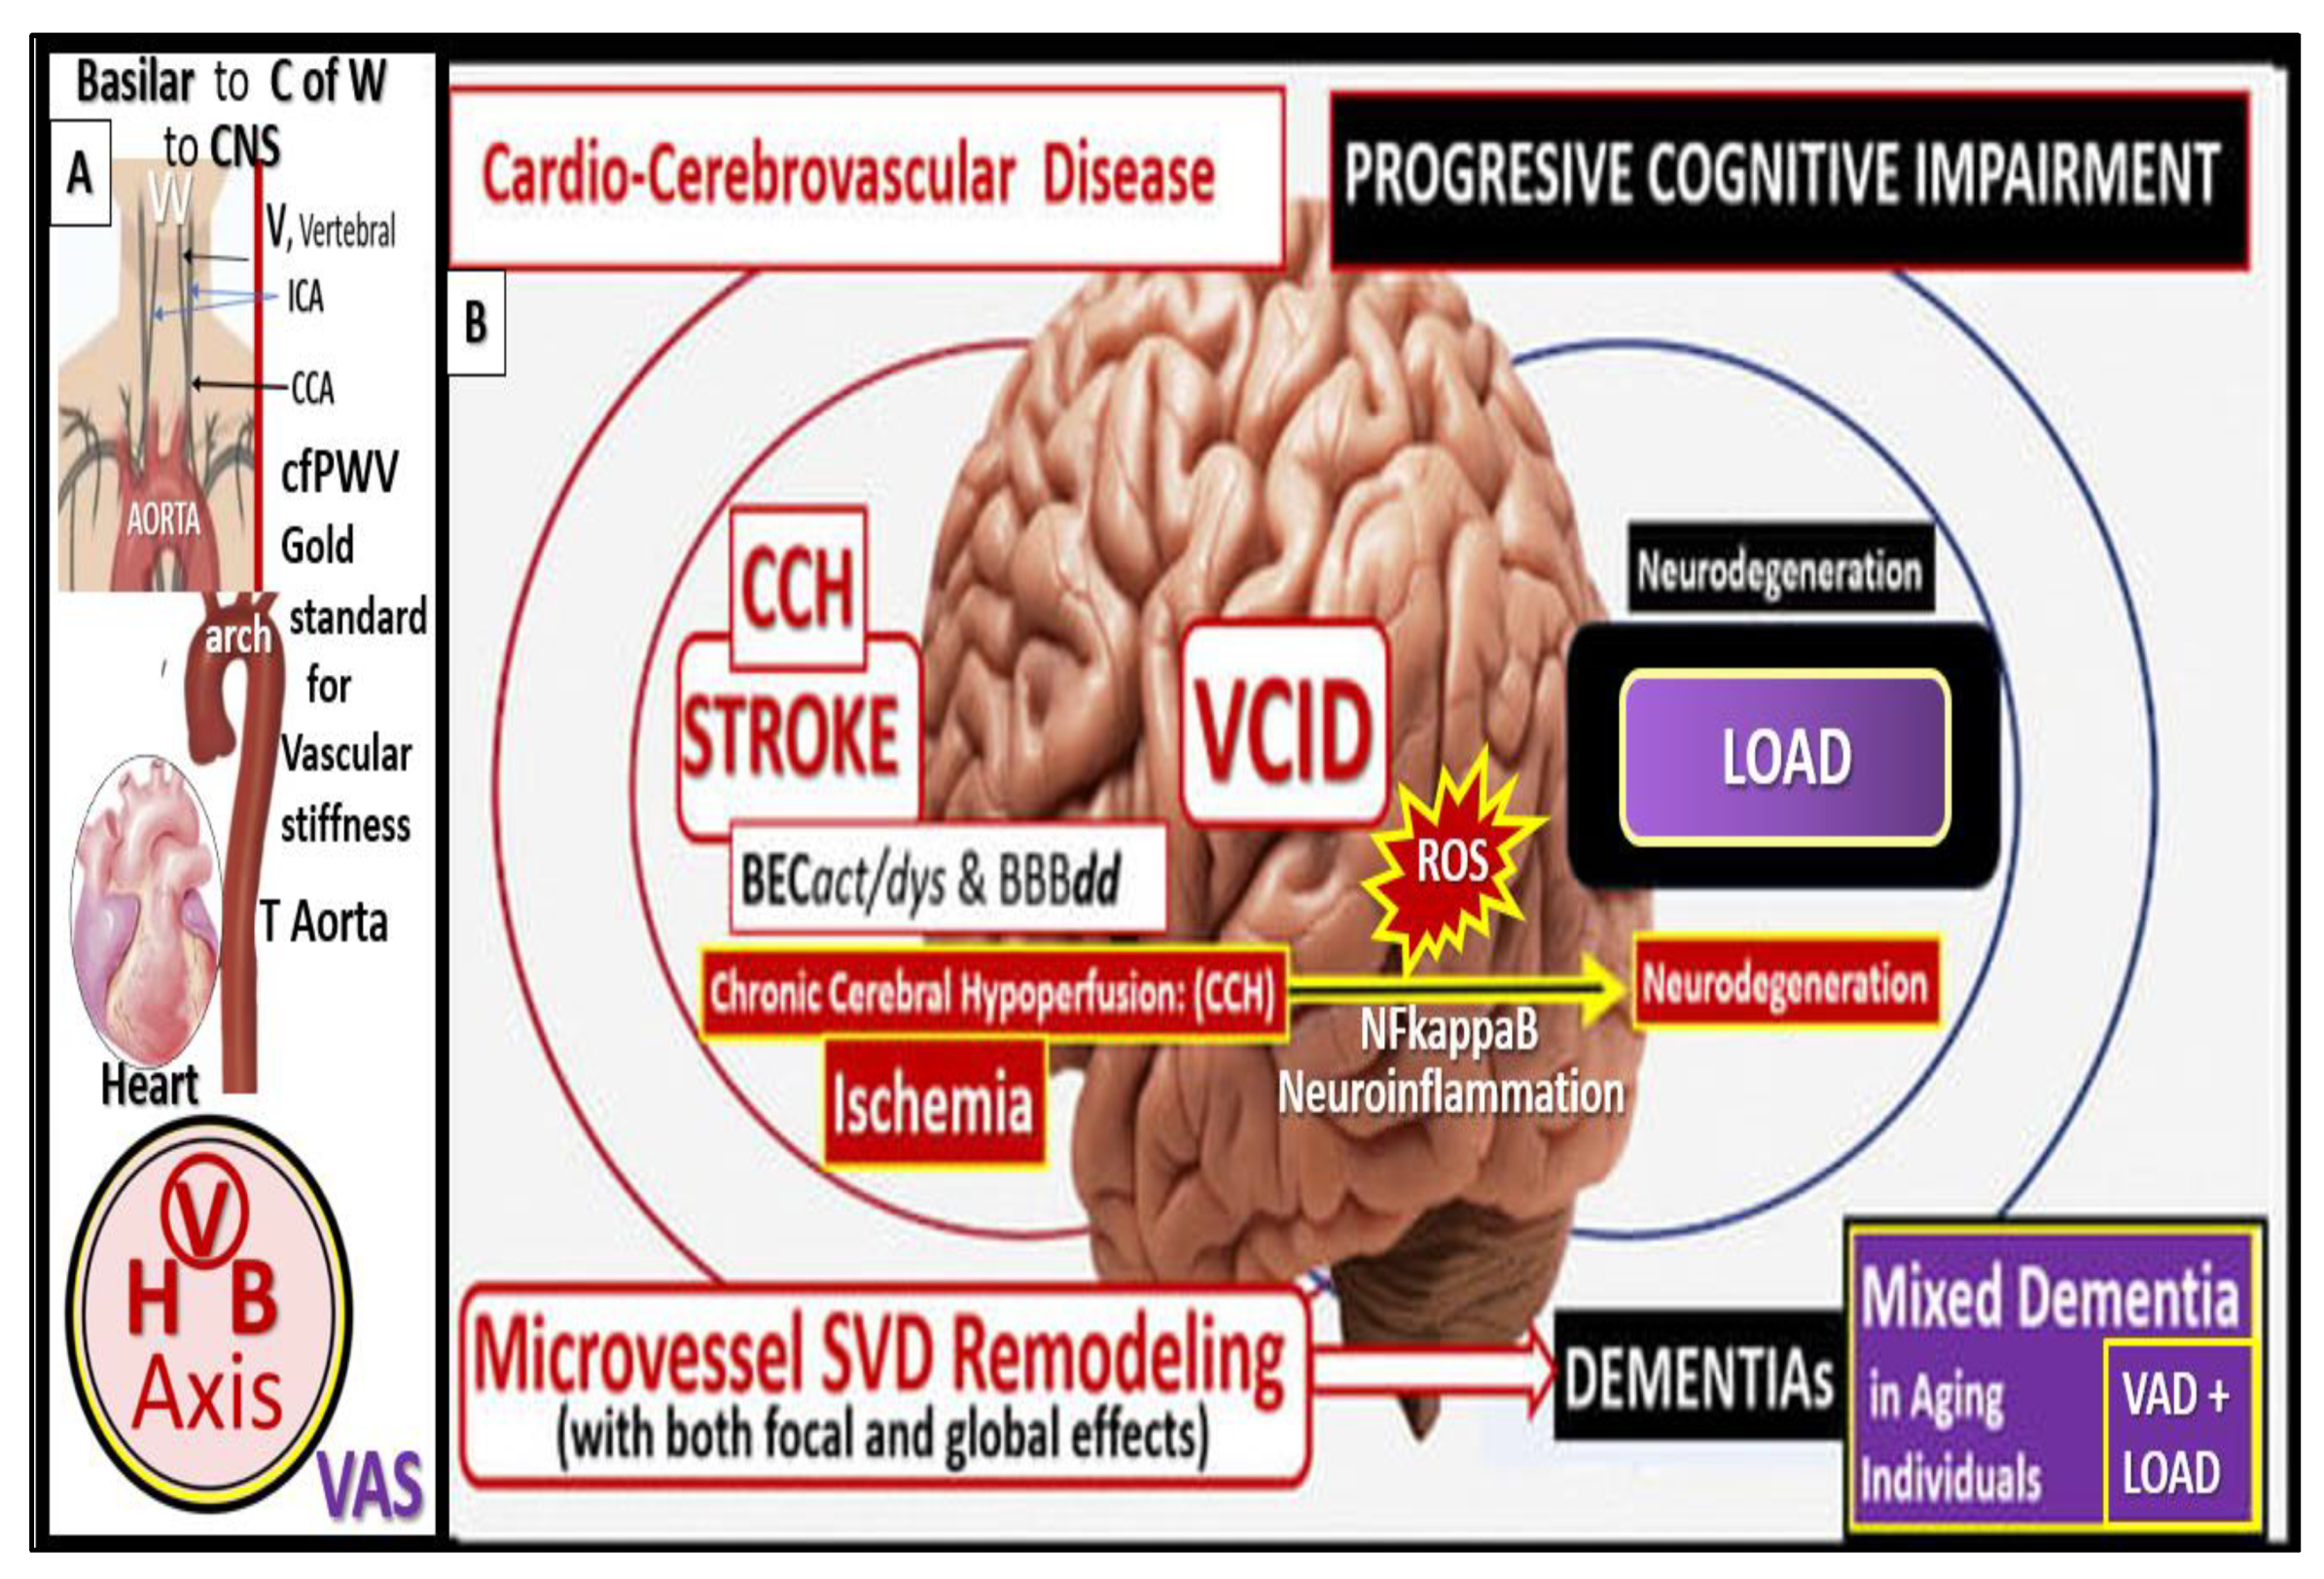
Figure 17.
Possible sequence of events involving increased pulse wave velocity (PWV) and increased pulsatile pulse pressure (pp) of extracranial vascular stiffening (VAS) to brain microvessels and subsequent neurodegeneration. The injurious stimuli of increased pp (upper left-hand insert of a cleaned capillary from the db/db female diabetic model; red arrows) are due to the direct effect of extracranial vascular arterial stiffening (VAS) and this injury to the brain endothelial cell(s) (BECs) results in a response to injury wound healing mechanism of BEC, hyperlucency, and thickening of the basement membrane (upper left). This injury also associates with increased oxidative redox stress (OxRS) via reactive oxygen species (ROS) and the reactive species interactome (RSI) and neuroinflammation that gives rise to BEC activation and dysfunction (BECact/dys) and blood-brain barrier dysfunction and disruption (BBBdd). Importantly BECact/dys results in neuroinflammation and decreased nitric oxide (NO) bioavailability in addition to increased neurovascular unit (NVU) permeability and NVU uncoupling. The NVU uncoupling gives rise to chronic cerebral hypoperfusion (CCH) and hypometabolism to regional neurons with resulting neurodegeneration, impaired cognition with mild cognitive impairment (MCI), dementia, and late-onset Alzheimer’s disease (LOAD). Concurrently, the cerebral small vessel disease (SVD) that associates with BECact/dys and BBBdd, eNOS uncoupling, decreased NO and endothelial nitric oxide synthase (eNOS) uncoupling can also give rise to neurodegeneration. Additionally, VAS may potentiate amyloid and tau accumulation and deposition in the brain through pulsatile damage to not only the NVU capillaries but also to the perivascular spaces and contribute to enlarged perivascular spaces that associate with impaired glymphatic waste removal of toxic oligomers of Aβ and tau [29]. Aβ, amyloid beta; BH2, dihydrobiopterin; BH4, tetrahydrobiopterin; CL, capillary lumen; CMBs, cerebral microbleeds; EPVS, enlarged perivascular spaces; HVB, heart-vessel-vascular-brain axis (upper right-hand logo); MD, mixed dementia; MRI, magnetic resonance imaging; NADPH Ox, nicotinamide adenine dinucleotide phosphate oxidase reduced; RSI, reactive species interactome; VAD, vascular dementia; WMH, white mater hyperintensities. .
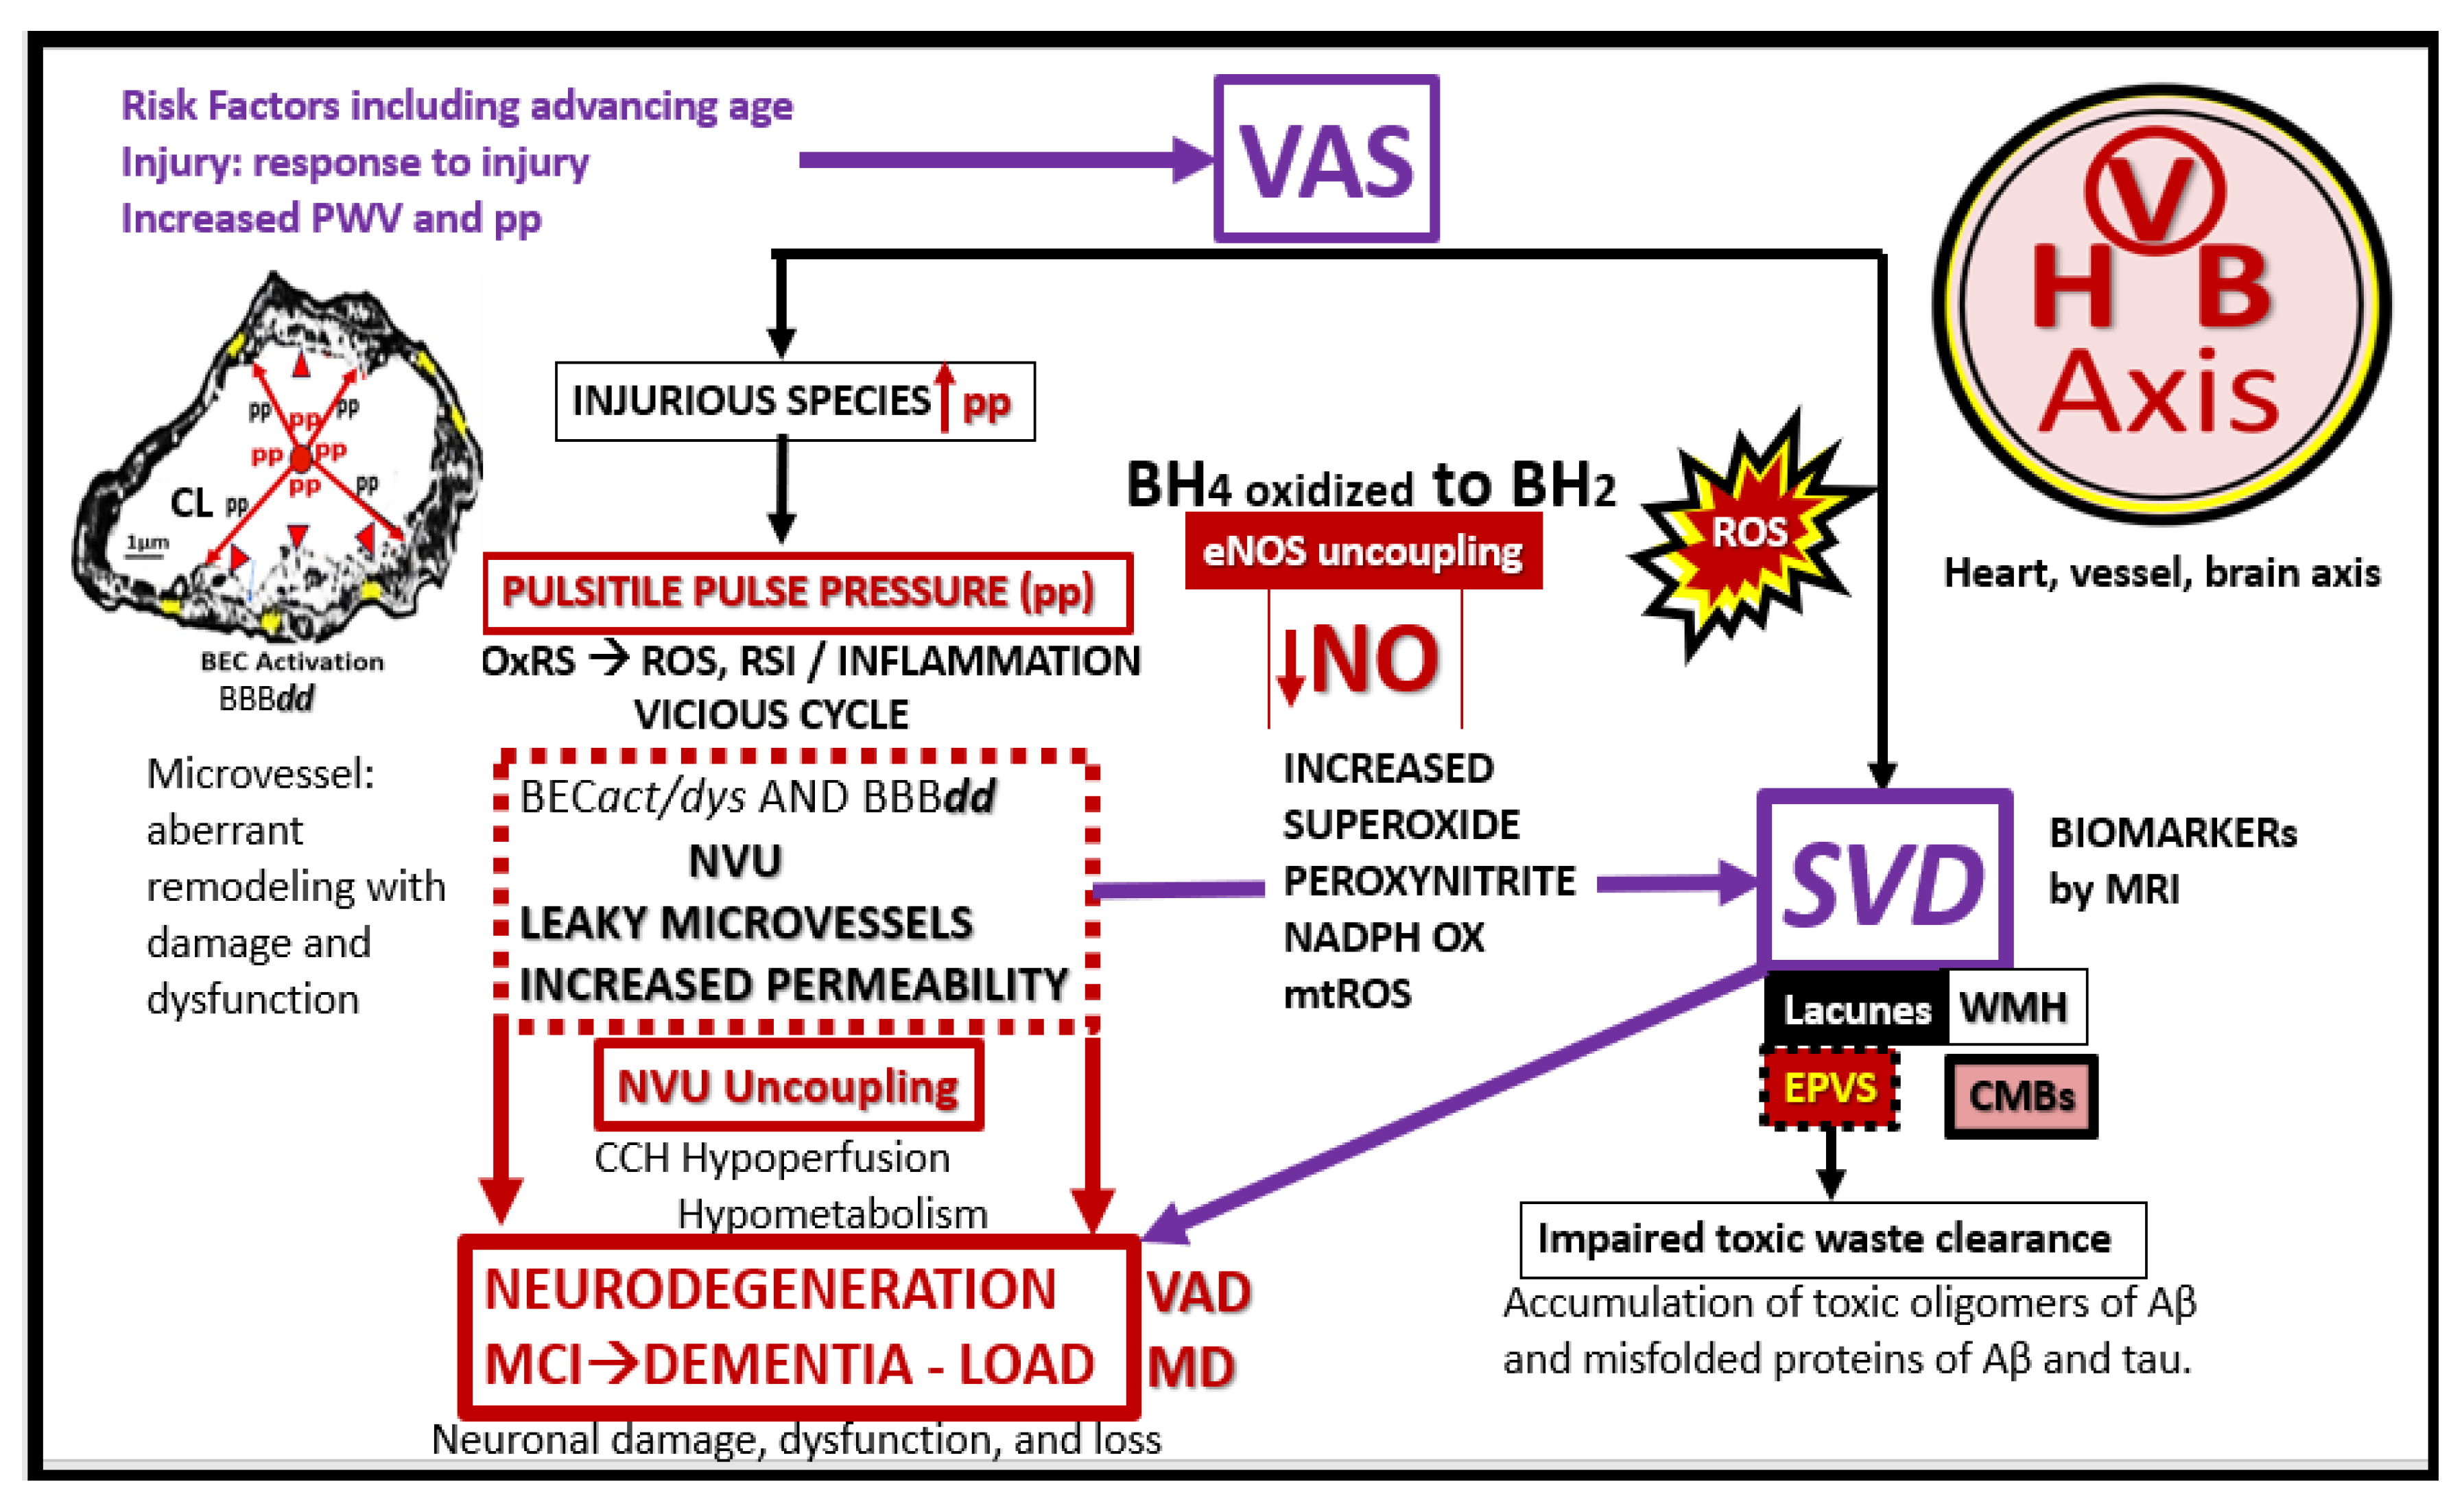
Figure 18.
An umbrella overarching approach of mixed dementias including the vascular contributions to impaired cognition and dementia (VCID). Importantly, the shared risk factors for each of these spectrum diseases (VCID, VaD and LOAD) may help to explain their shared coexistence in mixed co-occurring dementias under the umbrella. Below the umbrella spectrum diseases of mixed dementias illustration these processes are divided into early, middle, and later manifestations in the development of dementias as follows: Early remodeling neurovascular remodeling hypothesis (vascular remodeling changes occur prior to the deposition of amyloid beta); middle amyloid beta cascade and tau hypothesis; later hypoperfusion-hypometabolism with impaired glucose/nutrient uptake relationship to chronic cerebral hypoperfusion and hypometabolism to result in neuronal dysfunction, impaired cognition, neurodegeneration, and LOAD. Even though MCI is placed on the neurodegenerative blackened side of the spectrum, it may also occur on the left-hand side of the red spectrum. Concepts utilized in this modified illustration were provided with permission by CC 4.0 [104]. Aβ, amyloid beta; asterisks, indicate emphasis; CAA, cerebral amyloid angiopathy; CCH, chronic cerebral hypoperfusion; CMBs, cerebral microbleeds; EPVS, enlarged perivascular spaces; HTN, hypertension; IR, insulin resistance; OxRS, oxidative redox stress; ROS, reactive oxygen species; T2DM, type 2 diabetes mellitus; WMH, white matter hyperintensities.
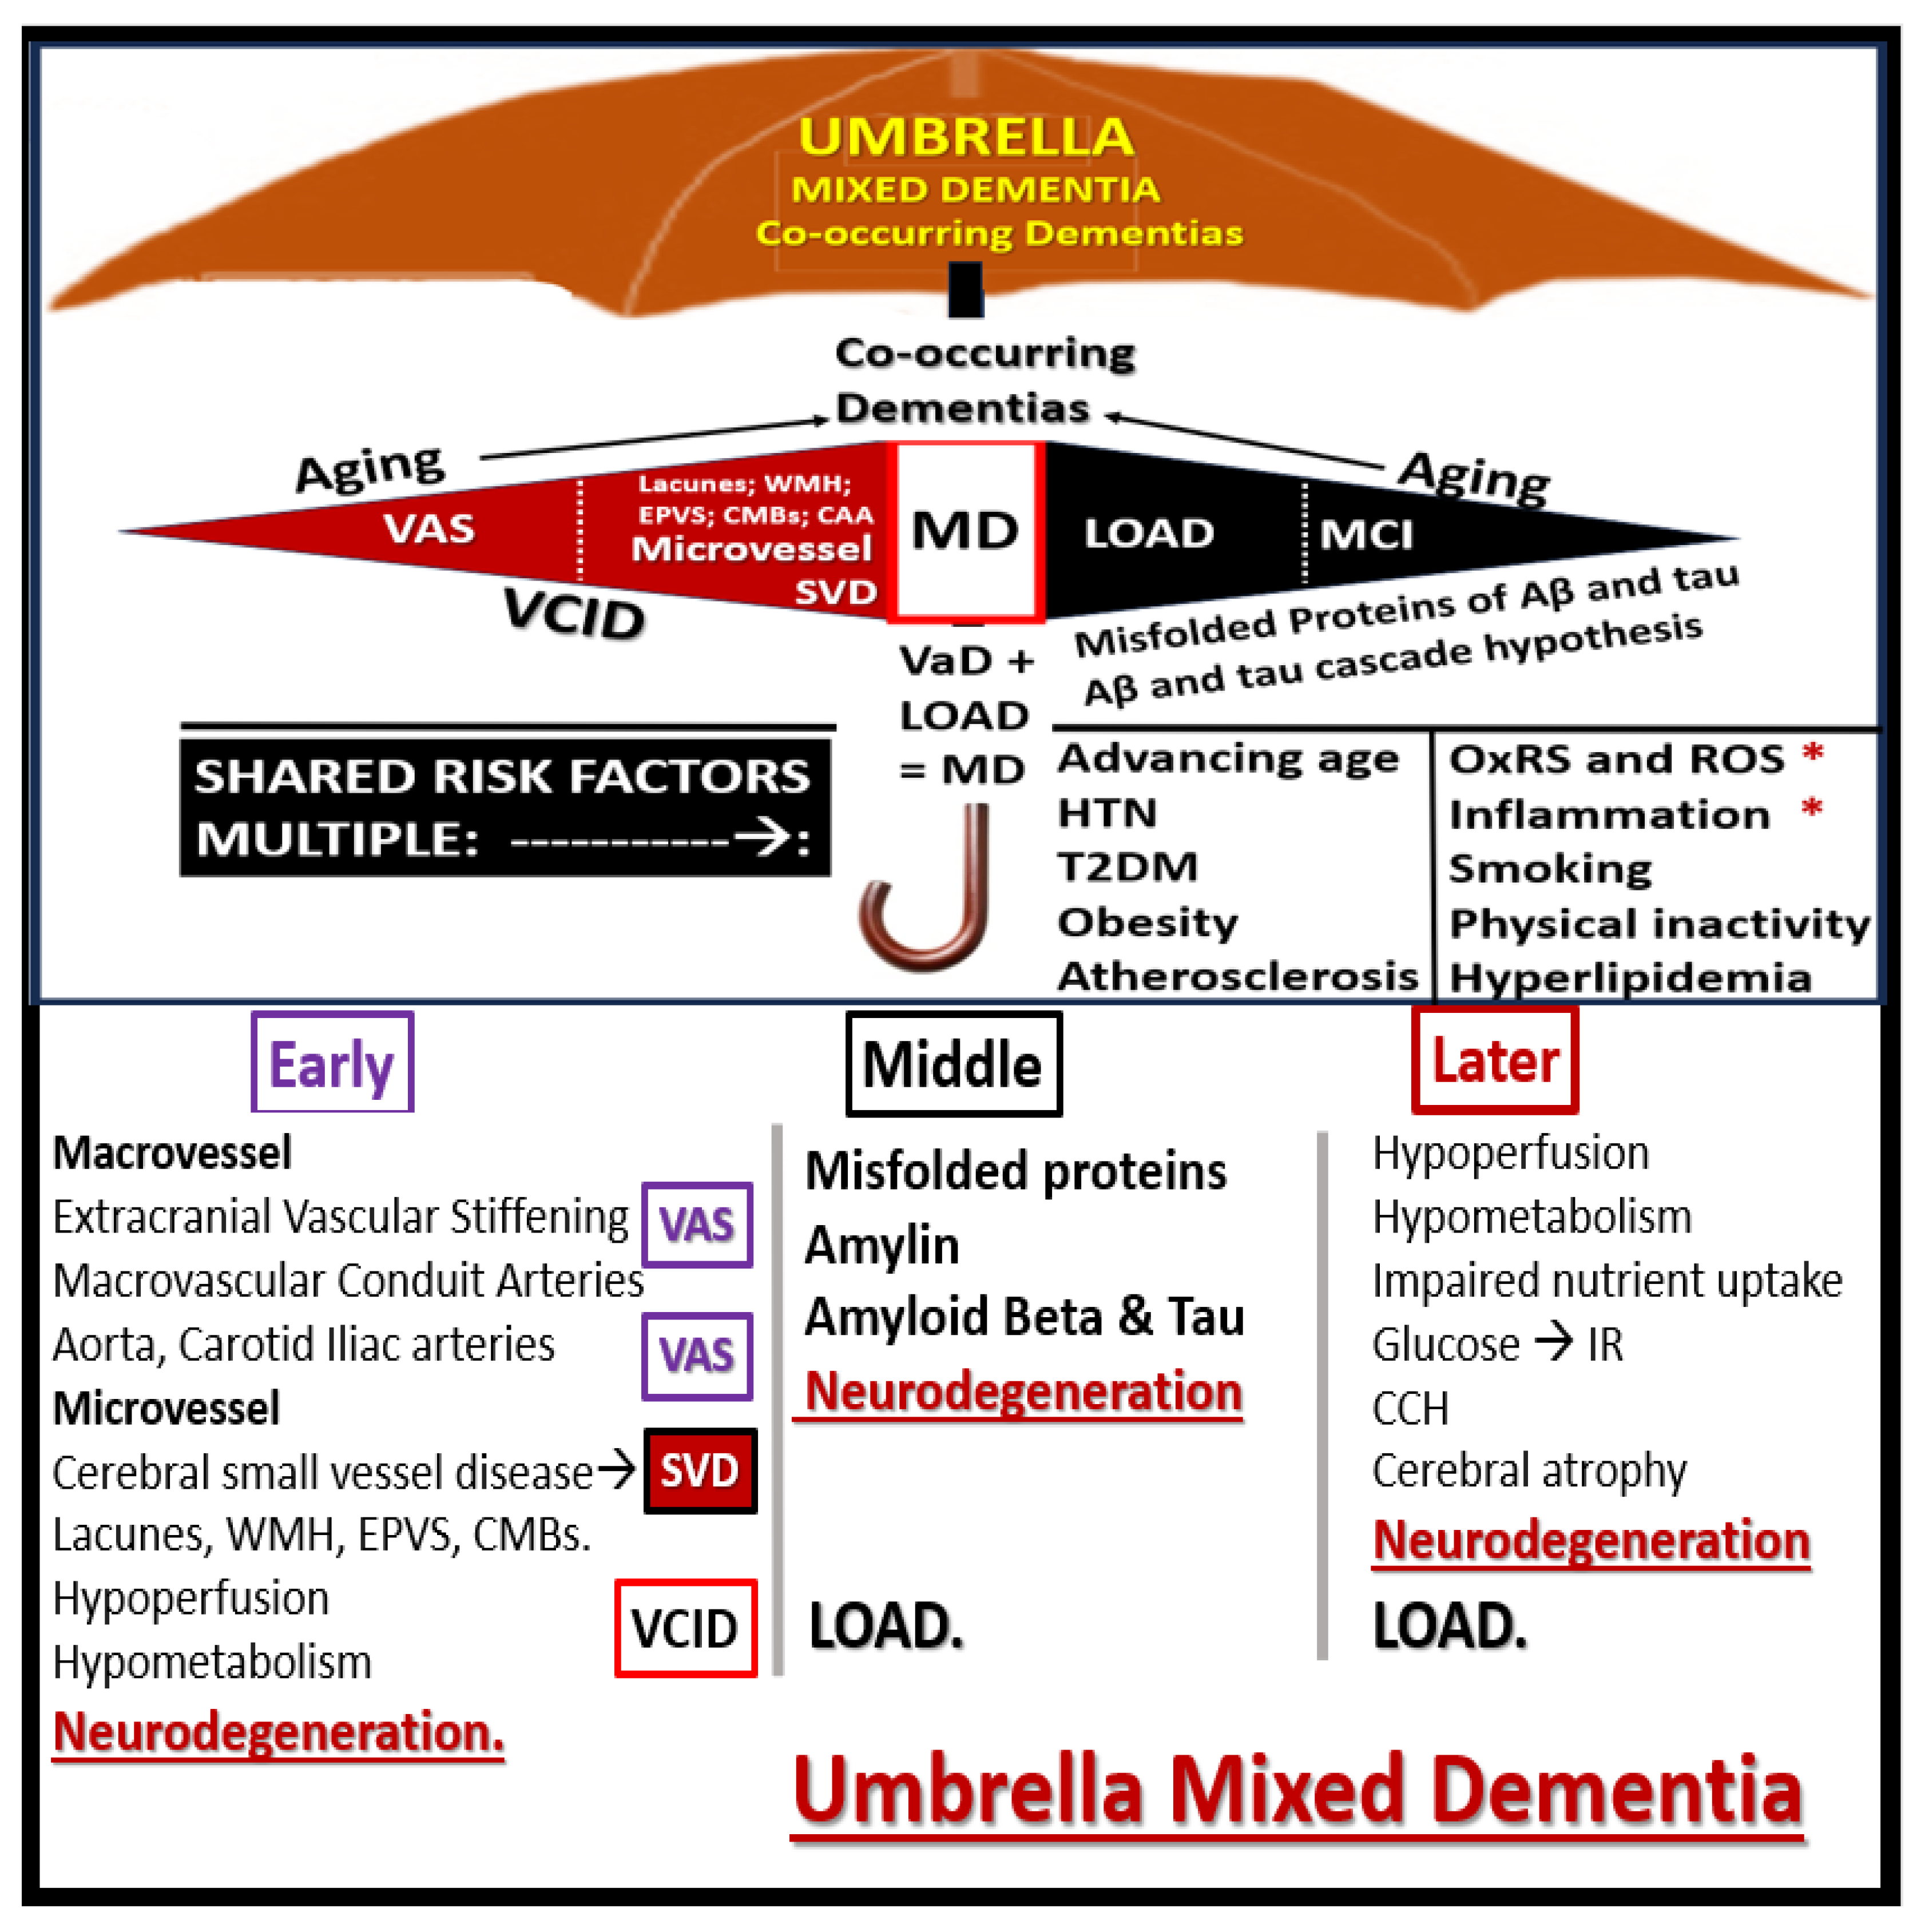
Disclaimer/Publisher’s Note: The statements, opinions and data contained in all publications are solely those of the individual author(s) and contributor(s) and not of MDPI and/or the editor(s). MDPI and/or the editor(s) disclaim responsibility for any injury to people or property resulting from any ideas, methods, instructions or products referred to in the content. |
© 2025 by the authors. Licensee MDPI, Basel, Switzerland. This article is an open access article distributed under the terms and conditions of the Creative Commons Attribution (CC BY) license (http://creativecommons.org/licenses/by/4.0/).
Copyright: This open access article is published under a Creative Commons CC BY 4.0 license, which permit the free download, distribution, and reuse, provided that the author and preprint are cited in any reuse.


