Submitted:
13 January 2025
Posted:
14 January 2025
You are already at the latest version
Abstract
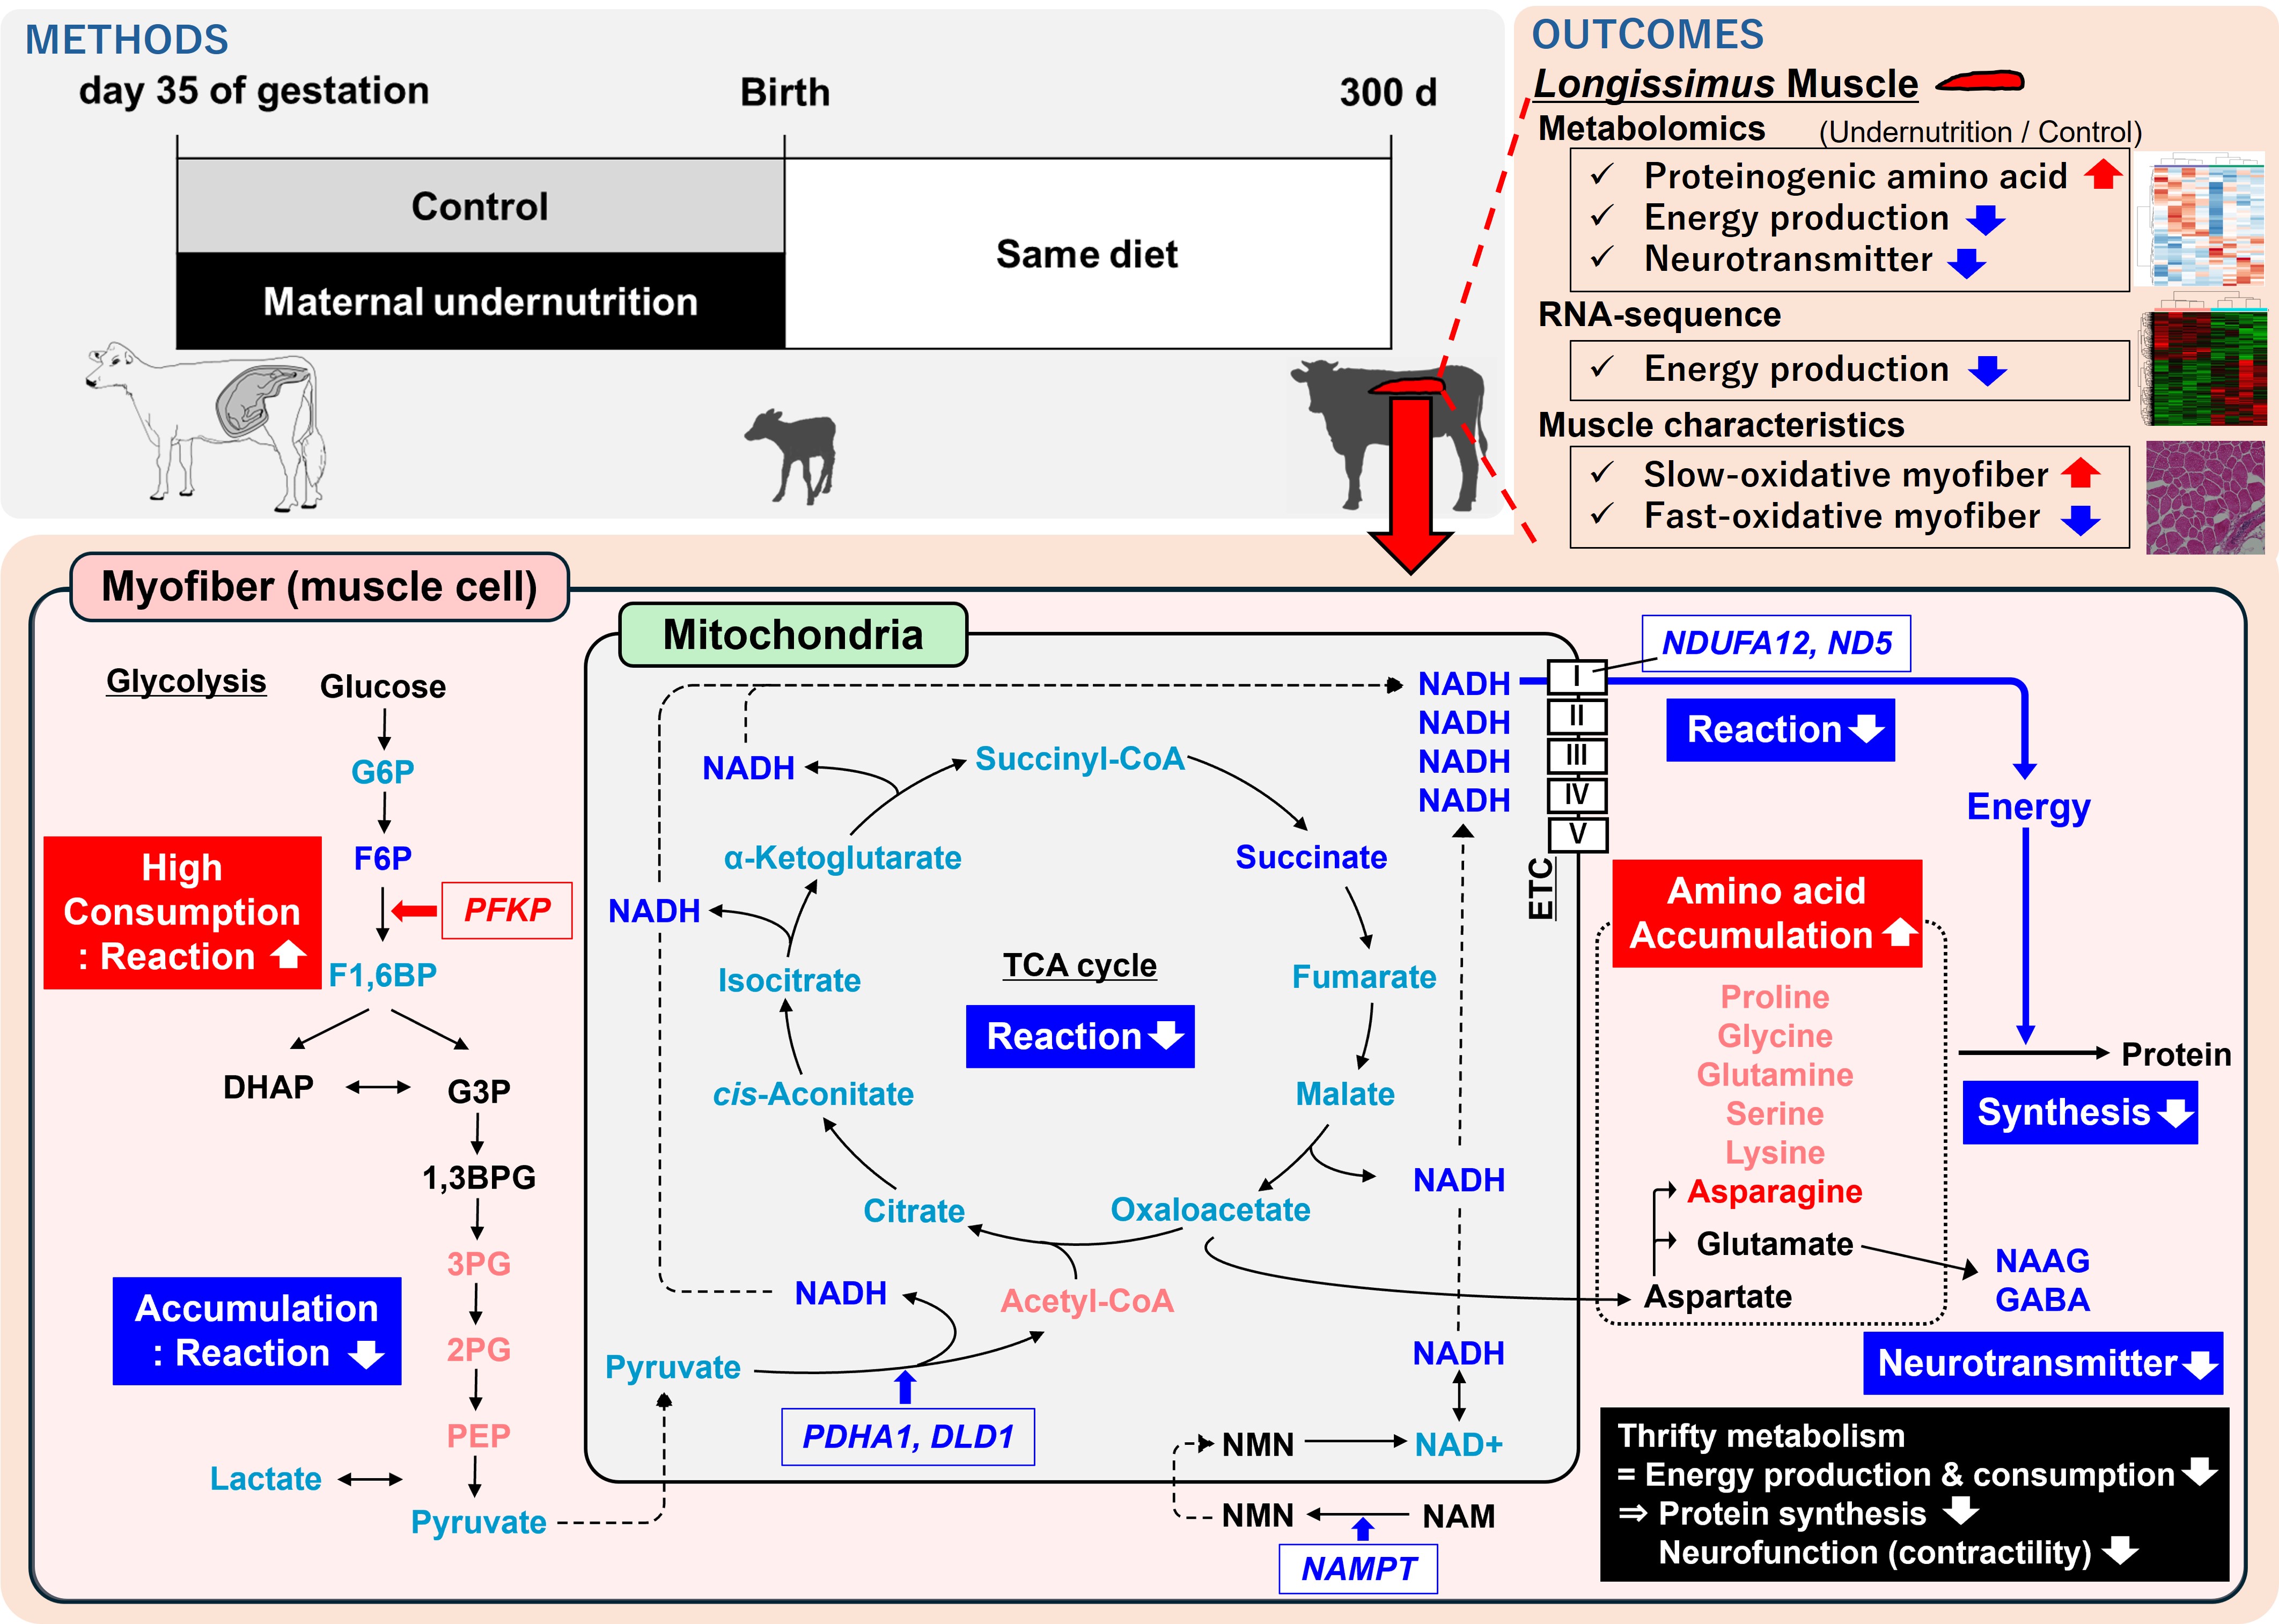
Objectives: This study investigated the long-term effects of maternal undernutrition on overall muscle metabolism, growth performance, and muscle characteristics in postnatal offspring of Wagyu (Japanese Black) cattle. Methods: Wagyu cows were divided into nutrient-adequate (control, CNT; n=4, 120% of requirements) and nutrient-restricted groups (NR; n=4; 60% of requirements), and treated from day 35 of gestation until parturition. Diets were delivered on the basis of crude protein requirements, meeting 100% and 80% of dry matter requirements in CNT and NR groups, respectively. All offspring were provided with the same diet from birth to 300 days of age (d). Longissimus thoracis muscle (LM) samples were collected from the postnatal offspring. Results: The NR offspring had lower birth body weight, but their body weight caught up before weaning. Comprehensive analyses of metabolites and transcripts revealed the accumulation of proteinogenic amino acids in NR offspring LM at 300 d, while the abundance of nicotinamide adenine dinucleotide (NADH) and succinate were reduced. These changes were accompanied by decreased gene expression of nicotinamide phosphoribosyltransferase (NAMPT), NADH: ubiquinone oxidoreductase subunit A12 (NDUFA12), and NADH dehydrogenase subunit 5 (ND5), which are essential for mitochondrial energy production. Maternal undernutrition also altered the abundance of glycolysis-related metabolites and mRNA. Additionally, NR offspring LM exhibited decreased neurotransmitter levels, along with a higher proportion of slow-oxidative myofibers and a lower proportion of fast-oxidative myofibers at 300 d. Conclusions: Offspring from nutrient-restricted cows might suppress muscle energy production, primarily in the mitochondria, and conserve energy expenditure for muscle protein synthesis, compromising neurodevelopment necessary for proper myofiber contractility. These findings suggested that maternal undernutrition programs a thrifty metabolism in offspring muscle, with long-term effects.
Keywords:
Wagyu cattle
; beef cattle
; maternal nutrition
; undernutrition
; fetal programming
; energy metabolism
; metabolomics
; omics
; skeletal muscle
; myofiber
1. Introduction
Maternal nutrition status is one of the extrinsic factors affecting the growth, development, and function of the fetal organ systems [1]. In fetal skeletal muscle, myogenesis primarily drives development, but adipogenesis and fibrogenesis are also initiated during gestation [2]. These tissues derive from a common pool of mesenchymal progenitor cells in the muscle, and the fate of these progenitor cells is decided during the fetal stage [2]. Thus, nutrition during the fetal stage is a critical factor in determining postnatal growth potential and meat characteristics. Greenwood et al. reported that severe maternal nutrient restriction reduces postnatal growth [3]. Webb et al. also found that protein restriction during gestation altered fatty acid composition and total lipid amount in adult offspring muscle [4]. These differences are attributed to the nutritional environment during the fetal stage; however, the mechanism responsible for maintaining these long-term effects remains unclear.
Muscle metabolism influences meat production because muscle growth is a result of protein accretion, which is achieved through complex biological processes including anabolic and catabolic events [5]. In cattle muscle, metabolic and contractile maturations occur during the late fetal stage, while primary and secondary myofibers are formed during the early to mid-fetal stage [6]. We previously found that, when the nutrition of Wagyu (Japanese Black) cows was severely restricted throughout the entire gestation period, fetal growth was retarded [7] and fetal muscle metabolism was disrupted at 260 days of gestation [8]. Although many studies have reported that maternal undernutrition impacts the muscle metabolism of ruminant fetuses [9,10,11], few have addressed the long-term effect of maternal nutrient restriction throughout the entire gestation period on the muscle metabolic profile in the offspring of beef cattle postnatally [12].
Conversely, studies using animal models have shown that the skeletal muscle of postnatal offspring from undernourished dams exhibits metabolic alterations, such as reduced mitochondrial energetics, decreased insulin-stimulated glucose uptake, and increased lipid accumulation, resulting in a higher risk of metabolic disease [13,14]. These alterations are considered to result from fetal adaptation through physiological metabolic changes to survive under limited in utero nutrient conditions, thereby programming a thrifty metabolism over the long term [15]. These biological systems might also develop in the skeletal muscle of bovine offspring. Therefore, we hypothesized that maternal undernutrition programs the muscle metabolism of offspring during the fetal stage, which is maintained over the long term and affects the development, functionality, and morphological characteristics of skeletal muscle in postnatal offspring.
The objectives of this study were to determine the long-term effects of maternal nutrient restriction during gestation on overall muscle metabolism, postnatal growth performance, and muscle characteristics in postnatal offspring of Wagyu (Japanese Black) cattle. Specifically, using metabolomics and RNA sequencing, we identified differentially expressed metabolites and transcripts in the longissimus thoracis muscle (LM) of postnatal offspring from Wagyu cows provided with either a control diet or restricted nutrition. This integrative approach revealed that maternal undernutrition changed the fundamental muscle metabolism and functionality of postnatal offspring.
2. Materials and Methods
2.1. Animals and Experimental Design
The experimental protocols and procedures were reviewed and approved by the Animal Care and Use Committee of Kagoshima University (approval number: A22009). Nutrient requirements, such as crude protein (CP), total digestible nutrients (TDN), and dry matter (DM), were calculated on the basis of animal BW, in accordance with the Japanese Feeding Standards for Beef Cattle (JFSBC) [16]. Eight multiparous Wagyu (Japanese Black) cows (Kagoshima Prefectural Institute for Agricultural Development, Kirishima, Japan) were fertilized with female-sexed sorted semen of the same sire (Chiehisa bull; National Livestock Breeding Center, Nishishirakawa-gun, Japan). After confirming the pregnancy by ultrasonography at day 35 of gestation, cows were randomly assigned into a nutrient-adequate group (control, CNT; n = 4; 120% of JFSBC requirements) or a nutrient-restricted group (NR; n = 4; 60% of JFSBC requirements), and the treatments were continued until parturition (Figure 1). Diets were delivered on the basis of the CP requirements, meeting 100% and 80% of DM requirements in the CNT and NR groups, respectively. Experimental diets consisted of concentrate-based mixed feed (15.3% CP, 69.8% TDN, and 87.6% DM) with wheat straw (3.6% CP, 38.0% TDN, and 85.8% DM) to adjust DM levels, and the diet amount was calculated on the basis of BW. Cows were kept in a drylot, and each cow was fed individually using stanchions to lock in each animal until they completely consumed their feed in the morning (08:30) and afternoon (15:30). The offspring calves were provided with colostrum and kept with their mother until 3 days of age (d). After 4 d, all calves were subjected to the same nutritional conditions in a paddock. The calves were provided milk replacer (28.0% CP, 108.0% TDN; Calftop EX Black [Zenrakuren, Tokyo, Japan]) from 4 to 62 d, total mixed ration (TMR) containing hay and dry calf starter (16.8% CP, 72.4% TDN) from 4 to 120 d, and then TMR consisting of hay and concentrate (17.1% CP, 66.2% TDN) from 121 to 300 d. The calves were kept in a drylot and each of them was fed individually using stanchions to lock in each animal in the morning (08:30) and afternoon (15:30). The nutrient intake is shown in Table 1. The calves were weighed at 0, 30, 60, 120, 180, 240, and 300 d (Table 1). All of the cattle were allowed ad libitum access to water and mineralized salt (Cowstone A; Nippon Zenyaku Kogyo, Koriyama, Japan) during the experiment.
2.2. Longissimus Thoracis Muscle Sampling
Samples of LM, located at the 12th to 13th thoracic vertebrae, were collected at 75, 180, and 300 d through needle biopsies for histological and transcriptomic analyses. The incision site for needle biopsies was shaved and cleaned with 70% ethanol and diluted povidone-iodine solution. After the administration of a hemostatic agent (5% tranexamic acid; Fujita Pharmaceutical Co., Ltd., Tokyo, Japan), general anesthetic (2% xylazine; Bayer AG, Leverkusen, Germany), and local anesthetic (2% lidocaine hydrochloride; Sandoz Group AG, Basel, Switzerland), the skin was incised, and 2.0-mm-wide and 8-cm-long LM samples were collected using 15.0 cm sterilized biopsy needles (Merit Medical Systems Inc., South Jordan, UT). Biopsies for histochemical analysis were covered with tissue embedding medium (Tissue-Tek O.C.T. Compound; Sakura Finetechnical, Tokyo, Japan). All biopsies were immediately frozen in liquid nitrogen and stored at −80°C until analyses of metabolites, transcripts, and histochemical properties.
2.3. Metabolomics and Pathway Analysis
Metabolomic analysis was conducted by capillary electrophoresis time-of-flight mass spectrometry (CE-TOFMS), in accordance with the Dual Scan package (Human Metabolome Technologies Inc. [HMT], Tsuruoka, Japan). The methods of Phomvisith et al. [17] were followed with modifications. Briefly, approximately 30–40 mg of LM was mixed with 1,500 µL of 50% acetonitrile/Milli-Q water containing 2 µM internal standards (H3304-1002; HMT) and homogenized with zirconia beads (5 mmφ and 3 mmφ) four times at 3,500 rpm and 4°C for 60 s. After centrifugation at 2,300×g and 4°C for 5 min, the upper-layer solution was filtered through a Millipore 5-kDa cut-off filter with centrifugation at 9,100×g and 4°C for 120 min. The filtrate was lyophilized, reconstituted in Milli-Q water, and analyzed by CE-TOFMS. The spectrometer range was from mass-to-charge ratios (m/z) of 60 to 900 and 70 to 1,050 for cationic and anionic metabolites, respectively. Peak information, including m/z, peak area, and migration time, was scanned by MasterHands ver.2.19.0.2, automatic integration software (Keio University, Tsuruoka, Japan). Signal peaks were annotated to HMT’s metabolite database based on their m/z value and migration time and normalized to internal standards.
MetaboAnalyst (https://www.metaboanalyst.ca/home.xhtml) was used for the enrichment pathway analysis of differentially expressed metabolites, based on the Kyoto Encyclopedia of Genes and Genomes Database (KEGG).
2.4. RNA Sequencing and Pathway Analysis
Approximately 100 mg of LM was homogenized in TRIzol reagent (Invitrogen, Carlsbad, CA) and total RNA was extracted in accordance with the manufacturer’s manual (Nippon Gene, Tokyo, Japan) and purified using RNeasy MinElute Cleanup (Qiagen, Hilden, Germany). Total RNA concentration and quality [absorbance (A) ratio at 260 and 280 nm] were quantified using a NanoDrop ND-1000 spectrophotometer (Thermo Fisher Scientific Inc., Waltham, MA). All extractions yielded RNA with an A260:A280 nm ratio greater than 1.9. Messenger RNA (mRNA) was purified from total RNA using poly-T oligo-attached magnetic beads. In accordance with the manufacturer’s manual, synthesized cDNA was paired-end sequenced with NEBNext® Ultra™ II Directional RNA Library Prep Kit (New England Biolabs, Ipswich, MA) using Illumina Platforms (Illumina, San Diego, CA), generating paired-end reads (150 bp in length). The dataset we analyzed has been deposited in the DNA Data Bank of Japan (accession numbers: xxxxxx).
Fastp v.0.23.1. [18] was used to check the quality of the sequencing data and filter the sequenced reads. Reads with adaptor sequences, uncertain nucleotides (> 10% of either read), and low-quality nucleotides (base quality less than 5, > 50% of either read) were removed. The obtained reads were mapped to the bovine reference genome (ncbi_bos_taurus_gcf_002263795_3_ars_ucd2_0) with HISAT2 v.2.0.5 [19] and genes were assembled with StringTie v.1.3.3b [20]. After assembly, transcript abundance was quantified using read counts and normalized as fragments per kilobase of transcript per million mapped reads (FPKM) for each sample. Differential gene expression analysis was performed with DESeq2 [21]. The KEGG pathways enriched with differentially expressed genes (DEG) were estimated by DAVID 2021 (https://david.ncifcrf.gov/) [22].
2.5. Muscle and Adipocyte Histochemical Properties, and Myofiber Type Composition
Serial and transverse cryosections of LM (8 µm thick) were collected and stained on the basis of their acid-preincubated (pH 4.3) myosin ATPase and reduced nicotinamide adenine dinucleotide dehydrogenase (NADH-DH) activities. Myofiber type was classified as type I, IIA, or IIX, in accordance with the nomenclature of Brooke & Kaiser [23,24], by image analysis using photographs of stained specimens taken with a Biorevo bz-9000 (Keyence, Osaka, Japan) at 100× magnification. Type I myofibers strongly reacted with myosin ATPase after acid preincubation (pH 4.3) and were stained with NADH-DH. Type IIA and IIX myofibers had weak myosin ATPase activity after acid preincubation. Type IIA myofibers reacted with NADH-DH, while type IIX ones did not. Sub-regional myofiber type composition and diameters were assessed on the basis of an average of 300 myofibers. Myofiber diameters were measured as the largest width perpendicular to the myofiber’s long axis. Myofiber type area percentages were estimated using the following equation: (mean of myofiber diameter × 0.5)2 × π × (myofiber composition ratio).
Serial and transverse cryosections of LM (8 μm thick) were collected and stained with Oil Red O (FUJIFILM Wako Pure Chemical Corp., Osaka, Japan), which reacted with triglyceride, to detect adipocytes. The cross-sectional area of an average of 150 stained adipocytes was analyzed by a Biorevo bz-9000 (Keyence).
2.6. Statistical Analyses
All analyses were performed using animal as the experimental unit. To test the effects of diet within the timepoint, the data of nutrient intake, growth performance, metabolites, transcripts, myofiber characteristics, and intramuscular adipocyte size were analyzed by t-test. To correct for multiple hypothesis testing, adjusted P-values were calculated for the data on enrichment analysis of the KEGG pathways (false discovery rate: FDR). Data are shown as the mean ± SEM. Differences were considered statistically significant at P ≤ 0.05, while they were considered to show tendencies at P ≤ 0.10.
3. Results
3.1. Growth Performance
No differences in the intake of CP and TDN from milk replacer and TMR were found between CNT and NR offspring from 0 to 300 d (P > 0.31; Table 1). The NR offspring had lower BW at birth and 30 d (P = 0.03); however, this difference had disappeared at 60, 120, and 180 d (P > 0.31). The NR offspring tended to have greater BW at 240 d (P = 0.08), but the treatment did not affect BW at 300 d (P = 0.29). Average daily gain (ADG) was lower in NR offspring than in CNT offspring during 0–30 d (P = 0.02). Meanwhile, there were no differences in ADG between CNT and NR offspring during 31–60 d, 61–120 d, and 241–300 d (P > 0.35); however, NR offspring had greater ADG during 121–180 d (P = 0.04) and tended to have greater ADG during 181–240 d (P = 0.08). Finally, there were no differences in the CP and TDN conversion ratio into BW gain between CNT and NR offspring during 0–120 d and 121–300 d (P > 0.15).
3.2. Metabolomics and Pathway Analysis
In total, 339 metabolite peaks were detected in offspring LM at 300 d and annotated in accordance with the HMT metabolite database (Table S1). In NR offspring LM, there were higher levels of pyroglutamine, N6,N6-dimethyllysine, 11-aminoundecanoic acid, adenosine 3′,5′-diphosphate, and asparagine than in CNT offspring LM (P < 0.05; Table 2). Conversely, NR offspring LM had lower levels of nicotinamide adenine dinucleotide (NADH), 2-deoxyribonic acid, N-acetylglucosamine 1-phosphate, myo-inositol 2-phosphate, 3-methylcytidine, and allantoic acid (P < 0.05). The NR offspring LM tended to have higher levels of taurine, methylguanidine, 2-amino-2-methyl-1-propanol, and glycerophosphorylethanolamine (P < 0.10). However, there were tendencies for NR offspring LM to have decreased levels of tyrosine methyl ester, N-acetylaspartylglutamate, fructose 6-phosphate, succinate, gamma-aminobutyric acid (GABA), and glucosaminic acid (P < 0.10).
The KEGG pathway enrichment analysis was performed using 21 metabolites that exhibited a significant difference in their abundance between the groups or a tendency for such a difference (Table 3). The pathway of alanine, aspartate, and glutamate metabolism was significantly associated with restricted maternal nutrition, which was enriched by increased asparagine and decreased succinate, N-acetylaspartylglutamate, and GABA (FDR < 0.01). No significant enrichment of other pathways was observed for the differentially expressed metabolites. However, amino acid metabolism and energy metabolism-related pathways, including, glycolysis and the tricarboxylic acid (TCA) cycle, were among the top pathways identified. To further understand the trend of metabolic flux, the energy metabolism-related metabolites that substantially differed in abundance (|abundance difference| ≥ 20%) between CNT and NR offspring LM at 300 d are listed in Table S2, regardless of statistical significance.
3.3. Transcriptomics and Pathway Analysis
Comprehensive transcriptomics using RNA sequencing analysis revealed 364 upregulated and 263 downregulated DEG in NR offspring LM at 300 d compared with the levels in CNT offspring LM (P < 0.05). To identify the networks influenced by the nutrient treatment, KEGG pathway enrichment analyses were performed separately for upregulated and downregulated DEG. The enriched KEGG pathways, identified DEG, and gene expression levels of the DEG are presented in Tables 4, S3, and S4, respectively. Genes related to the cytoskeleton in muscle cells were enriched among the upregulated DEG (FDR < 0.01, raw P < 0.01), including collagen type I alpha 1 chain (COL1A1), collagen type VI alpha 1 chain (COL6A1), collagen type VI alpha 2 chain (COL6A2), and integrin subunit alpha 11 (ITGA11). Rbosomal-related genes tended to be enriched (FDR = 0.08, raw P < 0.01). There were no pathways significantly associated with downregulated DEG; however, metabolic pathways were most enriched with the downregulated DEG, including NADH:ubiquinone oxidoreductase subunit A12 (NDUFA12), NADH dehydrogenase subunit 5 (ND5), nicotinamide phosphoribosyltransferase (NAMPT), pyruvate dehydrogenase E1 subunit alpha 1 (PDHA1), and dihydrolipoamide dehydrogenase (DLD) (FDR = 1.00, raw P = 0.02). Energy metabolism pathways, such as insulin resistance, glycolysis/gluconeogenesis, adenosine monophosphate-activated protein kinase (AMPK) signaling pathway, fructose and mannose metabolism, tryptophan metabolism, and glucagon signaling pathway, were among the top pathways identified (FDR = 1.00, raw P < 0.09). Furthermore, KEGG pathway enrichment analysis was performed for the DEG set, including both upregulated and downregulated ones. Genes related to the cytoskeleton in muscle cells were enriched in the DEG set (FDR = 0.03), while no significant enrichment of other pathways was identified. However, energy metabolism-related pathways, including glycolysis/gluconeogenesis, AMPK signaling pathway, and fructose and mannose metabolism, were among the top pathways identified (FDR = 1.00, raw P < 0.06). Among glycolysis/gluconeogenesis-related genes, the expression of the phosphofructokinase-platelet (PFKP) gene was increased in NR offspring LM, whereas the gene expression of PDHA1, DLD, glucose-6-phosphatase catalytic subunit 1 (G6PC1), fructose-bisphosphate aldolase B (ALDOB), and aldehyde dehydrogenase 3 family member B1 (ALDH3B1) was decreased (P < 0.04).
3.4. Muscle and Adipocyte Histochemical Properties
There were no differences in all myofiber type diameters between CNT and NR offspring LM at 300 d (P > 0.32), or in myofiber type compositions at 75 and 180 d (P > 0.31; Table 5). At 300 d, there was no difference in type IIX myofiber percentage (P = 0.62); however, NR offspring LM had a lower percentage of type IIA myofibers (P = 0.02) and tended to have a higher percentage of type I myofibers (P = 0.07) than CNT offspring LM. Nutrition had no effect on adipocyte cross-sectional area (P = 0.35). There were no differences in the estimated area percentages of type IIA and type IIX myofibers at 300 d (P > 0.45); however, NR offspring LM had a greater area percentage of type I myofibers than CNT offspring LM (P = 0.04; Table S5).
4. Discussion
Sustainable and efficient beef production is required to meet the global demand for a nutritious source of protein for the human diet. Studies have reported that maternal undernutrition during gestation impairs offspring growth and productivity [3,4,7]; however, the mechanisms behind the long-term effects remain poorly studied. In the current study, we evaluated the long-term effects of maternal nutrient restriction during gestation on overall skeletal muscle metabolism and morphological characteristics in the skeletal muscle of postnatal offspring. We found that, in the LM of offspring from nutrient-restricted cows, proteinogenic amino acids accumulated and TCA cycle-related metabolites decreased. Metabolites in the initial stage of glycolysis decreased due to maternal undernutrition, while those in the later stage of glycolysis accumulated. Maternal nutrient restriction reduced the abundance of N-acetylaspartylglutamate and GABA in offspring LM. Additionally, NR offspring LM had a greater proportion of type Ⅰ myofibers and a lower proportion of type IIA ones (Figure 2).
Almost 75% of ruminant fetal growth occurs during the last 2 months of gestation, but primary and secondary myofibers are formed during early to mid-gestation [25,26]. Because there is no net increase in the number of myofibers after birth [26], adequate nutrition throughout gestation is important for beef productivity. In the current study, prolonged maternal nutrient restriction decreased offspring birth BW by 10.2%; however, the reduction in BW of NR offspring was no longer observed after pre-weaning. The NR offspring grew with greater ADG during the post-weaning growth period, resulting in greater BW at 240 d; however, there was no difference in BW at 300 d. The values of the TDN and CP requirements per unit of BW gain were substantially lower in NR offspring, but this did not reach significance. Greenwood et al. reported that severe maternal nutrient restriction reduced offspring birth BW, but also described that the cattle growth that was retarded during the fetal stage (with 10.2 kg or 26% lower birth BW) did not catch up with that of well-nourished counterparts at any postnatal age [3]. In the current study, the offspring were provided a concentrate-based diet from pre-weaning to 300 d, whereas in the study of Greenwood et al., cattle were raised with a roughage-based diet from pre-weaning until feedlot entry. Differences in the postnatal environment and ADG could be the reason for the inconsistent findings. Meanwhile, Freetly et al. found that maternal undernutrition during the last two gestations reduced the birth BW of offspring calves; however, the difference was recovered by 2 months, similar to the findings in the current study [27]. Other studies reported that the offspring from undernourished cows could catch up in terms of BW to a level equivalent to that of the controls during the growing period, but maternal nutrient restriction altered the carcass composition. In particular, the carcasses of offspring undernourished in utero had more fat and less lean meat [4,28,29]. Overall, studies suggest that the long-term effects of maternal nutritional restriction on offspring may not be apparent in phenotypic traits such as BW; however, there may be internal changes in muscle metabolism and development.
According to Bonnet et al., primary and secondary myofibers are generated during the first two trimesters of gestation, and metabolic and contractile maturations occur during the last trimester in bovine fetuses [6]. In the current study, despite all offspring being raised in the same environment for 300 days after birth, 21 differentially expressed metabolites were identified. Pathway analysis showed the enrichment of genes related to metabolic networks, such as metabolic process, insulin resistance, glycolysis/gluconeogenesis, AMPK signaling, and fructose and mannose metabolism, among the DEG downregulated in NR offspring LM. These results suggest that muscle energy metabolism in the offspring was influenced by maternal nutrient restriction over the long term. Maternal undernutrition altered the abundance of the metabolites related to alanine, aspartate, and glutamate metabolism. Specifically, asparagine was increased in NR offspring LM, while succinate, N-acetylaspartylglutamate, and GABA were decreased. Among energy metabolism, this pathway is important for the malate–aspartate shuttle, where aspartate and glutamate play a crucial role in the indirect transfer of NADH from the cytosol into the mitochondrial matrix for oxidation at the mitochondrial electron transport chain (ETC) [30]. Meanwhile, when protein is limited and its biosynthesis is required, aspartate is converted to asparagine by asparagine synthetase [31]. Asparagine is an important proteinogenic amino acid and also promotes protein synthesis through activation of the mammalian target of rapamycin complex 1 (mTORC1) [32]. In the current study, the asparagine level was elevated by 41.1% in NR offspring LM. There were no statistically significant differences in the levels of other amino acids; however, proteinogenic amino acids, including proline, glycine, glutamine, serine, and lysine, were substantially accumulated in NR offspring LM (fold change [FC, NR value vs. CNT value] > 1.22; Table S2). The anabolic process of proteinogenic amino acids for protein synthesis requires chemical energy, adenosine triphosphate (ATP), mainly produced through the TCA cycle, ETC oxidation, and glycolysis in muscle [5].
NADH, a crucial reducing equivalent, plays essential roles in mitochondrial metabolism. It is primarily produced by the TCA cycle in mitochondria and subsequently oxidized in the ETC, generating ATP [5]. In NR offspring LM, the abundance of NADH was reduced by 77.8%, accompanied by the 39.5% decrease in the level of succinate, an intermediate in the TCA cycle. Other TCA cycle intermediates, including citrate, cis-aconitate, isocitrate, α-ketoglutarate, fumarate, malate, and NAD+ were also substantially decreased in NR offspring LM (FC < 0.80; Table S2). This indicates a suppression of mitochondrial energy production in NR offspring LM, as evidenced by the reduced expression of genes associated with mitochondrial function. Specifically, the gene expression of NDUFA12 and ND5, which encode key subunits of ETC complex Ⅰ responsible for the oxidation of NADH [33], as well as NAMPT, which encodes rate-limiting enzyme mediating NAD+ generation [34], was decreased in NR offspring LM. Furthermore, NADH is also generated in mitochondria during the conversion of pyruvate to acetyl-CoA; however, maternal undernutrition decreased the gene expression of PDHA1 and DLD, which encode subunits of the pyruvate dehydrogenase complex responsible for this process [35]. These findings suggest that maternal undernutrition might suppress chemical energy production in muscle, primarily by impairing mitochondrial functions such as TCA cycle and ETC oxidation. Although not as pronounced as the impacts on the mitochondrial function, maternal undernutrition altered glycolysis metabolism. In the current study, the abundance of fructose 6-phosphate was decreased by 37.4% in NR offspring LM, along with the increase in PFKP gene expression, which catalyzes the rate-limiting reaction in glycolysis of converting fructose 6-phosphate to fructose 1,6-diphosphate [36,37]. The NR offspring LM also had substantially low levels of other intermediates in the initial process of glycolysis, including glucose 6-phosphate and fructose 1,6-diphosphate (FC < 0.80), but high levels of metabolites in the later stage of glycolysis, including 3-phosphoglycerate, 2-phosphoglycerate, and phosphoenolpyruvate (FC > 2.02; Table S2). These results suggest that the initial stage of glycolysis was accelerated in NR offspring LM, but the activity of its later part was inhibited. Overall, maternal undernutrition would reduce energy production in offspring skeletal muscle.
These alterations of energy metabolism in postnatal offspring were consistent with studies investigating the effect of maternal undernutrition on fetal skeletal muscle. Muroya et al. reported that maternal undernutrition increased the abundance of proteinogenic amino acids, such as glutamine and proline, in bovine fetal LM, accompanied by downregulation of the mRNA expression of genes related to protein synthesis activation [8]. Zhu et al. also demonstrated that maternal nutrient restriction reduced the phosphorylation of mTOR and ribosomal protein, but did not affect calpastatin and ubiquitylated protein content in ovine fetal LM [38]. In addition, Pendleton et al. found that intrauterine growth restriction decreased mitochondrial oxygen consumption and ETC activity in the skeletal muscle of sheep fetuses [39], which was consistent with the findings in a study by Zhao et al. [40]. These studies suggest that maternal nutrient restriction contributes more to the inhibition of protein accretion than to the degradation of existing protein in fetal muscle, suppressing energy production and consumption in muscle mitochondria. Although Fernandes et al. reported that protein supplementation during gestation altered the abundance of metabolites related to lipid and amino acid metabolism in offspring cattle LM at 22 months [41], few studies have investigated the impact of maternal undernutrition on the energy metabolism of postnatal offspring muscle in farm animals [12]. Studies based on human and animal models have reported that, when in utero nutrition is limited, the fetus adapts to that environment through physiological change to survive. This adaptation results in offspring with a thrifty metabolism over the long term, characterized by an increased capacity to store energy fuels rather than burn them [15]. In particular, Beauchamp et al. found that maternal nutrient restriction decreased mitochondrial energetics, including respiration ability per mitochondrion, in the muscle of adult offspring mice, accompanied by reduced mitochondrial content and altered muscle characteristics [13]. These studies suggest that maternal undernutrition disrupts metabolism and impairs myofiber development and maturation in offspring LM. In the current study, NR offspring might have adapted to severe maternal nutrient restriction through physiological changes that conserve energy expenditure for protein synthesis in muscle. Reduced mitochondrial energy production and the accumulation of proteinogenic amino acids might be due to the development of a thrifty phenotype originating at the fetal stage.
N-Acetylaspartylglutamate and GABA are responsible for synapse transmission and well-known markers for neuronal density and viability [42]. Although these metabolites are primarily present in neurons, they are also present and synthesized in nerve terminals [42]. Neural transmission in nerve terminals is important for muscle function because skeletal muscle contractions are neurogenic and are initiated by nerve impulses at the neuromuscular junction [43]. Vliet et al. found that a decrease in the abundance of N-acetylaspartylglutamate is a potential metabolic biomarker of abnormal neurodevelopment related to intrauterine growth restriction [44]. Peerboom & Wierenga reported that GABA is required for neuronal development and function because it is necessary for the migration and proliferation of neuronal precursors, synapse maturation, and neuronal activity and sensitivity [45]. In the current study, maternal undernutrition decreased the abundance of N-acetylaspartylglutamate and GABA by 44.7% and 27.6%, respectively. Additionally, they are synthesized from glutamate [42], as demonstrated by the pathway enrichment analysis. The lack of N-acetylaspartylglutamate and GABA might be due to the alteration of energy metabolism, as stated above, thereby altering neurodevelopment and its function. Therefore, these changes may affect the myofiber contractile functionality.
Skeletal muscles are composed of various myofiber types, classified by their metabolism and contractile properties [46]. Type Ⅰ myofibers utilize oxidative metabolism for ATP production with higher mitochondrial activity and contract slowly. Meanwhile, type IIX myofibers generate ATP predominantly through glycolysis and are characterized by fast contraction, while type IIA myofibers are oxidative-glycolytic and also exhibit fast contraction. The myofibers’ distribution and functionality are influenced by substrate availability and their fundamental metabolic and contractile abilities. Maternal nutrient restriction influences muscle development and characteristics of postnatal cattle because, in ruminant animals, the total number of myofibers is set by the end of the second trimester of gestation, and muscle growth during the last trimester and postnatally is achieved by myofiber hypertrophy [47,48,49]. Although maternal nutrition during late gestation differed between the groups in the current study, there were no differences in all-type myofiber diameters at 300 d. This suggests that the postnatal diet and environment, rather than prenatal nutrition, may have a sufficient impact on myofiber hypertrophy. Fahey et al. found that nutrient deficiency during early to mid-gestation increased and reduced slow- and fast-twitch myofibers, respectively, in newborn lamb LM [50]. However, offspring born to nutrient-restricted dams had lower fast oxidative and higher fast glycolytic myofiber percentages at 8 months [51]. Studies investigating the LM of matured adult offspring reported that maternal undernutrition during early [52] and mid-gestation [49] did not affect myofiber type composition, consistent with a study by Greenwood & Café, where maternal undernutrition throughout the entire gestation period did not alter myofiber area percentages in offspring LM at 30 months [53]. Other studies targeting late gestation reported that maternal nutrient restriction did not affect myofiber type percentages in the muscle of newborn lambs [54] or 5-month-old offspring [55]. In the current study, maternal nutrient restriction did not alter myofiber composition at 75 and 180 d; however, at 300 d, NR offspring LM exhibited more type Ⅰ and less IIA myofibers, along with an increased relative area of type Ⅰ myofibers. The differences among these studies may be attributable to the severity of restriction, timing and duration of treatment, and muscle development and age of offspring. Matarneh et al. reported that postural muscles require myofibers characterized by greater energy efficiency, slower contraction kinetics, and higher fatigue resistance [46]. The increase in the percentage of type I myofibers in NR offspring LM at 300 d might be necessary to support heavier BW as they grow. This may indicate an alteration in myofiber functionality, as indicated by the metabolomic analysis.
In addition to myofiber formation, the development of adipose and connective tissue is initiated during the prenatal period. In the current study, maternal nutrient restriction did not affect adipocyte size; however, the expression of cytoskeleton-related genes, including collagen and integrin, was increased in NR offspring LM. Adipogenesis and fibrogenesis are competitive processes with each other because these cellular lineages originate from common fibro-adipogenic progenitor cells, known as mesenchymal stem cells [56]. Because adipose tissue has high plasticity [57], the results of the current study might be due to the compensatory growth of adipose tissue in NR offspring LM; however, further histochemical and biomolecular investigations are needed to determine whether maternal undernutrition has a long-term effect on the commitment of adipogenesis or fibrogenesis.
In the current study, we set 60% of nutrient requirements as “undernutrition” because, according to JFSBC, this level was considered to represent the minimum amount of nutrition needed to avoid pregnancy complications in pregnant cows [16]. Clarke et al. provided 60% of nutrient requirements to sheep during early to mid-gestation, but ovine fetal size and BW did not differ [58]. By contrast, Vonnahme et al. demonstrated that 50% nutrient restriction decreased fetal BW and surface area of placentomes immediately following a prolonged bout of nutrient restriction from early to mid-gestation in sheep [59]. These studies suggest that moderate restriction and small differences in maternal nutrition levels may not cause significant phenotypic differences in the fetus. Additionally, JFSBC recommends an approximate increase of 25% of the nutrient requirement during the last 2 months of gestation for maintenance of the fetus. We previously reported that fetal BW and tissue/organ weight, such as of muscle and liver, differed between the fetuses from Wagyu cows provided with 60% or 120% of the nutrient requirements [7]. Therefore, in the current study, 120% of the nutrient requirements was set as a control counterpart to 60% of requirements, to investigate the long-term effect of maternal undernutrition on offspring muscle.
Overall, we observed the long-term effects of maternal undernutrition on the metabolism and morphological characteristics of skeletal muscle in postnatal offspring of Wagyu cattle. Previous studies identified epigenetic regulation as a mechanism underlying fetal and neonatal programming [60], emphasizing the need for further investigations to elucidate the epigenetic mechanisms regulating the long-term impacts observed in the current study.
5. Conclusions
In this study, we found that maternal undernutrition had long-term effects on internal changes in muscle metabolism and functionality, although it did not affect phenotypic traits such as BW over the long term. Maternal undernutrition induced the accumulation of proteinogenic amino acids and reduction of energy production, particularly through decreased NADH production and TCA cycle and ETC oxidation function, in postnatal offspring muscle. Offspring might adapt to the severely limited nutrient environment through physiological changes that reduce mitochondrial energy production and conserve energy expenditure for protein synthesis in muscle. These results might have been due to the thrifty energy metabolism in offspring muscle programmed during the fetal stage. Furthermore, maternal undernutrition decreased metabolites of neurotransmitters, suggesting the long-term impact on the contractile functionality through the alteration of neurodevelopment. Therefore, restricted nutrition during gestation regulates energy metabolism and contractility in offspring muscle over the long term, thereby negatively influencing animal growth and meat productivity.
Supplementary Materials
The following supporting information can be downloaded at the website of this paper posted on Preprints.org., Table S1: All metabolites detected in the longissimus thoracis muscles of 300-day-old offspring from cows provided with adequate nutrition (CNT, 120% of requirements) or restricted nutrition (NR, 60% of requirements), Table S2: Energy metabolism-related metabolites that substantially differed in abundance (|abundance difference| > 20%) between the longissimus thoracis muscles (LM) of 300-day-old offspring from cows provided with adequate nutrition (CNT, 120% of requirements) or restricted nutrition (NR, 60% of requirements), Table S3: KEGG pathways (P < 0.10) enriched with differentially expressed genes (DEG) and the identified DEG between the longissimus thoracis muscles (LM) of 300-day-old offspring from cows provided with adequate nutrition (CNT, 120% of requirements) or restricted nutrition (NR, 60% of requirements), Table S4: Differentially expressed genes (DEG) identified in KEGG pathway analyses of longissimus thoracis muscles in 300-day-old offspring from cows provided with adequate nutrition (CNT, 120% of requirements) or restricted nutrition (NR, 60% of requirements), Table S5: Estimated myofiber area percentages of the longissimus thoracis muscles (LM) in 300-day-old offspring from cows provided with adequate nutrition (CNT, 120% of requirements) or restricted nutrition (NR, 60% of requirements).
Author Contributions
Conceptualization, D.N. and T.G.; methodology, D.N., T.H., T.S., S.M., S.Y., and T.G.; software, D.N.; validation, D.N., S.M., and T.G.; formal analysis, D.N. and T.H.; investigation, D.N., T.H., T.S., S.M., K.K., S.U., I.O., S.Y., and T.G.; resources, K.K., S.U., I.O., S.Y., and T.G.; data curation, D.N. and T.H.; writing—original draft preparation, D.N.; writing—review and editing, S.M. and T.G.; visualization, D.N; supervision, T.S., S.Y. and T.G.; project administration, T.G.; funding acquisition, T.G. All authors have read and agreed to the published version of the manuscript.
Funding
This research was funded by a Livestock Promotional Subsidy from the Japan Racing Association (JRA), JST Center of Innovation - NEXT (COI-NEXT) and JST SPRING [grant number JPMJSP2136].
Institutional Review Board Statement
All experimental protocols and procedures were approved by the Animal Care and Use Committee of Kagoshima University (approval number: A22009).
Data Availability Statement
The RNA-sequencing dataset has been deposited in the DNA Data Bank of Japan (accession numbers: xxxxxx). Data will be made available on request.
Acknowledgments
The authors wish to thank Dr. Ryohei Fujita (Hokkaido University) for technical assistance. The authors also thank Edanz (https://jp.edanz.com/ac) for editing a draft of this manuscript.
Conflicts of Interest
The authors declare no conflicts of interest.
References
- Greenwood, P.L.; Bell, A.W. Developmental Programming and Growth of Livestock Tissues for Meat Production. Veterinary Clinics of North America - Food Animal Practice 2019, 35, 303–319. [Google Scholar] [CrossRef] [PubMed]
- Du, M.; Huang, Y.; Das, A.K.; Yang, Q.; Duarte, M.S.; Dodson, M. V.; Zhu, M.J. MEAT SCIENCE AND MUSCLE BIOLOGY SYMPOSIUM: Manipulating Mesenchymal Progenitor Cell Differentiation to Optimize Performance and Carcass Value of Beef Cattle, J Anim Sci 2013, 91, 1419–1427. [Google Scholar] [CrossRef] [PubMed]
- Greenwood, P.L.; Cafe, L.M. Consequences of Nutrition and Growth Retardation Early in Life for Growth and Composition of Cattle and Eating Quality of Beef; 2005; Vol. 15;
- Webb, M.J.; Block, J.J.; Funston, R.N.; Underwood, K.R.; Legako, J.F.; Harty, A.A.; Salverson, R.R.; Olson, K.C.; Blair, A.D. Influence of Maternal Protein Restriction in Primiparous Heifers during Mid- and/or Late-Gestation on Meat Quality and Fatty Acid Profile of Progeny. Meat Sci 2019, 152, 31–37. [Google Scholar] [CrossRef]
- Zumbaugh, M.D.; Johnson, S.E.; Shi, T.H.; Gerrard, D.E. Molecular and Biochemical Regulation of Skeletal Muscle Metabolism. J Anim Sci 2022, 100. [Google Scholar] [CrossRef]
- Bonnet -, M.; Cassar-Malek, I.; Chilliard, Y.; Picard, B. Ontogenesis of Muscle and Adipose Tissues and Their Interactions in Ruminants and Other Species. Animal 2010. [Google Scholar] [CrossRef]
- Zhang, Y.; Otomaru, K.; Oshima, K.; Goto, Y.; Oshima, I.; Muroya, S.; Sano, M.; Saneshima, R.; Nagao, Y.; Kinoshita, A.; et al. Effects of Low and High Levels of Maternal Nutrition Consumed for the Entirety of Gestation on the Development of Muscle, Adipose Tissue, Bone, and the Organs of Wagyu Cattle Fetuses. Animal Science Journal 2021, 92. [Google Scholar] [CrossRef]
- Muroya, S.; Zhang, Y.; Kinoshita, A.; Otomaru, K.; Oshima, K.; Gotoh, Y.; Oshima, I.; Sano, M.; Roh, S.; Oe, M.; et al. Maternal Undernutrition during Pregnancy Alters Amino Acid Metabolism and Gene Expression Associated with Energy Metabolism and Angiogenesis in Fetal Calf Muscle. Metabolites 2021, 11. [Google Scholar] [CrossRef] [PubMed]
- Chang, E.I.; Wesolowski, S.R.; Gilje, E.A.; Baker, P.R.; Reisz, J.A.; D’Alessandro, A.; Hay, W.W.; Rozance, P.J.; Brown, L.D. Skeletal Muscle Amino Acid Uptake Is Lower and Alanine Production Is Greater in Late Gestation Intrauterine Growth-Restricted Fetal Sheep Hindlimb. Am J Physiol Regul Integr Comp Physiol 2019, 317, R615–R629. [Google Scholar] [CrossRef] [PubMed]
- Smith, B.I.; Vásquez-Hidalgo, M.A.; Li, X.; Vonnahme, K.A.; Grazul-Bilska, A.T.; Swanson, K.C.; Moore, T.E.; Reed, S.A.; Govoni, K.E. The Effects of Maternal Nutrient Restriction during Mid to Late Gestation with Realimentation on Fetal Metabolic Profiles in the Liver, Skeletal Muscle, and Blood in Sheep. Metabolites 2024, 14, 465. [Google Scholar] [CrossRef] [PubMed]
- Martin, D.E.; Jones, A.K.; Pillai, S.M.; Hoffman, M.L.; McFadden, K.K.; Zinn, S.A.; Govoni, K.E.; Reed, S.A. Maternal Restricted- And Overfeeding during Gestation Result in Distinct Lipid and Amino Acid Metabolite Profiles in the Longissimus Muscle of the Offspring. Front Physiol 2019, 10, 448206. [Google Scholar] [CrossRef]
- Foroutan, A.; Wishart, D.S.; Fitzsimmons, C. Exploring Biological Impacts of Prenatal Nutrition and Selection for Residual Feed Intake on Beef Cattle Using Omics Technologies: A Review. Front Genet 2021, 12, 720268. [Google Scholar] [CrossRef]
- Beauchamp, B.; Ghosh, S.; Dysart, M.W.; Kanaan, G.N.; Chu, A.; Blais, A.; Rajamanickam, K.; Tsai, E.C.; Patti, M.E.; Harper, M.E. Low Birth Weight Is Associated with Adiposity, Impaired Skeletal Muscle Energetics and Weight Loss Resistance in Mice. International Journal of Obesity 2015 39:4 2014, 39, 702–711. [Google Scholar] [CrossRef] [PubMed]
- Selak, M.A.; Storey, B.T.; Peterside, I.; Simmons, R.A. Impaired Oxidative Phosphorylation in Skeletal Muscle of Intrauterine Growth-Retarded Rats. Am J Physiol Endocrinol Metab 2003, 285. [Google Scholar] [CrossRef]
- Beauchamp, B.; Harper, M.E. In Utero Undernutrition Programs Skeletal and Cardiac Muscle Metabolism. Front Physiol 2016, 6, 171634. [Google Scholar] [CrossRef]
- National Agriculture and Food Research Organization Japanese Feeding Standard for Beef Cattle; 2008th ed.; Japan Livestock Industry Association: Tokyo, Japan, 2009.
- Phomvisith, O.; Muroya, S.; Otomaru, K.; Oshima, K.; Oshima, I.; Nishino, D.; Haginouchi, T.; Gotoh, T. Maternal Undernutrition Affects Fetal Thymus DNA Methylation, Gene Expression, and, Thereby, Metabolism and Immunopoiesis in Wagyu (Japanese Black) Cattle. Int J Mol Sci 2024, 25, 9242. [Google Scholar] [CrossRef]
- Chen, S.; Zhou, Y.; Chen, Y.; Gu, J. Fastp: An Ultra-Fast All-in-One FASTQ Preprocessor. In Proceedings of the Bioinformatics; Oxford University Press, September 1 2018; Vol. 34, pp. i884–i890.
- Kim, D.; Paggi, J.M.; Park, C.; Bennett, C.; Salzberg, S.L. Graph-Based Genome Alignment and Genotyping with HISAT2 and HISAT-Genotype. Nature Biotechnology 2019 37:8 2019, 37, 907–915. [Google Scholar] [CrossRef] [PubMed]
- Pertea, M.; Pertea, G.M.; Antonescu, C.M.; Chang, T.C.; Mendell, J.T.; Salzberg, S.L. StringTie Enables Improved Reconstruction of a Transcriptome from RNA-Seq Reads. Nature Biotechnology 2015 33:3 2015, 33, 290–295. [Google Scholar] [CrossRef] [PubMed]
- Love, M.I.; Huber, W.; Anders, S. Moderated Estimation of Fold Change and Dispersion for RNA-Seq Data with DESeq2. Genome Biol 2014, 15, 1–21. [Google Scholar] [CrossRef] [PubMed]
- Sherman, B.T.; Hao, M.; Qiu, J.; Jiao, X.; Baseler, M.W.; Lane, H.C.; Imamichi, T.; Chang, W. DAVID: A Web Server for Functional Enrichment Analysis and Functional Annotation of Gene Lists (2021 Update). Nucleic Acids Res 2022, 50, W216–W221. [Google Scholar] [CrossRef] [PubMed]
- Brooke, M.H.; Kaiser, K.K. Muscle Fiber Types: How Many and What Kind? Arch Neurol 1970, 23, 369–379. [Google Scholar] [CrossRef]
- Brooke, M.H.; Kaiser, K.K. Three “Myosin Adenosine Triphosphatase” Systems: The Nature of Their PH Lability and Sulfhydryl Dependence. J Histochem Cytochem 1970, 18, 670–672. [Google Scholar] [CrossRef] [PubMed]
- Funston, R.N.; Larson, D.M.; Vonnahme, K.A. Effects of Maternal Nutrition on Conceptus Growth and Offspring Performance: Implications for Beef Cattle Production. J Anim Sci 2010, 88, E205–E215. [Google Scholar] [CrossRef]
- Du, M.; Tong, J.; Zhao, J.; Underwood, K.R.; Zhu, M.; Ford, S.P.; Nathanielsz, P.W. Fetal Programming of Skeletal Muscle Development in Ruminant Animals. J Anim Sci 2010, 88. [Google Scholar]
- Freetly, H.C.; Ferrell, C.L.; Jenkins, T.G. Timing of Realimentation of Mature Cows That Were Feed-Restricted during Pregnancy Influences Calf Birth Weights and Growth Rates. J Anim Sci 2000, 78, 2790–2796. [Google Scholar] [CrossRef] [PubMed]
- Marquez, D.C.; Paulino, M.F.; Rennó, L.N.; Villadiego, F.C.; Ortega, R.M.; Moreno, D.S.; Martins, L.S.; De Almeida, D.M.; Gionbelli, M.P.; Manso, M.R.; et al. Supplementation of Grazing Beef Cows during Gestation as a Strategy to Improve Skeletal Muscle Development of the Offspring. Animal 2017, 11, 2184–2192. [Google Scholar] [CrossRef] [PubMed]
- Zhao, L.; Liu, X.; Gomez, N.A.; Gao, Y.; Son, J.S.; Chae, S.A.; Zhu, M.J.; Du, M. Stage-Specific Nutritional Management and Developmental Programming to Optimize Meat Production. Journal of Animal Science and Biotechnology 2023 14:1 2023, 14, 1–14. [Google Scholar] [CrossRef]
- Holeček, M. Aspartic Acid in Health and Disease. Nutrients 2023, Vol. 15, Page 4023 2023, 15, 4023. [Google Scholar] [CrossRef] [PubMed]
- Balasubramanian, M.N.; Butterworth, E.A.; Kilberg, M.S. Asparagine Synthetase: Regulation by Cell Stress and Involvement in Tumor Biology. Am J Physiol Endocrinol Metab 2013, 304. [Google Scholar] [CrossRef] [PubMed]
- Krall, A.S.; Xu, S.; Graeber, T.G.; Braas, D.; Christofk, H.R. Asparagine Promotes Cancer Cell Proliferation through Use as an Amino Acid Exchange Factor. Nature Communications 2016 7:1 2016, 7, 1–13. [Google Scholar] [CrossRef]
- Wirth, C.; Brandt, U.; Hunte, C.; Zickermann, V. Structure and Function of Mitochondrial Complex I. Biochimica et Biophysica Acta (BBA) - Bioenergetics 2016, 1857, 902–914. [Google Scholar] [CrossRef] [PubMed]
- Basse, A.L.; Agerholm, M.; Farup, J.; Dalbram, E.; Nielsen, J.; Ørtenblad, N.; Altıntaş, A.; Ehrlich, A.M.; Krag, T.; Bruzzone, S.; et al. Nampt Controls Skeletal Muscle Development by Maintaining Ca2+ Homeostasis and Mitochondrial Integrity. Mol Metab 2021, 53, 101271. [Google Scholar] [CrossRef] [PubMed]
- Pavlu-Pereira, H.; Silva, M.J.; Florindo, C.; Sequeira, S.; Ferreira, A.C.; Duarte, S.; Rodrigues, A.L.; Janeiro, P.; Oliveira, A.; Gomes, D.; et al. Pyruvate Dehydrogenase Complex Deficiency: Updating the Clinical, Metabolic and Mutational Landscapes in a Cohort of Portuguese Patients. Orphanet J Rare Dis 2020, 15, 1–14. [Google Scholar] [CrossRef]
- Ausina, P.; Da Silva, D.; Majerowicz, D.; Zancan, P.; Sola-Penna, M. Insulin Specifically Regulates Expression of Liver and Muscle Phosphofructokinase Isoforms. Biomedicine & Pharmacotherapy 2018, 103, 228–233. [Google Scholar] [CrossRef]
- Mor, I.; Cheung, E.C.; Vousden, K.H. Control of Glycolysis through Regulation of PFK1: Old Friends and Recent Additions. Cold Spring Harb Symp Quant Biol 2011, 76, 211–216. [Google Scholar] [CrossRef] [PubMed]
- Zhu, M.J.; Ford, S.P.; Nathanielsz, P.W.; Du, M. Effect of Maternal Nutrient Restriction in Sheep on the Development of Fetal Skeletal Muscle. Biol Reprod 2004, 71, 1968–1973. [Google Scholar] [CrossRef] [PubMed]
- Pendleton, A.L.; Antolic, A.T.; Kelly, A.C.; Davis, M.A.; Camacho, L.E.; Doubleday, K.; Anderson, M.J.; Langlais, P.R.; Lynch, R.M.; Limesand, S.W. Lower Oxygen Consumption and Complex I Activity in Mitochondria Isolated from Skeletal Muscle of Fetal Sheep with Intrauterine Growth Restriction. Am J Physiol Endocrinol Metab 2020, 319, E67–E80. [Google Scholar] [CrossRef] [PubMed]
- Zhao, W.; Kelly, A.C.; Luna-Ramirez, R.I.; Bidwell, C.A.; Anderson, M.J.; Limesand, S.W. Decreased Pyruvate but Not Fatty Acid Driven Mitochondrial Respiration in Skeletal Muscle of Growth Restricted Fetal Sheep. Int J Mol Sci 2023, 24, 15760. [Google Scholar] [CrossRef]
- Fernandes, A.C.; Polizel, G.H.G.; Cracco, R.C.; Cançado, F.A.C.Q.; Baldin, G.C.; Poleti, M.D.; Ferraz, J.B.S.; Santana, M.H. de A. Metabolomics Changes in Meat and Subcutaneous Fat of Male Cattle Submitted to Fetal Programming. Metabolites 2024, 14, 9. [Google Scholar] [CrossRef]
- Neale, J.H.; Bzdega, T.; Wroblewska, B. N-Acetylaspartylglutamate. J Neurochem 2000, 75, 443–452. [Google Scholar] [CrossRef] [PubMed]
- Pette, D.; Staron, R.S. Transitions of Muscle Fiber Phenotypic Profiles. Histochem Cell Biol 2001, 115, 359–372. [Google Scholar] [CrossRef]
- van Vliet, E.; Eixarch, E.; Illa, M.; Arbat-Plana, A.; González-Tendero, A.; Hogberg, H.T.; Zhao, L.; Hartung, T.; Gratacos, E. Metabolomics Reveals Metabolic Alterations by Intrauterine Growth Restriction in the Fetal Rabbit Brain. PLoS One 2013, 8. [Google Scholar] [CrossRef] [PubMed]
- Peerboom, C.; Wierenga, C.J. The Postnatal GABA Shift: A Developmental Perspective. Neurosci Biobehav Rev 2021, 124, 179–192. [Google Scholar] [CrossRef] [PubMed]
- Matarneh, S.K.; Silva, S.L.; Gerrard, D.E. New Insights in Muscle Biology That Alter Meat Quality. Annu Rev Anim Biosci 2021, 9, 355–377. [Google Scholar] [CrossRef] [PubMed]
- Greenwood, P.L.; Slepetis, R.M.; Bell, A.W.; Hermanson, J.W. Intrauterine Growth Retardation Is Associated with Reduced Cell Cycle Activity, but Not Myofibre Number, in Ovine Fetal Muscle. Reprod Fertil Dev 1999, 11, 281. [Google Scholar] [CrossRef]
- Wegner, J.; Albrecht, E.; Fiedler, I.; Teuscher, F.; Papstein, H.J.; Ender, K. Growth- and Breed-Related Changes of Muscle Fiber Characteristics in Cattle. J Anim Sci 2000, 78, 1485–1496. [Google Scholar] [CrossRef] [PubMed]
- Costa, T.C.; Du, M.; Nascimento, K.B.; Galvão, M.C.; Meneses, J.A.M.; Schultz, E.B.; Gionbelli, M.P.; Duarte, M. de S. Skeletal Muscle Development in Postnatal Beef Cattle Resulting from Maternal Protein Restriction during Mid-Gestation. Animals (Basel) 2021, 11, 1–14. [Google Scholar] [CrossRef]
- Fahey, A.J.; Brameld, J.M.; Parr, T.; Buttery, P.J. The Effect of Maternal Undernutrition before Muscle Differentiation on the Muscle Fiber Development of the Newborn Lamb, J Anim Sci 2005, 83, 2564–2571. [Google Scholar] [CrossRef]
- Zhu, M.J.; Ford, S.P.; Means, W.J.; Hess, B.W.; Nathanielsz, P.W.; Du, M. Maternal Nutrient Restriction Affects Properties of Skeletal Muscle in Offspring. J Physiol 2006, 575, 241–250. [Google Scholar] [CrossRef]
- Alvarenga, T.I.R.C.; Copping, K.J.; Han, X.; Clayton, E.H.; Meyer, R.J.; Rodgers, R.J.; McMillen, I.C.; Perry, V.E.A.; Geesink, G. The Influence of Peri-Conception and First Trimester Dietary Restriction of Protein in Cattle on Meat Quality Traits of Entire Male Progeny. Meat Sci 2016, 121, 141–147. [Google Scholar] [CrossRef]
- Greenwood, P.L.; Cafe, L.M. Prenatal and Pre-Weaning Growth and Nutrition of Cattle: Long-Term Consequences for Beef Production. Animal 2007, 1, 1283–1296. [Google Scholar] [CrossRef]
- Ahmadzadeh-Gavahan, L.; Hosseinkhani, A.; Hamidian, G.; Jarolmasjed, S.; Yousefi-Tabrizi, R. Restricted Maternal Nutrition and Supplementation of Propylene Glycol, Monensin Sodium and Rumen-Protected Choline Chloride during Late Pregnancy Does Not Affect Muscle Fibre Characteristics of Offspring. Vet Med Sci 2023, 9, 2260–2268. [Google Scholar] [CrossRef] [PubMed]
- Tygesen, M.P.; Harrison, A.P.; Therkildsen, M. The Effect of Maternal Nutrient Restriction during Late Gestation on Muscle, Bone and Meat Parameters in Five Month Old Lambs. Livest Sci 2007, 110, 230–241. [Google Scholar] [CrossRef]
- Uezumi, A.; Ito, T.; Morikawa, D.; Shimizu, N.; Yoneda, T.; Segawa, M.; Yamaguchi, M.; Ogawa, R.; Matev, M.M.; Miyagoe-Suzuki, Y.; et al. Fibrosis and Adipogenesis Originate from a Common Mesenchymal Progenitor in Skeletal Muscle. J Cell Sci 2011, 124, 3654–3664. [Google Scholar] [CrossRef] [PubMed]
- Du, M.; Wang, B.; Fu, X.; Yang, Q.; Zhu, M.J. Fetal Programming in Meat Production. Meat Sci 2015, 109, 40–47. [Google Scholar] [CrossRef] [PubMed]
- Clarke, L.; Heasman, L.; Juniper, D.T.; Symonds, M.E. Maternal Nutrition in Early-Mid Gestation and Placental Size in Sheep. British Journal of Nutrition 1998, 79, 359–364. [Google Scholar] [CrossRef] [PubMed]
- Vonnahme, K.A.; Hess, B.W.; Hansen, T.R.; McCormick, R.J.; Rule, D.C.; Moss, G.E.; Murdoch, W.J.; Nijland, M.J.; Skinner, D.C.; Nathanielsz, P.W.; et al. Maternal Undernutrition from Early- to Mid-Gestation Leads to Growth Retardation, Cardiac Ventricular Hypertrophy, and Increased Liver Weight in the Fetal Sheep. Biol Reprod 2003, 69, 133–140. [Google Scholar] [CrossRef] [PubMed]
- Costa, T.C.; Gionbelli, M.P.; Duarte, M. de S. Fetal Programming in Ruminant Animals: Understanding the Skeletal Muscle Development to Improve Meat Quality. Animal Frontiers 2021, 11, 66–73. [Google Scholar] [CrossRef] [PubMed]
Figure 1.
Design of the study. Wagyu cows were provided with adequate nutrition (control, CNT; n = 4, 120% of requirements) or restricted nutrition (NR; n = 4; 60% of requirements) from day 35 of gestation until parturition. After birth, all offspring were provided with the same diet until 300 d.
Figure 1.
Design of the study. Wagyu cows were provided with adequate nutrition (control, CNT; n = 4, 120% of requirements) or restricted nutrition (NR; n = 4; 60% of requirements) from day 35 of gestation until parturition. After birth, all offspring were provided with the same diet until 300 d.
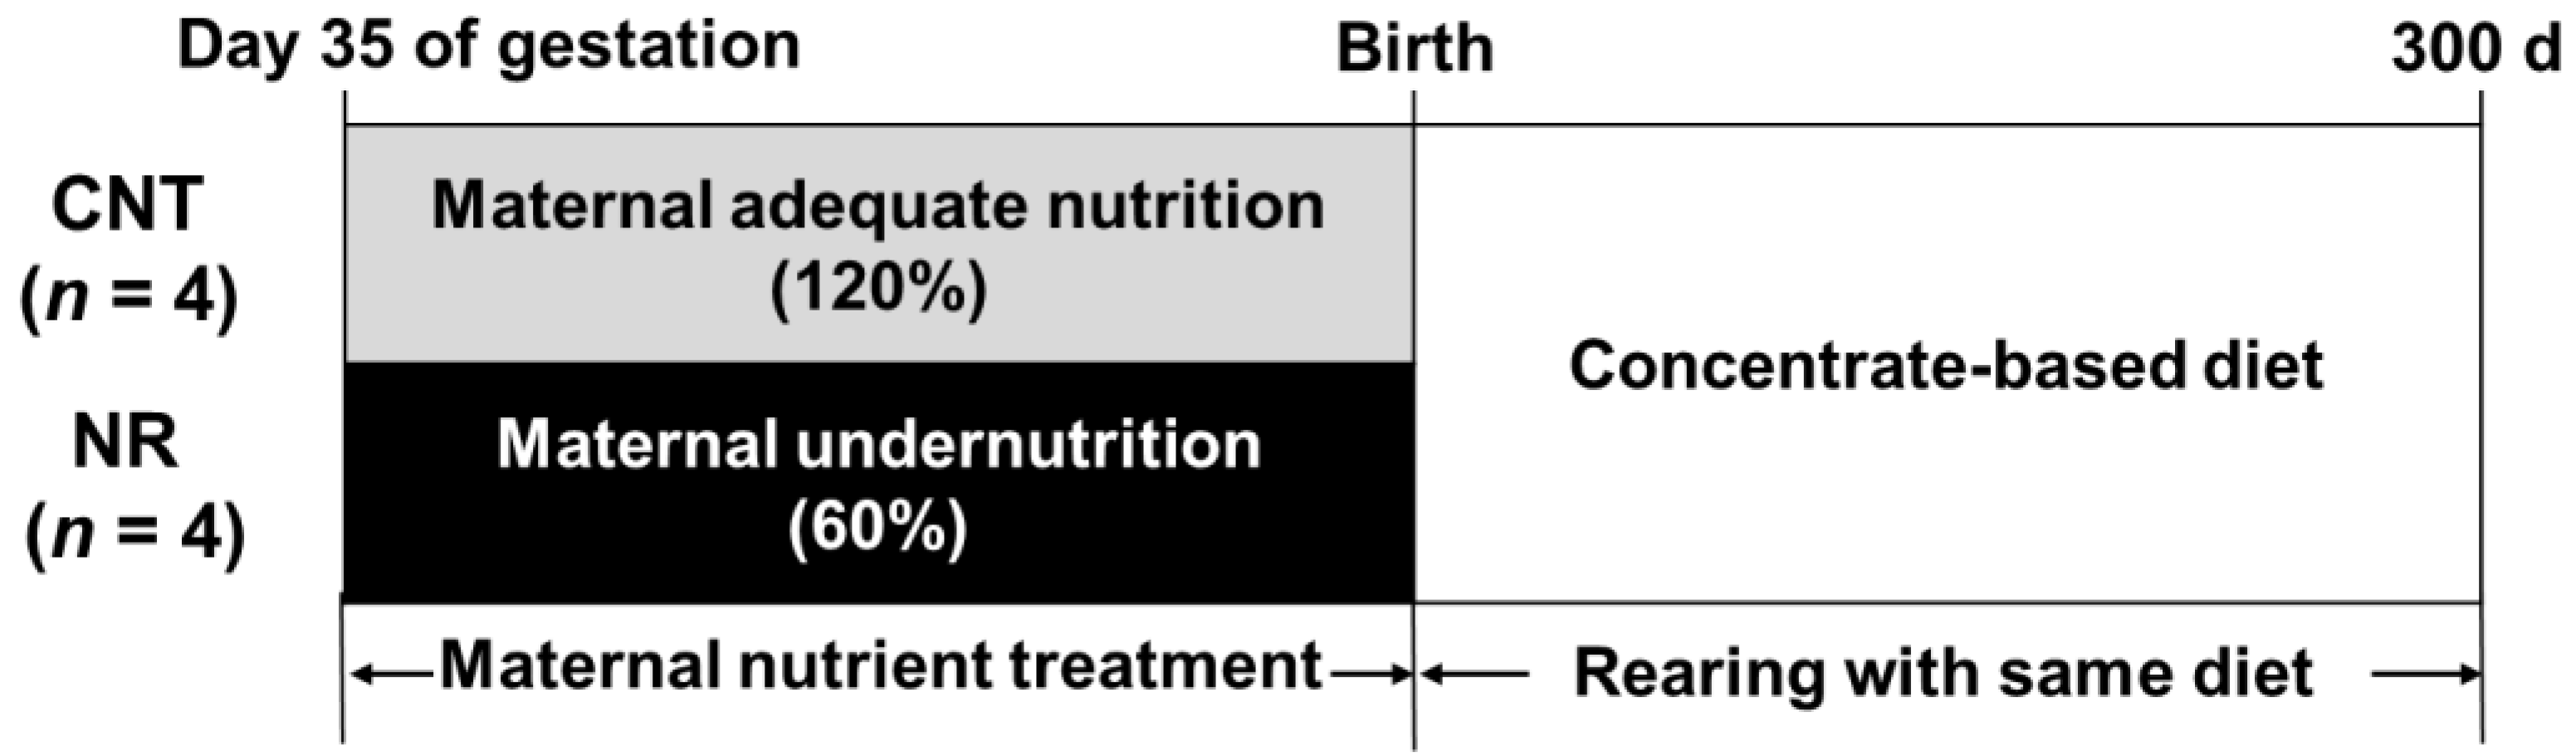
Figure 2.
Schematic representation of the effects of maternal undernutrition on energy metabolism of offspring muscle. Comprehensive analyses were performed to investigate the abundances of transcripts and metabolites in the longissimus thoracis muscles (LM) of 300-day-old offspring from cows provided with adequate nutrition (CNT, 120% of requirements) or restricted nutrition (NR, 60% of requirements). These analyses identified tricarboxylic acid (TCA) cycle, oxidation in the electron transport chain (ETC), and glycolysis as altered metabolic pathways. The accumulation of proteinogenic amino acids might be due to thrifty metabolism programmed during the fetal stage, resulting in the conservation of energy expenditure for protein synthesis in muscle. Suppression of energy production was evident by the reduction in the metabolites and expression of genes related to the mitochondrial TCA cycle and ETC, and accumulated metabolites in the later stage of glycolysis. The decrease in neurotransmitters produced from glutamate suggests that the thrifty metabolism might affect neurodevelopment and functions necessary for proper myofiber contractility. Text not enclosed in squares indicates metabolites; red: accumulated metabolite (P < 0.10), light red: substantially accumulated metabolites (fold change [FC] > 1.2), blue: reduced metabolites (P < 0.1), light blue: substantially reduced metabolites (FC < 0.8) in NR offspring LM; black: metabolites that did not differ in abundance between the groups. Text enclosed in squares and italicized indicates differentially expressed genes (DEG); red: upregulated DEG (P < 0.05), blue: downregulated DEG (P < 0.05) in NR offspring LM. NAD = nicotinamide adenine dinucleotide, NAAG = N-acetylaspartylglutamate, GABA = gamma-aminobutyric acid, NAM = nicotinamide, NMN = nicotinamide mononucleotide, G6P = glucose 6-phosphate, F6P = fructose 6-phosphate, F1,6BP = fructose 1,6-diphosphate, DHAP = dihydroxyacetone phosphate, G3P = glyceraldehyde 3-phosphate, 1,3BPG = 1,3-bisphosphoglycerate, 3PG = 3-phosphoglycerate, 2PG = 2-phosphoglycerate, PEP = phosphoenolpyruvate, NDUFA12 = NADH:ubiquinone oxidoreductase subunit A12, ND5 = NADH dehydrogenase subunit 5, NAMPT = nicotinamide phosphoribosyltransferase, PDHA1 = pyruvate dehydrogenase E1 subunit alpha 1, DLD = dihydrolipoamide dehydrogenase, PFKP = phosphofructokinase-platelet. Ⅰ, Ⅱ, Ⅲ, Ⅳ, and Ⅴ = complex Ⅰ, Ⅱ, Ⅲ, Ⅳ, and Ⅴ in the ETC, respectively.
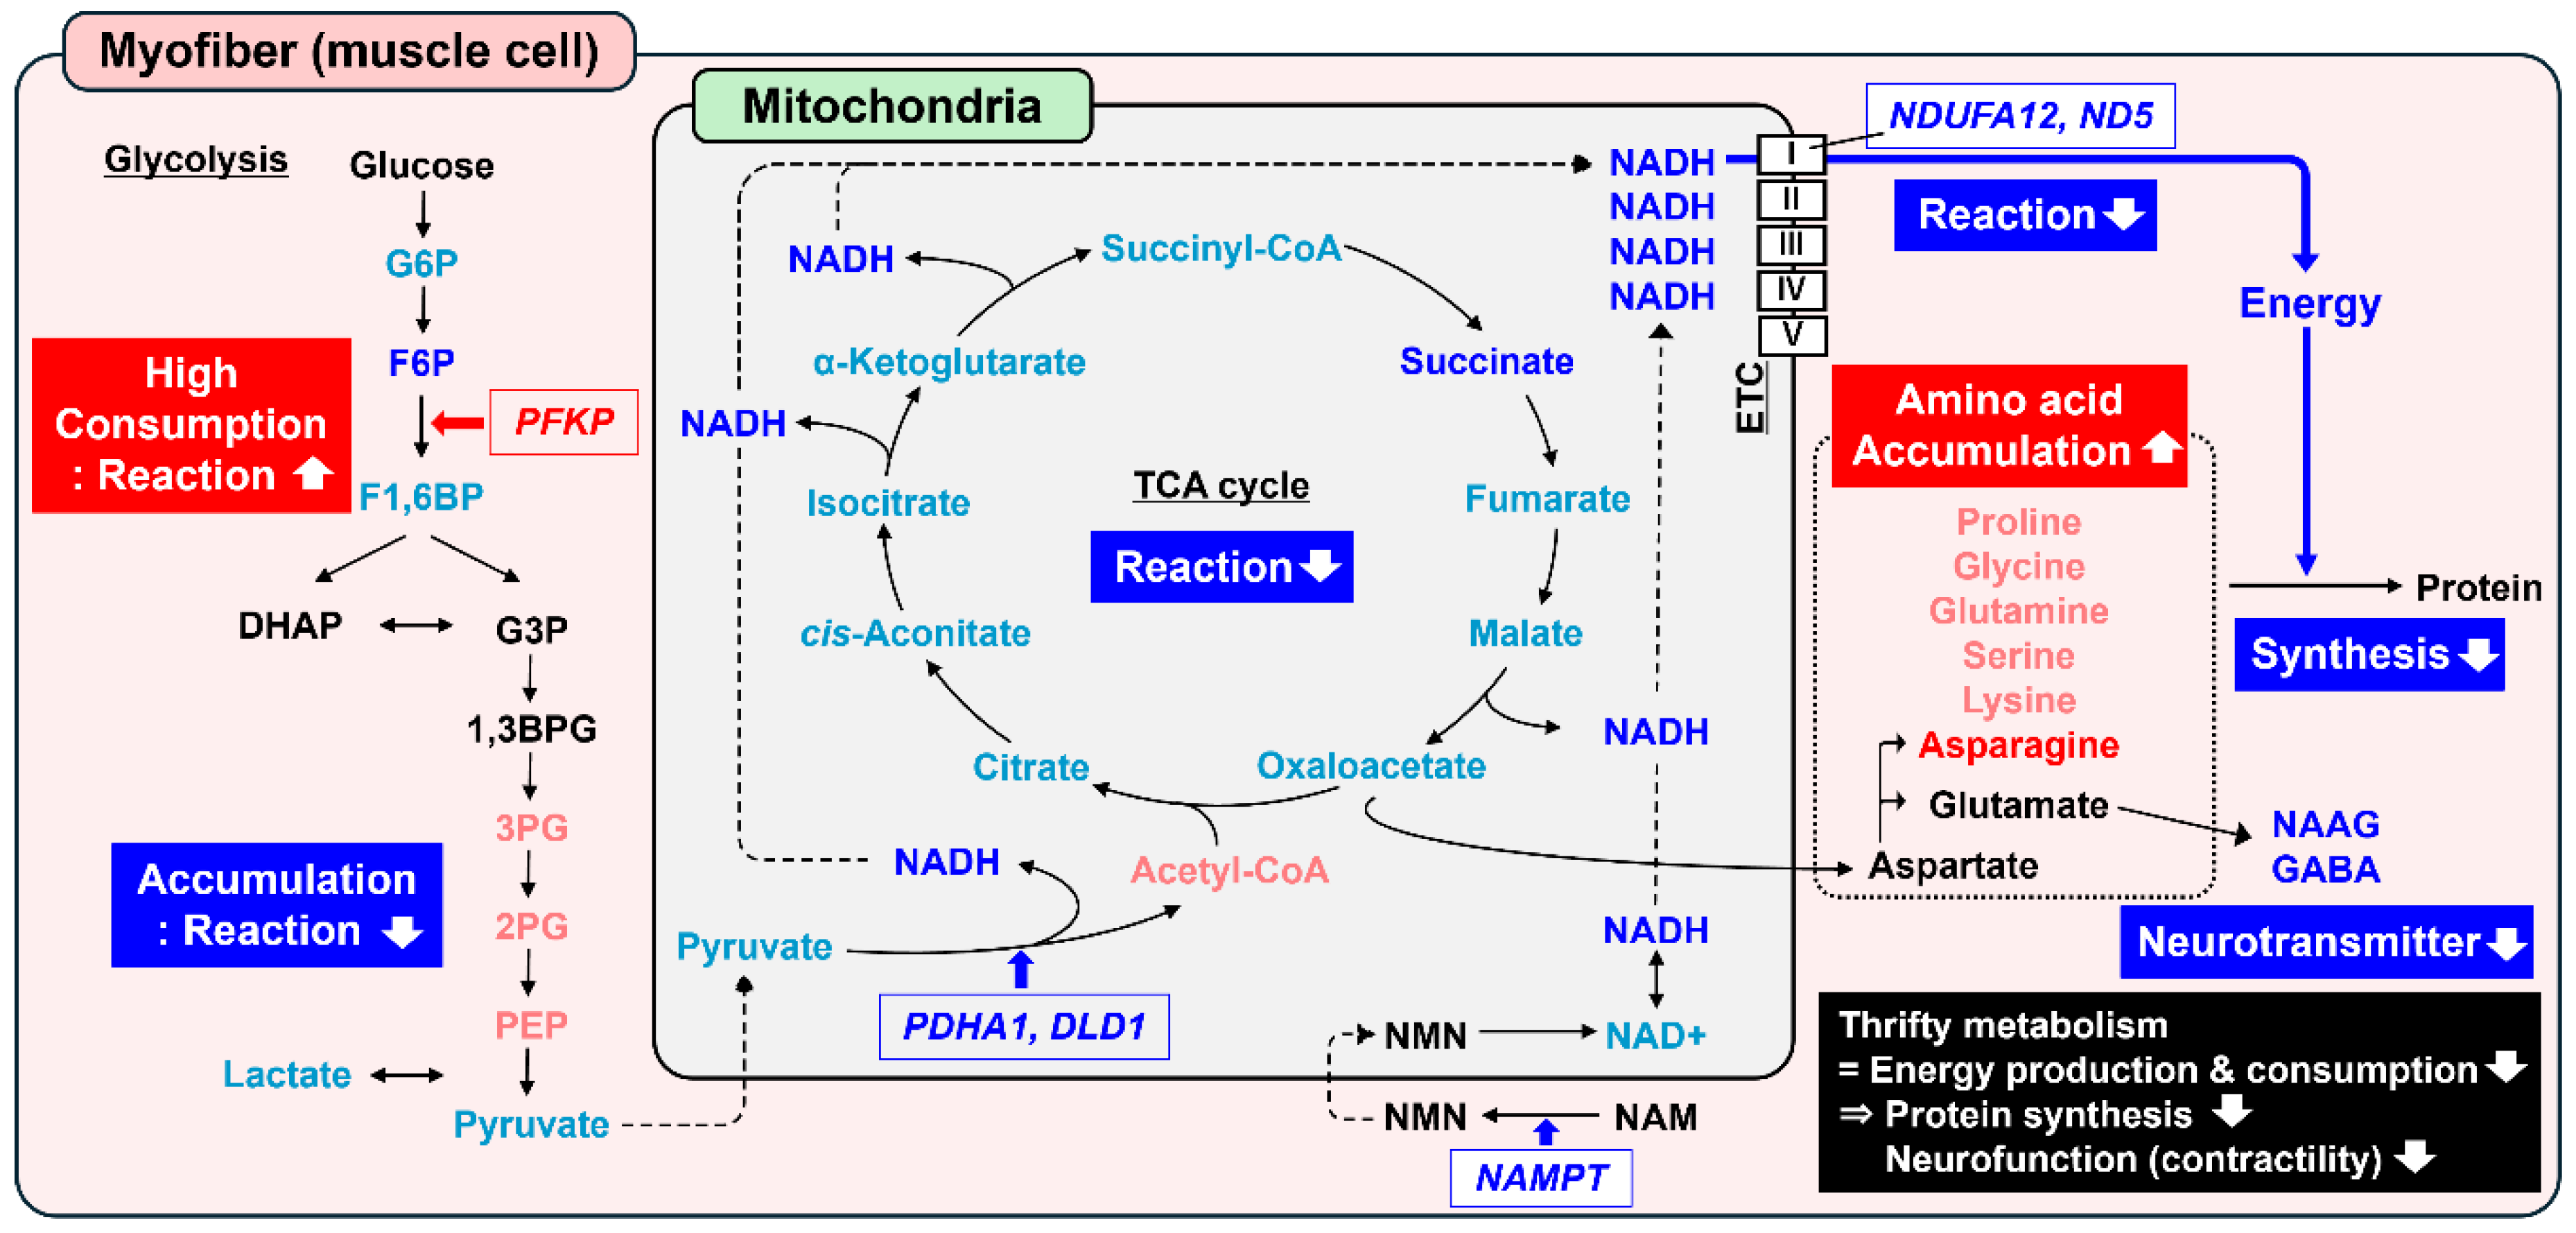

Table 1.
Nutrient intake and growth characteristics of Wagyu cattle offspring.
| Treatment1 | |||||
| Items | CNT | NR | SEM | P-value | |
| Nutrient intake, kg | |||||
| Milk replacer | |||||
| CP2 | 16.6 | 16.3 | 0.7 | 0.73 | |
| TDN3 | 64.0 | 63.0 | 2.8 | 0.73 | |
| Total mixed ration | |||||
| 0–120 d | |||||
| CP2 | 31.9 | 34.3 | 2.1 | 0.31 | |
| TDN3 | 137.5 | 147.9 | 8.9 | 0.31 | |
| 121–300 d | |||||
| CP2 | 213.6 | 214.6 | 7.0 | 0.89 | |
| TDN3 | 858.4 | 865.7 | 28.6 | 0.79 | |
| Body weight, kg | |||||
| 0 d | 36.1 | 32.4 | 1.2 | 0.03 | |
| 30 d | 63.2 | 55.9 | 1.2 | < | 0.01 |
| 60 d | 82.3 | 78.8 | 2.6 | 0.31 | |
| 120 d | 140.0 | 139.2 | 5.0 | 0.90 | |
| 180 d | 198.4 | 205.9 | 7.0 | 0.34 | |
| 240 d | 249.3 | 278.3 | 11.1 | 0.08 | |
| 300 d | 311.1 | 328.8 | 12.5 | 0.29 | |
| ADG4, kg/d | |||||
| 0–30 d | 0.90 | 0.78 | 0.03 | 0.02 | |
| 31–60 d | 0.64 | 0.76 | 0.09 | 0.35 | |
| 61–120 d | 0.96 | 1.01 | 0.05 | 0.39 | |
| 121–180 d | 0.97 | 1.11 | 0.05 | 0.04 | |
| 181–240 d | 0.85 | 1.21 | 0.16 | 0.08 | |
| 241–300 d | 1.03 | 0.84 | 0.16 | 0.39 | |
| CPCR6, kg CP intake/kg BW gain | |||||
| 0–120 d | 0.47 | 0.48 | 0.02 | 0.69 | |
| 121–300 d | 1.26 | 1.11 | 0.07 | 0.15 | |
| TDNCR5, kg TDN intake/kg BW gain | |||||
| 0–120 d | 1.94 | 1.99 | 0.08 | 0.66 | |
| 121–300 d | 5.07 | 4.47 | 0.31 | 0.17 | |
1Wagyu cattle offspring from cows provided with adequate nutrition (CNT, 120% of requirements) or restricted nutrition (NR, 60% of requirements). 2CP = crude protein. 3TDN = total digestible nutrients. 4ADG = average daily gain. 5CPCR = CP conversion ratio. 6TDNCR = TDN conversion ratio.
Table 2.
Metabolites that differed in abundance (P < 0.10) between the longissimus thoracis muscles of 300-day-old offspring from cows provided with adequate nutrition (CNT, 120% of requirements) or restricted nutrition (NR, 60% of requirements).
Table 2.
Metabolites that differed in abundance (P < 0.10) between the longissimus thoracis muscles of 300-day-old offspring from cows provided with adequate nutrition (CNT, 120% of requirements) or restricted nutrition (NR, 60% of requirements).
| Treatment2 | |||||
| Compound1 | CNT | NR | SEM | P-value | |
| NADH | 100.0 | 22.2 | 5.7 | < | 0.01 |
| Pyroglutamine | 100.0 | 145.1 | 8.0 | 0.01 | |
| 2-Deoxyribonic acid | 100.0 | 72.6 | 4.6 | 0.01 | |
| N-Acetylglucosamine 1-phosphate | 100.0 | 33.2 | 12.6 | 0.01 | |
| N6,N6-Dimethyllysine | 100.0 | 141.3 | 11.0 | 0.03 | |
| 11-Aminoundecanoic acid | 100.0 | 140.7 | 11.2 | 0.03 | |
| 3’,5’-ADP | 100.0 | 203.4 | 27.6 | 0.03 | |
| myo-Inositol 2-phosphate | 100.0 | 68.9 | 8.9 | 0.04 | |
| 3-Methylcytidine | 100.0 | 55.2 | 12.0 | 0.04 | |
| Asparagine | 100.0 | 141.4 | 13.4 | 0.05 | |
| Allantoic acid | 100.0 | 57.8 | 13.2 | 0.05 | |
| Tyrosine methyl ester | 100.0 | 69.4 | 9.5 | 0.06 | |
| Taurine | 100.0 | 140.3 | 14.3 | 0.06 | |
| N-Acetylaspartylglutamate | 100.0 | 55.3 | 16.4 | 0.07 | |
| Fructose 6-phosphate | 100.0 | 62.6 | 12.0 | 0.07 | |
| Succinate | 100.0 | 60.5 | 13.7 | 0.07 | |
| GABA | 100.0 | 72.4 | 11.2 | 0.08 | |
| Methylguanidine | 100.0 | 139.0 | 16.1 | 0.09 | |
| 2-Amino-2-methyl-1-propanol | 100.0 | 120.7 | 8.9 | 0.10 | |
| Glycerophosphorylethanolamine | 100.0 | 171.5 | 30.4 | 0.10 | |
| Glucosaminic acid | 100.0 | 63.2 | 15.2 | 0.10 | |
1Metabolite contents were measured using capillary electrophoresis–time-of-flight mass spectrometry. 2Values in the table represent the mean relative contents as a percentage, with the CNT value set to 100%. NADH = nicotinamide adenine dinucleotide; 3’,5’-ADP = adenosine 3’,5’-diphosphate; GABA = gamma-aminobutyric acid.
Table 3.
KEGG pathways enriched with metabolites that differed in abundance (P < 0.10) between the longissimus thoracis muscles (LM) of 300-day-old offspring from cows provided with adequate nutrition (CNT, 120% of requirements) or restricted nutrition (NR, 60% of requirements).
Table 3.
KEGG pathways enriched with metabolites that differed in abundance (P < 0.10) between the longissimus thoracis muscles (LM) of 300-day-old offspring from cows provided with adequate nutrition (CNT, 120% of requirements) or restricted nutrition (NR, 60% of requirements).
| Metabolites2 | ||||||
| Pathway1 | P-value | FDR | Increased in NR LM | Decreased in NR LM | ||
| Alanine, aspartate, and glutamate metabolism | < | 0.01 | < | 0.01 | Asparagine | Succinate, N-Acetylaspartylglutamate, GABA |
| Butanoate metabolism | < | 0.01 | 0.15 | Succinate, GABA | ||
| Amino sugar and nucleotide sugar metabolism | 0.03 | 0.76 | Fructose 6-phosphate, N-Acetyl-glucosamine 1-phosphate | |||
| Taurine and hypotaurine metabolism | 0.05 | 1.00 | Taurine | |||
| Starch and sucrose metabolism | 0.11 | 1.00 | Fructose 6-phosphate | |||
| TCA cycle | 0.12 | 1.00 | Succinate | |||
| Fructose and mannose metabolism | 0.12 | 1.00 | Fructose 6-phosphate | |||
| Ether lipid metabolism | 0.12 | 1.00 | Glycerylphosphorylethanolamine | |||
| Pantothenate and CoA biosynthesis | 0.12 | 1.00 | 3¢,5¢-ADP | |||
| Propanoate metabolism | 0.13 | 1.00 | Succinate | |||
| Pentose phosphate pathway | 0.14 | 1.00 | Fructose 6-phosphate | |||
| Glycolysis/gluconeogenesis | 0.16 | 1.00 | Fructose 6-phosphate | |||
| Arginine and proline metabolism | 0.21 | 1.00 | GABA | |||
| Glycerophospholipid metabolism | 0.21 | 1.00 | Glycerylphosphorylethanolamine | |||
| Primary bile acid biosynthesis | 0.26 | 1.00 | Taurine | |||
| Purine metabolism | 0.37 | 1.00 | Allantoic acid | |||
1KEGG pathway analysis was performed using MetaboAnalyst 6.0. 2Metabolites expressed at higher (CNT < NR) or lower levels (CNT > NR) in NR offspring LM (P < 0.10). TCA cycle = tricarboxylic acid cycle; GABA = gamma-aminobutyric acid; 3′,5′-ADP = adenosine 3′,5′-diphosphate.
Table 4.
KEGG pathways (P < 0.10) enriched with the differentially expressed genes (DEG) between the longissimus thoracis muscles (LM) of 300-day-old offspring from cows provided with adequate nutrition (CNT, 120% of requirements) or restricted nutrition (NR, 60% of requirements).
Table 4.
KEGG pathways (P < 0.10) enriched with the differentially expressed genes (DEG) between the longissimus thoracis muscles (LM) of 300-day-old offspring from cows provided with adequate nutrition (CNT, 120% of requirements) or restricted nutrition (NR, 60% of requirements).
| Items1 | Hits/total genes | Raw P-value | FDR | |||
| Pathways enriched with upregulated DEG2 | ||||||
| bta04820 | Cytoskeleton in muscle cells | 15 / 232 | < | 0.01 | < | 0.01 |
| bta05171 | Coronavirus disease - COVID-19 | 16 / 317 | < | 0.01 | 0.01 | |
| bta03010 | Ribosome | 11 / 202 | < | 0.01 | 0.08 | |
| bta04512 | ECM–receptor interaction | 7 / 89 | < | 0.01 | 0.14 | |
| bta05169 | Epstein–Barr virus infection | 11 / 236 | < | 0.01 | 0.15 | |
| bta05150 | Staphylococcus aureus infection | 7 / 105 | 0.01 | 0.20 | ||
| bta05164 | Influenza A | 9 / 196 | 0.01 | 0.34 | ||
| bta04145 | Phagosome | 8 / 166 | 0.01 | 0.35 | ||
| bta04610 | Complement and coagulation cascades | 6 / 93 | 0.01 | 0.35 | ||
| bta05133 | Pertussis | 5 / 78 | 0.03 | 0.71 | ||
| bta04510 | Focal adhesion | 8 / 204 | 0.04 | 0.72 | ||
| bta05162 | Measles | 7 / 162 | 0.04 | 0.72 | ||
| bta05165 | Human papillomavirus infection | 11 / 354 | 0.05 | 0.77 | ||
| bta04974 | Protein digestion and absorption | 6 / 129 | 0.05 | 0.77 | ||
| bta05132 | Salmonella infection | 9 / 265 | 0.05 | 0.77 | ||
| bta05323 | Rheumatoid arthritis | 5 / 104 | 0.08 | 0.99 | ||
| bta04151 | PI3K–Akt signaling pathway | 11 / 392 | 0.08 | 0.99 | ||
| bta04621 | NOD-like receptor signaling pathway | 7 / 198 | 0.08 | 0.99 | ||
| bta05020 | Prion disease | 9 / 303 | 0.10 | 0.99 | ||
| Pathways enriched with downregulated DEG3 | ||||||
| bta01100 | Metabolic pathways | 27 / 1642 | 0.02 | 1.00 | ||
| bta04931 | Insulin resistance | 5 / 110 | 0.03 | 1.00 | ||
| bta00010 | Glycolysis/gluconeogenesis | 4 / 64 | 0.03 | 1.00 | ||
| bta04152 | AMPK signaling pathway | 5 / 126 | 0.04 | 1.00 | ||
| bta04144 | Endocytosis | 7 / 249 | 0.05 | 1.00 | ||
| bta00051 | Fructose and mannose metabolism | 3 / 34 | 0.05 | 1.00 | ||
| bta00380 | Tryptophan metabolism | 3 / 46 | 0.08 | 1.00 | ||
| bta04922 | Glucagon signaling pathway | 4 / 103 | 0.09 | 1.00 | ||
| Pathways enriched with upregulated and downregulated DEG4 | ||||||
| bta04820 | Cytoskeleton in muscle cells | 18 / 232 | < | 0.01 | 0.03 | |
| bta05171 | Coronavirus disease - COVID-19 | 18 / 317 | < | 0.01 | 0.52 | |
| bta04512 | ECM–receptor interaction | 8 / 89 | 0.01 | 0.59 | ||
| bta05169 | Epstein–Barr virus infection | 14 / 236 | 0.01 | 0.59 | ||
| bta05132 | Salmonella infection | 14 / 265 | 0.02 | 1.00 | ||
| bta00010 | Glycolysis/gluconeogenesis | 6 / 64 | 0.02 | 1.00 | ||
| bta04144 | Endocytosis | 13 / 249 | 0.03 | 1.00 | ||
| bta04621 | NOD-like receptor signaling pathway | 11 / 198 | 0.03 | 1.00 | ||
| bta03010 | Ribosome | 11 / 202 | 0.04 | 1.00 | ||
| bta04152 | AMPK signaling pathway | 8 / 126 | 0.05 | 1.00 | ||
| bta05150 | Staphylococcus aureus infection | 7 / 105 | 0.06 | 1.00 | ||
| bta00051 | Fructose and mannose metabolism | 4 / 34 | 0.06 | 1.00 | ||
| bta05162 | Measles | 9 / 162 | 0.06 | 1.00 | ||
| bta04610 | Complement and coagulation cascades | 6 / 93 | 0.09 | 1.00 | ||
| bta05020 | Prion disease | 13 / 303 | 0.10 | 1.00 | ||
1Enrichment analyses were performed using DAVID 2021, Knowledgebase v2023q4. KEGG pathway. 2Upregulated DEG in NR offspring LM were used (P < 0.05). Gene expression was analyzed by RNA sequencing. 3Downregulated DEG in NR offspring LM were used (P < 0.05). 4Both upregulated and downregulated DEG in NR offspring LM were used (P < 0.05). ECM = extracellular matrix, PI3K = phosphoinositide 3-kinase, NOD = nucleotide-binding oligomerization domain, AMPK = adenosine monophosphate-activated protein kinase.
Table 5.
Myofiber and intramuscular fat characteristics of the longissimus thoracis muscles (LM) in offspring from cows provided with adequate nutrition (CNT, 120% of requirements) or restricted nutrition (NR, 60% of requirements).
Table 5.
Myofiber and intramuscular fat characteristics of the longissimus thoracis muscles (LM) in offspring from cows provided with adequate nutrition (CNT, 120% of requirements) or restricted nutrition (NR, 60% of requirements).
| Treatment | ||||
| Items1 | CNT | NR | SEM | P-value |
| Myofiber diameter at 300 d, µm | ||||
| Type I | 37.5 | 41.1 | 3.0 | 0.32 |
| Type IIA | 49.9 | 54.3 | 5.5 | 0.48 |
| Type IIX | 64.7 | 64.5 | 4.3 | 0.95 |
| Myofiber type, % | ||||
| 75 d | ||||
| Type I | 24.7 | 23.8 | 2.2 | 0.74 |
| Type IIA | 26.0 | 26.7 | 1.2 | 0.67 |
| Type IIX | 49.2 | 49.5 | 2.9 | 0.94 |
| 180 d | ||||
| Type I | 23.3 | 21.2 | 1.6 | 0.33 |
| Type IIA | 24.8 | 27.9 | 2.1 | 0.31 |
| Type IIX | 51.9 | 50.9 | 1.9 | 0.67 |
| 300 d | ||||
| Type I | 21.6 | 29.0 | 2.7 | 0.07 |
| Type IIA | 30.2 | 24.1 | 1.3 | 0.02 |
| Type IIX | 48.2 | 46.9 | 1.8 | 0.62 |
| Adipocyte size at 300 d, μm2 | ||||
| Cross-sectional area | 2365.0 | 1947.4 | 306.3 | 0.35 |
1Samples of LM adjacent to the 12th to 13th thoracic vertebrae were collected by needle biopsy. Cryosections (8 μm thick) were prepared and an average of 300 myofibers and 150 adipocytes were measured. The myofiber diameters were measured as the largest width perpendicular to the long axis of each myofiber.
Disclaimer/Publisher’s Note: The statements, opinions and data contained in all publications are solely those of the individual author(s) and contributor(s) and not of MDPI and/or the editor(s). MDPI and/or the editor(s) disclaim responsibility for any injury to people or property resulting from any ideas, methods, instructions or products referred to in the content. |
© 2025 by the authors. Licensee MDPI, Basel, Switzerland. This article is an open access article distributed under the terms and conditions of the Creative Commons Attribution (CC BY) license (http://creativecommons.org/licenses/by/4.0/).
Copyright: This open access article is published under a Creative Commons CC BY 4.0 license, which permit the free download, distribution, and reuse, provided that the author and preprint are cited in any reuse.


