
Submitted:
10 January 2025
Posted:
13 January 2025
You are already at the latest version
Abstract
The construction industry faces increasing pressure to reduce energy consumption and carbon emissions. Promoting sustainable practices, such as using hot-rolled H-shapes and minimizing welding, can address these challenges. This study introduces Low-Carbon H-Shape Bolted-Composited Beams (HBCBs) as a sustainable alternative. Experimental and numerical investigations into the lateral-torsional buckling behavior of HBCBs demonstrated that high-strength bolts significantly enhance structural stability and capacity. A reliable simulation method was developed and validated based on experimental results. The study revealed that bolt spacing exceeding 1/15 of the beam span has negligible effects on load-bearing capacity, and HBCB performance reaches approximately 95% of plug-welded counterparts. Despite this, longitudinal slip reduction remains challenging, warranting further research to optimize performance.
Keywords:
lateral-torsional buckling
; low-carbon
; H-shape
; beam
; high-strength bolt
; longitudinal slippage
1. Introduction
Be The traditional construction sector faces unprecedented challenges in energy saving and carbon emission reduction (CEs). The construction industry significantly impacts the environment, accounting for about 30% of global CEs, 40% of world energy consumption [1], and 51.3% of total CEs in China [2]. Consequently, it must play a crucial role in reducing emissions. Most embodied CEs occur before the operation phase [3], making material selection, efficient building processes, design for disassembly, and optimized logistics essential [4].
Choosing low-carbon materials can notably reduce a building's initial carbon footprint. Timber is generally considered to have lower CEs than concrete and steel [5], but poor design can result in higher emissions [6]. Prefabricated steel structures, on the other hand, often conserve energy and reduce CEs more effectively than concrete [7], making them a promising long-term solution for the industry. The component production phase is the predominant source of CEs, accounting for 60-73% of total lifecycle emissions [2]. Within this phase, welding-related CEs are particularly significant, comprising 57.2% of emissions in the prefabrication process [8]. Thus, reducing welding can substantially lower overall emissions.
Steel components should utilize hot-rolled shapes (HRSs) or cold-formed shapes (CFSs) to minimize welding. Although CFSs with fasteners have the lowest carbon emissions [9], their application is limited. Conversely, the utilization rate of HRSs remains low. For example, in China, the world's largest steel producer, the engineering utilization rate of HRSs is only 15-20%, with no significant changes in recent years [4]. Developing high-performance HRS built-up components is crucial. Lu et al. [10,11] introduced innovative designs such as flanged cruciform H-shape columns (FCHCs) and T-shaped built-up columns (NTBCs). Also, bolts should replace welding where possible, exemplified by developing weld-free columns [12].
Beams, which use more steel than columns in steel buildings, face limitations due to insufficient manufacturing and market standards for hot-rolled H-shapes. To address this, the authors propose H-shape bolted-composited beams (HBCBs), similar to using high-strength bolts to connect steel plate girders' two sub-beams to solve issues of shipping and field lifting [13]. HHLBs can be used for new construction and can also strengthen existing H-beams. Zhu et al. [13] investigated the bearing capacity of composite and I-section plate beams of the same height and flange plates through experimental comparison. Although all specimens exhibited lateral torsional buckling with slight web yielding near loading points, the composite plate beam's bearing capacity was 6.1% higher than the I-section one. However, they did not thoroughly address composite plate beams' lateral-torsional buckling or overall stability.
Xu et al. [14,15,16] used a similar strategy connecting two cold-formed channels in modular light steel buildings. Their findings revealed that laminated equal channel beams had greater loading capacity and bending stiffness than independent bending double beams [14]. Increasing the number of bolt connections constrained slipping behavior, suggesting that an appropriate number of bolts should be used in engineering practice for optimal efficiency [15]. The results [16] showed that the influence of design factors on EIe (bending stiffness) and Pu (ultimate capacity) were ranked as follows: n > β > f > b > p for EIe and p > b > β > f > n for Pu. Here, n represents the number of bolts, f interfacial friction, β layer height ratio, p load type, and b boundary condition. However, Xu et al.'s [14,15,16] study did not focus on hot-rolled H-shapes.
There are several research gaps in the study of low-carbon H-shape bolted-composited beams (HBCBs). Comprehensive experimental and numerical investigations into their lateral-torsional buckling behavior are lacking. The main effective factors are not clear. Therefore, this paper conducted experimental and numerical research to explore their lateral-torsional buckling behavior and the impact of different factors to lay the foundation for future research on the mechanical performance and design methods of HBCBs.
2. Experimental Investigations
2.1. Specimens Design and Original Data
The cross-section and geometric symbols of an HBCB specimen are shown in Figure 1. Two extension lengths were arranged outside of two supports to fix the beam and the supports, making the specimen length L, where L = Le + 2×150 mm. Thus, the geometric length L of all test beams was 3,000 mm, with an effective length Le of 2,700 mm.
In this study, an HBCB used two Q235B HW100×100×6×8 H-shapes combined with 8.8-grade M12 high-strength bolts. A corresponding no-connection laminated beam (NCLB) specimen was also created to study the effect of bolts. According to GB50017-2017 [17], beams met the S1 cross-section requirements, which allows the entire section plasticity. A pair of 6 mm thick transverse stiffeners were placed at the supports, quarter points, and mid-span of the beam's effective length.
The bolts were spaced at 300 mm spacings equal to 1/9 L. At the supports, two bolts were positioned 75 mm apart. According to GB50017-2017 [17], a pre-tensioned force of 38.5 kN was given to a high-strength bolt of the HHLB, and the bolts' center spacing l0, end spacing l3, and edge margin spacing e complied with the requirements.
2.2. Test Setup
Figure 3a shows the loading system and on-site photos of the specimen. An actuator, a rigid extension rod, a load distribution beam, and two loading point solid round steel bars were used in the loading system to apply two-point concentrated loads at the four-quarter points of the upper flange of the specimen, causing the beam to form a pure bending between the two loading points. Two particular beam end supports, including a simple-supported support and splint support at each beam end, were designed, as shown in Figure 3b. At the supporting end, the beam can not freely warp and can rotate around the major and minor axes without lateral displacement and rotate around its longitudinal axis.
Before testing loading, all specimens were pre-loaded with 5mm and held for 10 minutes to check the loading equipment and data collection system and eliminate the gaps between the specimen parts and test setup. After pre-loading, unloaded to zero. A displacement loading controlled the formal testing loading; the speed was 1 mm/min. The displacement increment of each step was 1 mm and held for 2 minutes to check and judge whether there were any abnormalities in the specimen. After the overall instability of a specimen, continue loading until the load drops to 80% of the peak load or the maximum elongation capacity of the actuator is reached, and at this time, finish the test.
2.3. Arrangement of Displacement Meters and Strain Gauges
Figure 4a shows the specimen's displacement meters arrangement. Since the beam moved downward during the test, a smooth glass piece was pasted outside the mid-span stiffener of the specimen to ensure that the displacement meters D1, D2, and D3 measuring the lateral displacement of the beam could slip up and down freely without changing its horizontal direction. Among them, D2 was located at the superimposed flange of the upper and lower beams. The displacement meter D4 measured the vertical displacement of the beam at mid-span. Displacement meters D5 and D6 measured the longitudinal relative slip of the upper and lower steel beams. Displacement meters D7 and D8 measured the vertical displacement at the support. With the displacement meter D4, the actual deflection at the mid-span of the beam was calculated. Since the pure bending section of the beam should be the first to undergo overall instability failure, strain gauges were only arranged on the mid-span area of the specimen, as shown in Figure 4b. A data acquisition system hooked up to the loading system automatically recorded loads, displacements, and strains.
3. Test Results and Discussion
3.1. Test Observations
3.1.1. HBCB Specimen
In the initial loading stage, the HBCB remained in the elastic phase. A clear and loud sound was heard when the loading displacement reached 14 mm (approximately 92 kN), indicating a longitudinal relative slip between the upper and lower flanges connected by bolts. Real-time data from displacement meters D1, D2, and D3 showed that the mid-span section of the specimen tilted. After that, the load continued to increase, the mid-span deflection grew significantly, and the load increment rate began to slow.
At the loading displacement of 22 mm (approximately 104 kN), another sudden sound occurred, and the load dropped to about 93 kN. Real-time monitoring with displacement meters D5 and D6 revealed longitudinal relative slip along the beam's length. As loading progressed, the load data continued to rise, and at a displacement of 124 mm (approximately 127 kN), the actuator reached its maximum range due to equipment limitations, resulting in a mid-span deflection of 117 mm, at which point the test was terminated.
The HBCB specimen did not exhibit significant mid-span section torsion or lateral shifting. Minor displacements were noted at the stiffeners of the upper and lower beams, and the connecting bolts of the composite beam were tilted, indicating longitudinal relative slip. At the end of the test, the mid-span failure mode of the HBCB specimen is shown in Figure 5a, while the overall lateral deformation and deflection after unloading are presented in Figure 5b,c.
That suggests the lateral-torsional buckling of the specimens occurred in which the upper and lower beams worked together (see Figure 5). No local buckling was found in the test.
3.1.2. HBCB Specimen
In the initial loading phase, the specimen remained in the elastic stage. As loading continued, when the displacement reached 20 mm (load of 84 kN), the rate of increase in bearing capacity began to slow. Real-time data from displacement meters D1, D2, and D3 showed that the mid-span section of the specimen tilted. When the displacement increased to 25 mm (load of 89 kN), a clear and loud sound was heard, and real-time data monitoring from displacement meters D5 and D6 revealed longitudinal relative slip at the stiffeners of the upper and lower beams of the specimen. At this point, the specimen's bearing capacity suddenly dropped to 86 kN. When the displacement loading to 31 mm (load of 93 kN), a second distinct sound occurred, and real-time data from displacement meters D1, D2, and D3 showed that the mid-span section of the specimen tilted strongly, and the bearing capacity dropped to 90 kN. The bearing capacity data continued to rise as loading progressed. The specimen reached its maximum bearing capacity when the displacement reached 47 mm (load of 95 kN). During this phase, the specimen emitted continuous sounds, and data from the displacement meters revealed that with each sound, lateral shifting and longitudinal relative slip occurred at both the upper and lower parts of the composite beam. The displacement was further increased to 110 mm, at which point the bearing capacity was 82 kN, approximately 80% of the peak load. Due to actuator range limitations, the test was terminated, and the mid-span deflection was 106 mm.
During the test, it was observed that a lack of bolt constraints exhibited poorer overall performance. Consequently, significant torsion and lateral shifting occurred at the mid-span section of the upper and lower beams, and substantial longitudinal relative slip was also observed. The final failure mode was independent lateral-torsional buckling for upper and lower beams. The failure mode and local phenomena are shown in Figure 6a, and the overall lateral deformation and deflection after unloading are shown in Figure 6b,c.
In addition to longitudinal relative slip, the two beams (upper and lower beams) underwent a relative transverse slip, as shown in Figure 6, which revealed the lateral movement and torsion of the upper and lower beams are not synchronized. It implied that the lateral-torsional buckling of the upper and lower beams does not develop simultaneously. No local buckling was also found.
3.2. Specimens' Load and Displacement Curves
3.2.1. Load vs. Mid-Span Deflection
Consider the self-weight of the specimen, and the load vs. mid-span deflection is given based on the test data, where the displacement is the average of the differences between the measurement data of displacement meters D4, D7, and D8. Due to insufficient estimation of specimen deflection, the HBCB specimen failed to be loaded to the predetermined end load because the loading actuator reached its limit. Therefore, it has no declining section after the peak value. Figure 7a shows that the HBCB specimen experienced noticeable elastic and elastoplastic stages, and the NCLB specimen underwent three stages from the start of loading to the end of the test: elastic, elastoplastic, and failure.
The critical load (Pcr), maximum load (Pmax), and final load (Pend) corresponding to the three stages of the specimen are shown in Table 4. The data indicate that with the addition of bolt connections, the critical load and maximum load of the HBCB specimen increased by 9.31% and 33.38%, respectively, compared to the NCLB specimen. The bolt assembly effect is significant.
3.2.2. Load vs. Mid-Span Lateral Deformation
The calculation formula for the mid-span lateral deformation at the centroid of the HBCB is Equation (1).
Since there was relative lateral slippage between the upper and lower beams of the NCLB specimen and the real-time data of the relative lateral slippage of the upper and lower beams could not be measured during the test, the accurate lateral displacement of the specimen cannot be calculated. Because the lateral deformation value is an auxiliary index, this study still uses Equation (1) for approximate calculation.
Figure 7b shows the load vs. mid-span lateral deformation of specimens. At lower loads, both specimens exhibited almost no lateral displacement at the mid-span cross-section. However, once the load increased to the critical load (Pcr), lateral displacement at the mid-span cross-section began to occur and gradually increased until lateral-torsional buckling occurred. After buckling, the lateral displacement of the mid-span cross-section grew rapidly while the load-carrying capacity decreased sharply, consistent with the typical characteristics of global instability in flexural members. Due to the limitations of the loading device, the HBCB specimen could not be loaded to its ultimate load capacity, resulting in the absence of a descending curve for lateral displacement at the mid-span. However, this does not affect the identification of its lateral-torsional buckling behavior.
3.2.3. Load vs. Relative Longitudinal Slippage
The calculation formula for the relative longitudinal slippage is Equation (2).
Figure 7c shows that the longitudinal relative slip between the upper and lower beams of the specimen gradually increased with the load. When the load-carrying capacity reached the critical load of the HBCB specimen, the longitudinal relative slip between the upper and lower beams accelerated until the specimen eventually failed due to instability.
In addition, although the longitudinal relative slip of the HBCB specimen was smaller than that of the NCLB specimen, the collaborative performance between the upper and lower beams of the structure was still far from perfect. This indicates that the number of high-strength bolts used in the specimen might be insufficient to effectively restrict the development of longitudinal relative slip between the upper and lower beams, necessitating further research in the future.
3.3. Specimens' Load and Strain Curve
Figure 8 illustrates the load-strain curves for eight strain gauge measurement points located at the mid-span cross-section of the two specimens, with the strain gauge arrangement shown in Figure 4a. Figure shows that at lower load levels, the measured strain data from strain gauges S1, S2, S7, and S8 are symmetric about the neutral axis, and their curves exhibit a linear growth trend. This indicates that the specimens primarily experienced in-plane bending during the initial loading phase.
As the load increased, the curves displayed clear inflection points and deviations, with their symmetry disrupted, indicating that lateral deformation and torsion occurred in the mid-span cross-section alongside bending, both of which intensified with further loading. Furthermore, Figure 8 shows that the compressive strain in the flanges of the specimens exceeded the average yield strain of the steel flanges obtained from material testing (see Table 3), confirming that the specimens had elastoplastic deformation consistent with observed experimental phenomena.
Comparing the load-strain curves at mid-span for the specimens, it was found that strain gauges S5 and S6 of the HBCB specimen remained in a state of low strain (close to the neutral axis) until the final load was reached, whereas S5 and S6 of the NCLB specimen were consistently under compression. This phenomenon demonstrates that the high-strength bolted HBCB specimen behaved as an integrated beam, working as a single unit under load, whereas the non-bolted laminated NCLB specimen functioned with the upper and lower beams independently bearing the load.
4. ABAQUS Analysis Methodology and Validation
The two-point loading tests on the HBCB and NCLB specimens effectively demonstrated the beams' lateral-torsional buckling failure mode, indicating the tests' success. The high-strength bolt-connected hot-rolled H-shape composited beams can be considered a unified beam working together under load, while the upper and lower beams independently load the unbolted pure laminated beam specimens. However, the HBCB specimen still exhibited longitudinal relative slip between the upper and lower beams, indicating that the number of high-strength bolts used in the test was insufficient. Numerical investigations are essential to investigate bolts' influence on the lateral-torsional buckling, load-bearing capacity, deformation, and relative slip of the HBCB. Therefore, this study proposes a reliable numerical analysis method that can be utilized for future investigations involving various parameter variations. The detailed ABAQUS 6.1.4 numerical analysis methodology for model development and verification is outlined below.
4.1. Finite Element Model
4.1.1. Model Component Dimensions
4.1.2. True Stress-Strain Relationship of Steel and Bolts
ABAQUS analysis accounts for material nonlinearity. According to the stress-strain model of steel and bolts shown in Figure 2, the engineering stress and strain listed in Table 3 must be converted into true stress and strain before inputting the material constitutive model into ABAQUS. The conversion method can be found in Reference [18].
4.1.3. Contact Settings
In ABAQUS, contact settings typically involve defining contact surfaces, the type of contact, and the contact properties.
The contact relationships in the specimen HBCB primarily exist between the lower surface of the upper flange of the upper beam and the upper surface of the lower flange of the lower beam, the bolt cap and the flange surface, the bolt shank and the flange hole wall, and the lower surface of the lower flange of the lower beam and the upper surface of the support base plate. The complex contact relationships can lead to difficulties in model convergence and excessively long computation times during analysis. Therefore, to reduce the convergence difficulty and time in finite element analysis, the high-strength bolt model is simplified by replacing the hexagonal bolt cap with a circular bolt cap, and the influence of the bolt threads is ignored. "Surface-to-Surface Contact" is applied between the flange overlap faces, between the bolt cap and the flange surface, and between the lower surface of the lower flange of the lower beam and the upper surface of the support base plate, with interaction properties defined.
For normal behavior, "Hard Contact" is selected in the pressure-overclosure option, with the "Allow Separation" option enabled to prevent penetration between model components. For tangential behavior, Coulomb friction is used to describe the sliding behavior between contact surfaces, with the friction coefficient set to 0.3 according to GB 50017-2017 [17] for "Q235 steel with wire-brushed surfaces to remove rust or untreated clean rolled surfaces." The stiffeners are connected to the flanges and webs of the hot-rolled H-shaped steel beams using fillet welds, with "Tie" constraints applied in the interaction settings.
The bolt contact settings were removed for the specimen NCLB, while other contact settings remained consistent with those of the HBCB specimen.
4.1.4. Boundary Conditions and Load Application
Appropriate boundary conditions and load applications were defined in the numerical model as follows to simulate the experimental setup accurately.
The experiment utilized simple and splint supports (Figure 3), with line-point contact between the angle knife edge and the side of the beam. At the support locations, the specimen ends were allowed to undergo minor rotations around the X-axis (strong axis) and Y-axis (weak axis), as well as longitudinal sliding along the Z-axis (specimen's longitudinal axis) and free warping. However, lateral and vertical displacements along the X-axis and Y-axis were restricted.
In the numerical analysis, these boundary conditions needed to be implemented in the finite element model by applying displacement and rotational degree-of-freedom constraints and support boundary conditions to ensure consistency with the actual experimental setup. Thus, at both ends of the finite element model, UR1=UR2=0.
When applying concentrated loads, reference points RP-1 and RP-2 should be created at the loading points. A "Coupling" constraint should be established within a 3 mm range on either side of the loading points, and the concentrated load should be applied along the Y-axis direction.
During the BUCKLE analysis phase, it is necessary to determine the most unfavorable model of the component, i.e., the first-order buckling mode. Therefore, a unit concentrated force is applied, and the resulting eigenvalue represents the buckling load of the component.
In the nonlinear analysis phase, loading is performed by applying displacement to the component.
An example of specimen HBCB is shown in Figure 9a.
4.1.5. Element and Mesh
For nonlinear buckling analysis, shell elements provide better analysis accuracy compared to solid elements. Therefore, except for the bolts, which are modeled using solid element C3D8R, all other components are modeled using shell element S4R in the ABAQUS model.
Through extensive modeling and analysis, the final mesh sizes selected for the H-beam model are 25mm, for the stiffener model are 10mm, and for the high-strength bolt model are 2mm. Additionally, sections with bolt holes are subdivided, and mesh refinement is applied to these areas to achieve optimal mesh quality. The overall model mesh division is shown in Figure 9b.
4.1.6. Bolt Pre-Tension Force
The bolt pre-load is simulated by defining the bolt load before applying the displacement load. Figure 10 shows the location and direction of the applied bolt pre-load. In the finite element simulation, the middle face of the bolt shank is cut, and the bolt load is applied to this middle face in the axial direction of the bolt shank.
4.1.7. Initial Geometric Imperfections
The initial geometric imperfections (initial bending) are introduced using the "consistent defect mode method." This method utilizes the first-order buckling mode obtained from the BUCKLE analysis as the most critical mode. The node coordinates are adjusted according to this mode and scaled by a specified defect coefficient. According to GB 50017-2017 [17], the initial bending is set to one-thousandth of the component's span. In ABAQUS, these imperfections are incorporated using the "*IMPERFECTION" command.
4.1.8. Residual Stress
The residual stress distribution for hot-rolled H-shapes was given by ECCS [19], as shown in Figure 11a. Here, σrc represents residual compressive stress, and σrt represents residual tensile stress, with σrc = -σrt = 0.3fy, fy is the steel's yield strength, using σy in Table 3. It is assumed that the local bolt holes do not alter the distribution of residual stresses. These residual stresses are combined to obtain the residual stress distribution for the HBCB, shown in Figure 11b. In ABAQUS, a predefined field is created in the load module, selecting "stress" and the field area according to the residual stress distribution and introducing the residual stress as the initial stress in the model.
4.2. Finite Element Verification
4.2.1. Comparison of Failure Modes
The modeling and analysis of the HBCB and NCLB specimens were performed following the method in Section 4.1. The finite element simulation failure modes obtained are shown in Figure 12a and Figure 13a. When compared with the experimental failure modes shown in Figure 12b and Figure 13b, it is observed that the FE failure modes are highly similar to the experiments.
4.2.2. Comparison of Load-Deformation Curves
Figure 14 and Figure 15 show the load-deformation curves, load-midspan deflection curves, load-midspan lateral displacement curves, and load-longitudinal slip curves for the HBCB and NCLB specimens.
By comparing Figure 14 and Figure 15, it can be observed that the ABAQUS simulation analysis performs well for the bolted HBCB specimens, with the curve trends closely matching the experimental results. The simulation aligns well with the experiments before lateral-torsional buckling occurs for the boltless NCLB specimens but shows larger deviations in the post-buckling (elastic-plastic) stage. The specimens' critical load (corresponding to elastic lateral-torsional buckling), peak load, and ultimate load (corresponding to the test end) are extracted and listed in Table 4. The error between the critical loads obtained from the ABAQUS analysis and the experimental values is less than 9%, with the error for the peak loads being less than 3%. For the relatively complex composite beams with high-strength bolts discussed in this paper, focusing on the lateral-torsional buckling of the beam, both experimental and numerical simulation approaches are highly challenging. However, the current error magnitude is within an acceptable range.
These results demonstrate the reliability and validity of the ABAQUS simulation method used in this study, making it a suitable tool for further research on HBCB specimens.
5. Analysis of the Influence of High-Strength Bolt
The influence of bolts on the structural performance of specimens is a critical aspect of this study. For bolted HBCB specimens, the bolts significantly enhance the stability and overall behavior under load, as evidenced by the closer agreement between ABAQUS simulation results and experimental data. The presence of bolts delays lateral-torsional buckling, resulting in higher critical and peak loads compared to boltless NCLB specimens.
All specimens are modeled based on the experimental HBCB specimen as the prototype, with the same Q235 steel and 8.8 M12 grade high-strength bolt specifications remaining unchanged, while only pre-tension forces and bolt spacings are varied.
5.1. The Influence of High-Strength Bolt Pre-Loadings
Due to potential improper operations during the actual assembly of composite beams, the pre-tension force applied to high-strength bolts may deviate from the values specified in the standards. To investigate the effect of bolt pre-tension on the load-bearing capacity of H-shaped steel composite beams, the degree of pre-tension force is described as cd = Nr / Ns, representing the deviation between the actual pre-tension force and the standard requirement. Nr is the actual applied pre-loading (kN), and Ns is the required pre-loading (kN) according to GB50017-2017 [17].
High-strength bolts of type M12-8.8 were selected, with a bolt spacing of L/10. A finite element model was established with designed pre-loading application degrees of 0.6, 1.0, and 1.4, corresponding to cases of insufficient, standard, and excessive pre-tension, respectively, in practical engineering. Figure 16a shows the load-midspan deflection curves of the composite beams, while Figure 16b illustrates the load-longitudinal relative slip curves.
Figure 16 shows that the slope of the curves in the elastic stage and the elastic-plastic ultimate load increase with the degree of bolt pre-tension force. However, during the failure stage, the overall deformation of the composite beam decreases as the bolt pre-tension force increases. This indicates that higher bolt pre-tension force improves the composite beam's overall stiffness and load-bearing capacity.
According to Table 5, when the actual pre-tension force of M12-8.8 high-strength bolts decreases from 38.5 kN to 23.1 kN, the maximum load-bearing capacity of the composite beam reduces by 1.50%, and the maximum longitudinal slip (udmax) increases by 5.96%. Conversely, when the pre-tension force increases from 38.5 kN to 53.9 kN, the maximum load-bearing capacity rises by 3.20%, and the maximum longitudinal relative slip (udmax) decreases by 4.04%.
The comparison indicates that the degree of pre-tension force can enhance the composite beam's ultimate load-bearing capacity and longitudinal slip resistance, though the influence is not significant.
5.2. The Influence of High-Strength Bolt Spacings
In order to further investigate the influence of high-strength bolt spacings, this paper analyzes the different bolt spacings carried out to establish eight bolt spacings of L, L/2, L/4, L/5, L/8, L/10, L/15, L/16, and T, where L represents the length of the member, T represents the connects the spliced topper and lower beams with plug welds at the bolt holes to replace the high-strength bolts. All specimens are modeled based on the experimental HBCB specimen as the prototype, with the same Q235 steel and 8.8 M12 grade high-strength bolt specifications remaining unchanged, while only the bolt spacing arrangement is varied.
Figure 16 shows that as the bolt spacing decreases ( equivalent to increasing the number of bolts), the load-bearing capacity of the specimen improves, and longitudinal relative slip is suppressed.
The data in Table 6 shows that when the bolt spacing is reduced from L/10 to L/15, the maximum load changes by only +0.37%. Similarly, reducing the spacing from L/10 to L/16 results in an increase of just +0.76% in maximum load. Moreover, the maximum load for a spacing of L/10 is 93% of the corresponding welded connection, and for L/16, it is 93.7%. This indicates that when the bolt spacing is reduced to 1/10 of the span, further reduction in spacing has a negligible effect on improving the load-bearing capacity. However, the data in Table 6 also shows that when the bolt spacing is reduced from L/10 to L/15, the maximum longitudinal slip decreases by 21.5%. When the spacing is further reduced from L/15 to L/16, the reduction in maximum longitudinal slip is only 3.4%. Balancing load-bearing capacity and reducing longitudinal slip, the current data suggests that the optimal bolt spacing is L/15. While this spacing reduces the relative longitudinal slip between the upper and lower beams, it does not achieve the same performance as welding. Further research is needed to explore ways to minimize longitudinal slip and enhance the load-bearing capacity of HBCBs.
6. Conclusions
Based on the findings from experimental and numerical analyses, the following conclusions can be drawn:
- The proposed Low-Carbon H-shape bolted-composited beams (HBCBs) demonstrated reliable lateral-torsional buckling behavior, validated through experimental and numerical investigations.
- High-strength bolt connections significantly enhanced the stability and load-bearing capacity of the beams compared to boltless laminated counterparts.
- Bolt spacing critically influences performance when the bolt spacing exceeds 1/15 of the beam span. At a spacing of L/15, the load-bearing capacity of HBCBs reached approximately 93.3% of that of beams with plug-weld connections.
- High-strength bolts reduced longitudinal slip effectively, but they did not fully replicate the performance of welded connections. Further research is necessary to optimize bolt arrangements and reduce longitudinal slips to enhance the overall mechanical performance of HBCBs.
Author Contributions
Conceptualization, L.L.; investigation. K.K.D, B.L, H.H; validation, B.L, H.Z, H.H; resources, L.L.; writing—original draft preparation, K.KD, L.L B.L, Z.H, and H.H.; writing—review and editing, L.L., B.L, and Z.H; project administration, L.L.; funding acquisition, L.L. All authors have read and agreed to the published version of the manuscript.
Data Availability Statement
The original contributions presented in the study are included in the article; further inquiries can be directed to the corresponding author.
Conflicts of Interest
The authors declare that they have no conflicts of interest.
References
- Gan, V.; Wong, C.; Tse, K.; Chen, J.; Lo, I.; Chan, C. Parametric modelling and evolutionary optimization for cost-optimal and low-carbon design of high-rise reinforced concrete buildings. Advanced Engineering Informatics. 2019, 42, 100962. [Google Scholar] [CrossRef]
- You, J.; Xu, X.; Wang, Y.; Xiang, X.; Luo, Y. Life cycle carbon emission assessment of large-span steel structures: A case study. Structures, 2023, 52, 842–853. [Google Scholar] [CrossRef]
- BS EN 15978:2011; Sustainability of Construction Works-Assessment of Environmental Performance of Buildings-Calculation Method. British Standards Institute, London, UK, 2011.
- Li, Q.; Yue, Q. Feng, P. ; Xie, N.; Liu, Y. Development Status and Prospect of Steel Structure Industry Based on Carbon Peak and Carbon Neutrality Target. Progress in Steel Building Structures. 2022, 24, 1–6. [Google Scholar]
- Dani, A.; Roy, K.; Masood, R.; Fang, Z.; Lim, J. A comparative study on the life cycle assessment of New Zealand residential buildings. Buildings 2022, 12, 50. [Google Scholar] [CrossRef]
- Hart, J.; D'Amico, B.; Pomponi, F. Whole-life embodied carbon in multistory buildings: Steel, concrete and timber structures. Journal of Industrial Ecology. 2021, 25, 403–418. [Google Scholar] [CrossRef]
- Mostafavi, F.; Tahsildoost, M.; Zomorodian, Z.S. Energy efficiency and carbon emission in high-rise buildings: A review (2005-2020). Building and Environment. 2021, 206, 108329. [Google Scholar] [CrossRef]
- Huang, Z.; Zhou, H.; Tang, H.; Zhao, Y.; Lin, B. Carbon emissions of prefabricated steel structure components: A case study in China. Journal of Cleaner Production. 2023, 406, 137047. [Google Scholar] [CrossRef]
- Roy, K.; Dani, A.A.; Ichhpuni, H.; Fang, Z.; Lim, J.B.P. Improving sustainability of steel roofs: life cycle assessment of a case study roof. Applied Sciences. 2022, 12, 5943. [Google Scholar] [CrossRef]
- Lu, L.; Wang, D.; Dai, Z.; Luo, T.; Ding, S.; Hao, H. Global Buckling Investigation of the Flanged Cruciform H-shapes Columns (FCHCs). Applied Sciences. 2021, 11, 11458. [Google Scholar] [CrossRef]
- Nie, W.; Lu, L.; Li, R.; Hao, H.; Luo, T. Global buckling investigation of T-shaped built-up columns composed of two hot-rolled H-shapes. Structures, 2023, 58, 105485. [Google Scholar] [CrossRef]
- Lin, X.; Okazaki, T.; Chung, Y. L.; Nakashima, M. Flexural performance of bolted built-up columns constructed of H-SA700 steel. Journal of Constructional Steel Research. 2013, 82, 48–58. [Google Scholar] [CrossRef]
- Zhu, Y.; Zhao, J. Experimental and analytical studies on bearing capacity of bolt connected composite plate girders. International Journal of Steel Structures, 2017, 17, 1317–1329. [Google Scholar] [CrossRef]
- Xu, B.; Xia, J.; Chang, H.; Ma, R.; Zhang, L. Flexural behaviour of pairs of laminated unequal channel beams with different interfacial connections in corner-supported modular steel buildings. Thin-Walled Structures. 2020, 154, 106792. [Google Scholar] [CrossRef]
- Xu, B.; Xia, J.; Ma, R.; Chang, H.; Yang, C.; Zhang, L. Investigation on interfacial slipping response of laminated channel beams with bolt connections in modular steel buildings. Journal of Building Engineering. 2023, 63, 105441. [Google Scholar] [CrossRef]
- Xu, B.; Xia, J.; Chang, H.; Chen, X.; Yang, C.; Zhang, L. Numerical-analytical investigation on bending performance of laminated beams in modular steel buildings. Journal of Constructional Steel Research. 2024, 217, 108630. [Google Scholar] [CrossRef]
- GB 50017-2017; Standard for design of steel structures. China Architecture & Building Press, Beijing, China, 2017.
- Xin, H.; Veljkovic, M. Evaluation of high strength steels fracture based on uniaxial stress-strain curves. Engineering Failure Analysis. 2021, 120, 105025. [Google Scholar] [CrossRef]
- ECCS. Ultimate limit state calculation of sway framed with rigid joints. Technical Committee 8 (TC 8) of European Convention for Constructional Steelwork (ECCS). Tech. Rep. 1984, 33.
Figure 1.
Cross-sectional configurations and dimensional symbols of an HBCB specimen. (a) Cross-section; (b) Top view.
Figure 1.
Cross-sectional configurations and dimensional symbols of an HBCB specimen. (a) Cross-section; (b) Top view.
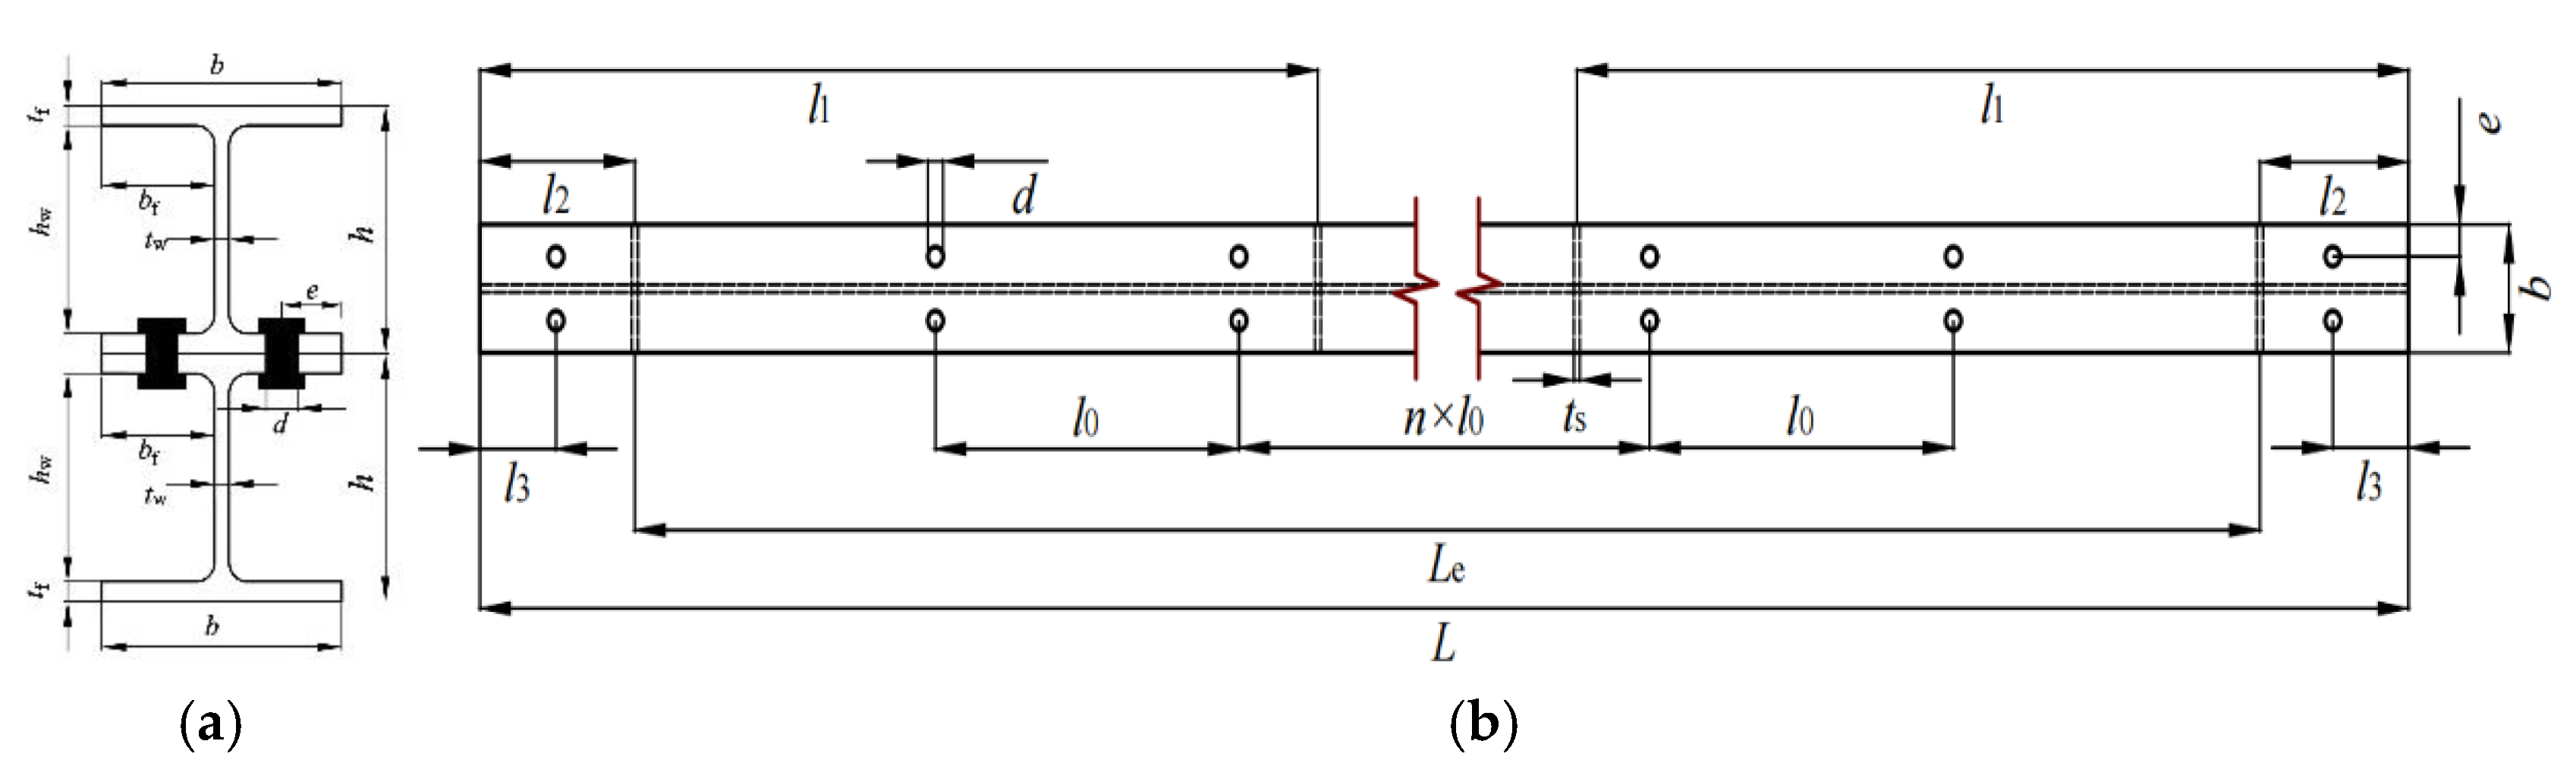
Figure 2.
Three-line stress-strain relationship curve.
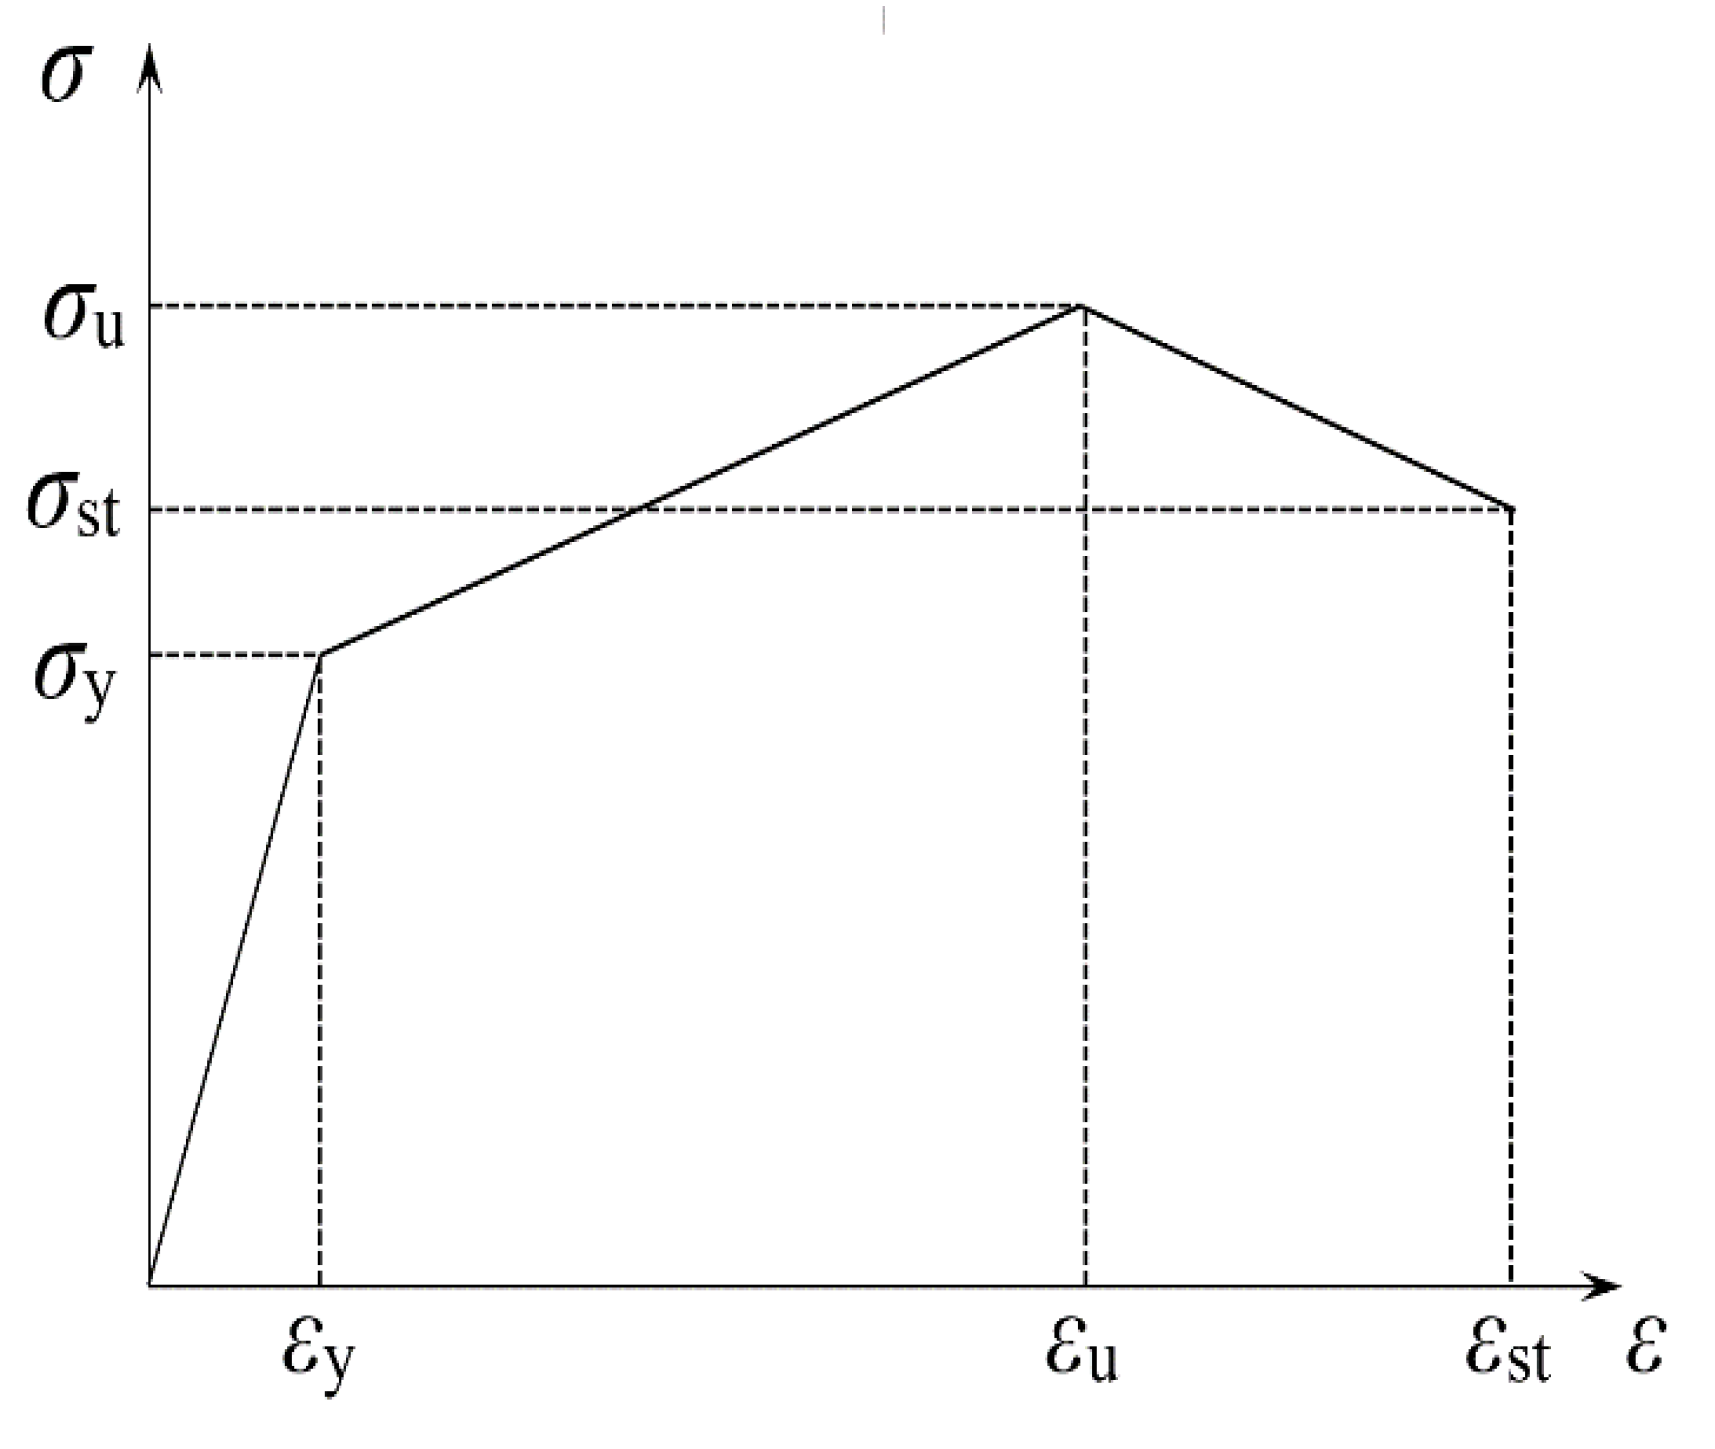
Figure 3.
Photo of the test setup on site. (a)Test setup; (b) Beam end support.
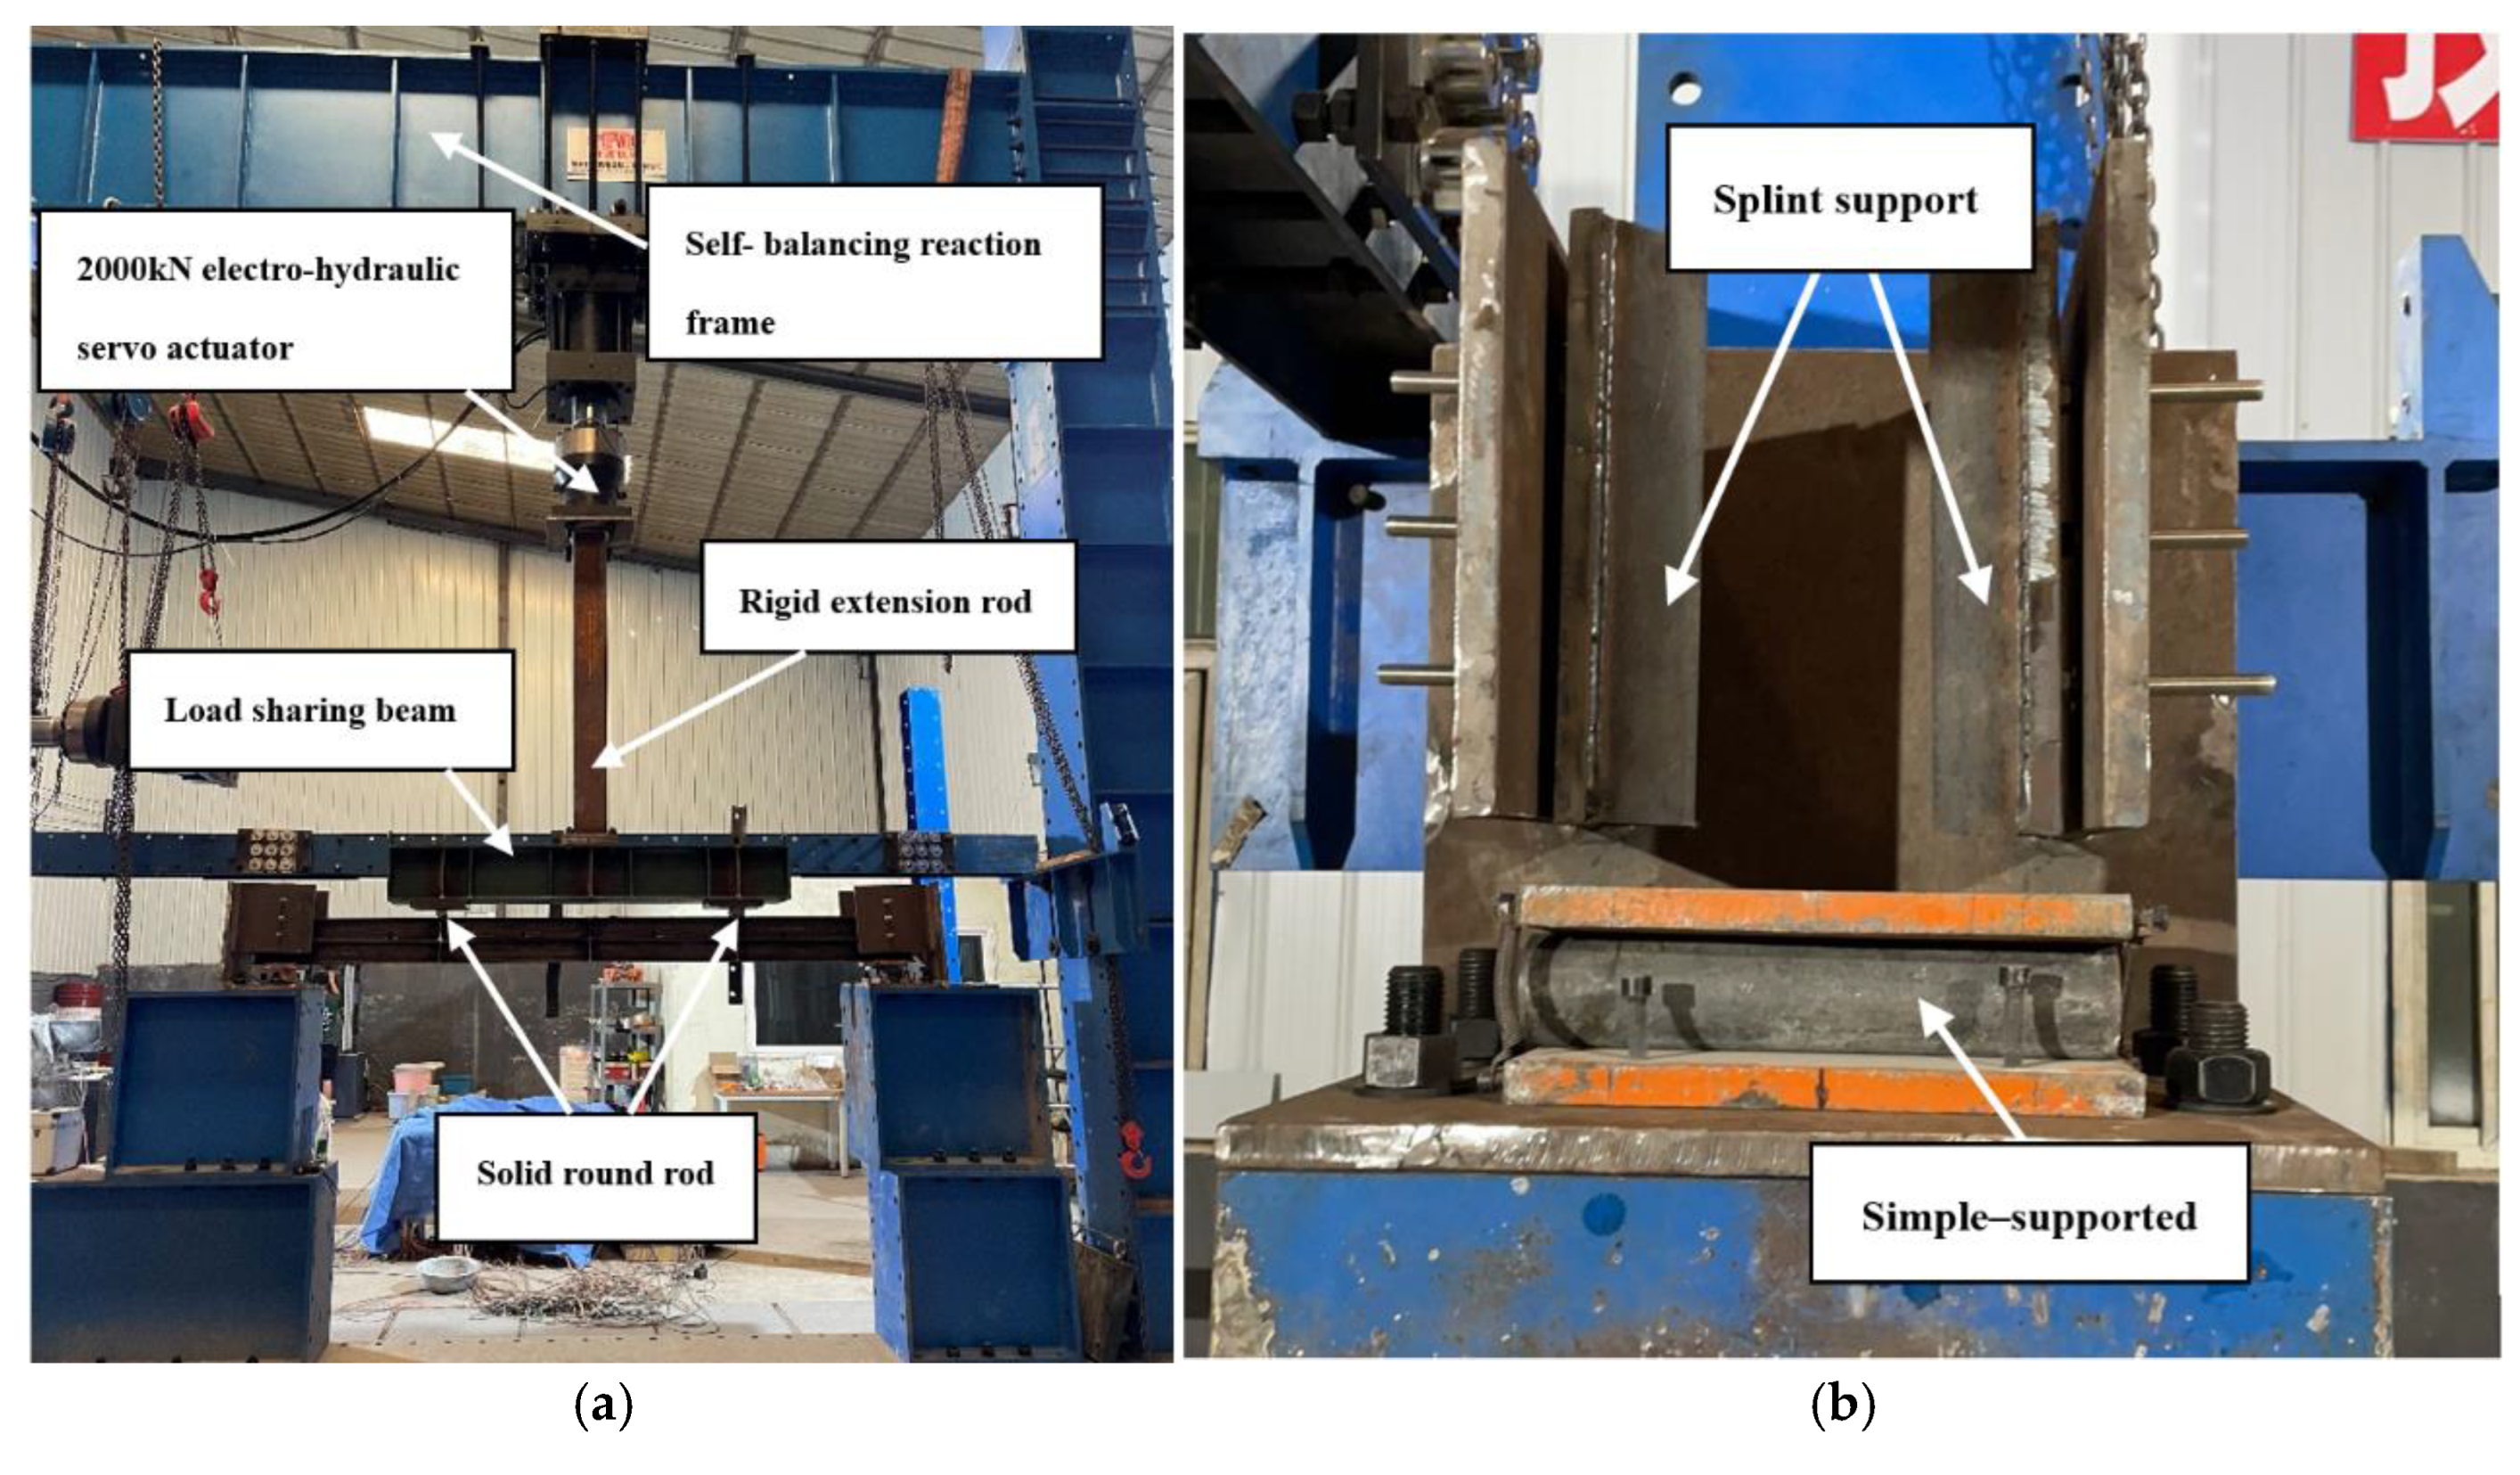
Figure 4.
Photo of the test setup on site. (a)Test setup; (b) Beam end support.
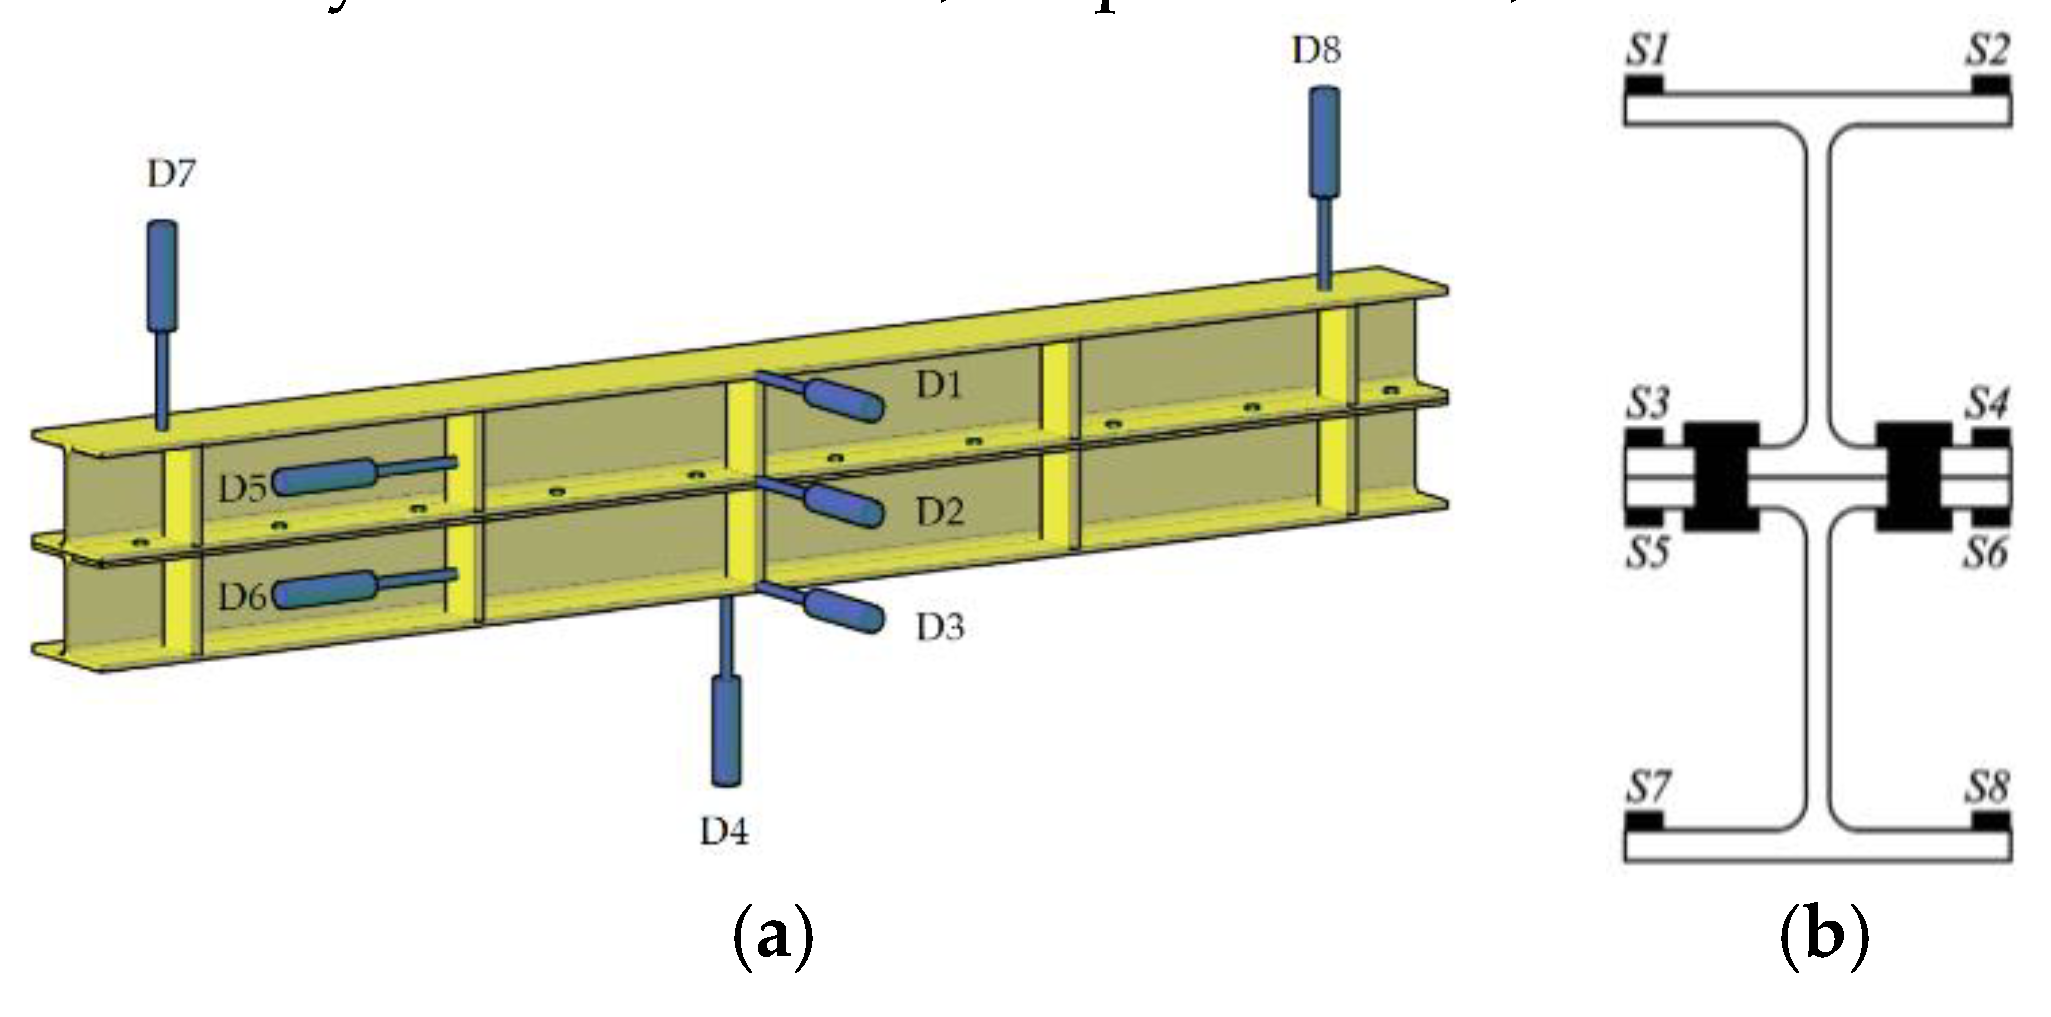
Figure 5.
The failure modes of HBCB specimen. (a) Lateral-torsional buckling and longitudinal slippage; (b) Residual plastic deformation out of the plane; (c) Residual plastic deformation in the plane.
Figure 5.
The failure modes of HBCB specimen. (a) Lateral-torsional buckling and longitudinal slippage; (b) Residual plastic deformation out of the plane; (c) Residual plastic deformation in the plane.
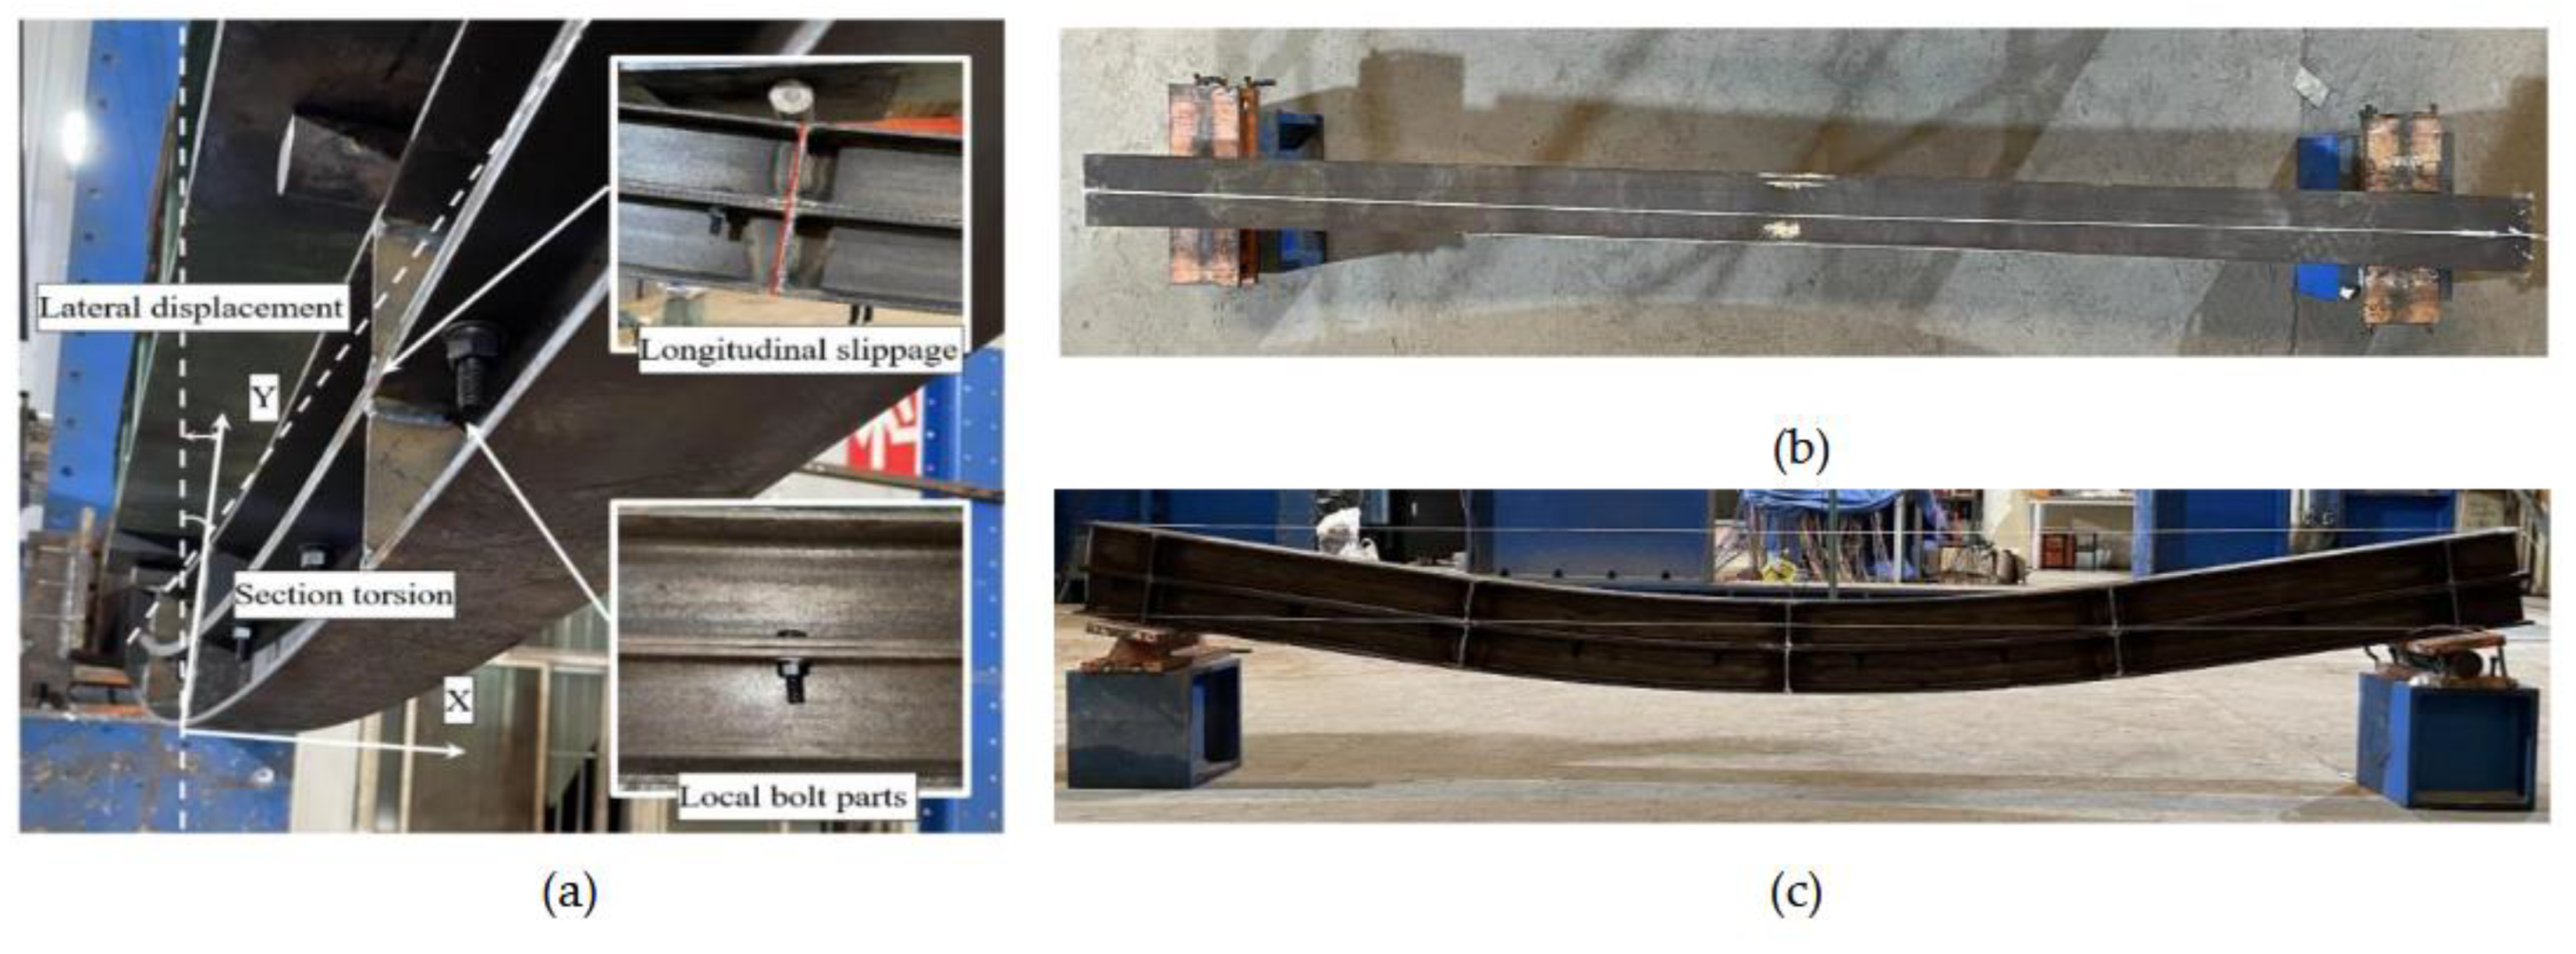
Figure 6.
The failure modes of NCLB specimen. (a) Lateral-torsional buckling and longitudinal slippage; (b) Residual plastic deformation out of the plane; (c) Residual plastic deformation in the plane.
Figure 6.
The failure modes of NCLB specimen. (a) Lateral-torsional buckling and longitudinal slippage; (b) Residual plastic deformation out of the plane; (c) Residual plastic deformation in the plane.
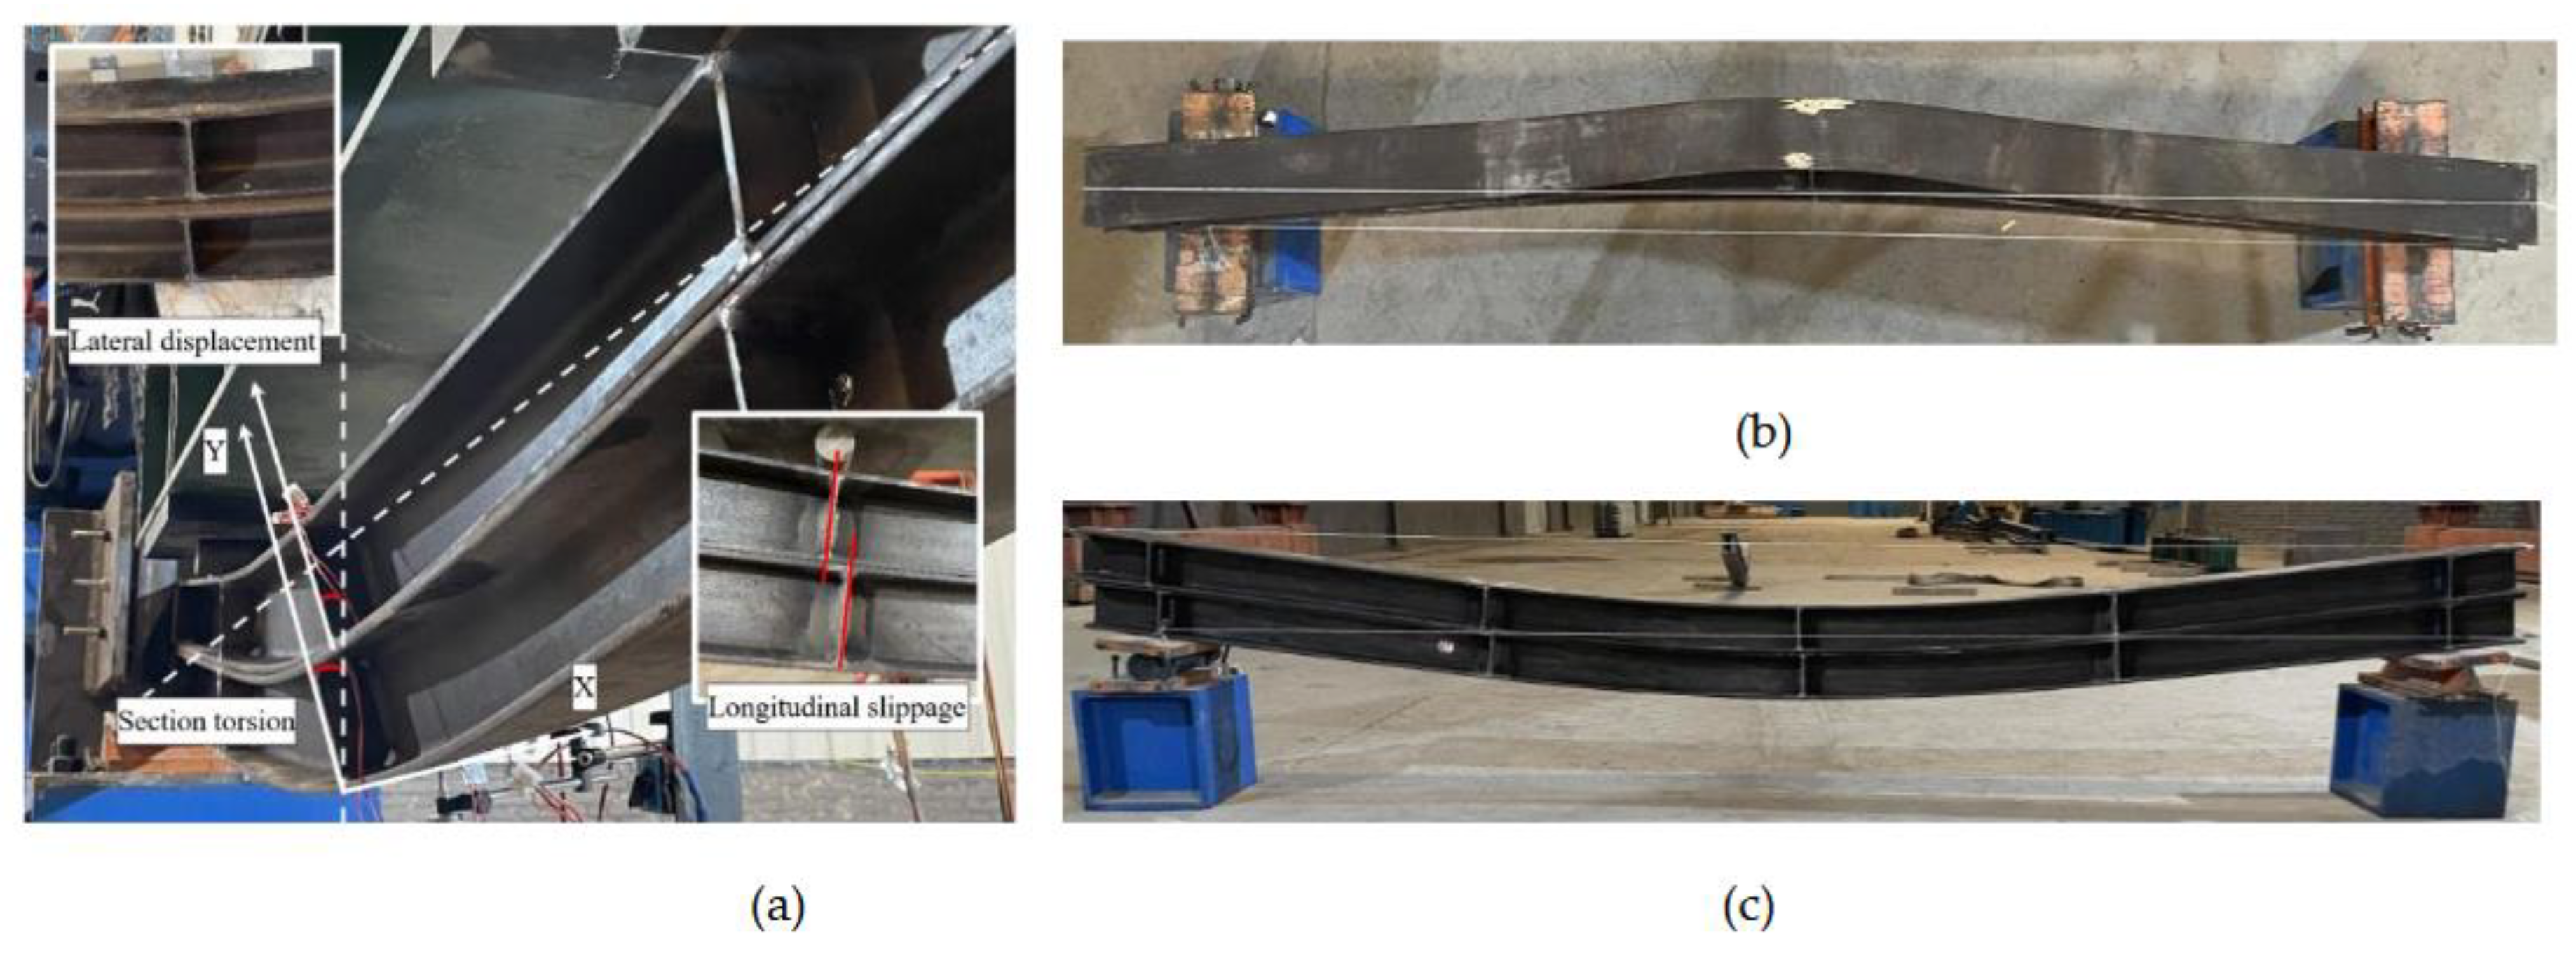
Figure 7.
Specimens' load and displacement curves. (a) Curves of load-deflection; (b) Curves of load-lateral deformation; (c) Curves of load-longitudinal slippage.
Figure 7.
Specimens' load and displacement curves. (a) Curves of load-deflection; (b) Curves of load-lateral deformation; (c) Curves of load-longitudinal slippage.
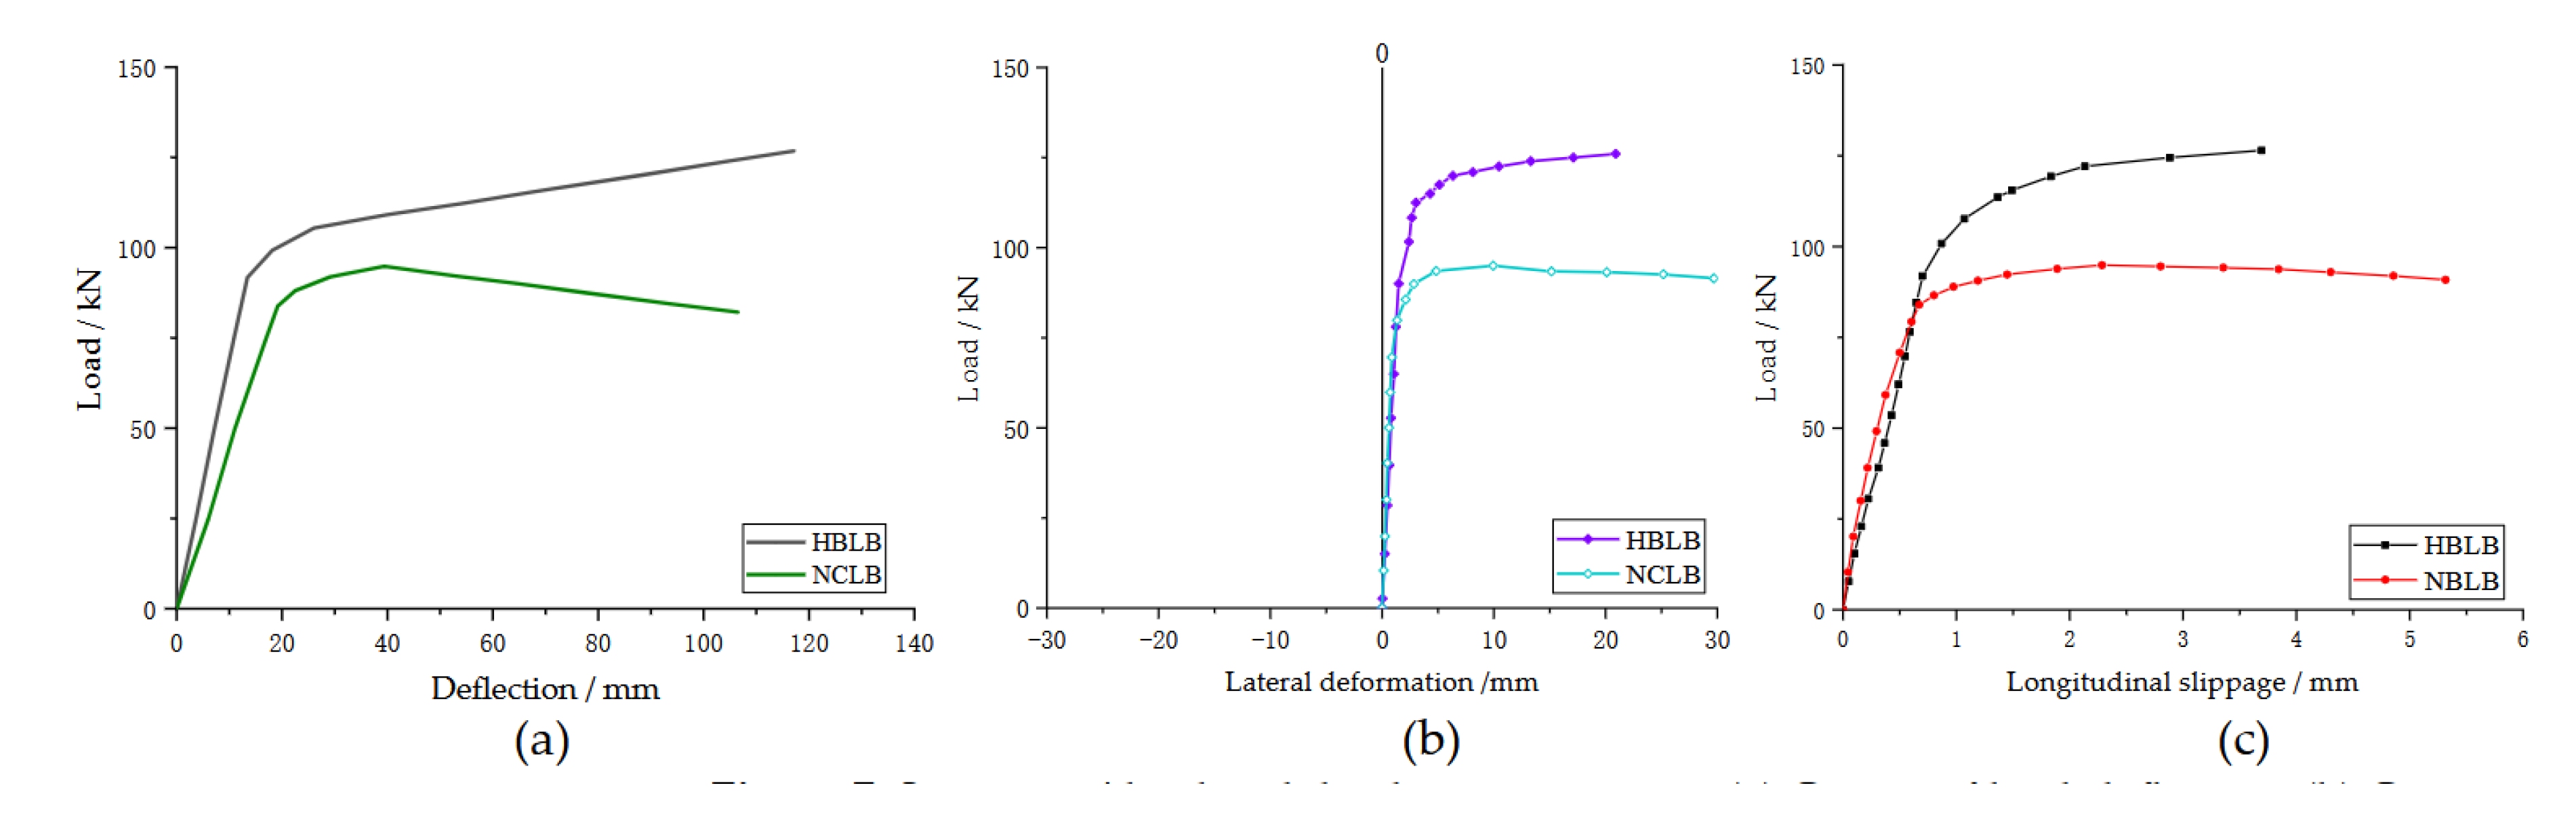
Figure 8.
Specimens' load and strain curves. (a) Specimen HBCB; (b) Specimen NCLB.
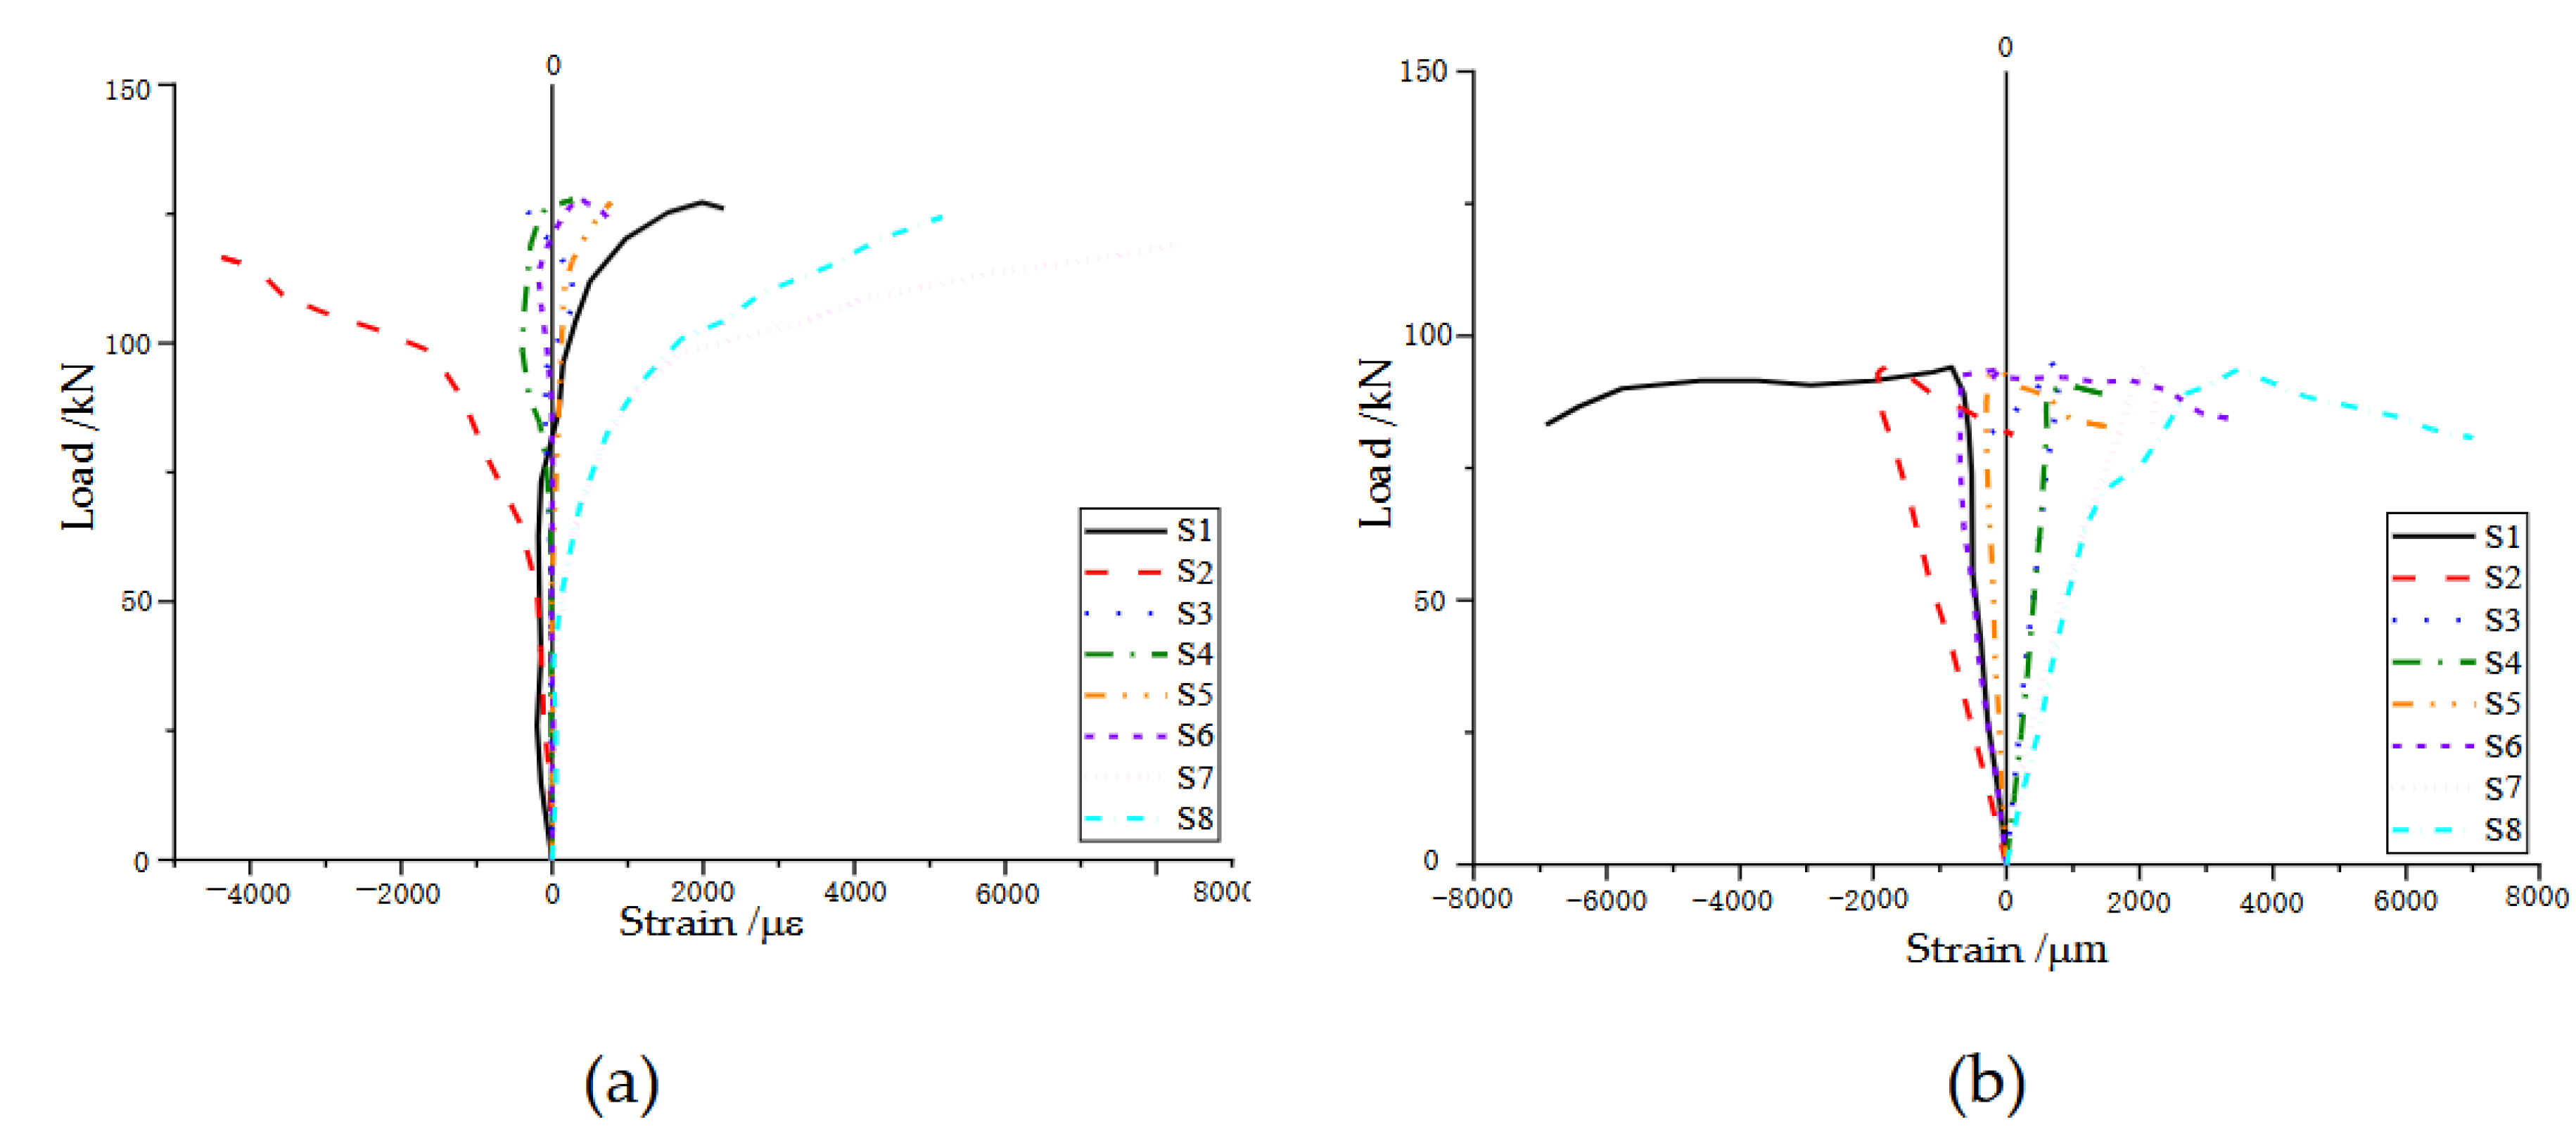
Figure 9.
Finite element model of specimen HBCB. (a) Boundary condition; (b) Elemnet and mesh.
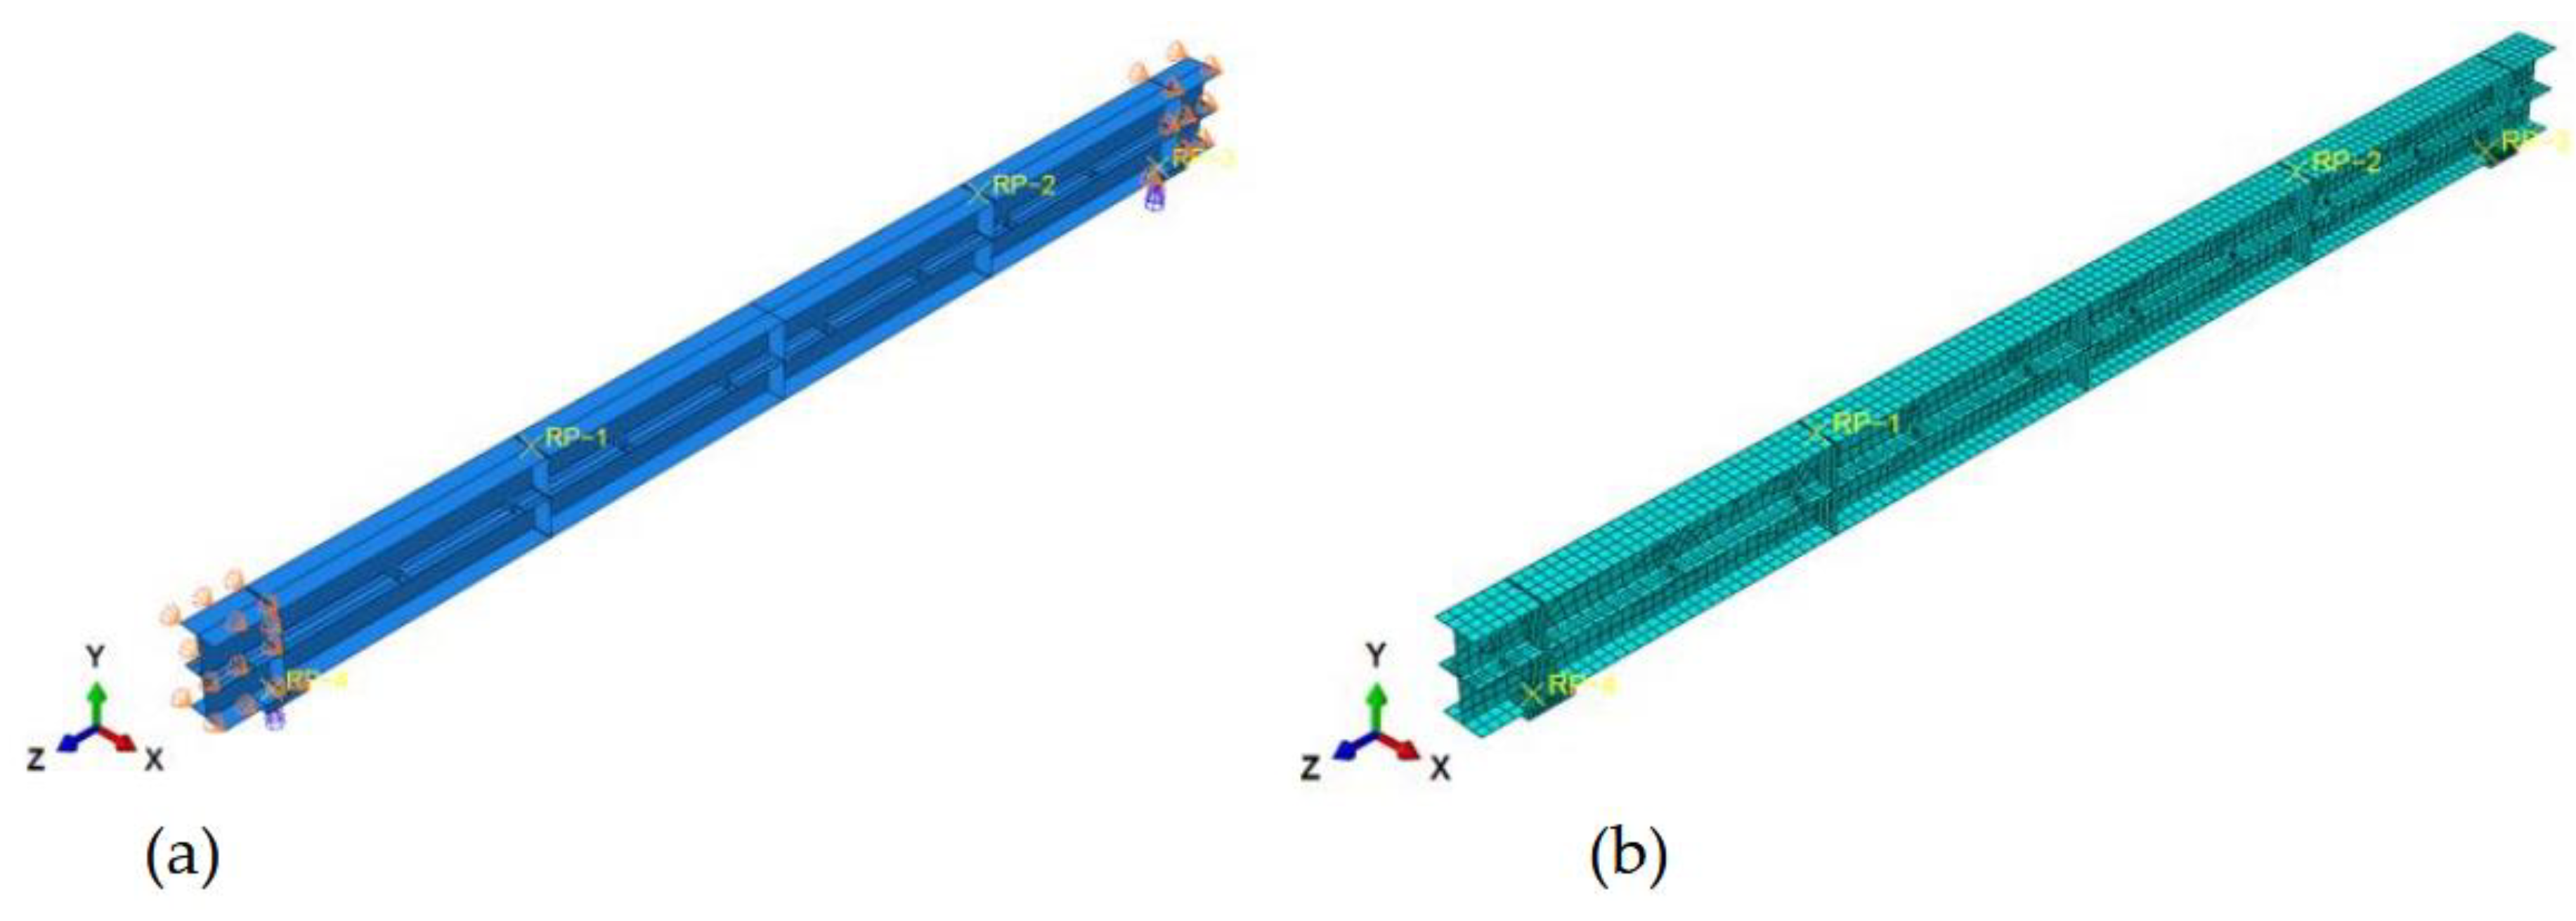
Figure 10.
Addition of bolt pre-load in finite element modeling.
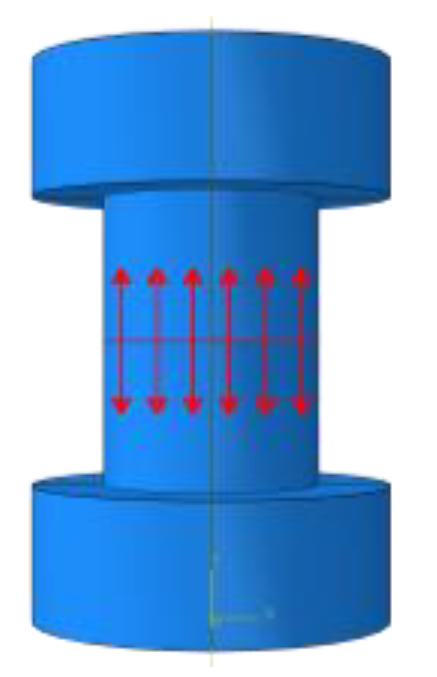
Figure 11.
Residual stress distribution. (a) Residual stress distribution of an H-beam; (b) Residual stress distribution of an HBCB and NCLB.
Figure 11.
Residual stress distribution. (a) Residual stress distribution of an H-beam; (b) Residual stress distribution of an HBCB and NCLB.

Figure 12.
Comparison of failure modes of HBCB specimen. (a) ABAQUS analysis; (b) Experiment.
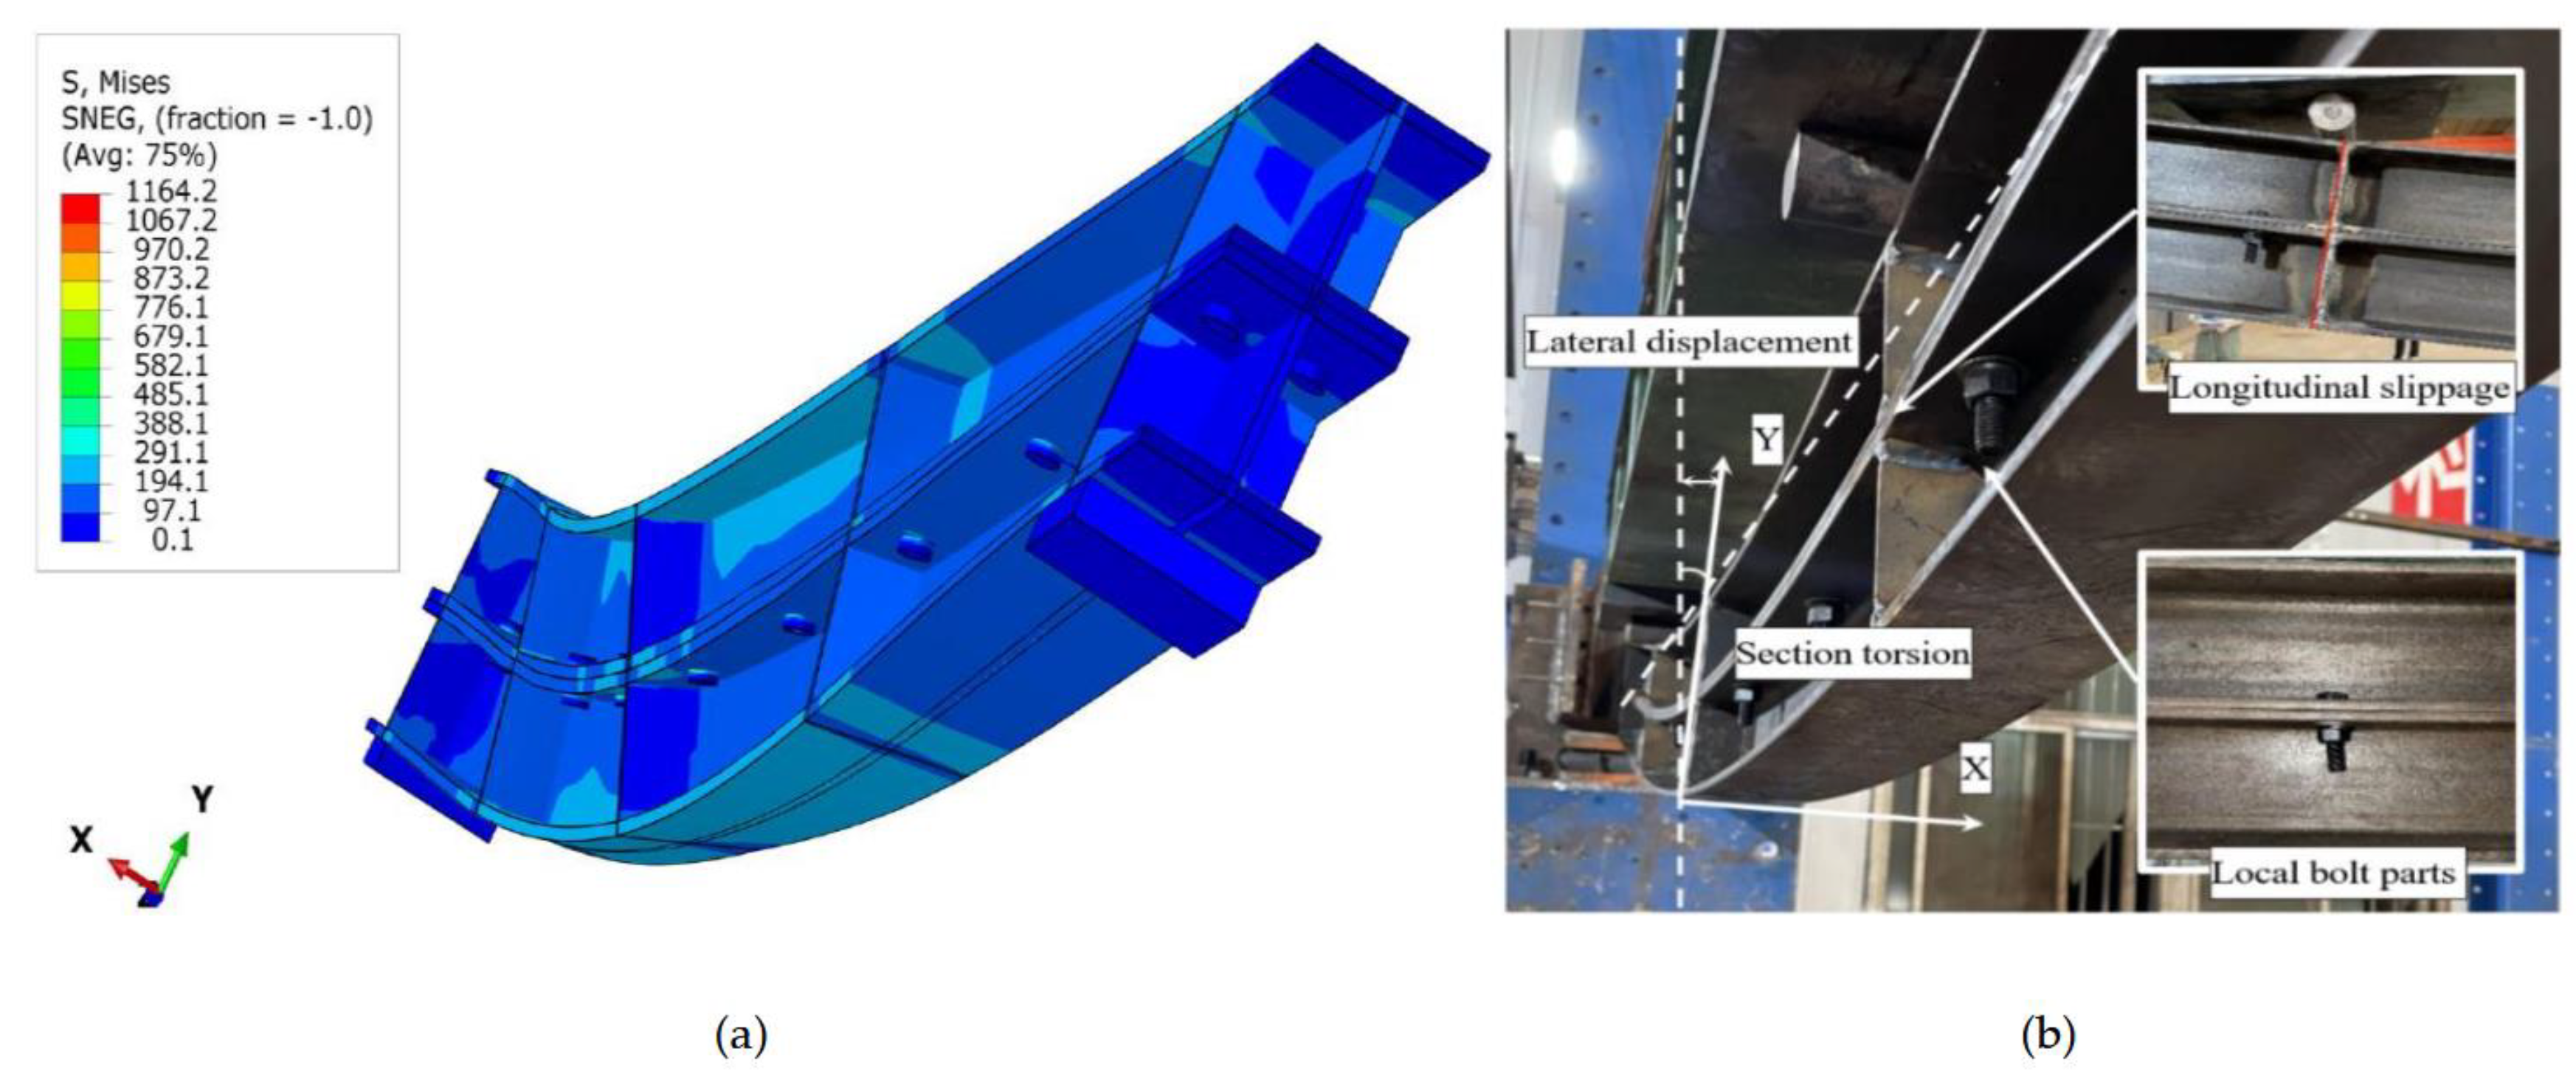
Figure 13.
Comparison of failure modes of NCLB specimen. (a) ABAQUS analysis; (b) Experiment.
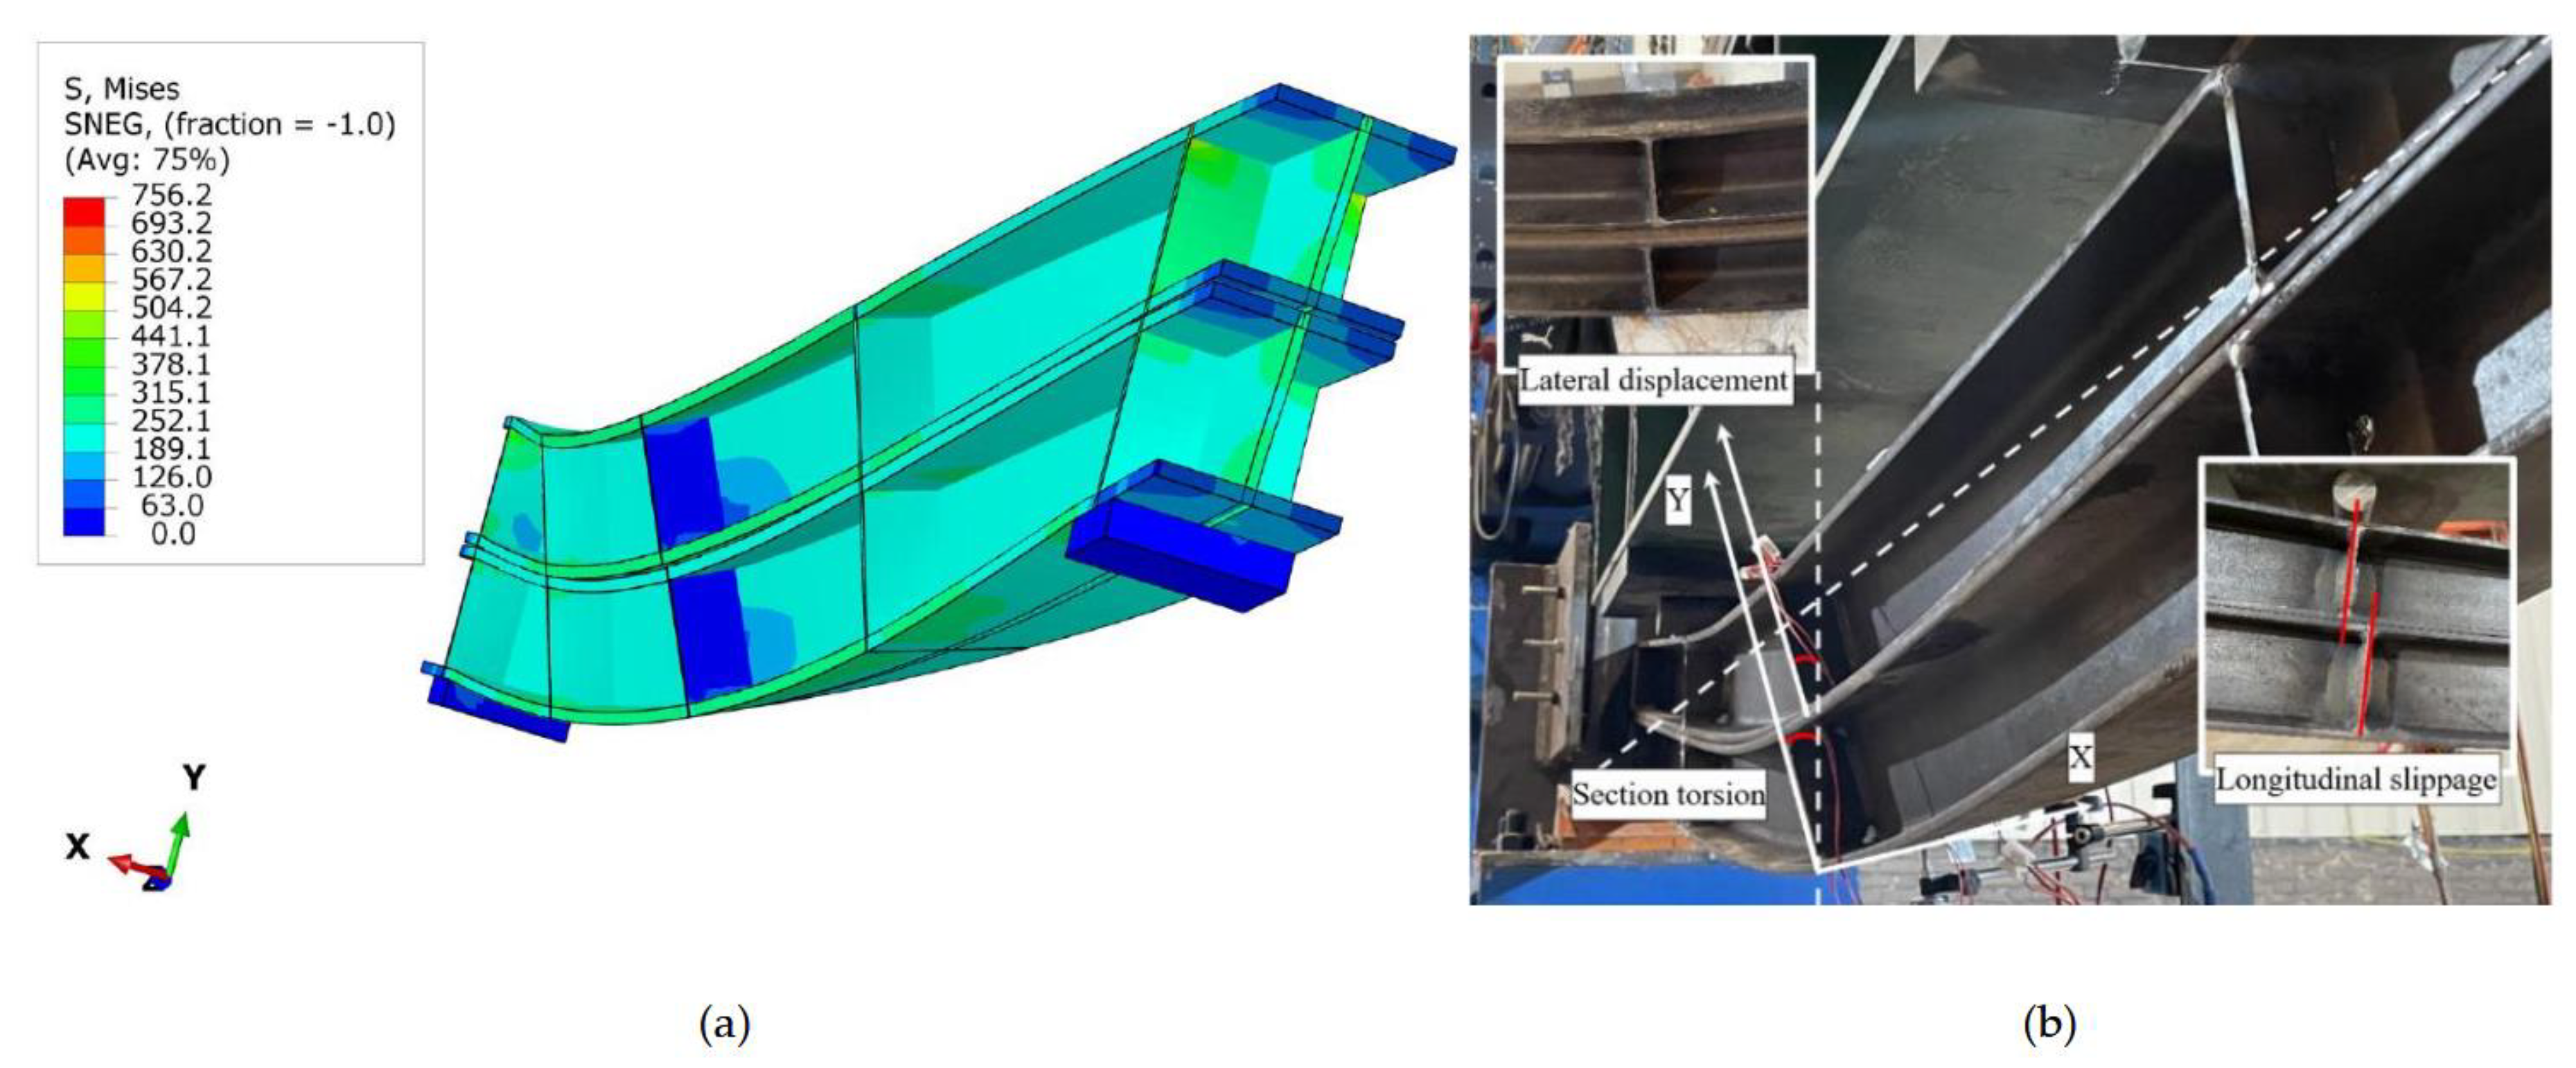
Figure 14.
Comparison of load-deformation curves of HBCB specimen. (a) Load-midspan deflection; (b) Load-midspan lateral displacement; (c) Load-longitudinal slip.
Figure 14.
Comparison of load-deformation curves of HBCB specimen. (a) Load-midspan deflection; (b) Load-midspan lateral displacement; (c) Load-longitudinal slip.
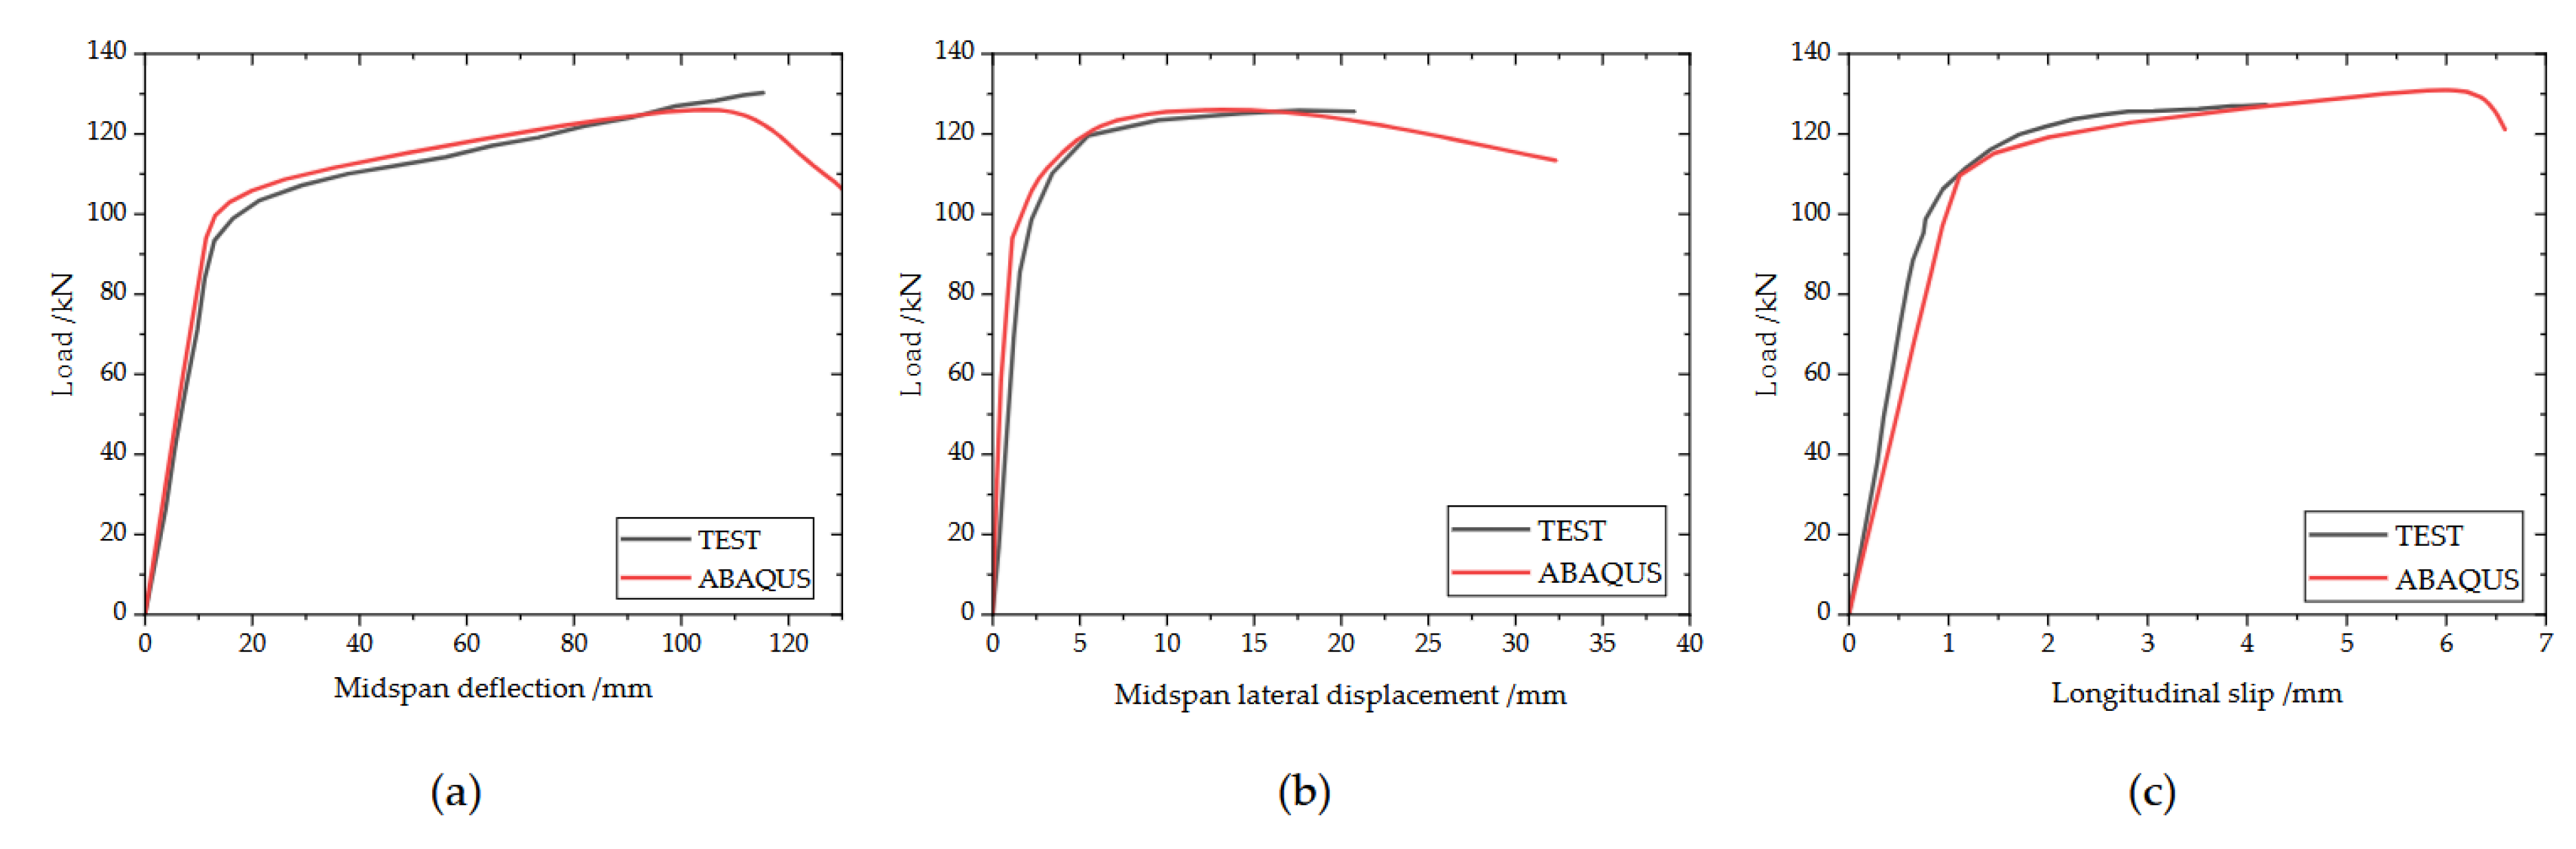
Figure 15.
Comparison of load-deformation curves of NCLB specimen. (a) Load-midspan deflection; (b) Load-midspan lateral displacement; (c) Load-longitudinal slip.
Figure 15.
Comparison of load-deformation curves of NCLB specimen. (a) Load-midspan deflection; (b) Load-midspan lateral displacement; (c) Load-longitudinal slip.
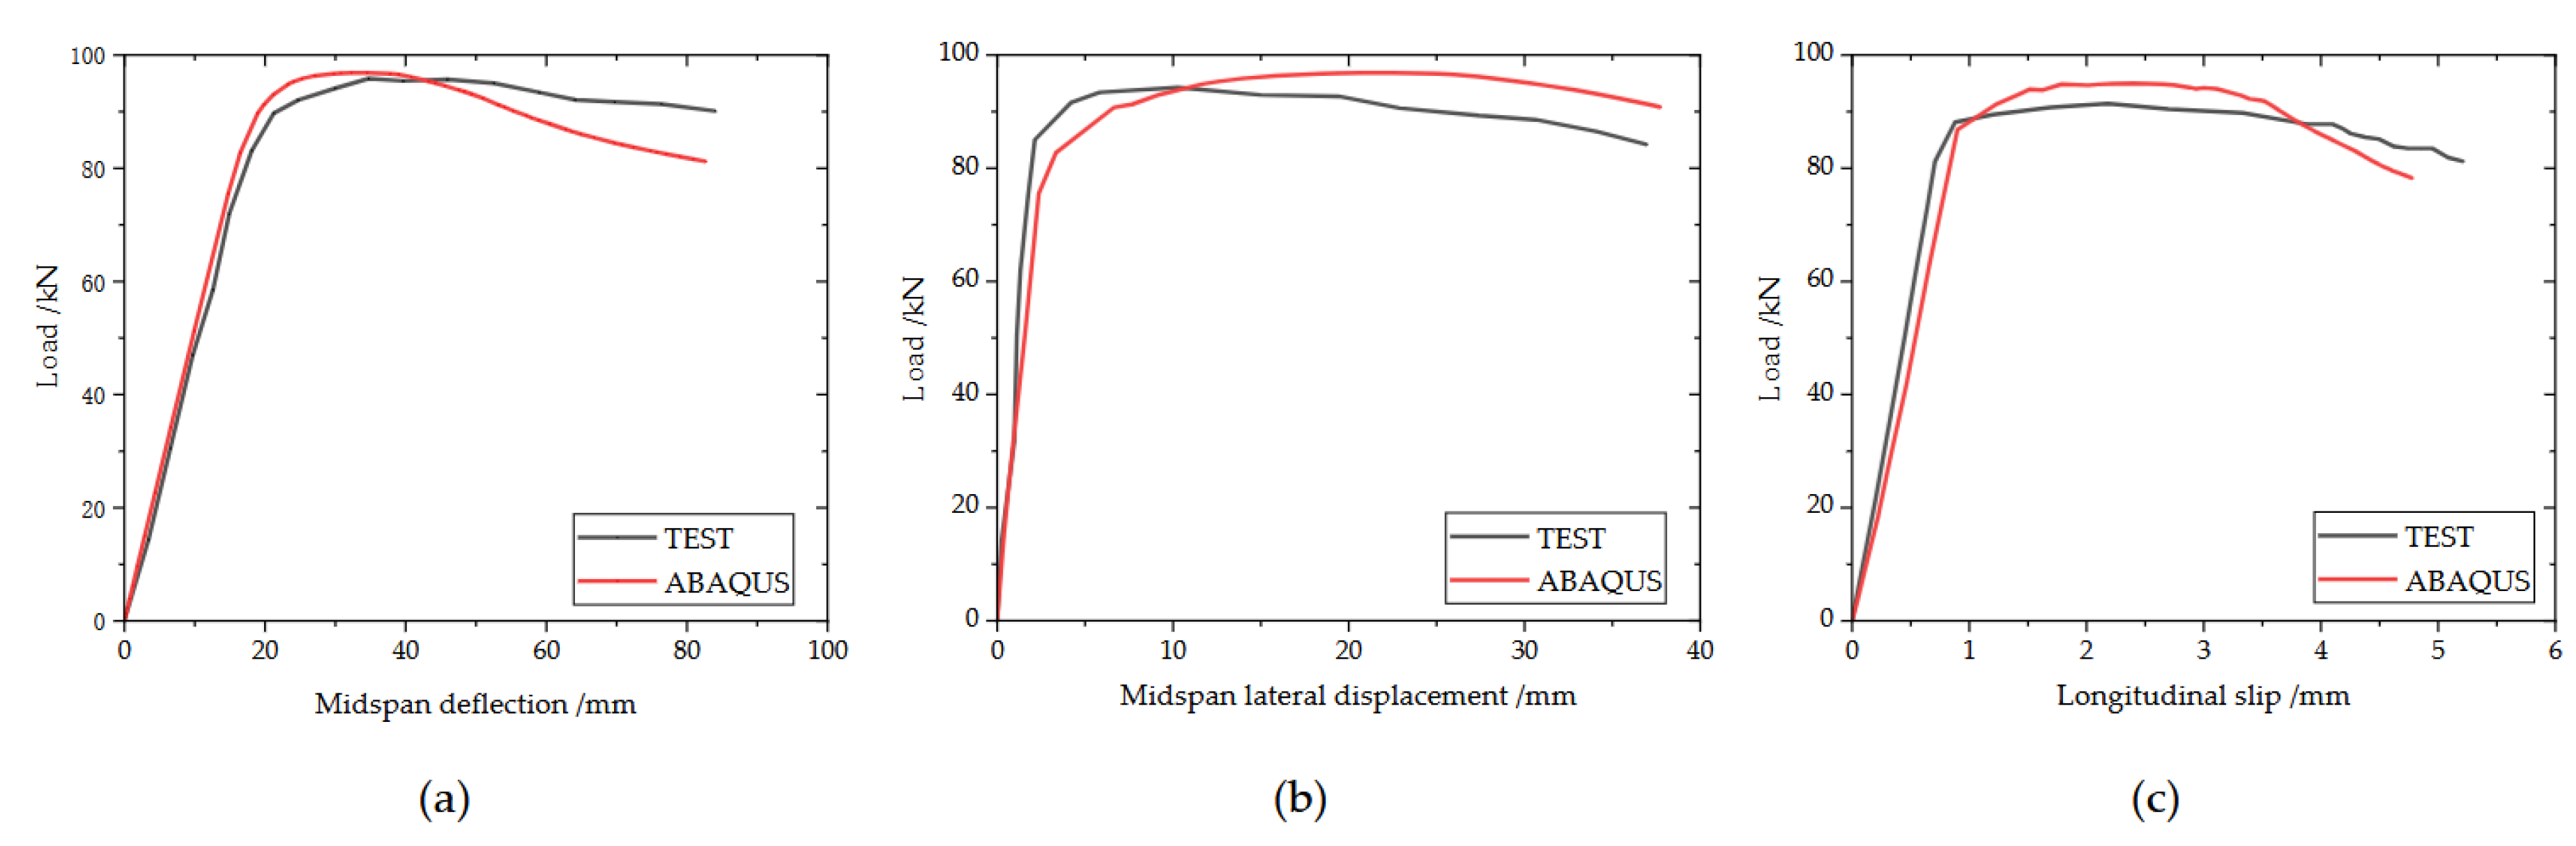
Figure 16.
Effect of bolt pre-loadings vs. deformation. (a) Midspan deflection curves; (b) Longitudinal slip curves.
Figure 16.
Effect of bolt pre-loadings vs. deformation. (a) Midspan deflection curves; (b) Longitudinal slip curves.
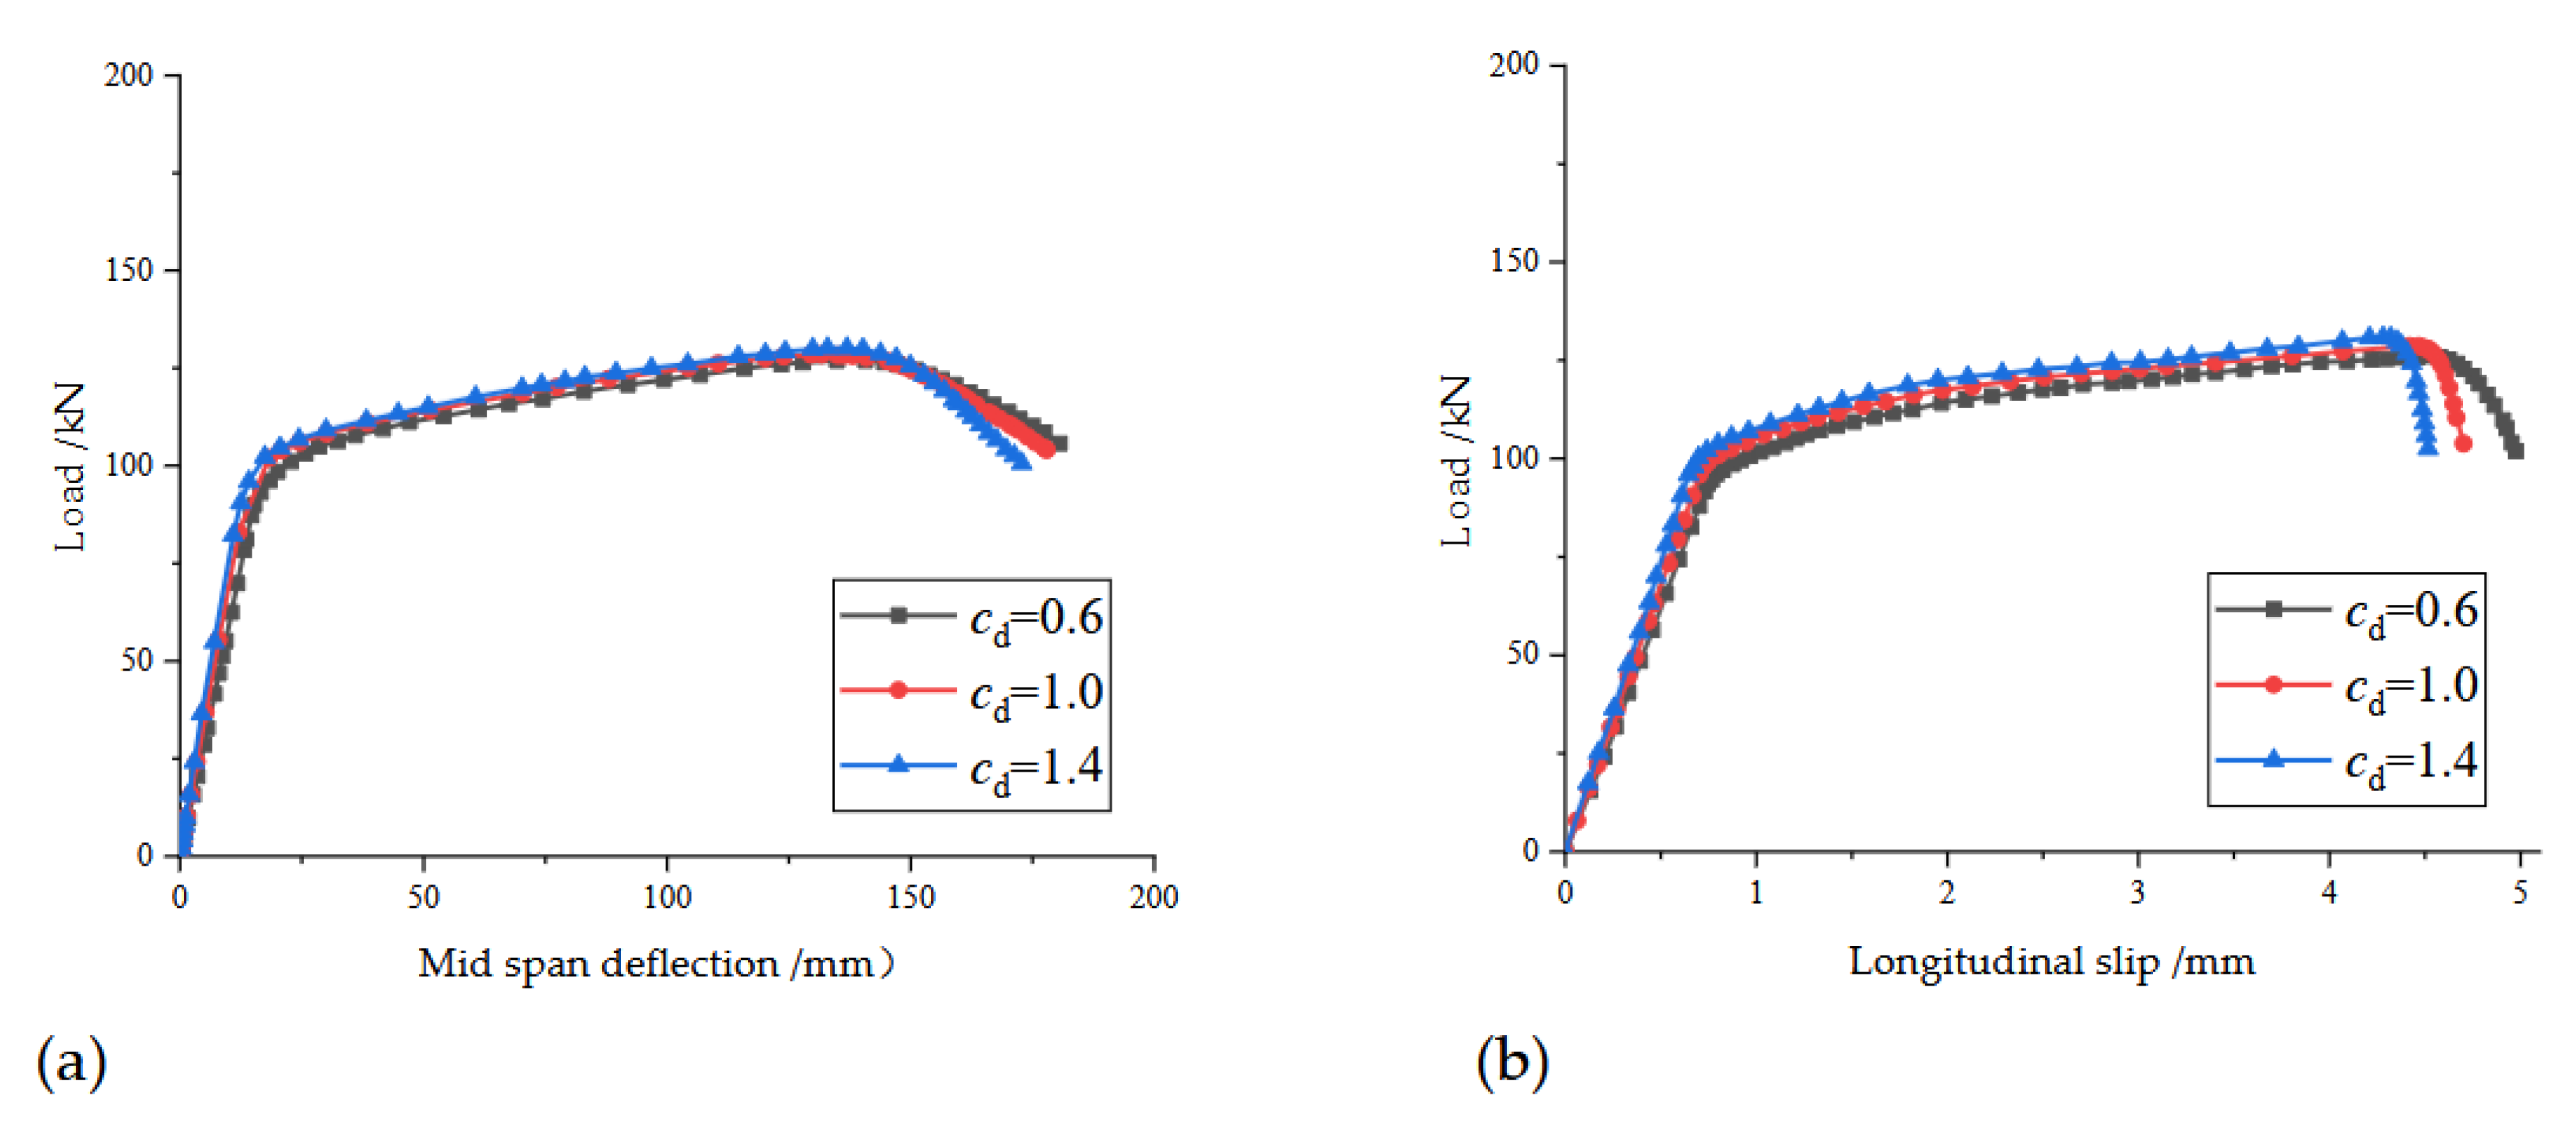
Figure 17.
Effect of different bolt spacing on Load vs. deformation. (a) Midspan deflection curves; (b) Longitudinal slip curves.
Figure 17.
Effect of different bolt spacing on Load vs. deformation. (a) Midspan deflection curves; (b) Longitudinal slip curves.
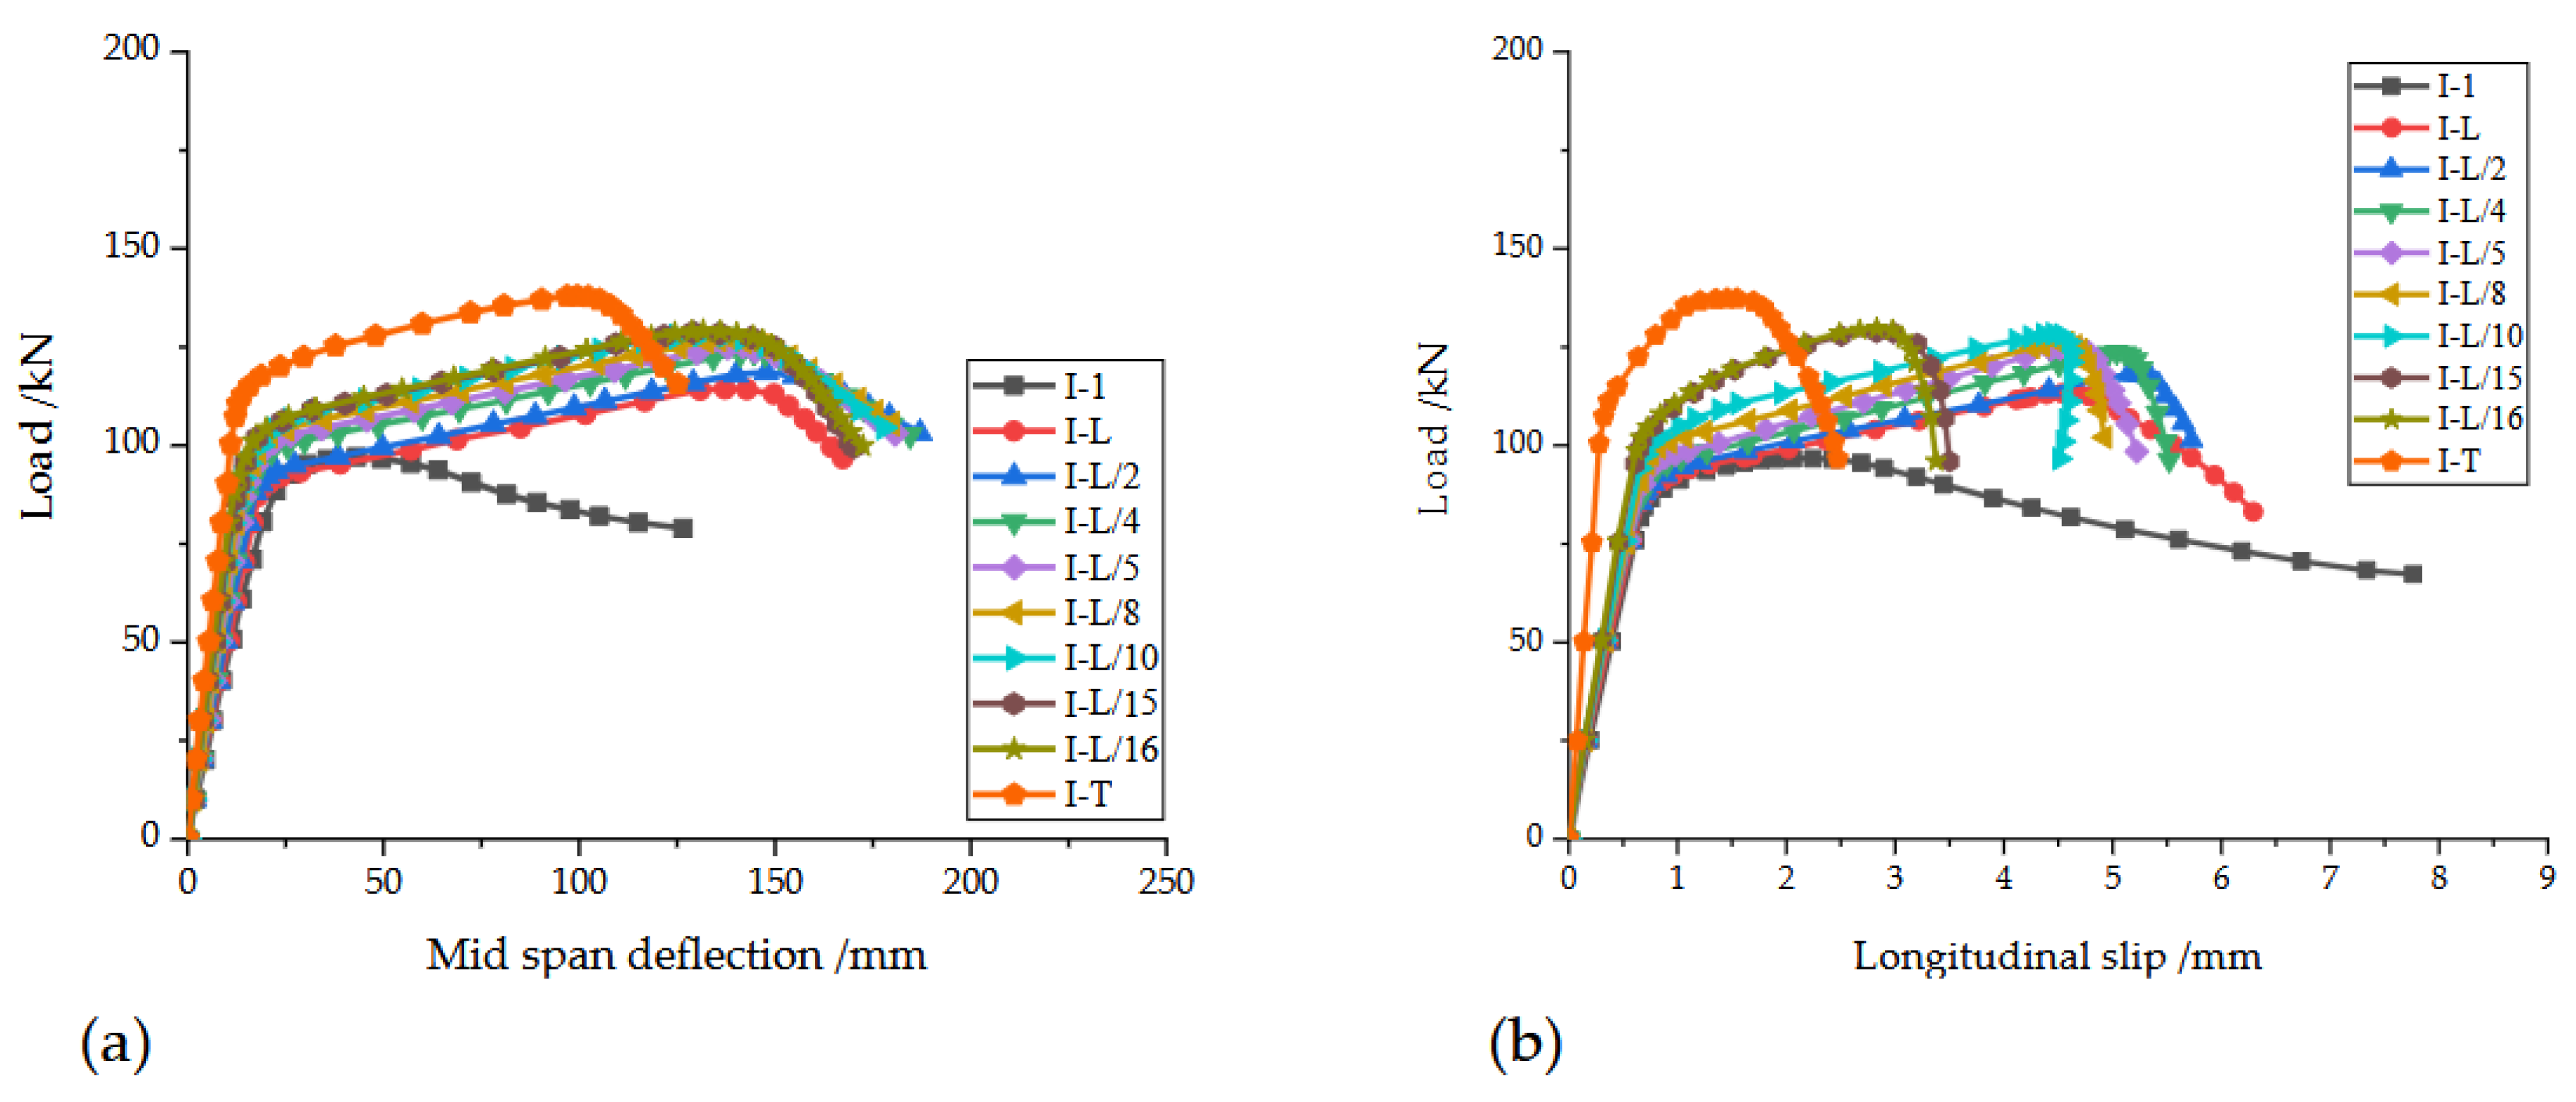

Table 1.
Dimensions of cross-sections (Unit: mm).
| Specimen | tf | tw | b | bf | h | hw | |||
| The upper beam of HBCB | 7.9 | 6.2 | 100.2 | 47.2 | 99.6 | 83.8 | |||
| The lower beam of HBCB | 8.1 | 6.2 | 100.4 | 47.0 | 100.0 | 83.6 | |||
| The upper beam of NCLB | 8.1 | 6.2 | 100.1 | 47.1 | 100.1 | 83.8 | |||
| The lower beam of NCLB | 8.1 | 6.0 | 100.3 | 47.0 | 100.2 | 83.9 | |||
Table 2.
Dimensions of specimens (Unit: mm).
| Specimen | L | Le | H | l0 | l1 | l2 | l3 | d | e | ts |
| HBCB | 2999.74 | 2699.44 | 199.58 | 299.6 | 824.4 | 149.4 | 74.4 | 13.9 | 25.2 | 5.9 |
| NCLB | 3000.02 | 2699.96 | 200.30 | 299.9 | 824.9 | 149.9 | 74.9 | 13.9 | 25.1 | 5.8 |
Table 3.
Mechanical Properties of steel and bolts.
| Samples | E/MPa | σy/MPa | εy | σu/MPa | εu | σst/MPa | εst |
| Web 100-1 | 203000 | 345.7 | 0.00191 | 464.1 | 0.17724 | 368.7 | 0.24158 |
| Web 100-2 | 202000 | 359.3 | 0.00218 | 469.2 | 0.18205 | 368.9 | 0.26537 |
| Web 100-3 | 208000 | 362.8 | 0.00240 | 471.0 | 0.17979 | 369.2 | 0.25779 |
| Mean | 204333 | 355.9 | 0.00216 | 468.1 | 0.17969 | 368.9 | 0.25491 |
| Flange 100-1 | 202000 | 320.2 | 0.00163 | 440.8 | 0.25002 | 345.2 | 0.35135 |
| Flange 100-2 | 210000 | 308.2 | 0.00163 | 445.6 | 0.38066 | 343.8 | 0.38066 |
| Flange 100-3 | 204000 | 291.0 | 0.00390 | 441.9 | 0.34566 | 345.6 | 0.34566 |
| Mean | 205333 | 306.5 | 0.00239 | 442.8 | 0.32545 | 344.9 | 0.35922 |
| Bolt | 161000 | 645.0 | 0.004 | 793.5 | 0.025 | 636.9 | 0.121 |
Table 4.
The bearing capacity of the test and ABAQUS (Unit: kN).
| Specimen | Test | ABAQUS | ||||
| Pcr | Pmax | Pend | Pcr, FE | Pmax, FE | Pend, FE | |
| HBCB | 91.66 | 126.59 | 126.59 | 99.59 | 126.05 | 102.10 |
| Error | - | - | - | +8.65% | -0.43% | - |
| NCLB | 83.85 | 94.91 | 82.52 | 91.27 | 96.88 | 80.47 |
| Error | - | - | - | +8.85% | +2.08% | -2.48% |
Table 5.
The ultimate bearing capacity and the maximum longitudinal slip value of composite beams under different degrees of pre-tension application (Unit: kN).
Table 5.
The ultimate bearing capacity and the maximum longitudinal slip value of composite beams under different degrees of pre-tension application (Unit: kN).
| Bolt type | Preload level | Nr (kN) | Ns (kN) | Pmax(kN) | udmax (mm) |
| M12-8.8 | 0.6 | 23.1 | 38.5 | 124.16 | 4.98 |
| 1.0 | 38.5 | 38.5 | 126.05 | 4.70 | |
| 1.4 | 53.9 | 38.5 | 130.10 | 4.51 |
Table 6.
The ultimate load-bearing capacity of high-strength bolt-connected composite beams under varying bolt spacings.
Table 6.
The ultimate load-bearing capacity of high-strength bolt-connected composite beams under varying bolt spacings.
| Specimen | Bolt spacingl0/mm | l0/L | Bolt counts | Pmax/kN | Dmax/mm | udmax/mm |
| HW-HW | — | — | 0 | 97.11 | 126.51 | 7.76 |
| HW-HW-L | 3000 | 1 | 4 | 114.43 | 167.29 | 6.30 |
| HW-HW-L/2 | 1500 | 1/2 | 6 | 118.64 | 187.09 | 5.73 |
| HW-HW-L/4 | 750 | 1/4 | 10 | 123.82 | 184.53 | 5.52 |
| HW-HW-L/5 | 600 | 1/5 | 12 | 124.13 | 180.63 | 5.22 |
| HW-HW-L/8 | 375 | 1/8 | 16 | 125.35 | 179.87 | 4.93 |
| HW-HW-L/10 | 300 | 1/10 | 20 | 128.19 | 177.77 | 4.46 |
| HW-HW-L/15 | 200 | 1/15 | 32 | 128.67 | 170.08 | 3.50 |
| HW-HW-L/16 | 187.5 | 1/16 | 34 | 129.16 | 172.41 | 3.38 |
| HW-HW-T | — | — | — | 137.90 | 125.12 | 2.47 |
Disclaimer/Publisher’s Note: The statements, opinions and data contained in all publications are solely those of the individual author(s) and contributor(s) and not of MDPI and/or the editor(s). MDPI and/or the editor(s) disclaim responsibility for any injury to people or property resulting from any ideas, methods, instructions or products referred to in the content. |
© 2025 by the authors. Licensee MDPI, Basel, Switzerland. This article is an open access article distributed under the terms and conditions of the Creative Commons Attribution (CC BY) license (http://creativecommons.org/licenses/by/4.0/).
Copyright: This open access article is published under a Creative Commons CC BY 4.0 license, which permit the free download, distribution, and reuse, provided that the author and preprint are cited in any reuse.


