
Submitted:
30 December 2024
Posted:
10 January 2025
You are already at the latest version
Abstract
The primary obstacle in making accurate runoff predictions in the catchment is the unavailability of precise rainfall measurement data. The objective of this study is to apply the HEC-HMS to estimate runoff using observed and satellite precipitation products over the Modjo catchment and measure and compare the performance of each simulation. The study considered two commonly used gridded precipitation products: CHIRPS. In the HEC-HMS model setup, the study used the SCS Curve Number, SCS Unit Hydrograph, and the Muskingum method for Loss, transform, and routing model, respectively. Hydro-meteorological data, collected daily, were compiled and prepared for the process of model calibration (spanning2010-2019) and validation (2020-2023). Results showed that NSE, R2, and PBIAS values become 0.842, 0.85, and -2.99 for observed rainfall products and 0.711, 0.72, and +5.6 for CHIRPS rainfall products during calibration and 0.751, 0.78, and -3.112 for observed rainfall products and 0.622, 0.64, and +7.99 for CHIRPS rainfall products during validation. The estimated peak flood discharge simulated with observed, and CHIRPS data was 288.9 m3/s, and 369.2 m3/s, then compared with the observed stream flow of 248.1m3/s. The model results have revealed that global precipitation products have showcased a promising and observed precipitation an effective performance in simulating runoff over the Modjo catchment and are recommended for further investigation to improve the accuracy.
Keywords:
Flood
; HEC-HMS
; Hydrological modeling
; Modjo
; Rainfall
; Runoff
1. Introduction
Global water resources are facing escalating threats due to rising demand driven by rapid urban development, population increase, and the impacts of climate change. Climate change effects, including modified rainfall patterns, higher temperatures, and severe weather occurrences, significantly influence water resources (Gebre, 2015). Hydrological and associated water-evaluation simulations have been extensively utilized to tackle a wide range of water resource issues around the world (Akoko et al., 2021). Precisely forecasting daily streamflow within the basin is essential for reducing flood damage and facilitating early alerts (Iamampai et al., 2024). Hydrological models are vital for enhancing the comprehension of hydrological processes, managing and analyzing water resources, ensuring their sustainable use, and supporting informed decision-making and planning. To tackle the issue of insufficient observed data at the local level for water resource planning and utilization within the river basin, the hydrologic simulation approach has become extensively employed in recent years (Marahatta et al., 2021). Rainfall-runoff hydrological models for catchments are essential in hydrological research (Chakravarti et al., 2015). Hydrological models can enhance the understanding of the functions of various components within the hydrological cycle for each catchment, while also providing a foundation for modeling additional hydrological processes (Flores et al., 2021). Hydrological models are extensively utilized for the comprehensive evaluation and management of water resources within catchments (Ruan et al., 2017). Grasping the intricate connections between rainfall and runoff processes is crucial for accurately forecasting surface runoff (Fereidoon et al., 2019). Modeling surface runoff is employed to analyze catchment yields and their responses, assess water availability, track changes over time, and make predictions (Knightes, 2017). Runoff modeling is used to gain insights into watershed productivity and responses, as well as to anticipate water availability, monitor changes over time, and predict extreme events (Jehanzaib et al., 2022). The administration and planning of water resources, such as irrigation management, river basin engineering, reservoir operations, and navigation, greatly depend on runoff modeling (Ranjan & Singh, 2022). Rainfall-runoff models are commonly employed to evaluate climate risks by forecasting alterations in streamflow and other hydrological processes resulting from expected human-induced climate change (Watson et al., 2022). However, modeling the runoff process poses a significant hydrological challenge due to its inherent randomness and complex spatial and temporal dynamics (Shekar et al., 2023), and is affected by precipitation characteristics, catchment shape, and size, soil types, land use and topography are the main factors affecting runoff from a catchment (Ranjan & Singh, 2022).
The existing modeling techniques are typically classified into one of three categories: (i) Empirical models, (ii) Conceptual models, and (iii) Physically-based models (Sidle, 2021). Empirical models are developed exclusively through the analysis of existing data, which is why they are often referred to as data-driven models. In contrast, physically-based models offer a more accurate representation of real-world phenomena by mathematically modeling these processes (Nath et al., 2020). Physical hydrological models, which are created to replicate the movement and storage of water within a watershed, are classified according to their spatial representation. Lumped models consider the entire basin as a single entity, averaging parameters and overlooking spatial variability (Okiria et al., 2022). Semi-distributed models segment the basin into smaller sub-basins, providing a degree of spatial differentiation while simplifying the interactions between these areas (Fathy et al., 2015). In contrast, distributed models utilize a fine grid to represent every point within the basin, effectively capturing complex spatial heterogeneity and delivering the most detailed and realistic simulations (Pelletier & Andréassian, 2022). The selection of these models is influenced by various factors, including the objectives of the study, the complexity of the basin, the availability of data, and the computational resources at hand. Lumped models are appropriate for rapid assessments, semi-distributed models are suitable for basins of moderate complexity, while distributed models are best for in-depth investigations.
The advancement of computer technology and programming has enabled academics, industries, and researchers to develop a variety of software tools for modeling watershed processes (Chathuranika et al., 2022). Among many other available computer models used for simulating rainfall-runoff processes, the Soil and Water Assessment Tool (Arnold et al., 2012), the Hydrologic Engineering Centre-Hydrologic Modelling System (Cazanescu et al., 2012), Artificial Neural Network (Dawson & Wilby, 1998) are frequently used by hydrological modelers around the world. The Hydrologic Engineering Center's Hydrologic Modeling System (HEC-HMS) is a software program designed for hydrologic modeling, created by the US Army Corps of Engineers. It features an integrated tool for simulating the hydrologic processes of dendritic watershed systems (Hamdan et al., 2021). The HEC-HMS model is commonly utilized in numerous hydrological studies due to its ease of use, low data requirements, and ability to implement standard methodologies (Janicka & Kanclerz, 2023). The HEC-HMS model is lump-based (Chathuranika et al., 2022). Incorporation of a GIS workspace into HEC-HMS simplifies the modeling process and greatly enhances user experience with the software. While numerous models have been created for watershed hydrology, the limited access to temporal and spatial data has been a major obstacle to their implementation, particularly in developing countries. (Kangsabanik & Murmu, 2017).
The modeling of catchment runoff and its precision are greatly affected by the availability and quality of rainfall data in the catchment area. Creating rainfall-runoff models in areas with limited data poses a considerable challenge, as it is often hard to acquire dependable precipitation information across the catchment. Most precipitation datasets are derived from weather stations; however, these gauge-based products encounter various issues, such as uneven station distribution and a lack of long-term, continuous observations, especially in developing regions where data scarcity and gaps are prevalent (Hu et al., 2024). In Ethiopia, the uneven distribution of rainfall gauging stations, marked by low data quality and considerable data gaps, undermines the overall reliability of rainfall information (Aniley et al., 2023; Chinasho et al., 2021; Gashaw et al., 2023; Gebere et al., 2015). In these situations, employing remotely sensed rainfall products can be an effective way to address the data shortfall. Remote sensing information can act as alternatives to conventional ground gauges in regions lacking sufficient rainfall and soil moisture data (Iamampai et al., 2024). These products, obtained from satellite observations, provide a useful alternative, particularly in developing nations where ground-based precipitation networks are scarce. Gridded precipitation data derived from gauge stations has been extensively studied and utilized to create hydrological models (Ruan et al., 2017).
The aim of this study is to assess the performance and variability of observed versus remotely sensed precipitation products in terms of their effectiveness for generating runoff. The research employed the widely utilized HEC-HMS hydrologic models to simulate and compare the streamflow generation capabilities within the Modjo River catchment in the Awash River basin, located in central Ethiopia. The study focused on the most commonly used global remote sensing precipitation datasets, specifically the Climate Hazards Infrared Precipitation with Station (CHIRPS), which has a spatial resolution of 0.05 degrees. CHIRPS was selected for this investigation due to its thorough validation across Africa, which has shown its ability to effectively capture rainfall variability and trends in comparison to ground observations (Dagne et al., 2024). The model was calibrated between 2010 and 2019 (for 10 years) and validated from 2019 to 2023 (for 4 years) at the same discharge station. The hydrologic model statistical performances for both models were examined using the Coefficient of Determination (R2), Percentage of bias (PBIAS), and the Nash Sutcliffe Efficiency (NSE). These parameters were used to determine the streamflow computational capabilities.
2. Materials and Methods
2.1. Study Area Description
The research was conducted in the Modjo catchment of the Awash River basin, situated in the Oromia Regional State of Ethiopia. Its precise location spans Latitudes: 8°40′ to 9°4′N and Longitudes: 38°45′ to 39°13′E, as illustrated in Figure 1. The area covers roughly 1,420 square kilometers. The catchment features rolling topography, extensive and deep valleys formed by small streams, and narrow flatlands in the southern region, which have been affected by inadequate land-use practices, soil erosion, and deposition processes (Besha et al., 2022). The catchment consists of three primary soil types: eutric cambisol, eutric nitosol, and pellic vertisol. Elevations within the catchment range from 1,764 to 3,091 meters. The slope of the catchment is expressed as a percentage, varying from 0% to 200.48%. It receives an average annual rainfall of 427 mm, with values ranging from 387 mm to a peak of 511 mm. The average minimum and maximum monthly temperatures in the area fluctuate between 9.96 °C and 18.76 °C, and 26.8 °C to 35.70 °C, respectively. The highest temperatures occur in May, while the lowest are recorded in December. The main rainy season spans from June to September. The catchment is mainly characterized by lumped watershed features, predominantly covered by agricultural land, and is classified as Hydrological Soil Group C. Its geographical location, approximately 70 km east of Addis Ababa, enhances its importance in the context of regional hydrology. In the study area, the catchment and its tributaries consistently supply water to the Modjo River (M. G. Alemu et al., 2022). The Modjo River acts as a tributary to the Awash River in central Ethiopia. The catchment area is located near Modjo town (see Figure 2), providing vital data for hydrological studies and assessments. This river is significant for the local ecosystem and water resources, and it connects with other tributaries.
2.2. Data Sets
HEC-HMS rainfall-runoff modeling necessitates data on land use and land cover (LULC) to assess infiltration and runoff rates, rainfall data to characterize events and their intensity, streamflow data for model calibration and validation, a Digital Elevation Model (DEM) to outline the basin and flow paths, and soil data to evaluate infiltration and runoff characteristics. The streamflow data collected was measured at the outlet of the Modjo catchment, situated near Modjo town. The recorded rainfall was sourced from three gauging stations within the Modjo catchment: Chefe Donsa, Ejere, and Modjo meteorological stations. In addition to the observed data, satellite precipitation products, specifically CHIRPS, were obtained. A summary of the data utilized is presented in the Table 1 and Figure 3.
The CHIRPS rainfall products, from 2009 to 2023, were extracted using the Google Earth Engine cloud API using the ee.ImageCollection algorithm and a filter command (ee.Filter.calendarRange) to cover the study period from 2009 to 2023. Prior to their integration into the model processing, CHIRPS rainfall data were adjusted for bias, a crucial step for achieving improved outcomes.
2.3. HEC-HMS Model Construction
All modifications were performed using HEC-HMS version 4.11, which includes five key components for developing the hydraulic model: terrain preprocessing, basin models, meteorological models, control specifications, and time-series data. The methods employed in this study are summarized in the figure below (Figure 4).
2.3.1. Loss Model
The loss method in HEC-HMS is a vital component for simulating the rainfall-runoff interactions within a watershed. It focuses on quantifying the volume of rainfall that is absorbed through infiltration and various processes prior to contributing to surface runoff (Hamdan et al., 2021). The loss method applied in this study is the Soil Conservation Service (SCS) Curve Number technique. This approach aims to estimate direct surface runoff resulting from rainfall by establishing an empirical connection between precipitation and various land conditions, including soil type and land use (Derdour et al., 2018). The curve number (CN) values rise linearly with the potential for runoff and decrease inversely in relation to the infiltration coefficient (Horablaga et al., 2024). The net rainfall was estimated as follows Eq. (1) (Yu & Zhang, 2023):
Where Pe is effective rainfall; P is rainfall; Ia is an initial abstraction, assumed to be 20 percent of S; S is potential maximum retention after runoff begins, which can be estimated by Eq. (2) (Yu & Zhang, 2023)(Fanta & Feyissa, 2021):
Where CN is the runoff curve number.
2.3.2. Transform Model
In HEC-HMS, the transform model is an essential element that converts surplus rainfall into runoff. For this study, the Soil Conservation Service Unit Hydrograph model was chosen to calculate runoff. This approach necessitates estimating the lag time (TL), which is defined as the duration from the centroid of the excess rainfall to the centroid of the direct runoff (Horablaga et al., 2024; Jabbar et al., 2021). The sole input parameter for this method is lag time (Tlag), which is influenced by the time of concentration (TC). Both lag time (TL) and time of concentration (TC) are parameters that dictate the speed at which a watershed reacts to rainfall across its area (Guduru et al., 2023). Time of Concentration is defined as the time required for a drop of water to travel from the most hydrologically remote point in a watershed to the point of collection. The lag time was computed using Eq. (3) (Jabbar et al., 2021).
The time of concentration can be estimated based on basin characteristics including topography and the length of the reach by Kirpich’s formula Eq. (4) (Kirpich, 1940).
Where L is the reach length in feet, and S is the slope.
2.3.3. Routing Model
HEC-HMS offers several routing techniques to model the flow of water through river segments, and in this study, the Muskingum method was employed. The Muskingum method is a widely used hydrologic routing approach in HEC-HMS that simulates the propagation of flood waves through a river segment by accounting for both storage and flow relationships over time (Baláž et al., 2011). This model requires two input parameters: the travel time of the flood wave (k) through a specific routing segment and the factor for attenuating the flood wave (Tangam et al., 2024). Eq. (5) was adopted in the present study as the Muskingum equation (Maharathi, 2021).
Where K is Food wave traveling time (0≤ K ≤ 150), X is a weighting factor, I is inflow, Q is outflow, and S is storage.
2.3.4. Calibration and Validation
Model calibration and validation are critical processes in hydrological modeling that ensure the reliability and accuracy of simulations. Proper calibration and validation play a crucial role in enhancing water resource management and decision-making, especially in light of climate change and various environmental challenges. Model Calibration in HEC-HMS involves adjusting model parameters to ensure that the simulated runoff closely matches observed streamflow data. This process typically uses historical hydrological data to fine-tune parameters such as curve numbers, loss rates, and routing coefficients. Model Validation follows calibration and involves testing the model's predictive capability using a different dataset that was not used during the calibration phase. Model validation involves evaluating the model's ability to replicate observed data that was not utilized during the calibration phase, ensuring this is done with an acceptable level of accuracy. This step is crucial to confirm that the model can accurately simulate runoff under various conditions. The present study utilizes approximately 75% of the available data for calibration, covering the period from 2010 to 2019, while the remaining data was reserved for validation, spanning from 2020 to 2023. This approach ensures that the model is effectively tuned to historical data before being tested against a separate dataset to evaluate its predictive accuracy.
2.4. Model Simulation Evaluation
Assessing the effectiveness of hydrological models such as HEC-HMS is vital for confirming their dependability in simulating runoff and other hydrological elements. In this study, various statistical methods were utilized to evaluate how accurately the model simulations reflect observed data, which is crucial for efficient water resource management and planning. The techniques were applied to both simulations: one using actual rainfall data and the other utilizing CHIRPS rainfall data. This research considered the evaluation of the model's performance through metrics such as Nash-Sutcliffe Efficiency (NSE), Percentage of Bias (PBIAS), and the coefficient of determination (R²), which are widely recognized indicators in hydrological modeling.
2.4.1. Nash-Sutcliffe Efficiency (NSE)
Nash-Sutcliffe Efficiency (NSE) is a statistical indicator utilized to assess the forecasting capability of models by comparing the values that are observed with those that are simulated (McCuen et al., 2006). It is especially significant in hydrology for evaluating how effectively a model can mirror real-world data. NSE assesses the relative disparity between the extent of residual data variance ("noise") and the variance of the measured data ("information") (USACE, 1998). NSE was computed using Eq. (6) (Arciniega-Esparza et al., 2022; Guduru & Mohammed, 2024)
2.4.2. Coefficient of Determination (R2)
R2 describes the degree of collinearity between simulated and observed data (USACE, 1998). The value of R2 was computed using Eq. (7) (Muleta & Marcell, 2023).
Where Qobs is simulated stream flow at a time t, and Qsim is simulated flow at time t.
The following table (Table 2) the range of NSE and R2 and their satisfactory classes.
2.4.3. Percentage of Bias (PBIAS)
The Percentage of Bias (PBIAS) is a statistical measure employed in HEC-HMS to evaluate the precision of model simulations compared to actual observed data (Faty et al., 2023). It quantifies the average tendency of the simulated values to either surpass or fall below the true observed values (Kumar et al., 2024). The following equation was used to calculate PBIAS in this study (Goodarzi et al., 2024).
The following table (Table 3) the range of PBIAS and their satisfactory classes.
2.5. Limitations of the Study
Recognizing the limitations and shortcomings of research is essential in any study. In this particular research, several notable limitations have been identified. First, there is a significant issue with observed data discontinuity. Effective runoff simulation models rely on accurate observed data for simulation, calibration, and validation, which includes actual precipitation and stream flow data. Unfortunately, our analysis reveals substantial discontinuities in the data, potentially affecting the reliability and applicability of the findings. Additionally, another limitation is that the study concentrates on a single-gridded global precipitation product. This focus restricts the exploration and comparison of multiple datasets, which could provide a more comprehensive understanding of the results.
3. Results and Discussions
3.1. Model Setup Results
The HEC-HMS software was utilized to convert precipitation data into direct runoff, taking into account the terrain and surface characteristics of the area being modeled. The basin model is a vital component of the HEC-HMS system, enabling an accurate representation of the rainfall-runoff interactions throughout the entire watershed. Calibration of the model occurred over a decade, from 2010 to 2019, with validation spanning four years, from 2020 to 2023, including an initial year at the same discharge monitoring station. To develop the catchment basin model, a thorough delineation process was performed, leading to the identification of ten unique sub-basins and fourteen flow paths, leveraging the GIS functionalities embedded in HEC-HMS. For the evaluation of these sub-basins and flow paths (see Figure 5), three distinct modeling strategies were considered: the Loss Model, the Transform Model, and the Routing Model. Each of these modeling frameworks requires specific types of input data to operate efficiently, underscoring the necessity of customized data needs for each model component. This comprehensive strategy guarantees a robust simulation of hydrological processes within the watershed.
3.2. Sensitivity Analysis
Identifying the most sensitive variables in the Modjo catchment is the initial step in calibrating and validating the HEC-HMS model. Sensitivity analysis was a key component of the model, helping to pinpoint the most sensitive parameters. This assessment was performed through the NSE index by modifying the values of different model parameters. Furthermore, the sensitivity analysis method is employed to assess the influence of hydrologic parameters on the runoff hydrograph for the specific catchment. Therefore, the sensitivity analysis included parameters such as the curve number, Muskingum K, Muskingum X, initial abstraction, lag time, and recession constant. Based on the analysis, it was noticed that the main parameter which affect runoff quantities were the recession constant and curve number (Figure 6). The parameter lag time and Initial abstraction were the third and fourth control effects on NSE, respectively. The remaining parameters were not showed significant changes on value of NSE. The same kind of observation was also highlighted in a study by (G. T. Alemu et al., 2023).
3.3. Model Simulation with Observed Rainfall Data
The statistical parameters applied to evaluate the modelling process demonstrated a strong alignment between the observed and simulated discharge values for the Modjo catchment. The analysis of daily rainfall-runoff simulations over the Modjo catchment using HEC-HMS reveals critical insights into model performance during both the calibration phase (2010-2019) and the validation phase (2020-2023). During calibration, the Nash-Sutcliffe Efficiency (NSE) of 0.842 indicates a strong correlation between observed and simulated runoff, suggesting that the model effectively captures the hydrological dynamics of the catchment. This high NSE value, approaching 1, signifies reliable predictions, while the Percent Bias (PBIAS) of -2.89 reflects a slight underestimation of runoff, remaining within acceptable limits and indicating minimal bias. Additionally, the Coefficient of Determination (R²) of 0.85 implies that 85% of the variance in observed runoff can be explained by the model, reinforcing its credibility. However, during the validation phase, the NSE decreases to 0.751, indicating a decline in predictive capability and raising concerns about the model's adaptability to new data. The PBIAS shifts to -3.112, suggesting a transition towards overestimation of runoff, which may reflect changes in rainfall patterns or other hydrological factors inadequately captured during calibration. Furthermore, the R² value drops to 0.780, indicating that the model explains only 78% of the variance in observed runoff during validation, highlighting potential deficiencies in capturing hydrological processes under varying conditions. Collectively, these findings underscore the necessity for ongoing refinement and validation of the HEC-HMS model to enhance its predictive accuracy and reliability in simulating runoff within the Modjo catchment. The hydrological modeling results revealed a close correspondence between the simulated and observed hydrographs, as shown in Figure 7.
3.4. Model Simulation with CHIRPS Rainfall Data
The statistical metrics used to assess the model’s performance highlighted a strong correlation between observed and simulated discharge values for the Modjo catchment. The evaluation of daily rainfall-runoff simulations using CHIRPS precipitation data over the Modjo catchment through HEC-HMS reveals important quantitative insights during both the calibration phase (2010-2019) and the validation phase (2020-2023). During calibration, the Nash-Sutcliffe Efficiency (NSE) of 0.711 indicates a moderate correlation between observed and simulated runoff, suggesting that while the model captures some hydrological dynamics, there is room for improvement in its predictive accuracy. The Percent Bias (PBIAS) of +5.6 indicates a slight overestimation of runoff, which, although within a tolerable range, suggests that the model may not fully account for certain hydrological processes. The Coefficient of Determination (R²) of 0.72 implies that the model can explain 72% of the variance in observed runoff, reinforcing its utility but also highlighting limitations in capturing the full complexity of the catchment's hydrology. In the validation phase, the NSE decreases to 0.622, indicating a further decline in predictive capability and raising concerns about the model's generalizability to new data. The PBIAS increases to +7.98, suggesting a growing tendency to overestimate runoff, which may reflect changes in rainfall patterns or other hydrological factors that were not adequately represented during calibration. Additionally, the R² value drops to 0.64, indicating that only 64% of the variance in observed runoff is explained by the model during validation, pointing to significant deficiencies in accurately simulating runoff under varying conditions. Collectively, these findings underscore the need for ongoing refinement and validation of the HEC-HMS model to enhance its predictive accuracy and reliability in simulating runoff within the Modjo catchment. The hydrological modeling results revealed a close correspondence between the simulated and observed hydrographs, as shown in Figure 8. This figure compares the time series of discharge values, both simulated and observed, at the catchment outlet during the calibration period (2010-2019) and the validation period (2020-2023).
The estimated peak flood discharge during both calibration and validation phases was 288.9 m³/s for observed precipitation data and 369.2 m³/s for CHIRPS data. In comparison, the observed stream flow was 248.1 m³/s. This indicates that while the CHIRPS data significantly overestimated peak discharge, the observed precipitation data provided a closer approximation to the actual stream flow measurements. Graphical techniques, like comparing observed and simulated hydrographs, provide a way to visually evaluate the performance of a model. This approach highlights trends, discrepancies, and how closely the model outputs match actual data. A visual review of the monthly cumulative of simulated hydrographs in Figure 9 indicates that both simulations using observed rainfall data and CHIRPS rainfall data align closely with the observed hydrographs. The subsequent plot of monthly streamflow distribution during the calibration and validation periods offers additional visual insight for comparing the simulations with the observations. The pattern and form of the hydrograph appear to be similar.
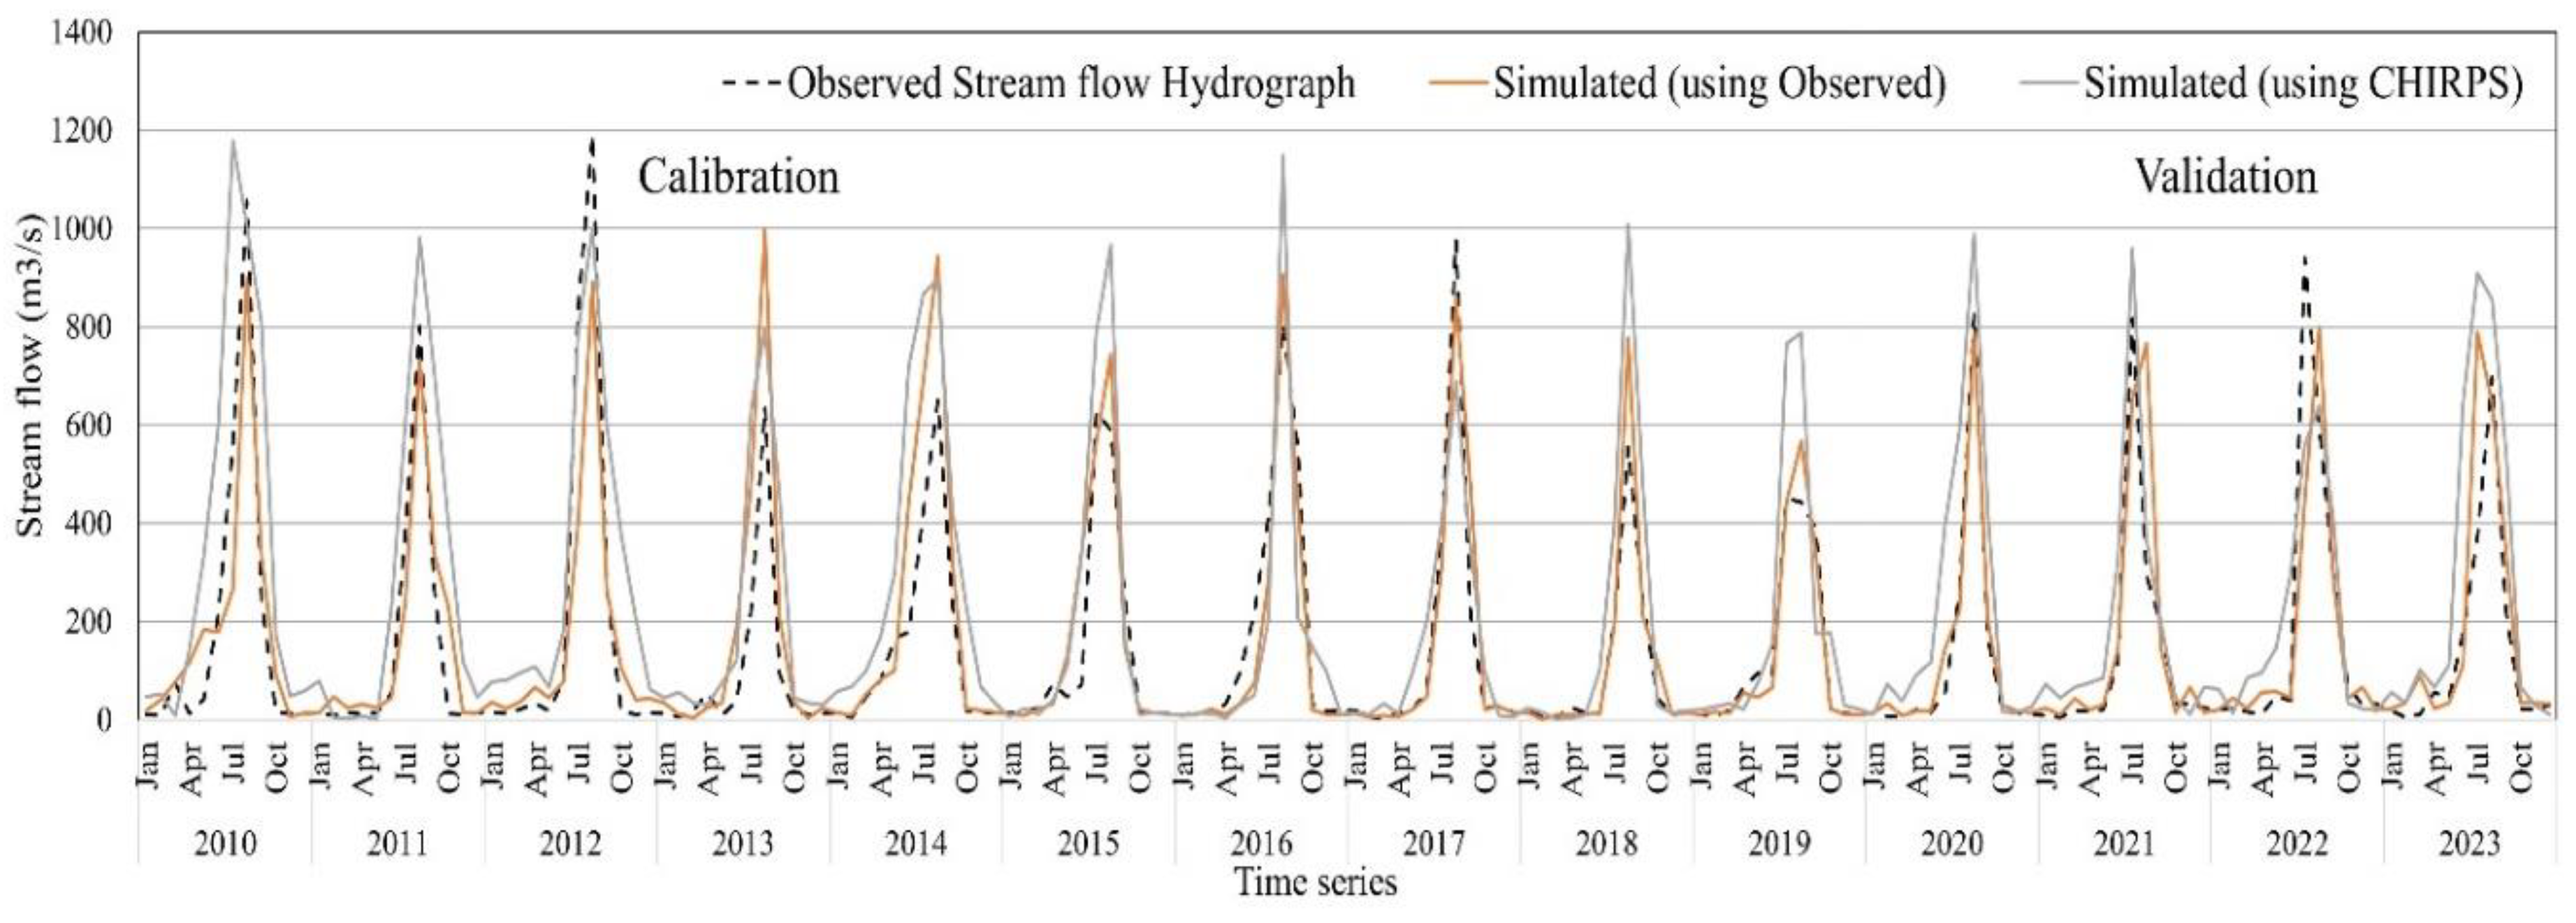
Figure 8. Monthly cumulative simulated and observed hydrographs in calibration and validation period.
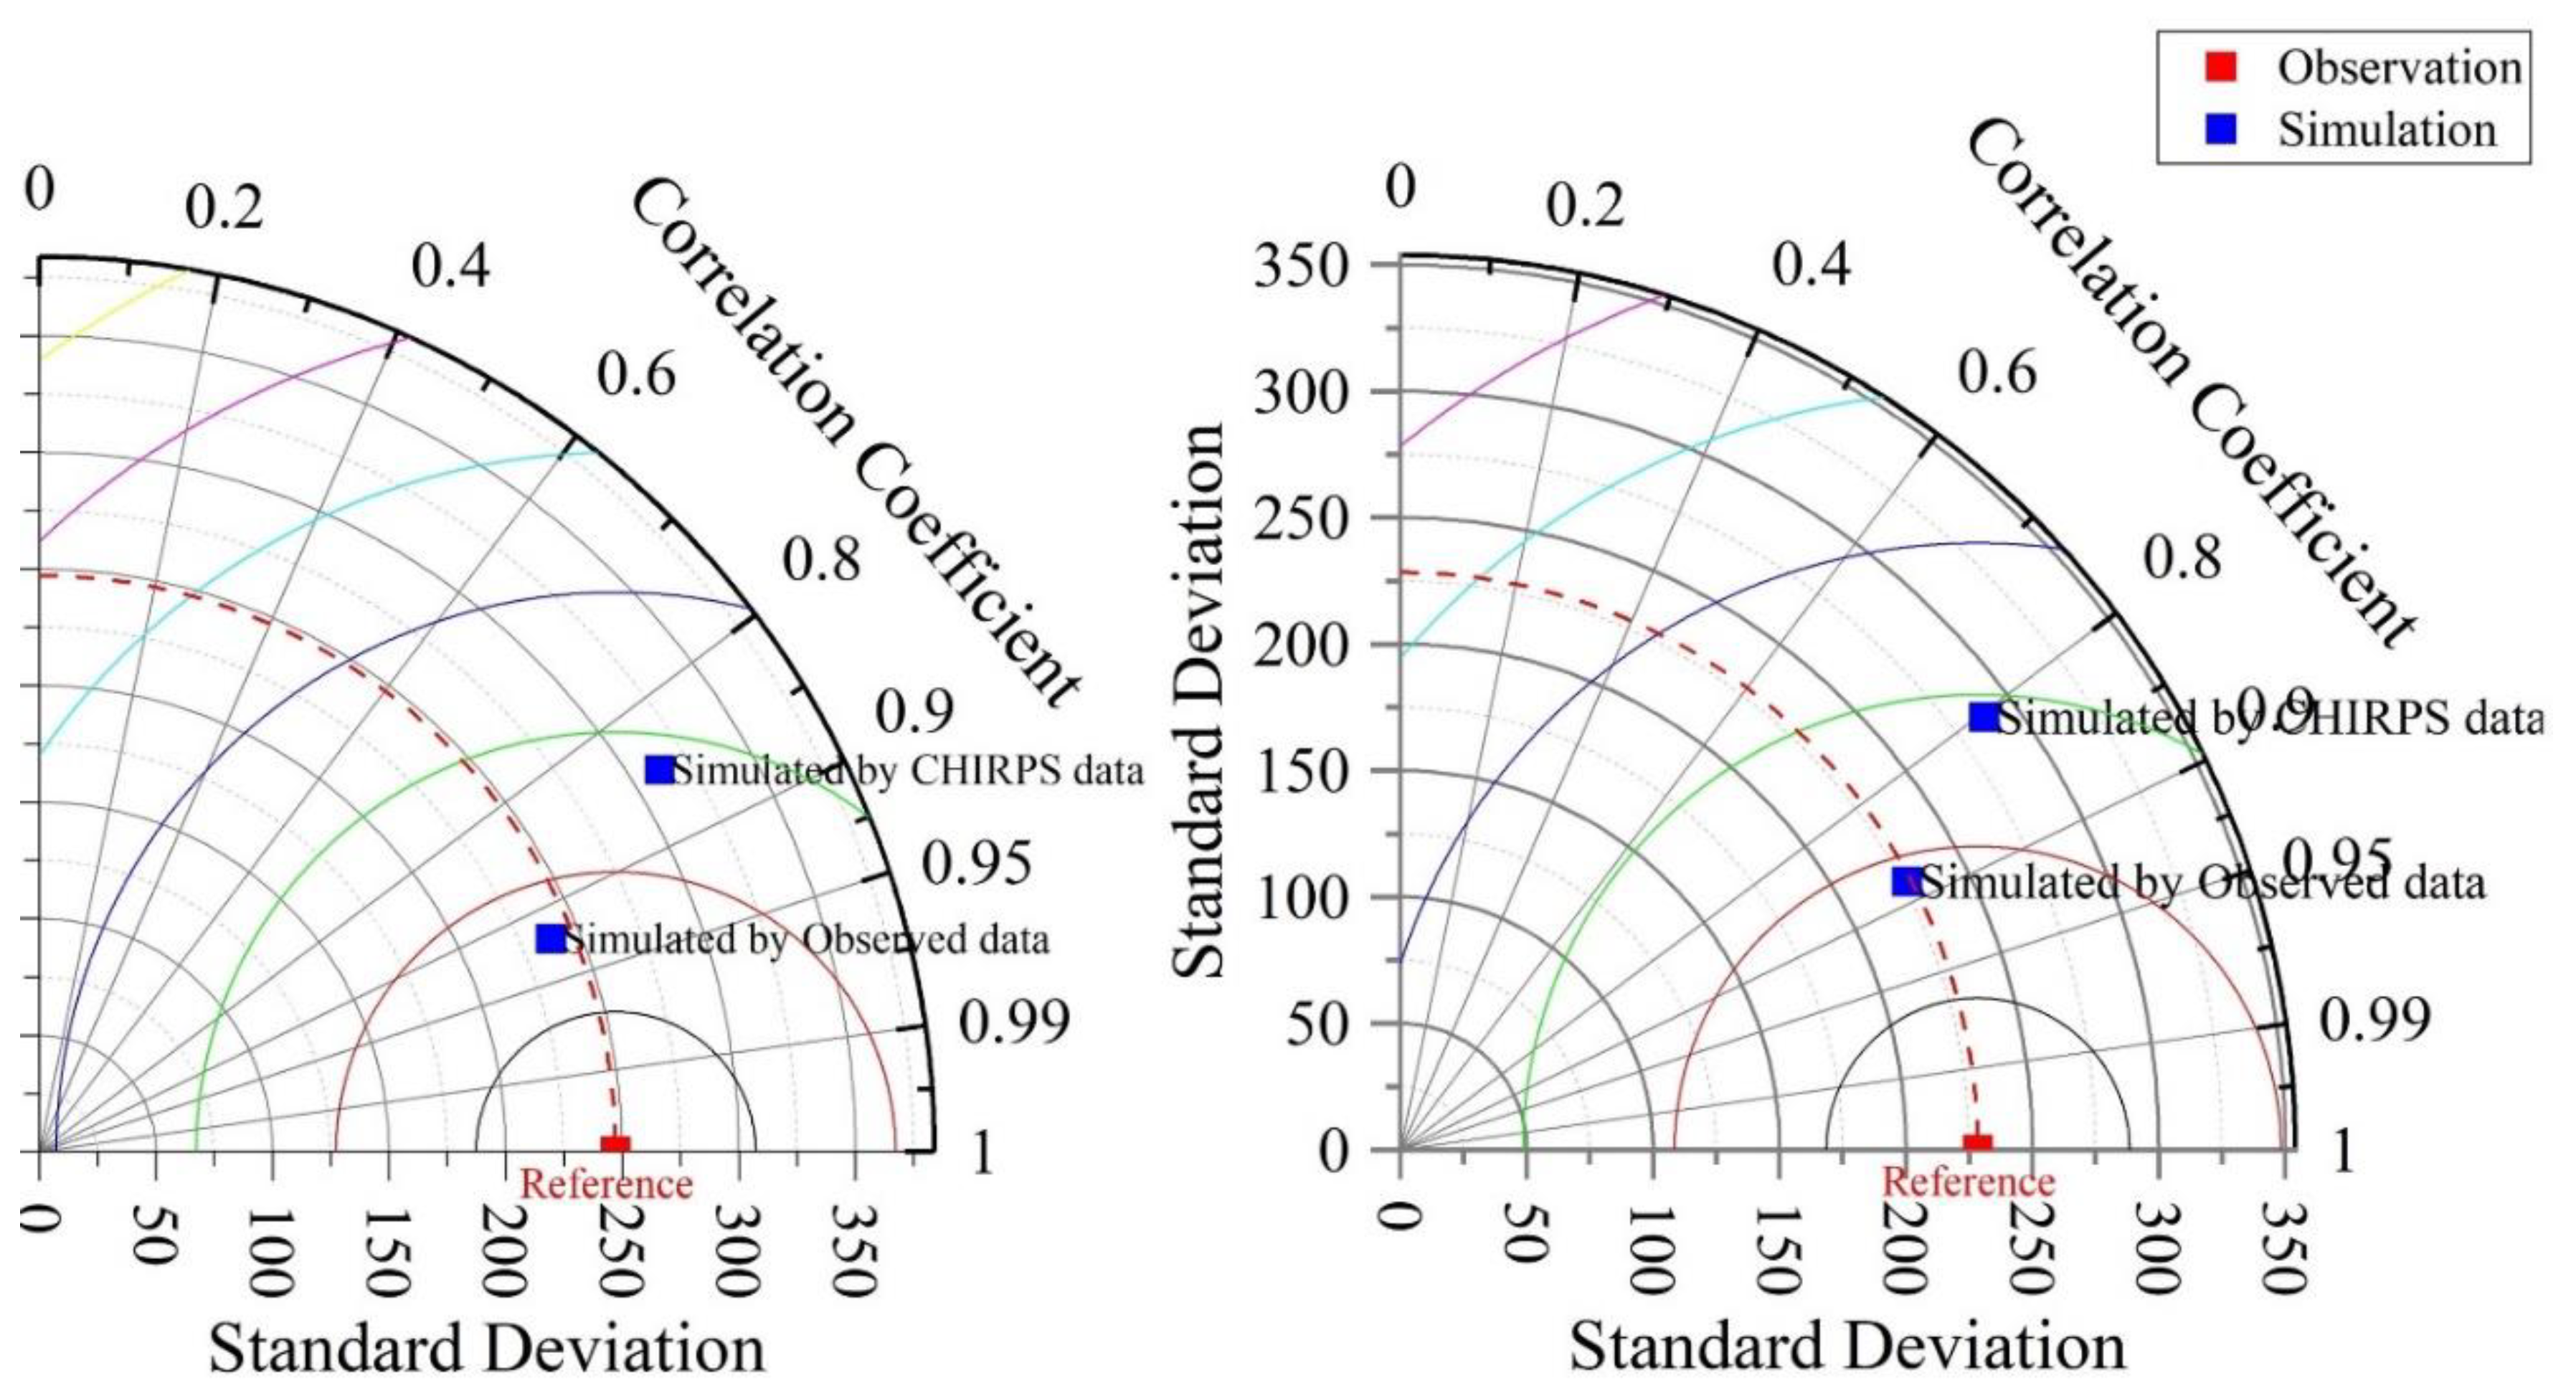
The comparison of simulated and observed values for the entire watershed reveals that, while the model generally captured the trends and magnitudes of hydrological responses, discrepancies in specific areas suggest the need for further calibration and refinement of input parameters to improve accuracy. The correlation coefficients for simulations using observed data are 0.92 during the calibration phase and 0.88 during the validation phase. In contrast, the correlation coefficients for simulations based on satellite data are 0.85 for the calibration period and 0.80 for the validation period (Figure 10). The correlation between model simulations using observed rainfall data and CHIRPS rainfall data indicates that simulations based on observed precipitation datasets perform better than those based on CHIRPS data. However, the differences in correlation are relatively small, suggesting that both datasets provide similar levels of accuracy in the simulations. This implies that while observed data may yield slightly superior results, CHIRPS data still offers a viable alternative for hydrological modeling. The following Taylor diagram plot illustrates the correlation coefficient between the observed data and the simulations, providing a visual representation of the model's performance concerning both datasets. This diagram helps to further understand the relationship between the observed and simulated rainfall, highlighting the strengths and weaknesses of each dataset.
Figure 9.
Tylor diagram for simulated and observed stream flow.
3.5. Comparison of Model Simulation by Observed and Satellite Precipitation Products
When comparing the results of rainfall-runoff simulations using CHIRPS precipitation data with those using observed precipitation over the Modjo catchment, several key differences emerge in terms of model performance metrics during both calibration and validation phases. For the CHIRPS data, the calibration phase yields an NSE of 0.711, indicating a moderate correlation between observed and simulated runoff, while the PBIAS of +5.6 suggests a slight overestimation of runoff. The R² value of 0.72 indicates that 72% of the variance in observed runoff is explained by the model, reflecting a reasonable fit but highlighting limitations in capturing the full hydrological dynamics. In contrast, the observed precipitation simulations demonstrate a higher NSE of 0.842 during calibration, suggesting a stronger correlation and more effective representation of hydrological processes. The PBIAS for observed data is -2.89, indicating a slight underestimation of runoff, which is generally more favorable than the overestimation seen with CHIRPS data. The R² value of 0.85 for observed precipitation further reinforces its credibility, as it explains 85% of the variance in observed runoff, showcasing a more robust model performance. During the validation phase, both datasets show a decline in model performance, but the observed precipitation maintains a higher NSE of 0.751 compared to the CHIRPS value of 0.622, indicating better predictive capability. The PBIAS for CHIRPS increases to +7.98, reflecting a growing tendency to overestimate runoff, while the observed data's PBIAS remains more stable at -3.112. Additionally, the R² for CHIRPS drops to 0.64, suggesting that only 64% of the variance in observed runoff is explained, which is significantly lower than the observed data's R² of 0.780. Overall, while both datasets exhibit challenges in validation, the observed precipitation simulations demonstrate superior performance metrics, highlighting the importance of accurate rainfall input data in hydrological modeling. All the values of the statistical metrics is shown in Table 4.
3.6. Comparison with Other Studies
Ensuring the accuracy of flood risk mapping data is crucial since it facilitates policy formulation. It encourages integrated management techniques, enhances engagement with stakeholders, and makes the most use of available resources. This study confirmed its outcomes by comparing it with similar studies conducted in the country and globally. The study compares its findings based on NSE and R² values with those from other studies that primarily use satellite precipitation products to simulate runoff. A study by (Belayneh et al., 2020) reported a NSE of nearly 0.68 and a coefficient of determination (R²) of 0.77 for calibration, while for validation, the NSE dropped to 0.51 and R² to 0.7. A study by (Benkirane et al., 2023) performed an event-based analysis to simulate floods using satellite precipitation products from GPM data, reporting NSE values ranging from 60% to 90% for calibration and 50% to 80% for validation across different analyses. These results align well with the findings of the present study. Similar to the present study, findings by (Anh et al., 2022) reported promising results for CHIRPS rainfall products, with NSE and R² values greater than 80% and a lower PBIAS of 0.45. This demonstrates a significant decrease from calibration to validation, which is consistent with the findings of the present study. The study (Rafiee et al., 2024) who found that using Global Precipitation Measurement (GPM) remote sensing data is reliable for modeling key hydrological parameters, aligning with the findings of the present study. Similar investigations across different studies have revealed that global precipitation datasets demonstrate a promising level of accuracy, albeit with lower values compared to observed precipitation in catchment rainfall-runoff simulations (Adam et al., 2017; Belayneh et al., 2020; Hernández-Romero et al., 2022). This suggests that while these datasets can be effective, there may still be discrepancies when compared to ground-truth measurements.
3.7. Implication of the Findings
Studies have shown that while HEC-HMS can yield satisfactory simulations of hydrological processes, discrepancies between simulated and observed runoff can occur, emphasizing the need for continuous validation and calibration of models with diverse precipitation sources to improve forecasting accuracy and water resource management. This improvement underscores the critical role that accurate precipitation data plays in hydrological modeling, especially in areas where ground-based measurements are limited. By integrating satellite-derived precipitation, HEC-HMS can better simulate the hydrological response of watersheds, leading to more reliable flood predictions and improved water resource management strategies. This approach not only enhances the accuracy of runoff simulations but also facilitates the application of hydrological models in diverse geographical contexts where traditional data sources may be insufficient. The effective results of HEC-HMS rainfall-runoff modeling using both observed and satellite precipitation products highlight the importance of accurate precipitation data in hydrological simulations. In regions where traditional precipitation measurements are sparse, such as many developing countries, satellite data can provide critical insights into spatial and temporal precipitation patterns, enhancing the reliability of runoff predictions.
4. Conclusions and Key Recommendations
The study specifically aimed to compare the effectiveness of observed precipitation data against satellite-derived products in simulating runoff, thereby providing insights into their applicability for sustainable water management in the region. The study selects CHIRPS, a widely utilized global precipitation dataset, for the simulations. Sensitivity analysis revealed that the primary parameters affecting runoff quantities are the recession constant and the curve number. The comparison of rainfall-runoff simulations using CHIRPS and observed precipitation data revealed significant differences in model performance metrics. During calibration, CHIRPS achieved a Nash-Sutcliffe Efficiency (NSE) of 0.711, a Percent Bias (PBIAS) of +5.6, and an R² of 0.72, indicating moderate correlation and slight overestimation of runoff. In contrast, observed precipitation simulations yielded a higher NSE of 0.842, a more favorable PBIAS of -2.89, and an R² of 0.85, demonstrating superior predictive capability. During validation, CHIRPS' performance declined, with an NSE of 0.622 and a PBIAS of +7.98, while observed precipitation maintained a higher NSE of 0.751 and a stable PBIAS of -3.112. The R² for CHIRPS dropped to 0.64, compared to 0.780 for observed data, further highlighting the observed precipitation's effectiveness in accurately capturing runoff dynamics. The estimated peak flood discharge during both calibration and validation phases was 288.9 m³/s for observed precipitation data and 369.2 m³/s for CHIRPS data. These comparative results underscore the importance of integrating both data sources for improved hydrological modeling, particularly in regions where ground-based data may be limited. The insights gained from this study are crucial for informing water resource management strategies in the Modjo catchment, especially in the face of climate variability and increasing water demand. By demonstrating the strengths and limitations of different precipitation products, this research contributes to the broader understanding of hydrological modeling in Central Ethiopia, paving the way for more effective and sustainable water management practices. Future research should focus on enhancing the accuracy of satellite precipitation estimates and exploring advanced modeling techniques to further improve runoff predictions, ultimately supporting the sustainable management of water resources in the region.
Funding
This research received no external funding.
Data Availability Statement
The data that support the findings of this study are available from the corresponding author, upon reasonable request.
Conflicts of Interest
The authors have no relevant financial or non-financial interests to disclose. There are not any disclosed conflicts of interest.
References
- Adam, E. O., Abd Elbasit, M. A. M., Solomon, T., & Ahmed, F. (2017). Integration of satellite rainfall data and curve number method for runoff estimation under SEMI-arid Wadi system. International Archives of the Photogrammetry, Remote Sensing and Spatial Information Sciences - ISPRS Archives, 42(3W2), 1–7. [CrossRef]
- Akoko, G., Le, T. H., Gomi, T., & Kato, T. (2021). A review of swat model application in africa. Water (Switzerland), 13(9). [CrossRef]
- Alemu, G. T., Ayalew, M. M., Geremew, B. S., Bihonegn, B. G., & Tareke, K. A. (2023). Evaluation of semi-distributed hydrological models performance in borkena watershed; upper awash basin, Ethiopia. Heliyon, 9(7), e18030. [CrossRef]
- Alemu, M. G., Wubneh, M. A., & Worku, T. A. (2022). Impact of climate change on hydrological response of Mojo river catchment, Awash river basin, Ethiopia. Geocarto International, 0(0), 000. [CrossRef]
- Anh, T. N., Huu, X. N., Tuong, V. N. T., & Tai, L. P. (2022). Application of HEC-HMS Model and Satellite Precipitation Products to Restore Runoff in Laigiang River Basin in Vietnam. Indonesian Journal of Geography, 54(1), 1–10. [CrossRef]
- Aniley, E., Gashaw, T., Abraham, T., Demessie, S. F., Bayabil, H. K., Worqlul, A. W., van Oel, P. R., Dile, Y. T., Chukalla, A. D., Haileslassie, A., & Wubaye, G. B. (2023). Evaluating the performances of gridded satellite/reanalysis products in representing the rainfall climatology of Ethiopia. Geocarto International, 38(1). [CrossRef]
- Arciniega-Esparza, S., Birkel, C., Chavarría-Palma, A., Arheimer, B., & Breña-Naranjo, J. A. (2022). Remote sensing-aided rainfall-runoff modeling in the tropics of Costa Rica. Hydrology and Earth System Sciences, 26(4), 975–999. [CrossRef]
- Arnold, J. G., Moriasi, D. N., Gassman, P. W., Abbaspour, K. C., White, M. J., Srinivasan, R., Santhi, C., Harmel, R. D., Van Griensven, A., & Van Liew, M. W. (2012). SWAT: Model use, calibration, and validation. Transactions of the ASABE, 55(4), 1491–1508.
- Baláž, M., Danáčová, M., & Szolgay, J. (2011). On the use of the Muskingum method for the simulation of flood wave movements. Slovak Journal of Civil Engineering, 18(3), 14–20. [CrossRef]
- Belayneh, A., Sintayehu, G., Gedam, K., & Muluken, T. (2020). Evaluation of satellite precipitation products using HEC-HMS model. Modeling Earth Systems and Environment, 6(4), 2015–2032. [CrossRef]
- Benkirane, M., Amazirh, A., Laftouhi, N. E., Khabba, S., & Chehbouni, A. (2023). Assessment of GPM Satellite Precipitation Performance after Bias Correction, for Hydrological Modeling in a Semi-Arid Watershed (High Atlas Mountain, Morocco). Atmosphere, 14(5), 0–22. [CrossRef]
- Besha, K. Z., Demissie, T. A., & Feyessa, F. F. (2022). Comparative analysis of long-term precipitation trends and its implication in the Modjo catchment, central Ethiopia. Journal of Water and Climate Change, 13(11), 3883–3905. [CrossRef]
- Cazanescu, S., Pienaru, A., Manea, R., & Virsta, A. (2012). BUILDING AN ADVANCED HYDROLOGIC MODEL USING SOFTWARE DEVELOPED BY US ARMY CORPS OF ENGINEERS. International Multidisciplinary Scientific GeoConference: SGEM, 3, 579.
- Chakravarti, A., Joshi, N., & Panjiar, H. (2015). Rainfall Runoff Analysis using Artificial Neural Network. Indian Journal of Science and Technology, 8(14). [CrossRef]
- Chathuranika, I. M., Gunathilake, M. B., Baddewela, P. K., Sachinthanie, E., Babel, M. S., Shrestha, S., Jha, M. K., & Rathnayake, U. S. (2022). Comparison of Two Hydrological Models, HEC-HMS and. Fluids, 7(267), undefined-undefined. https://www.mendeley.com/catalogue/69f2348f-f22c-3ac4-850d-449e0be2c72d/.
- Chinasho, A., Bedadi, B., Lemma, T., Tana, T., Hordofa, T., & Elias, B. (2021). Evaluation of Seven Gap-Filling Techniques for Daily Station-Based Rainfall Datasets in South Ethiopia. Advances in Meteorology, 2021. [CrossRef]
- Dagne, S. S., Roba, Z. R., Moisa, M. B., Deribew, K. T., Gemeda, D. O., & Hirpha, H. H. (2024). Rainfall prediction for data-scarce areas using meteorological satellites in the case of the lake Tana sub-basin, Ethiopia. Journal of Water and Climate Change, 15(5), 2188–2211. [CrossRef]
- Dawson, C. W., & Wilby, R. (1998). An artificial neural network approach to rainfall- runoff modelling. Hydrological Sciences Journal, 43(1), 47–66. [CrossRef]
- Derdour, A., Bouanani, A., & Babahamed, K. (2018). Modelling rainfall runoff relations using HEC-HMS in a semi-arid region: Case study in Ain Sefra watershed, Ksour Mountains (SW Algeria). Journal of Water and Land Development, 36(1), 45–55. [CrossRef]
- Fanta, S. S., & Feyissa, T. A. (2021). Performance evaluation of HEC-HMS model for continuous runoff simulation of Gilgel Gibe watershed, Southwest Ethiopia. Journal of Water and Land Development, 50, 85–97. [CrossRef]
- Fathy, I., Negm, A. M., Nassar, M. A., Ahmed, E., El-Sayed, H., El-Fiky, M., Nassar, M., & Al-Sayed, E. (2015). Runoff Hydrograph Modeling for Arid Regions (Case Study: Wadi Sudr-Sinai) 58 Runoff Hydrograph Modeling for Arid Regions (Case Study: Wadi Sudr-Sinai). International Water Technology Journal, IWTJ, 5(1). https://www.researchgate.net/publication/309494447.
- Faty, B., Sterk, G., Ali, A., Sy, S., Dacosta, H., Diop, S., & Descroix, L. (2023). Satellite-based rainfall estimates to simulate daily streamflow using a hydrological model over Gambia watershed. Water Science, 37(1), 1–18. [CrossRef]
- Fereidoon, M., Koch, M., & Brocca, L. (2019). Predicting rainfall and runoff through satellite soil moisture data and SWAT modelling for a poorly gauged basin in Iran. Water (Switzerland), 11(3). [CrossRef]
- Flores, N., Rodríguez, R., Yépez, S., Osores, V., Rau, P., Rivera, D., & Balocchi, F. (2021). Comparison of three daily rainfall-runoff hydrological models using four evapotranspiration models in four small forested watersheds with different land cover in south-central Chile. Water (Switzerland), 13(22), 1–28. [CrossRef]
- Gashaw, T., Worqlul, A. W., Lakew, H., Taye, M. T., Seid, A., & Haileslassie, A. (2023). Evaluations of satellite/reanalysis rainfall and temperature products in the Bale Eco-Region (Southern Ethiopia) to enhance the quality of input data for hydro-climate studies. Remote Sensing Applications: Society and Environment, 31, 100994. Society and Environment. [CrossRef]
- Gebere, S. B., Alamirew, T., Merkel, B. J., & Melesse, A. M. (2015). Performance of high resolution satellite rainfall products over data scarce parts of eastern ethiopia. Remote Sensing, 7(9), 11639–11663. [CrossRef]
- Gebre, S. L. (2015). Application of the HEC-HMS Model for Runoff Simulation of Upper Blue Nile River Basin. Journal of Waste Water Treatment & Analysis, 06(02). [CrossRef]
- Goodarzi, M. R., Poorattar, M. J., Vazirian, M., & Talebi, A. (2024). Evaluation of a weather forecasting model and HEC-HMS for flood forecasting: case study of Talesh catchment. Applied Water Science, 14(2), 1–16. [CrossRef]
- Guduru, J. U., Jilo, N. B., Rabba, Z. A., & Namara, W. G. (2023). Rainfall-runoff modeling using HEC-HMS model for Meki river watershed, rift valley basin, Ethiopia. Journal of African Earth Sciences, 197(April 2023). [CrossRef]
- Guduru, J. U., & Mohammed, A. S. (2024). Hydrological modeling using HEC-HMS model, case of Tikur Wuha River Basin, Rift Valley River Basin, Ethiopia. Environmental Challenges, 17(September). [CrossRef]
- Hamdan, A. N. A., Almuktar, S., & Scholz, M. (2021). Rainfall-runoff modeling using the hec-hms model for the al-adhaim river catchment, northern iraq. Hydrology, 8(2). [CrossRef]
- Hernández-Romero, P., Patiño-Gómez, C., Corona-Vásquez, B., & Martínez-Austria, P. F. (2022). Rainfall/runoff hydrological modeling using satellite precipitation information. Water Practice and Technology, 17(5), 1082–1098. [CrossRef]
- Horablaga, A., Bădăluță-minda, C., Popescu, G., Kader, S., Sestras, P., Herbei, M. V., Dragomir, L. O., & Popescu, C. A. (2024). Rainfall-runoff modeling based on HEC-HMS model : a case study in an area with increased groundwater discharge potential. October, 1–17. [CrossRef]
- Hu, X., Zhou, Z., Xiong, H., Gao, Q., Cao, X., & Yang, X. (2024). Inter-comparison of global precipitation data products at the river basin scale. Hydrology Research, 55(1), 1–16. [CrossRef]
- Iamampai, S., Talaluxmana, Y., Kanasut, J., & Rangsiwanichpong, P. (2024). Enhancing rainfall-runoff model accuracy with machine learning models by using soil water index to reflect runoff characteristics. Water Science and Technology, 89(2), 368–381. [CrossRef]
- Jabbar, L. A., Khalil, I. A., & Sidek, L. M. (2021). Hec-Hms Hydrological Modelling for Runoff Estimation in Cameron Highlands, Malaysia. International Journal of Civil Engineering and Technology (Ijciet), 12(9), 40–51. [CrossRef]
- Janicka, E., & Kanclerz, J. (2023). Assessing the Effects of Urbanization on Water Flow and Flood Events Using the HEC-HMS Model in the Wirynka River Catchment, Poland. Water (Switzerland), 15(1). [CrossRef]
- Jehanzaib, M., Ajmal, M., Achite, M., & Kim, T. W. (2022). Comprehensive Review: Advancements in Rainfall-Runoff Modelling for Flood Mitigation. Climate, 10(10), 1–17. [CrossRef]
- JHS, B., ALT, F., AD, L., & LC, A. (2019). The influence of spatial discretization on HEC-HMS modelling: a case study. International Journal of Hydrology, 3(5), 442–449. [CrossRef]
- Kangsabanik, S., & Murmu, S. (2017). Rainfall-runoff modelling of Ajay river catchment using SWAT model. IOP Conference Series: Earth and Environmental Science, 67(1). [CrossRef]
- Kirpich, Z. P. (1940). Time of concentration of small agricultural watersheds. Civil Engineering, 10(6), 362.
- Knightes, C. (2017). An Overview of Rainfall-Runoff Model Types An Overview of Rainfall-Runoff Model Types. September, 0–29.
- Kumar, S., Choudhary, M. K., & Thomas, T. (2024). A hybrid technique to enhance the rainfall-runoff prediction of physical and data-driven model: a case study of Upper Narmada River Sub-basin, India. Scientific Reports, 14(1), 26263. [CrossRef]
- Maharathi, P. (2021). Flood Routing Using Muskingum Method and Hec-Hms Model. October. https://www.researchgate.net/publication/355078474. //www: https.
- Marahatta, S., Aryal, D., Devkota, L. P., Bhattarai, U., & Shrestha, D. (2021). Application of swat in hydrological simulation of complex mountainous river basin (Part ii: Climate change impact assessment). Water (Switzerland), 13(11). [CrossRef]
- McCuen, R. H., Knight, Z., & Cutter, A. G. (2006). Evaluation of the Nash–Sutcliffe Efficiency Index. Journal of Hydrologic Engineering, 11(6), 597–602. [CrossRef]
- Muleta, T. N., & Marcell, K. (2023). Rainfall-Runoff Modeling and Hydrological Responses to the Projected Climate Change for Upper Baro Basin, Ethiopia. American Journal of Climate Change, 12(02), 219–243. [CrossRef]
- Nath, A., Mthethwa, F., & Saha, G. (2020). Runoff estimation using modified adaptive neuro-fuzzy inference system. Environmental Engineering Research, 25(4), 545–553. [CrossRef]
- Okiria, E., Okazawa, H., Noda, K., Kobayashi, Y., Suzuki, S., & Yamazaki, Y. (2022). A Comparative Evaluation of Lumped and Semi-Distributed Conceptual Hydrological Models: Does Model Complexity Enhance Hydrograph Prediction? Hydrology, 9(5). [CrossRef]
- Pelletier, A., & Andréassian, V. (2022). On constraining a lumped hydrological model with both piezometry and streamflow: Results of a large sample evaluation. Hydrology and Earth System Sciences, 26(10), 2733–2758. [CrossRef]
- Rafiee, M. R., Rad, S., Mahbod, M., Zolghadr, M., Azamatulla, H. M., & Tripathi, R. P. (2024). Modeling run-off flow hydrographs using remote sensing data: an application to the Bashar basin, Iran. Journal of Water and Climate Change, 15(4), 1490–1506. [CrossRef]
- Ranjan, S., & Singh, V. (2022). HEC-HMS based rainfall-runoff model for Punpun river basin. Water Practice and Technology, 17(5), 986–1001. [CrossRef]
- Ruan, H., Zou, S., Yang, D., Wang, Y., Yin, Z., Lu, Z., Li, F., & Xu, B. (2017). Runoff simulation by SWAT model using high-resolution gridded precipitation in the upper Heihe River Basin, Northeastern Tibetan Plateau. Water (Switzerland), 9(11). [CrossRef]
- Shekar, P. R., Mathew, A., Pandey, A., & Bhosale, A. (2023). A comparison of the performance of SWAT and artificial intelligence models for monthly rainfall–runoff analysis in the Peddavagu River Basin, India. Aqua Water Infrastructure, Ecosystems and Society, 72(9), 1707–1730. [CrossRef]
- Sidle, R. C. (2021). Strategies for smarter catchment hydrology models: incorporating scaling and better process representation. Geoscience Letters, 8(1). [CrossRef]
- Tangam, I., Yonaba, R., Niang, D., Adamou, M. M., Keïta, A., & Karambiri, H. (2024). Daily Simulation of the Rainfall–Runoff Relationship in the Sirba River Basin in West Africa: Insights from the HEC-HMS Model. Hydrology, 11(3). [CrossRef]
- USACE. (1998). HEC-HMS Technical Reference Manual Introduction. Computer Manual, 1–288.
- Watson, A., Midgley, G., Ray, P., Kralisch, S., & Helmschrot, J. (2022). How Climate Extremes Influence Conceptual Rainfall-Runoff Model Performance and Uncertainty. Frontiers in Climate, 4(June), 1–19. [CrossRef]
- Yu, X., & Zhang, J. (2023). The Application and Applicability of HEC-HMS Model in Flood Simulation under the Condition of River Basin Urbanization. Water (Switzerland), 15(12). [CrossRef]
Figure 1.
Study Area.
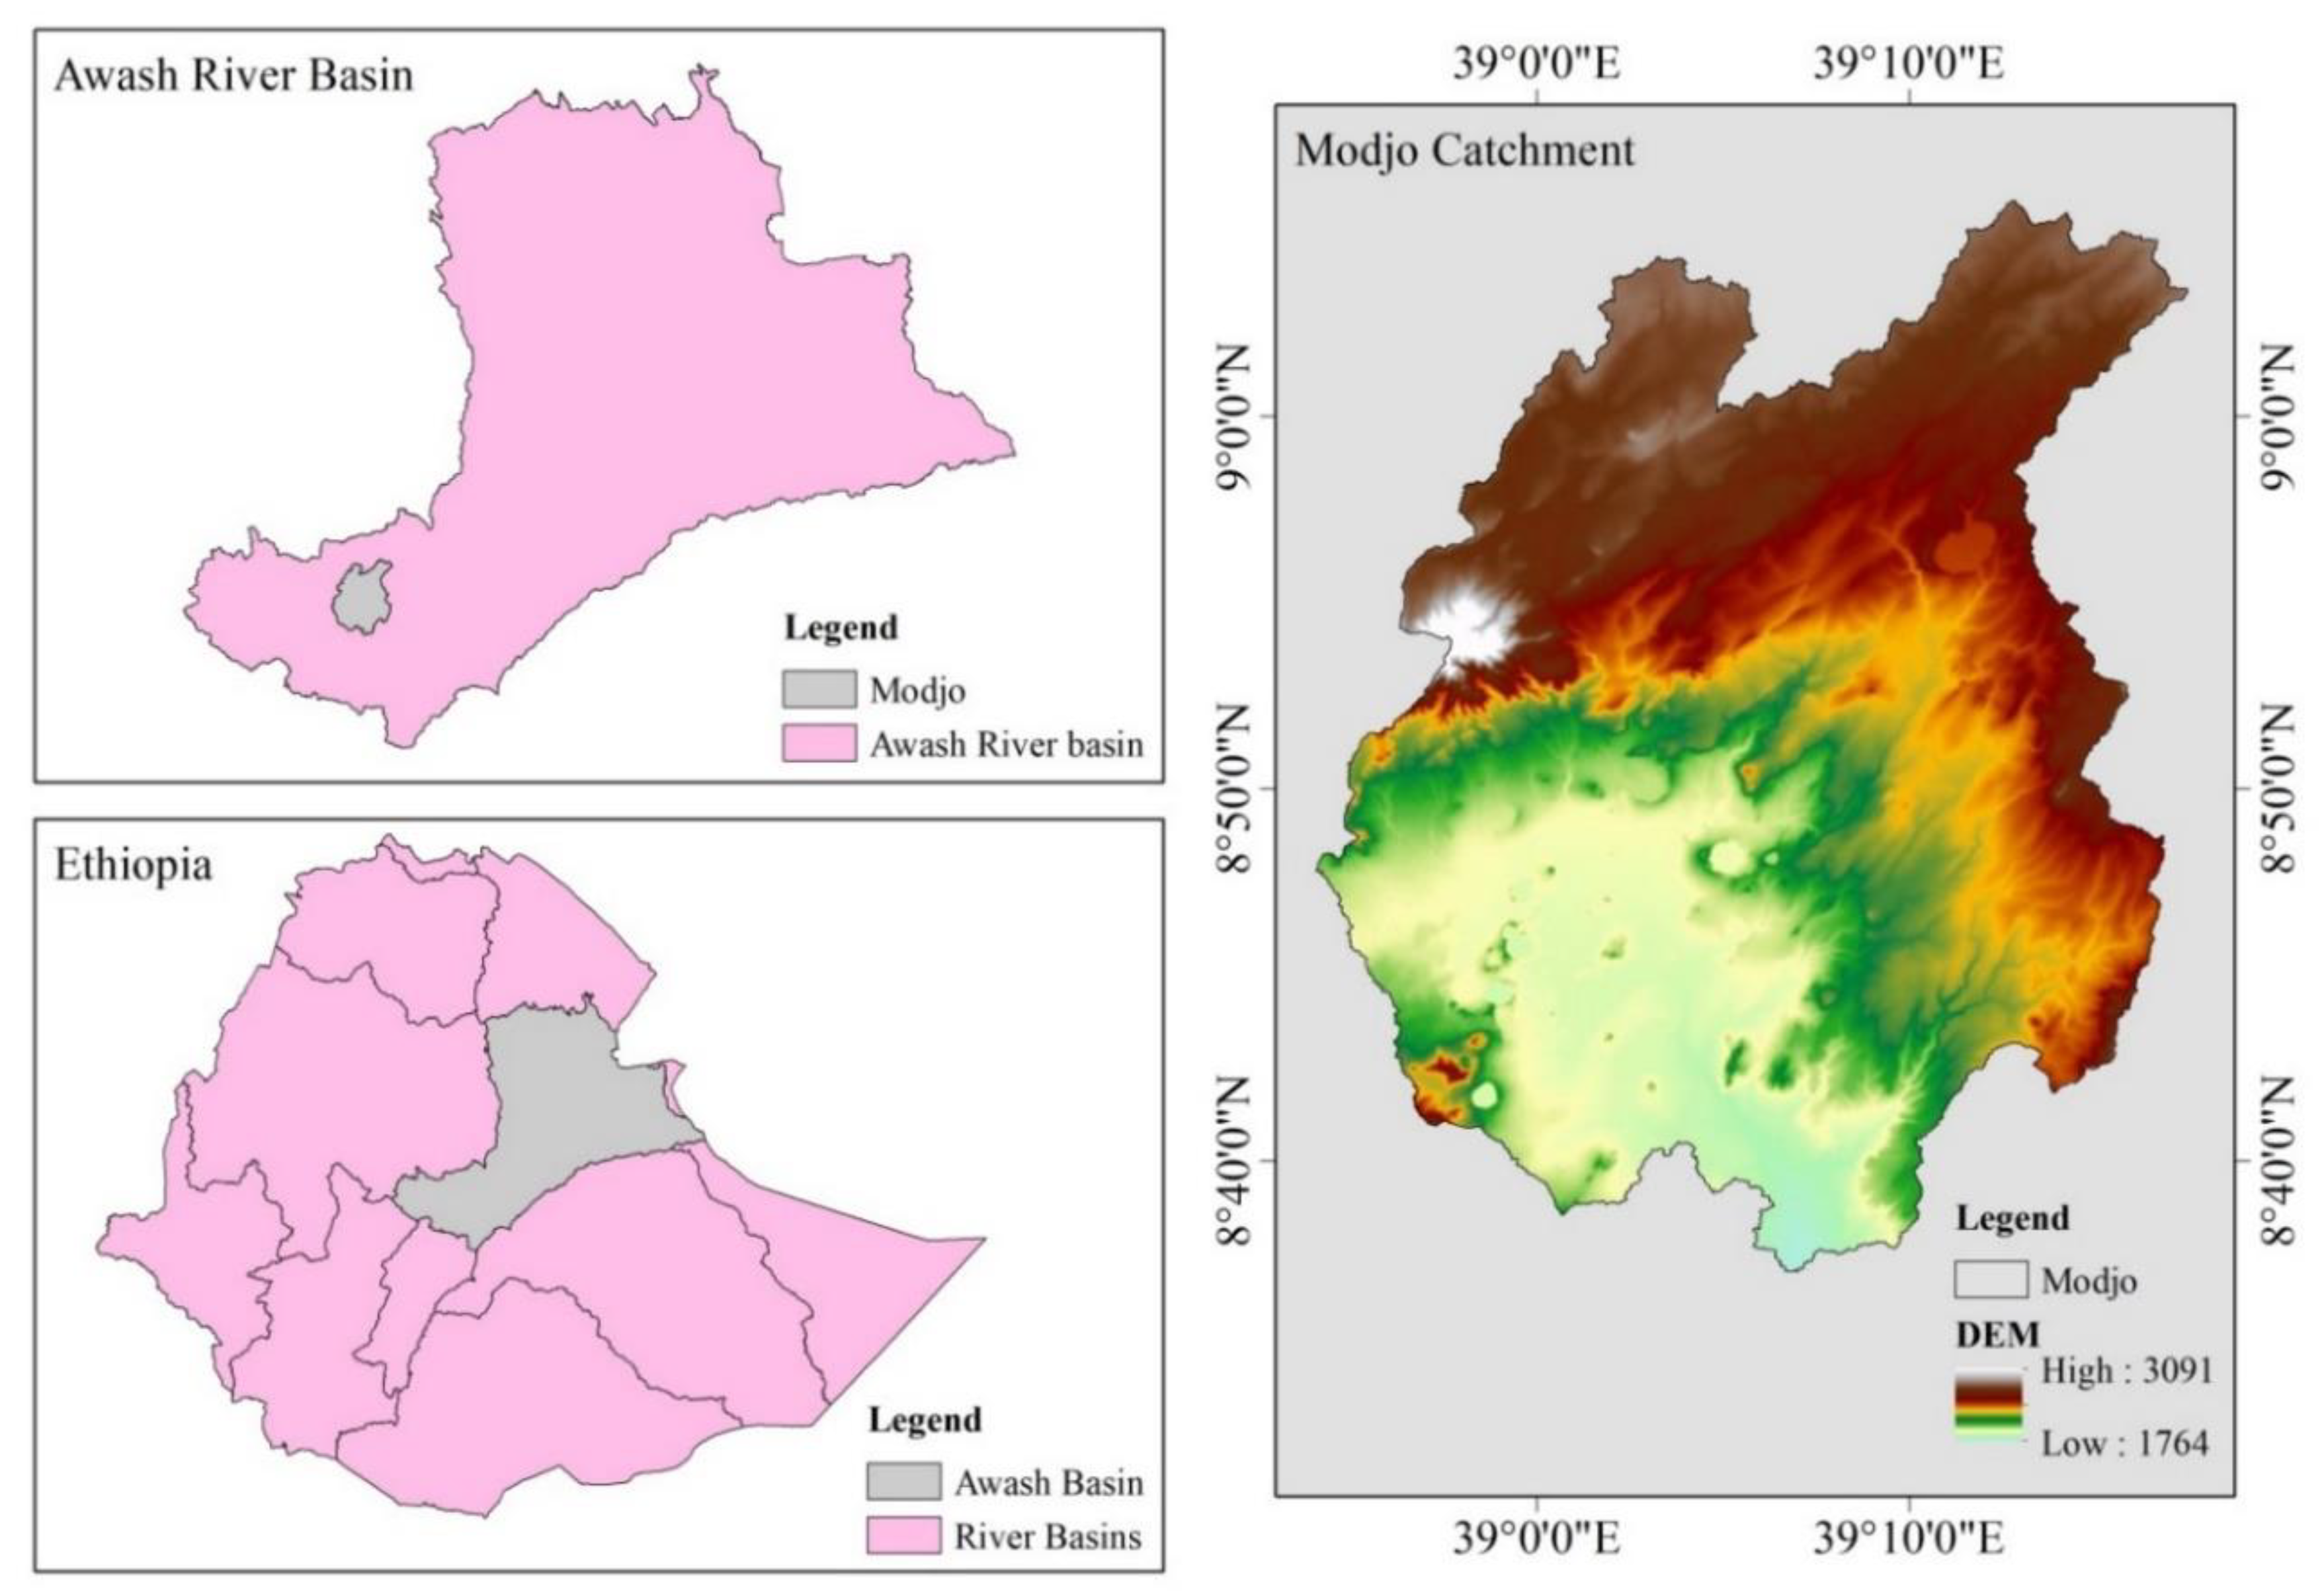
Figure 2.
Modjo River at the Modjo River gauging station (near Modjo town).
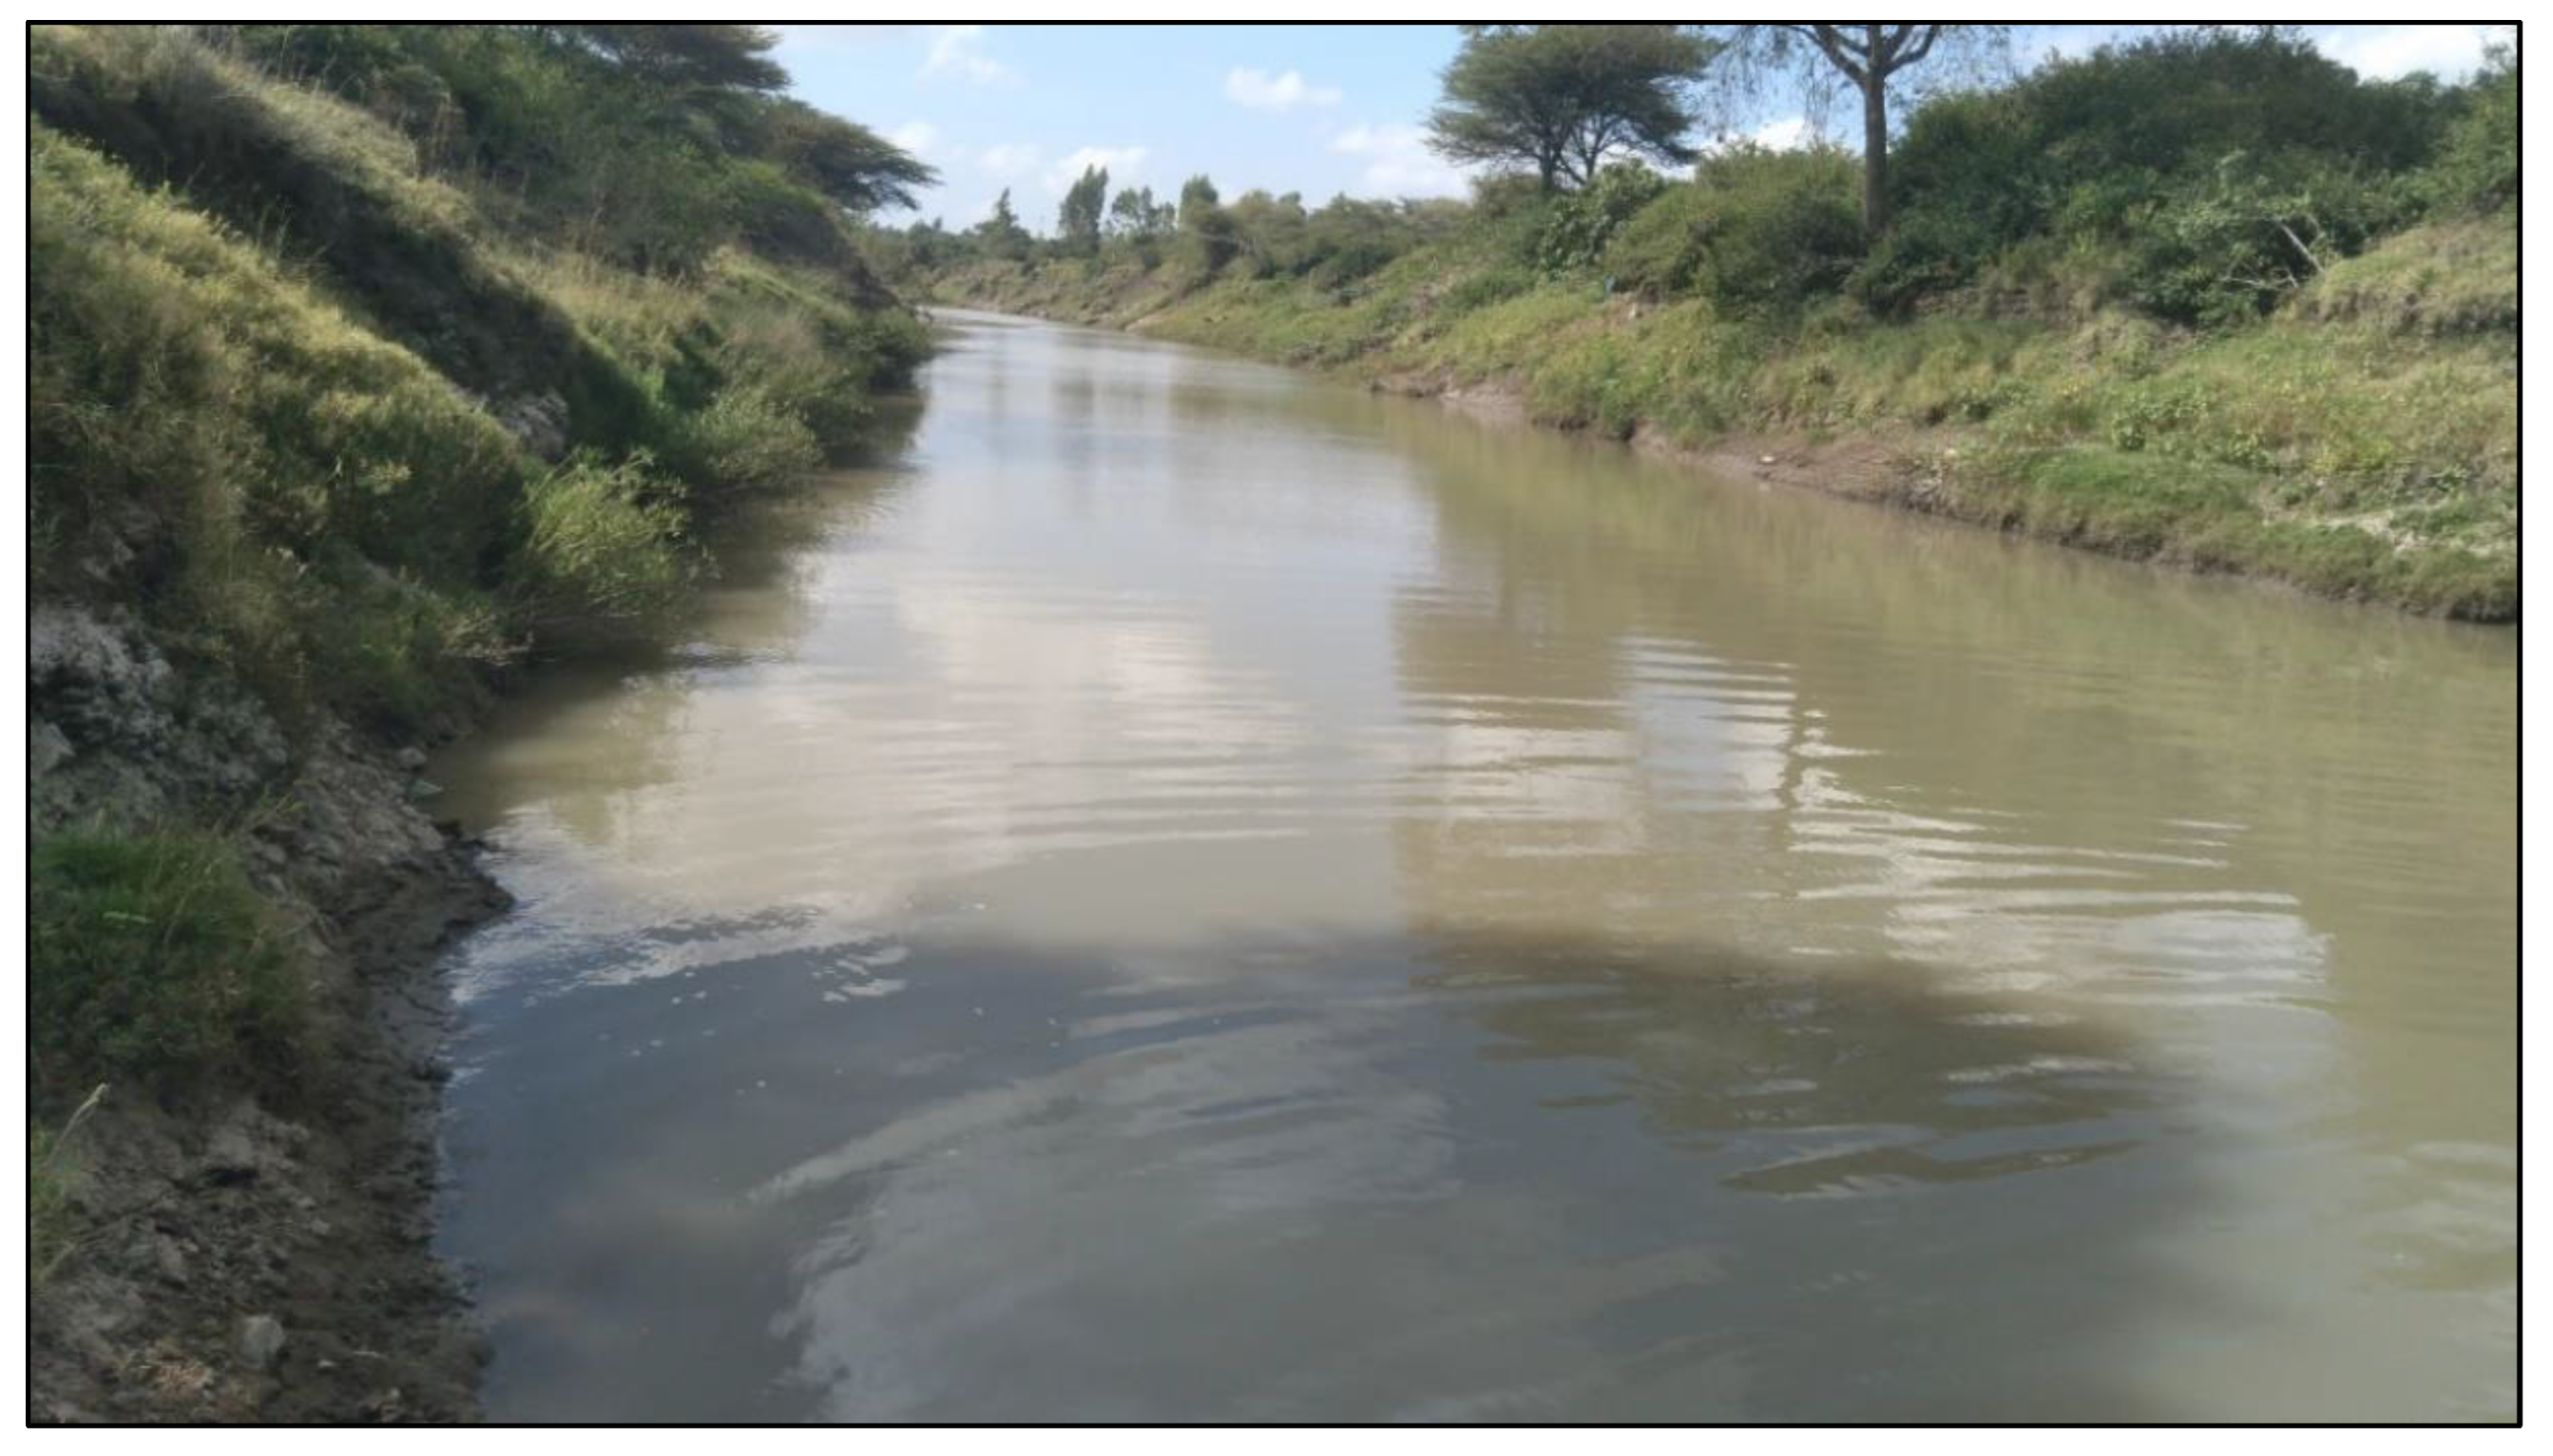
Figure 3.
Data used.
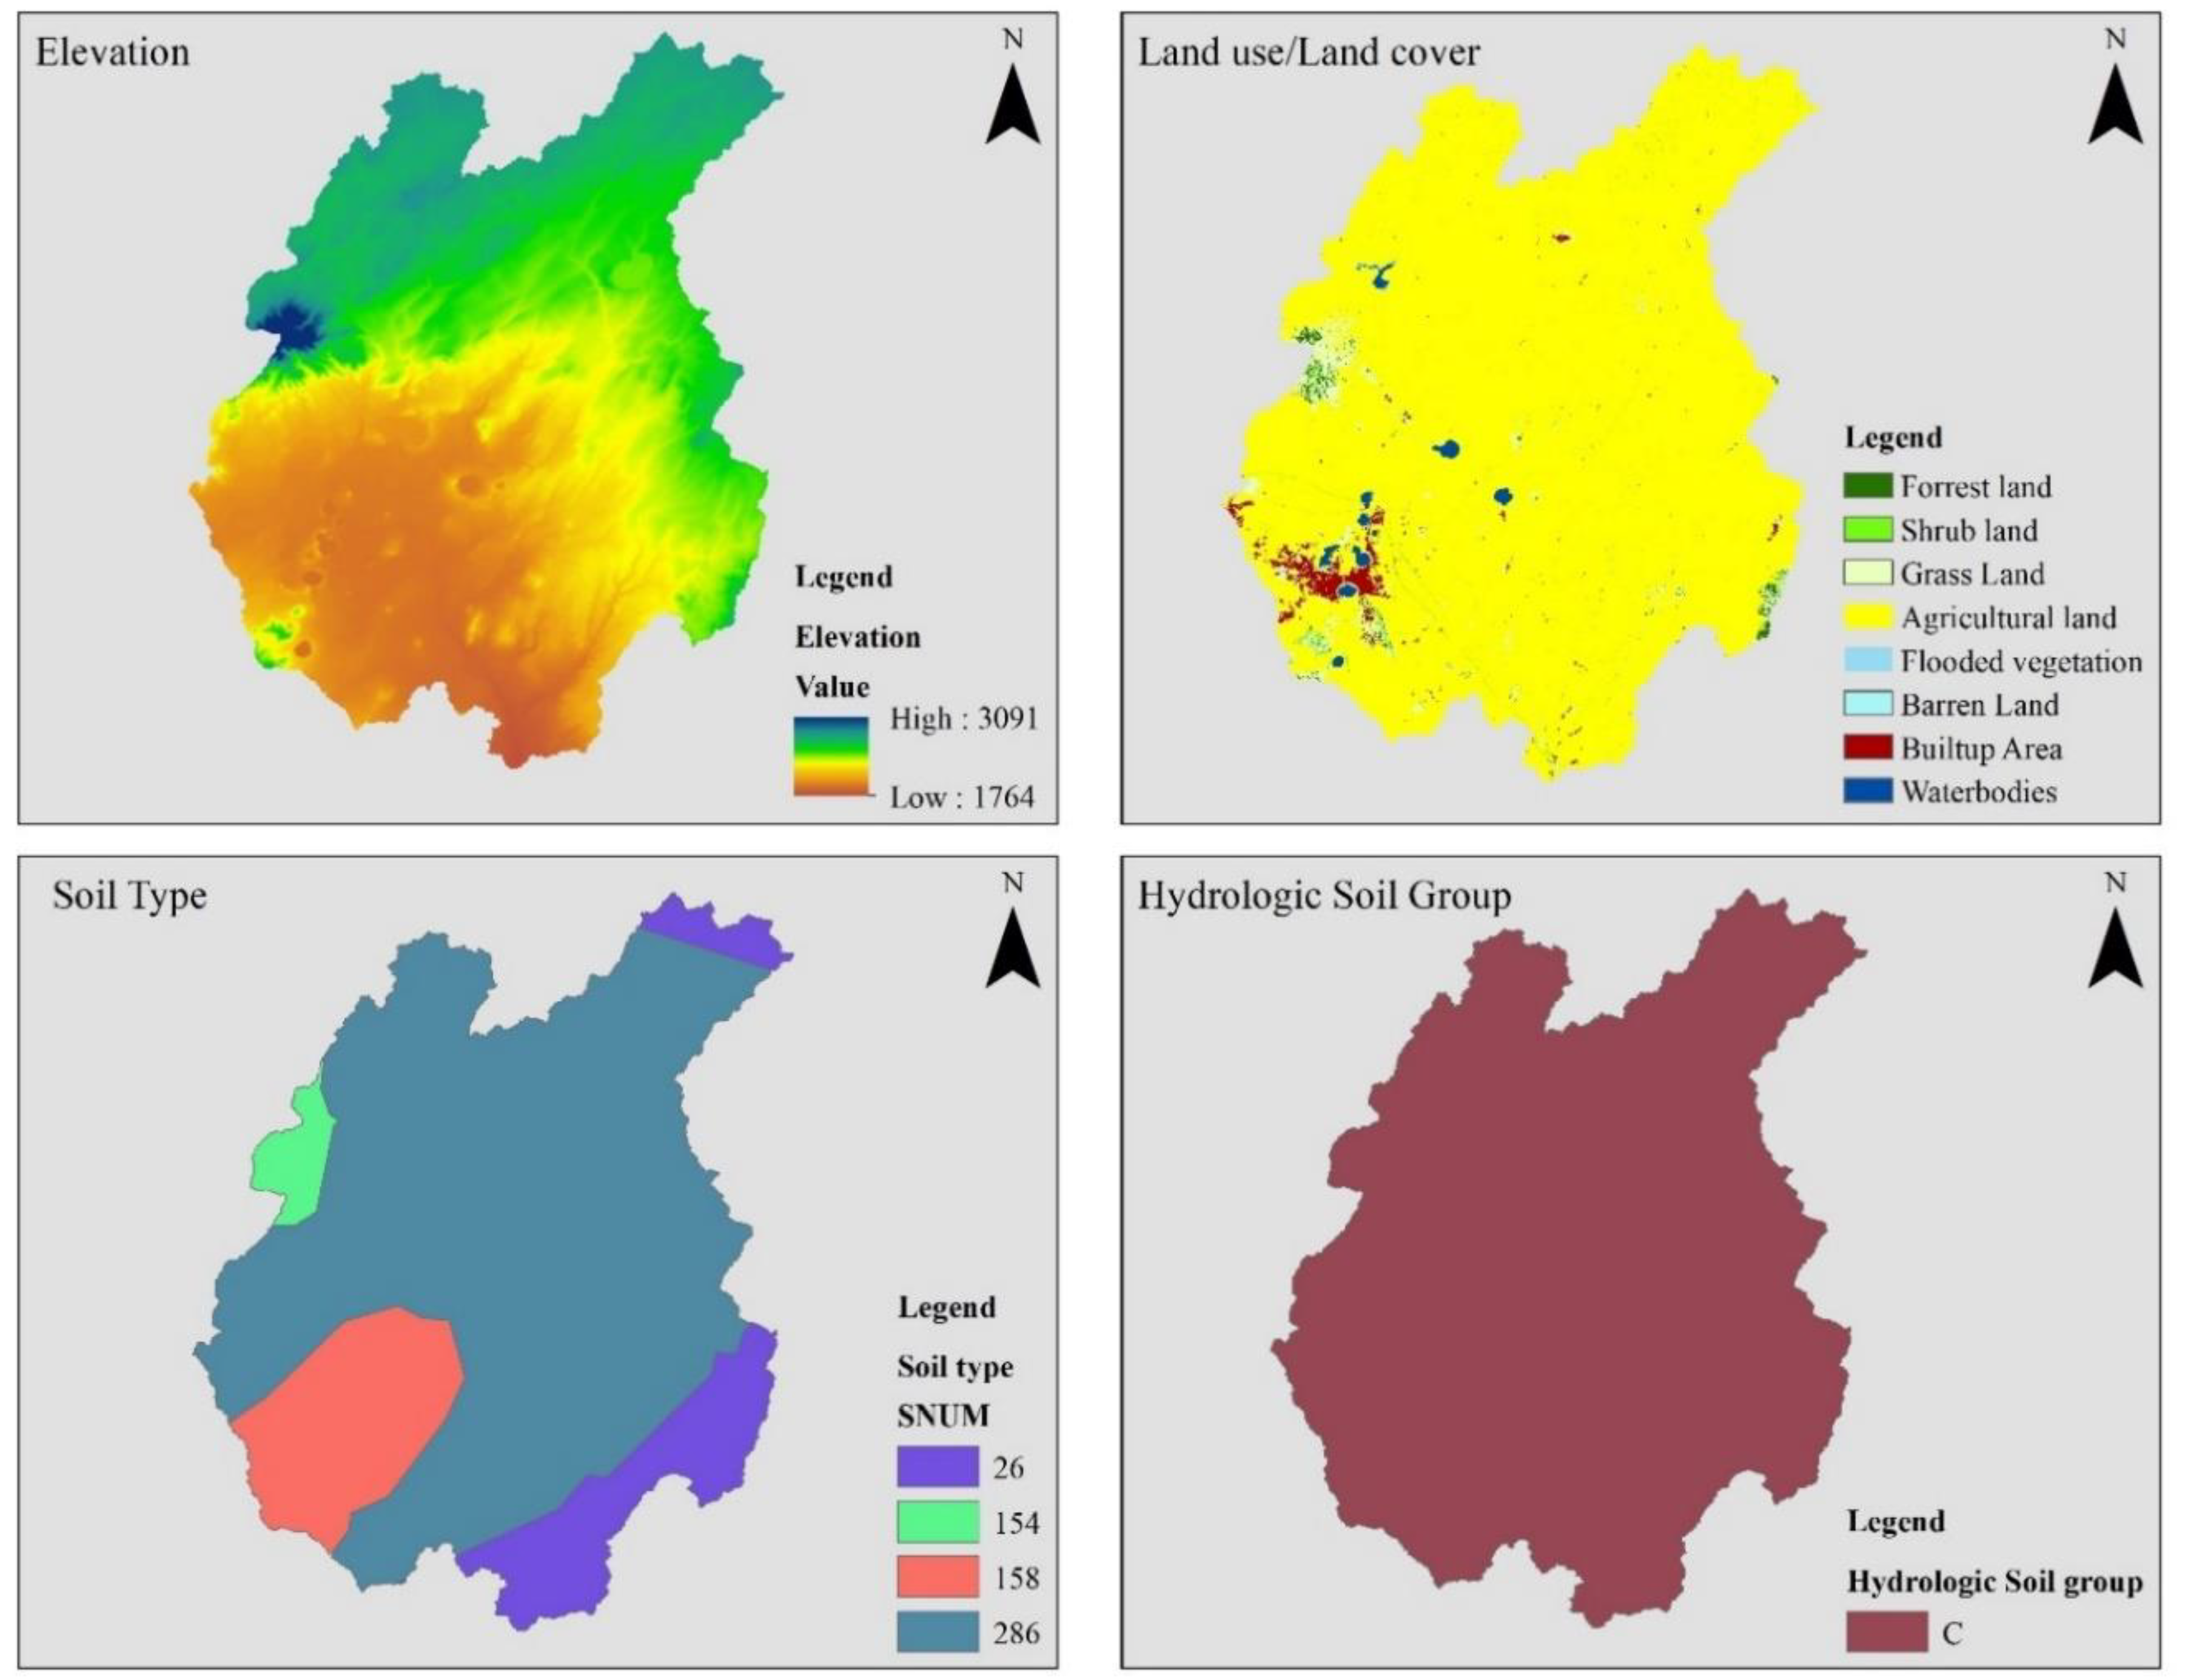
Figure 4.
Methodology flowchart.
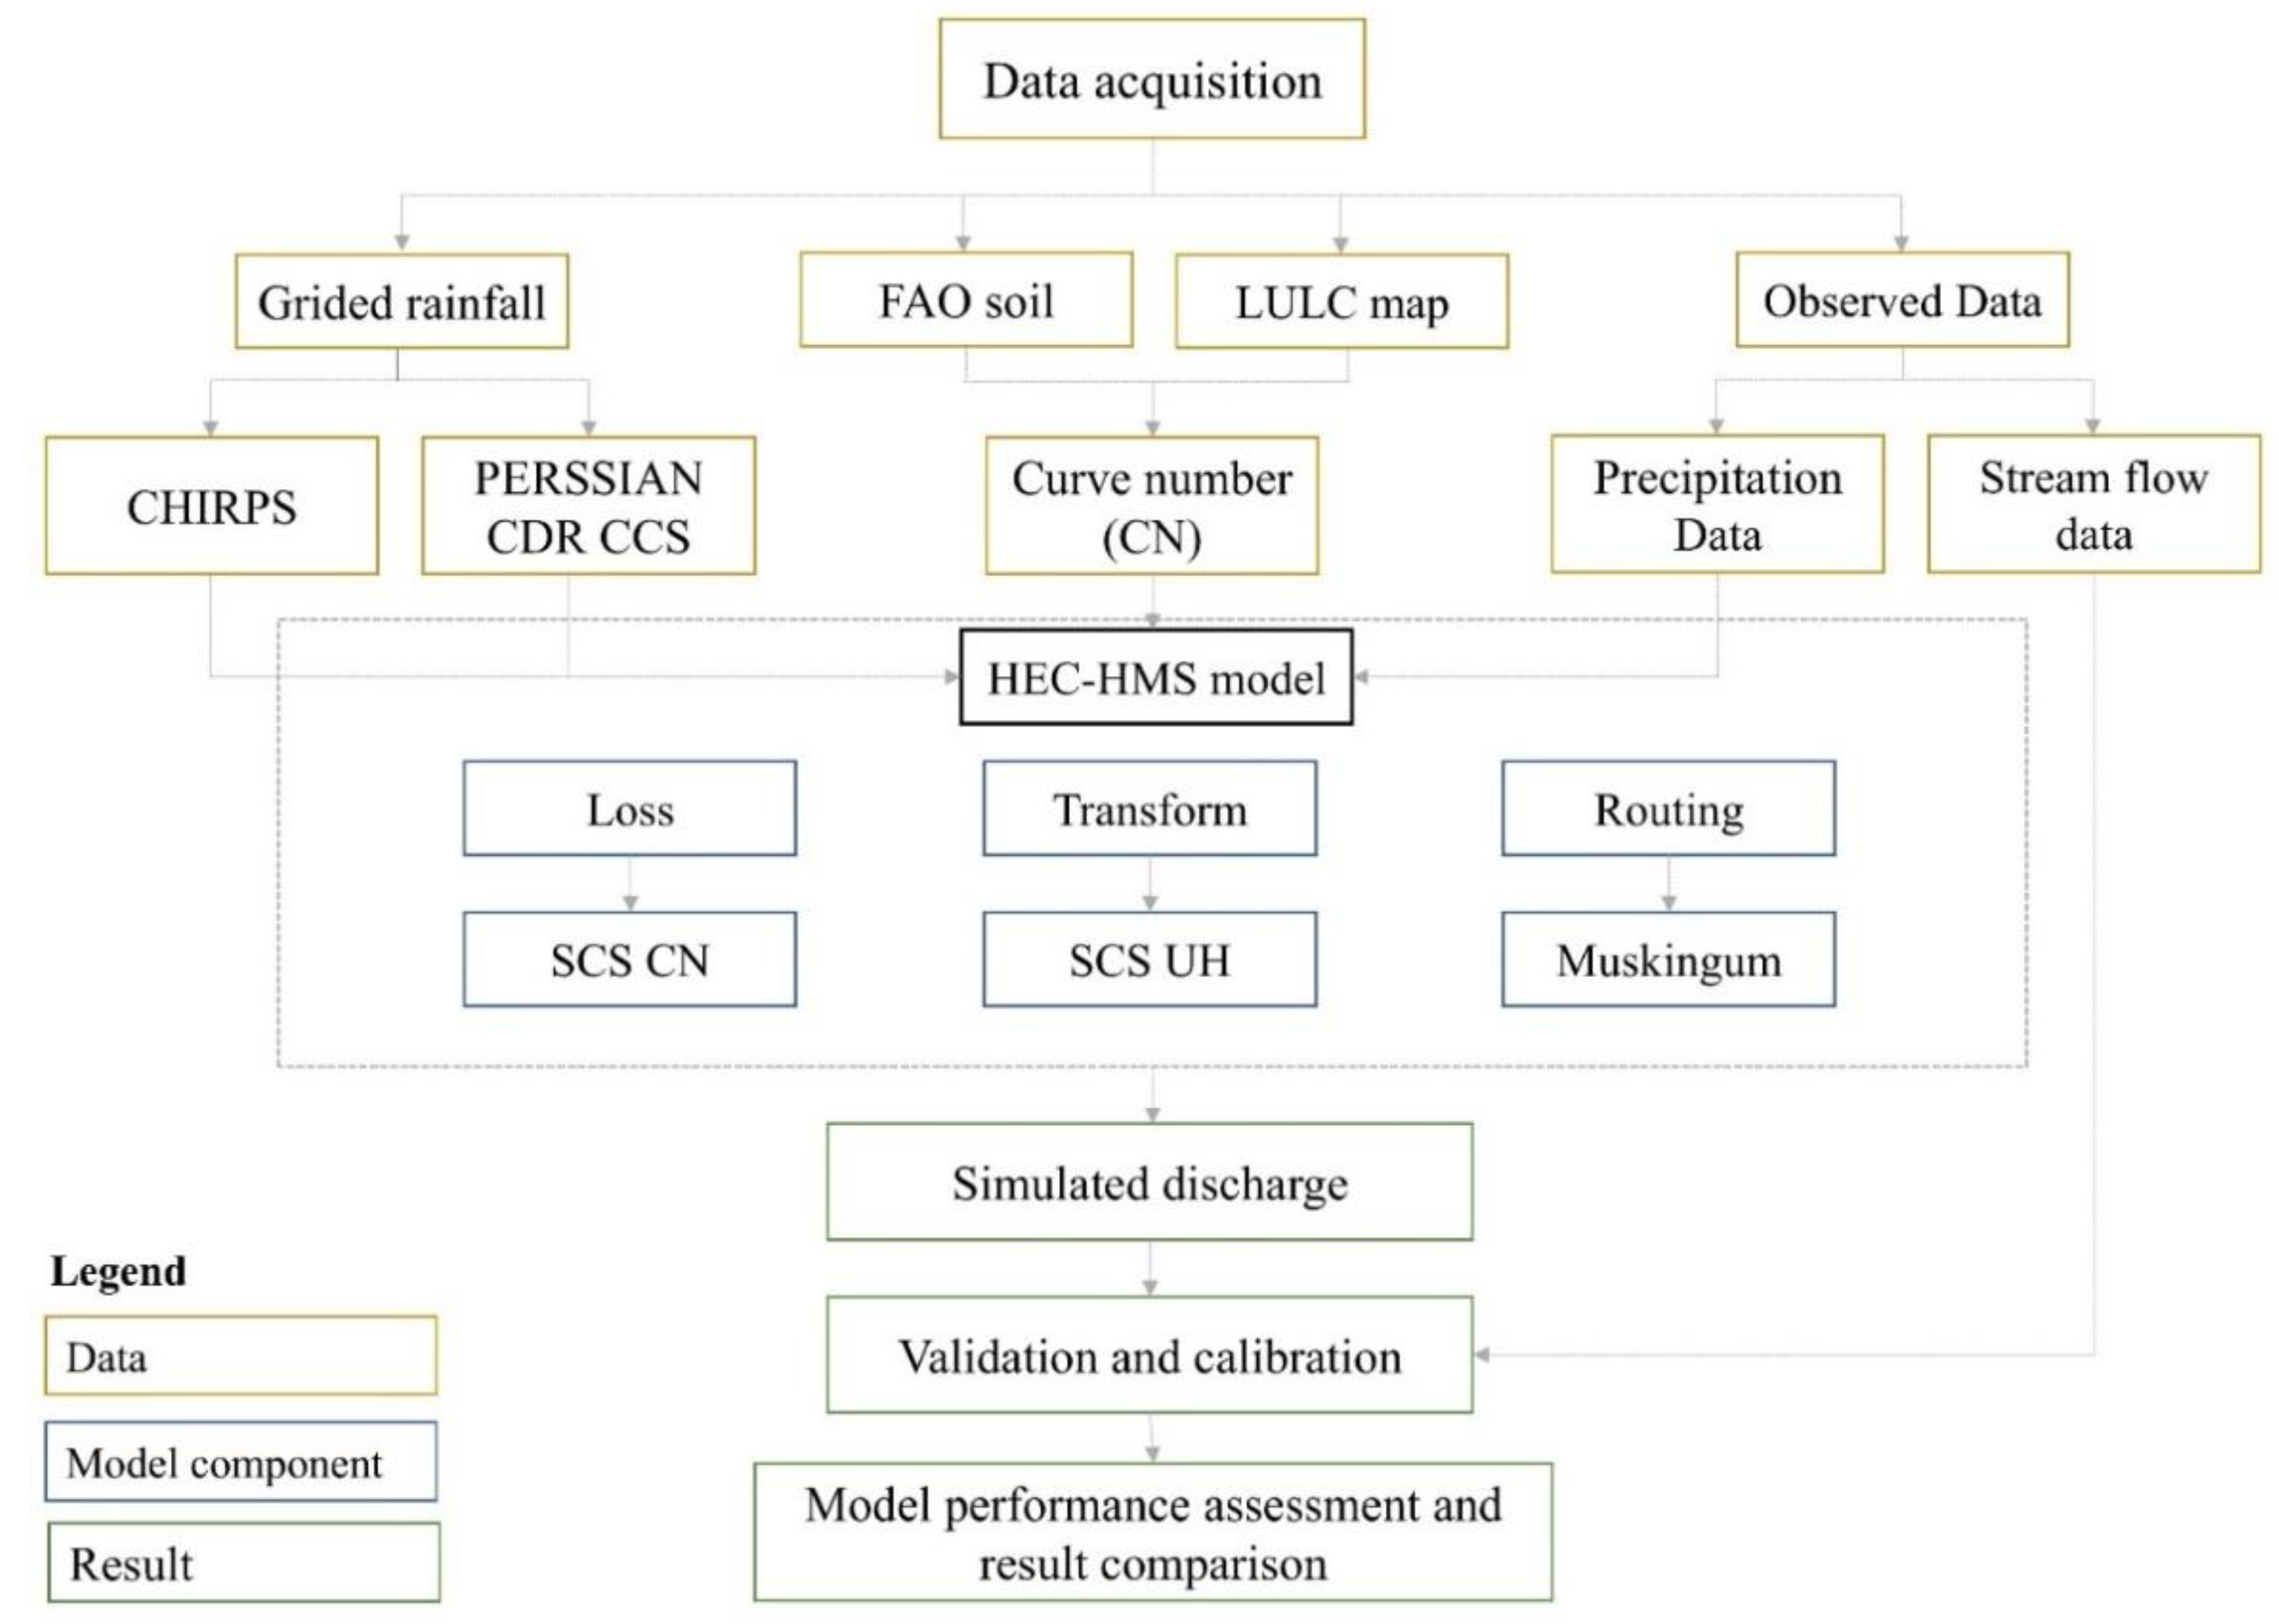
Figure 5.
HEC-HMS model set-up for simulation.
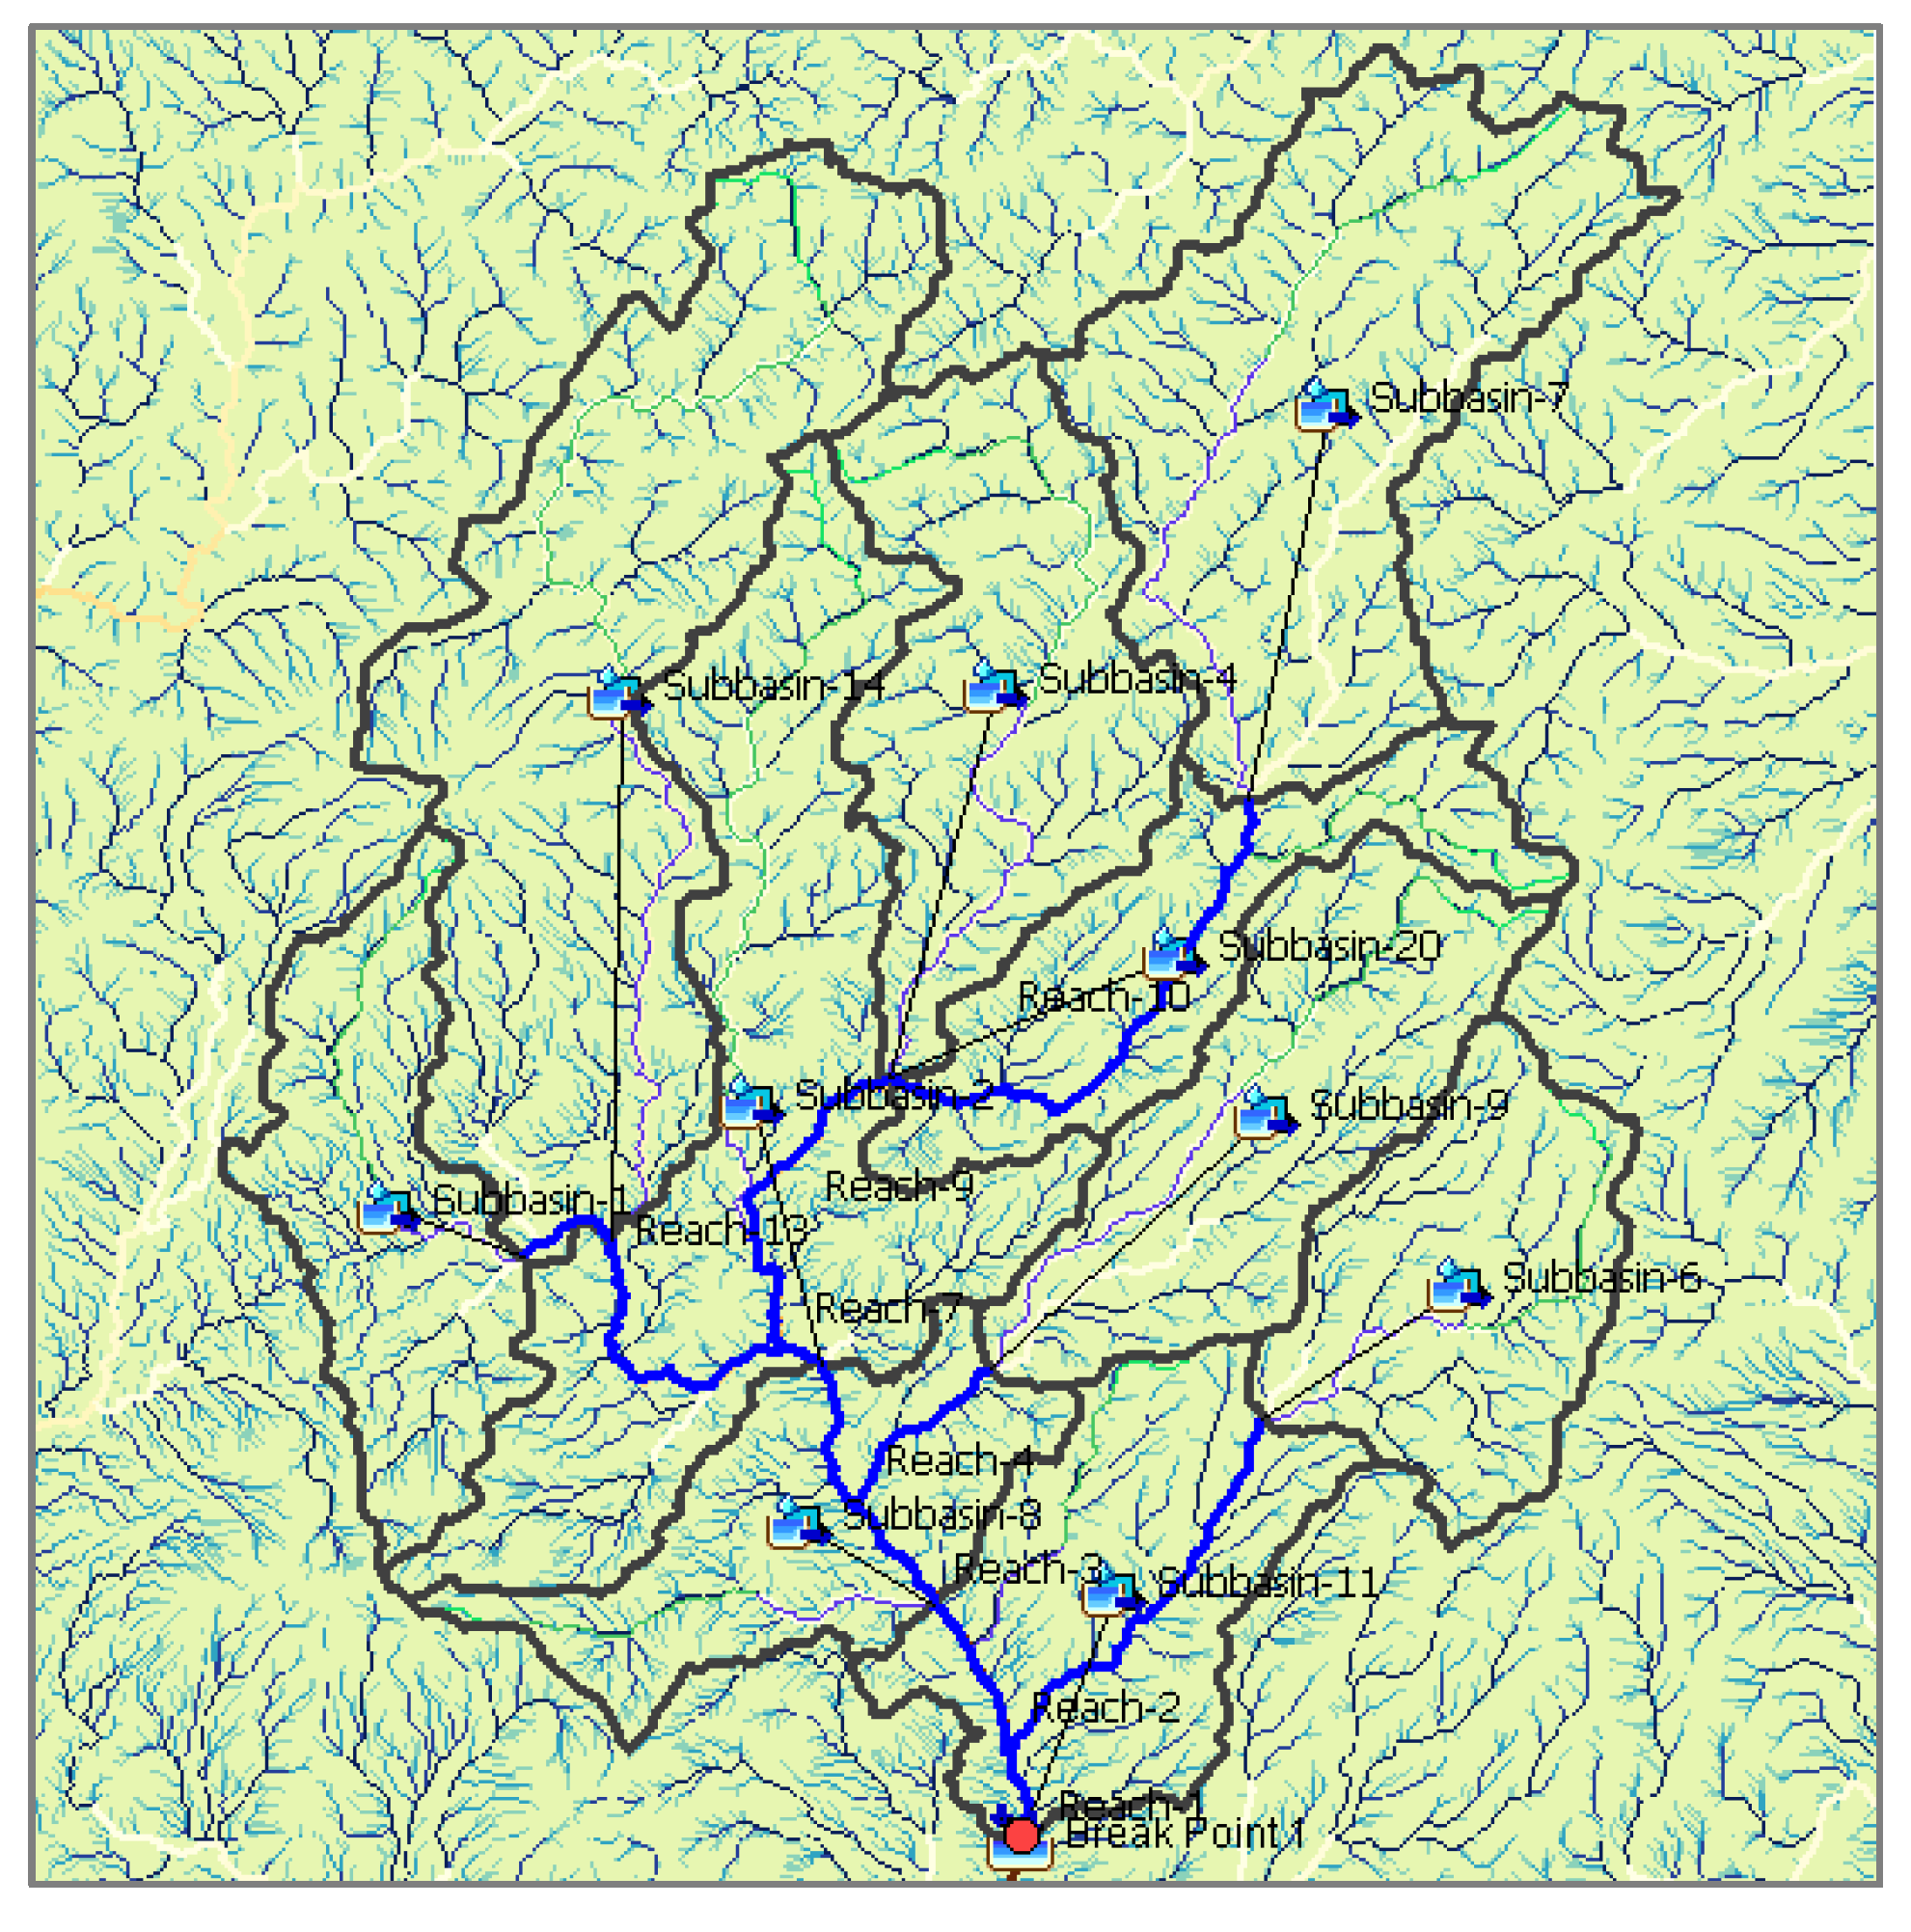
Figure 6.
Sensitivity analysis plot for HEC-HMS parameters.
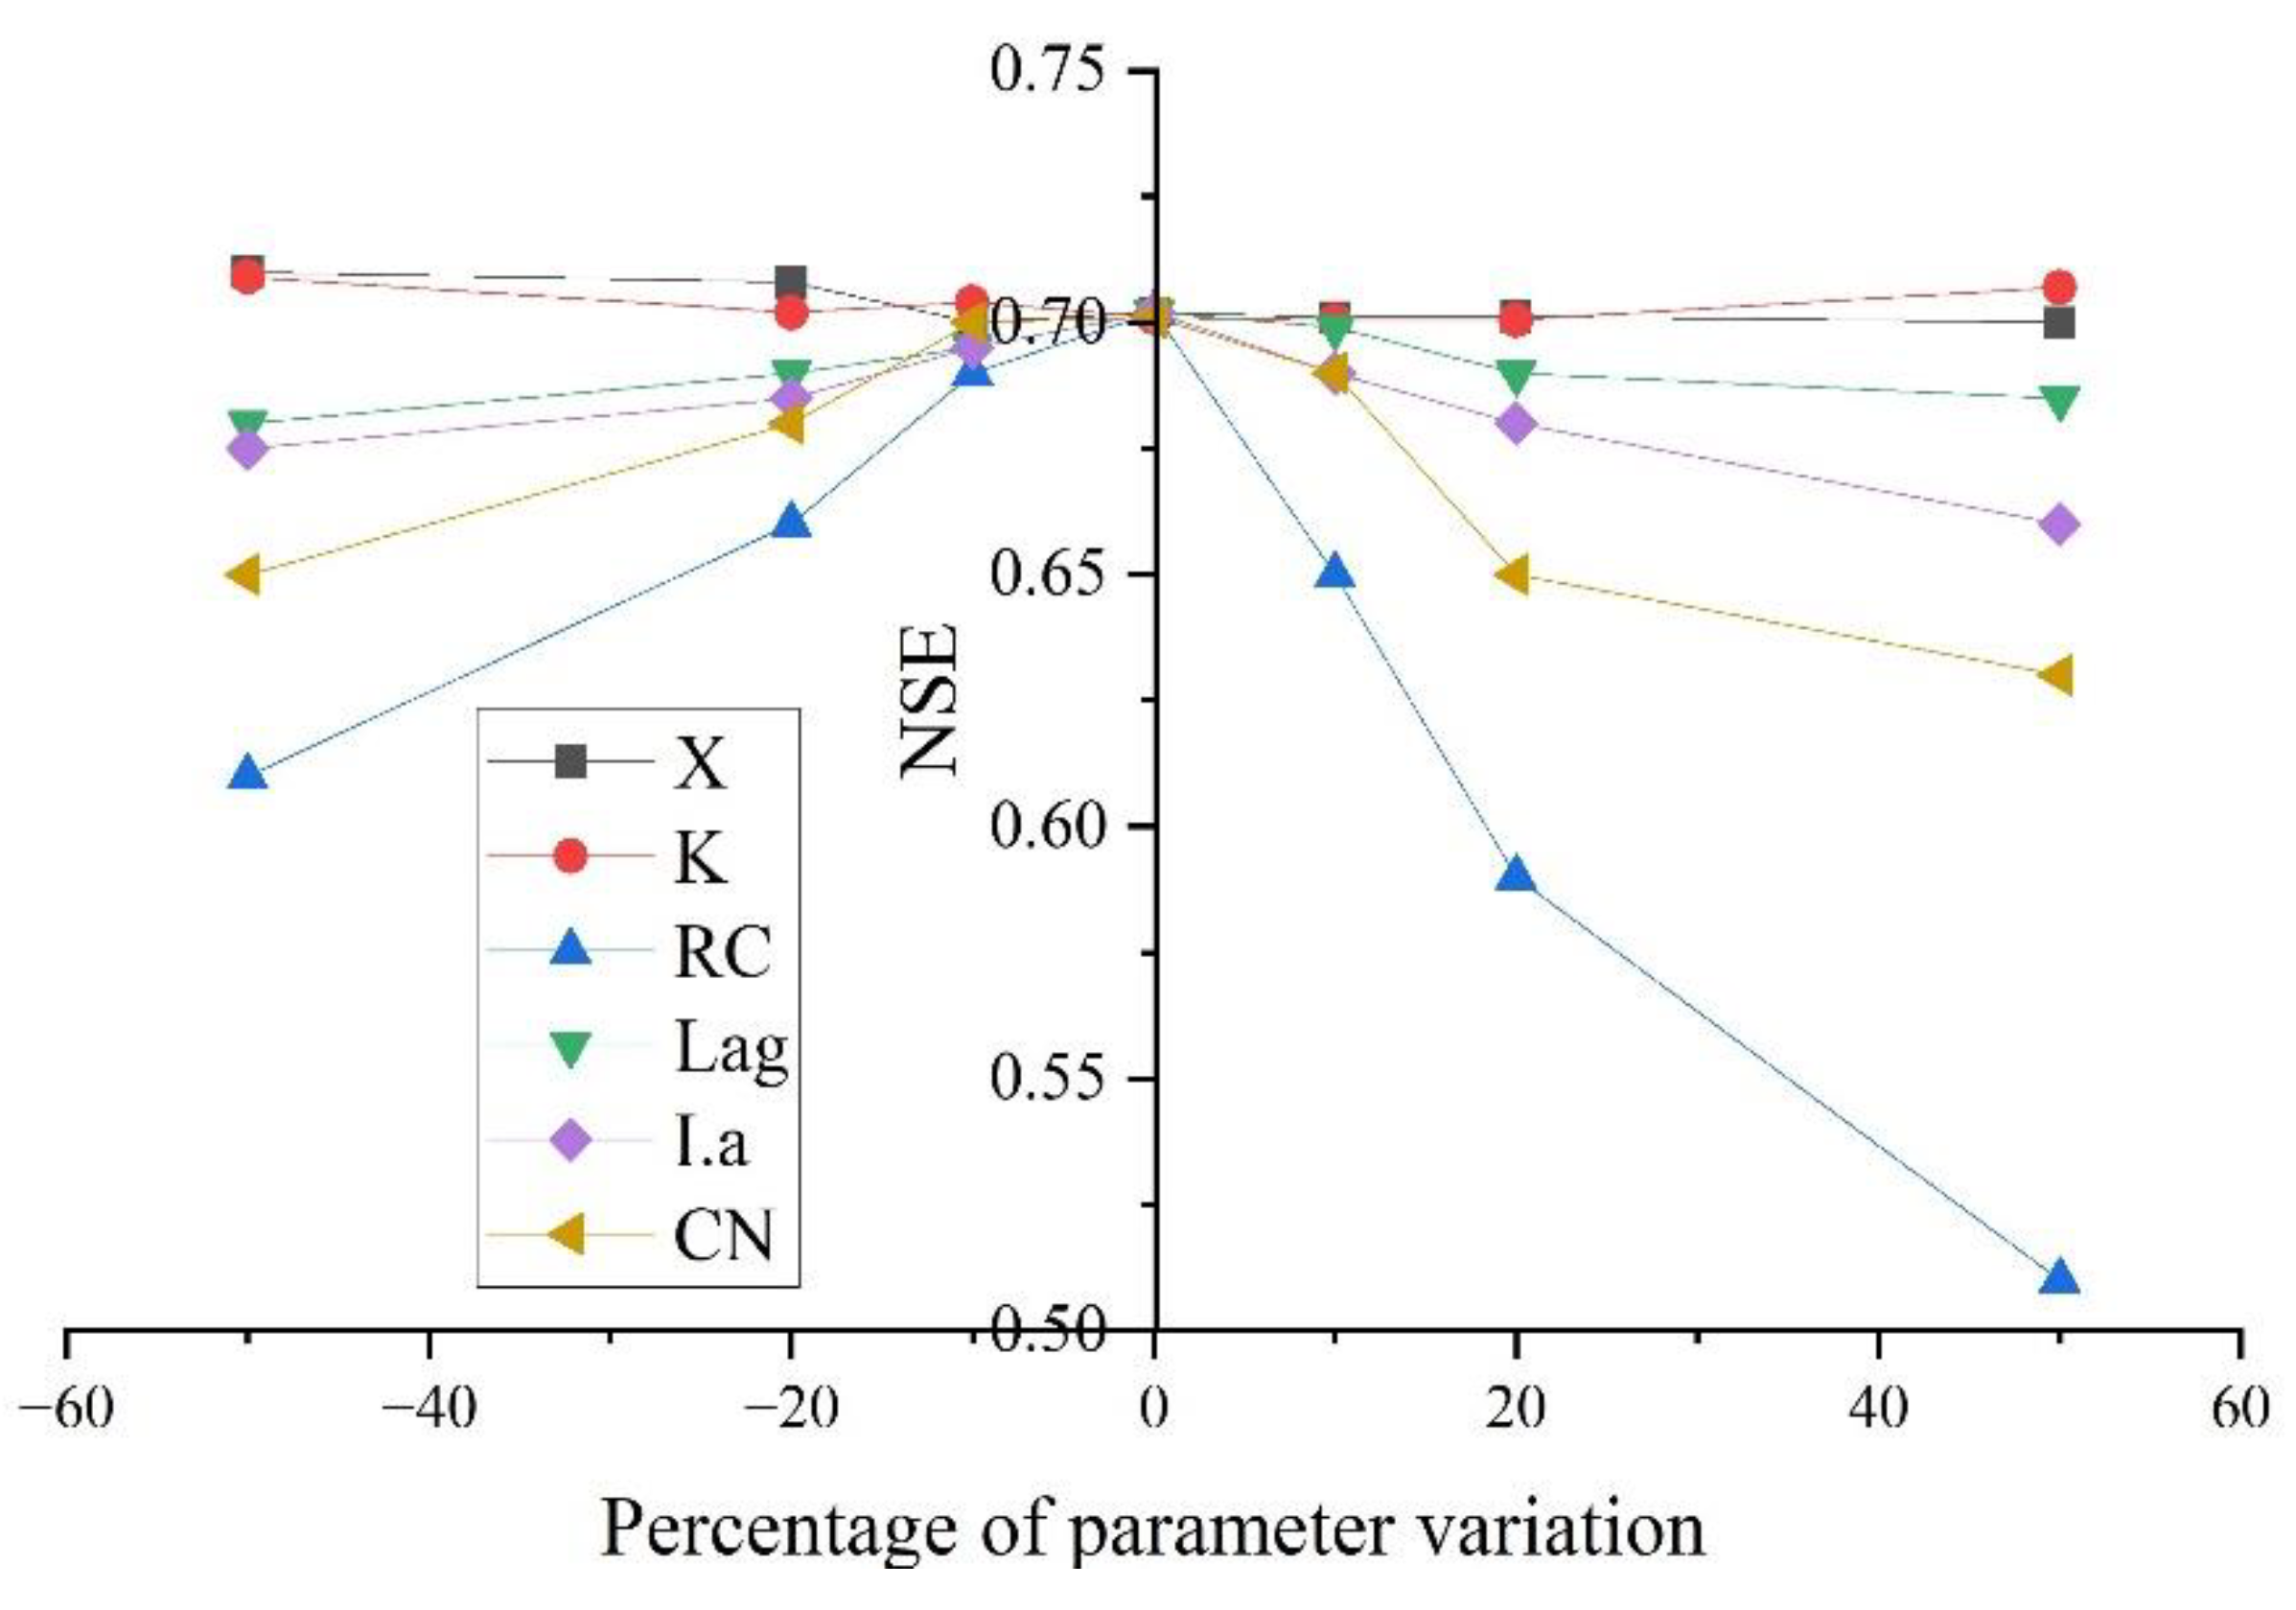
Figure 7.
Simulated and observed hydrographs in calibration and validation period based on a daily basis using observed precipitation data.
Figure 7.
Simulated and observed hydrographs in calibration and validation period based on a daily basis using observed precipitation data.
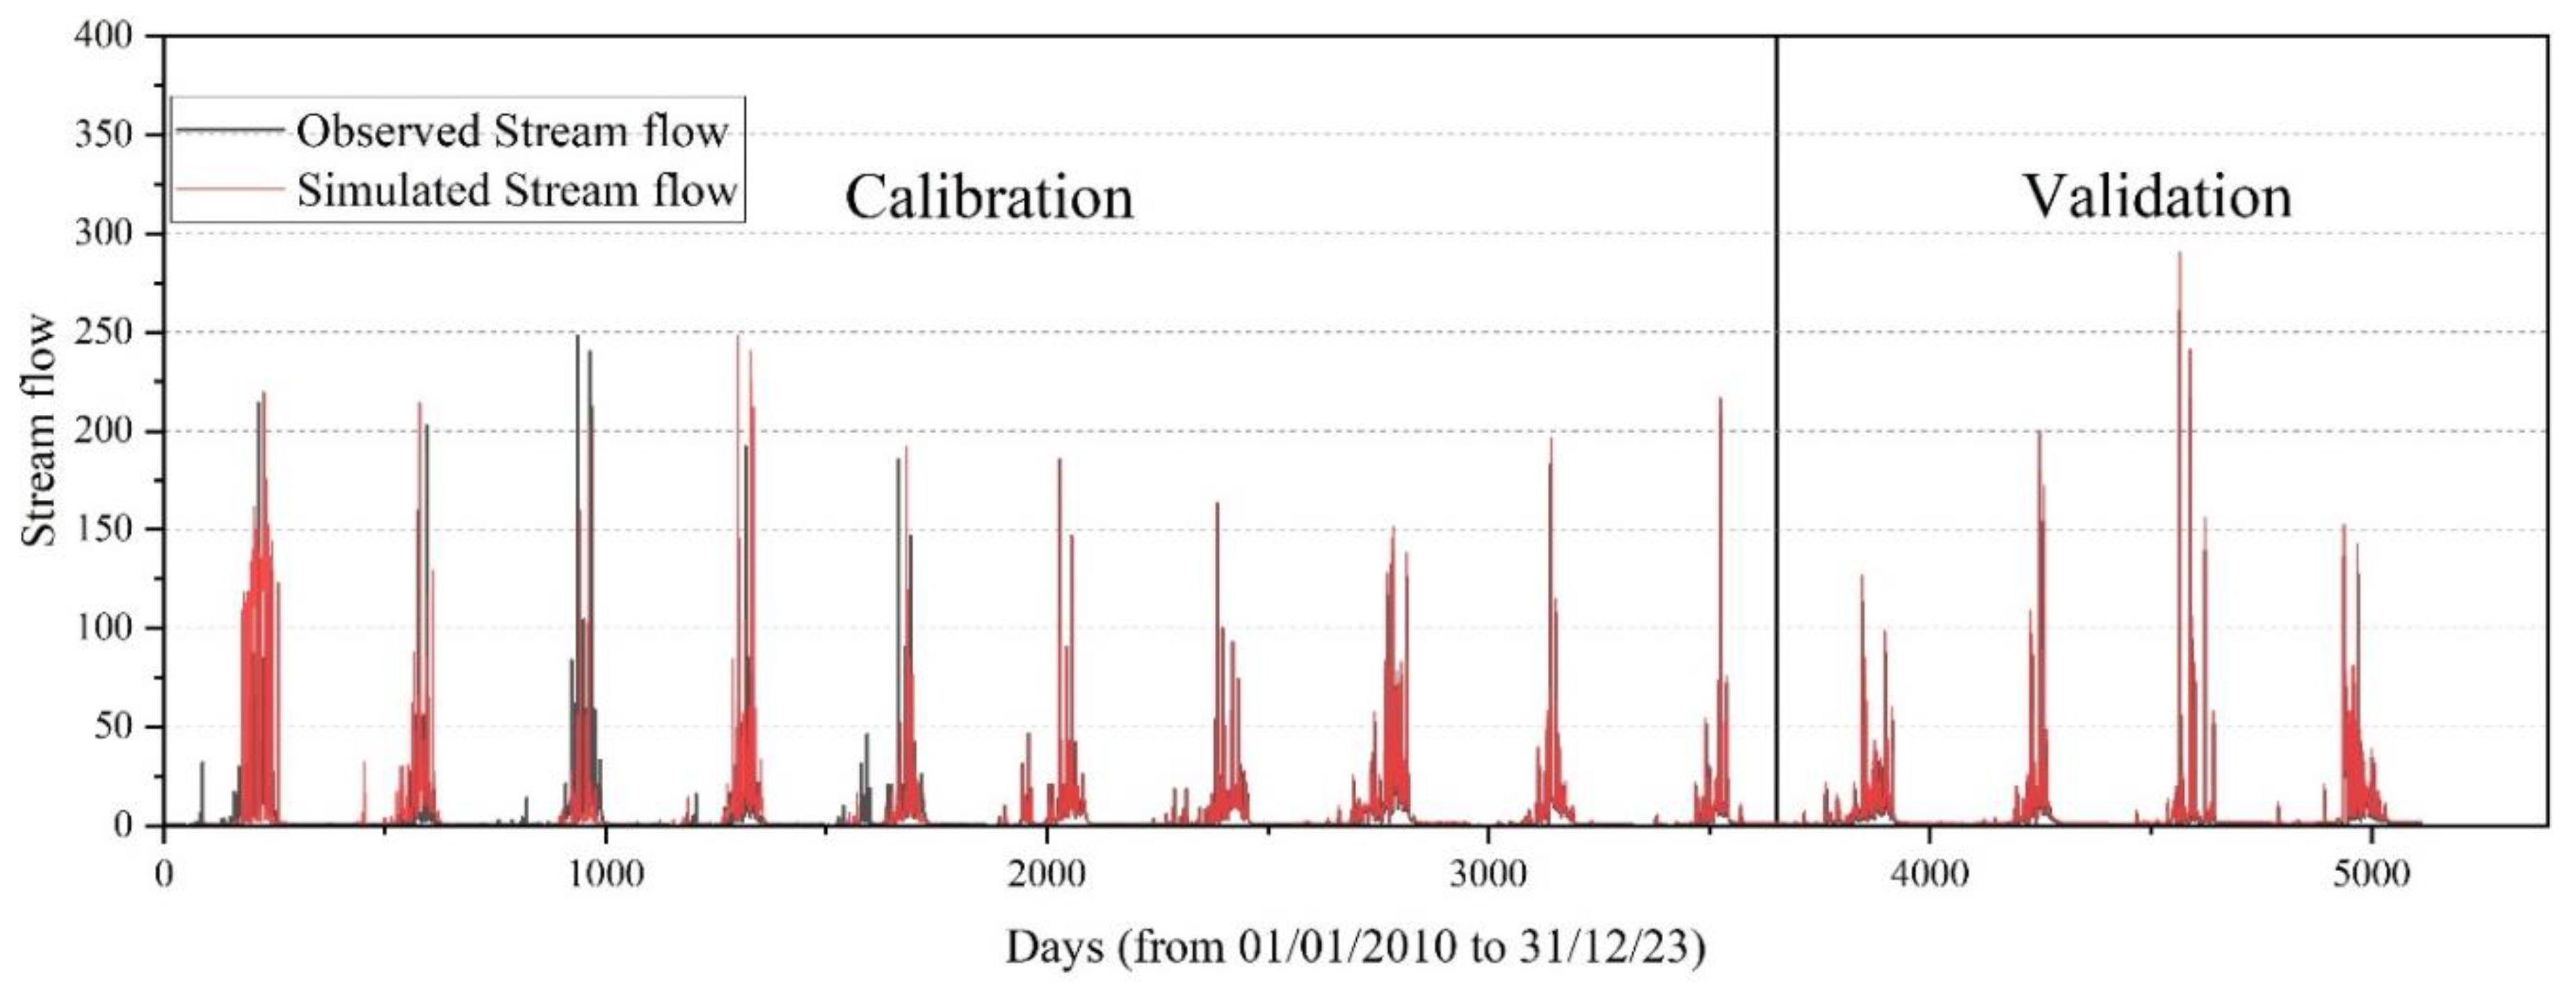
Figure 8.
Simulated and observed hydrographs in calibration and validation period based on a daily basis using CHIRPS rainfall data.
Figure 8.
Simulated and observed hydrographs in calibration and validation period based on a daily basis using CHIRPS rainfall data.
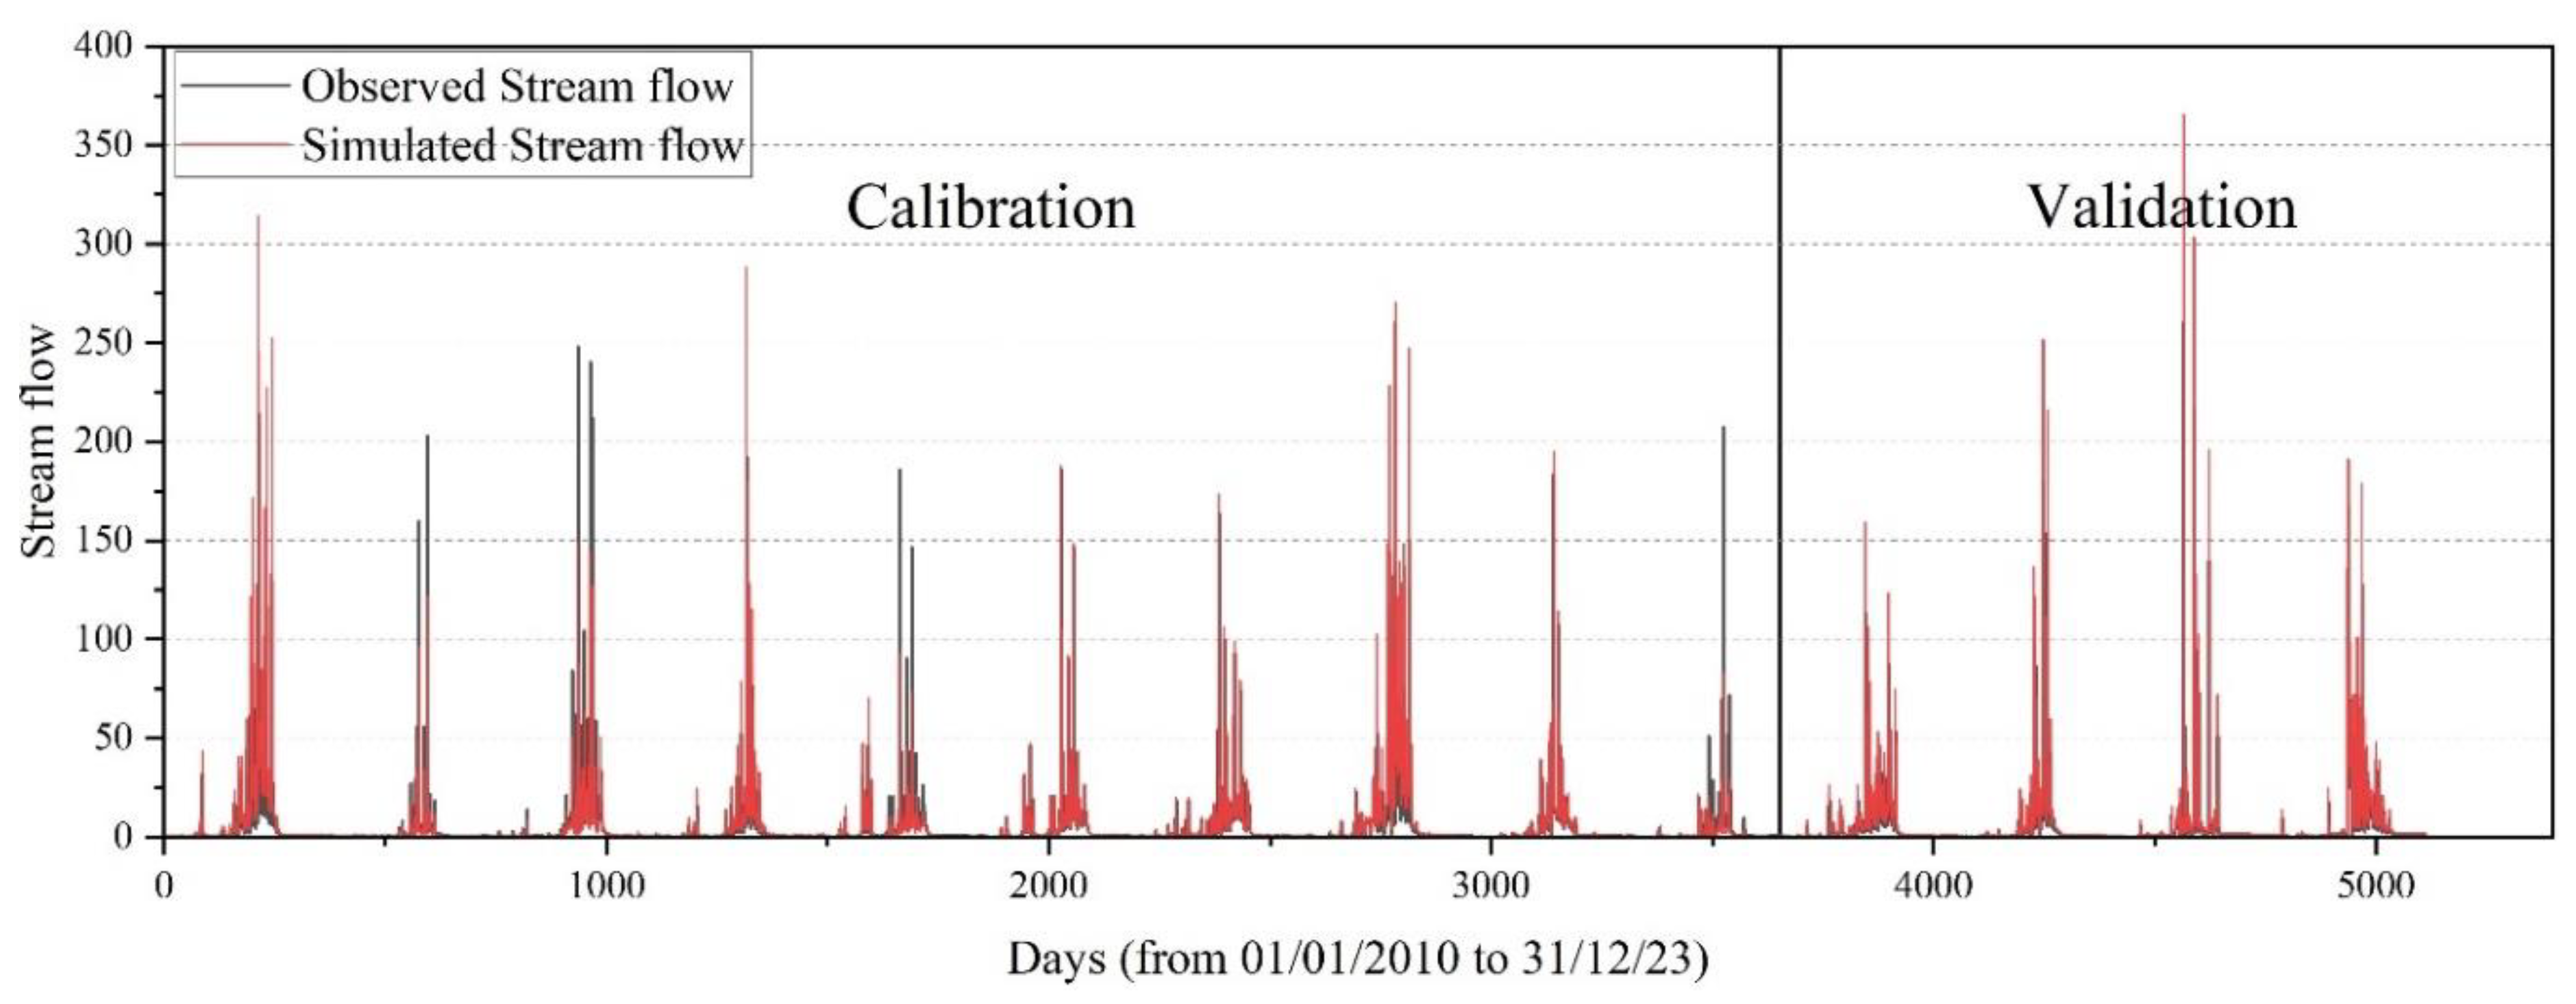

Table 1.
Summary of data used.
| Data type | Source | Spatial resolution | Purpose | Temporal resolution | Date of acquisition |
| DEM | USGS | 30m 30m | Terrain processing | - | 01/08/2024 |
| Soil map | FAO | CN generation | - | 01/08/2024 | |
| LULC | Esri | 10m 10m | CN generation | 2023 | 01/08/2024 |
| Observed rainfall | NMAE | Point data | Model simulation | 2009 – 2023 | 14/07/2024 |
| CHIRPS | UCSB/CHG | 0.05O | Model simulation | “ | 02/08/2024 |
| Observed streamflow | MoWE | Point data | Validation and calibration | “ | 21/07/2024 |
Table 2.
NSE and R2 acceptability range.
| Measurements | Very good | Good | Satisfactory | Unsatisfactory |
| NSE | 0.75–1 | 0.65–0.75 | 0.50–0.65 | <0.50 |
| R2 | 0.75–1 | 0.65–0.75 | 0.50–0.65 | <0.50 |
Table 3.
General Performance evaluations for suggested statistics related to PBIAS (JHS et al., 2019).
Table 3.
General Performance evaluations for suggested statistics related to PBIAS (JHS et al., 2019).
| PBIAS | value<±10 | ±10≤value<±15 | ±15≤value<±25 | value≥±25 |
| Performance Rating | Very good | Good | Satisfactory | Unsatisfactory |
Table 4.
Performance measurement matrices for all simulation.
| `Data type | Simulation | Performance measurement metrics | |||
| NSE | PBIAS | R2 | |||
| Observed | Calibration | 0.842 | -2.89 | 0.85 | |
| Validation | 0.751 | -3.112 | 0.78 | ||
| CHIRPS | Calibration | 0.711 | +5.6 | 0.72 | |
| Validation | 0.622 | +7.98 | 0.64 | ||
Disclaimer/Publisher’s Note: The statements, opinions and data contained in all publications are solely those of the individual author(s) and contributor(s) and not of MDPI and/or the editor(s). MDPI and/or the editor(s) disclaim responsibility for any injury to people or property resulting from any ideas, methods, instructions or products referred to in the content. |
© 2025 by the authors. Licensee MDPI, Basel, Switzerland. This article is an open access article distributed under the terms and conditions of the Creative Commons Attribution (CC BY) license (http://creativecommons.org/licenses/by/4.0/).
Copyright: This open access article is published under a Creative Commons CC BY 4.0 license, which permit the free download, distribution, and reuse, provided that the author and preprint are cited in any reuse.


