
Submitted:
10 January 2025
Posted:
10 January 2025
You are already at the latest version
Abstract
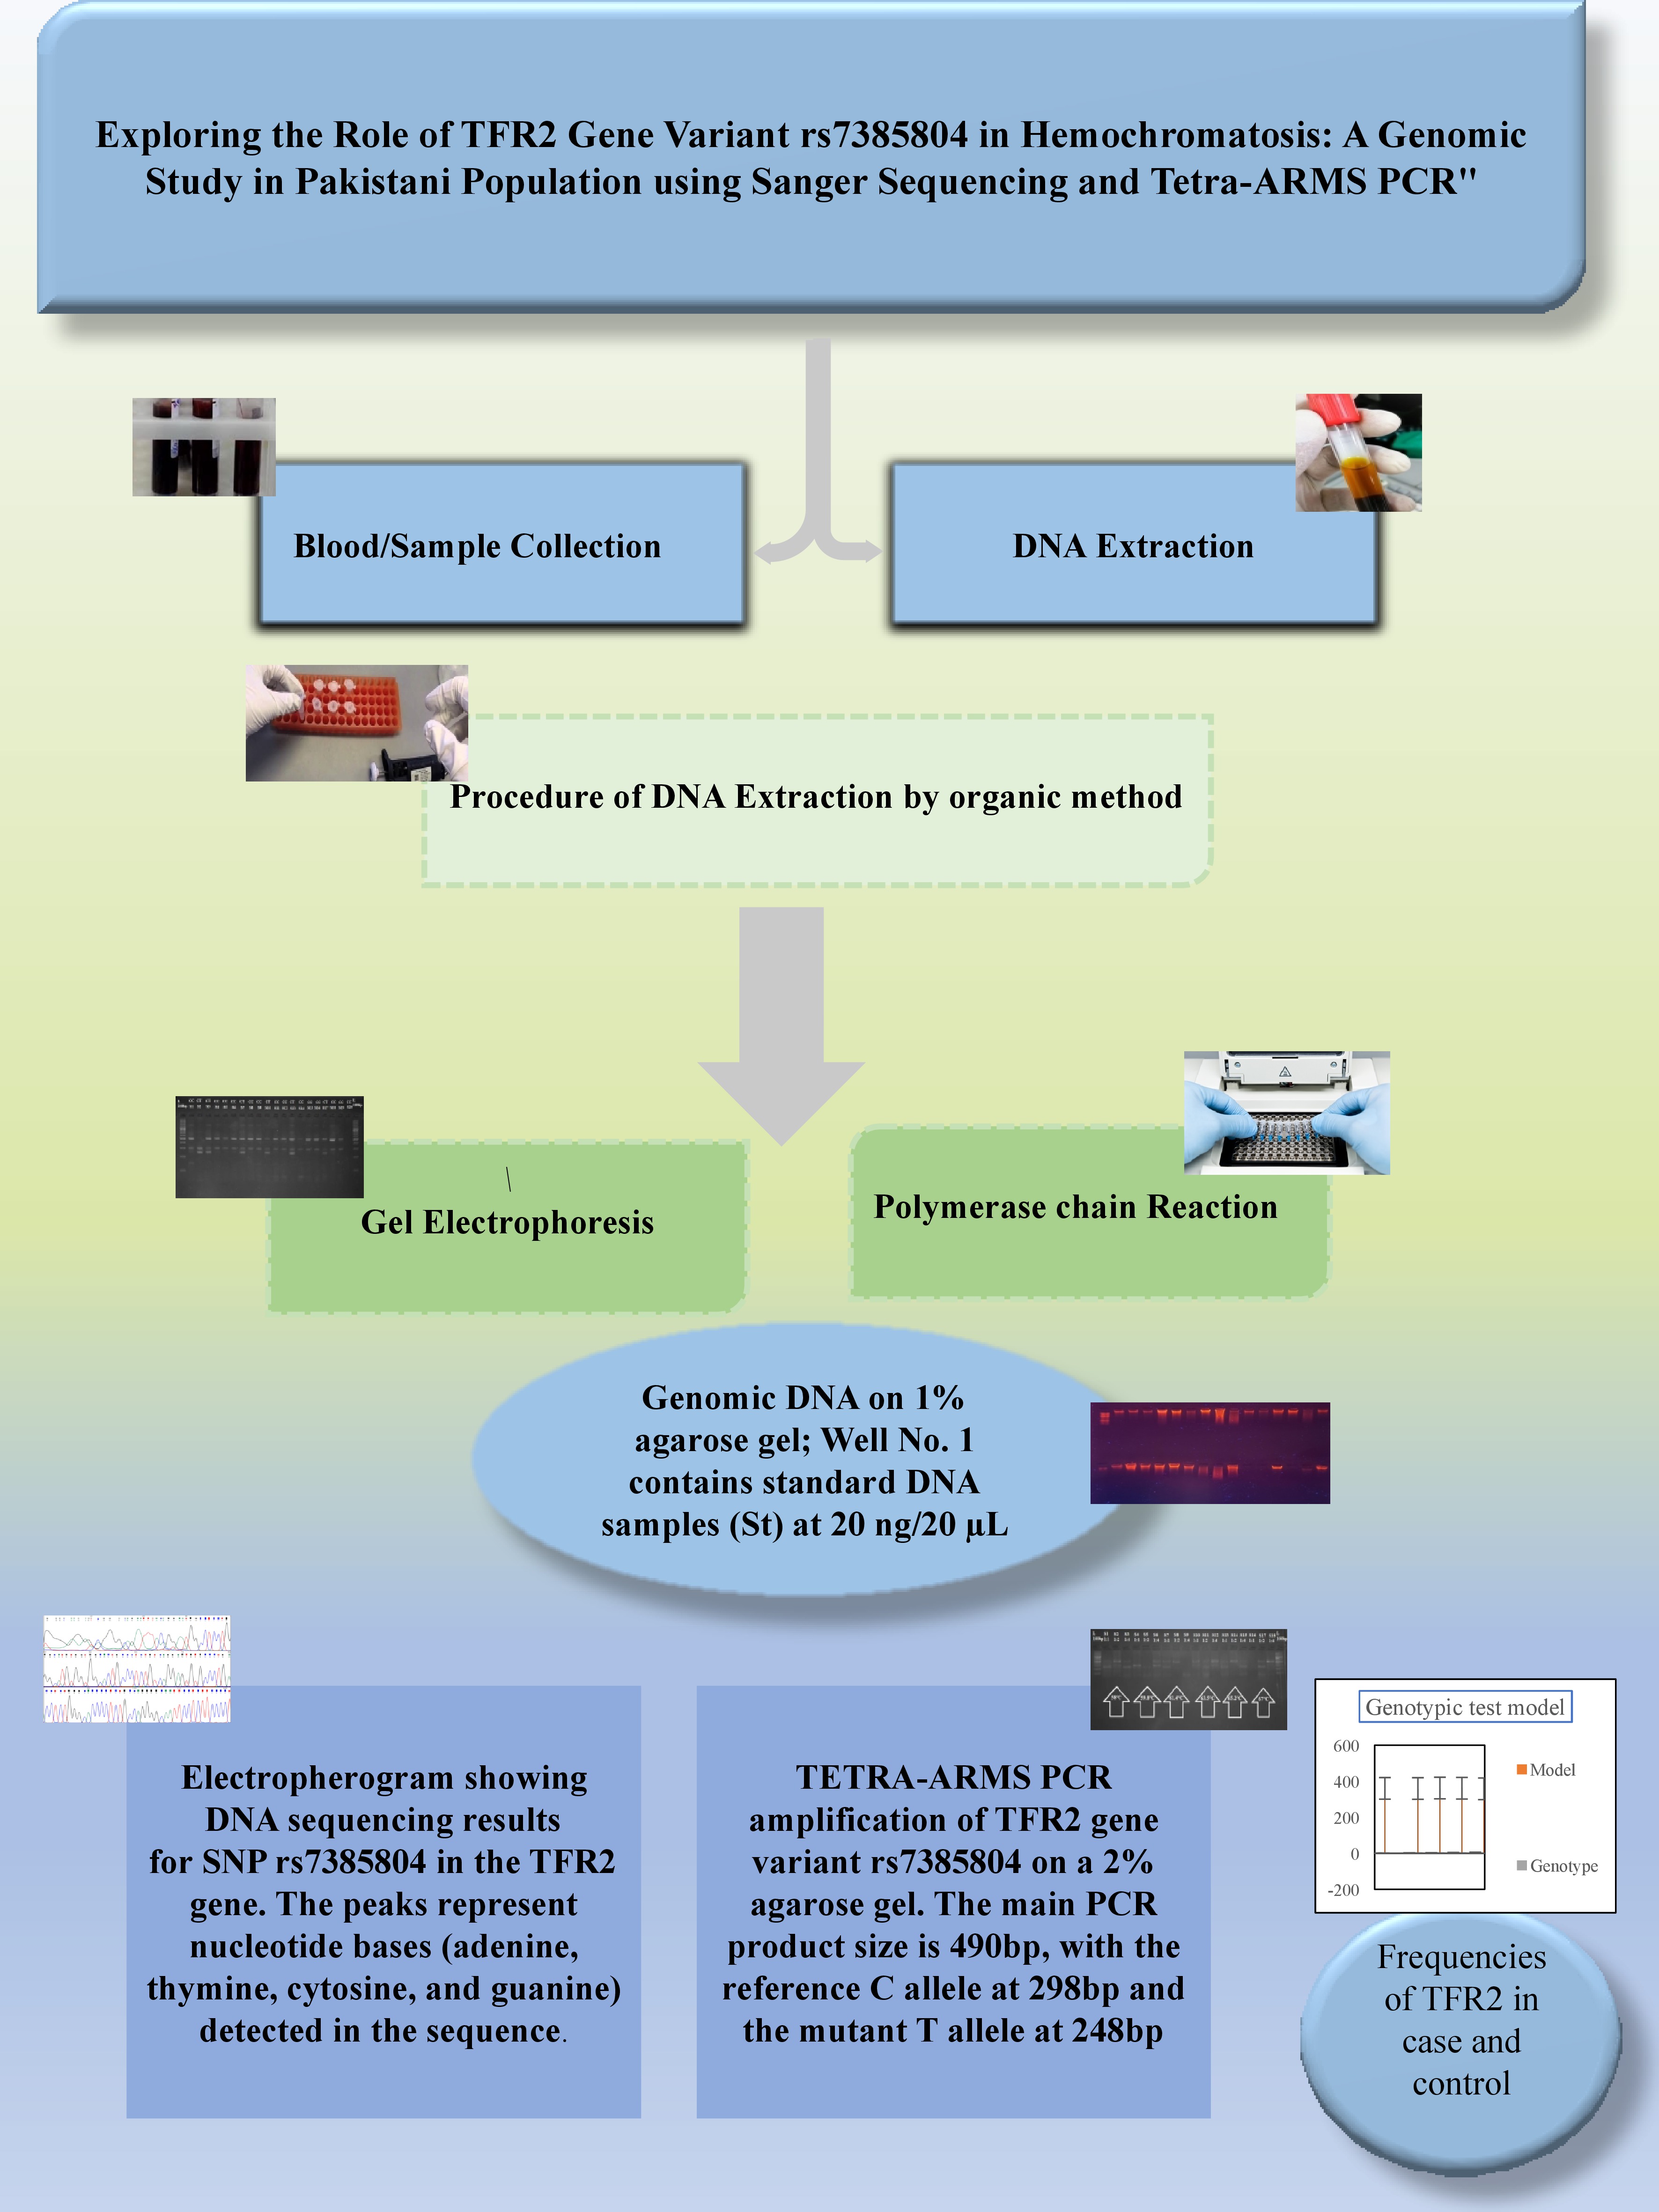
Hemochromatosis is an autosomal recessive iron overload disorder. The TFR2 gene variant rs7385804 has been implicated in hemochromatosis, but its role in the Pakistani population remains unexplored. This study intended to examine association of TFR2 gene variant rs7385804 with hemochromatosis in Pakistani individuals. We employed a case-control study design, recruiting 200 hemochromatosis patients and 200 healthy controls from Pakistani population. Deoxyribonucleic acid was isolated from blood samples using the phenol-chloroform method. Sanger sequencing and Tetra-ARMS PCR were used to identified the TFR2 genes and its variant rs7385804.Our results showed a significant association between TFR2 gene variant rs7385804 and hemochromatosis in Pakistani population (p < 0.001). The rate of the abnormal alleles was (35%) higher than control (15%). Sanger sequencing confirmed the presence of the variant in 70% of patients, while Tetra-ARMS PCR showed 90% concordance with sequencing results. This study demonstrates the utility of Sanger sequencing and Tetra-ARMS PCR in detecting TFR2 gene variant rs7385804 in Pakistani population. Our findings suggest that this variant may serve as a genetic marker for hemochromatosis in this population. More research is required to authorize these outcomes and discover the clinical consequences of this association.
Keywords:
Hemojuveline
; hepatocytes
; hemochromatosis
; hepcidin
; ferroprotein
1. Introduction
Hemochromatosis (HH) is a inherited diseases categorized by unnecessary iron development in the body (Bardou-Jacquet et al.). This pathological iron overload primarily affects body part such as the liver, heart and pancreas. When not treated on time, it may be creating severe complications, like as liver disorders, diabetes, and heart diseases (Kanwar and Kowdley). Hepcidin is the primary manager of iron hemostasis. When the level of Hepcidin decreased iron consumption enhanced. The HFE gene, located on chromosome 6, which is perform a vital role in metabolism of iron. Mutations in this gene impair the function of the HFE protein, leading to enhanced intestinal iron absorption (Fernandes et al.). Under normal conditions, the HFE protein interrelates with the transferrin receptor to normalize Fe acceptance to food. However, the C282Y mutation in the HFE gene disrupts this interaction, resulting in uncontrolled iron absorbance and deposition in organs. Over time, this iron accumulation can cause significant damage, manifesting as liver cirrhosis, diabetes, and heart disease (Costa et al.). The penetrance of HH, well-defined as the quantity of persons with the transmutation who has medical signs, is flexible. Not all individuals with the C282Y mutation develop iron overload or associated complications, suggesting the influence of additional genetic, environmental, and lifestyle factors on disease expression. Beyond HFE mutations, other genes such as HJV, HAMP, and TFR2 have also been linked to non-HFE related hemochromatosis, although these cases are considerably less common (Katsarou et al.).
Hereditary hemochromatosis or primary hemochromatosis also termed HFE hemochromatosis. HFE gene also known as human homeostatic iron regulator protein an activator of Hepcidin.(Finlayson) Hemochromatosis occurs in the body due to the results of pathogenetic variants in different genes which increases iron body stores and also a heavy amount of iron stores in the different organs of the body. The 2 most crucial advancements in the field of HH disease occupied dwelling in the previous eras. The first one is the identification of the HFE gene and the second one is the discovery of Hepcidin. Both of these have resulted in the manifestation and clear viewpoint of the understanding of iron metabolism in the body.(Moretti et al.) In primary hemochromatosis, there are 2 types of disease type 1 and type 2 also called juvenile. The type 1 population has mutated genes which include the people of Europe within the age of 40-60 years. In women, the loss of blood during the menstruation cycle and loss of iron during pregnancy are the late manifestations of hemochromatosis.(Barton, Edwards and Acton)
There is a strong susceptibility to this disease also found in those patients with heavy alcohol consumption. The high amount intake of alcohol increases iron overload and there is a chance of the developing of liver cancer. Juvenile or type 2 occurs at an early age or in childhood. It causes a decrease in sex hormone production. Secondary hemochromatosis is developed when a patient has taken a high amount of iron supplements, received a transfusion of blood, and also due to anemia. This iron overload also takes place due to the mix-up of the increased iron absorption and the recurrent iron transfusion.(Geller and de Campos). The increased level of the iron in liver due to alcohol has been studied in a recent study. Alcohol results in increased iron absorption is expression of Hepcidin takes place due to high intake of alcohol(Pietrangelo "Hemochromatosis: An Endocrine Liver Disease").Hepatocellular carcinoma is the deadliest cancer worldwide, and it is also brought on by iron excess in the liver. It is most prevalent worldwide and is growing every day. An individual's organs are damaged with HCC. Hemochromatosis, often known as bronze diabetes, is the cause of liver cirrhosis, fibrosis, and hyperpigmentation when it is not identified in its later stages (Gochee and others) In HFE hemochromatosis, the primary mutations are H63D and C282Y. The term "high iron gene HFE mutation" is frequently used to describe H63D (Peesapati et al.)
There are 5 genes involved with various subtypes of hemochromatosis disorder. These genes are HFE, TFR1, HAMP, HJV and SLC40A1. 60-100% of cases of hemochromatosis in the European population are dominantly caused by the HFE gene. In the Celtic population thousands of years ago this disorder has been recognized. (Wallace and Subramaniam)There is increased Transferrin saturation and Ferritin levels in this disorder and it is also the cause of many diseases like liver cirrhosis, fibrosis, hepatocellular carcinoma, and bronze coloring of the skin. In Northern European people HH is the most popular disease (Andersen et al.) In the Caucasian population, genetic hemochromatosis is also the most prevalent disorder. Various mutations occur in different genes involved in hemochromatosis but the most public is the HFE gene mutation. Positional cloning is used by Feder and Colleagues for the identification of HFE-linked disorders. Hepcidin is regulated normally by HFE protein Hepcidin is the main controller of iron metabolism.(Grosse et al.)Von Recklinghausen was the first person in the 19th century who introduces the term “hemochromatosis”. Symptoms of hemochromatosis include skin pigmentation, cirrhosis, diabetes mellitus, and liver fibrosis. When a mutation occurs at the C282Y position of the HFE gene Hepcidin liver hormone is reduced and with the reduction of the Hepcidin level in the liver iron levels increase in the liver which causes hyperferritnemia and liver cirrhosis (Camaschella)
Mostly in the form of heme, inorganic, and Ferritin absorption of dietary iron is carried out. The dietary iron which is inorganic state mostly exists in the oxidized form Fe+3 and reduces to Fe+2 for intestinal uptake this process of reduction takes place in the intestinal cells of the apical membrane by the seductresses. Divalent metal transport is the key relevant that assisted in the transportation of Fe2+ in the apical membrane.(Babitt and Lin) All of this transportation takes place in an acidic environment In humus, the vital process occurs named as iron homeostasis its name work is to control the iron excess in the body which is very harmful for the body and destroys the cells Iron is very important for many processes in the body mainly it is required for biological functions like oxygen transport and cellulose respiration. 3-5 grams of iron is present in the adult human body for vital functions.(Weiss) Iron is stored in the liner which is in excessive amounts and mobilized in demand. Anemia and iron deficiency are more likely to occur in indigenous peoples, refugees, immigrants from low income countries, and those who cannot afford wholesome meals (Wessling-Resnick)
Iron excess is linked to several illnesses. Because of the iron balance, billions of patients are impacted globally. Iron overload is responsible for serious damage and fatalities. Anemia, Thalassemia, Sickle cell disease melodiousness, linear cirrhosis, fibrosis, and bronze skin disease are caused by the iron in balance in the body(Fargion, Valenti and Fracanzani). Iron load toxicity is a problem in medicine from molecular to cellular characteristics to clinical claims. Extra iron is dropped in joints and other organs including the liver, heart, and pancreas, which is extremely detrimental to the organs and causes the dyes to function (Kontoghiorghes). There are many fetal outcomes of hemochromatosis related to the liver. Some of these are liver cirrhosis of the liver, hepatocellular carcinoma, fibrosis, and bronze skin disease. The impact of hemochromatosis on the liver is a topic of interest because the liver is the most affected. By the hemochromatosis disorders. Liver hormone Hepcidin is going to be reduced which can cause hepatic iron overload (Cobilinschi et al.)
Hemochromatosis disorder related to the liver is the main cause of hepatic cancer. 6th most prevalent diagnosed cancer is liver cancer. Hepatic cancer mortality rate in China is the highest among all over the world. Hepatocellular carcinoma and Hepatic Cholangio Carcinoma (ICC) are primary liver cancer types. Hepatic Angiosarcoma (HA) is the 3rd most prevalent liver cancer, which is initiates in arteries of the blood of lymphatic nodes.(Paganoni, Lechel and Vujic Spasic) There are 2 types of hemochromatosis disorder the first one is primary and the 2nd one is secondary hemochromatosis. Primary hemochromatosis is also known as hereditary or HFE hemochromatosis. There is iron overload in different organs body like the liver, pancreas, heart, skin, and joints in primary hemochromatosis. A biological scientist first identified HFE gene mutation. The HFE gene has many different mutations including H63D, C282Y, and S65C. The most prominent is the C282Y Homozygous mutation (Shamas)
Secondary hemochromatosis is also known as nonhereditary or non-HFE hemochromatosis. Four types of non-HFE hemochromatosis genes result in non-hereditary hemochromatosis. These include the transporter family 40 member 1 (SLC40A1), which codes for ferroportin 1, TFR2 transferrin receptor 2, HAMP, which codes for hepcidin, and HJV. The range of these genes' allelic frequencies is 0.00007 to 0.0004. Hemochromatosis is directly involved in liver fibrosis, resulting in chronic liver damage with a large accumulation of extracellular matrix protein. Liver fibrosis is brought on by alcohol use, nonalcoholic steatohepatitis, cholestasis liver disease, virus-related hepatitis, autoimmune hepatitis and nonalcoholic fatty liver disease. There are many novel targets and signaling pathways including the following processes apoptosis, oxidative stress, epigenetics, inflammation, and receptor-generated mediators in liver fibrosis. (Fletcher and Powell). The most frequent cause of liver inflammation and damage is cirrhosis (>50–70 g/day). Hepatic stellate cells are the key players which are involved in the growth of liver cirrhosis. Hepatocellular carcinoma is considered the most dangerous and life-threatening complication related to hemochromatosis disease .(Tirnitz-Parker et al.)
Genomic studies have also identified population differences in the frequency of HH-related mutations. The C282Y transformation is most commonly found in residents of European descent, with a carrier frequency of about 1 in 8 individuals.(Burke et al.) In contrast, it is rare in Asian and African populations. This mutation likely originated from a single ancestor in Northern Europe, with evidence suggesting a selective advantage related to iron metabolism in the historical context of iron-deficient diets. The molecular foundation of HH is now well understood thanks to developments in genomic technology, and genetic testing has increased diagnostic precision.(Grosse et al.) These developments allow for early detection and management of the disease, potentially preventing the severe consequences of untreated iron overload.(Savatt et al.)
The highest prevalence of HH is observed in individuals of Celtic origin, with a carrier frequency of 1 in 10 and a homozygous prevalence of 1 in 200 among Northern Europeans. In the general European population, the prevalence of C282Y homozygosity ranges from 0.2% to 0.5%. In the United States, HH prevalence is similar to that in Europe, with a homozygous C282Y prevalence of about 0.5% among non-Hispanic whites. The condition is less common in African Americans, Hispanics, and Asian populations.(Katsarou et al.) Among individuals of European ancestry in Australia, the prevalence of HH is comparable to that in Europe, with a C282Y homozygosity rate of approximately 0.5%. HH is rare in Asian populations, with significantly lower carrier rates of the C282Y mutation. In Japan, China, and other East Asian countries, the prevalence of HH is negligible. HH is also rare in African populations.(Waalen, Nordestgaard and Beutler) The C282Y mutation is almost non-existent, and other genetic mutations associated with iron overload are more common in sub-Saharan Africa, though these mutations are not as strongly linked to HH. Data on HH in South American populations are limited, but the condition appears to be less prevalent than in European-descended populations. The prevalence of HH in the Middle East is low, with very few cases reported. The genetic mutations associated with HH are uncommon in this region.(Barton, Edwards and Acton)
In the United States, Canada, and Australia, HH prevalence mirrors that of Northern Europe due to the large proportion of the population with European ancestry. Non-Hispanic whites have a homozygosity rate of approximately 0.5% for the C282Y mutation in Asian populations.(Jones et al.) Studies in China, Japan, and South Korea show a very low prevalence of the C282Y mutation, with the mutation almost absent in these populations.(Pointon et al.) Other genetic mutations associated with iron overload are more common but do not lead to the classic HH seen in European populations. HH is also rare in South Asia like India, Pakistan, and Bangladesh. The C282Y mutation is virtually nonexistent in these populations. Studies indicate that iron overload in South Asian populations is more likely to result from dietary factors or other non-genetic causes rather than from HH. HH is uncommon and Middle Eastern populations, where the C282Y mutation is rare. Iron overload conditions in these regions are more likely to be linked to other genetic factors or environmental influences than HH.(Crawford et al.) The prevalence of hereditary hemochromatosis significant variation across different ethnic groups and geographical regions. While the condition is most prevalent among individuals of Northern European descent, it is rare in Asian, South Asian, African, and Middle Eastern populations. This disparity is largely attributable to the varying frequencies of the C282Y mutation and other genetic variants across these populations.(Crownover and Covey)
Studying hereditary hemochromatosis (HH) in South Asia is crucial due to its underexplored prevalence and potential health impacts in this diverse region. While HH is more common in European populations, recent studies suggest that mutations related to iron overload could be present in South Asia, albeit at lower frequencies.(Panigrahi et al.) For instance, the C282Y mutation, the most common HH-associated mutation, is rare in South Asians, but the H63D variant has a higher occurrence rate, with carrier frequencies estimated at 2-5%.(Lok et al.) Given South Asia's large and genetically diverse population, understanding HH's local prevalence and genetic variations is essential for improving diagnostic approaches, public health planning, and personalized medical interventions. Additionally, iron metabolism disorders are underdiagnosed in this region, potentially leading to overlooked cases of iron overload that can result in severe complications like liver disease and diabetes, underscoring the need for focused research.(Hanson, Imperatore and Burke)
The genetic diversity in South Asia is one of the highest in the world, shaped by complex historical migrations, cultural practices, and population stratification. The frequency and manifestation of hereditary hemochromatosis (HH) genetic alterations in the area are significantly influenced by this variety.(Hajar et al.) While the C282Y mutation, predominantly responsible for HH in European populations, is rare in South Asians, other variants such as H63D and S65C have been detected, though at lower frequencies. The heterogeneity of these mutations across different ethnic groups in South Asia reflects the region's intricate genetic landscape. The impact of this genetic diversity on HH prevalence is multifaceted. Given the varied genetic backgrounds, certain populations in South Asia may harbor unique mutations affecting iron metabolism, potentially leading to undiagnosed or misdiagnosed cases of HH.(Pointon et al.) Additionally, the interaction between these genetic factors and environmental influences, such as diet and public health conditions, could further modulate the expression of HH-related symptoms in the region. This genetic variation necessitates a tailored approach to genetic screening and diagnosis of HH in South Asia. Understanding the specific mutations and their distribution can improve early detection and intervention strategies, reducing the risk of severe complications associated with iron overload in affected individuals.(Adams et al.)
Public health systems in South Asia, which already face significant challenges due to a high burden of infectious diseases and non-communicable diseases (NCDs), must also account for the potential impact of undiagnosed or untreated HH. If HH is not properly identified and diagnosed, it might result in serious side effects such diabetes, heart disease, liver cirrhosis, and hepatocellular cancer .(Lok et al.) These conditions require extensive medical care, placing a substantial burden on healthcare systems. The economic implications of HH are significant. Studies from Western countries estimate that the annual healthcare cost per untreated HH patient can range from $2,000 to $10,000, depending on the severity of iron overload and related complications.(Motulsky and Beutler) While specific data for South Asia is limited, these costs are likely to be high, particularly in resource-constrained settings where advanced medical care is less accessible. If left unaddressed, HH could contribute to the growing burden of NCDs in the region, exacerbating existing healthcare challenges.(McLaren et al.)
Early diagnosis and treatment, primarily through phlebotomy or iron chelation therapy, can prevent most of the severe complications associated with HH. However, for these interventions to be effective, there must be a robust public health strategy that includes awareness campaigns, genetic screening programs, and the training of healthcare professionals to recognize and manage HH.(Van Bokhoven, van Deursen and Swinkels) Furthermore, resource allocation needs to consider the potential hidden burden of HH. To detect and treat HH, funding genetic research and public health facilities might reduce long-term medical expenses and enhance patient outcomes. Tailoring public health initiatives to the unique genetic landscape of South Asia is essential to address this emerging health concern and ensure that the healthcare system is prepared to manage the potentially significant burden of HH.(Pietrangelo "Hereditary Hemochromatosis: Pathogenesis, Diagnosis, and Treatment")
The primary objective of this systematic review is to compile and analyze data on the prevalence of hemochromatosis genetic mutations in South Asia. While hemochromatosis is well-documented in Western populations, there is limited and inconsistent data regarding its prevalence in South Asian populations. This review aims to address this gap by systematically evaluating and synthesizing existing research studies that report on the frequency and distribution of hemochromatosis-related genetic mutations (such as HFE gene mutations) within South Asian countries, including but not limited to India, Pakistan, Bangladesh, Nepal, and Sri Lanka. By aggregating information from numerous studies, this review will provide a wide-ranging summary of the genetic landscape of hemochromatosis in the region.(Padeniya et al.) It is anticipated that the results will improve our knowledge of the genetic epidemiology of hemochromatosis in South Asia, reveal any genetic variations unique to the region, and point out any inconsistencies with data from other areas.(Crawford et al.) This information will be crucial for improving diagnostic strategies, developing targeted public health interventions, and guiding future research directions in South Asia. Ultimately, this systematic review aims to contribute to the broader goal of optimizing hemochromatosis management and improving patient outcomes in this diverse and populous region.(Clark, Britton and Powell)
2. MATERIAL AND METHOD
A. Blood/Sample Collection
Blood samples were drawn from 200 diagnosed patients suffering from hemochromatosis and 200 healthy donors in EDTA vacutainers. Hepatology Department, Gangha Ram Hospital, Lahore provided these samples. These samples were further studied for the following clinical and biochemical evaluations:
- Demographic Data: Age of the patients having hepatic related disorders.
- Iron-related Parameters: Level of Ferritin and transferrin.
- Levels of hepatic enzymes:(GGT), (AST), (ALT), (ALP).
- Concentrations of sodium (Na⁺), potassium (K⁺), and chloride (Cl⁻) in the serum.
- Tests measuring renal function (RFTs), measurement of urea and creatinine.
- Tests measuring liver function (LFTs), Serum glutamic oxaloacetic transaminase (SGOT).
- Make up the lipid profile: LDL, HDL
B. DNA Extraction
The DNA extraction process typically involves the following key steps:
- i)
- Disruption of cellular structures: Sectioning through the nuclear and cytoplasmic membranes so that the DNA can be liberated.
- ii)
- Purification and Isolation: This is the process where strands of DNA are separated from other cellular materials such as proteins, lipids and other nucleic acids.
- iii)
- Quantification: This method is used for assessing the yield and purity of DNA output after applying the predetermined DNA extraction techniques.
There are some factors including time, cost, toxicity of reagents, availability of laboratory supplies, and compliance to standard operational procedures which can be helpful in extraction of DNA. Furthermore, it is important that sufficient volume of starting material is provided for the DNA extraction protocol which will be followed.
Deoxyribonucleic acid (DNA) is a grammatical term for molecules that are present in all human cells as the data of information. It comprises guanine, cytosine, thymine, adenine, phosphate and sugar. The DNA is one of the most important molecules for the different biological activities as well as for the transfer of the gene characteristics from one generation to another.
For instance, extraction of DNA is an important practice to some methodologies like polymerase chain reaction (PCR) methods, quantification, and sequencing. These procedures are applied frequently in diagnostic laboratories to enable the identification of genetic anomalies, mutation or disruption.
C. Procedure of DNA Extraction by organic method
Before DNA extraction samples of blood were freeze at -20ºC. Take out blood samples from refrigerator and incubated at room temperature until it become thawed. Take Eppendorf’s tubes according to the samples. Take tubes according to how many samples DNA have to be extracted after that added 500 micro titer of 20 mM tris HCL in each Eppendorf’s tubes. Put cut out gel piece in tris HCL Eppendorf’s tubes. Vortex the samples centrifuge at 13000rpm for 5 minutes. Then supernatant discarded almost 100 micro liter supernatant left behind with pellet. Then add 500 micro liters of 50mM Tris HCL again in each Eppendorf’s tubes. Vortex mix again samples and then centrifuges samples for 5 minutes. Supernatant discarded and little left behind, then 500 micro liter lysis buffers in each tube. Also added 20 micro liters Proteinase K and incubated the samples at 55 degrees centigrade for overnight in the incubator,
then the 500 microliters of (PCI) Phenol chloroform Isoamylalchol and invert mix the samples and centrifuge these samples for 12 minutes at 13000 rpm. Supernatant transfer into the clean Eppendorf’s tubes after that 800-micro liter of 100% chilled Isopropanol and mixed by inversion incubated the samples at minus 20 degrees centigrade for 20 minutes in the freezer. Centrifuge these samples for 10 minutes at 13000rpm and supernatant discarded. Then added 500 microliters of 70% ethanol inverted mix the samples and centrifuge at 13000rpm for 5 minutes supernatant was discarded. The leftover pellet Extracted DNA and then air dried for 3-4 hours. Then 150 micro liter TE buffer in all Eppendorf’s and DNA stored in elution buffer at -20℃.
D. Gel Electrophoresis
DNA molecules can be separated out by using Gel Electrophoresis; by using Agarose gel the DNA separation and study of their migration is enhanced because before Agarose gel DNA was separated out by using Sucrose density gradient centrifugation by this method only the estimated size of DNA is observed.
Preparation of 1%Agarose Gel
Firstly, we weighted the agarose gel about 0.5g mostly concentrations of agarose gel is related to the size of fragments. Add a buffer of Electrophoresis we use TE buffer, about 50ml of TE buffer is added and mixed by swirling. Melt this mixture of gel and buffer done by using a microwave we were repeated this step until gel is clearly dissolved. After that, we add Ethidium Bromide (EtBr) about 2µl. Then we allow the agarose gel to be cool down. We place casting tray into the gel apparatus, sometimes tape is also used to make gel mold and also to cover edge of tray then, set one or two combs depending upon the numbers of samples Then, pour the melt form of gel into the casting tray and allow the gel to be cool.
Adjustment of Gel Apparatus
To create a 1% agarose gel, a small amount of loading dye, 1.5 µL, for visualization purposes is placed on paraffin paper. Its primary function is to allow the DNA to be seen as it moves during the electrophoresis and also allow the samples to settle down inside the wells of the gel.
For best results, the suspending voltage for electrophoresis is set at close to 80 voltage units, running for about 40 minutes. It is very important to add enough buffer so the gel casts properly and floats inside the casting tray.
The cathode is indicated by a black lead and the anode by a red lead. The black lead is placed on the black terminal while red lead is connected to the red terminal. After securing these connections, the power supply unit is switched ON and the gel is followed with time during the run.
After about 40 minutes, the cover is removed slowly after turning OFF the power supply, and the gel is then observed under UV light for the migration and separation of the DNA regions. This step is necessary as part of the interpretation of the results obtained after the gel electrophoresis.
Primer Designing
Identify the target SNP or mutation site for genotyping. Obtain the DNA sequence surrounding the target site. Design two outer primers (forward and reverse) to amplify a DNA fragment containing the SNP. Design two inner primers (allele-specific forward and reverse) to specifically amplify either the wild-type or mutant allele. Ensure that the outer primers are located outside the inner primers. Aim for primer lengths of 18-25 base pairs with a GC content of 40-60%. Use primer design software to check for potential primer- dimer formation and hairpin structures. Avoid runs of the same nucleotide (e.g., poly-A or poly-T). Check the melting temperatures (Tm) of the primers to ensure they are similar. Add a tail (e.g., GTGTCTT) to the 5' end of the inner primers to increase specificity.
Verify the uniqueness of the primers using BLAST to avoid off-target amplification. Consider adding a mismatch at the penultimate base of the allele-specific primers to enhance specificity. Use a reference sequence to design primers if available. Order primers formed a reputable supplier with high purity. Dilute primers to a working concentration of 10 μM for optimal performance. Store primers kept at -20°C to -80°C for long-term use. Use primer concentrations between 0.1-1 μM in the PCR reaction. Test primers for specificity and efficiency using control samples. Optimize PCR conditions if needed based on primer performance. Document primer sequences and experimental conditions for future reference.

Table 1.
Tetra arms primers of SNP rs7385804.
| Primer Name | Primer Sequence (5' → 3') |
Amplicon size (bp) | Primer Length (bp) | Tm |
|---|---|---|---|---|
| Outer Reverse Primer | ATGACCTGGAAG GTCAGTG |
150 | 20 | 59°C |
|
Outer Reverse Primer |
GAGTGGAGGTGG GGAAGG |
250 | 19 | 58°C |
|
Inner Forward Primer |
CGGCGAGAGAGAG GGAAG |
200 | 20 | 60°C |
|
Inner Reverse Primer |
CGTCTTGGGAAGATC CACTA |
200 | 20 | 61°C |
E. Polymerase chain Reaction
The tetra-primer amplification refractory mutation system-polymerase chain reaction (ARMS-PCR) is a widely used molecular method for genotyping single nucleotide polymorphisms (SNPs). Inner primers and outer primers are the two sets of primers used. While the inner primers are intended to be allele-specific, the outer primers are non-specific to alleles and amplify the target gene area. Accurate SNP detection is made possible by the outside primers, which serve as a template for the inner primers.
Selection of SNP of Interest
A detailed review of research studies and literature, accessed via Google Scholar and other databases, was conducted to identify SNPs associated with hemochromatosis and liver-related disorders. The SNP rs7385804 in the TFR2 gene emerged as a key candidate, with numerous studies highlighting its association with hemochromatosis.
Tetra-ARMS PCR Methodology
Tetra-ARMS PCR, often referred to as tetra-primer ARMS-PCR, is a popular method for identifying certain mutations and genotyping single nucleotide polymorphisms (SNPs). The following is a step-by-step guide Outer primer: Forward and reverse primers designed to amplify the DNA segment containing the SNP or mutation. Inner primers: Allele-specific primers (both forward and reverse) that differentiate between the wild-type and mutant alleles. Make sure the target DNA fragment is amplified by the outside primers when you set up a conventional PCR experiment.
Include the following controls:
- Positive control: A DNA sample with a known genotype for comparison.
- Negative control: A reaction without DNA to check for contamination.
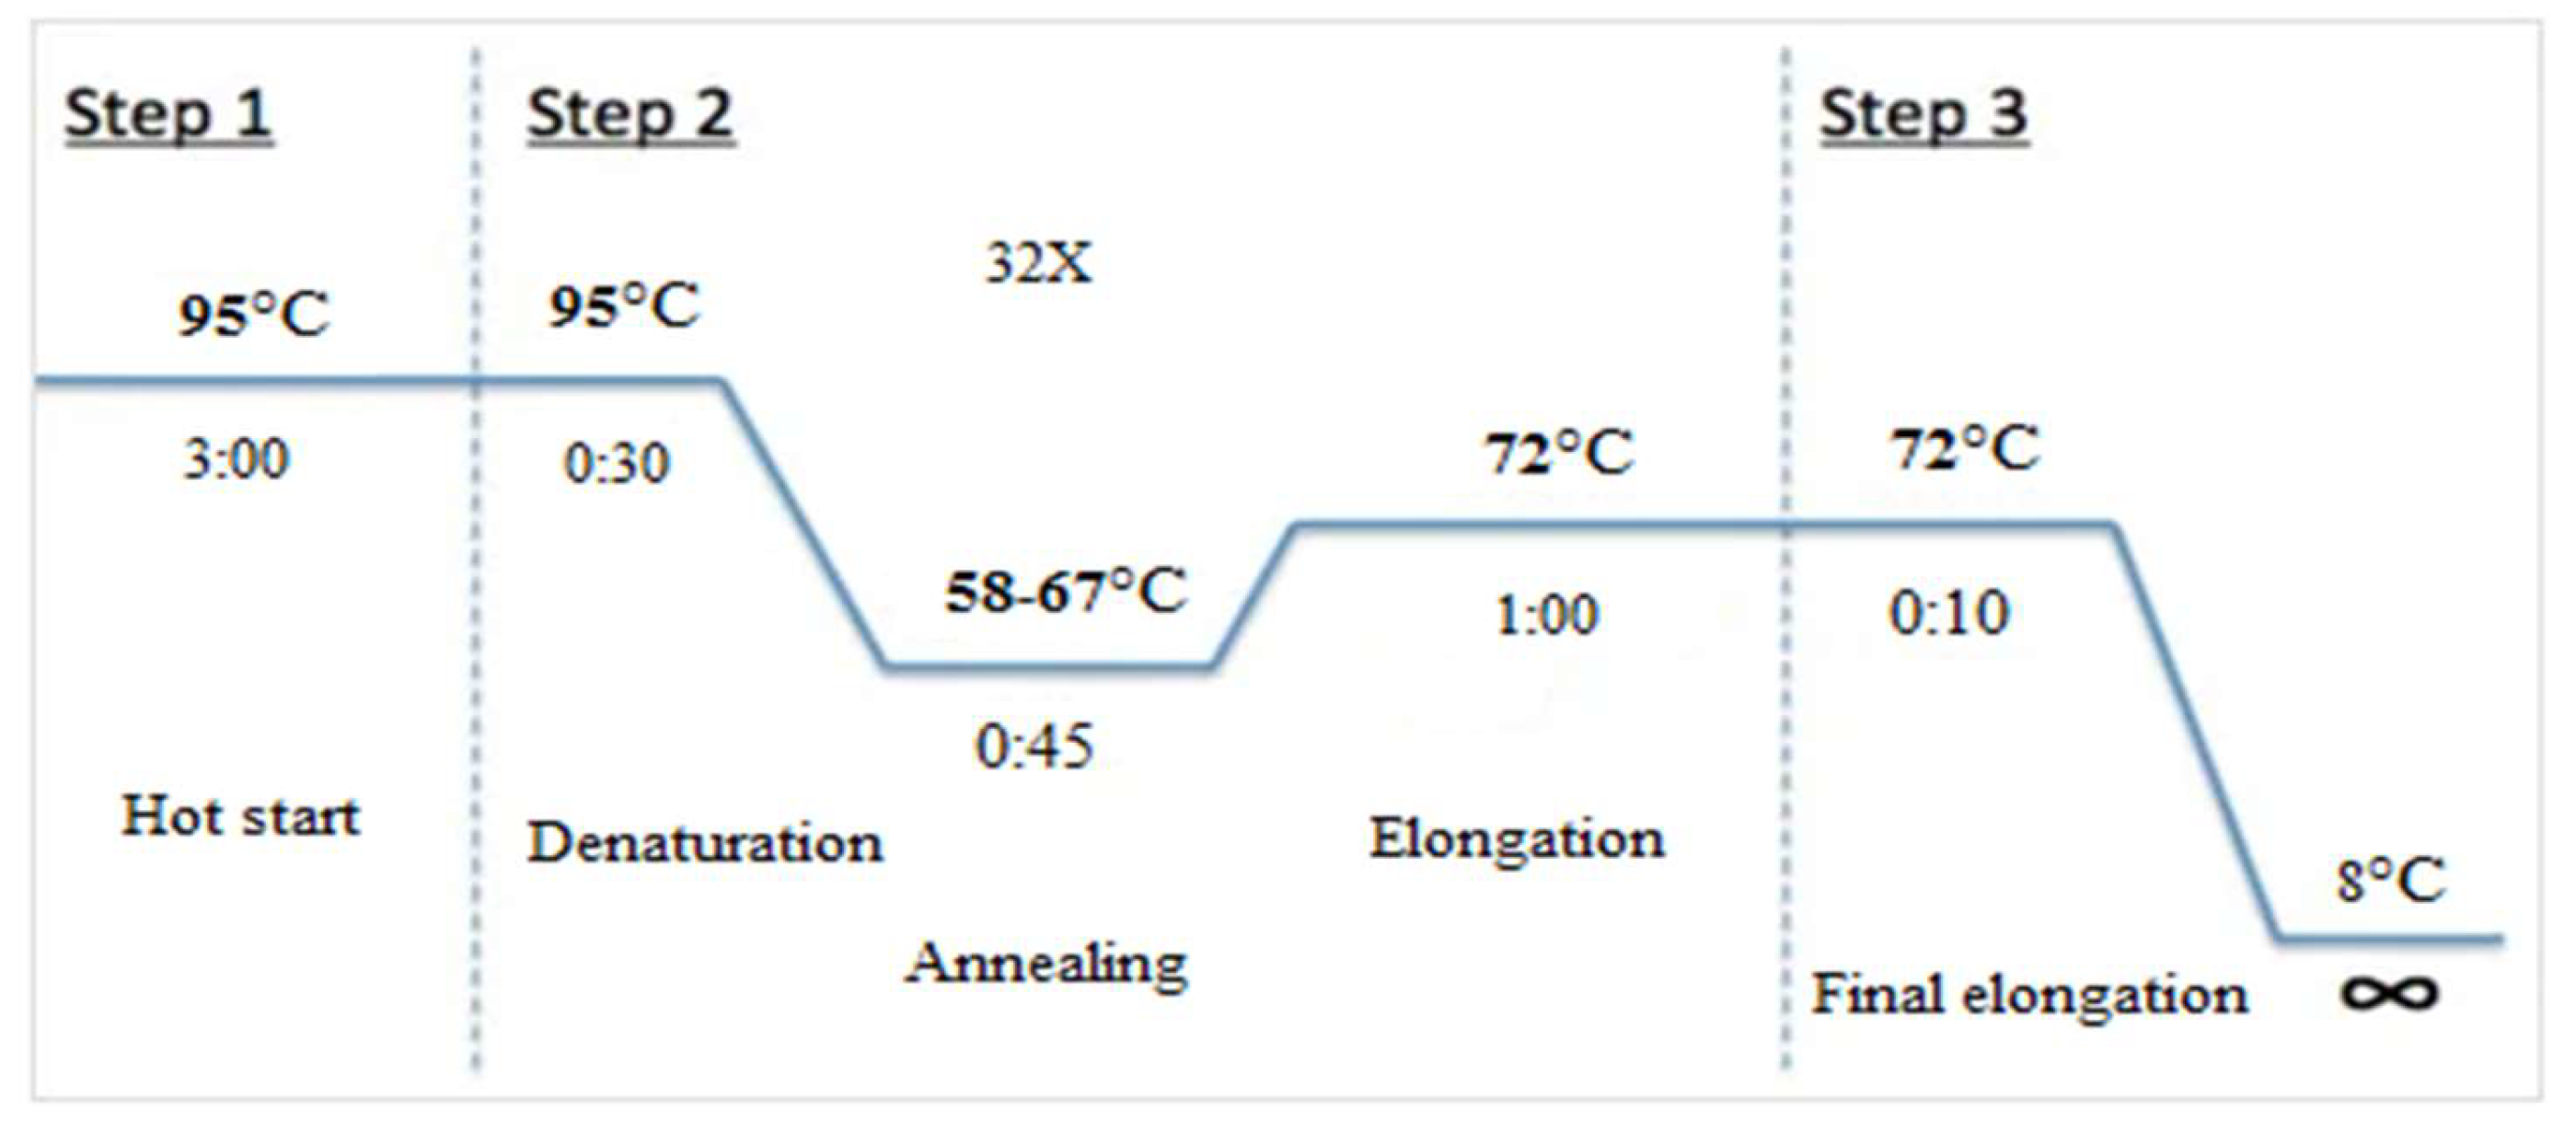
PCR Cycling Parameters
- To separate the DNA strands, start with an initial denaturation procedure that lasts five minutes at 95°C.
- Carry out 35 PCR cycles under the following circumstances:
- Thirty seconds of denaturation at 95°C.
- Annealing for 30 seconds at the ideal temperature determined by the primers' melting temperature (Tm).
- To create DNA strands, extend at 72°C for 30 seconds
- To guarantee full amplification, finish with a last extension step at 72°C for five minutes.
Gel Electrophoresis Analysis
Using 1X TAE buffer, create a two percent agarose gel, then stain it with ethidium bromide. Put a DNA ladder and the PCR results onto the gel. Run the gel for 30 to 45 minutes at 100V. See the outcomes when exposed to UV radiation. Bands produced by the outer primers indicate the wild-type allele. Bands from the inner primers indicate the mutant allele. Lack of a specific band may suggest a homozygous genotype for either the wild-type or mutant allele.
Validation and Troubleshooting
Confirm ambiguous results by sequencing the PCR products. Resolve issues like non-specific amplification or primer-dimers by adjusting:
- Primer concentrations.
- Annealing temperatures.
Verify the quality and integrity of DNA samples before starting PCR to avoid amplification issues.
Best Practices
- Store reagents properly and ensure they are free from contamination.
- Use sterile techniques and maintain a clean, decontaminated workspace.
- Keep detailed records of all experimental procedures and outcomes.
- Compare results against known controls to validate accuracy.
- Analyze the data statistically for reliable conclusions.
Storage and Safety
- Store PCR products at -20°C for short-term use and DNA samples at -80°C for extended storage.
- Dispose of all waste materials following biosafety and institutional guidelines.
- Follow proper safety measures when handling reagents and working with UV light.
Adhering to this workflow and maintaining strict quality control ensures that tetra-ARMS PCR yields consistent and accurate genotyping results for research and clinical purposes.
Follow safety protocols when working with PCR reagents and UV light.
- Maintain a log of all experiments and results.
- Consider automation for high-throughput genotyping applications.
- Validate the tetra-arms PCR method with known samples or reference materials.
- Consider the implications of the results for research or clinical applications.
- Continuously update and improve the methodology based on feedback and new developments.
GRADIENT ARMS PCR OPTIMIZATION
Optimization of gene was carried out under different conditions. Temperatures, primer concentrations and DNA quantity were the primary factors which were varied to optimize the ARMS PCR.
TFR2 GENE
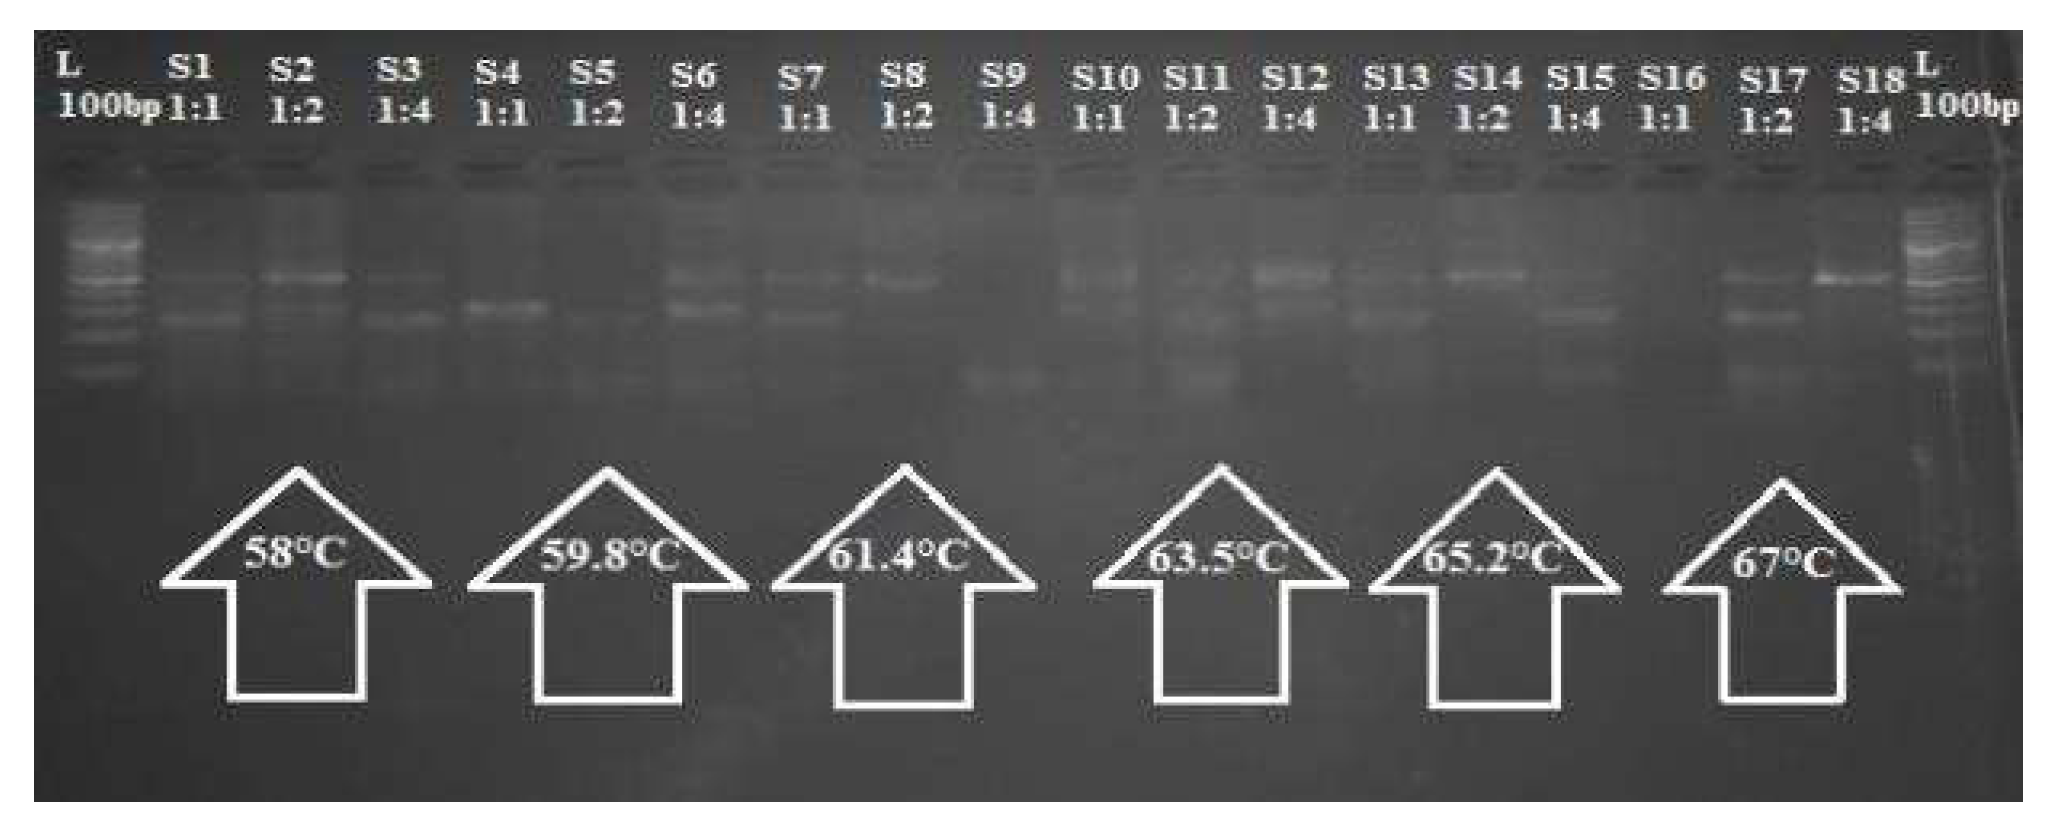
To optimize the Tetra-ARMS PCR for the selected SNP TFR2 C677T, two strategies were employed concurrently. A gradient Using three distinct outers to inner primer ratios (1:1, 1:2, and 1:4) and a variety of annealing temperatures (58–67°C), PCR was carried out in triplicate with a 10µL reaction volume. Figure displays the thermocycler profile utilized for the PCR
Figure 1.
Thermocycler PCR profile.
TFR2 GENE
The optimal conditions obtained from the previous phase were used to treat all of the gathered DNA samples for ARMS PCR. Table 2 displays the reaction materials for the 10 µL PCR.
Gel Electrophoresis for PCR Analysis
A 3% agarose gel made in 0.5X TBE buffer was used to examine the PCR results in order to confirm the amplified TFR2 C677T SNP amplicons. A total of 4 µL (2 µL PCR product and 2 µL tracking dye) was added to each well. The bands were stained with ethidium bromide (EtBr) and seen using a UV transilluminator. Using a 1Kb DNA ladder (GeneRuler, Thermo Fisher Scientific), the size of the allele-specific products was assessed. For additional examination, a gel documentation system was used to take a picture of the gel.
Validation of Tetra-ARMS PCR Output via Sanger Sequencing
Sanger sequencing was used to sequence random samples that represented the three genotypes of TFR2 C677T (CC, CT, and TT) in order to validate the genotyping results for the SNPs found by Tetra-ARMS PCR. utilizing the same ideal circumstances as the ARMS PCR, with a temperature for annealing of sixty degrees Celsius, amplification was performed for sequencing utilizing only the outer forward and reverse primers.
1.5% Agarose Gel Electrophoresis
To confirm the TFR2 C490T SNP amplicons, PCR products were examined on a 1.5% agarose gel prepared in 0.5X TBE buffer. Each well was filled with 4 µL of liquid (2 µL PCR product + 2 µL tracking dye). Ethidium bromide was used to stain the DNA bands, and they were visualized under UV light. The sizes of the allele-specific products were estimated by comparison with a 1Kb DNA ladder (GeneRuler, Thermo Fisher Scientific). A gel image was captured using a gel documentation system for further analysis.
Post-Amplification Purification
To prepare the PCR product for sequencing, purification is required to eliminate excess primers, dNTPs, salts, and primer-dimers that could interfere with the sequencing reaction. The High Prep™ kit was used for this process, which involves reversible DNA binding to paramagnetic beads. The purification procedure consisted of three main steps: binding, washing, and elution.
- Add 1X particle solution in accordance with the PCR volume (15 µL of bead solution for a 15 µL reaction).
- Pipette the mixture, then quickly centrifuge.
- Avoid using the magnetic plate and incubate for five minutes at room temperature.
- After adding 50 µL of 100% ethanol, let it sit at room temperature for ten more minutes.
- For three minutes, place the samples on a magnetic plate.
- Gently aspirate the supernatant so as not to disrupt the magnetic beads.
- Use 50 µL of 70% ethanol to wash the beads, then use a pipette to drain the liquid.
- Let the beads air dry on the magnetic plate for five minutes, making sure the ethanol evaporates without drying them out too much.
- Aspirate the supernatant to obtain the purified DNA. Run a gel with 2 µL of the DNA to check its concentration.
Sequencing PCR
Sequencing of the purified PCR product was conducted using the chain termination method. The forward and reverse primers were used in two different reactions for every pcr. For analysis, the reverse primer-generated sequence was transformed into its corresponding forward sequence. The BigDye Terminator Kit v3 was used for sequencing. (Applied Biosystems), which contains the necessary enzymes, buffers, regular dNTPs, and four fluorescently labeled ddNTPs. When these ddNTPs are triggered by an argon laser in a genetic analyzer, they produce different hues of fluorescence, green, blue, red and black
The formula Q = 1/50 ng, where Q is the quantity of DNA and 1 is the length of the DNA template, was used to quantify the DNA template employed in the process 4o mini. The ingredients used in PCR are listed in Table 3.
STATISTICAL ANALYSIS
The SHEsis online tool (http://analysis.bio-x.cn/myAnalysis.php) was used to do the genotypic and allelic analysis of the TETRA-ARMS PCR. SNPstats an online program for SNP analysis, was used to create genetic association models. All statistical tests were conducted at a 95% confidence level. SPSS Statistics was used to assess the research participants' epidemiological data, including TFTs, age, as well as gender, using a double-tailed χ² test. A P-value of less than 0.05 or less than 0.01 was deemed statistically significant.
Results
This study aimed to examine the association between TFR2 gene polymorphisms and the development of hemochromatosis. It also aimed to look at how TFR2 polymorphisms in individuals with liver diseases relate to sex and age. Blood samples and epidemiological information were gathered from Sir Ganga Ram Hospital in Lahore, Punjab, Pakistan. The prevalence of hemochromatosis has increased, especially in areas which have elevated ferritin levels. A total of 200 blood samples from afflicted people of various ages and sexual orientations were taken.
A. DNA Extraction via Organic Method
Using a modified organic technique, DNA was isolated from blood cells. A Nanodrop spectrophotometer was used to measure the DNA concentrations, and the findings ranged from 23.8 ng/µL to 1289.8 ng/µL. 1% agarose gel electrophoresis was used to evaluate the extracted DNA's integrity by comparing it to a common DNA marker. The findings of Nanodrop are shown in Figure 4.1. Two hundred case specimens and two hundred control samples had their DNA effectively retrieved.
Figure 2.
Genomic DNA on 1% agarose gel; Well No. 1 contains standard DNA samples (St) at 20 ng/20 µL, and Wells No. 2-201 contain DNA samples (S1-S200) from case and control samples.
Figure 2.
Genomic DNA on 1% agarose gel; Well No. 1 contains standard DNA samples (St) at 20 ng/20 µL, and Wells No. 2-201 contain DNA samples (S1-S200) from case and control samples.
B. Tetra Arms PCR Optimization
The TFR2 gene variant was successfully amplified using allele-specific primers designed for the TFR2 rs7385804 variant. The PCR amplicons were subjected to size confirmation by loading onto a 2% agarose gel, with a 100 bp DNA ladder used as a reference for size. The full-length TFR2 amplicon size was 490bp, with the allele-specific amplicons corresponding to 248bp for the C allele and 298bp for the G reference allele.
TFR2 PCR Optimization
The gradient PCR approach identified 60°C as the optimal annealing temperature, where a 1:1 ratio of outer and inner primers produced the best amplification results. Other annealing temperatures tested did not result in as robust amplification as the 60°C condition. The 200 samples (100 patients and 100 controls) underwent Sanger sequencing for further confirmation of the TFR2 rs7385804 genotype. Sequencing data confirmed the TFR2 genotypes, with patient samples showing higher prevalence of the variant allele compared to controls, corroborating the PCR results. A total of 200 samples (100 from hemochromatosis patients and 100 controls) were processed using the optimized TETRA-ARMS PCR protocol. These samples were amplified and genotyped for the TFR2 rs7385804 variant, which allowed for a reliable genotyping of the variant across both patient and control groups.
Figure 4.3
Figure 3.
Electropherogram showing DNA sequencing results for SNP rs7385804 in the TFR2 gene. The peaks represent nucleotide bases (adenine, thymine, cytosine, and guanine) detected in the sequence.
Figure 3.
Electropherogram showing DNA sequencing results for SNP rs7385804 in the TFR2 gene. The peaks represent nucleotide bases (adenine, thymine, cytosine, and guanine) detected in the sequence.
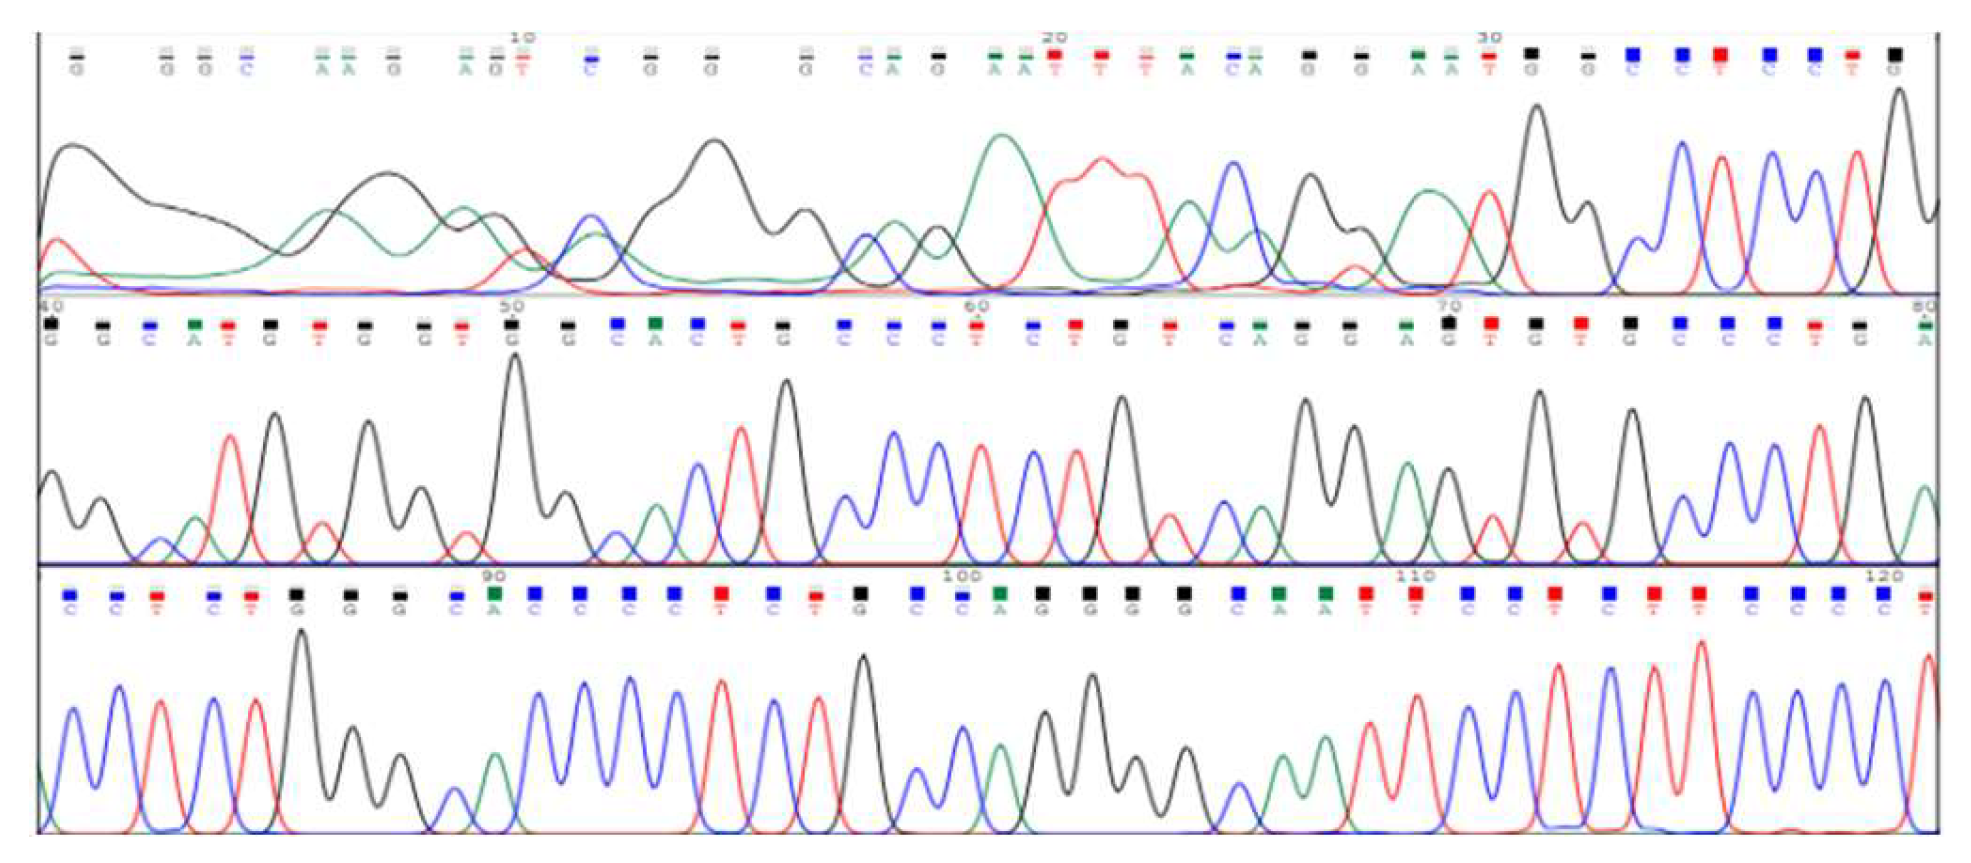
Figure 4.
The PCR products are compared with the DNA ladder (L), with the optimal amplification observed at a 1:1 primer ratio and an annealing temperature of 60°C.
Figure 4.
The PCR products are compared with the DNA ladder (L), with the optimal amplification observed at a 1:1 primer ratio and an annealing temperature of 60°C.
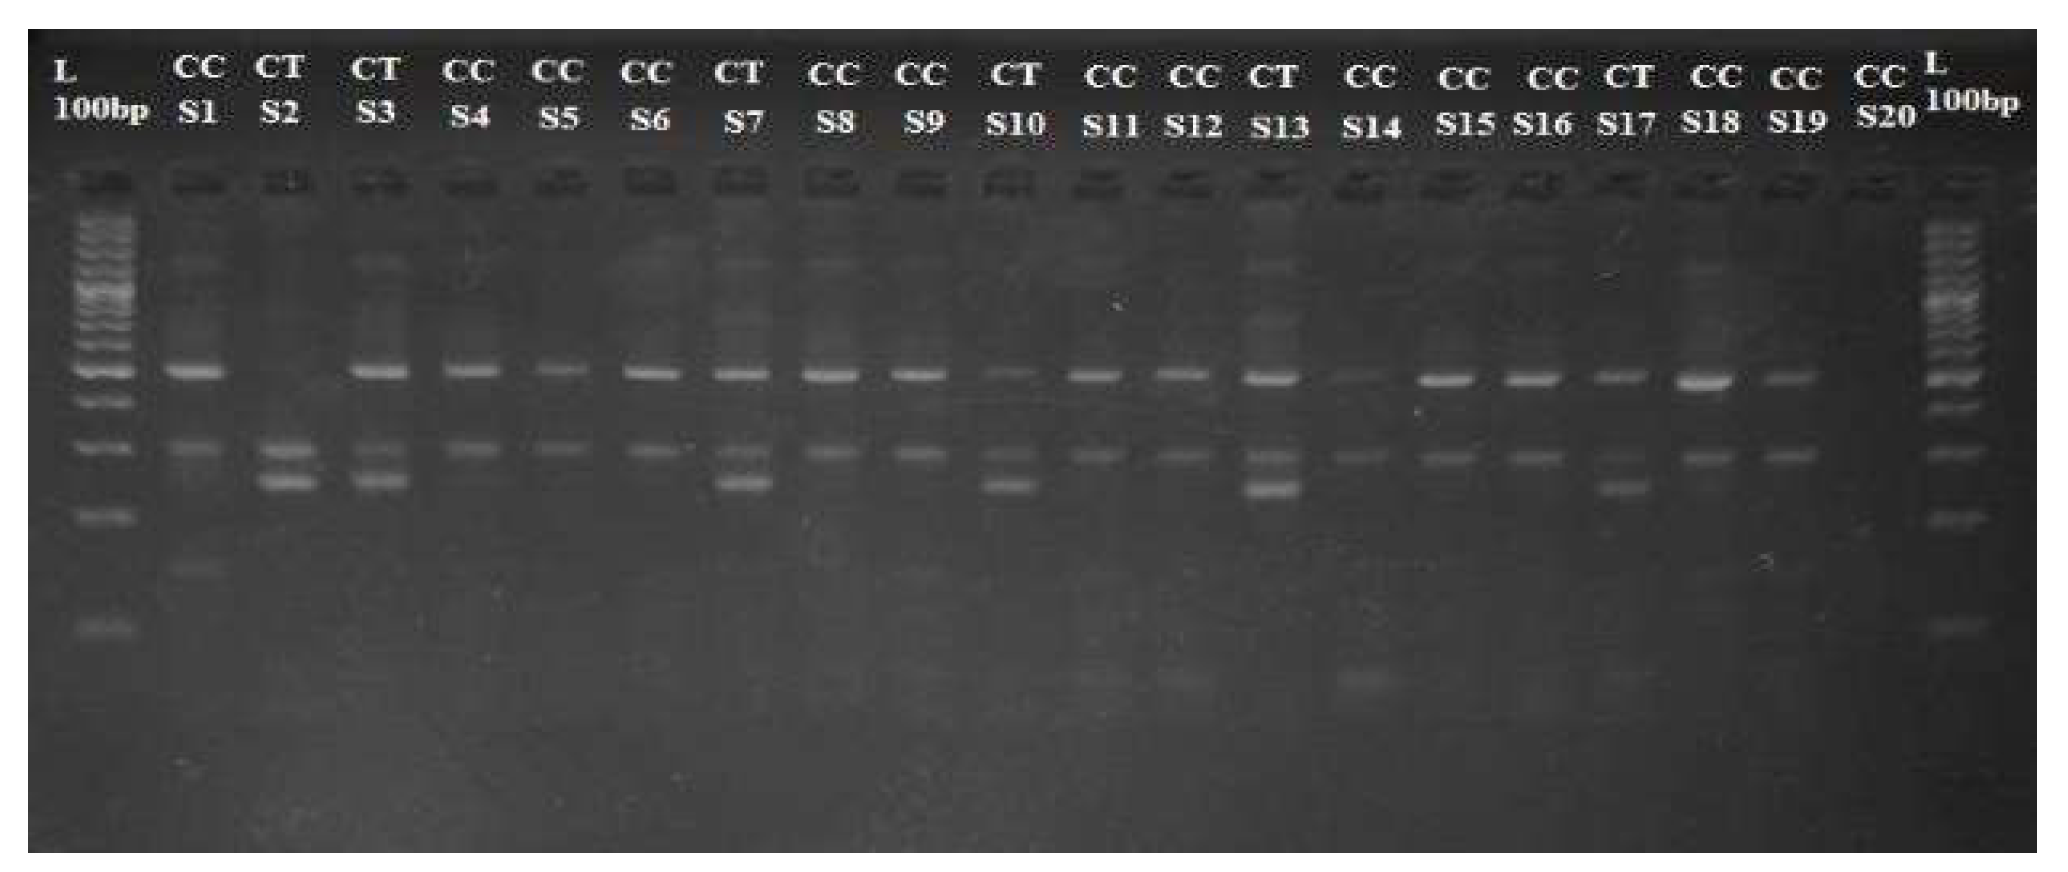
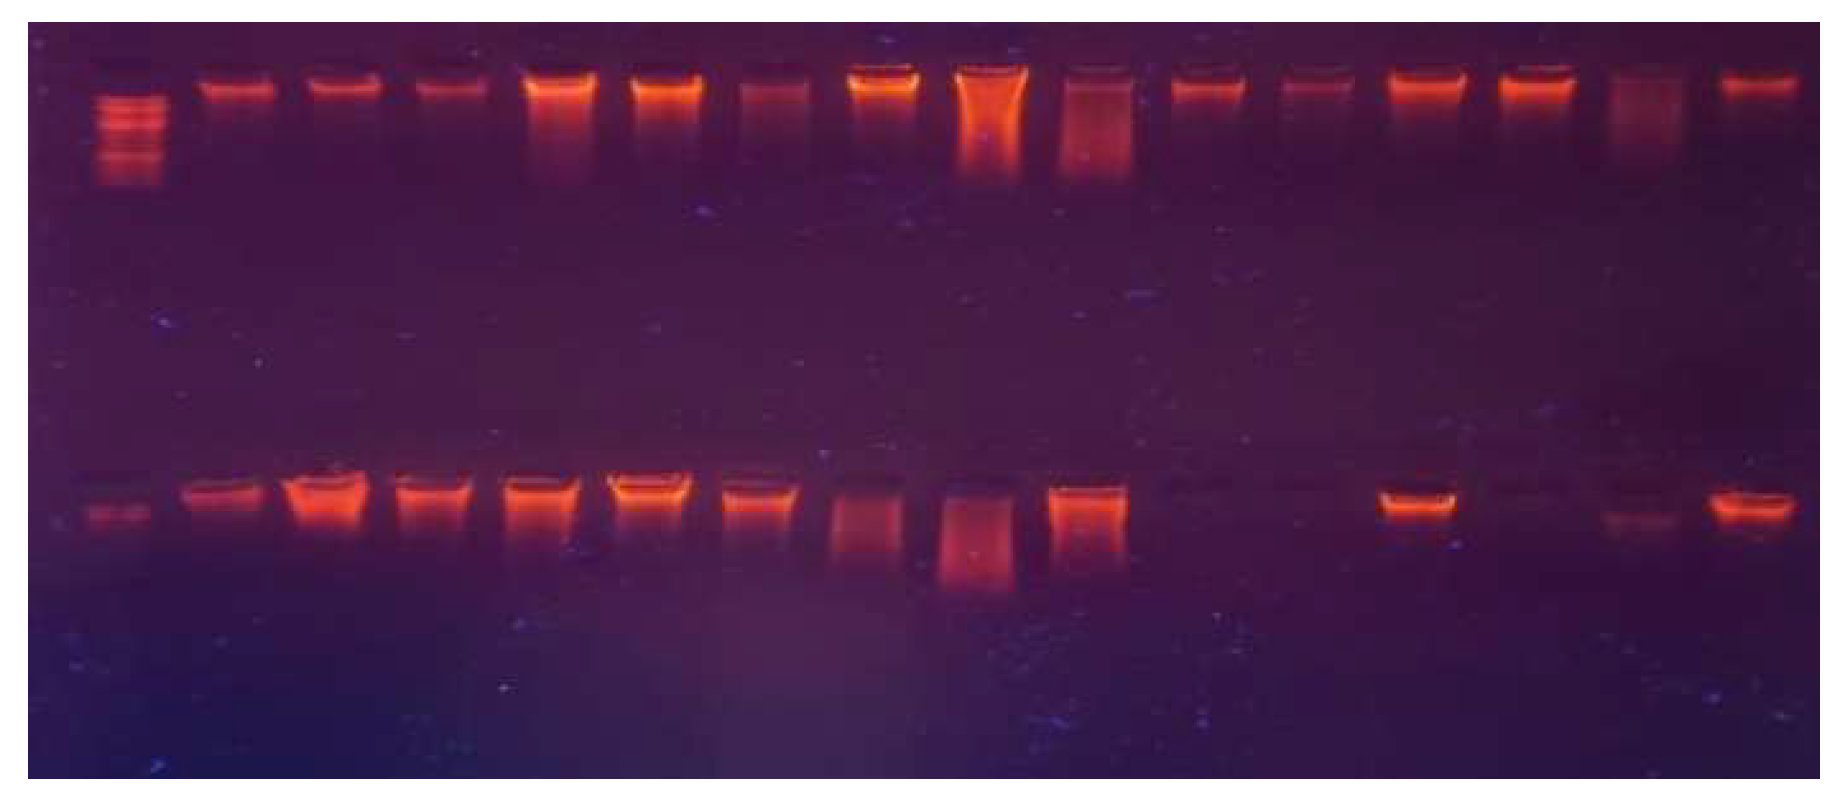
Figure 5.
TETRA-ARMS PCR amplification of TFR2 gene variant rs7385804 on a 2% agarose gel. The main PCR product size is 490bp, with the reference C allele at 298bp and the mutant T allele at 248bp.
Figure 5.
TETRA-ARMS PCR amplification of TFR2 gene variant rs7385804 on a 2% agarose gel. The main PCR product size is 490bp, with the reference C allele at 298bp and the mutant T allele at 248bp.
Confirmation and Validation of SNP Detection via TETRA-ARMS PCR:
Nine randomly chosen samples from each of the three genotypes (CC, CG, and GG) were chosen for Sanger sequencing in order to confirm the SNPs found by TETRA-ARMS PCR for the TFR2 gene variation rs7385804. Figure 4 displays the amplicons from these samples, which were amplified using outer primers and purified prior to sequencing. The TFR2 variant amplicons were present in quantities ranging from 0.5 to 8 ng/µL. The precise location of the variation is indicated in the sequencing electropherograms of the chosen SNP (rs7385804). The genotypes/alleles are shown by the X-axis, and the existence of the corresponding genotypes (CC, CG, GG) is confirmed by the Y-axis, which displays the peak height in relative fluorescence units (rfu).
Statistical Analysis of Case and Control Samples:
The allele and genotype frequencies for rs7385804 were calculated using SHEsis and SNPStats software. A total of 162 patient samples and 114 control samples were included in the analysis, with a 95% confidence level applied to all statistical tests. SPSS was used for additional analysis, and two-tailed χ² tests were performed to evaluate the relationship between the TFR2 gene variants and hemochromatosis. Age and gender distributions were also considered in the statistical models. Statistical significance was defined as a P-value of less than 0.05 and an accuracy interval larger than 0.01.
Allele and Genotype Frequencies for rs7385804 (TFR2 C677G) and rs1805087 (TFR2 A2756G):
The genotype and allele frequencies for the TFR2 variants rs7385804 (C677G) and rs1805087 (A2756G) were computed using SHEsis and SNPStats software. The genotypic and allelic frequencies for rs7385804 are presented in Table 4.2 and Table 4.3, which précis the outcomes obtained from SHEsis.
Association analysis between Rs7385804 and Hemochromatosis Disorder
The SNP stats web tool was used to analyze the SNP association of rs7385804 TFR2 as shown in Table
Table 6.
Genotypic test model showing association of SNP rs7385804 TFR2 C677G and Hemochromatosis disorders.
Table 6.
Genotypic test model showing association of SNP rs7385804 TFR2 C677G and Hemochromatosis disorders.
| Model | Geno type |
Control (100) |
Case (100) |
p-value | (95% CI) | AIC |
|
Co-dominant |
C/C | 70 (70%) | 85 (85%) | 0.0072 | 1.00 | 360.4 |
| C/T | 26 (26%) | 12 (12%) | 0.42 (0.21 – 0.83) | |||
|
Dominant |
C/C | 70 (70%) | 85 (85%) | 0.0043 | 1.00 | 359.7 |
| C/T + T/T | 30 (30%) | 15 (15%) | 0.44 (0.21 – 0.91) | |||
|
Recessive |
C/C + C/T | 96 (96%) | 100 (100%) | 0.189 | 1.00 | 362.3 |
| T/T | 4 (4%) | 0 (0%) | NA (0.00 – NA) | |||
|
Over-dominant |
C/C + T/T | 74 (74%) | 87 (87%) | 0.0094 | 1.00 | 361.2 |
| C/T | 26 (26%) | 13 (13%) | 0.48 (0.23 – 1.00) |
Figure 6.
Frequencies of TFR2 in case and control.
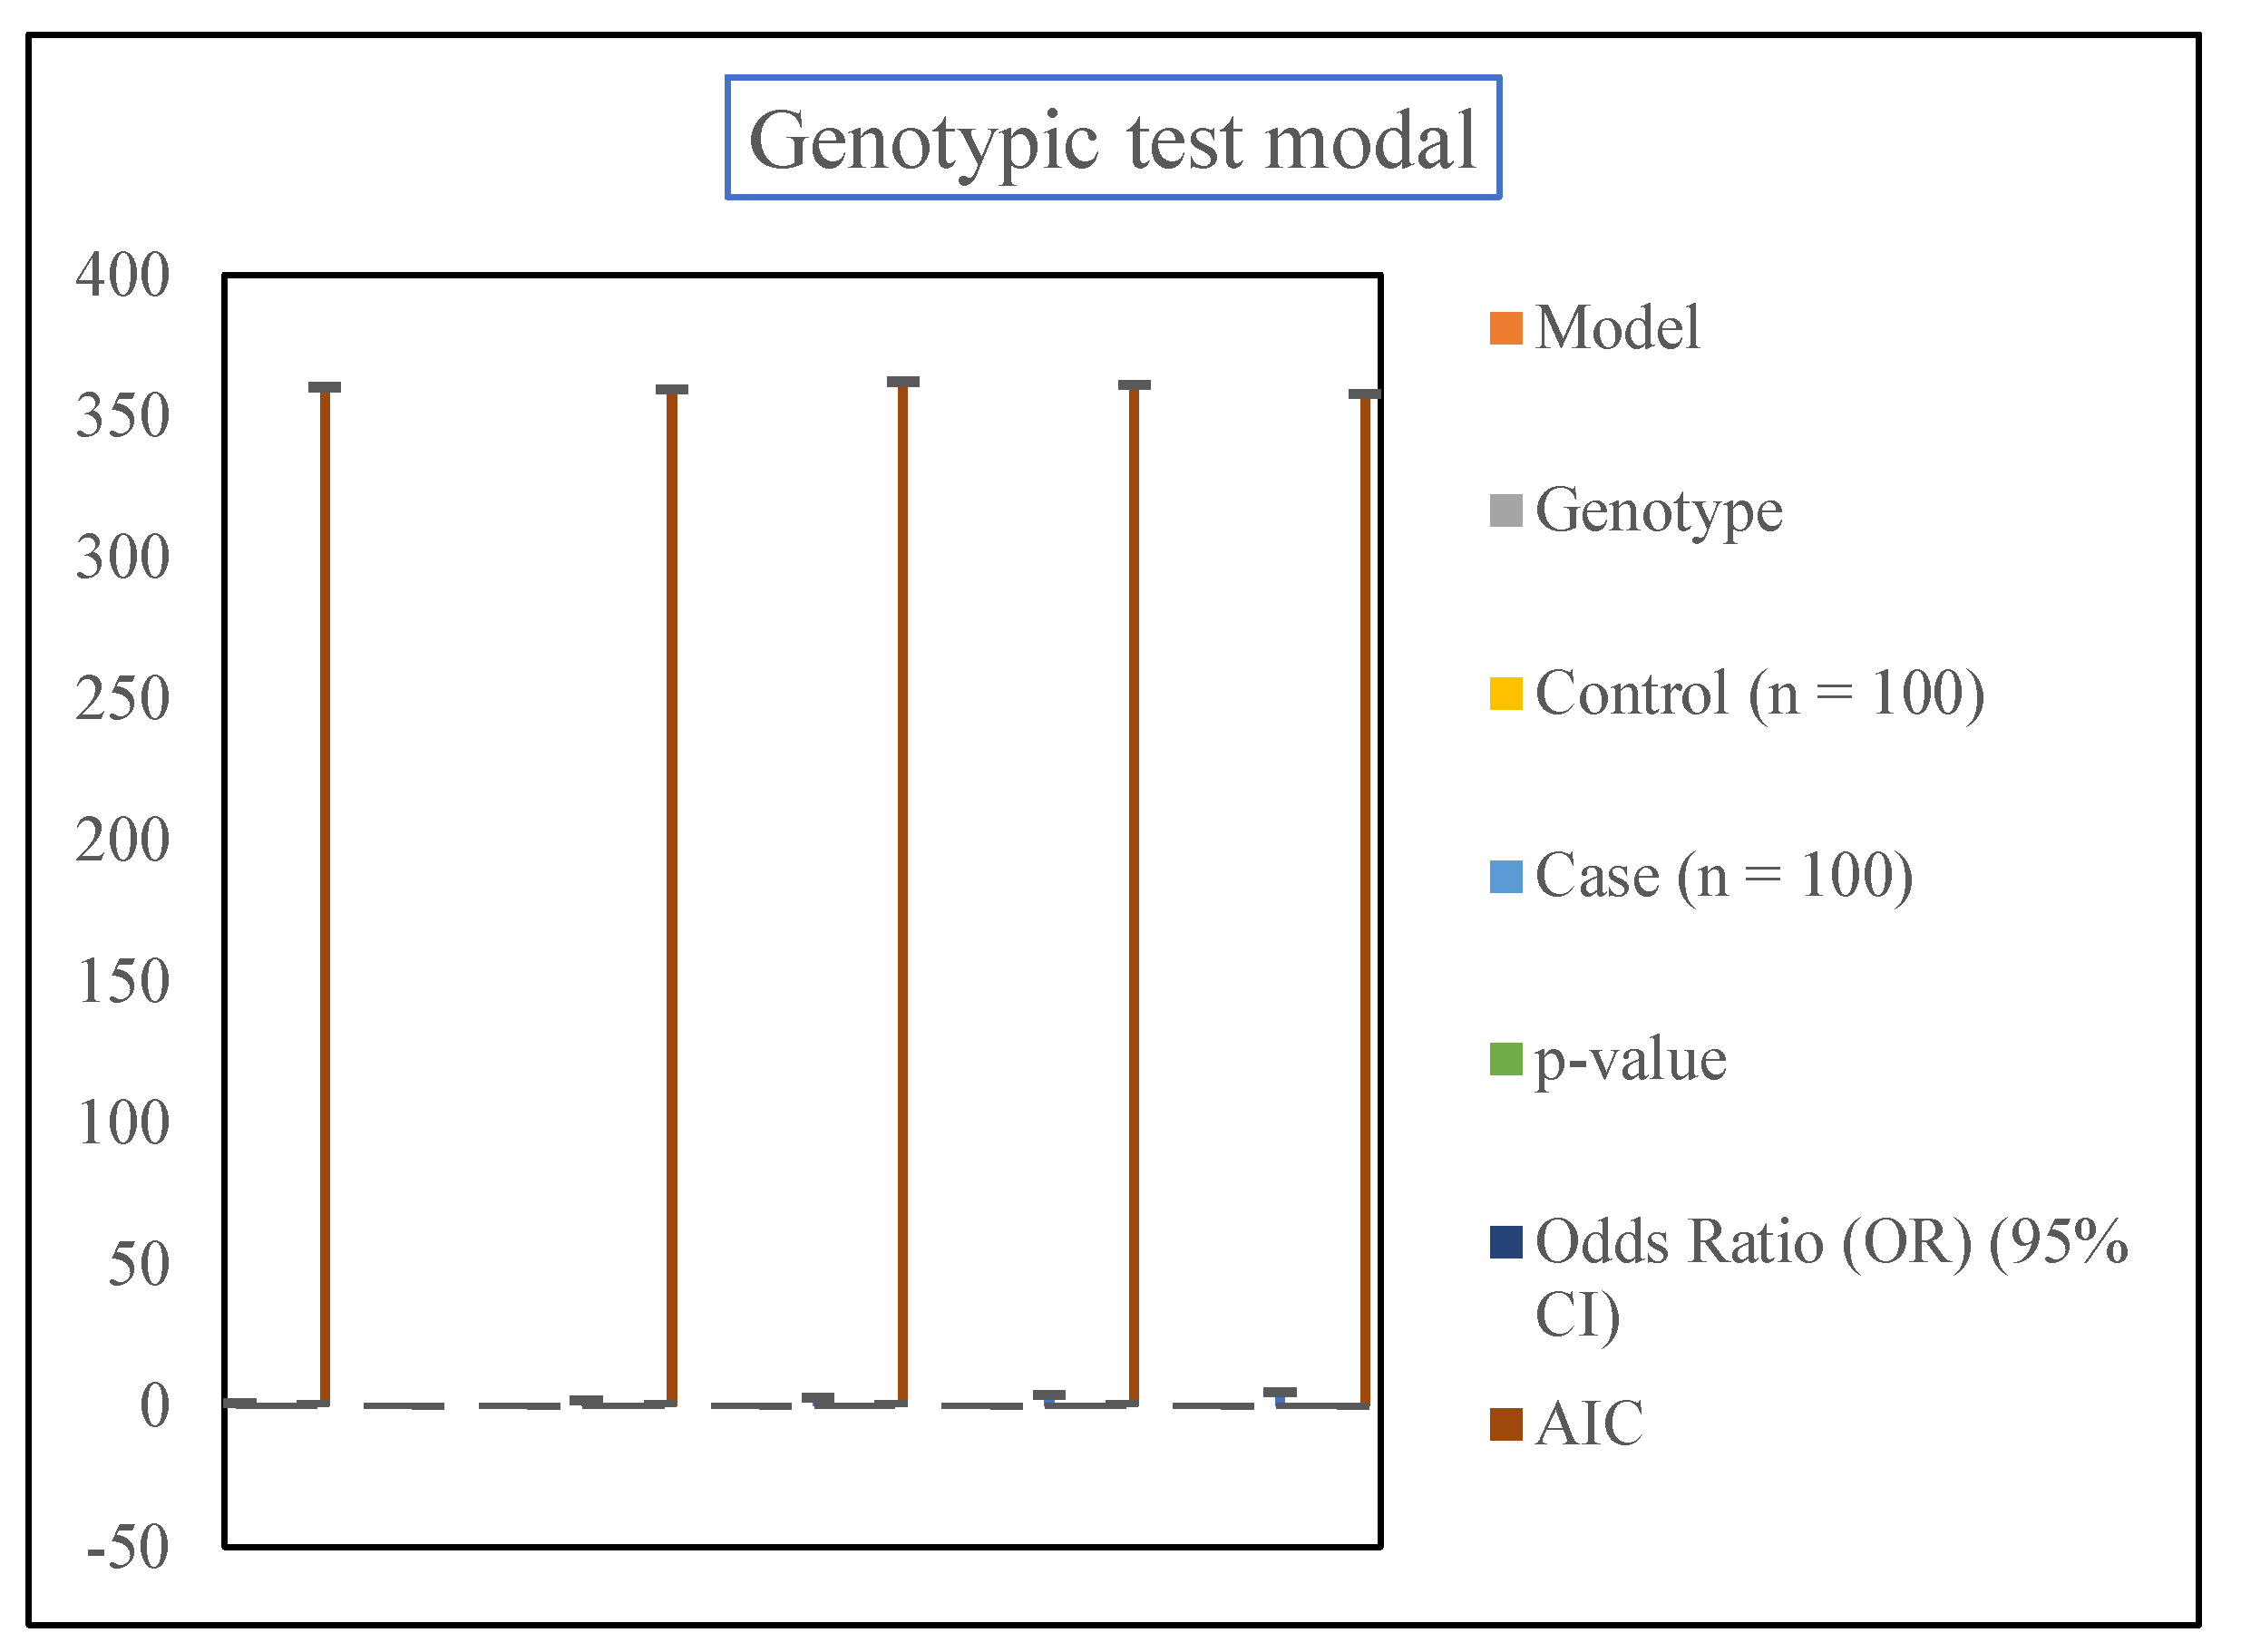
Table 7.
Association between Hemochromatosis and. Hyperferritnemia
| Groups | HH (ng/dL) | HFR (ng/mL) | HH (uIU/mL) |
| Control | (92 ± 11) | (1.5 ± 0.4) | (3.8 ± 0.12) |
| Hemochromatosis | (185 ± 22) | (5.2 ± 0.5) | (0.25 ± 0.003) |
| Hyperferritinemia | (16 ± 4) | (1.2 ± 0.1) | (12.5 ± 2.9) |
Figure 7.
Association between Hemochromatosis and.
Hyperferritnemia
Discussion
The analysis incorporated multiple genetic models (Co-dominant, Dominant, Recessive, Over-dominant, and Log-additive) to explore how the rs7385804 SNP might contribute to disease susceptibility. The findings revealed statistically significant associations in the Co-dominant, Dominant, Over-dominant, and Log-additive models. With a p-value of 0.0013 and an AIC of 351.5, the Log-additive model was the most robust fit to the data and demonstrated the greatest correlation. In the Co-dominant model, individuals carrying the C/T genotype were found to have 2.21 times higher odds of developing the condition compared to those with the C/C genotype (OR = 2.21, 95% CI: 1.27–3.86). Similarly, the Dominant model, which grouped the C/T and T/T genotypes, revealed a slightly higher odds ratio (OR = 2.32, 95% CI: 1.33–4.03). This demonstrates that carrying at least one copy of the T allele increases the risk of hemochromatosis.
The Over-dominant model, which highlights the influence of heterozygous genotypes, showed an odds ratio of 2.15 (95% CI: 1.23–3.74). However, the Recessive model, which considers the effect of the T/T genotype, was not statistically significant due to the rarity of this genotype in both the case and control groups. This observation suggests that the heterozygous C/T genotype may have a more significant impact on disease susceptibility.
The Log-additive model emerged as the strongest predictor, considering the cumulative effect of risk alleles. It demonstrated an odds ratio of 2.34 (95% CI: 1.37–4.01), emphasizing that each additional T allele increases the risk of developing hemochromatosis. Its lower AIC value further supports its suitability in explaining the genetic contribution of the TFR2 SNP.
The TFR2 gene encodes transferrin receptor 2, a protein critical for maintaining systemic iron balance. It primarily operates in liver cells to regulate hepcidin, a hormone that inhibits intestinal iron absorption and the release of stored iron. Mutations in TFR2 disrupt hepcidin regulation, causing excessive iron accumulation, which is a hallmark of hemochromatosis.
The SNP rs7385804, located within a regulatory region of the TFR2 gene, may influence the gene’s function by altering transcription or translation processes. The presence of the T allele could potentially modify gene expression, impacting hepcidin levels and contributing to iron overload. While this study identified a significant association, further research is needed to confirm the precise molecular mechanism by which these variant impacts iron metabolism.
While mutations in the HFE gene, such as C282Y and H63D, are widely recognized as primary contributors to hereditary hemochromatosis, studies have increasingly highlighted the role of non-HFE genes like TFR2. The present study, conducted in a South Asian cohort, supports the growing body of evidence suggesting that TFR2 variants are important in the pathogenesis of iron overload disorders.
Earlier investigations, such as those by Camaschella et al., identified TFR2 mutations as the cause of Type 3 hereditary hemochromatosis, a less common autosomal recessive form. Subsequent studies reported associations between TFR2 polymorphisms and iron-related phenotypes, though the findings often vary depending on the population. This study contributes to this growing field by identifying a significant association between rs7385804 and hemochromatosis in a Pakistani population, highlighting the need for genetic research in diverse ethnic groups.
Understanding the genetic underpinnings of hemochromatosis can aid in improving its management and prevention. Genetic screening for risk variants like rs7385804 can enable the early identification of individuals predisposed to iron overload, allowing for timely monitoring and intervention. For instance, regular assessment of serum ferritin and transferrin saturation levels in at-risk individuals can facilitate early diagnosis and treatment, such as therapeutic phlebotomy or dietary modifications.
Additionally, the findings emphasize the importance of considering incomplete penetrance and gene-environment interactions in genetic counseling. Although carrying the C/T genotype increases the risk, not all carriers develop the disease. Lifestyle factors, such as dietary iron intake and alcohol consumption, likely modulate the penetrance of genetic variants.
This study offers important insights into the genetic foundation of hemochromatosis within a South Asian population. By evaluating multiple genetic models, it offers a comprehensive understanding of the role of rs7385804 in disease susceptibility. The inclusion of a relatively large sample size for a genetic association study enhances the reliability of the findings.
However, some limitations should be noted. First, the study focused exclusively on a single SNP, potentially overlooking other genetic or regulatory variations in the TFR2 gene that may contribute to the condition. Second, the rarity of the T/T genotype limited the power of certain models, such as the Recessive model, to detect statistically significant associations. Finally, the study did not account for environmental factors or other comorbidities that could influence the observed associations.
Future studies should address these limitations by conducting whole-genome or targeted sequencing to identify additional variants and incorporating environmental and clinical variables into the analysis. Functional studies are also needed to validate the biological relevance of rs7385804 and its role in regulating iron metabolism.
3. CONCLUSION
The findings of this study underscore a significant association between SNP rs7385804 in the TFR2 gene and the risk of hemochromatosis in a South Asian population. The results highlight the importance of heterozygous genotypes and suggest that the Log-additive model is the best predictor of disease risk. These insights provide a foundation for further research into the genetic and molecular mechanisms underlying hemochromatosis and have potential implications for improving diagnosis and management strategies.
Conflict of Interest:
There is no conflict of interest among authors.
Author Contributions
Farhan Ikhtiar conducted the research, wrote the original manuscript text, and is the principal author.
Laraib Zafar Iqbal performed the statistical analysis.
Muhammad Faizan Qadir prepared the diagrams and tables.
Ahmed Haider assisted with data collection.
Rana Hissan Ullah applied the software tools.
Muhammad Usman Faroq reviewed the manuscript and contributed to drafting.
All authors reviewed and approved the final manuscript.
Faheem Fraz helped in the putting references
References
- Adams, Paul C, et al. "Hemochromatosis and Iron-Overload Screening in a Racially Diverse Population." New England Journal of Medicine 352.17 (2005): 1769-78. Print.
- Andersen, Rolf Værn, et al. "Hemochromatosis Mutations in the General Population: Iron Overload Progression Rate." Blood 103.8 (2004): 2914-19. Print.
- The Molecular Pathogenesis of Hereditary Hemochromatosis. Seminars in liver disease. 2011. © Thieme Medical Publishers. Print.
- Bardou-Jacquet, Edouard, et al. "Non-Hfe Hemochromatosis: Pathophysiological and Diagnostic Aspects." Clinics and research in hepatology and gastroenterology 38.2 (2014): 143-54. Print.
- Barton, James C, Corwin Q Edwards, and Ronald T Acton. "Hfe Hemochromatosis in African Americans: Prevalence Estimates of Iron Overload and Iron Overload-Related Disease." The American Journal of the Medical Sciences 365.1 (2023): 31-36. Print.
- Burke, Wylie, et al. "Hereditary Hemochromatosis: Gene Discovery and Its Implications for Population-Based Screening." Jama 280.2 (1998): 172-78. Print.
- Camaschella, Clara. "Understanding Iron Homeostasis through Genetic Analysis of Hemochromatosis and Related Disorders." Blood 106.12 (2005): 3710-17. Print.
- Clark, Paul, Laurence J Britton, and Lawrie W Powell. "The Diagnosis and Management of Hereditary Haemochromatosis." The Clinical Biochemist Reviews 31.1 (2010): 3. Print.
- Cobilinschi, Claudia Oana, et al. "A “Mix and Match” in Hemochromatosis—a Case Report and Literature Focus on the Liver." Medicina 59.9 (2023): 1586. Print.
- Costa, Taylla S, et al. "Hereditary Hemochromatosis Associated with the Development of Liver Cirrhosis." Jornal Brasileiro de Patologia e Medicina Laboratorial 57 (2021): e2842021. Print.
- Crawford, Darrell HG, et al. "Clinical Practice Guidelines on Hemochromatosis: Asian Pacific Association for the Study of the Liver." Hepatology International 17.3 (2023): 522-41. Print.
- Crownover, Brian K, and Carlton J Covey. "Hereditary Hemochromatosis." American family physician 87.3 (2013): 183-90. Print.
- Fargion, Silvia, Luca Valenti, and Anna Ludovica Fracanzani. "Beyond Hereditary Hemochromatosis: New Insights into the Relationship between Iron Overload and Chronic Liver Diseases." Digestive and Liver Disease 43.2 (2011): 89-95. Print.
- Fernandes, Augustine, et al. "The Molecular Basis of Hepcidin-Resistant Hereditary Hemochromatosis." Blood, The Journal of the American Society of Hematology 114.2 (2009): 437-43. Print.
- Finlayson, ND. "Hereditary (Primary) Haemochromatosis." BMJ: British Medical Journal 301.6748 (1990): 350. Print.
- Fletcher, Linda M, and Lawrie W Powell. "Hemochromatosis and Alcoholic Liver Disease." Alcohol 30.2 (2003): 131-36. Print.
- Geller, Stephen A, and Fernando PF de Campos. "Hereditary Hemochromatosis." Autopsy & Case Reports 5.1 (2015): 7. Print.
- Gochee, Peter A, et al. "A Population-Based Study of the Biochemical and Clinical Expression of the H63d Hemochromatosis Mutation." Gastroenterology 122.3 (2002): 646-51. Print.
- Grosse, Scott D, et al. "Clinical Penetrance in Hereditary Hemochromatosis: Estimates of the Cumulative Incidence of Severe Liver Disease among Hfe C282y Homozygotes." Genetics in Medicine 20.4 (2018): 383-89. Print.
- Hajar, Che Ghazali Norul, et al. "Allelic Diversity of the Hemochromatosis Gene (Hfe) in Malays, Chinese and Indians." sexual dysfunction 3 (2021): 4. Print.
- Hanson, EH, G Imperatore, and W Burke. "Hfe Gene and Hereditary Hemochromatosis: A Huge Review." American journal of epidemiology 154.3 (2001): 193-206. Print.
- Jones, DC, et al. "Comprehensive Hereditary Hemochromatosis Genotyping." Tissue antigens 60.6 (2002): 481-88. Print.
- Kanwar, Pushpjeet, and Kris V Kowdley. "Diagnosis and Treatment of Hereditary Hemochromatosis: An Update." Expert review of gastroenterology & hepatology 7.6 (2013): 517-30. Print.
- Katsarou, Martha-Spyridoula, et al. "Hemochromatosis: Hereditary Hemochromatosis and Hfe Gene." Vitamins and hormones 110 (2019): 201-22. Print.
- Kontoghiorghes, George J. "Iron Load Toxicity in Medicine: From Molecular and Cellular Aspects to Clinical Implications." International Journal of Molecular Sciences 24.16 (2023): 12928. Print.
- Kowdley, Kris V, et al. "Acg Clinical Guideline: Hereditary Hemochromatosis." Official journal of the American College of Gastroenterology| ACG 114.8 (2019): 1202-18. Print.
- Lok, Chun Yu, et al. "Iron Overload in the Asian Community." Blood, The Journal of the American Society of Hematology 114.1 (2009): 20-25. Print.
- McLaren, Christine E, et al. "Hemochromatosis and Iron Overload Screening (Heirs) Study Design for an Evaluation of 100,000 Primary Care-Based Adults." The American journal of the medical sciences 325.2 (2003): 53-62. Print.
- Moretti, Diego, et al. "Relevance of Dietary Iron Intake and Bioavailability in the Management of Hfe Hemochromatosis: A Systematic Review." The American journal of clinical nutrition 98.2 (2013): 468-79. Print.
- Motulsky, Arno G, and Ernest Beutler. "Population Screening in Hereditary Hemochromatosis." Annual review of public health 21.1 (2000): 65-79. Print.
- Padeniya, Padmapani, et al. "Frequency of Hereditary Hemochromatosis Gene (Hfe) Variants in Sri Lankan Transfusion-Dependent Beta-Thalassemia Patients and Their Association with the Serum Ferritin Level." Frontiers in Pediatrics 10 (2022): 890989. Print.
- Paganoni, Rossana, André Lechel, and Maja Vujic Spasic. "Iron at the Interface of Hepatocellular Carcinoma." International Journal of Molecular Sciences 22.8 (2021): 4097. Print.
- Panigrahi, I, et al. "Evidence for Non-Hfe Linked Hemochromatosis in Asian Indians." Indian journal of medical sciences 60.12 (2006): 491-95. Print.
- Peesapati, Venkata Sri Ramani, et al. "Beyond the Usual Suspects: Hereditary Hemochromatosis and Transaminitis in Primary Care." Cureus 15.8 (2023). Print.
- Pietrangelo, Antonello. "Hemochromatosis: An Endocrine Liver Disease." Hepatology 46.4 (2007): 1291-301. Print.
- ---. "Hereditary Hemochromatosis: Pathogenesis, Diagnosis, and Treatment." Gastroenterology 139.2 (2010): 393-408. e2. Print.
- Pointon, Jennifer J, et al. "Hemochromatosis Gene (Hfe) Mutations in South East Asia: A Potential for Iron Overload☆." Blood Cells, Molecules, and Diseases 30.3 (2003): 302-06. Print.
- Savatt, Juliann M, et al. "Testing and Management of Iron Overload after Genetic Screening–Identified Hemochromatosis." JAMA Network Open 6.10 (2023): e2338995-e95. Print.
- Shamas, Ambrin Gull. "Primary Hereditary Haemochromatosis and Pregnancy." GastroHep 2023 (2023). Print.
- Tirnitz-Parker, Janina EE, et al. "Iron and Hepatic Carcinogenesis." Critical Reviews™ in Oncogenesis 18.5 (2013). Print.
- Van Bokhoven, MA, C Th BM van Deursen, and Dorine W Swinkels. "Diagnosis and Management of Hereditary Haemochromatosis." Bmj 342 (2011). Print.
- Waalen, Jill, Børge G Nordestgaard, and Ernest Beutler. "The Penetrance of Hereditary Hemochromatosis." Best Practice & Research Clinical Haematology 18.2 (2005): 203-20. Print.
- Wallace, Daniel F, and V Nathan Subramaniam. "The Global Prevalence of Hfe and Non-Hfe Hemochromatosis Estimated from Analysis of Next-Generation Sequencing Data." Genetics in medicine 18.6 (2016): 618-26. Print.
- Weiss, Günter. "Genetic Mechanisms and Modifying Factors in Hereditary Hemochromatosis." Nature reviews Gastroenterology & hepatology 7.1 (2010): 50-58. Print.
- Wessling-Resnick, Marianne. "Iron: Basic Nutritional Aspects." Molecular, Genetic, and Nutritional Aspects of Major and Trace Minerals. Elsevier, 2017. 161-73.
Table 2.
Reagent Components for TETRA-ARMS PCR.
| Sr no | Reagent | Concentration |
|---|---|---|
| 1 | DNA Template | 100 ng – 200 ng |
| 2 | Outer Reverse Primer | 0.3 μM |
| 3 | Inner Forward Primer | 0.3 μM |
| 4 | Inner Reverse Primer | 0.3 μM |
| 5 | dNTP Mix | 200 μM |
| 6 | PCR Buffer (10X) | 1X |
| 7 | Magnesium Chloride (MgCl₂) | 2-3 mM |
| 8 | Taq Polymerase | 0.5 U – 1 U |
| 9 | DMSO | 1-2% |
| 10 | Water (Nuclease-free) | 3.1 μM |
| Total amount | 25 μL | |
Table 3.
Sequencing PCR Reaction Mixture Reagents.
| Sr. no | Components | Capacity µL |
|---|---|---|
| 1 | Sequence buffer | 1 |
| 2 | Big dye | 1.5 |
| 3 | Reverse of Forward primer | 1 |
| 4 | Template DNA | 3 |
| 5 | PCR water | 2 |
| Total volume | 10µL | |
Table 4.
Distribution of genotypes for the TFR2 gene variant rs7385804.
| Sr. No | Genotype | Control (n = 100) |
Case (n = 100) |
p-value |
| 1 | C/C (homozygous wild) | 79 (0.790) | 91 (0.550) | 0.00112 |
| 2 | C/G (heterozygous) | 17 (0.170) | 54 (0.330) | 0.00023 |
| 3 | G/G (homozygous mutant) | 4 (0.040) | 10 (0.120) | 0.0271 |
Table 5.
Allelic frequency of TFR2 in case and control.
| Sr. No | Allele | Control | Case | p-value |
| 1 | C Allele | 0.85 (170/200) | 0.75 (150/200) | 0.0072 |
| 2 | G Allele | 0.15 (30/200) | 0.25 (50/200) | 0.0072 |
Disclaimer/Publisher’s Note: The statements, opinions and data contained in all publications are solely those of the individual author(s) and contributor(s) and not of MDPI and/or the editor(s). MDPI and/or the editor(s) disclaim responsibility for any injury to people or property resulting from any ideas, methods, instructions or products referred to in the content. |
© 2025 by the authors. Licensee MDPI, Basel, Switzerland. This article is an open access article distributed under the terms and conditions of the Creative Commons Attribution (CC BY) license (http://creativecommons.org/licenses/by/4.0/).
Copyright: This open access article is published under a Creative Commons CC BY 4.0 license, which permit the free download, distribution, and reuse, provided that the author and preprint are cited in any reuse.


