Submitted:
31 December 2024
Posted:
10 January 2025
You are already at the latest version
Abstract
Common bean production is vital in Western Kenya for its economic, nutritional, environmental, and cultural significance. It provides a key income source for smallholder farmers, supports regional trade, and contributes to food security with affordable, protein-rich food. However, challenges such as pests, diseases, climate change, poor soil fertility, and limited access to quality seeds hinder production. Among these constraints Bean diseases and especially viral diseases have been documented to account for a higher percentage of crop losses in the field This study was commissioned to conduct a comprehensive analysis of small molecule metabolites in diseased common bean biological systems, aiming to identify potential disease biomarkers and improve the understanding of the related metabolic pathways. To achieve this, virus-free Rosecoco bean cultivars were initially planted and later exposed to viral diseases (BCMV and BCMNV) in designated regions. At the same time, control experiments involved the use of healthy plants. Diseased and healthy leaves were collected for metabolite extraction and analyzed using liquid chromatography coupled with quadrupole time-of-flight tandem mass spectrometry technology. A total of 354 metabolites were identified across seven pathways, with 51 upregulated metabolites, mainly from fatty acids, terpenoids, and alkaloids. Ten metabolites were identified as differentially expressed, two of which had their molecular structures successfully determined. These metabolites hold potential as biomarkers for viral disease detection, monitoring, and conferring resistance in common bean diseases. These findings emphasize the significance of fatty acids and terpenoids in plant stress responses, suggesting that further research into these pathways is crucial for better understanding plant defence resilience.
Keywords:
Phaseolus vulgaris L
; metabolomic profiling
; Biomarkers
; Disease detection
; Monitoring
Introduction
Common bean production is vital in Western Kenya due to its economic, nutritional, environmental, and cultural significance (Ojiem, 2018). It provides a crucial source of income for smallholder farmers, supports regional trade, and contributes to food security by offering affordable, protein-rich food (Lisciani et al., 2024). However, bean production in this region faces several challenges, including pests and diseases, climate change, poor soil fertility, limited access to quality seeds, inadequate market access, post-harvest losses, lack of agricultural knowledge, and high input costs (Farrow & Muthoni Andriatsitohaina, 2020; Abobatta et al., 2021). Viral diseases, particularly the Bean Common Mosaic Virus (BCMV), Bean Common Necrotic Virus (BCMNV) (H. S. Singh & Lamani, 2024), and Bean Yellow Mosaic Virus (BYMV) among others, are known to cause significant yield and quality losses. Various approaches have been employed to mitigate these diseases, such as integrated pest management (IPM), using resistant bean varieties, crop rotation, and proper spacing to reduce disease spread. However, resource-poor farmers often struggle to afford and adopt these interventions.
Metabolic profiling has emerged as an essential tool for understanding the biochemical responses of plants to various stressors (Satrio et al., 2024), including viral infections (Khan et al., 2022). In regions like Western Kenya, where smallholder farmers rely heavily on common beans (Phaseolus vulgaris) for nutrition, protein, and income, these viral diseases pose a significant threat to food security, especially in settings where access to diagnostic tools, pest management strategies, and agricultural extension services is limited. There are two approaches in metabolomics; Targeted metabolomics is crucial in understanding plant defense mechanisms and nutrition by comprehensively analyzing specific metabolites (Sharma et al., 2021). In addition, targeted metabolomics allows for the identification and quantification of key compounds such as phytohormones, secondary metabolites, and defense-related chemicals, which are produced by plants in response to biotic and abiotic stresses (Castro-Moretti et al., 2020; Vo et al., 2021). This approach has been used to identify metabolic pathways activated during stress responses, enabling the identification of potential biomarkers for disease resistance (Maia et al., 2020; Satrio et al., 2024) and improving our understanding of how plants defend themselves against pathogens, pests, or environmental stressors. In addition, targeted metabolomics offers insights into the composition of essential nutrients, including vitamins, amino acids, and minerals, present in plants (Kumar et al., 2017; D. P. Singh et al., 2022). By analyzing these metabolites, we can assess the nutritional value of crops, identify variations in nutrient levels across different plant varieties or growth conditions, and optimize agricultural practices to enhance crop yields and nutritional content. Furthermore, developing crops with improved nutrient profiles or increased resistance to stress can contribute to food security and human health.
Untargeted metabolome profiling is critical in understanding the biochemical complexities associated with viral infections in common beans, particularly in resource-limited settings like Western Kenya. This approach involves the comprehensive analysis of a wide array of metabolites without prior specification of which molecules to target, thereby providing a holistic view of the metabolic alterations occurring post-infection. By utilizing advanced analytical techniques such as Liquid Chromatography Mass Spectrometry and Nuclear Magnetic Resonance, we can identify and quantify various metabolic pathways that may be disrupted by viral pathogens (Manchester & Anand, 2017; Purdy, 2019). In examining the untargeted metabolome profiles of beans affected by viral diseases, insights can be gained into the plant’s stress response mechanisms and overall health. Such detailed profiling not only enhances our understanding of plant-pathogen interactions but also aids in developing targeted management strategies to improve crop resilience in affected regions.
Viral infections have been shown to disrupt plant growth and reproduction, resulting in significant modifications to plant metabolism (Zhao & Li, 2021). These changes are thought to reflect the plant’s defense mechanisms, nutrient allocation, and overall physiological state (Di Carli et al., 2012; Sun et al., 2020). However, many studies have pointed out that the full extent of these metabolic shifts and their implications for plant health and resistance mechanisms remain poorly understood, especially in the context of resource-poor farming systems. Furthermore, the lack of reliable and accessible diagnostic methods makes it difficult for farmers to detect viral infections early, which hinders timely intervention and the adoption of effective agricultural practices.
This study aimed to characterize the targeted and untargeted metabolome profiles of common beans infected by viral diseases to address challenges in viral disease detection and crop resilience. Targeted metabolomics focuses on specific metabolites, enabling the identification of metabolic markers related to disease presence and progression. In contrast, untargeted metabolomics provides a broader view of the entire metabolome, revealing biochemical pathways and potential novel biomarkers. By combining these approaches, we seek to provide a comprehensive understanding of how viral infections impact plant metabolism. In addition, this further aimed to identify key metabolic alterations in response to viral infections, correlating these changes with disease severity and resistance mechanisms. Identifying specific biomarkers could improve early detection and disease monitoring, while also contributing to breeding programs for developing viral-resistant bean varieties, enhancing crop resilience in resource-limited environments.
Methodology
Four study sites were selected within the Western Region of Kenya: Musasa (Vihiga), Sichilayi (Kakamega), Butula (Busia), and Tuti (Bungoma). At these sites, the Rosecoco bean cultivar was planted and subjected to mechanical inoculation (Bhat et al., 2020) with BCMV, BCMNV, and CMV viruses at the three-leaf stage. Control plots were established using virus-free Rosecoco seeds planted under similar conditions to serve as a baseline comparison (Figure 1). The inoculum for the mechanical transmission experiments was prepared from fresh or lyophilized leaves of Common bean plants infected with BCMV and BCMNV. The infected plant material was homogenized in potassium phosphate buffer (0.01 M, pH 7.0) at 1:5 (w/v). The homogenate was then filtered through Muslin cloth to remove large debris, yielding a clarified inoculum. This inoculum was used immediately for vascular puncture inoculation. inoculation, the leaves of the target plants were dusted with 400-mesh carborundum to facilitate virus entry by creating micro-abrasions on the leaf surface. Control plants were similarly dusted with carborundum but inoculated with phosphate buffer alone to ensure the validity of the experimental setup. For the control experiment, all plants were maintained in a greenhouse under controlled environmental conditions, with temperatures ranging from 25 to 30°C, for 30 days. The plants were monitored daily for symptom development, and serological validation of virus acquisition was performed using ELISA tests with the relevant antisera
Samples were collected at the near-flowering stage, consisting of 50 leaf samples (at least 10 from each of the 4 study site) and 10 samples from virus-free controls. The samples were quickly snap-frozen with liquid nitrogen, stored at −80°C, freeze-dried, and sent to the Max Planck Institute for Chemical Ecology in Jena, Germany for metabolome analysis.
Targeted and Untargeted Metabolome
The Leaf samples collected were ground using a HG-600 Geno/Grinder® 2010 (Cole-Parmer, New Jersey, USA) for 60 secs at 1150 strokes/min and extracted in 1mL of extraction buffer (200 mL Milli-Q water and 800mL HPLC grade MeOH) with standards (12.5 ng phytohormone IS) for 24 hours, then centrifuged at 19,000g for 20 minutes at 4oC. About 600-700 µL of the supernatant was transferred into 1.8mL autosampler vials and stored at -20°C until analyzed. The filtrate obtained was analyzed using liquid chromatography coupled with quadrupole time-of-flight tandem mass spectrometry (LCMS-9030 qTOF, Shimadzu Corporation, Kyoto, Japan) to quantify metabolites at various intervals. Chromatographic separation was performed on a Shim-pack Velox C18 column (100 mm × 2.1 mm, 2.7 µm particle size) maintained at 55°C (Shimadzu Corporation, Kyoto, Japan). A 3 µL injection volume was used for all samples, which were analyzed with a binary mobile phase: solvent A consisted of 0.1% formic acid in Milli-Q HPLC grade water (Merck, Darmstadt, Germany), and solvent B was UHPLC grade methanol with 0.1% formic acid (Romil Ltd., Cambridge, United Kingdom). The analysis was conducted on a qTOF high-definition mass spectrometer operating in negative electrospray ionization mode. The instrument parameters included a nebulizer voltage of 4.0 kV, interface temperature of 300°C, dry gas flow of 3 L/min, detector voltage of 1.8 kV, heat block temperature of 400°C, DL temperature of 280°C, and flight tube temperature of 42°C. Ion fragmentation was induced using argon gas with collision energies of 30 eV and a 5 eV spread (Ramabulana et al., 2021).
Data pre-processing was performed using XCMS, with HPLC/UHD qTOF parameters employing the centWave feature detection method. A maximum threshold of 15 ppm, a signal-to-noise ratio of 6, and prefilters for intensity and noise set to 100 and 3, respectively, were applied. Retention time correction was done using the Obiwarp method with profStep, while alignment required a minimum sample fraction of 0.5 and an m/z width of 0.015. The data was initially analyzed by visualizing the mass spectra and generating a feature table using MZmine v4.4.0, with parameters adjusted to optimize data processing. Feature quantification was normalized based on the original masses of the samples using custom Python scripts developed with pandas v2.2.3. Principal Component Analysis (PCA) was conducted using the PCA module from sklearn. decomposition. Differential expression of metabolites was assessed with the edgeR v4.0 package, and the results were visualized through volcano plots and heatmaps, generated using Python scripts built with matplotlib.pyplot.
The mascot generic format (mfg) files and metadata for the respective treatments were processed on the GNPS2 online platform for networking and Sirius v6 for spectral annotation. Spectral searches utilized libraries such as GNPS, Biocyc, CHEBI, COCONUT, DSSTox, Blood Exposome, FooDB, HMBD, HSDB, KEGG, KNApSAck, LOTUS, LipidMaps, Maconda, MeSH, MiMeDB, NORMAN, Plantcyc, PubChem, PubMed, SuperNatural, TeroMOL and YMDB embedded in Sirius (Böcker et al., 2009; Ludwig et al., 2020). Metabolites were matched to GNPS2-linked databases and were putatively annotated or verified through searches in compound databases using their peak mass and isomeric SMILES. Further confirmation of annotations was carried out through literature searches of relevant studies. Metabolite concentrations were then analyzed to identify enriched metabolomic pathways. Pathway overrepresentation was assessed using a hypergeometric test.
Phytohormone Analysis
Phytohormone analysis was carried out by LC-MS/MS, following the method of (Heyer et al., 2018) Heyer et al. (2018), using an Agilent 1260 series HPLC system (Agilent Technologies), with modifications. A tandem mass spectrometer, QTRAP 6500 (SCIEX, Darmstadt, Germany), was used, and the chromatographic gradient was adjusted. Chromatographic separation was performed on a Zorbax Eclipse XDB-C18 column (50 × 4.6 mm, 1.8 µm, Agilent Technologies). The mobile phases were water with 0.05% formic acid (A) and acetonitrile (B). The elution profile was as follows: 0–0.5 min, 5% B; 0.5–9.5 min, 5–58% B; 9.5–9.51 min, 58–100% B; 9.52–11.0 min, 100% B; and 11.01–14.0 min, 5% B. The flow rate was maintained at 1.1 ml/min, and the column temperature was set to 25 °C. The mass spectrometer operated in multiple reaction monitoring (MRM) mode in negative ionization mode.
Results
After analysis, a total of 354 metabolites were identified, although some could not be assigned to specific categories. These metabolites were mapped to seven (7) pathways, with the highest number found in fatty acids (81), followed by shikimates and phenylpropanoids (77), while the carbohydrate pathway contained the least metabolites, totaling just 21. A significant number of metabolites were annotated to the terpenoid pathway (58). Table 1:
A total of 51 metabolites were upregulated, with the majority originating from the fatty acid pathway (16), followed by terpenoids and alkaloids, each containing 11 metabolites. Notably, no metabolites from the carbohydrate pathway were upregulated. Table1
A total of 131 metabolites were downregulated, with the majority coming from the fatty acid pathway (53), followed by terpenoids (28). The least downregulated metabolites were from the carbohydrate pathway, with only 1. Table 1
The number of downregulated metabolites was greater than the number of upregulated metabolites, as shown in Table I and Figure 2. Notably, a significant portion of metabolites remained unidentified, possibly due to a lack of characterization
The metabolite with the highest upregulation was monoterpenes (Mapping ID 11308) in Busia, Bungoma, and Vihiga counties. In Kakamega, the highest concentrations were observed for eicosanoids (Mapping ID 7510), pseudoalkaloids (transamidation) (Mapping ID 1833), and monoterpenoids (Mapping ID 11308), as shown in Figure 3 A.
The following metabolites were significantly downregulated in high concentrations in samples from Kakamega County: pseudoalkaloids (ID 11135), guanidine alkaloids (ID 8613), flavonoids (ID 4437), coumarins (ID 4371), and small peptides (ID 1659). In Bungoma County, the downregulated metabolites included triterpenoids (ID 11139), linear polyketides (ID 10826), flavonoids (ID 6843), and naphthalenes (ID 2022). In Busia County, flavonoids (ID 5823) and naphthalene (ID 2022) were the metabolites most downregulated in high concentrations. In Vihiga County, the metabolites showing high downregulation included triterpenoids (ID 11139), pseudoalkaloids (transamidation) (ID 11135), linear polyketides (IDs 11091 and 11089), coumarins (ID 4371), small peptides (ID 3165), phenylpropanoids (C-6-C3), and small peptides (ID 1659), as shown in Figure 3 B.
The Volcano plots for Kakamega Vihiga, Busia, and Bungoma are shown in Figure 4 A, B, C, D
Differentially Expressed Metabolites (DEGs)
Results indicate that unique metabolites annotated to Kakamega, Bungoma, Busia, and Vihiga as 13.10, 6, and 3 respectively Figure 5. A comparison of two counties at a time showed that a combination of Busia and Bungoma had the highest number (21) of commonly expressed metabolites while a combination of Busia and Kakamega had the lowest (1). On comparing 3 counties at a time, the combination with the highest number of differentially expressed genes was a combination of Busia, Bungoma, and Vihiga. Across the four sites, 10 metabolites were commonly up-regulated, including. Amongst the four sites, 10 metabolites were commonly up-regulated including metabolites with the following mapping IDs (2603, 2843,3767, 3773, 6251, 8793, 8796 9995,10337, and 11308. The MS2 peak spectrum and databases were used to identify metabolites with Mapping ID 11308 and Mapping ID 2603. Their molecular structures are shown in Figure 6 (A, B, C, and D).
Unique downregulated metabolites were identified for Kakamega (23), Bungoma (19), Vihiga (9), and Busia (8). Notably, six metabolites were commonly differentiated across all regions: Terpene glycoside (ID 11089), Fatty acyls (ID 11091), Triterpenoids (ID 1139), Terpene glycosides (ID 11166), Glycosylglycerols (ID 11169), and Alkyl glycosides (ID 11177). Figure 5.
Phytohormone Analysis
Jasmonic Acid-Phenylalanine (JA-Phe), JA-Trp, OPDA, and JA-Ile were highly expressed in common bean samples from Kakamega, while SA and ABA exhibited the lowest expression levels (Figure 6). In Bungoma, elevated expression levels of ABA, JA-Trp, and OPDA were observed. Vihiga County samples showed relatively high expression levels of JA-Trp, JA, and OH-JA. Busia County, on the other hand, had high expression levels of OPDA and JA-Trp metabolites (Figure 7).
Mann Whitney statistical test was conducted to evaluate whether the distributions of the two groups sample and control were different, focusing on the ranks of the values rather than their actual magnitudes. Table 2
The phytohormone SA was significantly expressed in all counties within the region. Jasmonic acid (JA) was significantly expressed in all counties except Busia. Table 2
Discussion
This study identified a total of 354 metabolites across seven metabolic pathways, revealing a complex interplay of biochemical processes. The alkaloid pathway exhibited a balanced distribution of upregulated and downregulated metabolites, suggesting dynamic regulation in response to the experimental conditions. Upregulation in alkaloid synthesis could reflect an adaptive response to the biotic stress the common bean was subjected to, while the downregulation of 11 metabolites may indicate a reduction in some alkaloid production when not needed under these conditions. Notwithstanding these findings, the alkaloid pathway has been associated with enhancing the nutritional value of a healthy diet and improving the adaptability of Broad bean seeds (Vicia faba L.) (Shi et al., 2022). Similarly, another study identified 29 differential metabolites and 19 genes (14 structural and 5 regulatory) in Chenopodium quinoa (wild.), revealing consistent variations in flavonoid, phenolic acid, and alkaloid metabolites across different quinoa types (Liu et al., 2023) were linked to mechanisms shaping taste and quality.
The amino acid and peptide pathway exhibited a large number of downregulated metabolites (8 downregulated, 4 upregulated), potentially reflecting a reduction in amino acid synthesis under the studied conditions. Amino acids serve as essential building blocks for proteins (Battezzati & Riso, 2002) and gaseous signaling molecules, including ethylene, nitric oxide, and hydrogen sulfide (Brosnan & Rooyackers, 2012). This observed downregulation may indicate a metabolic shift towards alternative pathways, such as energy storage or the biosynthesis of secondary metabolites.
Carbohydrate metabolism plays a crucial role in stress tolerance and plant adaptive mechanisms, including responses to temperature stress (Nguyen, 2018) and drought tolerance (Dwivedi et al., 2023). In this study, the carbohydrate pathway exhibited no upregulated metabolites and only minimal downregulation, indicating its stability and limited involvement in the observed metabolic reprogramming. The reason for this could be that probably alternative energy sources, such as fatty acids, may have played a more prominent role under the studied conditions.
Flavonoids are natural products known for their significant role in protecting against various human diseases. Several bioactive flavonoids, including chalcones, flavones, flavanones, flavanols, isoflavonoids, and proanthocyanidins, are found in diverse parts of plants such as leaves, roots, bark, stems, flowers, weeds, and fruits. These compounds are synthesized in higher plants through the shikimate, phenylpropanoid, and polyketide pathways (Rehan, 2021).The polyketide pathway demonstrated a complex response, with 14 metabolites being downregulated and 8 upregulated. This indicates that while certain metabolites within this pathway may be upregulated for defense or specialized functions, the overall activity of the pathway may be diminished, reflecting shifts in metabolic priorities toward other processes. Similarly, the shikimate and phenylpropanoid pathways exhibited a reduction in metabolite production, with 16 metabolites downregulated and only one upregulated. This may indicate a potential shift away from the synthesis of aromatic and secondary metabolites, possibly to prioritize more immediate metabolic needs.
In contrast, the terpenoid pathway displayed a mixed response, with 11 metabolites upregulated and 28 downregulated. This indicates selective synthesis of certain terpenoids, likely in response to environmental stimuli or as part of the plant’s defense mechanisms, while other components of the pathway were suppressed. These findings highlight the dynamic regulation of metabolic pathways in response to shifting environmental and physiological demands.
Very long-chain fatty acids (VLCFAs), defined as fatty acids with more than 18 carbon atoms, are critical for physiological and structural functions in plants. VLCFAs are key components of membrane lipids, maintaining membrane homeostasis and selectively accumulating in the sphingolipids of the plasma membrane’s outer leaflet, where they play a vital role in intercellular communication (Batsale et al., 2021). Additionally, VLCFAs are found in phospholipids such as phosphatidylserine and phosphatidylethanolamine, influencing membrane domain organization and interleaflet coupling. In epidermal cells, they serve as precursors for the cuticular waxes that form the plant cuticle, which is essential for regulating interactions with the external environment (Batsale et al., 2021). Short-chain fatty acids (SCFAs), produced by colonic bacteria and derived from dietary sources, contribute to human health through their metabolic and signaling properties. Their physiological functions are determined by the length of their aliphatic tails and are mediated by the activation of specific membrane receptors (González-Bosch et al., 2021).
In the common bean plant, 131 metabolites were found to be downregulated across various pathways, with the fatty acid pathway exhibiting the largest reduction (53 metabolites). This point to significant shifts in lipid metabolism, potentially linked to energy demands, stress responses, or regulatory feedback mechanisms. Terpenoid metabolism also showed substantial downregulation (28 metabolites), suggesting adjustments in secondary metabolite production. Conversely, carbohydrate metabolism displayed minimal downregulation, indicating it was not a primary target of metabolic reprogramming.
The observed upregulation of certain fatty acid and terpenoid metabolites, alongside the downregulation of others, suggests a complex metabolic shift likely driven by stress or resource allocation. Fatty acids and secondary metabolites such as terpenoids appear to play pivotal roles in plant adaptation to environmental stressors, while carbohydrate metabolism remains relatively stable, possibly reflecting reliance on fatty acids for energy. These outcomes suggest coordinated metabolic reprogramming, with a focus on lipid and secondary metabolite synthesis, while carbohydrate metabolism remains conserved. Future research should explore the regulatory mechanisms underlying fatty acid and terpenoid pathways, as well as their interactions and shared metabolic controls.
The study also revealed distinct regional patterns in metabolite expression, highlighting the influence of environmental and geographical factors. Kakamega exhibited the highest number of unique downregulated metabolites (23), followed by Bungoma (19), Vihiga (9), and Busia (8). This regional variation suggests that local conditions, including soil composition, climate, and biotic factors, may shape the metabolic profiles of plants. Despite these regional differences, six metabolites were commonly downregulated across all four regions. These included terpene glycosides, fatty acyls, triterpenoids, glycosylglycerols, and alkyl glycosides. The downregulation of these metabolites suggests their potential role in the plant’s metabolic response to shared environmental stressors or conditions, such as nutrient limitations or biotic stress. These metabolites could also serve as biomarkers for disease monitoring or regional agricultural applications.
In Busia, Bungoma, and Vihiga counties, monoterpenes (Mapping ID 11308) were the most upregulated metabolites, reflecting an increased defense response to biotic stressors. Monoterpenes are known to play roles in plant defense (Li et al., 2023), including insect repellence (Abdelgaleil et al., 2024) and UV protection (Qasim et al., 2024). In Kakamega, eicosanoids (Mapping ID 7510), pseudoalkaloids (Mapping ID 1833), and monoterpenoids (Mapping ID 11308) were upregulated, signifying a specific response to stress or inflammatory processes eclusive to this region.
The downregulation of metabolites across counties suggests a prioritization of primary metabolism over secondary metabolite production under experimental conditions. In Kakamega, the downregulation of pseudoalkaloids, guanidine alkaloids, flavonoids, coumarins, and small peptides may indicate a reduction in metabolic resources allocated to defense and antioxidant production. Similarly, Bungoma and Busia counties showed downregulation of metabolites related to defense, such as triterpenoids, flavonoids, and naphthalenes.
Vihiga County exhibited the broadest range of downregulated metabolites, reflecting a widespread alteration in metabolic pathways. This includes the downregulation of triterpenoids, pseudoalkaloids, linear polyketides, coumarins, small peptides, and phenylpropanoids, suggesting complex responses to environmental or physiological stress.
Phytohormones/ Targeted Metabolomics
The findings of this study reveal significant regional variability in the regulation of key phytohormones, particularly abscisic acid (ABA), salicylic acid (SA), and jasmonic acid (JA) derivatives, which are crucial for plant defense and stress adaptation (Pigolev et al., 2023). These variations highlight the influence of local environmental factors such as soil composition, water availability, and climate on plant hormonal responses.
Abscisic acid (ABA), a hormone primarily linked to stress responses, particularly under drought or water-deficit conditions (Muhammad Aslam et al., 2022), was significantly upregulated in Bungoma and Kakamega (p-values of 0.0312* and 0.0257*, respectively). This indicates that the common bean plants in these regions likely responded to biotic (viral) stressors, which activated ABA signaling. In contrast, ABA showed no significant change in Busia and Vihiga (p-values of 0.0792 and 0.0890, respectively), which may indicate more stable environmental conditions or a reduced need for ABA-mediated stress responses in these areas.
Salicylic acid (SA), known for its role in plant immune responses and defense mechanisms (An & Mou, 2011; Irkitbay et al., 2022), was commonly upregulated across all four counties, with p-values ranging from 0.0022* to 0.0113*. This broad upregulation suggests that plants in these regions are facing environmental challenges—both biotic (e.g., pathogen attack) and abiotic (e.g., temperature fluctuations or water scarcity)—that activate the plant’s immune system. The consistent increase of SA plays an essential role in plant responses to stress across diverse environments (Zhao & Li, 2021).
Jasmonic acid (JA), a hormone involved in defense responses and stress adaptation (Wang et al., 2021), exhibited a more varied pattern across the counties. It was significantly upregulated in Kakamega and Vihiga (p = 0* and p = 0.0003*, respectively), indicating its active role in stress or defense pathways in these regions. In Bungoma, JA was also upregulated (p = 0.001), further suggesting an increase in defense mechanisms. However, in Busia, no significant changes in JA were observed (p = 0.1041), which could imply either that JA is not as pivotal in the region’s regulatory processes or that its regulation remains stable under local conditions.
The conjugated form of JA, jasmonic acid-isoleucine (JA-Ile), which is integral to defense signaling (Marquis et al., 2020), was significantly upregulated in Kakamega (p = 0.0022*) and Vihiga (p = 0.0003*), reinforcing the hormone’s role in stress or defense responses in these regions. Although JA-Ile also showed upregulation in Bungoma (p = 0.0257*), no significant change was observed in Busia (p = 0.1212), suggesting a regional disparity in its importance for plant metabolism and stress adaptation (Ma et al., 2023).
Other JA derivatives, such as JA-Met (a methylated form of jasmonic acid) and JA-Phe (a conjugate with phenylalanine) (Per et al., 2018), exhibited significant upregulation in some regions but not in others. JA-Met was notably upregulated in Bungoma (p = 0.0019*), while no significant changes were found in Kakamega, Busia, and Vihiga. In contrast, JA-Phe showed significant upregulation in Kakamega (p = 0.0005*) and Vihiga (p = 0.026*), suggesting its involvement in secondary metabolism and stress responses. These differences further highlight the region-specific role of JA derivatives in plant defense (Zhao and Li, 2021).
The hydroxyjasmonic acid (OH-JA) and its derivative OH-JA-Ile were also significantly upregulated in Bungoma and Vihiga (p-values ranging from 0.0008* to 0.02*), indicating that oxidative stress and defense mechanisms are prominent in these regions. However, Kakamega and Busia did not exhibit significant changes, suggesting that OH-JA and OH-JA-Ile may play a less critical role in these areas’ stress responses (Batsale et al., 2021).
Further analysis revealed significant changes in carboxylated JA forms, such as 12-JA (COOH-JA), and oxylipins like OPDA (Zhao & Li, 2021), which were notably upregulated in Kakamega and Vihiga (p-values ranging from 0.0032* to 0.0007* for COOH-JA, and 0.0173* to 0.0003* for OPDA). These metabolites likely play a role in stress adaptation and metabolic regulation in these regions. In contrast, Bungoma and Busia did not show significant alterations, reinforcing the idea that these regions experience less metabolic reprogramming in response to the biotic stress
Overall, these findings underscore the significant regional variability in the regulation of plant defense hormones, particularly JA and its derivatives, SA, and ABA. The upregulation of these hormones in most counties suggests their pivotal role in stress and defense responses, with local environmental factors such as climate, soil, and water availability likely influencing the extent and nature of hormonal regulation. Kakamega and Vihiga exhibited more consistent upregulation of defense-related hormones, indicating higher stress levels or a greater need for robust defense mechanisms. Conversely, Busia and Bungoma showed more selective responses, possibly due to more stable environmental conditions or different regulatory priorities in these areas. This regional variability highlights the complexity of plant stress responses and the influence of environmental context on hormonal regulation.
Implications and Future Directions
The observed upregulation and downregulation of metabolites across counties indicate the metabolic flexibility of plants in response to different environmental challenges. For instance, the upregulation of monoterpenes may reflect enhanced defense mechanisms triggered by stressors like herbivory or pathogen presence. The downregulation of secondary metabolites like flavonoids and alkaloids may signal a shift away from energy-costly processes in favour of more efficient metabolic pathways.
Geographical differences in metabolite profiles highlight the importance of local environmental factors in shaping plant metabolism. Understanding these variations is crucial for optimizing agricultural practices, enhancing crop resilience, and exploring the potential of specific metabolites for industrial or pharmaceutical applications.
Future Studies Should Focus on
- Investigating the regulation of fatty acid and terpenoid pathways to understand their adaptation to specific biotic stress, while examining the interplay between their biosynthesis to uncover potential shared regulatory mechanisms or precursor molecules involved in their upregulation and downregulation.
- Further research into the specific environmental and ecological factors influencing these hormonal shifts could help improve agricultural practices, particularly in developing region-specific strategies for enhancing plant resilience to stress.
Conclusion
This study provides an in-depth analysis of the metabolic and phytohormonal responses of common bean plants under biotic stress conditions, emphasizing both the complexity of metabolic networks and the regional variations in plant responses. By identifying 354 metabolites across seven metabolic pathways, the study reveals significant shifts in plant metabolic processes, with notable regional differences in the regulation of metabolites and phytohormones.
References
- Abdelgaleil, S.A.M.; Gad, H.A.; Ramadan, G.R.; El-Bakry, A.M.; El-Sabrout, A.M. Monoterpenes: Chemistry, insecticidal activity against stored product insects and modes of action—A review. International Journal of Pest Management 2024, 70, 267–289. [Google Scholar] [CrossRef]
- Abobatta, W.F.; El-Hashash, E.F.; Hegab, R.H. Challenges and opportunities for the global cultivation and adaption of legumes. J Appl Biotechnol Bioeng 2021, 8, 160–172. [Google Scholar]
- An, C.; Mou, Z. Salicylic acid and its function in plant immunity F. Journal of Integrative Plant Biology 2011, 53, 412–428. [Google Scholar] [CrossRef] [PubMed]
- Batsale, M.; Bahammou, D.; Fouillen, L.; Mongrand, S.; Joubès, J.; Domergue, F. Biosynthesis and functions of very-long-chain fatty acids in the responses of plants to abiotic and biotic stresses. Cells 2021, 10, 1284. [Google Scholar] [CrossRef]
- Battezzati, A.; Riso, P. (2002). Amino acids: Fuel, building blocks for proteins, and signals. In Nutrition (Vol. 18, Issue 9, pp. 773–774). Elsevier.
- Bhat, A.I.; Rao, G.P.; Bhat, A.I.; Rao, G.P. (2020). Mechanical Sap Transmission.
- Böcker, S.; Letzel, M.C.; Lipták, Z.; Pervukhin, A. SIRIUS: decomposing isotope patterns for metabolite identification. Bioinformatics 2009, 25, 218–224. [Google Scholar] [CrossRef]
- Brosnan, J.; Rooyackers, O. The importance of amino acids as independent metabolites, signalling molecules and as building blocks for protein. Current Opinion in Clinical Nutrition & Metabolic Care 2012, 15, 47–48. [Google Scholar]
- Castro-Moretti, F.R.; Gentzel, I.N.; Mackey, D.; Alonso, A.P. Metabolomics as an emerging tool for the study of plant–pathogen interactions. Metabolites 2020, 10, 52. [Google Scholar] [CrossRef]
- Di Carli, M.; Benvenuto, E.; Donini, M. Recent insights into plant–virus interactions through proteomic analysis. Journal of Proteome Research 2012, 11, 4765–4780. [Google Scholar] [CrossRef]
- Dwivedi, A.K.; Singh, V.; Anwar, K.; Pareek, A.; Jain, M. Integrated transcriptome, proteome and metabolome analyses revealed secondary metabolites and auxiliary carbohydrate metabolism augmenting drought tolerance in rice. Plant Physiology and Biochemistry 2023, 201, 107849. [Google Scholar] [CrossRef]
- Farrow, A.; Muthoni Andriatsitohaina, R. (2020). Atlas of common bean production in Africa. CIAT Publication.
- González-Bosch, C.; Boorman, E.; Zunszain, P.A.; Mann, G.E. Short-chain fatty acids as modulators of redox signaling in health and disease. Redox Biology 2021, 47, 102165. [Google Scholar] [CrossRef]
- Heyer, M.; Reichelt, M.; Mithöfer, A. A holistic approach to analyze systemic jasmonate accumulation in individual leaves of Arabidopsis rosettes upon wounding. Frontiers in Plant Science 2018, 9, 1569. [Google Scholar] [CrossRef] [PubMed]
- Irkitbay, А.; Madenova, A.K.; Sapakhova, Z.B. The role of salicylic acid in the plant defense mechanism. BULLETIN of the LN Gumilyov Eurasian National University. BIOSCIENCE Series 2022, 140, 83–96. [Google Scholar] [CrossRef]
- Khan, A.; Ali, S.; Khan, M.; Hamayun, M.; Moon, Y.-S. Parthenium hysterophorus’s endophytes: The second layer of defense against biotic and abiotic stresses. Microorganisms 2022, 10, 2217. [Google Scholar] [CrossRef] [PubMed]
- Kumar, R.; Bohra, A.; Pandey, A.K.; Pandey, M.K.; Kumar, A. Metabolomics for plant improvement: Status and prospects. Frontiers in Plant Science 2017, 8, 1302. [Google Scholar] [CrossRef] [PubMed]
- Li, C.; Zha, W.; Li, W.; Wang, J.; You, A. Advances in the biosynthesis of terpenoids and their ecological functions in plant resistance. International Journal of Molecular Sciences 2023, 24, 11561. [Google Scholar] [CrossRef]
- Lisciani, S.; Marconi, S.; Le Donne, C.; Camilli, E.; Aguzzi, A.; Gabrielli, P.; Gambelli, L.; Kunert, K.; Marais, D.; Vorster, B.J. Legumes and common beans in sustainable diets: Nutritional quality, environmental benefits, spread and use in food preparations. Frontiers in Nutrition 2024, 11, 1385232. [Google Scholar] [CrossRef]
- Liu, J.; Liu, J.; Zhang, P.; Wang, Q.; Li, L.; Xie, H.; Li, H.; Wang, H.; Cheng, S.; Qin, P. Elucidating the Differentiation Synthesis Mechanisms of Differently Colored Resistance Quinoa Seedings Using Metabolite Profiling and Transcriptome Analysis. Metabolites 2023, 13, 1065. [Google Scholar] [CrossRef]
- Ludwig, M.; Fleischauer, M.; Dührkop, K.; Hoffmann, M.A.; Böcker, S. De novo molecular formula annotation and structure elucidation using SIRIUS 4. Computational Methods and Data Analysis for Metabolomics 2020, 185–207. [Google Scholar]
- Ma, X.; Yu, X.; Cui, G.; Guo, Z.; Lang, D.; Zhang, X. Methyl jasmonate mitigates osmotic stress by regulating carbon and nitrogen metabolism of Glycyrrhiza uralensis seedlings subjected to salt stress. Acta Physiologiae Plantarum 2023, 45, 96. [Google Scholar] [CrossRef]
- Maia, M.; Ferreira, A.E.; Nascimento, R.; Monteiro, F.; Traquete, F.; Marques, A.P.; Cunha, J.; Eiras-Dias, J.E.; Cordeiro, C.; Figueiredo, A. Integrating metabolomics and targeted gene expression to uncover potential biomarkers of fungal/oomycetes-associated disease susceptibility in grapevine. Scientific Reports 2020, 10, 15688. [Google Scholar] [CrossRef]
- Manchester, M.; Anand, A. Metabolomics: Strategies to define the role of metabolism in virus infection and pathogenesis. Advances in Virus Research 2017, 98, 57–81. [Google Scholar] [PubMed]
- Marquis, V.; Smirnova, E.; Poirier, L.; Zumsteg, J.; Schweizer, F.; Reymond, P.; Heitz, T. Stress- and pathway-specific impacts of impaired jasmonoyl-isoleucine (JA-Ile) catabolism on defense signalling and biotic stress resistance. Plant, Cell & Environment 2020, 43, 1558–1570. [Google Scholar] [CrossRef]
- Muhammad Aslam, M.; Waseem, M.; Jakada, B.H.; Okal, E.J.; Lei, Z.; Saqib HS, A.; Yuan, W.; Xu, W.; Zhang, Q. Mechanisms of abscisic acid-mediated drought stress responses in plants. International Journal of Molecular Sciences 2022, 23, 1084. [Google Scholar] [CrossRef] [PubMed]
- Nguyen, H. (2018). Bacterial and viral diseases affecting soybean production Glen L. Hartman, USDA-ARS and University of Illinois, USA. In Achieving sustainable cultivation of soybeans Volume 2 (pp. 43–62). Burleigh Dodds Science Publishing.
- Ojiem, J.O. (2018). Improving cultivation practices for common beans. In Achieving sustainable cultivation of grain legumes Volume 2 (pp. 41–72). Burleigh Dodds Science Publishing.
- Per, T.S.; Khan MI, R.; Anjum, N.A.; Masood, A.; Hussain, S.J.; Khan, N.A. Jasmonates in plants under abiotic stresses: Crosstalk with other phytohormones matters. Environmental and Experimental Botany 2018, 145, 104–120. [Google Scholar] [CrossRef]
- Pigolev, A.V.; Degtyaryov, E.A.; Miroshnichenko, D.N.; Savchenko, T.V. Prospects for the application of jasmonates, salicylates, and abscisic acid in agriculture to increase plant stress resistance. Sel’skokhozyaistvennaya Biologiya 2023, 58, 3–22. [Google Scholar] [CrossRef]
- Purdy, J.G. Pathways to understanding virus-host metabolism interactions. Current Clinical Microbiology Reports 2019, 6, 34–43. [Google Scholar] [CrossRef]
- Qasim, M.; Islam, W.; Rizwan, M.; Hussain, D.; Noman, A.; Khan, K.A.; Ghramh, H.A.; Han, X. Impact of plant monoterpenes on insect pest management and insect-associated microbes. Heliyon 2024, 10. [Google Scholar] [CrossRef]
- Ramabulana, A.-T.; Petras, D.; Madala, N.E.; Tugizimana, F. Metabolomics and molecular networking to characterize the chemical space of four Momordica plant species. Metabolites 2021, 11, 763. [Google Scholar] [CrossRef]
- Rehan, M. (2021). Biosynthesis of diverse class flavonoids via shikimate and phenylpropanoid pathway. Bioactive Compounds-Biosynthesis, Characterization and Applications.
- Satrio, R.D.; Fendiyanto, M.H.; Miftahudin, M. (2024). Tools and Techniques Used at Global Scale Through Genomics, Transcriptomics, Proteomics, and Metabolomics to Investigate Plant Stress Responses at the Molecular Level. In Molecular Dynamics of Plant Stress and its Management (pp. 555–607). Springer.
- Sharma, V.; Gupta, P.; Kagolla, P.; Hangargi, B.; Veershetty, A.; Ramrao, D.P.; Suresh, S.; Narasanna, R.; Naik, G.R.; Kumar, A. Metabolomics intervention towards better understanding of plant traits. Cells 2021, 10, 346. [Google Scholar] [CrossRef]
- Shi, S.-H.; Lee, S.-S.; Zhu, Y.-M.; Jin, Z.-Q.; Wu, F.-B.; Qiu, C.-W. Comparative Metabolomic Profiling Reveals Key Secondary Metabolites Associated with High Quality and Nutritional Value in Broad Bean (Vicia faba L.). Molecules 2022, 27, 8995. [Google Scholar] [CrossRef]
- Singh, D.P.; Bisen, M.S.; Shukla, R.; Prabha, R.; Maurya, S.; Reddy, Y.S.; Singh, P.M.; Rai, N.; Chaubey, T.; Chaturvedi, K.K. Metabolomics-driven mining of metabolite resources: Applications and prospects for improving vegetable crops. International Journal of Molecular Sciences 2022, 23, 12062. [Google Scholar] [CrossRef] [PubMed]
- Singh, H.S.; Lamani, K. Chapter-14 Bean Common Mosaic Necrosis Virus. Viral Diseases of Vegetable & Fruit Crops 2024, 33, 191. [Google Scholar]
- Sun, Y.; Wang, M.; Mur LA, J.; Shen, Q.; Guo, S. Unravelling the roles of nitrogen nutrition in plant disease defences. International Journal of Molecular Sciences 2020, 21, 572. [Google Scholar] [CrossRef] [PubMed]
- Vo KT, X.; Rahman, M.M.; Rahman, M.M.; Trinh KT, T.; Kim, S.T.; Jeon, J.-S. (2021). Proteomics and metabolomics studies on the biotic stress responses of rice: An update. Rice.
- Wang, Y.; Mostafa, S.; Zeng, W.; Jin, B. Function and mechanism of jasmonic acid in plant responses to abiotic and biotic stresses. International Journal of Molecular Sciences 2021, 22, 8568. [Google Scholar] [CrossRef]
- Zhao, S.; Li, Y. Current understanding of the interplays between host hormones and plant viral infections. PLoS Pathogens 2021, 17, e1009242. [Google Scholar] [CrossRef]
Figure 1.
Common bean (Rosecoco cultivar) plants infected with BCMV and BCMNV viruses, growing in experimental fields at different sites: (A) Sirende (Bungoma), (B) Musasa (Vihiga), (C) Sichilayi (Kakamega), and (D) Butula (Busia). (E) Control plants of Rosecoco beans not infected with BCMV or BCMNV.
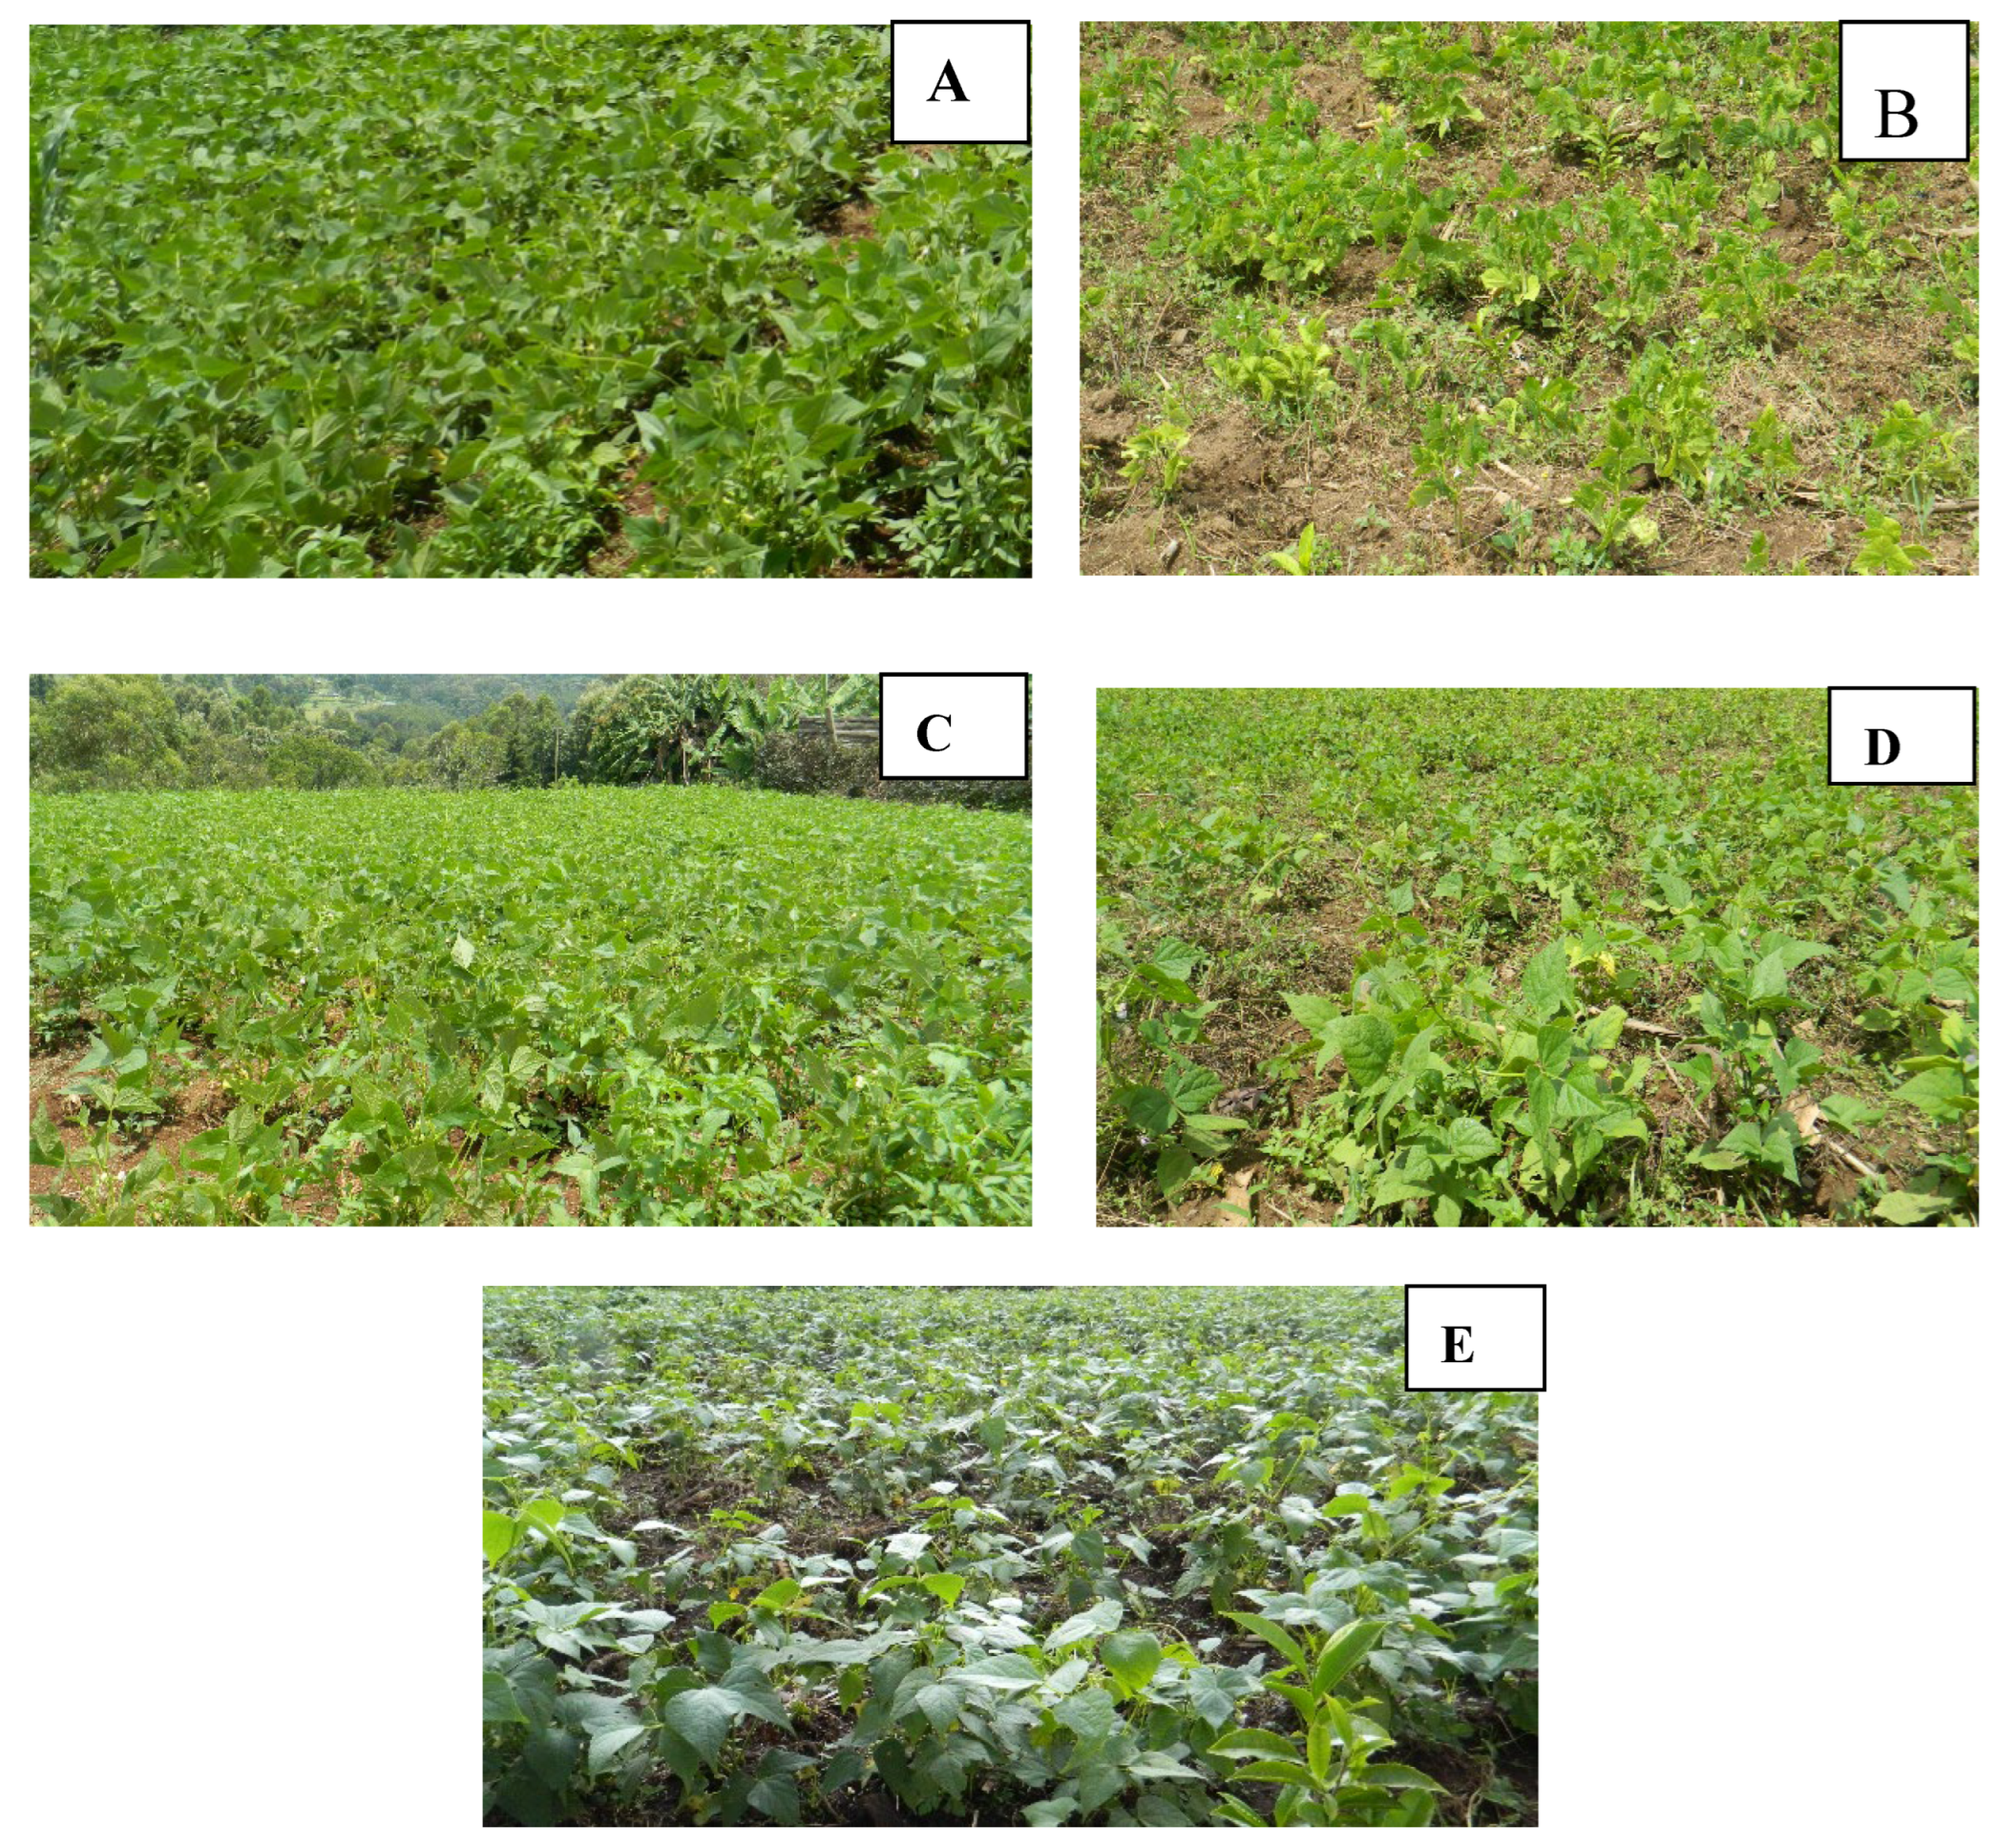
Figure 2.
Displays the upregulated and downregulated pathways, along with pathway enrichment, on the Y-axis, and the four counties studied on the X-axis.
Figure 2.
Displays the upregulated and downregulated pathways, along with pathway enrichment, on the Y-axis, and the four counties studied on the X-axis.
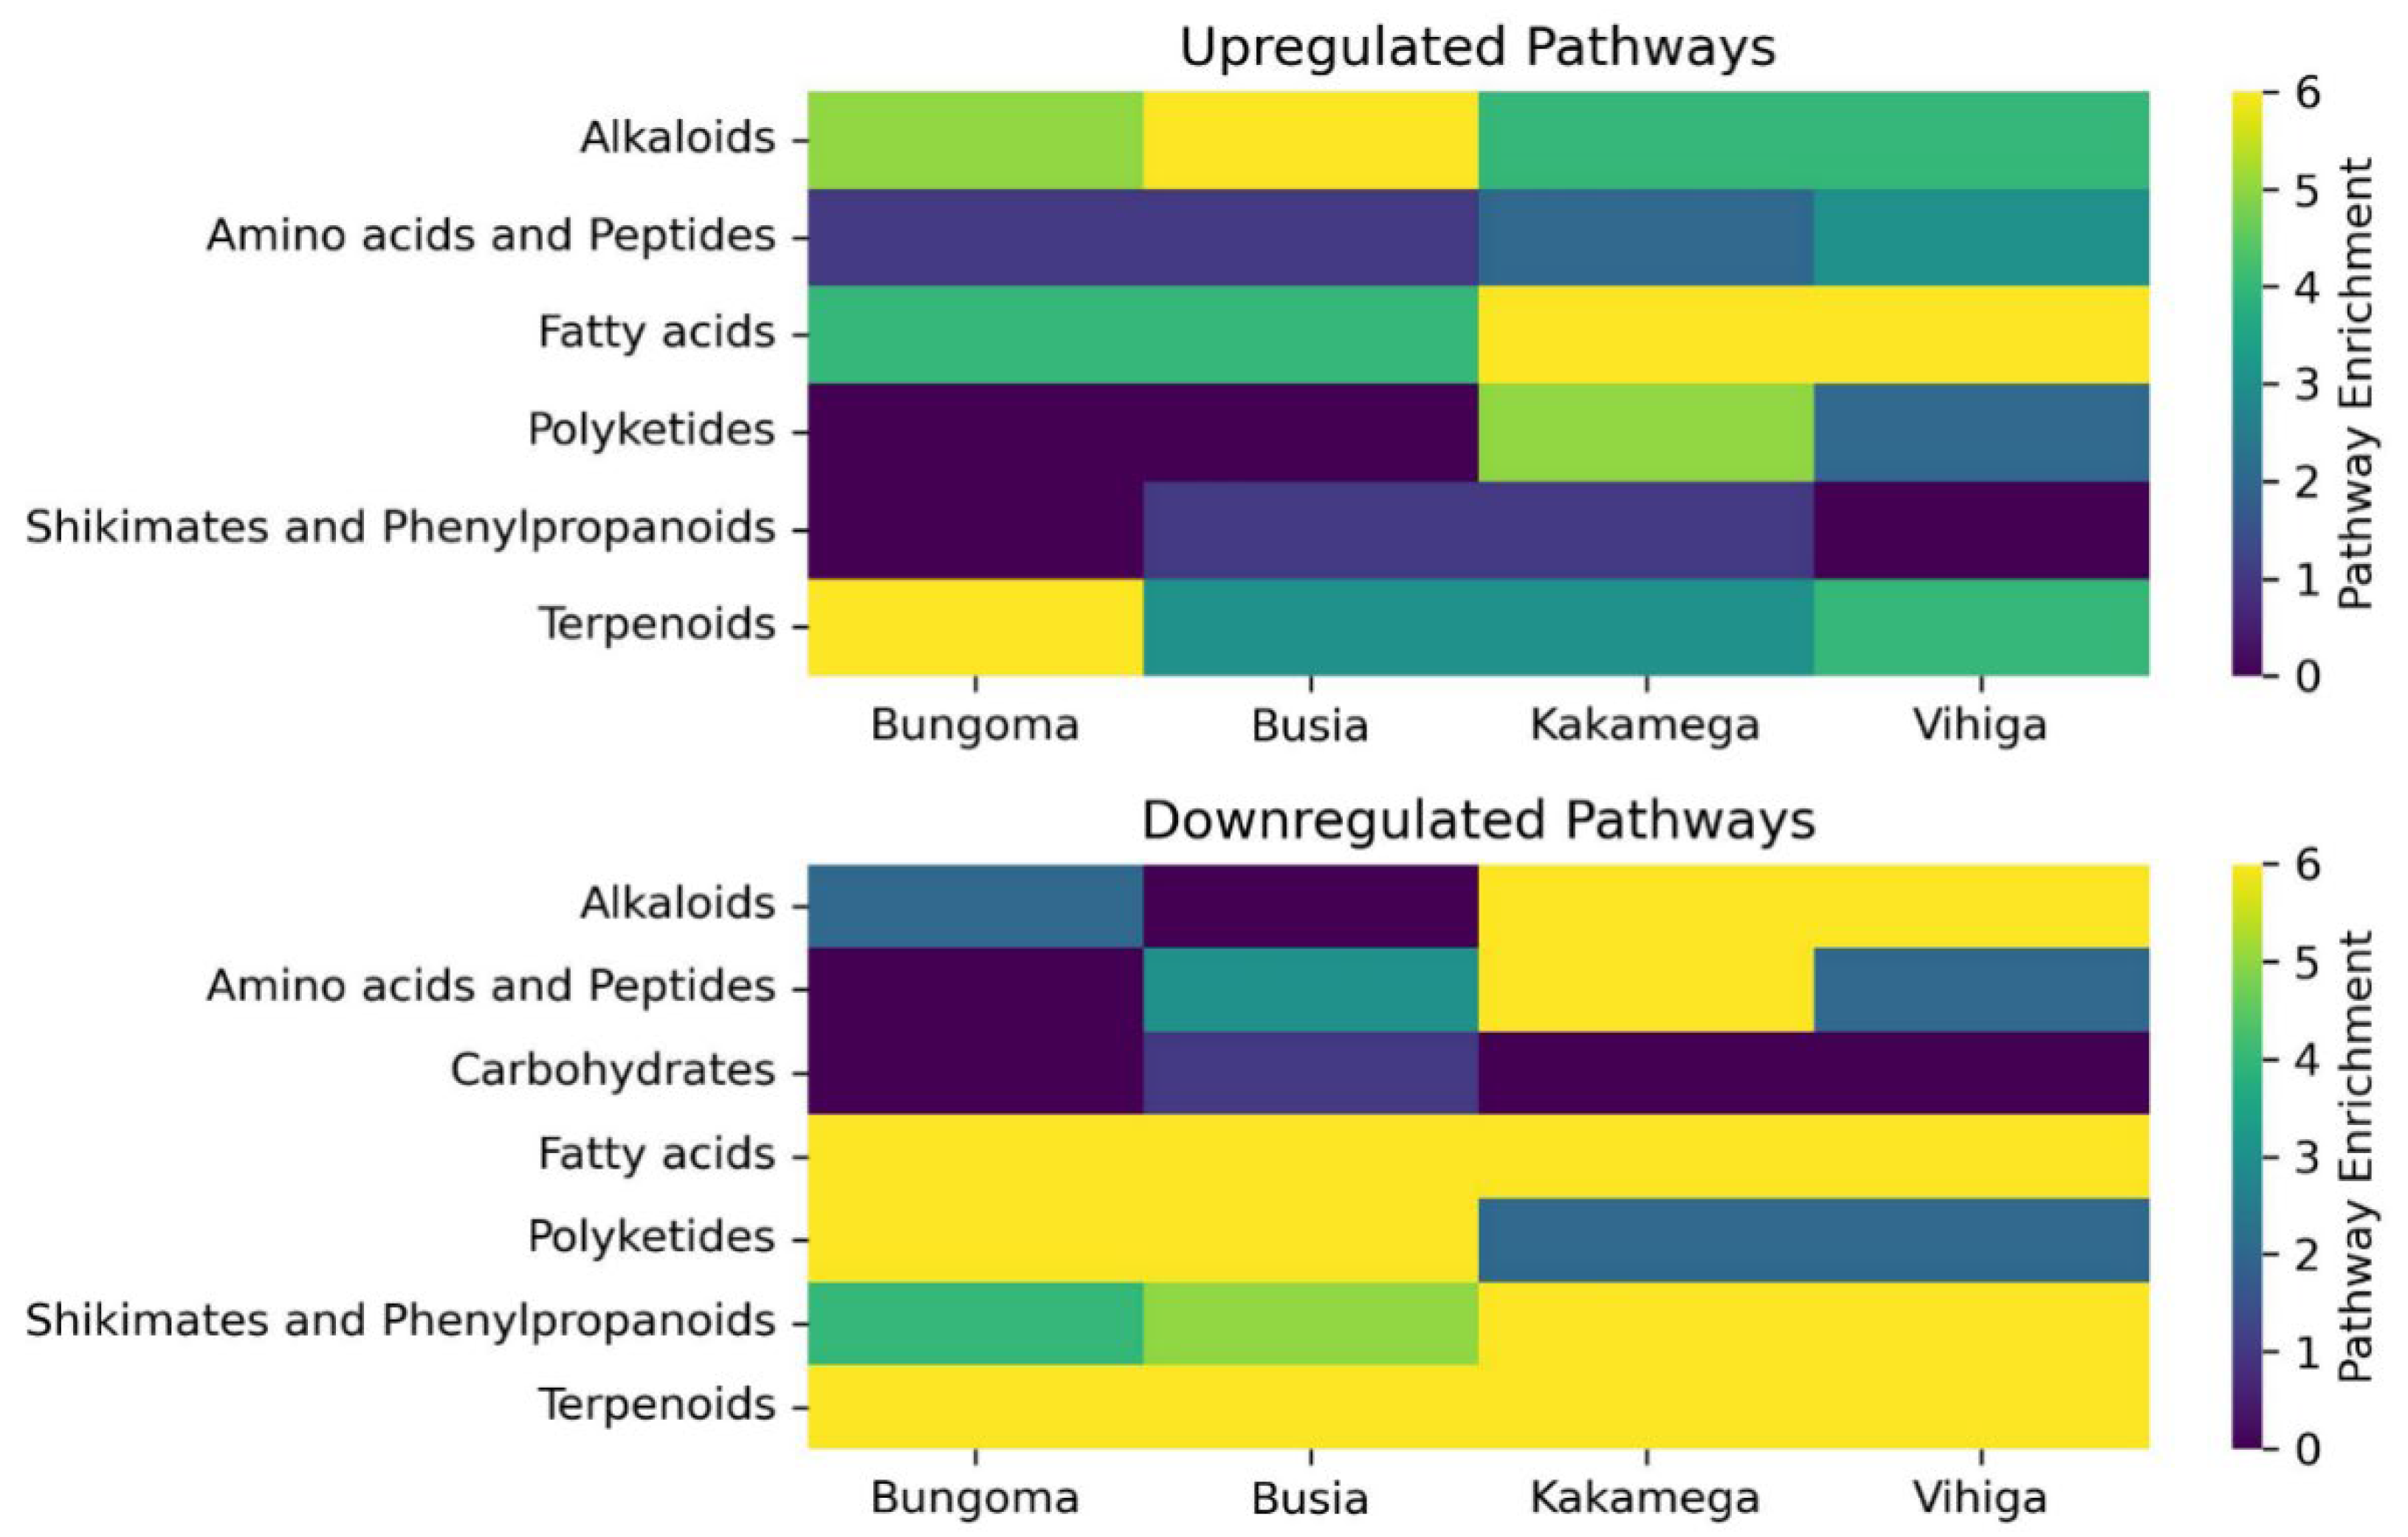
Figure 3.
A displays upregulated metabolites on the Y-axis, with the corresponding concentrations and sample localities on the X-axis. B shows downregulated metabolites on the Y-axis, along with their concentrations and sample localities on the X-axis
Figure 3.
A displays upregulated metabolites on the Y-axis, with the corresponding concentrations and sample localities on the X-axis. B shows downregulated metabolites on the Y-axis, along with their concentrations and sample localities on the X-axis
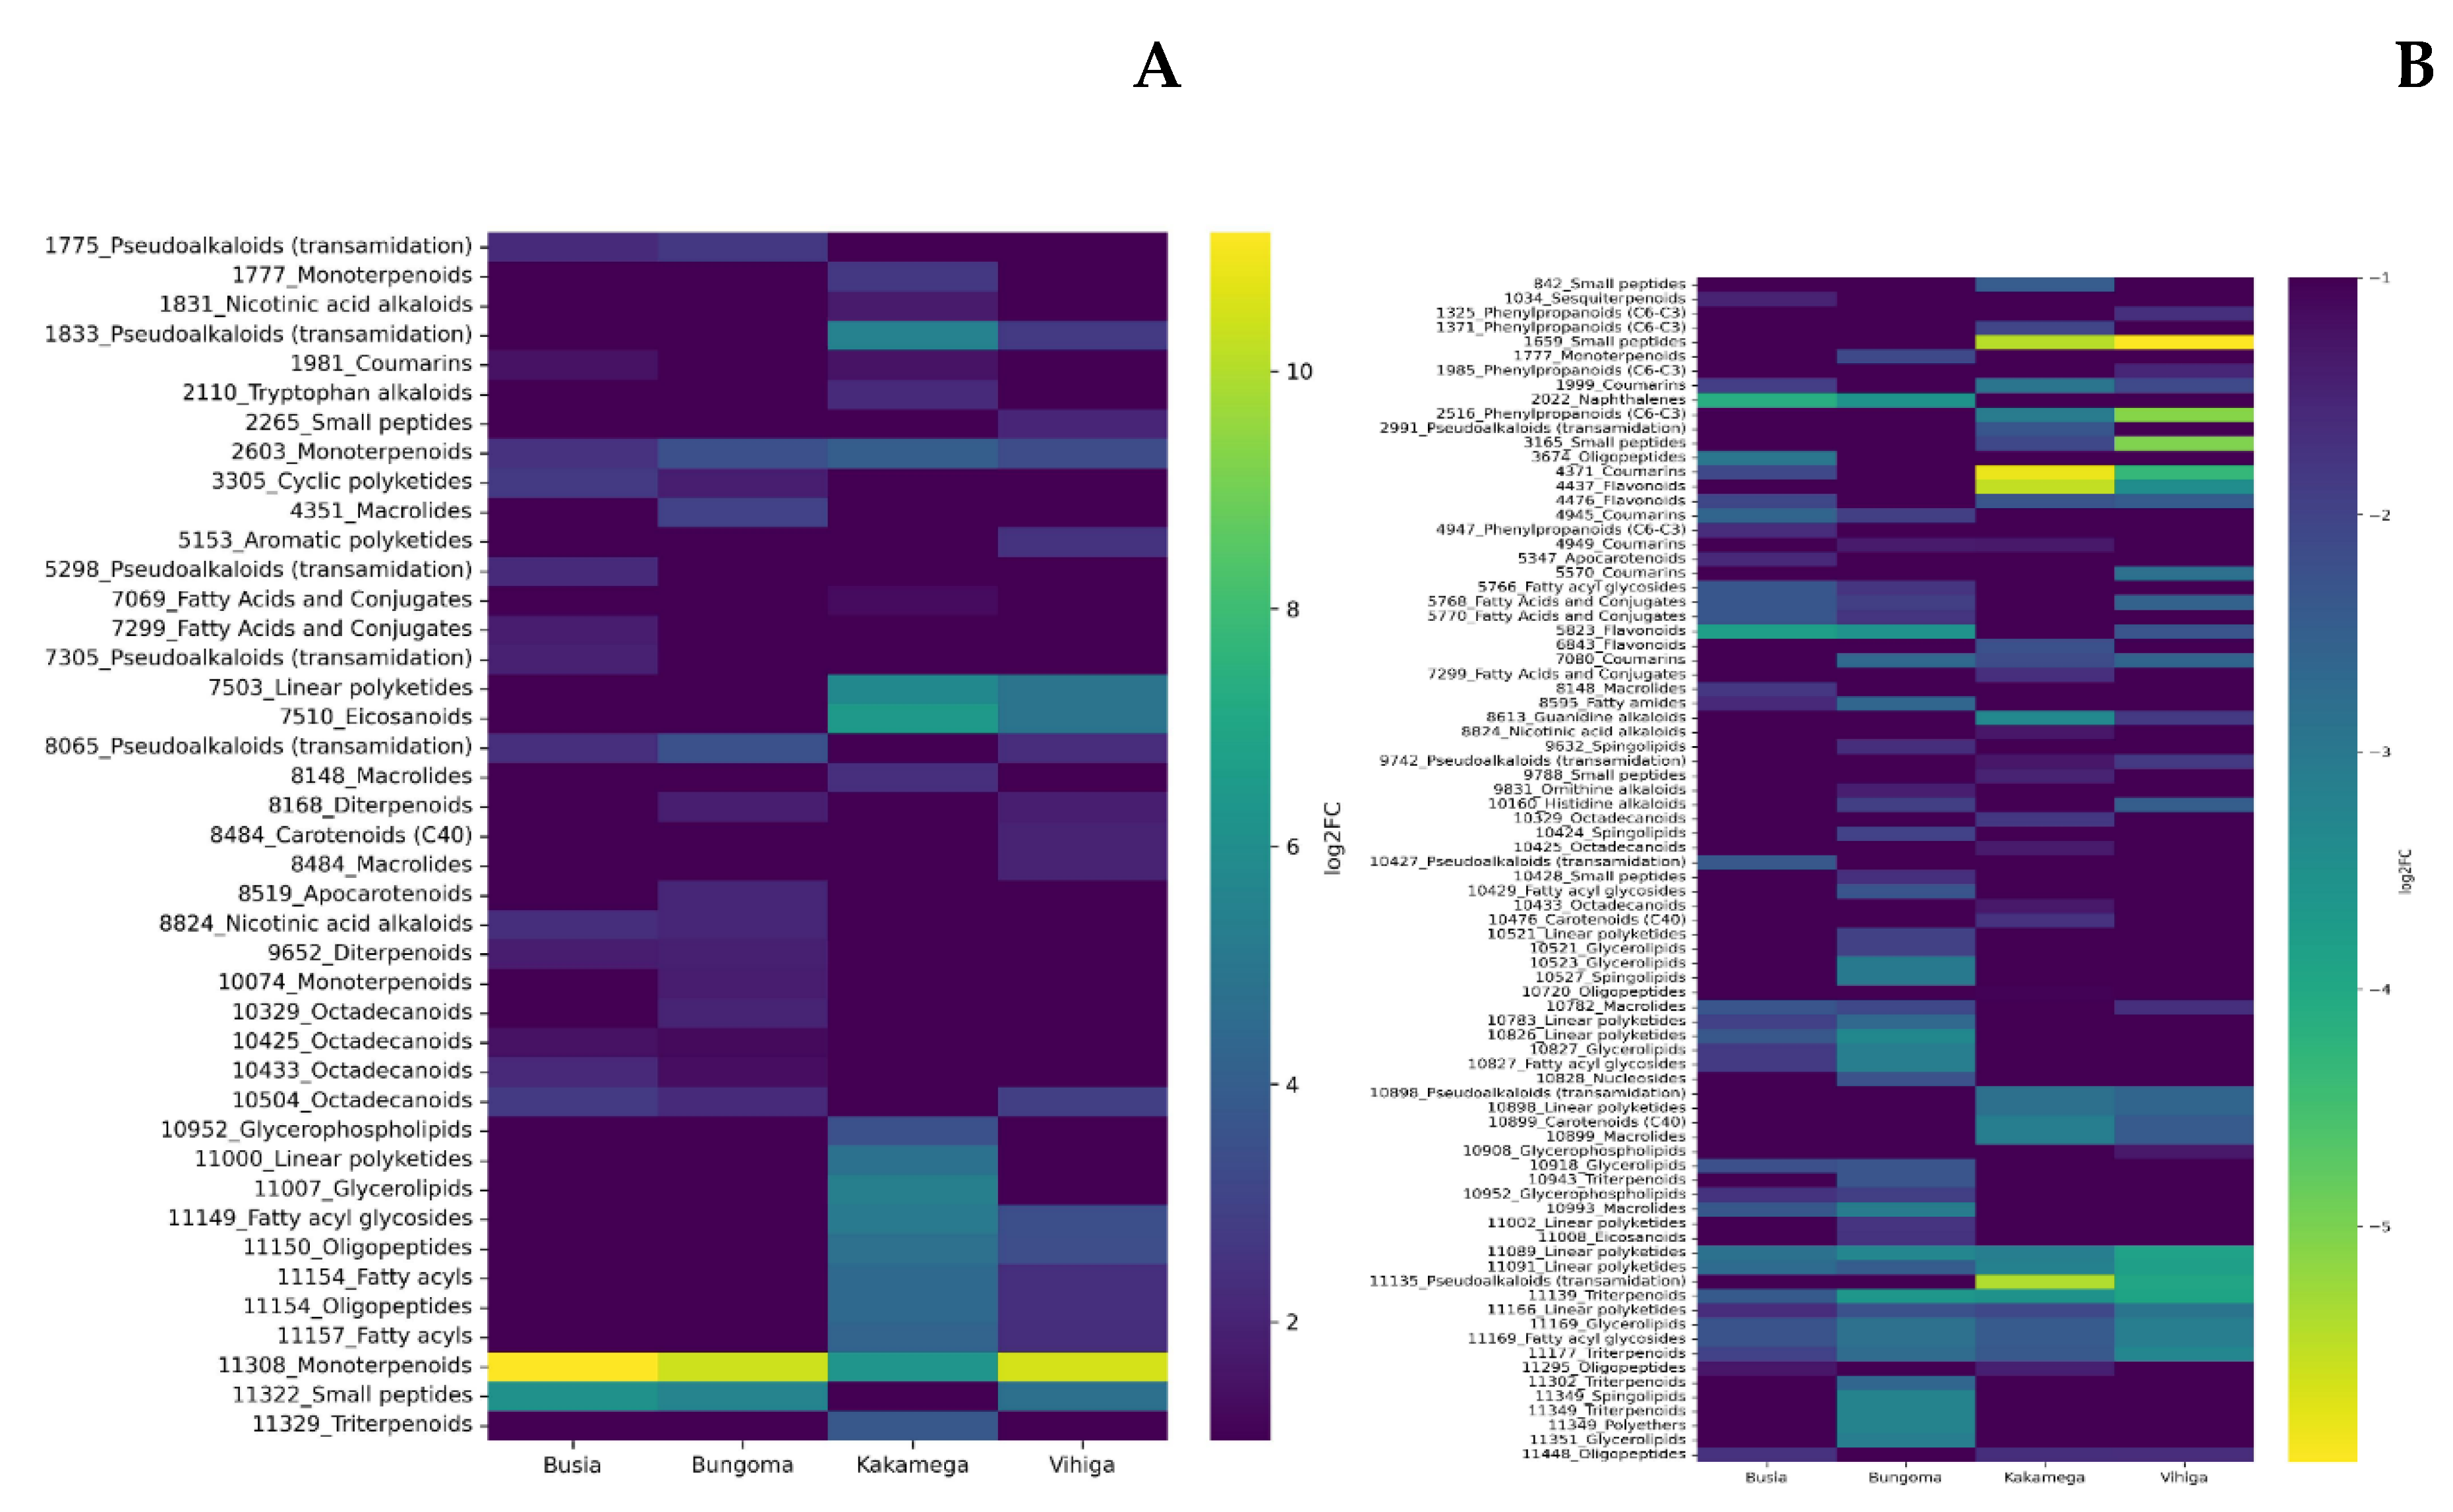
Figure 4.
Volcano plots displaying the following: A) Upregulated metabolites in red and downregulated metabolites in blue for Kakamega samples, B) Upregulated metabolites in red and downregulated metabolites in blue for Bungoma samples, C) Upregulated metabolites in red and downregulated metabolites in blue for Busia samples, and D) Upregulated metabolites in red and downregulated metabolites in blue for Vihiga samples.
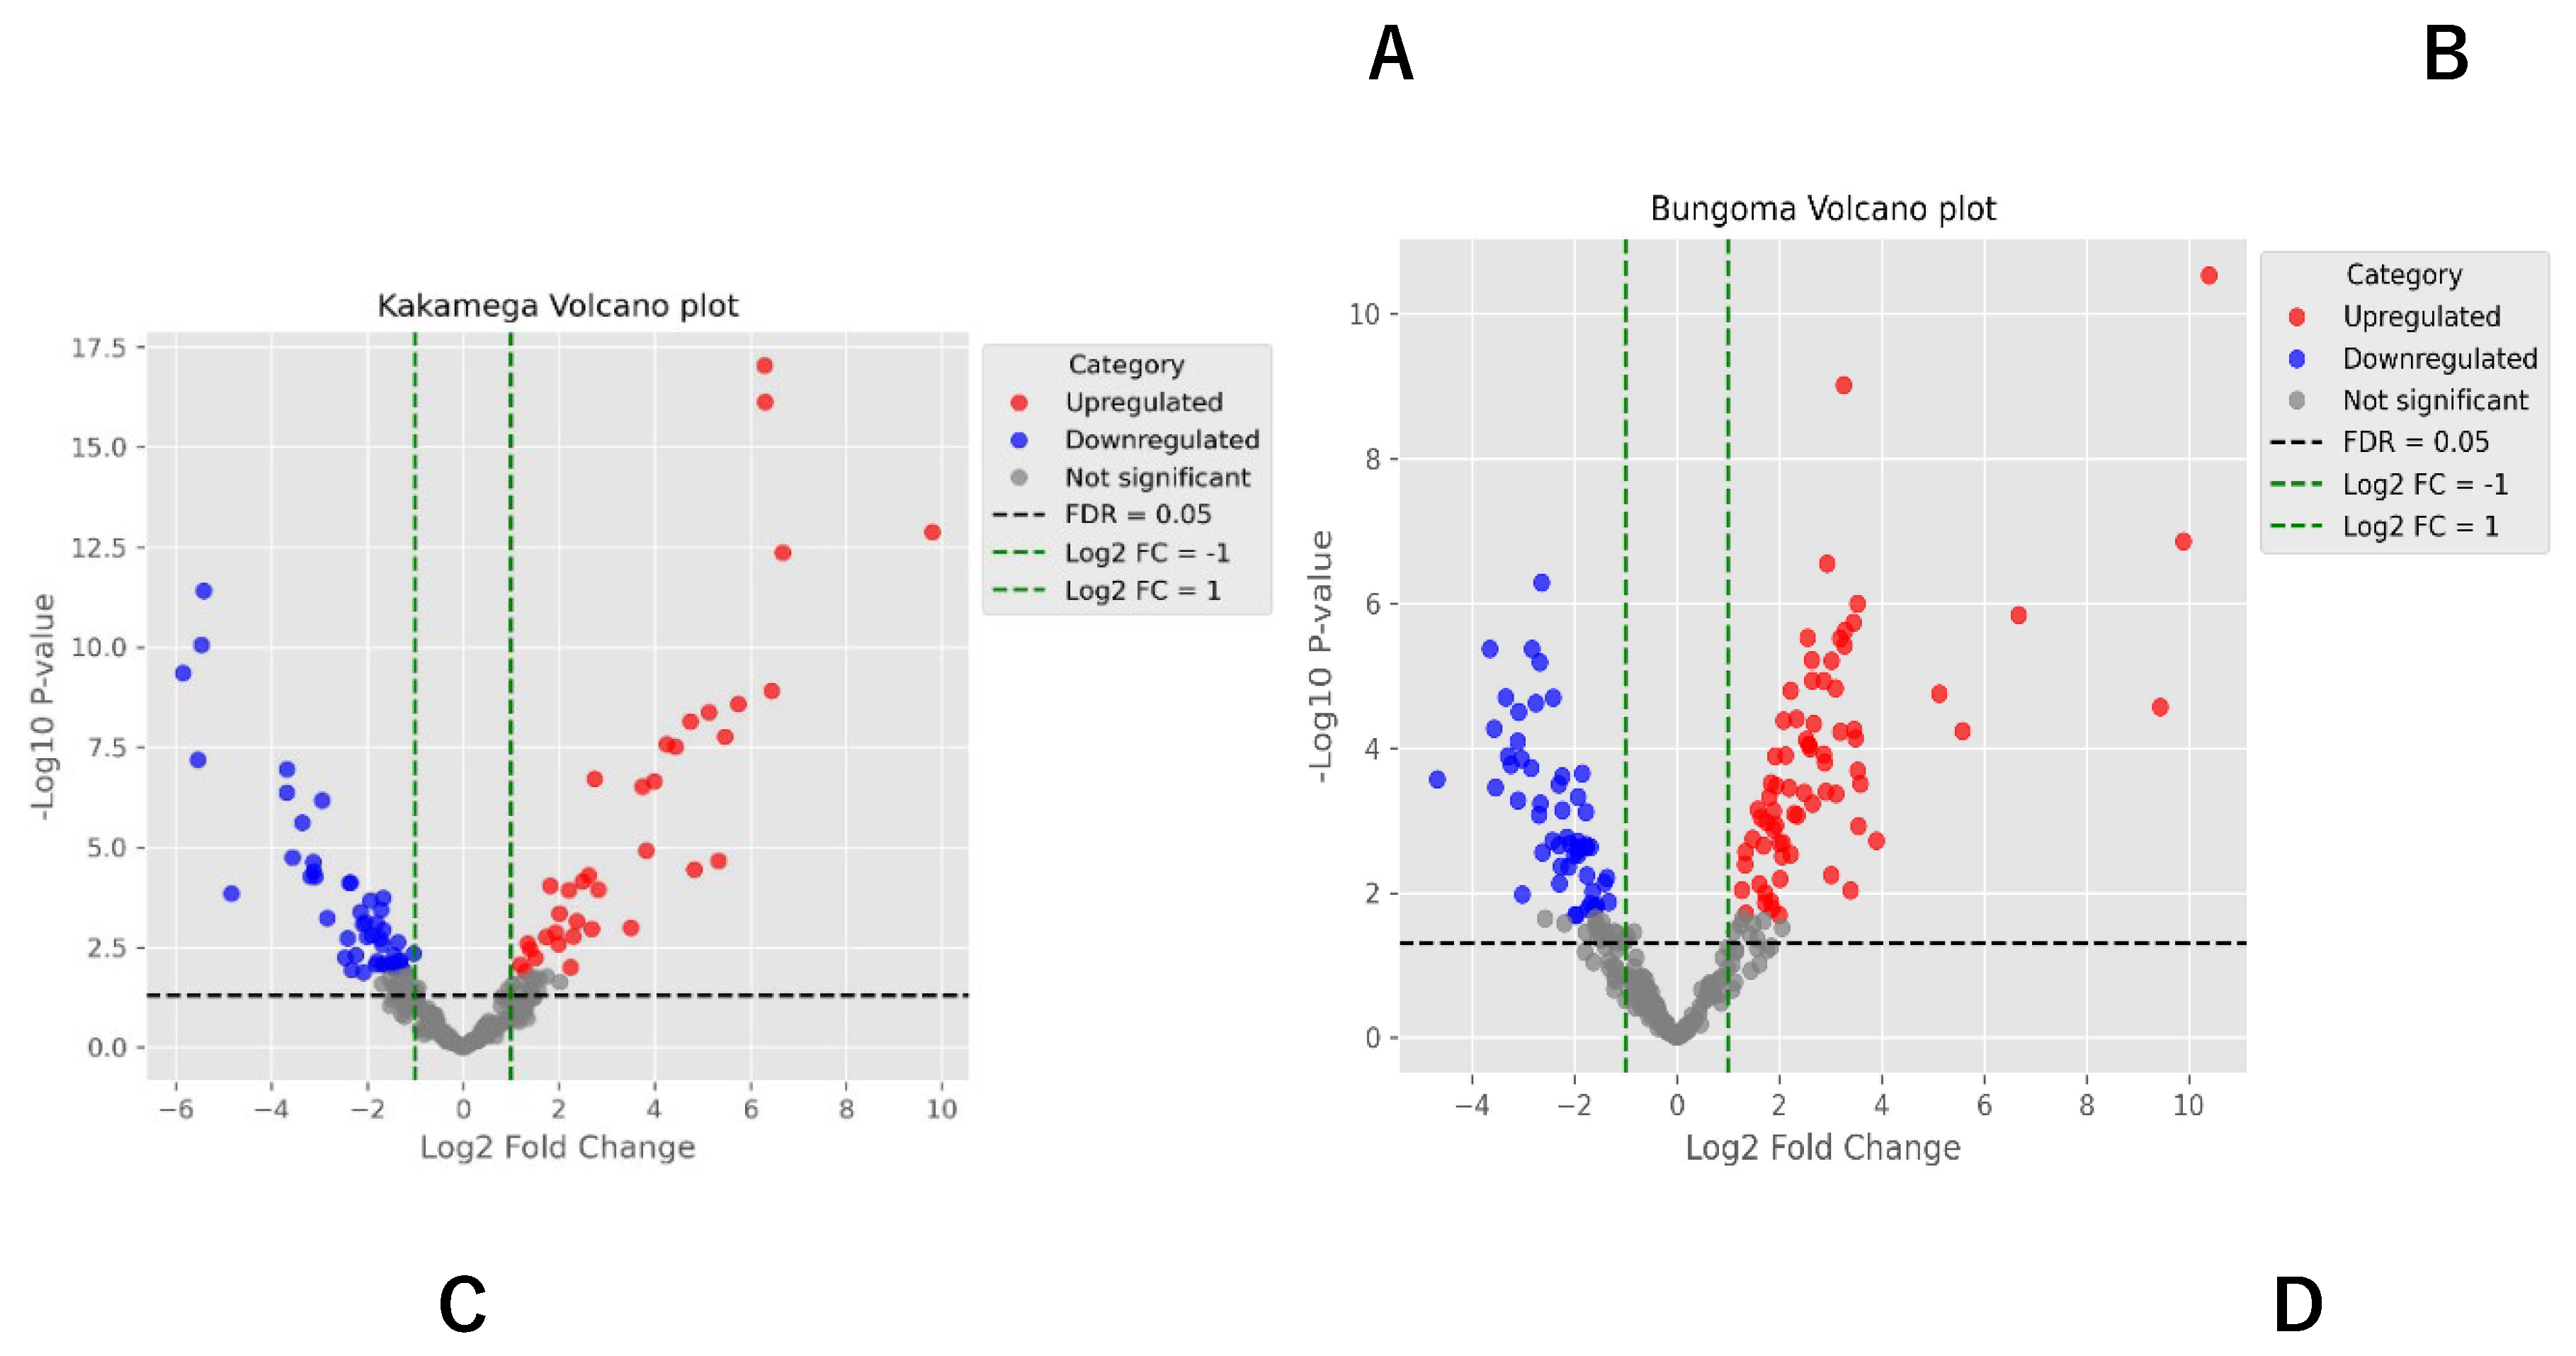
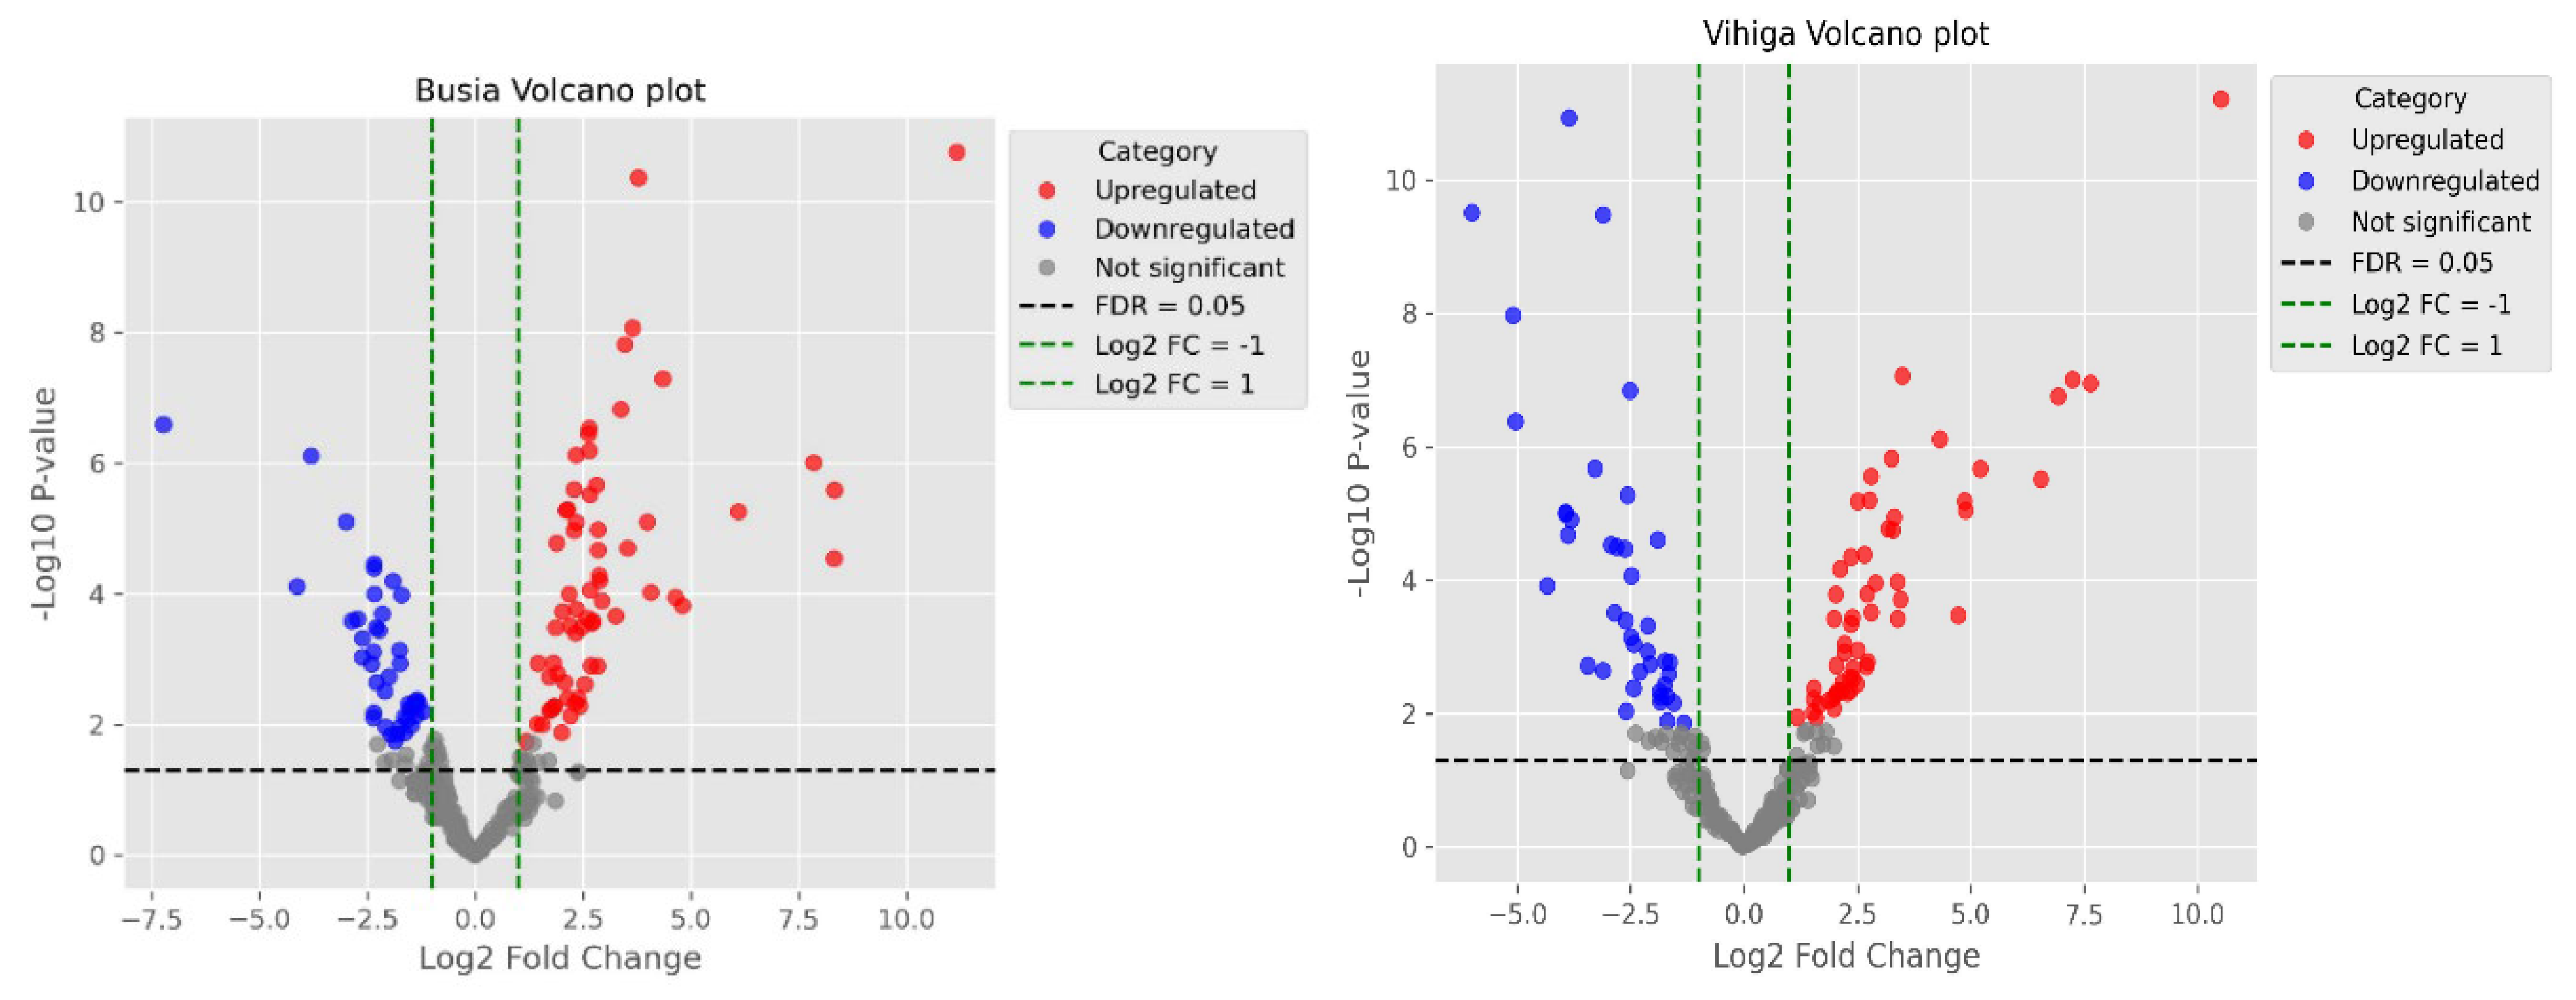
Figure 5.
Venn diagrams illustrating A) Upregulated differentially expressed metabolites across samples from different counties, and B) Downregulated differentially expressed metabolites from various counties within the Western region.
Figure 5.
Venn diagrams illustrating A) Upregulated differentially expressed metabolites across samples from different counties, and B) Downregulated differentially expressed metabolites from various counties within the Western region.
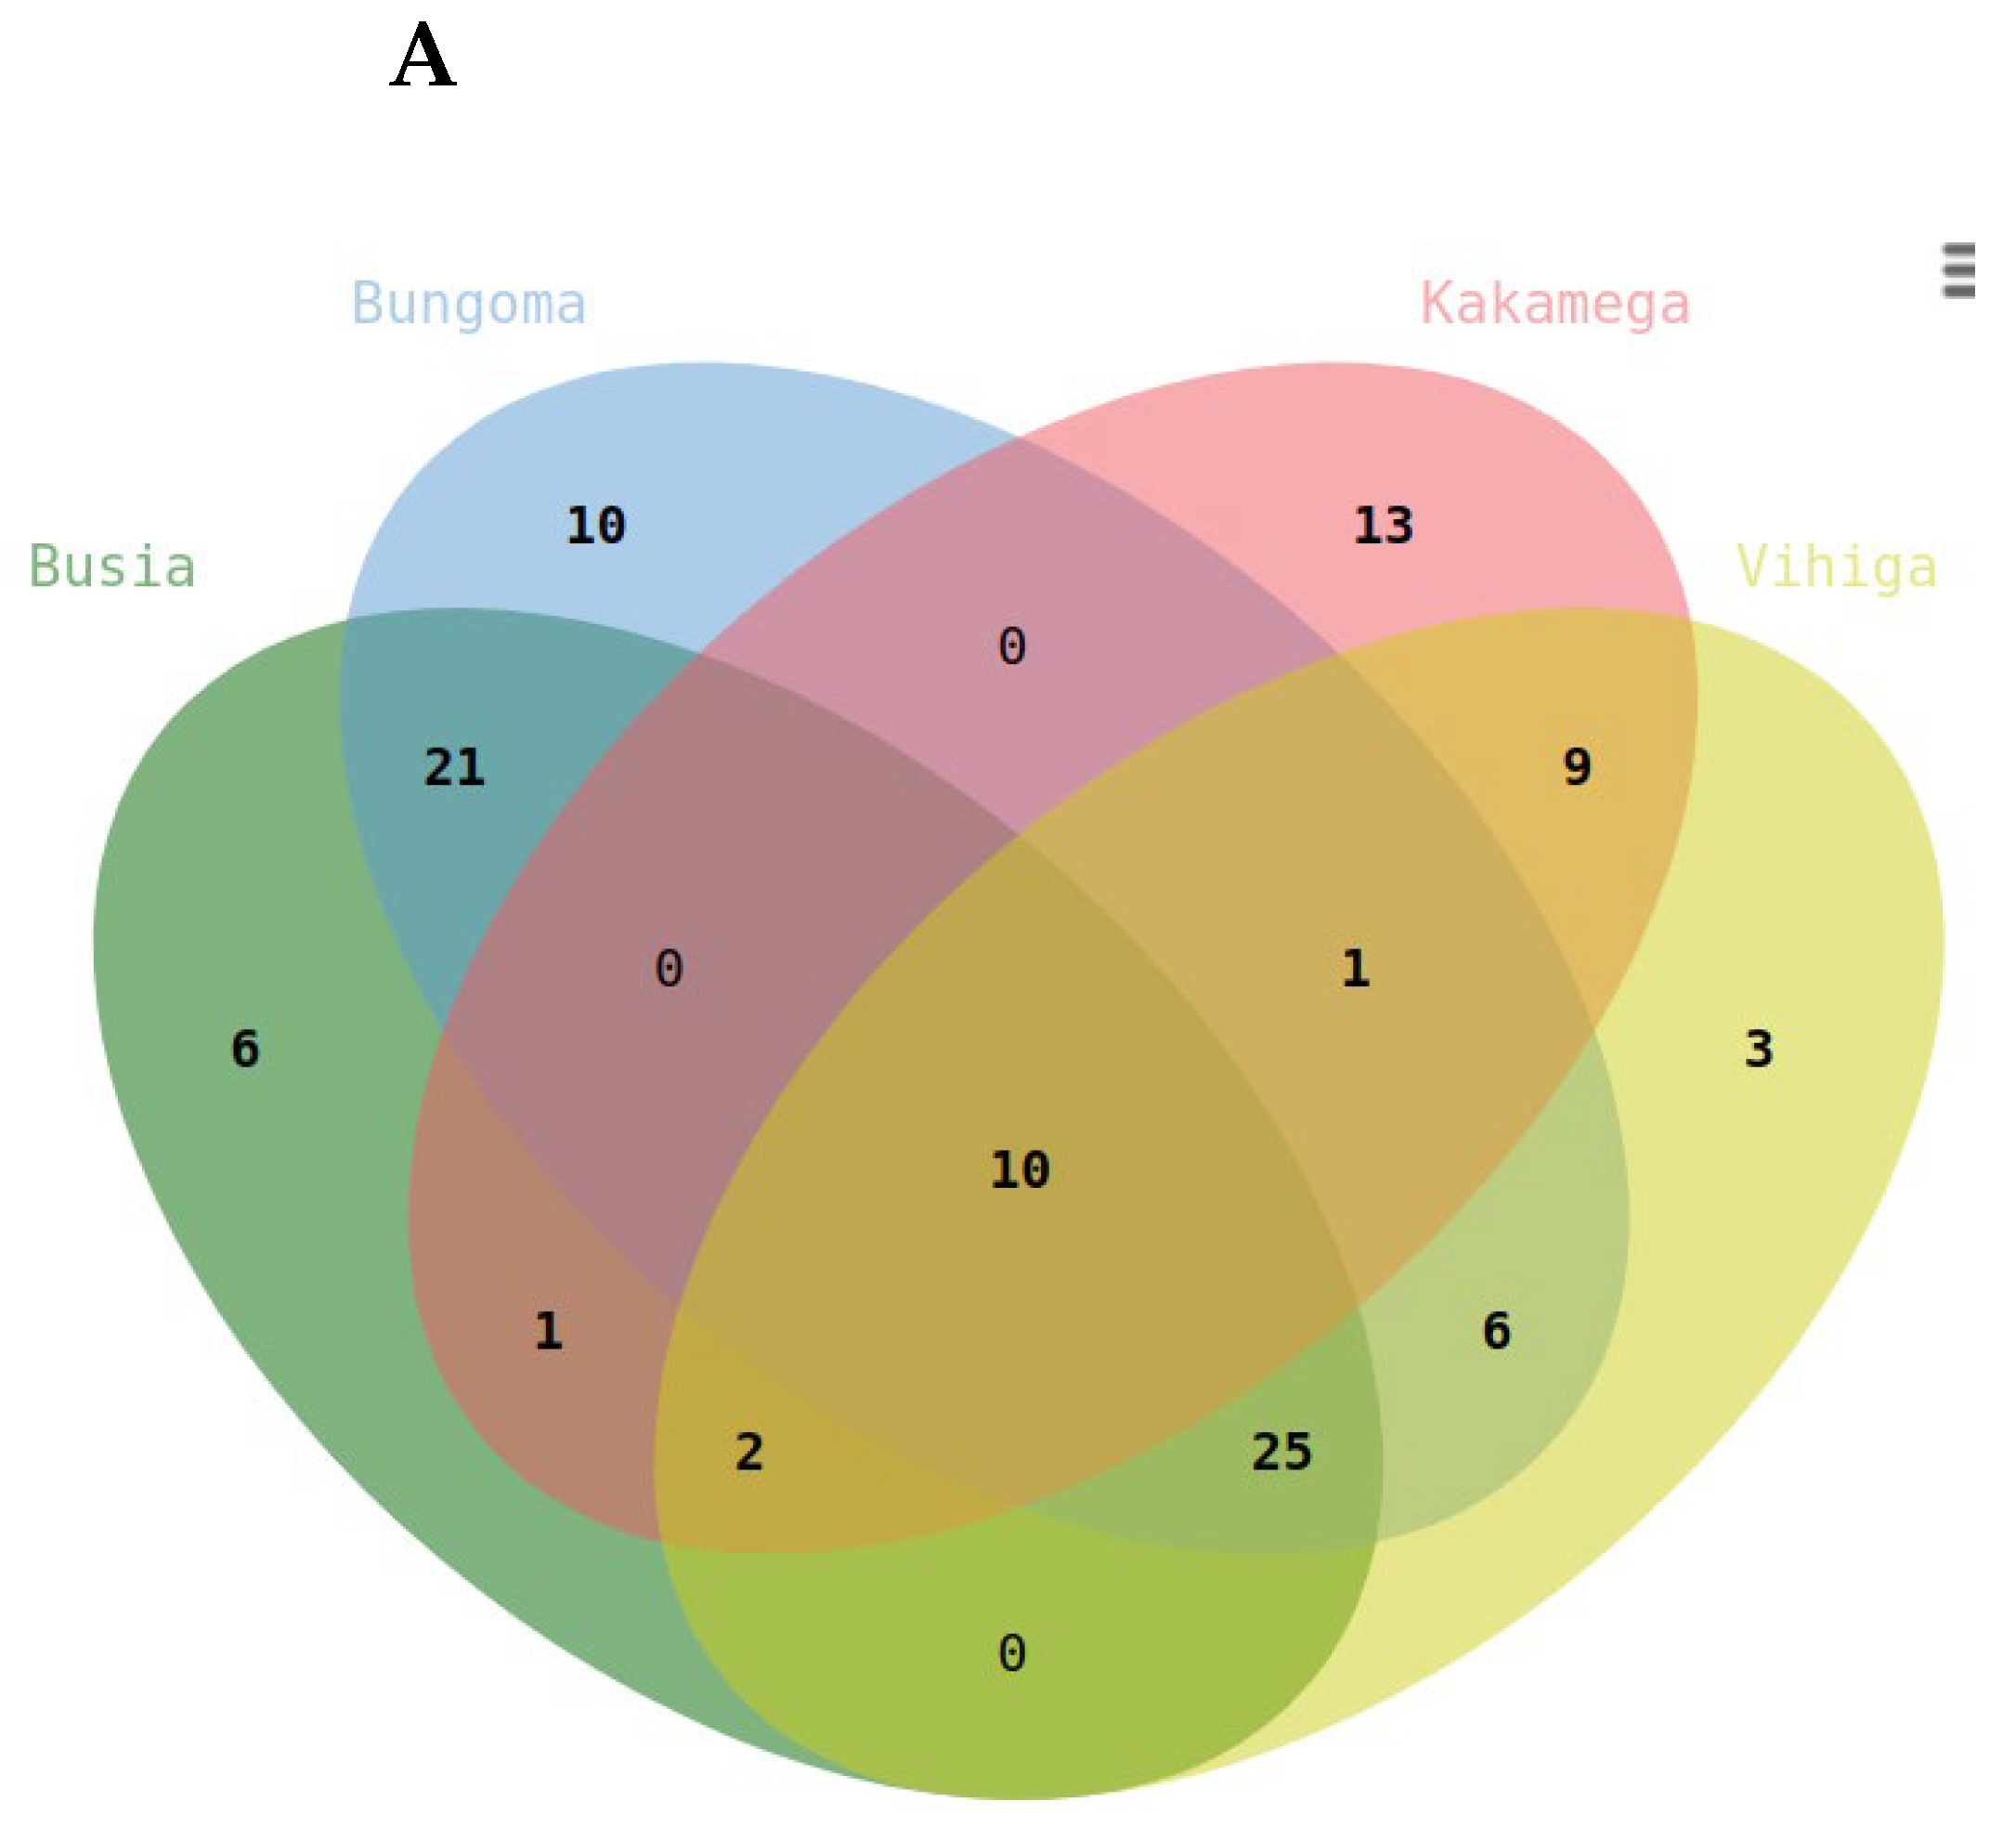
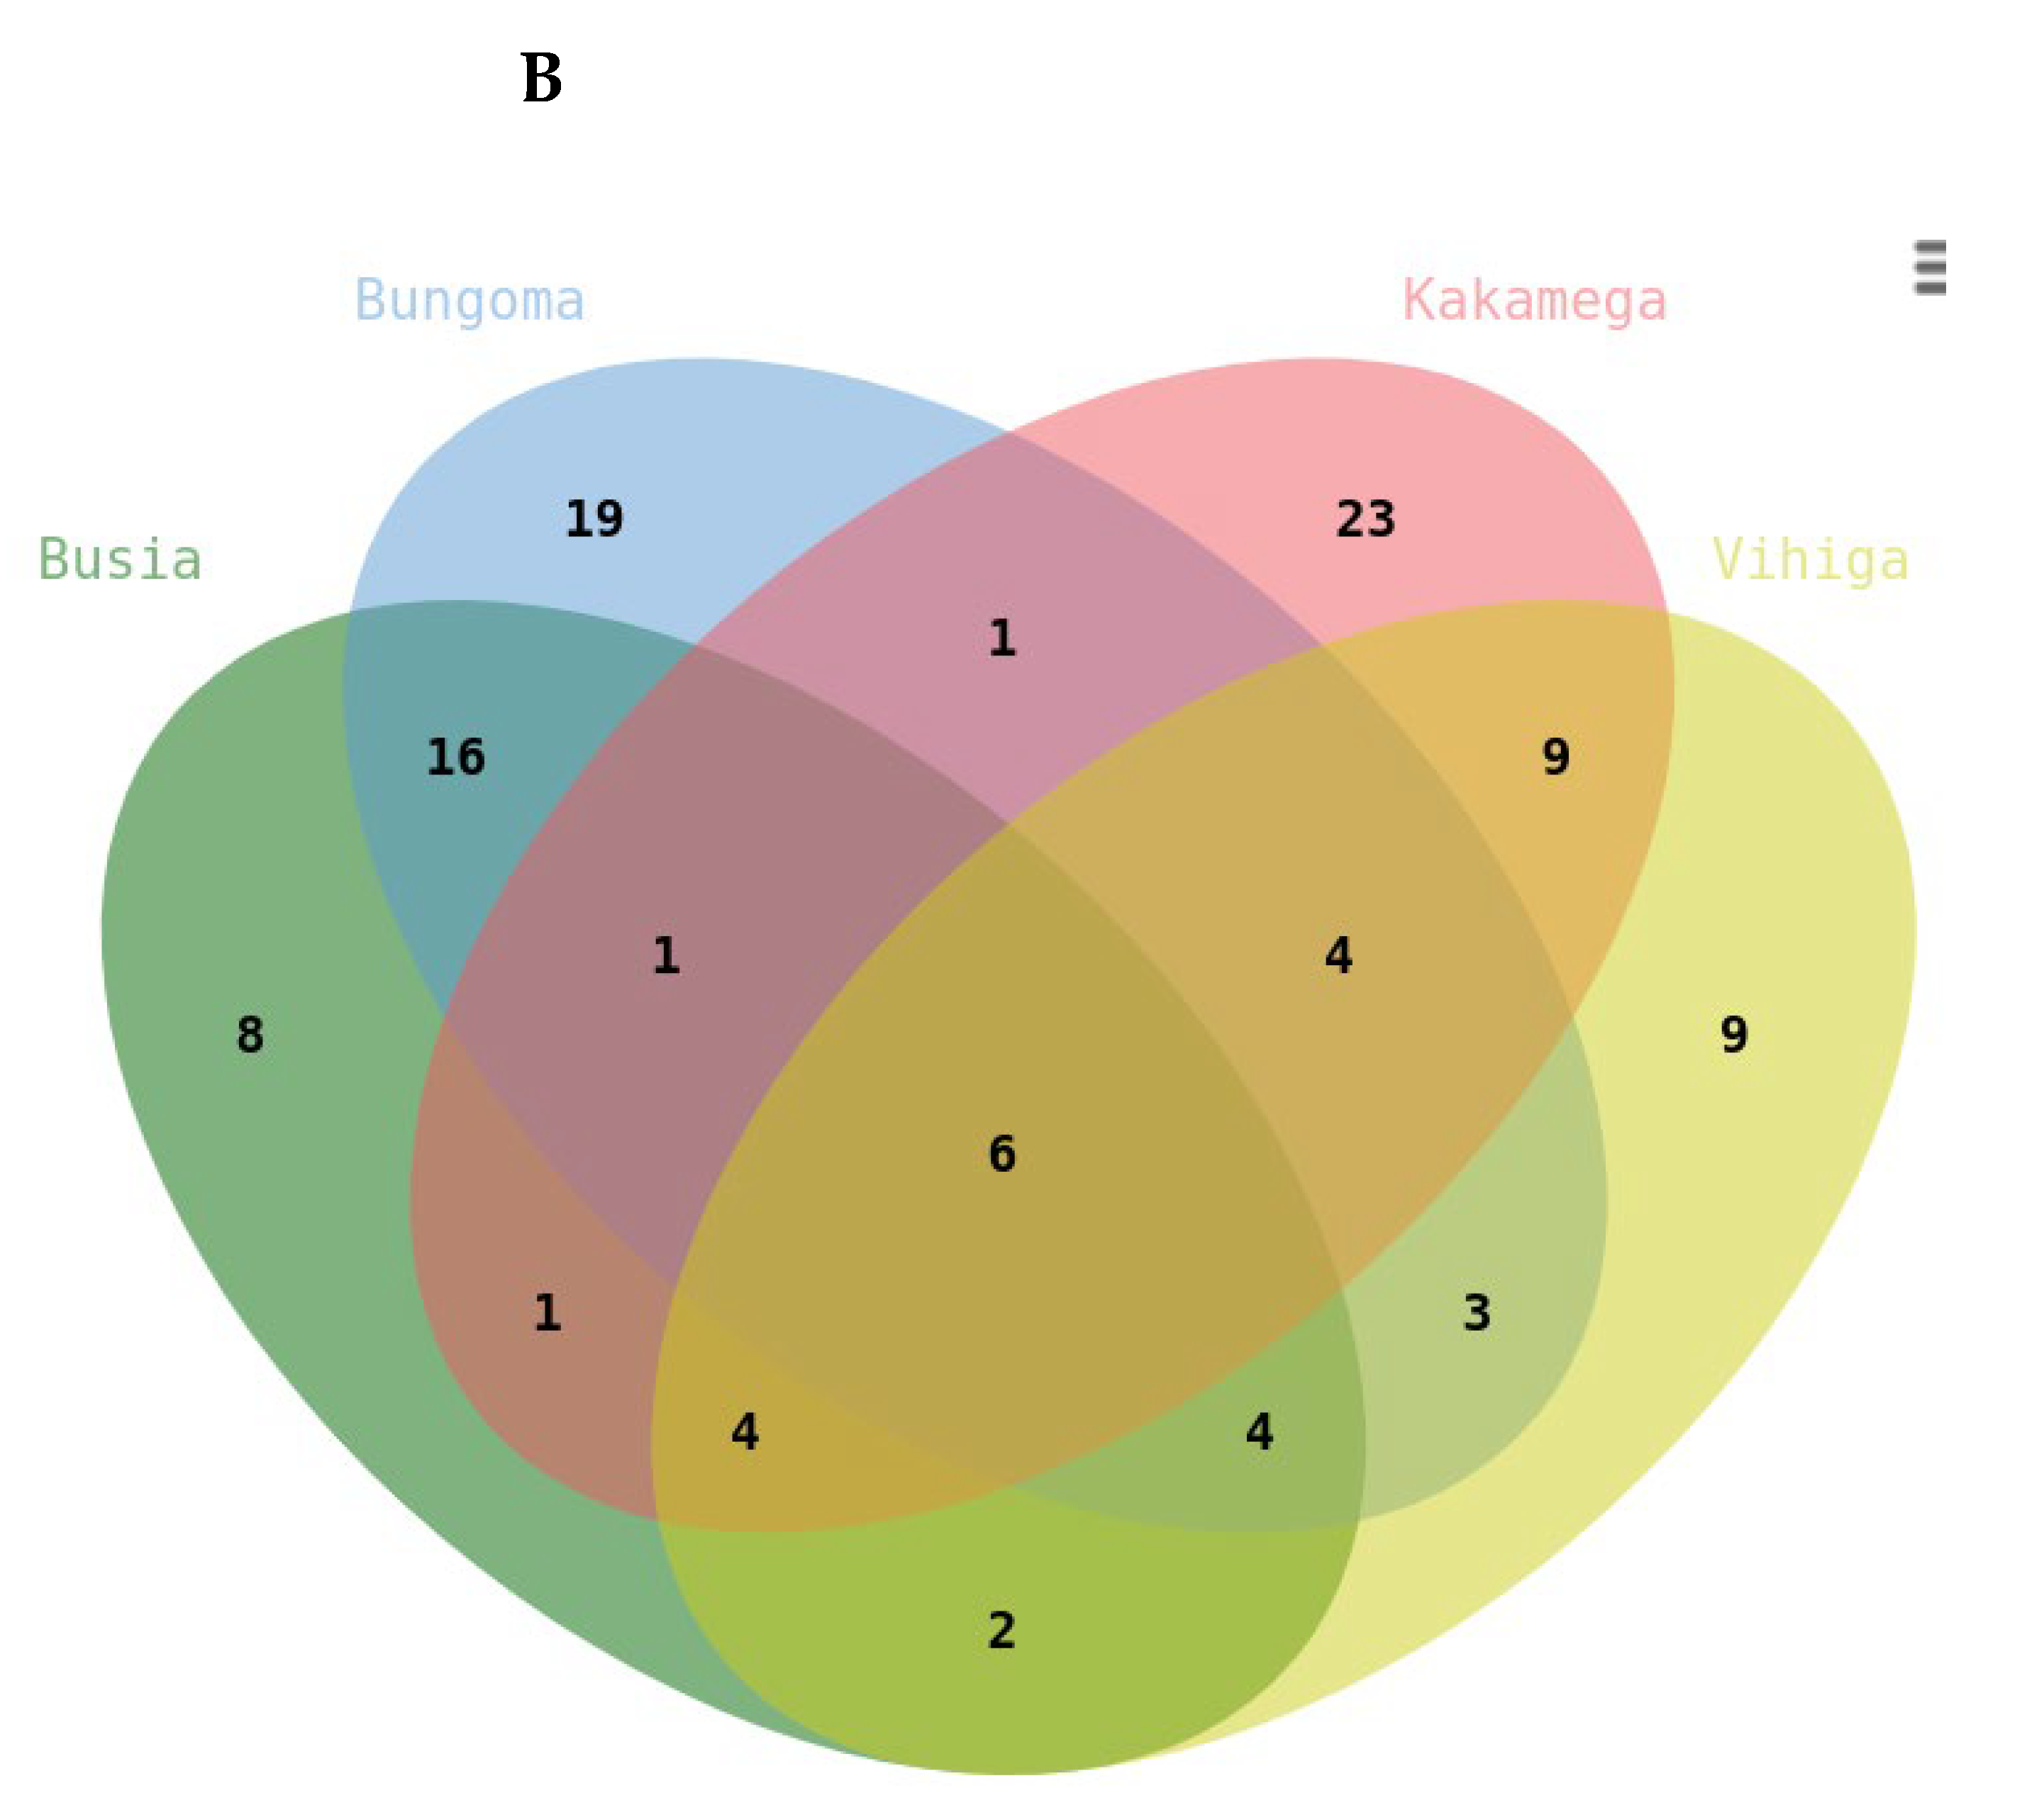
Figure 6.
A) Graph showing peak spectrum for MS2 of metabolite (Mapping ID 11308), B) Predicted molecular structure of metabolite 11308, C) Graph showing peak spectrum for MS2 metabolite (Mapping ID N0 2603), and D) Predicted molecular structure of metabolite (Mapping ID N0 2603).
Figure 6.
A) Graph showing peak spectrum for MS2 of metabolite (Mapping ID 11308), B) Predicted molecular structure of metabolite 11308, C) Graph showing peak spectrum for MS2 metabolite (Mapping ID N0 2603), and D) Predicted molecular structure of metabolite (Mapping ID N0 2603).
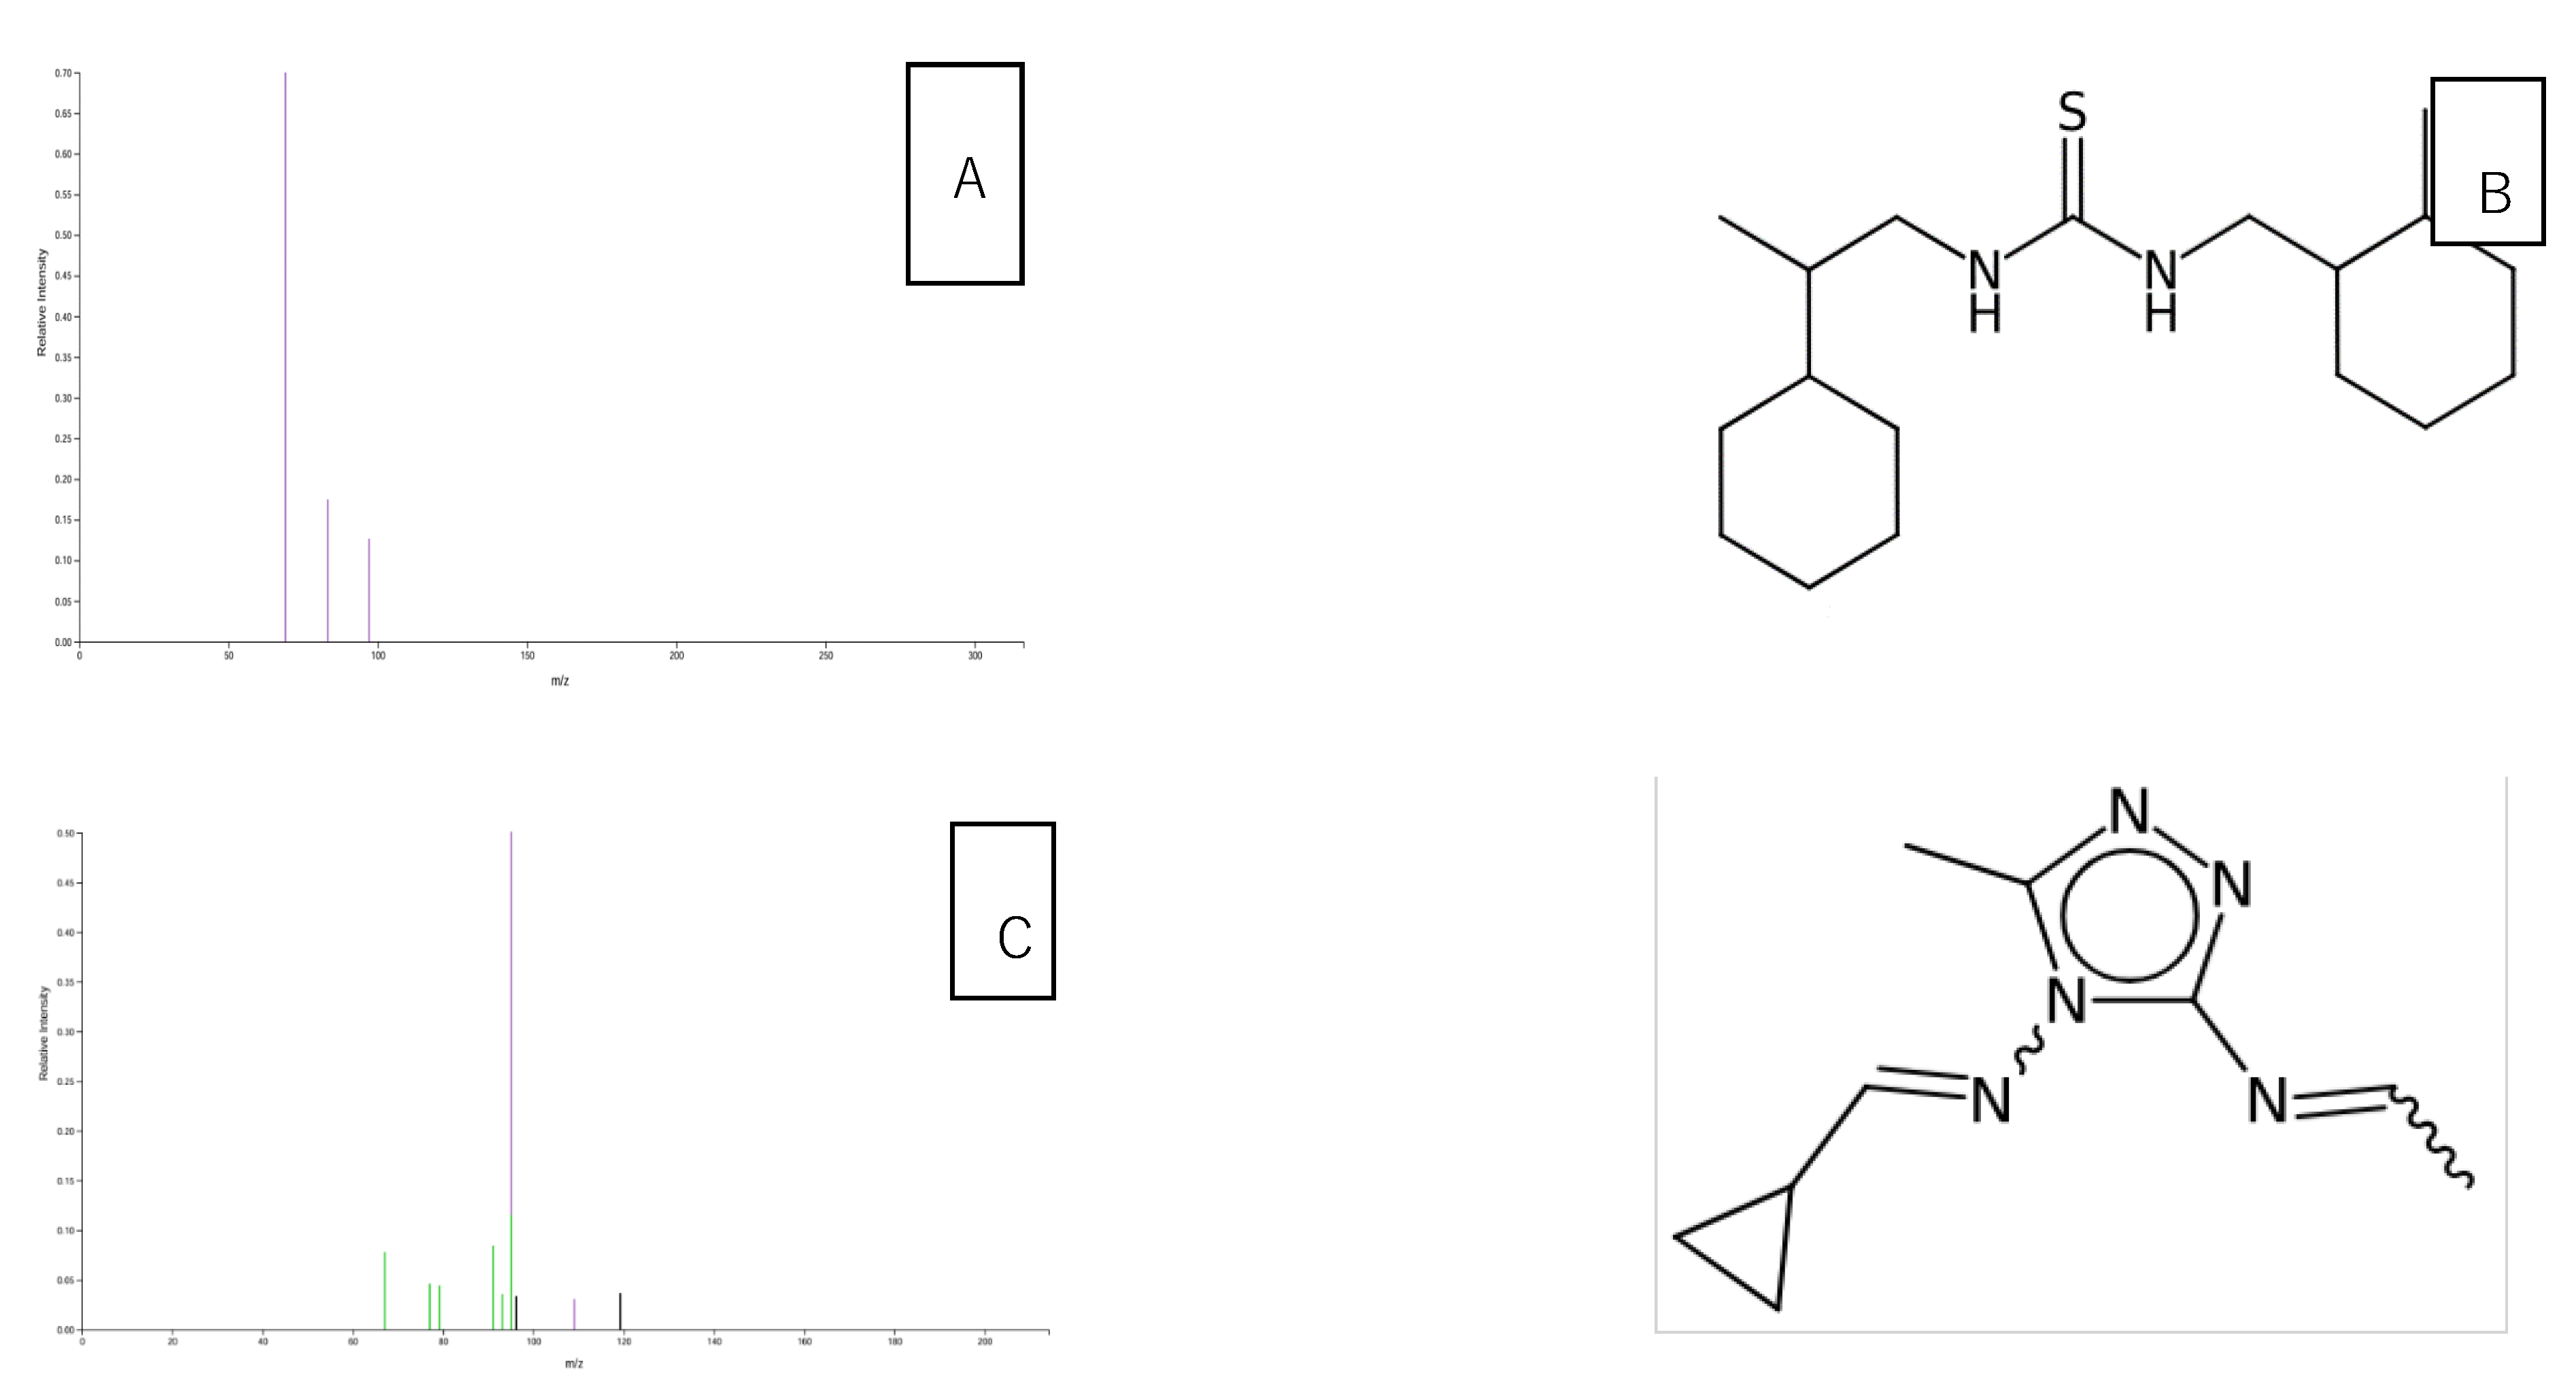
Figure 7.
Bar graph showing phytohormones extracted from diseased common beans in the Western region of Kenya (Kakamega, Bungoma, Vihiga, and Busia) on the Y-axis, which are involved in the plant defense mechanism, with normalized concentrations represented on the X-axis.
Figure 7.
Bar graph showing phytohormones extracted from diseased common beans in the Western region of Kenya (Kakamega, Bungoma, Vihiga, and Busia) on the Y-axis, which are involved in the plant defense mechanism, with normalized concentrations represented on the X-axis.
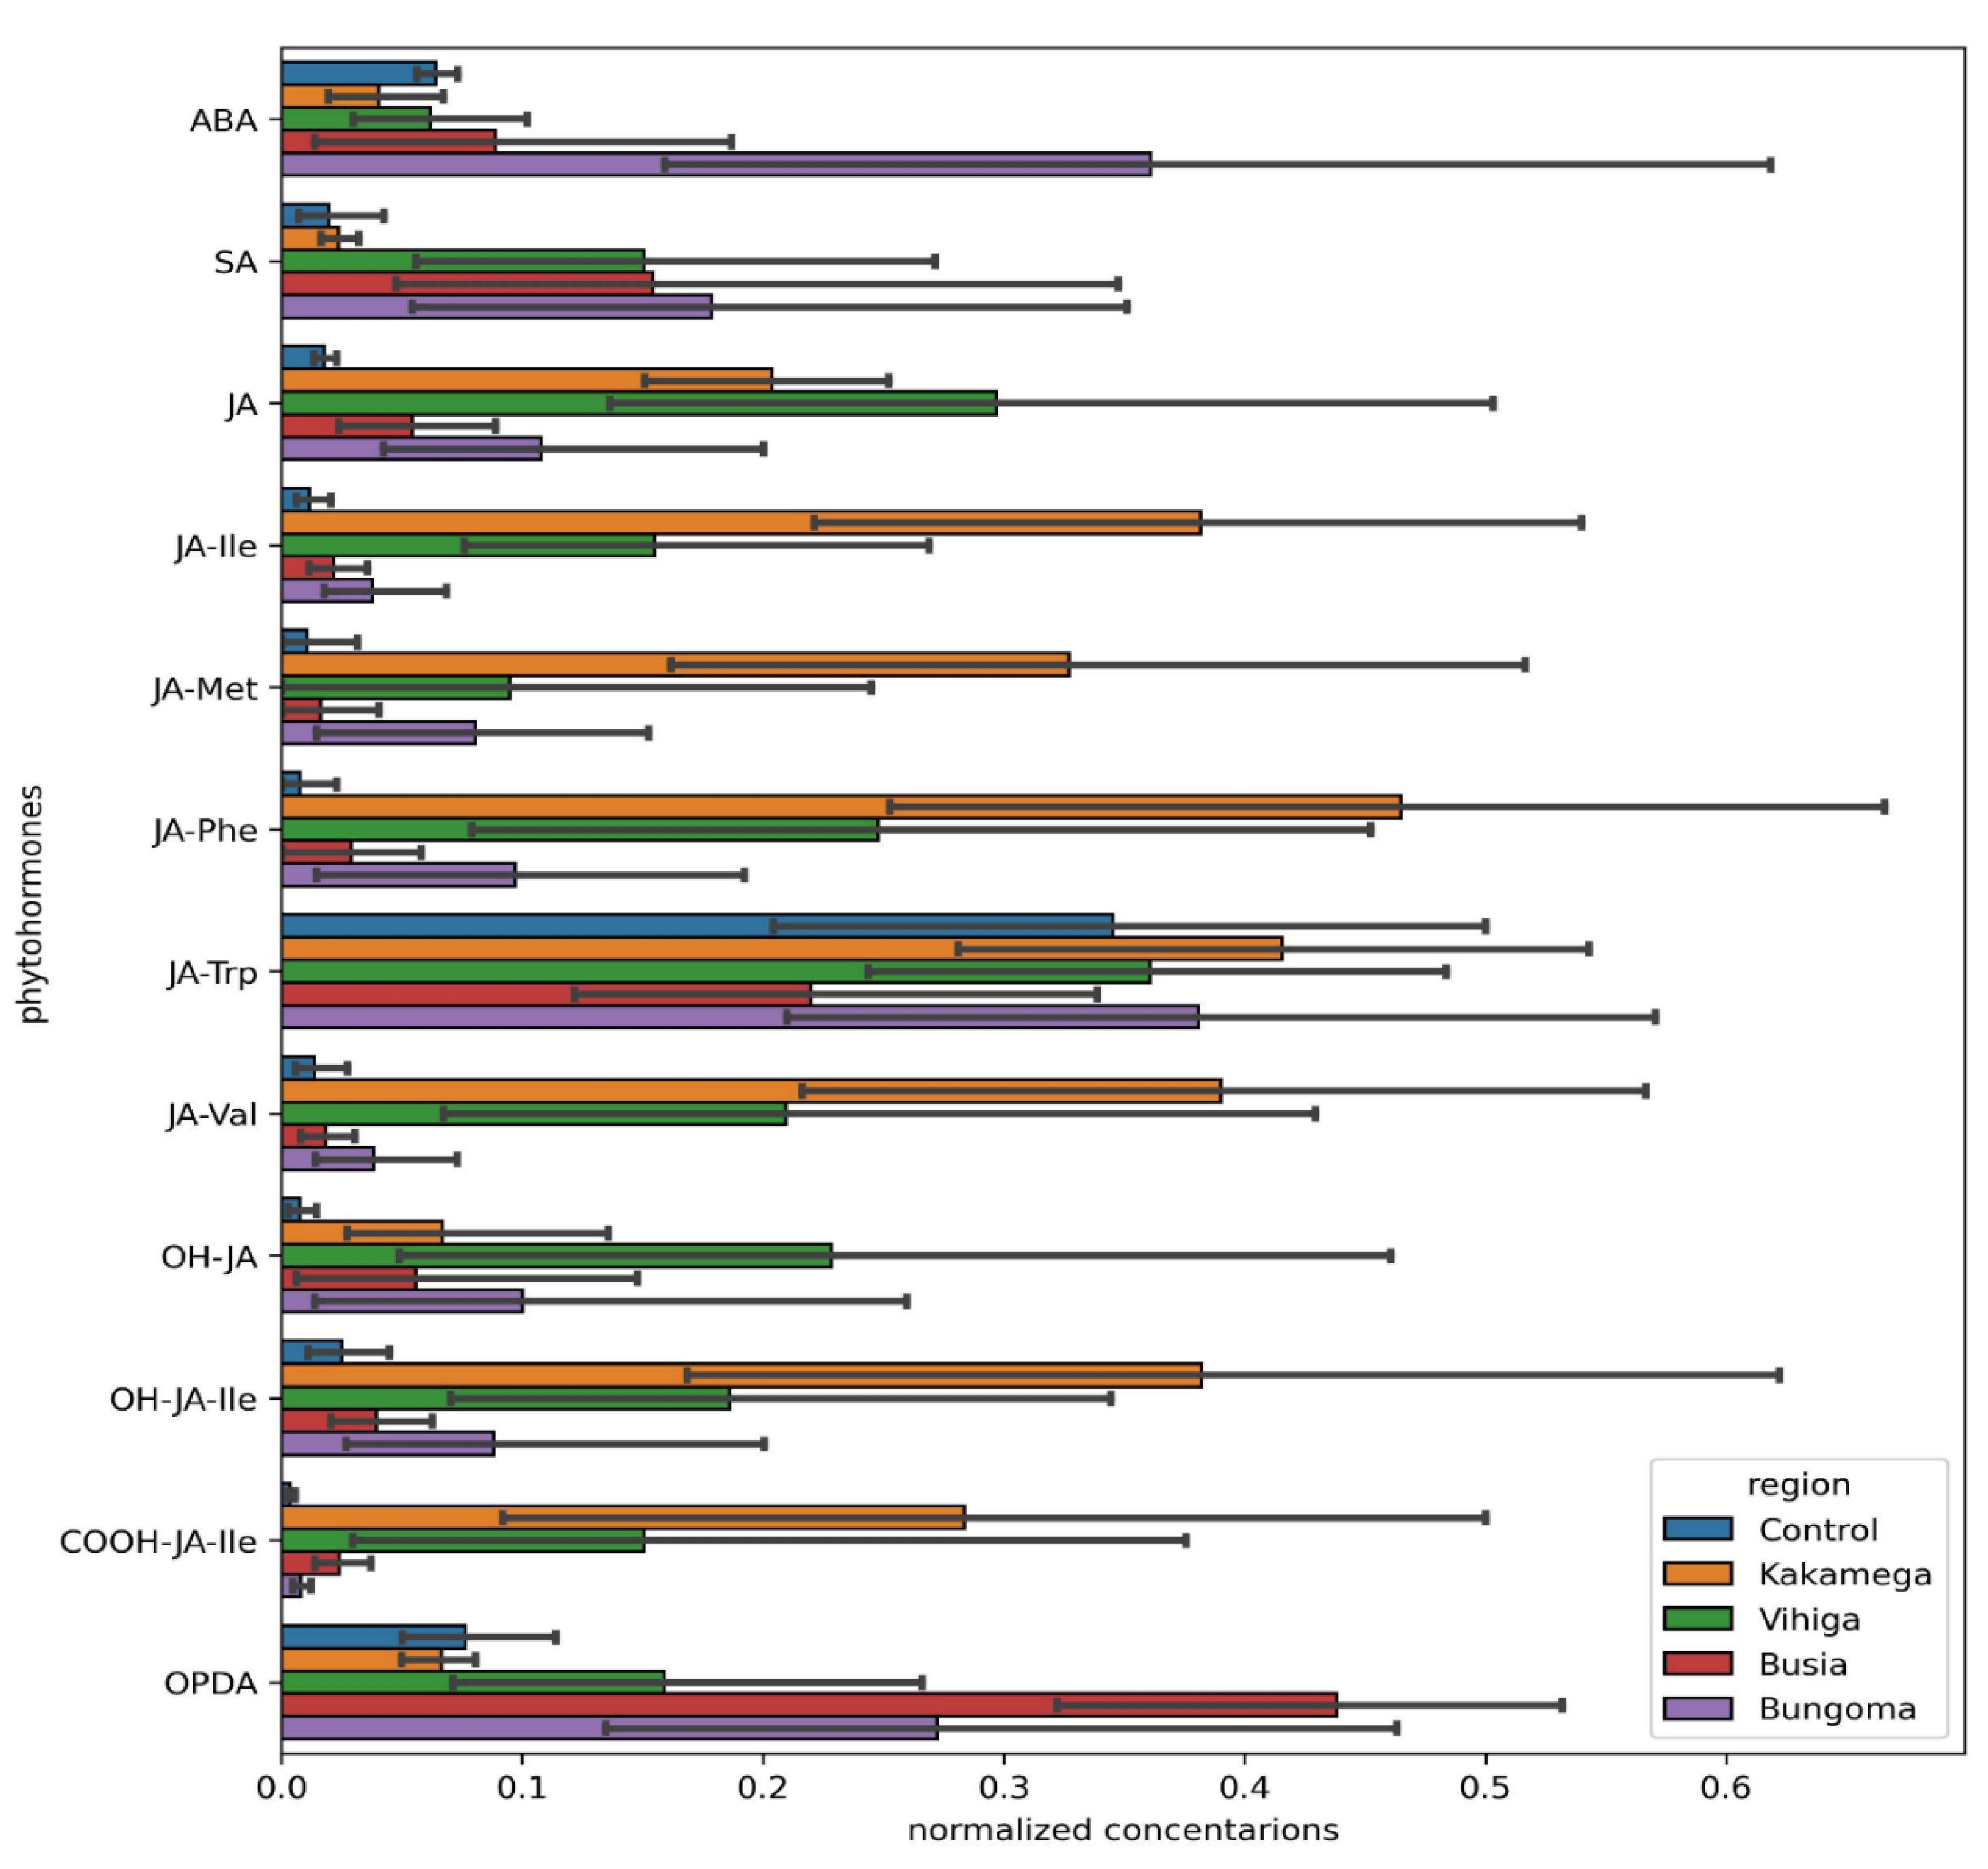

Table 1.
Shows the Metabolic Pathways and the total metabolites upregulated and down regulated.
| Metabolic Pathway | Number of Metabolite | Upregulated metabolites | Down-regulated Metabolites |
|---|---|---|---|
| Alkaloids | 41 | 11 | 11 |
| Amino acids and Peptides | 41 | 4 | 8 |
| Carbohydrates | 21 | 0 | 1 |
| Fatty Acids | 81 | 16 | 53 |
| Polyketides | 35 | 8 | 14 |
| Shikimates and Phenylpropanoids | 77 | 1 | 16 |
| Terpenoids | 58 | 11 | 28 |
| Total | 354 | 51 | 131 |
Table 2.
p-values for the targeted phytohormones compared to the control across counties in the Western region of Kenya.
Table 2.
p-values for the targeted phytohormones compared to the control across counties in the Western region of Kenya.
| Phyto hormone | Standard | Bungoma P- (Value) | Kakamega (P-Value) | Busia (P-Value) | Vihiga (P-Value) |
|---|---|---|---|---|---|
| Abscissic Acid | control | 0.0890 | 0.0312* | 0.0257* | 0.0792 |
| Salicylic Acid (SA) | control | 0.0073* | 0.0113* | 0.0022* | 0.0022* |
| Jasmonic Acid (JA) | control | 0.001* | 0* | 0.1041 | 0.0003* |
| Jasmonic Acid-lsoleucine- ( JA-)IIe | control | 0.0257* | 0.0022* | 0.1212 | 0.0003* |
| JA-Met | control | 0.0623 | 0.0019* | 0.6704 | 0.4406 |
| JA—phenylalanine (JA-Phe) | control | 0.0623 | 0.0005* | 0.2343 | 0.026* |
| JA-Tryptophan- (JA-Trp) | control | 0.7850 | 0.5279 | 0.2333 | 0.8891 |
| Jasmonic Acid Valine (JA-Val) | control | 0.1041 | 0.0032* | 0.2333 | 0.0009* |
| Hydroxyjasmonic Acid ( OH-JA | control | 0.0539 | 0.0008* | 0.4274 | 0.008* |
| Jasmonoyl-L-Isoleucine OH-JA-ILE | control | 0.0452* | 0.0081* | 0.4274 | 0.02* |
| Carboxyl Group Of 12-JA (COOH-JA) | control | 0.0962 | 0.0032* | 0.0004* | 0.0007* |
| Oxylipin 12-Oxo-Phytodienoic Acid OPDA | control | 0.0173* | 0.8501 | 0.0003* | 0.3913 |
*Significant.
Disclaimer/Publisher’s Note: The statements, opinions and data contained in all publications are solely those of the individual author(s) and contributor(s) and not of MDPI and/or the editor(s). MDPI and/or the editor(s) disclaim responsibility for any injury to people or property resulting from any ideas, methods, instructions or products referred to in the content. |
© 2025 by the authors. Licensee MDPI, Basel, Switzerland. This article is an open access article distributed under the terms and conditions of the Creative Commons Attribution (CC BY) license (http://creativecommons.org/licenses/by/4.0/).
Copyright: This open access article is published under a Creative Commons CC BY 4.0 license, which permit the free download, distribution, and reuse, provided that the author and preprint are cited in any reuse.


