Materials AND METHODS
Soil samples. The soil samples for the test were taken from Dujia Town, Wuchang City, Harbin City, Heilongjiang University Test Field, Hulan District, Harbin City, and Gaoguan Village, Chenhu Town, Boxing County, Binzhou City. The five-point sampling method is adopted for soil samples. 0-10cm soil samples are collected and fully ground through 2 mm sieve. The main field soil samples are paddy field, corn field, wheat field, potato field and cotton field. Dujia Town, Wuchang City, Harbin is located at 127.2 ° E, 44.8 ° N, with rainfall of 569.1 mm/year. The soil sample is black soil; The experimental field of Heilongjiang University in Hulan District, Harbin is located at 126.6 ° E, 45.9 ° N, with rainfall of 569.1 mm/year, and the soil sample is black soil; Gaoguan Village, Chenhu Town, Boxing County, Binzhou City is located at 118.1 °E, 37.2 °N, with precipitation of 564.8 mm/year. The soil sample is cinnamon.
Medium formula. (1)Minimal Salt Medium(MSM): K2HPO4 1.79 g, KH2PO4 0.45 g, MgSO4·7H2O 0.2 g , NaCl 0.4 g, Distilled water 1000 mL, pH7.0, Solid medium: add agar powder1.5%-2.0%. (2) Luria-Bertani (LB) Medium: Tryptone 10.0 g, Yeast Extract Powder 5.0 g, NaCl 10.0 g, Distilled water 1000 mL, pH7.0, 121 ℃ autoclave for 15min. (3) Nutrient Broth (NB) Medium: Peptone10.0 g, Meat extracts3.0 g, NaCl 5.0 g, Distilled water 1000 mL, pH7.2-7.4.
Enrichment, acclimation, isolation and purification of prometryn degrading strains. The herbicide-degrading strain was domesticated using a shake flask enrichment culture method. 5 g of soil sample, 25 mL of MSM and an appropriate amount of herbicide were added to a 50 mL triangular flask to reach a concentration of 200 mg/L of pendimethalin in the triangular flask, incubated in a constant temperature shaker at 30 ℃, 180 r/min, and 2.5 mL of the culture was inoculated into a new MSM every 5 d, and simultaneously increase the herbicide content in the medium by 200 mg/L each time until the concentration of herbicide in the medium reached 1000 mg/L. The enriched cultures were diluted in a gradient with sterile water (10-1, 10-2, 10-3, 10-4, 10-5, 10-6, 10-7, 10-8) and applied to the MSM added to prometryn, respectively. The purified strains were added to a shaking bed containing 1 mL of LB medium and incubated for 3 d at 30°C in a constant temperature incubator. When the OD value reached 1.0, the strains were centrifuged at 5000 r/min for 5 min, the supernatant was discarded, and 70% glycerol was added and mixed by aspiration.
Determination of growth curve of prometryn degrading strains. 20 μL of the suspension was added to 180 μL of MSM (25 mg/L, 50 mg/L and 75 mg/L of prometryn) and LB liquid medium, and four replicates were tested every 12 h. The strains were tested with Bioscreen until 72 h and growth curves were plotted.
Determination of the addition recovery and degradation rate of prometryn degrading strain. Pre-treatment of the obtained samples was performed as follows: 1 mL of culture medium, 0.25 g of NaCl, 5 mL of CH2Cl2 were added to 10 mL centrifuge tubes and shaken for 1 min on a Vortex; the upper layer was removed and placed in a new 10 mL centrifuge tube, 1 mL of CH2Cl2 was added and shaken for 1 min on a Vortex, the lower organic phase was placed in the first corresponding tube and the second centrifuge tube Add 1 mL of CH2Cl2 and shake for 1 min, place the organic phase in the first tube; add 0.2 g of anhydrous Na2SO4 to the combined first tubes and shake, place the upper layer in a 10 mL volumetric flask and place in a 50 °C water bath, evaporate the CH2Cl2; fix the volume to 10 mL with chromatographic grade methanol, shake with ultrasound for 30 min and finally pass through a 0.45 µm organic filter. The product was then passed through a 0.45 µm organic filter membrane into a 2 mL centrifuge tube and stored at 4°C in a refrigerator. It was subjected to High Performance Liquid Chromatography (HPLC). The mother liquor was diluted to 12.5 mg/L, 7.5 mg/L, 5 mg/L, 2.5 mg/L and 1 mg/L and analyzed by HPLC according to the chromatographic conditions and the standard curve was plotted.
The degradation rate of the highly efficient degrading bacterial strains was determined as follows: 5 mL of MSM added with herbicides (25 mg/L, 50 mg/L, 75 mg/L) and 50 μL of bacterial suspension were added to the test tubes, marked at the liquid level before shaking, and incubated in a constant temperature shaker at 30°C, 200 r/min for 5 days. A blank control group of CG was left to incubate with the treated group and the liquid level was made up according to the records before taking the samples. The culture solution taken out was extracted and subjected to high performance liquid chromatography to determine its degradation capacity. The spiked recovery and degradation rates are calculated by using the spiked recovery and degradation rate formulae.
Identification of prometryn degrading strains.The strains were Gram stained and then characterized using light microscopy, with reference to the three-step Gram staining method. LB ager medium was prepared and the purified strains were individually diluted and coated on the medium and incubated for 72h in a constant temperature incubator at 30°C. The resulting single colonies were observed for their size, edge, transparency, color and shape characteristics.
Identification was carried out using Single Box Biochemical Identification Tube(Huan Kai Microbial). Purified strains were inoculated in Nutrient Broth medium and incubated at 37°C for 18-24 h. 50 μL of broth culture was aspirated and added to penicillin vial and incubated at 35-37°C in an incubator, where the physiological and biochemical characteristics were identified with reference to the Bergey’s Manual of Systematic Bacteriology (9th edition) and the Manual of Identification of Common Bacteria.
The bacterial genomic DNA was extracted. The 16S rRNA PCR primers were 27F and 1492R, with the sequences 5’ - AGTTTGATCMTGGCTCAG - 3’ and 5’ - GGTTACCTTGTTACGACTT - 3’, respectively. 16S rRNA PCR reaction system was Template 0.5 μL, 10×Buffer (with Mg
2+) 2.5 μL, dNTP (2.5 mM) 1 μL, Taq enzyme 0.2 μL, F (10 μM) 0.5 μL, R (10 μM) 0.5 μL, and double distilled water to 25 μL. The cycling conditions were pre-denaturation 94°C for 5 min, denaturation 94°C for 1 min, annealing 56°C for 1 min, annealing cycle 35 times and extension 72°C for 1 min. The PCR products were detected by 1% agarose gel electrophoresis. The DNA bands required for PCR electrophoresis were purified. The sequences were analysed and the purified products were sent to Sangon Biotech (Shanghai) Co., Ltd. for gene sequence determination. The sequences were aligned on the ribosomal database
http://rdp.cme.msu.edu/index.jsp and submitted to NCBI to obtain an accession number. A Phylogenetic tree was constructed based on neighbor-joining methods using MEGA X (version X, USA).
Determination of growth characteristics of prometryn degrading strains. The purified single colonies were picked and inoculated into tubes containing 5 mL of LB liquid medium, shaken at 30°C, 160 r/min, incubated for 12 h, activated, 100 μL of the activated strain was taken and placed in a 96-well plate to measure OD600, sampled according to the OD600 value and placed in a 1.5 mL medium centrifuge tube at 5000 r/min, centrifuged for 5 min, the supernatant was discarded, added Add sterile 0.9% saline, shake with votex for 1 min, centrifuge again, discard supernatant, add sterile 0.9% saline and adjust OD600=1.0 to make bacterial suspension.
Take 1%, 5% and 10% bacterial suspensions respectively and add them to the 75 mg/L MSM added with prometryn. Repeat for three times. Set a control group that does not add a strain, and detect every 12 hours. Use Bioscreen to detect to 72 h, draw the strain growth curve, and study the influence of different inoculation amount on the growth characteristics of highly efficient degrading strains.
Take 10% of the bacterial suspension and add it to the MSM added with prometryn with pH=6.0, 7.0 and 8.0, which contains 75 mg/L, respectively. Repeat for three times. Set a control group that does not add a strain, and detect it every 12 h. Use Bioscreen to detect it to 72 h, draw the strain growth curve, and study the influence of different pH values on the growth characteristics of prometryn degrading strains.
Take 10% of the bacterial suspension and add it to MSM added with prometryn containing 75 mg/L respectively. Repeat for three times. Set one non added strain as the control group, and detect once every 12 hours. Use Bioscreen to detect for 72 h. Use HPLC to determine the residue, calculate the degradation rate, draw the strain growth curve and degradation curve, and study the influence of different culture time on the growth characteristics of prometryn degradation strains.
Determination of degradation ability of prometryn degrading strains by bioassay. The seeds were surface sterilised by soaking the seeds in 75% ethanol for 2 min, pouring out the 75% ethanol and rinsing with sterile water, pouring out the sterile water and soaking in 3% sodium hypochlorite solution for 20 minutes, pouring out the sodium hypochlorite solution and rinsing the seeds repeatedly with sterile water until the smell of sodium hypochlorite disappeared. The sterilised seeds were soaked in warm water at 30°C for 12 hours.
The sensitive concentration screening test method is as follows: first, prepare MSM added with prometryn with gradient concentration (5, 25, 50, 75, 100 mg/L), cut the sterile gauze into suitable size and place it in the sterilization plate, add 40 mL of culture solution to each plate, and then put 40 seeds into each plate evenly, each treatment is repeated for three times, and set sterile water as the blank control, place it in the 25°C light incubator for 6 days, and pay attention to supplementing the same amount of water every day, Observe and record the germination rate, bud length, root length and other indicators, and make statistical analysis to determine the more sensitive concentration of seeds.
The bioassay method of strain degradation capacity is as follows: the strain with high degradation rate is inserted into the MSM added with prometryn with sensitive concentration, shaken at 30°C, and applied to the seeds of sensitive crops according to the above method. This is the treatment group. In addition, the sterile water applied to the seeds of sensitive crops is the blank group. The MSM added with prometryn without bacteria is the control group. After each batch of treated seeds grows for 6 d, the germination rate bud length and root length.
Pan-genome sequencing of prometryn degrading strains. The whole genome of the isolated strain was extracted using a Genomic DNA purification Kit (Promega, Fitchburg, WI, USA), DNA purity and integrity were analyzed by agarose gel electrophoresis and DNA concentration was quantified. Each sample contained 1 μg of fragmented DNA randomly punched into 300 bp samples using a covaris ultrasound crusher. Complete libraries were prepared by end-repair, A-tail addition, sequencing ligation, purification and PCR amplification. After constructing the library, initial quantification is performed, followed by accurate quantification of the effective concentration of the library to ensure the quality of the library. After identification of the libraries, the whole genomes of strains T6-2 and T7-2 were sequenced according to the effective concentrations and the amount of target data required. Scaffolds larger than 500 bp were selected for subsequent analysis. Prediction of genome composition. We used four databases to predict gene function, they were GO, KEGG, COG, CAZymes.
Genomic colinearity analysis of prometryn degrading strains. Covariance analysis can reveal conserved core genes and also help explain differences in traits due to chromosomal variation. In this study, protein sequences and corresponding CDS sequences were screened against publicly available data from the Joint Genomics Institute (JGI) database and the Genome database of the National Center for Biotechnology Information (NCBI), and co-linear regions of efficiently degrading strains were searched for based on MCScanX-transposed.
Statistical analysis. Qubit 2.0 was used for initial quantification and Real-time Quantitative PCR method for accurate quantification of the effective concentration of the library to ensure the quality of the library. Sequencing was performed using the Illumina-HiSeq platform. Assembly into numerous scaffolds was performed using SPAdes (v3.13.0) software. Follow-up analyses were performed with scaffolds. Statistical analysis was performed using SPSS 20.0 statistical software, using Ducan’s multiple polar difference test, significance level by LSD chi-square test, three biological replicates for all experiments, significance level p<0.05, analysis comparing differences between treatments and control blanks, looking for correlation with the addition of microbial degrading bacteria.
Results
Enrichment, acclimation, isolation and purification of prometryn degrading strains. A preliminary screening of strains with hyaline rings was carried out by enrichment culture in MSM spiked with prometryn, further purified on LB solid medium and 19 bacterial strains capable of degrading prometryn were domesticated and isolated from test soil samples grown on rice, maize, wheat, potato and cotton in Heilongjiang and Shandong provinces. Six strains of degrading bacteria were further screened: T4-1, T5-3, T6-1, T6-2, T7-2 and T7-3. (
Table S1)
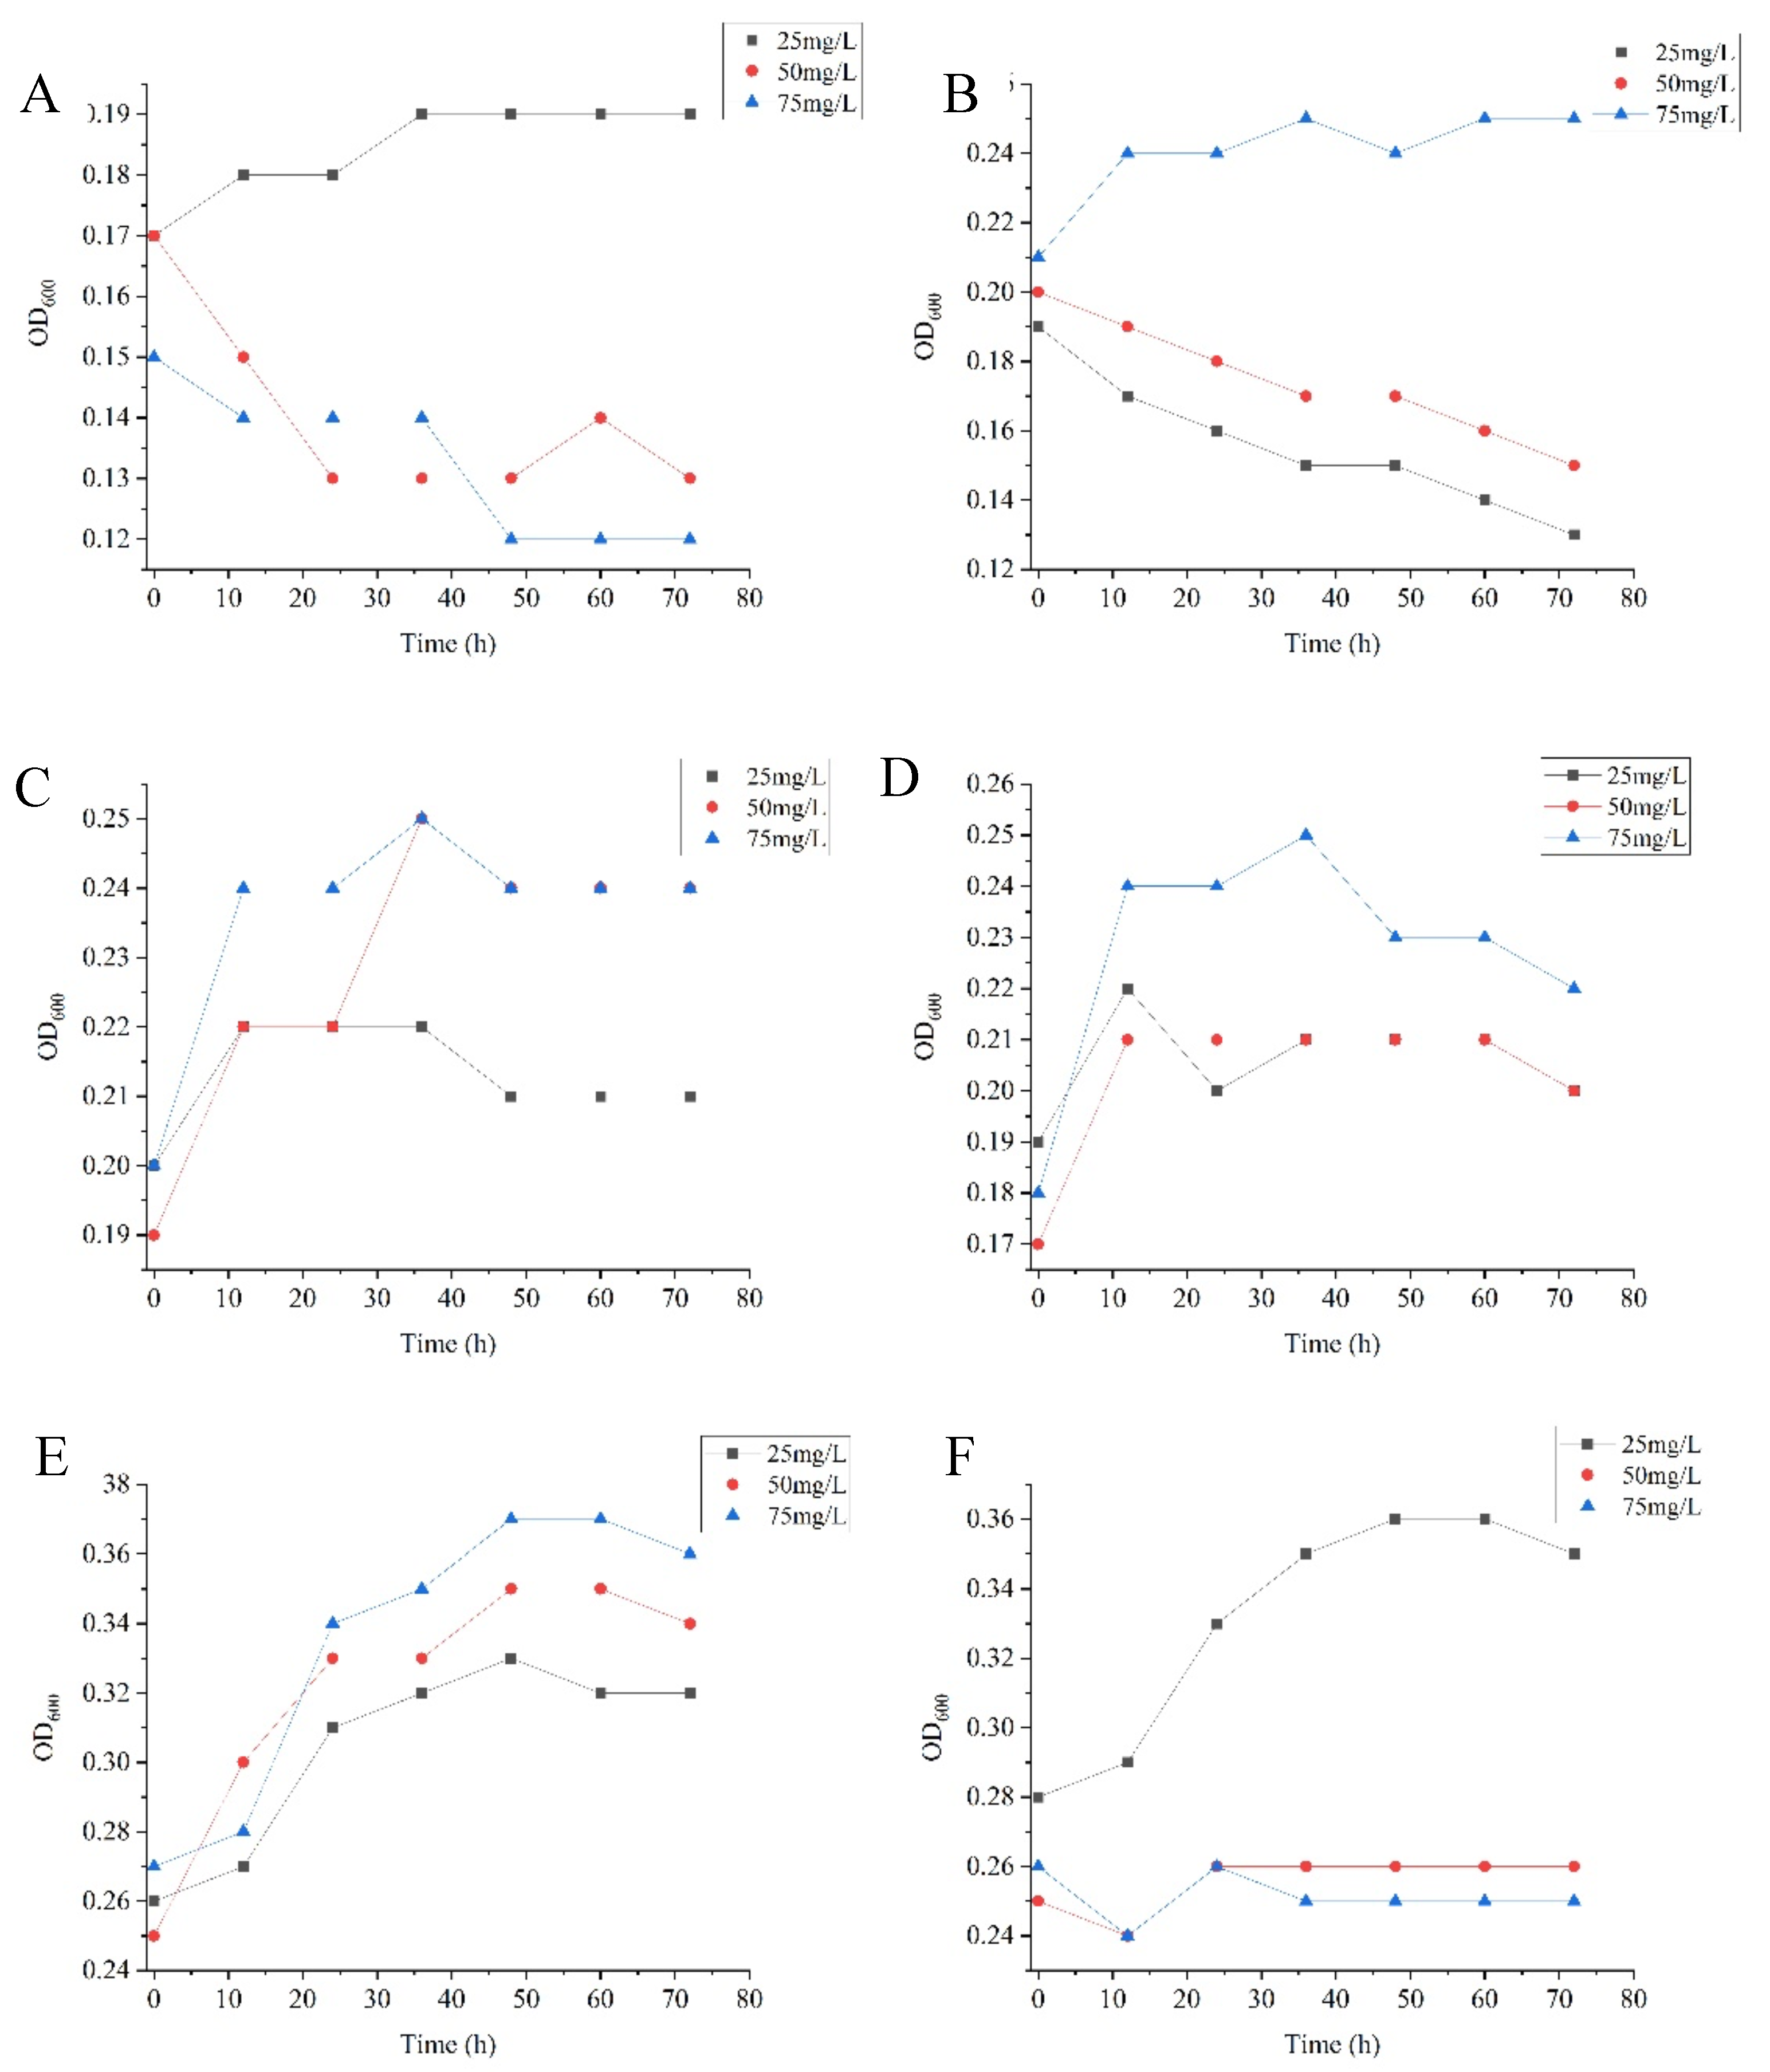
Growth curve of prometryn degrading strain. The bioscreen growth curve analyzer was used to determine the effect of herbicides with different initial concentrations on the growth of the strain, and the concentration with a better growth trend in the MSM added with herbicides was selected for subsequent experiments. 72 h growth curve of prometryn degrading bacteria strain (
Figure 1), in which strain T4-1 and strain T7-3 have a growth trend when prometryn initial concentration is 25 mg/L, and strain T5-3, T6-1, T6-2, and T7-2 have a growth trend when prometryn initial concentration is 75 mg/L.
Addition recovery rate and degradation rate of prometryn degrading strain. The standard curve for the herbicide quasi-quantitative was plotted as shown in
Figure 3. The linear regression equation was : y = 208073x + 97277 with the correlation coefficient: R
2 = 0.9999. (
Figure S2) 86.43%-114.45% of the recoveries were obtained for all strains at 15, 25, 50, 75 and 100 (mg/L), which proved that the above herbicide extraction and high performance liquid chromatography assay method was feasible. (
Table 1)
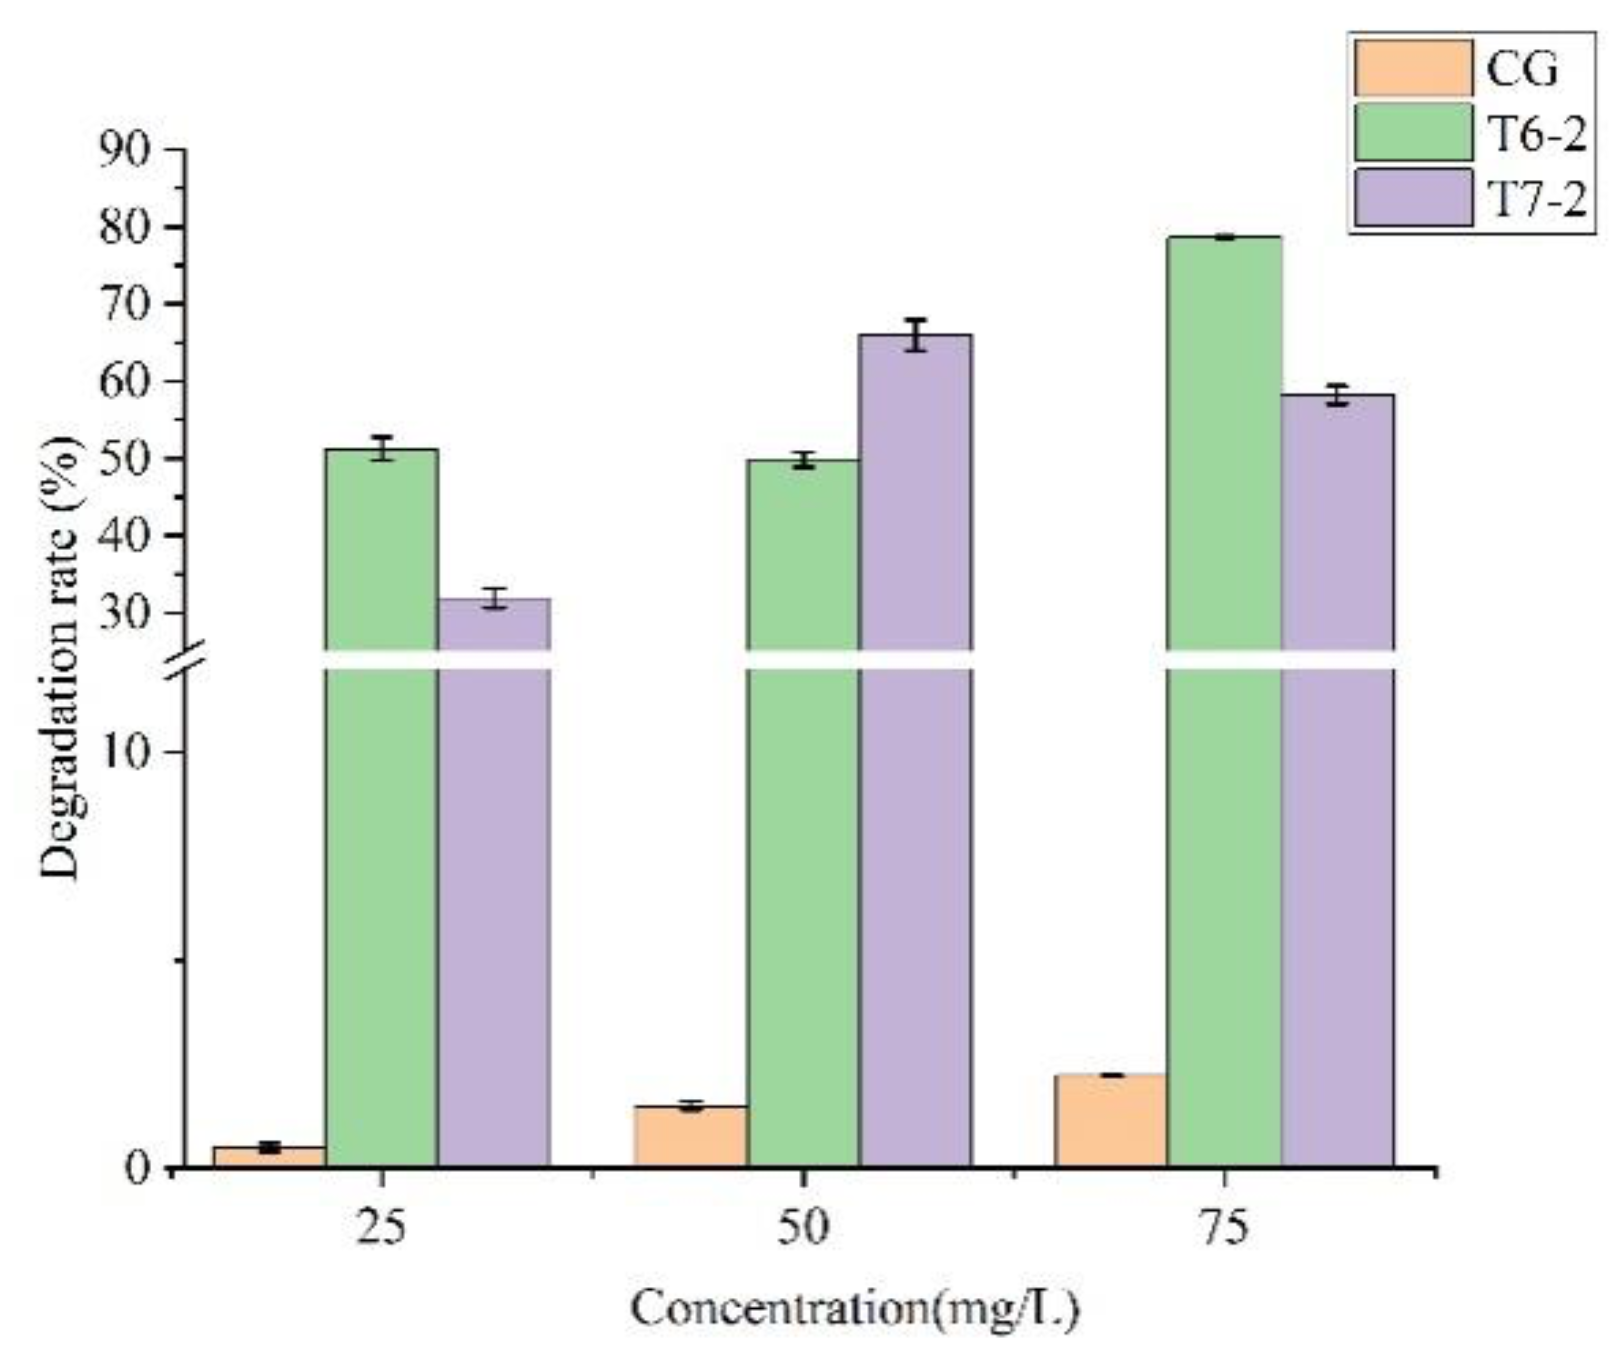
The high performance liquid chromatography was used to determine the degradation ability of the degradation bacteria to prometryn in the MSM, and the strains with high degradation effect were screened for subsequent experiments (
Figure 2). Among them, the strains T6-2 and T7-2 had good degradation effects on prometryn with initial concentrations of 75 mg/L and 50 mg/L within 5 days, and the degradation rates were 78.68% and 65.95%, respectively.
Figure 2.
Degradation rate of prometryn degrading strain. CG is the control group.
Figure 2.
Degradation rate of prometryn degrading strain. CG is the control group.
Identification of prometryn degrading strains.The colony morphology of strain T6-2, as shown in
Figure S3, observe the colony morphology of strain T6-2 on LB medium, the colony is very large, slightly yellow, rough and irregular surface, with many folds, opaque, Gram stain is purple, the shape is short and thick rod-shaped bacteria, judge the strain is Gram-positive bacteria.
The colony morphology of strain T7-2, as shown in
Figure S3, observe the colony morphology of strain T7-2 on LB medium, the colony is white, round, smooth at the edge, raised in the middle, opaque, Gram stain is red, the shape is short rod-shaped bacteria, judge the strain as Gram-negative bacteria.
The results of the physiological and biochemical responses of the prometryn degrading strains are shown in
Table S2 and the results of the tests were essentially the same when compared with Hidetsugu Higashi’s Manual for the Identification of Common Bacteria and Bergey’s Manual of Systematic Bacteriology (9
th edition). Strain T6-2 was positive for xylose, sorbitol, sided marigold alcohol, urea yophilized, cottonseed sugar, ornithine decarboxylase, lysine decarboxylase, semi-solid agar, and triose iron agar, and negative for citrate, phenylalanine, peptone water, glucose phosphate peptone water, and hydrogen sulphide; strain T7-2 was positive for ornithine decarboxylase, lysine decarboxylase, hydrogen sulphide, and semi-solid agar, and positive for xylose, sorbitol, Lateral marigold alcohol, urea yophilized, citrate, phenylalanine, cottonseed sugar, peptone water, glucose phosphate peptone water, triose iron agar negative.
The amplified product of the 16S rRNA from the efficiently degraded strain was subjected to 1 % agarose gel electrophoresis as shown in
Figure S4, with a gene fragment size of approximately 1400 bp.The comparison results of strain T6-2 on NCBI Blast showed that the 16S rRNA sequence of strain T6-2 had high homology with
Bacillus subtilis. Combined with the morphological and biochemical identification results, the strain was identified as
Bacillus subtilis subsp Subtilis, submit it to Genbank to obtain the login number MW349862, and build a phylogenetic tree (
Figure S5 A).The comparison results of strain T7-2 on NCBI Blast showed that the 16S rRNA sequence of strain T7-2 was highly homologous with
Brevundimonas. Combined with the morphological and biochemical identification results, the strain was identified as
Brevundimonas diminuta, and submitted to Genbank to obtain the registration number of MW350067 to construct a phylogenetic tree (
Figure S5 B).
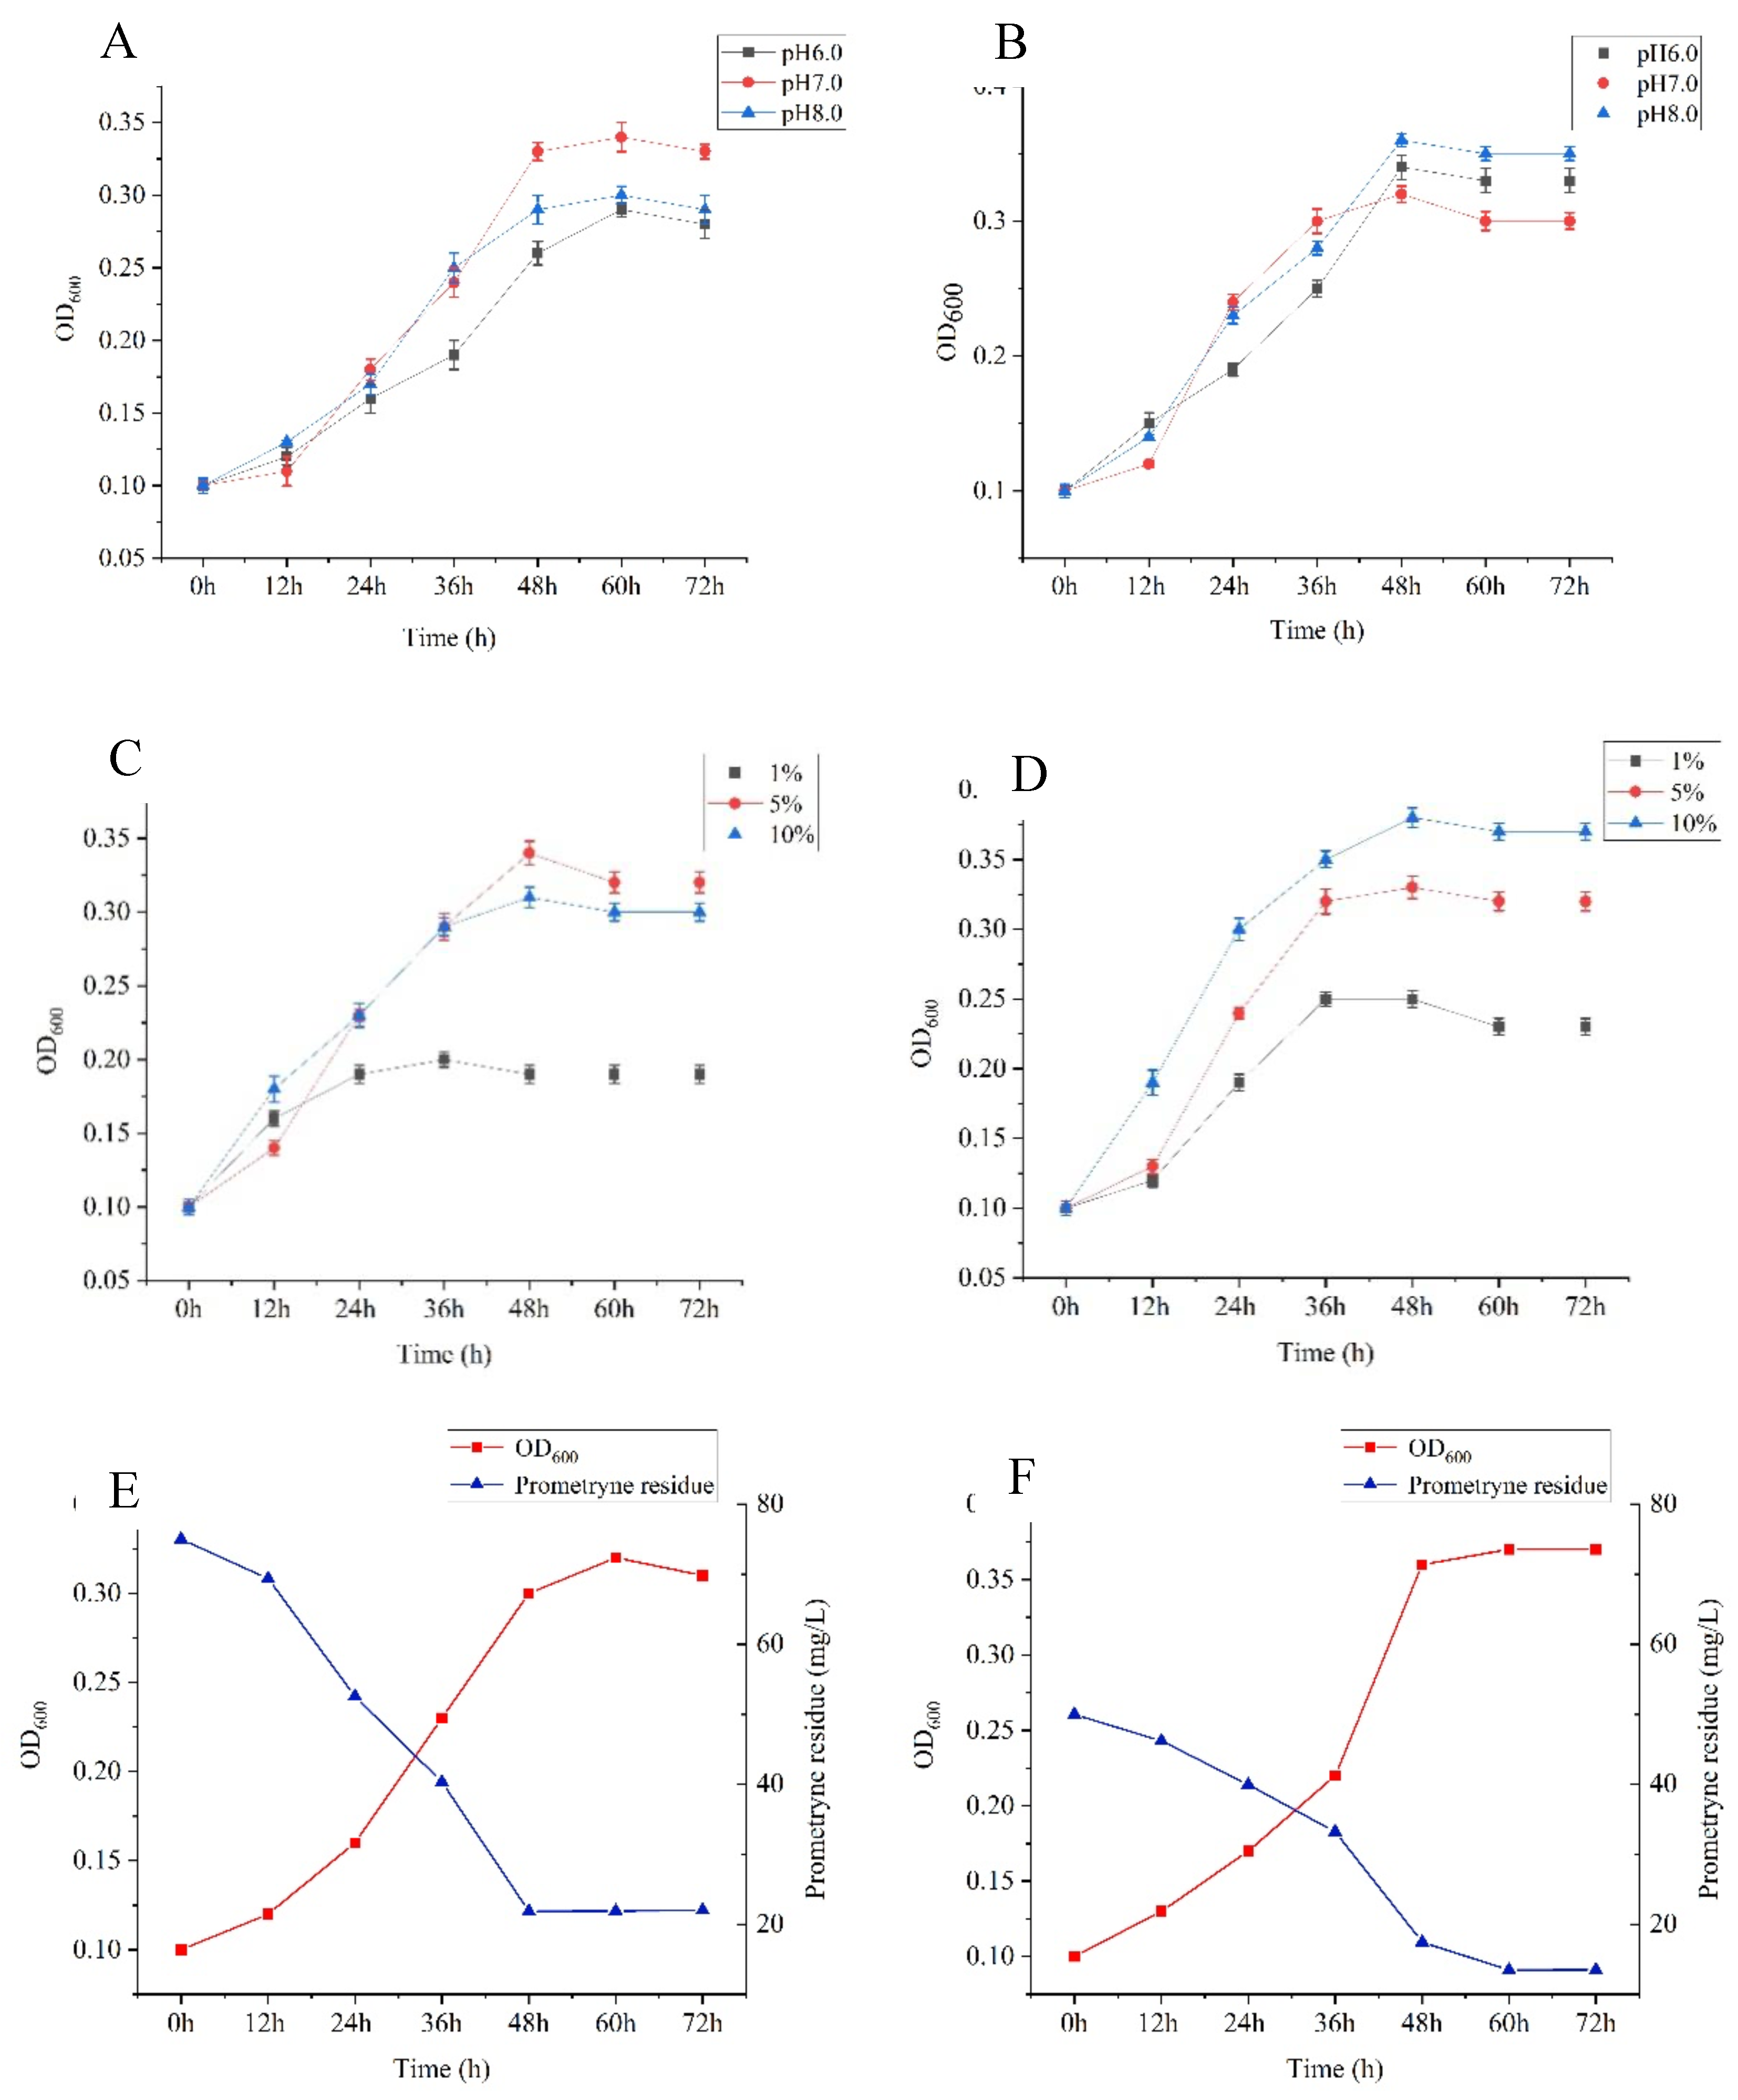
Growth characteristics of prometryn degrading strains. The growth test results of prometryn degrading bacteria strains with different pH values and inoculations are shown in
Figure 3. The optimum pH values of strain T6-2 and strain T7-2 are 7 and 8 respectively; The optimum inoculation amount of strain T6-2 was 5%, and that of strain T7-2 was 10%. The determination results of culture time on the growth and degradation ability of prometryn degrading bacteria strain are shown in
Figure 3. The logarithmic growth period of strain T6-2 is 12-48 h when it is cultured on the MSM added with prometryn, with its absorbance value of 0.32. The concentration of strain T6-2 decreases from 75 mg/L to 22.03 mg/L in 72 h, and the degradation rate reaches 70.63%; The logarithmic growth period of strain T7-2 was 36-60h when it was MSM added with prometryn, and its absorbance value was 0.37. The concentration of strain T7-2 decreased from 50 mg/L to 13.48 mg/L in 72h, and the degradation rate reached 73.03%.
Figure 3.
Determination of the growth of prometryn degrading bacteria strains at different pH values, inoculation amount and incubation time. A and B represent the growth determination of strains T6-2 and T7-2 at different pH; C and D represent the growth determination of strains T6-2 and T7-2 with different inoculums; E and F represent the growth determination of strains T6-2 and T7-2 at different culture time.
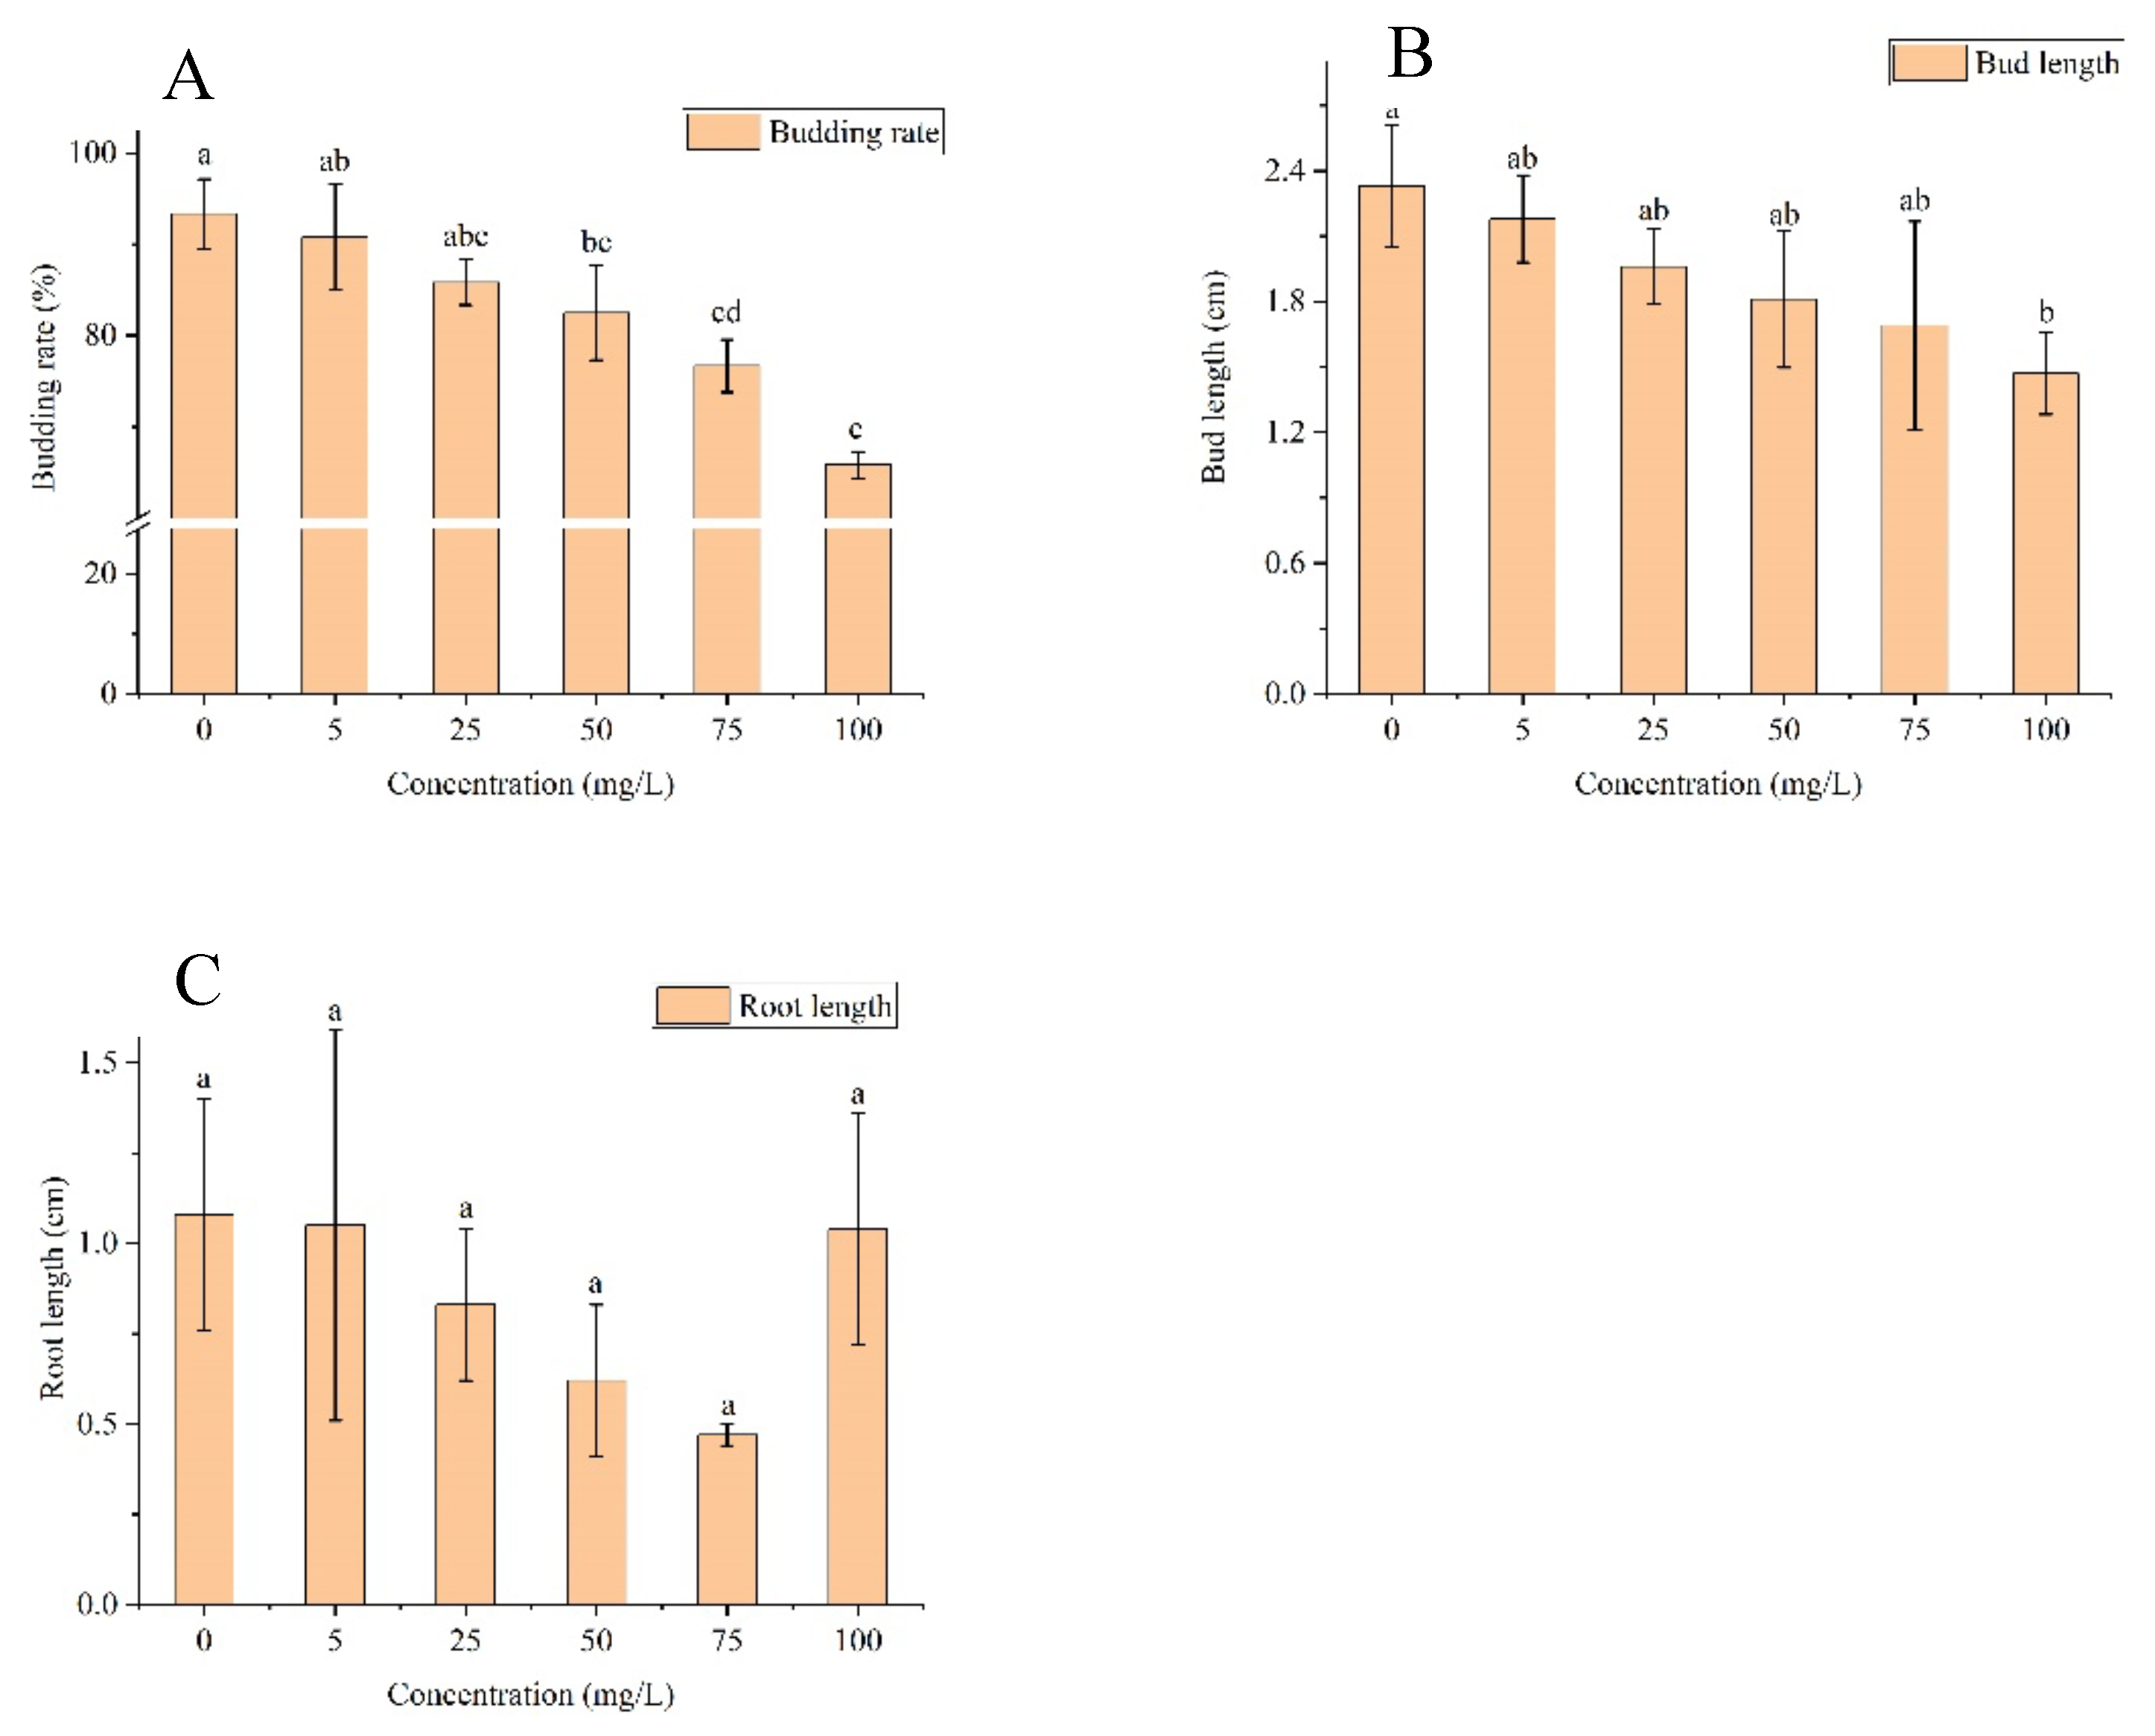
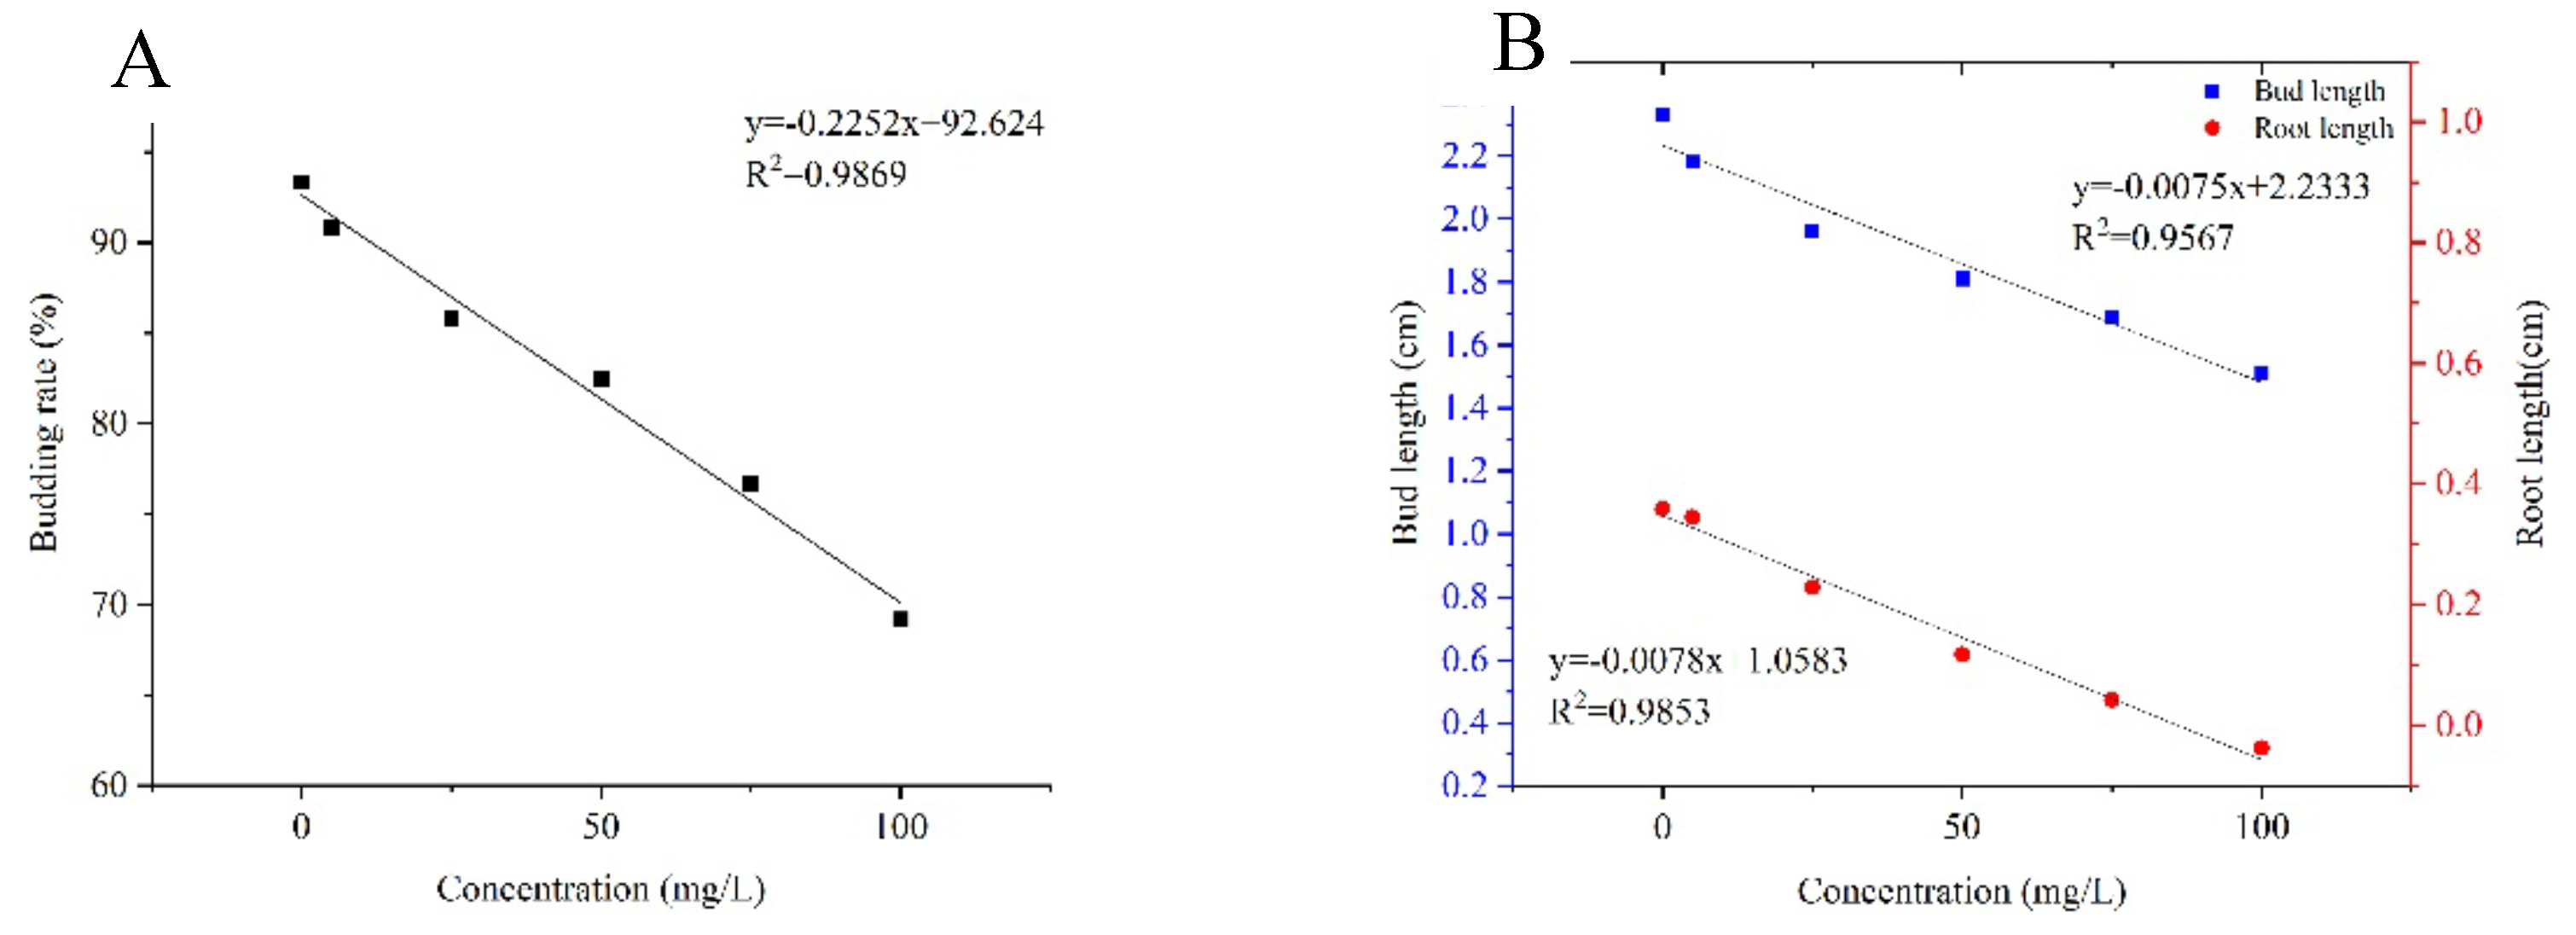
Study on the degradability of prometryn degrading strains. The results of the sensitive concentration tests on the effect of paraquat on maize seed germination are shown in
Figure 4. The concentration at which the germination rate, shoot length and root length of the seeds were selected to be significantly different for subsequent experiments was 100 mg/L. The sensitive concentration at which the effect of paraquat on maize seed germination rate and shoot length was significantly different at the (p<0.05) level compared to the no-herbicide added group.
With the addition of degrading strains, the germination of corn seeds was repaired. In the initial concentration of prometryn 100 mg/L, the germination rate, bud length and root length of the control group were significantly lower than those of the blank group. After the treatment of degrading strains T6-2 and T7-2, the germination rate and root length of corn seeds treated with T6-2 and T7-2 were significantly higher than those of the control group; Compared with the control group, the bud length of T6-2 treatment and T7-2 treatment increased by 7.28% and 13.25% respectively. (
Figure 5)(
Table 3)
Pan-genome sequencing of prometryn degrading strains. According to the previous results, it is proved that strains T6-2 and T7-2 have degradation effects on prometryn. In order to study their degradation genes, the pan-genome sequencing of T6-2 and T7-2 was carried out. A 300 bp library was constructed for each strain, sequenced on the Illumina sequencing platform and quality controlled using Trimmomatic (v0.36) software. 3.5×10⁶ raw sequences were obtained for strain T6-2 and 3.4*106 raw sequences for strain T7-2.
The COG database can be divided into a total of 25 categories according to function, with 9160 genes annotated into COGs for strain T6-2, 823 genes (8.98%) for G: Carbohydrate transport and metabolism, and 823 genes (8.98%) for E: Amino acid transport and metabolism had 850 genes or 9.28%, and K: Transcription had 813 genes or 8.88%. Strain T7-2 had 7445 genes annotated into the COG, 702 genes (9.43%) in R: general function prediction only, 646 genes (8.68%) in E: amino acid transport and metabolism and 640 genes (8.60%) in K: transcription.
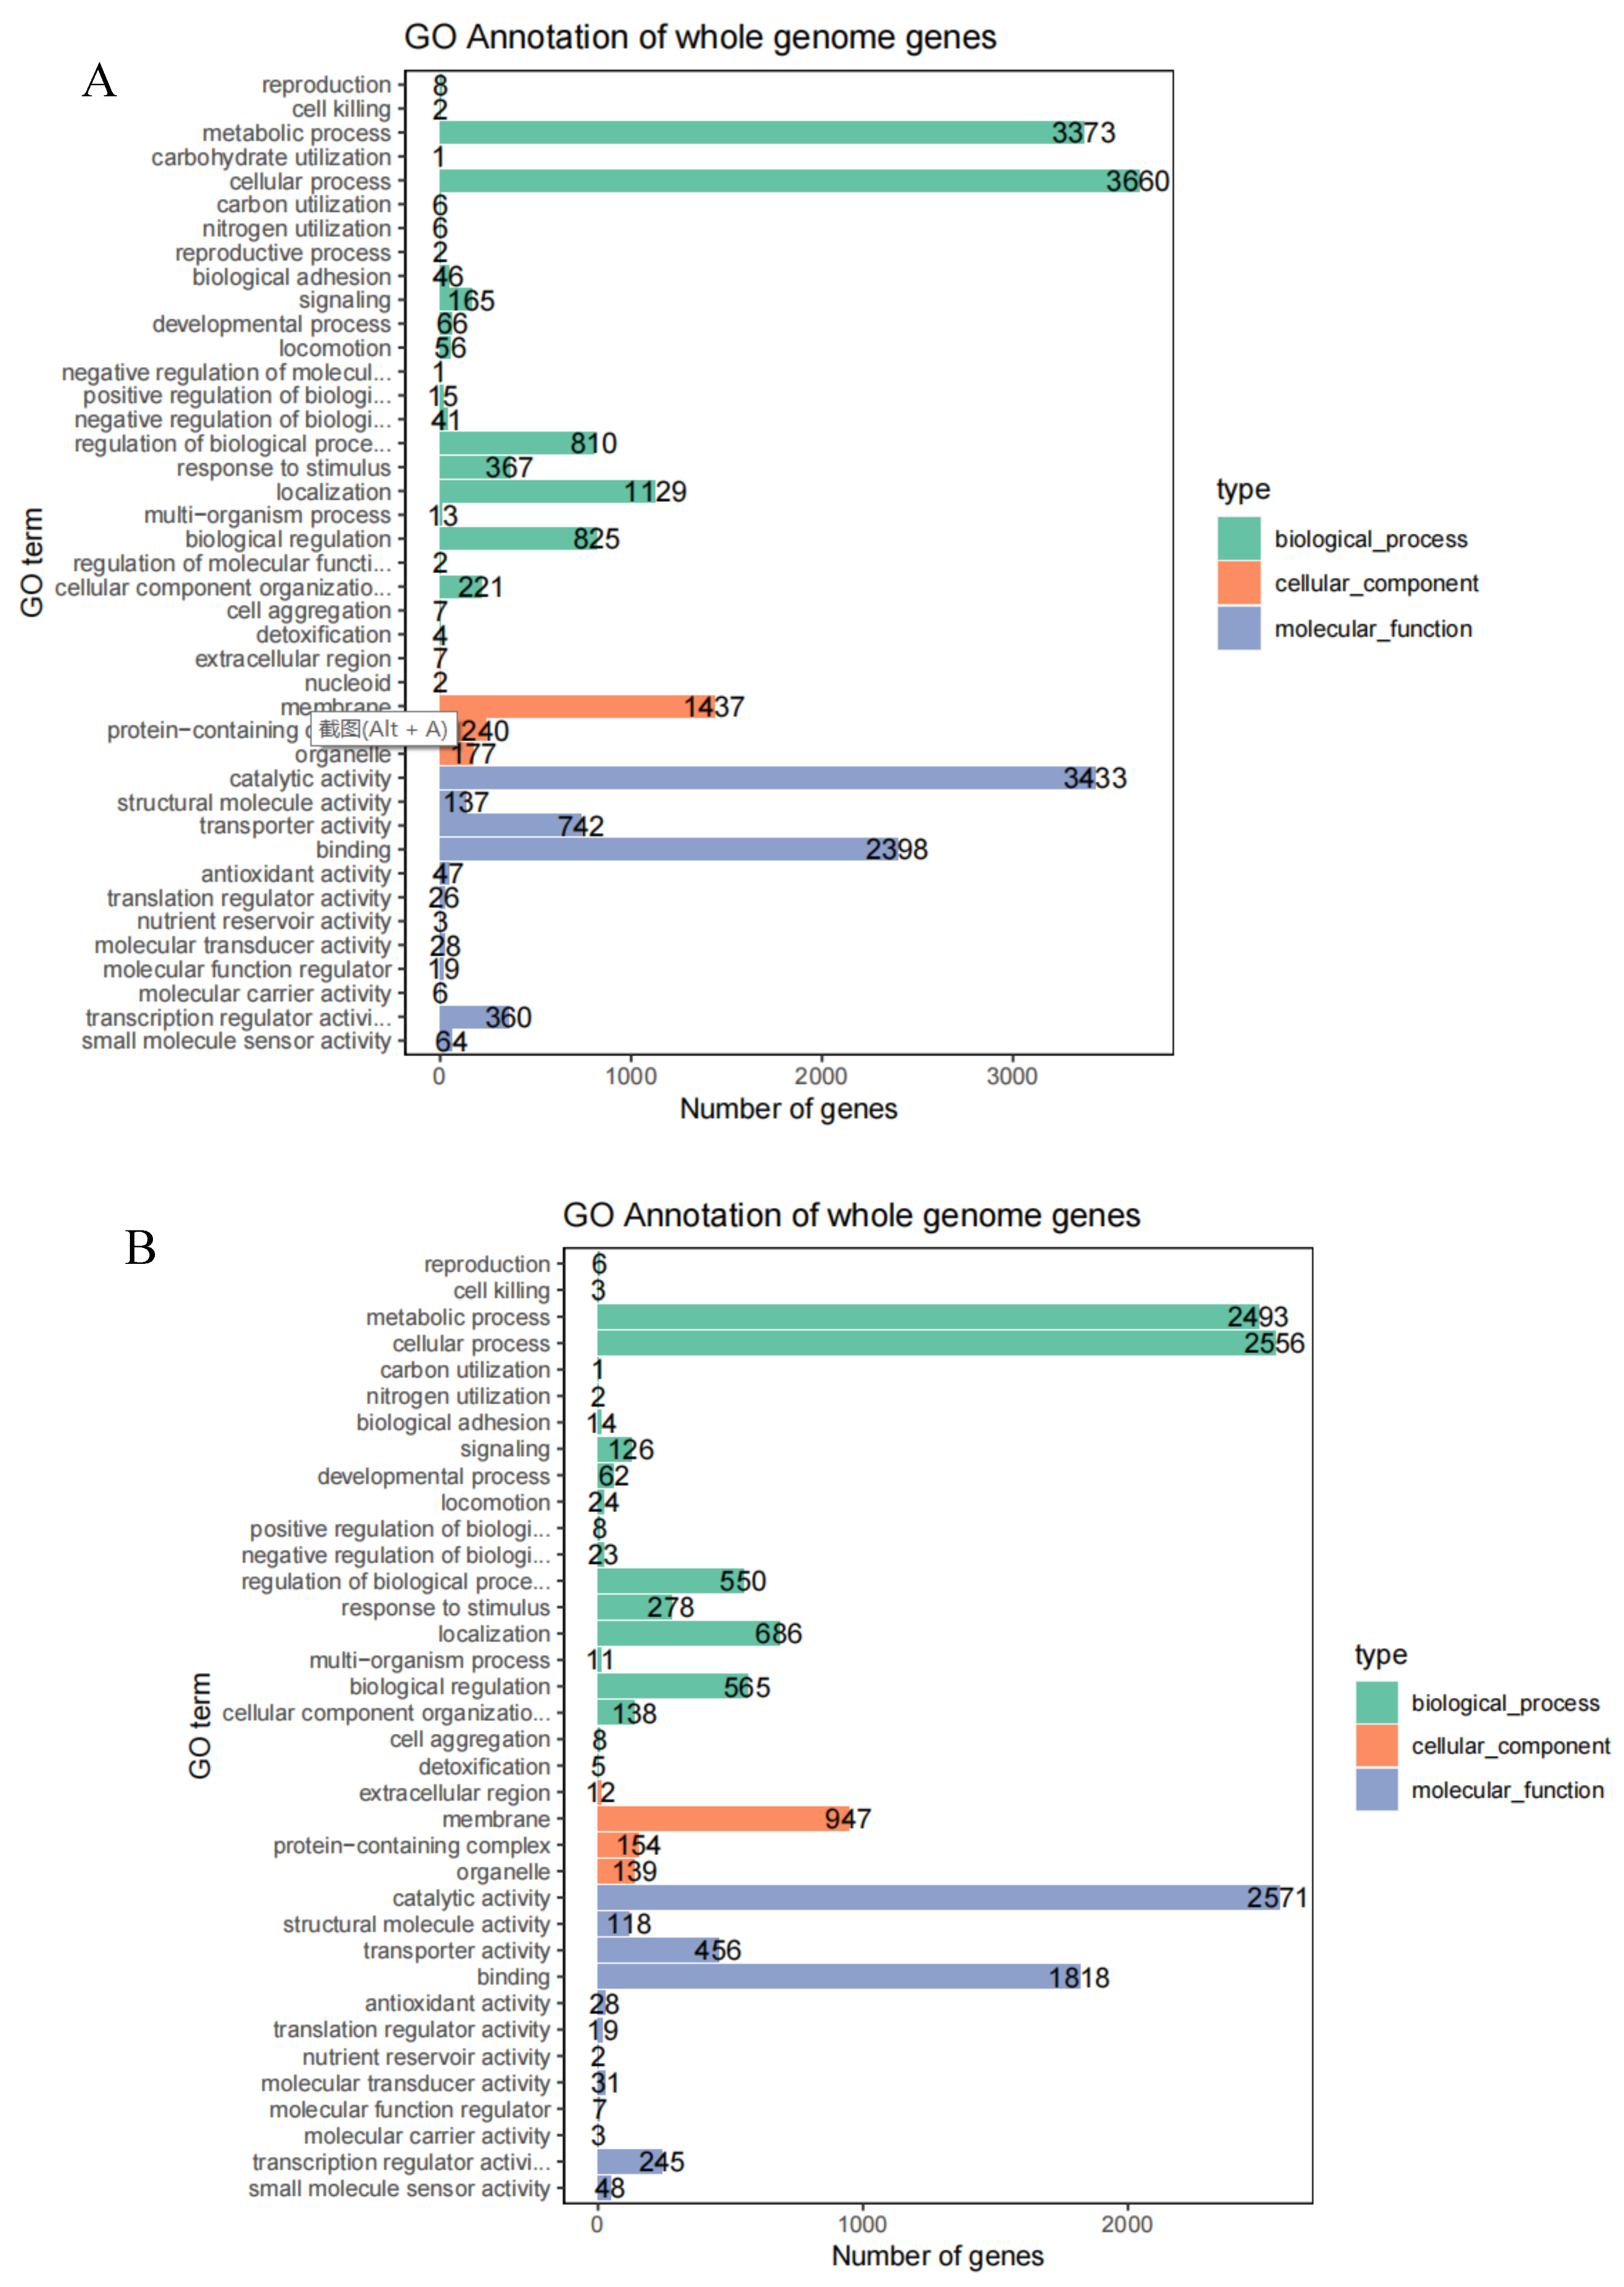
The GO database has three major classification statistics (
Figure 6). The strain T6-2 genes were classified into 40 functions, of which 10826 gene orders belonged to biological processes, 1863 to cellular components and 9126 to molecular functions. The genes involved in biological processes were the most numerous, with metabolic process accounting for 15.46%, carbohydrate utilization for 16.78%, localization for 5.18%, biological regulation for 3.78% and regulation of biological process accounted for 3.71%; membranes accounted for 6.59%, protein-containing complex accounted for 1.10%, organelle accounted for 0.81%; catalytic activity accounted for 15.74%, binding accounted for 10.99%, 3.40% for transporter activity and 1.65% for transcription regulator activity. The strain T7-2 genes were divided into 36 functions, of which 7559 gene orders belonged to biological processes, 1252 gene orders belonged to cellular components and 5346 gene orders belonged to molecular functions. The genes involved in biological processes were the most numerous, with metabolic process accounting for 17.61%, cellular process for 18.05%, regulation of biological process for 3.89%, localization for 4.85% and biological regulation for 3.99%. extracellular region was 0.08%, membrane was 6.69%, protein-containing complex was 1.09% and organelle was 0.98%; catalytic activity was 3.22% and the percentage of binding was 12.84%, transporter activity was 3.40%, structural molecule activity was 0.83% and transcription regulator activity was 163%.
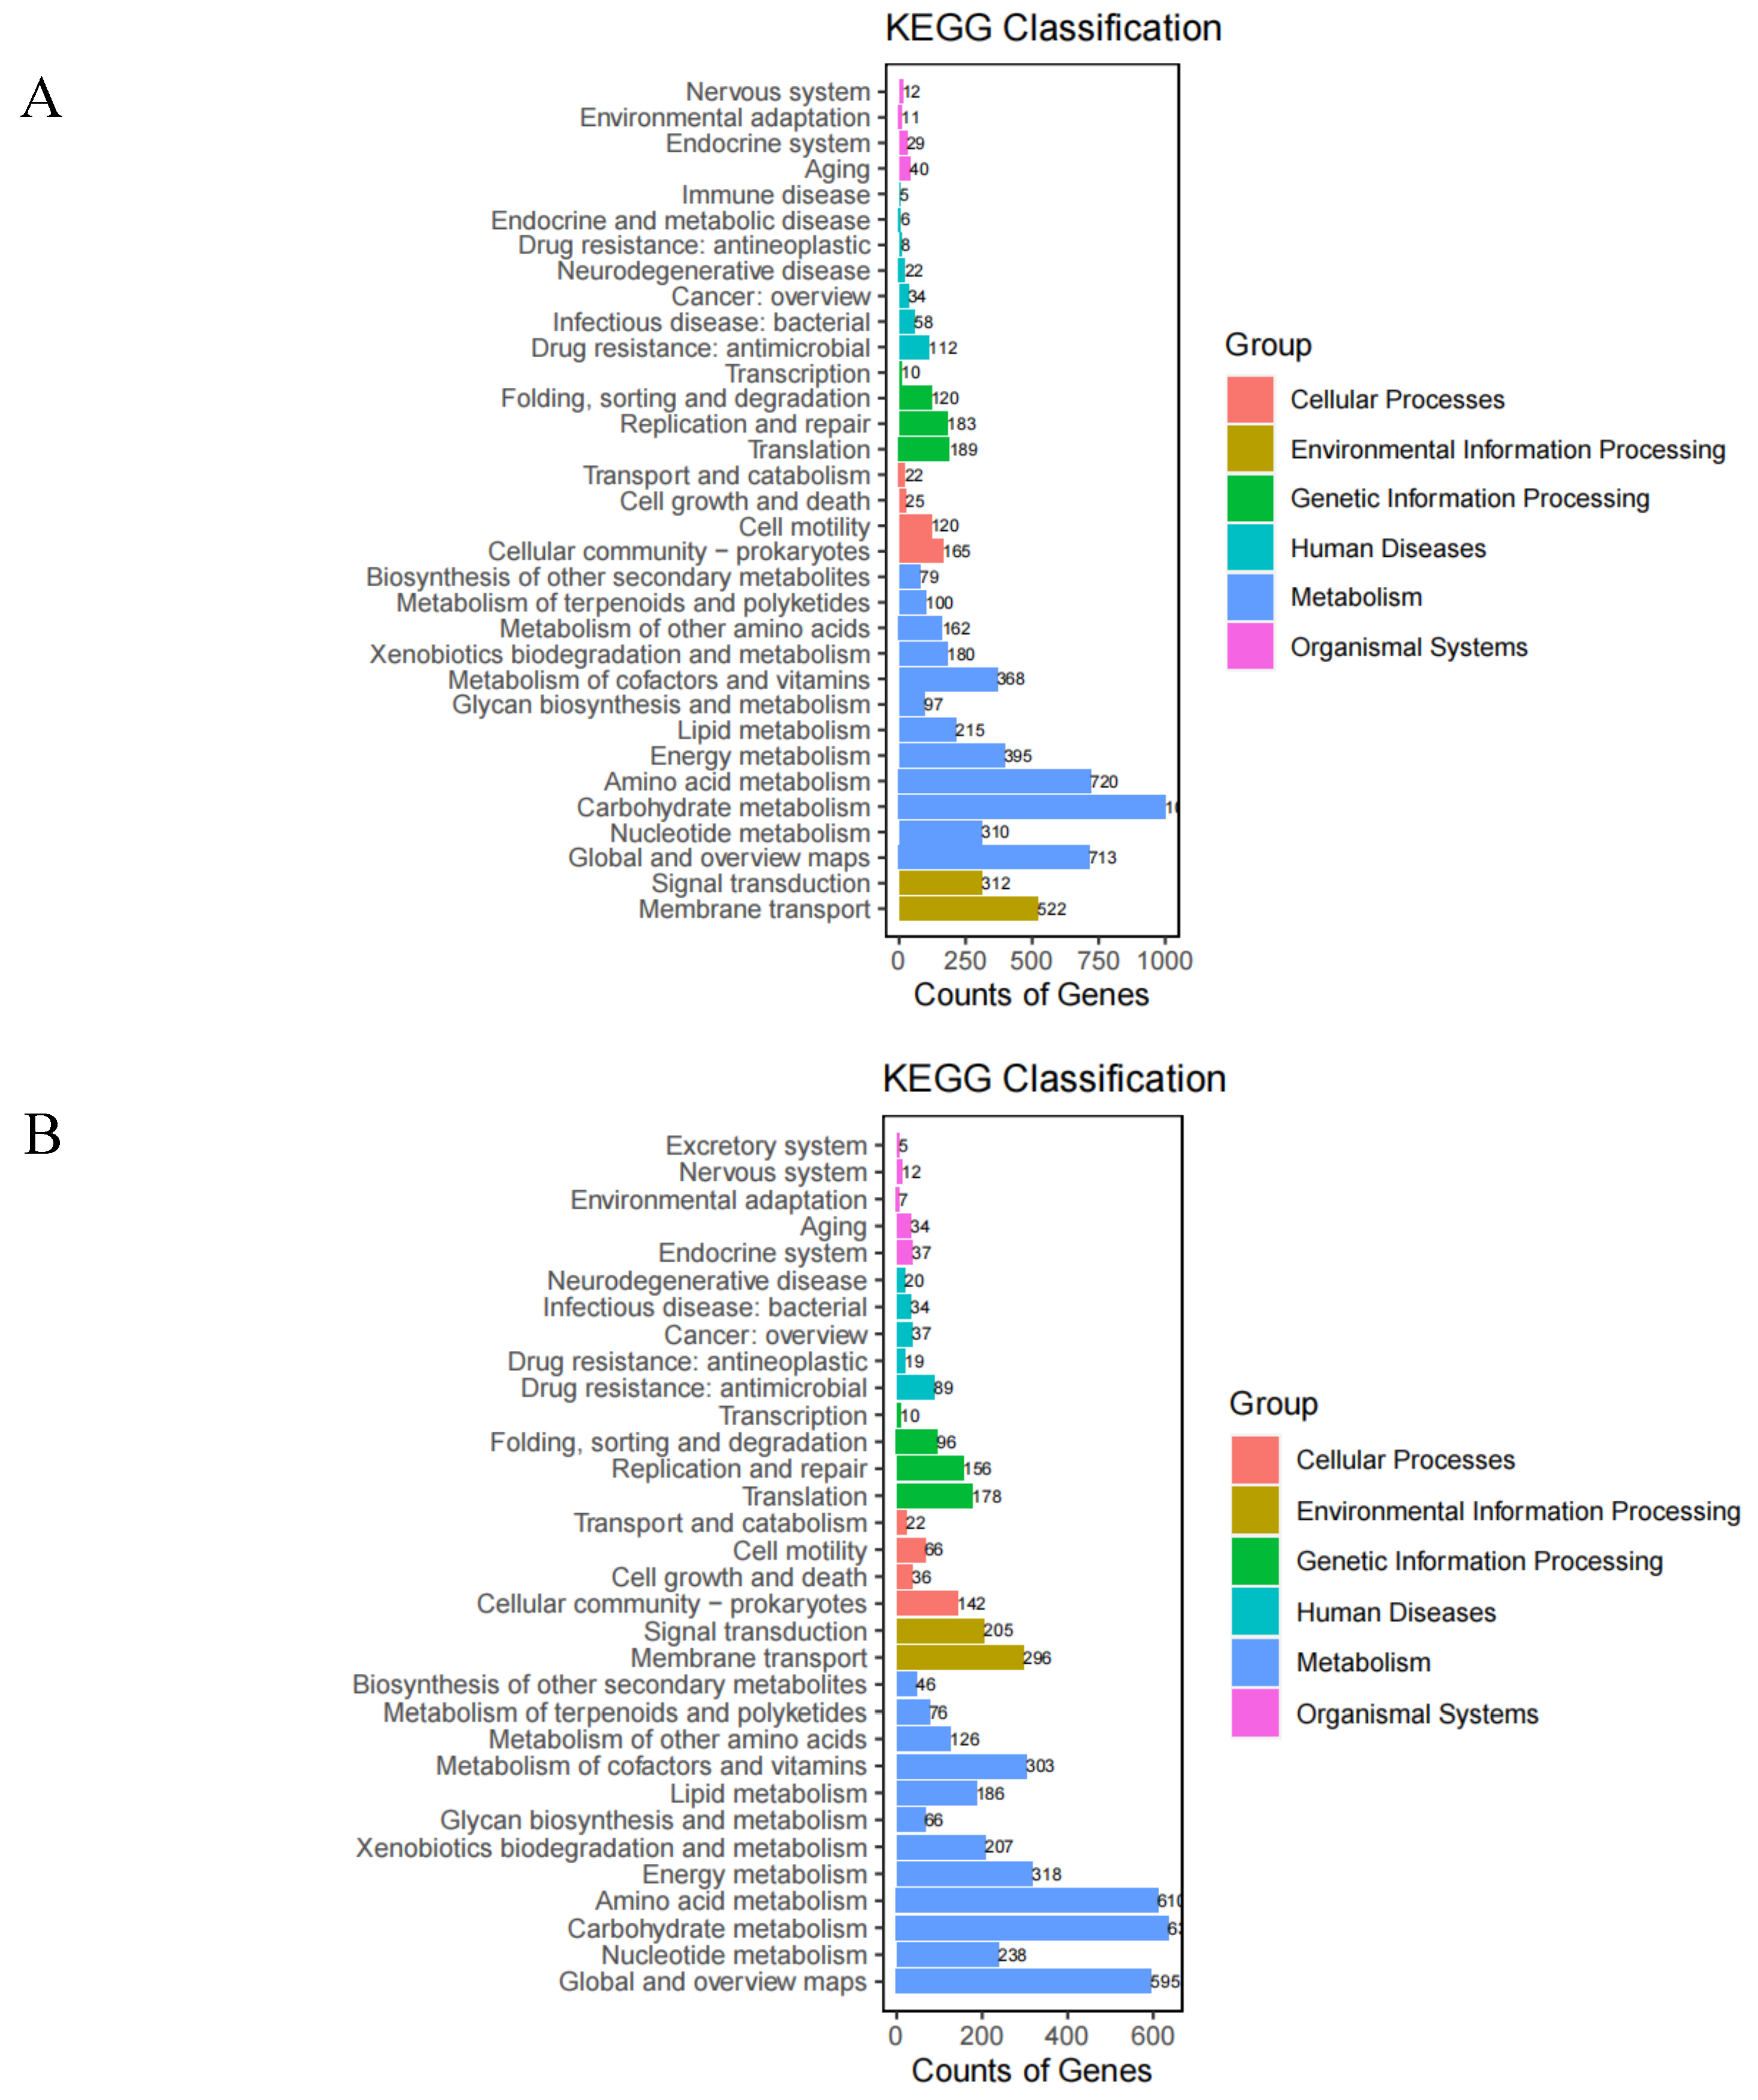
Statistics on the nu mber of annotated genes in the KEGG database (
Figure 7) showed that the highest number of genes for metabolism-related pathways and the lowest number for organismal systems. Strain T6-2 had 158 metabolic pathways with 6345 annotated genes, 320 genes for amino acid metabolism (11.35%), 713 genes for global and general overview maps (11.24%), 368 genes for cofactor and vitamin metabolism (5.98%) and 1001 genes for KEGG annotated carbohydrate metabolism (15.78%), mainly involved in pyruvate metabolism (106 genes, ko00620), glycolysis/gluconeogenesis (98 genes, ko00010) and amino- and nucleotide sugar metabolism (98 genes, ko00520). Strain T7-2 had 144 metabolic pathways with 4908 annotated genes, 610 genes for amino acid metabolism (12.43%), 318 genes for energy metabolism (6.48%), 303 genes for cofactor and vitamin metabolism (6.07%) and 636 genes for carbohydrate metabolism (12.96%) in KEGG annotated metabolism, mainly involved in pyruvate metabolism (90 genes, ko00620), glycolysis/gluconeogenesis (78 genes, ko00010) and propionate metabolism (78 genes, ko00640).
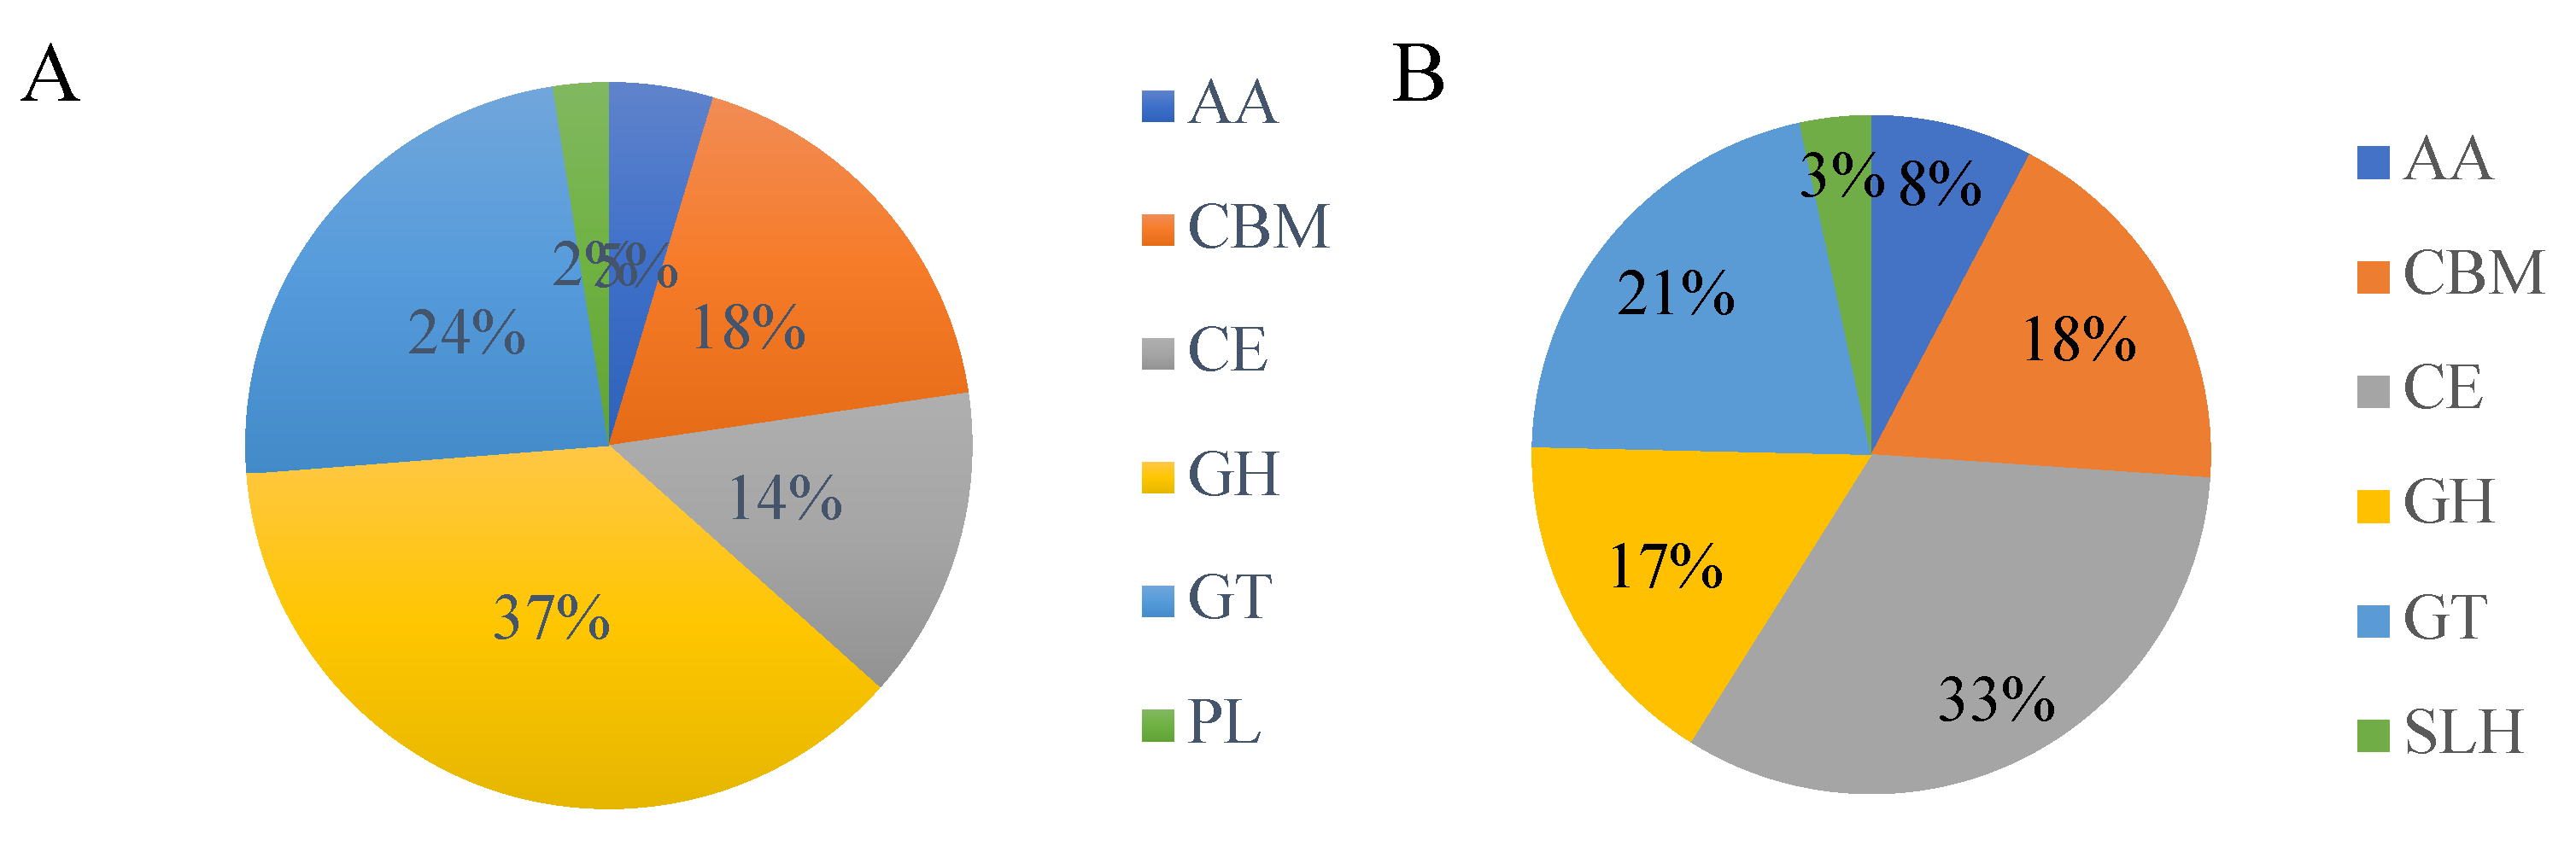
The annotated profile of carbohydrate-active enzyme genes was obtained by annotating the whole genome protein sequence with CAZyme and statistically (
Figure 8) shown. Strain T6-2 yielded 366 carbohydrate-related enzymes, of which 37% were glycoside hydrolases (GHs), 24% were glycosyltransferases (GTs), 18% were carbohydrate-binding enzymes (CBMs) and 14% were carbohydrate esterases (CEs). Strain T7-2 obtained 207 carbohydrate-related enzymes, of which 17% were glycoside hydrolases, 21% were glycosyltransferases, 18% were carbohydrate-binding enzymes and 33% were carbohydrate esterases.
The current key enzymes regarding the metabolism of herbicides by degrading bacteria contain hydrolases, dehydrogenases, decarboxylases, oxidoreductases, esterases, cytochrome P450 and others. In this study, genome-wide analysis of strains T6-2 and T7-2 was carried out, and gene function annotation was performed through KEGG, GO, COG, CAZymes and other databases. Based on these annotations this study screened for relevant degradation enzymes.
The degradation genes identified in strain T6-2 were aceE, aceF,pdhC, pdhD and DLD, por, YciA, alkB, atzE, feaB, ribA, oll, cypD-E , bioI. The degradation genes found in strain T7-2 were korA, aceE, aceF and pdhC, pdhD and DLD, alkB, BCG9842-B4061, BenA, pcaH, atzB, cypD-E, antA and est.
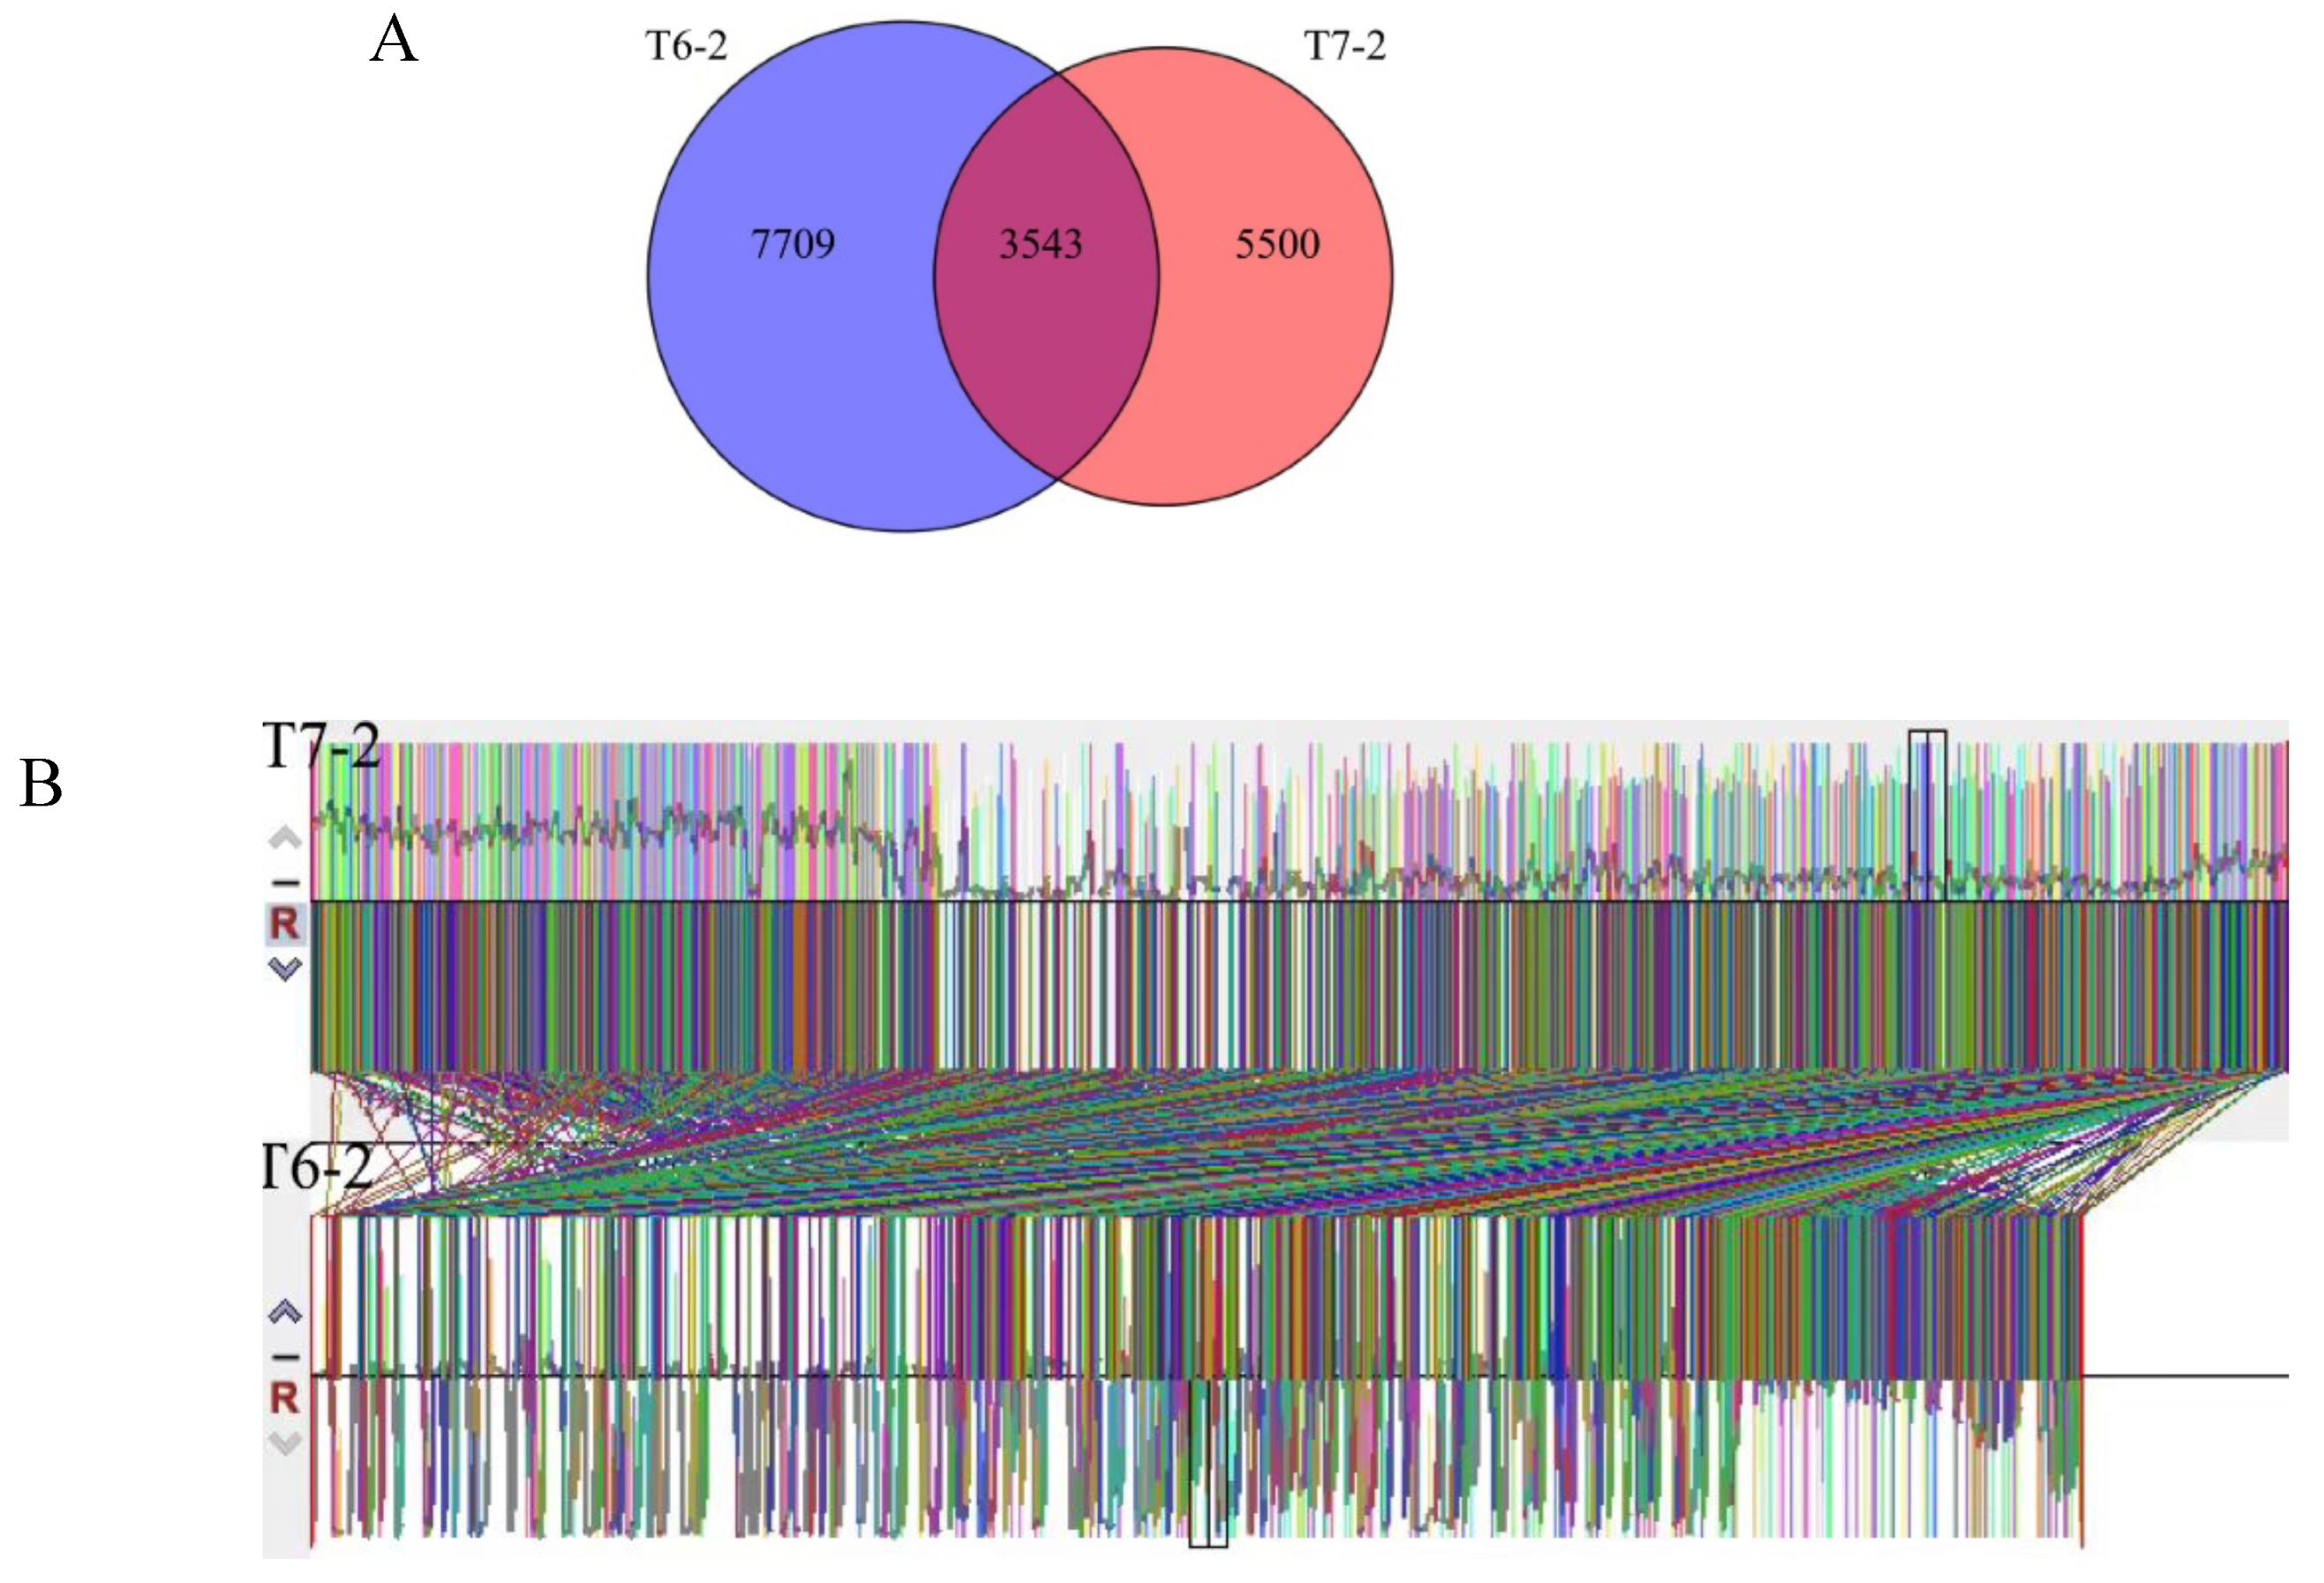
Genomic ollinearity analysis of prometryn degrading strains. Covariance is the presence of a degree of linear correlation between the independent variables that can have an impact on the variables’ contribution to the model. That is, if there is covariance between two variables, the effect of one of the variables will be relatively weaker while the effect of the other will be relatively stronger after the interactions have been calculated. Analysis of covariance allows analysis of regions of covariance and non-covariance between different versions of the genome. In this study, the regions of covariance of T6-2, T7-2. Strains T6-2 and T7-2 contain 5500 and 7709 unique genes respectively, with 3543 genes in common, and it is speculated that there are 3543 genes that can degrade prometryn. (
Figure 9)