
Submitted:
09 January 2025
Posted:
10 January 2025
You are already at the latest version
Abstract
Background: Prostate cancer (PCa) is the second most prevalent solid tumor among men globally and the leading non-skin cancer in American men. In 2020 alone, approximately 1.4 million new cases of prostate cancer were diagnosed worldwide, representing 14.1% of all new cancer cases in men. This multifactorial disease exhibits substantial variation in incidence and mortality across different ethnic groups and geographic regions. Although prostate-specific antigen (PSA) remains widely used as a biomarker for PCa, its limitations reduce its effectiveness for accurate detection. Consequently, finding biomarkers that can either complement or replace PSA is a major goal in PCa research. Methods: Urine samples were collected from healthy individuals (n=5) and patients with low- and high-risk PCa (4 and 7 subjects, respectively) and were analyzed using proteomic data-derived systems biology approaches. The most promising potential biomarkers were further investigated using The Cancer Genome Atlas (TCGA) database to assess their associations with clinical and histopathological characteristics in a larger in silico patient population. Results: In addition to describing the variations of the urinary proteome, the integration of protein profiles, network models and TCGA database has highlighted new potential biomarkers, including CPM, KRT8, ITIH2 and RCN1 that could enhance PCa management. Conclusions: Our findings support the technical feasibility of this combined approach for biomarker discovery and suggest further investigation into specific urinary proteins as potential novel biomarkers in larger patient cohorts.
Keywords:
Prostate cancer
; Urine
; Proteomics
; Network analysis
; Hubs
; TCGA
1. Introduction
According to estimates from the International Agency for Research on Cancer, over 19 million new cancer cases and nearly 10 million cancer-related deaths occurred globally in 2020 [1]. Prostate cancer (PCa) is the second most frequent cancer in men and the fifth leading cause of cancer death [2]. The initial evaluation for PCa typically begins with a digital rectal examination (DRE) and a prostate-specific antigen (PSA) test [3]. Following this, around 12 tissue samples are generally collected from the prostate gland via a biopsy, either using transrectal ultrasound (TRUS) guidance or MRI-targeted fusion techniques. A definitive diagnosis of PCa is made by microscopic examination of these samples, with the assignment of a Gleason score (GS) [4], as recommended by current medical guidelines. After diagnosis, imaging of the pelvic region or entire body may be performed using multi-parametric MRI (mpMRI), computed tomography (CT), or positron emission tomography (PET). Risk stratification is then applied using established algorithms like D’Amico, International Society of Urological Pathology (ISUP), National Comprehensive Cancer Network (NCCN), and Cancer of the Prostate Risk Assessment (CAPRA) [5]. PSA, a protein produced by the prostate gland, is commonly used as a marker for prostate health, with its levels measured by immunoassay. Elevated PSA levels may indicate conditions such as benign prostatic hyperplasia or PCa. Prostate biopsy remains the gold standard for confirming a prostate cancer diagnosis, though it is invasive and carries a post-biopsy sepsis risk of up to 2.4%. Furthermore, the PROMIS trial found that this method underestimated clinically significant PCa, defined as a Gleason score of ≥4+3 or a maximum cancer core length of 6 mm or more, in 18% of cases [6].
Like many types of cancer, prostate cancer is asymptomatic in its early stages. It is characterized by various clinical, pathological, and molecular features, necessitating the development of personalized and integrated molecular approaches for improved diagnosis, treatment, and prognosis [7,8,9,10,11]. To achieve this goal, new diagnostic strategies are evaluating the use of mRNA [12] and miRNA [13] biomarkers, as well as the combination of MRI and artificial intelligence (AI) systems [14]. Moreover, modern proteomics is facilitating the shift from relying on a single marker, such as PSA, to utilizing panels of biomarkers. This transition aims to enable earlier and more accurate diagnosis [15]. Biomarker discovery has been conducted through the analysis of biological fluids like serum [11,16], plasma [16,17] and urine [18,19], as well as by characterizing the proteome of tissue biopsies [20,21]. Additionally, the analysis of extracellular vesicle [22,23], including exosomes [24,25], is increasingly being adopted for this purpose.
Although most studies aim to identify biomarkers for early diagnosis, some of them have also turned their attention to shedding light on the mechanisms underlying tumor development [26,27], while others have sought to correlate biomarker profiles with tumor aggressiveness [28,29]. However, few studies have considered the reconstruction of protein-protein interaction (PPI) network models, which reveal the relationships between proteins [30,31]. In the present study, we analyzed urine samples from healthy donors (HDs) and PCa patients at the proteomics level, categorizing them based on clinical Gleason scores into low-risk (LRPCa) and high-risk PCa (HRPCa) groups. In addition to identifying potential biomarkers linked to disease stages, we used the identified proteins to reconstruct PPI network models for each group [32]. These models were analyzed both functionally, to identify PPI modules, and topologically, to select key regulatory proteins, or "hubs" and "bottlenecks," that play critical roles in the underlying biological systems [33].
2. Materials and Methods
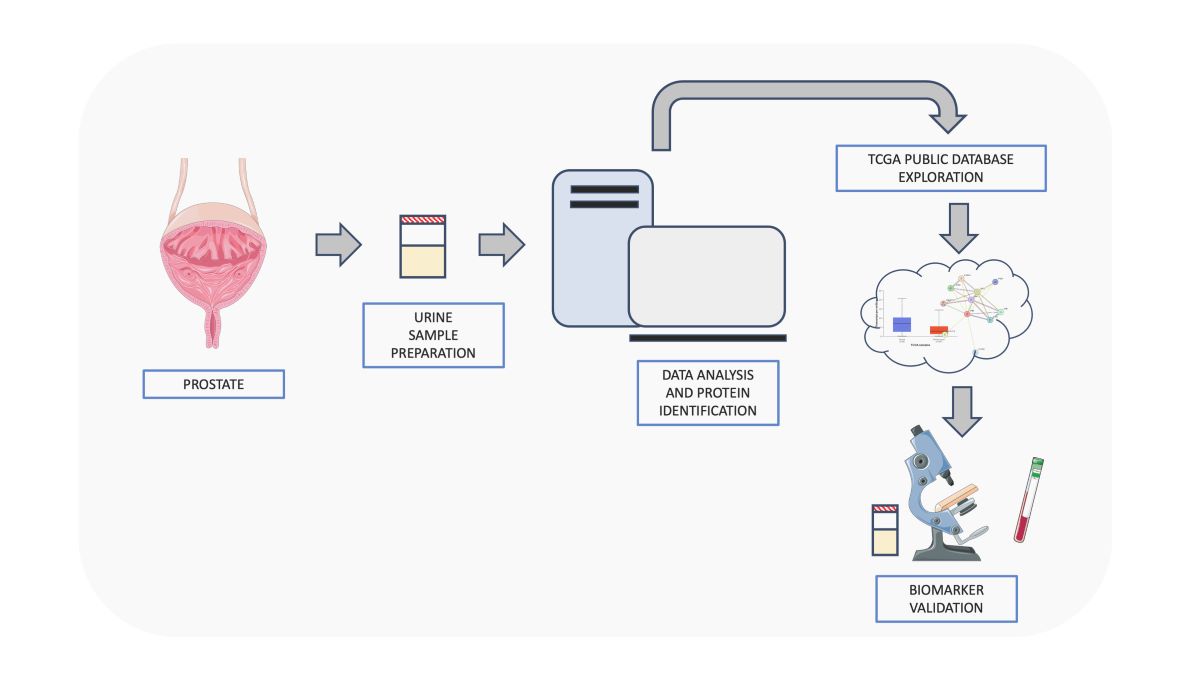
2.1. Sample Collection and Isolation of Total Proteins from Urine
A total of 16 participants were included in this study. Urine samples were collected from five HDs with a mean age of 29 ± 3 years, four individuals with LRPCa with a mean age of 66 ± 10 years and GS < 7, and seven individuals with HRPCa with a mean age of 64 ± 9 years and GS > 7. Total proteins were isolated from 1mL of urine using the Urine Protein Concentration Micro Kit (Cat# 17400) (Norgen Biotek, Thorold, ON, Canada). The isolation was performed according to the manufacturer’s instructions.
2.2. Protein Extraction and Enzymatic Digestion
Two hundred microliters per protein sample, collected at the end of isolation, were concentrated to 50 L in a vacuum concentrator at 60 °C and treated with RapiGestTMSF reagent (Waters Co, Milford, MA, USA) at the final concentration of 0.25% (w/v). The resulting suspensions were incubated under stirring at 100 °C for 20 minutes. Subsequently, the samples were cooled to room temperature and centrifuged 10 min at 2200 g. The protein concentration was assayed using the Invitrogen Qubit Protein BR Assay Kit (Life Technologies Corporation, Thermo Fisher, Eugene, ORE, USA) and 50 g proteins from each sample were digested overnight at 37 °C by adding Sequencing-grade Modified Trypsin (Promega Inc., Madison, WI, USA) at an enzyme/substrate ratio of 1:50 (w/w) in 0.1 M NH4HCO3 pH 7.9 buffer with 10% CHap 3CN. An additional aliquot of trypsin (1:100 w/w) was then added the next day, and the digestion continued for 4h. The enzymatic digestion was chemically stopped by acidification with 0.5%Trifluoroacetic Acid (TFA) (Sigma-Aldrich Inc., St. Louis, MO, USA), and a subsequent incubation at 37 °C for 45 minutes completed the RapiGest acid hydrolysis. Water immiscible degradation products were removed by centrifugation at 13,000 rpm for 10 minutes. Finally, the tryptic digest mixtures were desalted using PierceTM C-18 spin columns (Thermo Fisher Scientific, Pierce Biotechnology, Rockford, Il, USA), according to manufacturer protocol and were resuspended in 0.1% formic acid (Sigma-Aldrich Inc., St. Louis, MO, USA) in water (LC-MS Ultra CHROMASOLV™, Honeywell Riedel-de HaenTM, Muskegon, MI, USA) at a concentration of 0.1 g/L.
2.3. Proteomic Analysis by nanoLC-MS/MS
The nanoLC-MS/MS experiments were performed using the LTQ-Orbitrap XL-ETD mass spectrometer (Thermo Fisher Scientific, San José, CA, USA) coupled with Eksigent nanoLC-Ultra® 2D System (Eksigent, part of AB SCIEX Dublin, CA, USA) configured in trap-elute mode. Briefly, samples (0.8g injected) were first loaded on a trap (200 m x 500 m ChromXP C18-CL, 3 m, 120 Å) and washed with the loading pump running in isocratic mode with 0.1% formic acid in water for 10 minutes at a flow of 3 L/min. The automatic switching of auto-sampler ten-port valve then eluted the trapped mixture on a nano reversed phase column (75 m x 15 cm ChromXP C18-CL, 3 m, 120 Å) through a 130 minutes gradient of eluent B (eluent A, 0.1% formic acid in water; eluent B, 0.1% formic acid in acetonitrile) at a flow rate of 300 nL/min. In depth, gradient was: from 5-10% B in 5min, 10-40% B in 85min, 40-95% B in 27 min and holding at 95% B for 10 min. The eluated peptides were directly analyzed into a LTQ-Orbitrap XL-ETD through a nanoelectrospray ion source (Thermo Fisher Scientific); each sample was analyzed in at least 3 technical replicates. The spray capillary voltage was set at 1.7 kV and the ion transfer capillary temperature was held at 220 °C. Full MS spectra were recorded over a 400–1600 m/z range in positive ion mode, with a resolving power of 30000 (full width at half-maximum) and a scan rate of 2 spectra/s. This step was followed by five low-resolution MS/MS events that were sequentially generated in a data-dependent manner on the top five ions selected from the full MS spectrum (at 35% collision energy), using dynamic exclusion of 0.5 min for MS/MS analysis. Mass spectrometer scan functions and high performance liquid chromatography solvent gradients were controlled by the Xcalibur data system version 1.4 (Thermo Fisher Scientific, MA, USA).
2.4. MS/MS Data Processing
The Raw files collected following the analysis by LTQ-Orbitrap XL-ETD were processed by SEQUEST HT algorithm and Proteome Discoverer 2.5 software (Thermo Fisher Scientific, CA, USA). The corresponding experimental MS/MS spectra were compared against the theoretical mass spectra predicted by in silico digestion of Homo sapiens protein sequences downloaded from UNIPROT (www.uniprot.org) in December 2023. The following criteria of searching were set: trypsin enzyme, three missed cleavages per peptide, mass tolerances on precursor ions was set to ±100 ppm, while ±0.8 Da were set for fragment ions. Percolator node was used with a target-decoy strategy to give a final false discovery rates (FDR) ≤0.01 (strict) based on q-values, considering maximum deltaCN of 0.05. Only peptides with minimum peptide length of six amino acids, confidence at "Medium" level and rank 1 were considered. Protein grouping and strict parsimony principle were applied.
2.5. Enrichment Analysis
A preliminary functional evaluation of the characterized protein profiles was performed by functional annotation tool contained in STRING database [34]. For each subject, the enriched COMPARTMENTS, GO Biological Process (BP), GO Molecular Function (MF), GO Cellular Component (CC), KEGG, Reactome and WikiPathways were extracted (FDR≤0.05). They were compared by linear discriminant analysis (LDA) and those with F ratio ≥3.5 and P-value ≤0.05 were selected as differentially enriched among HD, LRPCa and HRPCa groups. Finally, they were represented by tree charts built using the ggtree and ggplot2 R package [35] and Circos tool [36].
2.6. Label-Free Quantitative Analysis
The protein profiles characterized by LC-MS analysis were semi-quantitatively compared by a label-free approach, as previously reported [33]. The Peptide Spectrum Matches (PSMs) values were normalized using a total signal normalization method [37]. Data matrix dimensionality (16 subjects and 2490 proteins) was reduced by LDA and proteins with F ratio ≥3.5 and P-value ≤0.05 were selected as differentially abundant (DAPs). To recover protein not selected by LDA due to high within-group variation, we performed a further DAPs extraction by taking into account the protein Identification Frequency (IF); specifically, we retained as DAPs those with IF>50% at least in one group, and IF<50% in one of the others. Selected DAPs were further processed by Principal Component Analysis (PCA) and Spearman’s correlation. Finally, pairwise comparisons (HD vs LRPCa; HD vs HRPCa and LRPCa vs HRPCa) were evaluated by DAve index:
where A and B represent the conditions compared); conventionally, the DAve index of proteins exclusively identified only in one of the conditions under comparison was set to ±2. Specifically, positive DAve values indicate proteins up-regulated in A (and down-regulated in B), while negative DAve values indicate proteins up-regulated in B (and down-regulated in A); a -0.4≥DAve≥0.4 was considered. All data processing were performed using JMP 15.2 SAS software.
2.7. Reconstruction of PPI Network Model and Functional Modules Identification
A PPI network model was reconstructed by STRING Cytoscape’s APP [34] starting from DAPs selected by LDA (n=141); only protein-protein interactions "databases" and/or "experiments" annotated, with a Score ≥0.3 and ≥0.15 were retaining. The proteins were grouped in PPI functional modules by the support of STRING Cytoscape’s APP and BINGO 2.44 [38]; as for BINGO 2.44, Homo sapiens organism, hypergeometric test and Benjamini–Hochberg FDR correction (≤0.01) were set.
2.8. Topological Analysis of PPI and Co-Expression Network Models
A PPI network model per group was reconstructed starting from proteins respectively found in at least 3 up to 5 HD subjects, at least 2 up to 4 LRPCa subjects and at least 4 up to 7 HRPCa subjects. The reconstructed HD, LRPCa and HRPCa PPI network models were analyzed at topological level by Centiscape Cytoscape’s APP [39], as previously reported [40]. Diameter, Average Distance, Degree, Betweenness, Centroid, Stress, EigenVector, Bridging, Eccentricity, Closeness, Radiality and Edge centralities were calculated. Betweenness coupled with Centroid and Betweenness coupled with Bridging were used to select hubs and bottlenecks, respetively; specifically, node with both values above the average were retained [32]. Statistical significance of topological results was tested by randomized network models [41]; n=1000 random models per group were reconstructed and analyzed by in house R scripts based on VertexSort (to build random models), igraph (to compute centralities), and ggplot2 (to plot results) libraries.
2.9. TCGA Bioinformatic Analysis
To investigate the correlation between proteomic findings and clinicopathological characteristics, we analyzed proteins predominantly expressed in urine samples from HDs compared to those with a PCa diagnosis, using data from The Cancer Genome Atlas (TCGA) and the UALCAN public library [42]. Additionally, we examined protein expression differences between urine samples from individuals with LRPCa and those with high-risk prostate cancer HRPCa, also utilizing the TCGA database and UALCAN platform. This two-step approach allowed us to assess associations between protein expression profiles and disease severity, aiding in the identification of potential biomarkers linked to clinical risk. UALCAN is a premier public resource to further explore TCGA gene expression data. UALCAN allows analysis of relative expression across cancer and normal samples, as well as indifferent cancer subgroups based on individual cancer clinicopathological information. The Tumor Immune Estimation Score TIMER 2.0 database was used to analyze the association between predominantly expressed genes and immune infiltration [43].
3. Results
A cohort of 16 subjects including 5 HDs, 4 subjects with LRPCa and 7 subjects with HRPCa was investigated.
3.1. Protein Profiling of Urine from Healthy Controls and Patients Affected by Prostate Cancer at Low- and High-Risk Level
After performing 48 nLC-hrMS/MS runs of urine samples from PCa patients and HDs, 2490 distinct proteins were identified, each confirmed by at least one unique peptide. The complete protein profile of each subject is provided in Table S1. A comparison of the average protein profiles for HDs, LRPCa, and HRPCa was conducted using Spearman’s correlation (Figure 1A). The HD proteome exhibited a low correlation with HRPCa (r = 0.35) and an even lower correlation with LRPCa (r = 0.22). As expected, LRPCa and HRPCa had the highest correlation (r = 0.42), reflecting the similarities between the two PCa groups. These differences between the groups were further emphasized in a Venn diagram, which shows the number of shared and group-specific proteins (Figure 1B). In detail, 284 proteins were common across all groups, while 435, 660, and 732 proteins were unique to HD, LRPCa, and HRPCa, respectively. Notably, HDs shared fewer proteins with LRPCa (n = 59) than with HRPCa (n = 151), while 169 proteins were shared between LRPCa and HRPCa.
3.2. Differentially Abundant Proteins (DAPs) by Comparing Urine Protein Profiles from Healthy Controls and Patients Affected by Prostate Cancer at Low- and High-Risk Level
The comparison of HD, LRPCa, and HRPCa profiles began with a Venn diagram and the identification frequency (IF) of group-specific proteins. By focusing on proteins present in at least 40% subjects per group, a set of proteins was selected to characterize the urinary profiles of HD (CPM, HAVCR2, CD84, DDHD1, SDC1), LRPCa (ITIH2, COL5A1-AS1, IGHV1OR15-1), and HRPCa (HELZ, DBI, CALM3, CPQ, PKG2, HMGCS2, CFAP43, MIA), as shown in (Figure 1B). Carboxypeptidase M (CPM), Inter-Alpha-Trypsin Inhibitor Heavy Chain 2 (ITIH2) and Helicase With Zinc Finger (HELZ) were identified with the highest frequency in HDs (IF=100%), LRPCa (IF=100%) and HRPCa (IF=57%), respectively. Cofilin-1 (CFL1) also emerged as a potential biomarker for HRPCa, being present in almost all HRPCa cases (IF = 86%), while found in only 25% of LRPCa cases and absent in HDs Table S2. Additionally, ITIH2 has already been suggested as a potential urinary biomarker for PCa [44], and Hydroxymethylglutaryl-CoA synthase (HMGCS2) has been observed to be significantly elevated at both the transcript and protein levels in HGPCa human tissues [45,46].
Besides using identification frequency (IF) to select potential markers, a further set of differentially abundant proteins (DAPs) was identified by processing peptide spectrum matches (PSMs) through Linear Discriminant Analysis (LDA) and DAve index [33,47]. This approach revealed 101 differentially abundant proteins (P ≤0.05), and when combined with those selected based on IF, a total of 141 DAPs were identified Table S2. Hierarchical clustering revealed that subjects were correctly grouped according to their clinical classification. Interestingly, two main branches emerged: one consisting of HDs and the other comprising PCa patients (Figure 1C). This grouping was further supported by principal component analysis (PCA) (Figure 1D), where PC1, accounting for 65.4% of the variance, distinguished HDs from PCa patients, while PC2 primarily separated LRPCa from HRPCa patients.
In addition to ITIH2, LRPCa patients showed a higher abundance of Serpin Family C Member 1 (SERPINC1), Complement C3 (C3), and Immunoglobulin Heavy Variable 1/OR15-1 (IGHV1OR15-1), with SERPINC1 [48] and Complement C3 [49] previously associated with PCa. In contrast, apart from HELZ, which was detected in 4 out of 7 HRPCa patients (and absent in HDs and LRPCa), no other proteins were uniquely abundant in HRPCa subjects. Rather than the presence of new biomarker proteins, both LRPCa and HRPCa patients showed a reduction in certain proteins (e.g., PVR, MXRA8, CPM, and EGF) that were present in HDs urine. Notably, reduced urinary EGF levels have been associated with various kidney disorders [50]. CPM and Pro-epidermal growth factor (EGF) have been linked in urine, with CPM serving as the major EGF-metabolizing enzyme in these fluids [51].
3.3. Functional Modules Marking the Urine Proteome of Healthy Controls and Patients Affected by Prostate Cancer at Low- and High-Risk Level
To gain further insights into the biological roles of the protein profiles from the urine of HDs, LRPCa and HRPCa subjects, we conducted an enrichment analysis based on GO Biological Process, GO Molecular Function, GO Cellular Component, Compartment, and Pathways (Figure 2 and Table S3). This analysis revealed enrichment in keratinocyte and epithelial differentiation processes in both LRPCa and HRPCa groups. Additionally, it highlighted biological processes related to cytoskeleton organization, supramolecular fibers, and intermediate filaments. In contrast, processes such as the regulation of lymphocyte activation and cell population proliferation were predominantly enriched in the HD group (Figure 2A).
The correlation between the immune system and HDs was reinforced by the enrichment of the "Immunoregulatory interactions between a Lymphoid and a non-Lymphoid cell" pathway (Figure 2B). Consistently, proteins with immunoglobulin-binding functions were enriched in HDs, while HRPCa showed an enrichment of lipase inhibitor activity and proteoglycan-binding functions (Figure 2C). Pathway analysis further highlighted the significance of cytoskeleton organization, angiogenesis (VEGFA-VEGFR2 signaling), and apoptosis (Signaling by Rho GTPases) in both LRPCa and HRPCa patients (Figure 2B). These functional insights were also reflected in the subcellular localizations most represented in the urinary profiles (Figure 2D-E). While structural proteins were more prevalent in LRPCa and HRPCa, the immunoglobulin complex and tertiary granule membrane were notably enriched in HDs. Interestingly, protease and peptidase inhibitors displayed a similar trend in both HDs and HRPCa subjects, but were significantly less enriched in LRPCa subjects. This trend ex-tended to other proteins and functional modules as well. To further investigate the functional groups characterizing the urine of HDs and PCa patients, the differentially abundant proteins (DAPs) were classified into 21 protein-protein interaction (PPI) functional modules (Figure 3). Rather than identifying new biomarkers, the analysis revealed a reduced release of proteins in PCa patients that were abundant in HDs, a trend that was evident at the system level as well. HD urines contained higher concentrations of consistent protein clusters involved in defense response, cell adhesion, and proteolysis. In addition to clusters associated with carbohydrate and lipid metabolism, HDs also displayed proteins potentially involved in angiogenesis inhibition, including MMRN2 [52], ROBO4 [53], MXRA8 [54] and CADM4 [55]). LRPCa patients, on the other hand, exhibited higher levels of proteins involved in the complement and coagulation cascade [48,56], keratins, actin cytoskeleton-related proteins and heat shock proteins (HSPs) [57]. These modules were even more abundant in HRPCa patients, alongside proteins related to heparan sulfate metabolism, chromatin organization, and glutathione metabolism. Interestingly, HRPCa patients showed complement and coagulation cascade levels similar to HDs, rather than LRPCa, indicating a distinct protein profile.
3.4. Network Hubs and Bottlenecks in Urine of Healthy Controls and Patients Affected by Prostate Cancer at Low- and High-Risk Level
To better understand the mechanisms behind the presence of proteins in the urine of HDs and PCa patients, we reconstructed and topologically analyzed a PPI network model for each group. The LRPCa and HRPCa networks exhibited high diameters and low average distances, combined with a higher average degree, suggesting an increased ability for proteins to communicate and a greater tendency to form functional modules (Figure 4A). In this context, hubs and bottlenecks represent key regulatory proteins that could play a major role in disease progression. After validating the networks through random models (Figure 4B),we identified 7 hubs/bottlenecks for HDs, 34 for LRPCa, and 29 for HRPCa (Figure 4C-E). Of note, 15 hubs/bottlenecks were in common between LRP and HRP (Table S4). Several of these proteins have previously been linked to PCa. Notably, components of the 14-3-3 protein family, including 14-3-3 protein theta (YWHAQ) [58], 14-3-3 protein beta/alpha (YWHAB) [59] and 14-3-3 protein sigma (SFN), were present, along with inflammation-related proteins such as Complement C3 (C3) and Antithrombin-III (SERPINC1) [48]. Microtubule-related proteins like Kinesin-like protein KIF23 (KIF23) [60] and Tubulin beta-4B chain (TUBB4B) [48] were also highlighted.
Heat shock proteins, particularly HSPA8 (found in both patient groups), as well as HSPA1B and HSPA1L, were key in LRPCa, reflecting the role of the HSP70 family in tumor cell survival [61]. Conversely, HRP networks were characterized by the presence of Heat shock protein HSP90-alpha (HSP90AA1) and HSP90-beta (HSP90AB1) [62], which are also important for cancer progression. In HRPCa, additional notable hubs included Agrin (AGRN) [40,63,64], Keratin, type I cytoskeletal 19 (KRT19) [65] and Keratin type II cytoskeletal 8 (KRT8) [66]. Among HD hubs/bottlenecks, two heparan sulfate proteoglycans, Syndecan-1 (SDC1) and Syndecan-4 (SDC4), emerged, which have been inversely associated with PCa aggressiveness [67]. Overall, LRPCa hubs/bottlenecks were enriched in functional categories such as cell cycle regulation, complement and coagulation cascades, immune system processes, and proteolysis. While these categories were also represented in HRPCa, there was a stronger focus on cell cycle processes, keratinization, and microtubule cytoskeleton organization.
3.5. TCGA Bioinformatic Analysis: HDs vs PCa
To investigate the correlation between proteomic findings and clinico-pathological characteristics, we analyzed proteins predominantly expressed in urine samples from HDs compared to those with a PCa diagnosis, using data from TCGA and the UALCAN public library (http://ualcan.path.uab).
Figure 5 A highlights the most prominently expressed and statistically significant proteins identified in urine samples from HDs compared to those from individuals diagnosed with PCa. Notably, Carboxypeptidase M (CPM) was detected in all urine samples from HDs (5 out of 5) and was entirely absent in samples from PCa patients (p = 0.00063, Table 1). As opposite, Keratin type II cytoskeletal 8 (KRT8) was predominantly found in 91% (10 out of 11) of urine samples from PCa patients and was not detected in those from HDs (p=0.0034).
Figure 5 B and F illustrate the TCGA expression data for CPM and KRT8, respectively, across a pan-cancer dataset, comparing expression levels in tumor tissues versus their normal counterparts. This analysis highlights distinct expression patterns for CPM and KRT8, suggesting their potential roles as biomarkers across various cancers. In PCa patients specifically, expression differences for both proteins were statistically significant (p = 3.13E-02 for CPM and p = 1.03E-06 for KRT8, shown in Figure 5 C and G, respectively). Further analysis of CPM expression in normal versus PCa tissues revealed statistically significant differences across several GS, including GS 6 (p = 4.66E-02), GS 7 (p = 4.61E-02), and GS 9 (p = 4.94E-02), (Figure 5 D). When examining CPM expression by nodal status, a significant difference was found between normal tissues and N0 status (p = 4.49E-02), though no significant differences were observed between normal and N1 or N0 and N1 (data not shown). Additionally, TIMER analysis indicated that CPM expression is correlated with immune cell infiltration, specifically with B cells, CD4+ T cells, CD8+ T cells, macrophages, neutrophils, and dendritic cells (Figure 5 E), suggesting a potential role for CPM in the tumor microenvironment and immune response. Also KRT8 expression in normal versus PCa tissues revealed statistically significant differences across GS, including normal prostate tissue versus GS 6 (p = 1.80E-05), GS 7 (p = 3.44E-08), GS 8 (p = 2.01E-04), GS 9 (p = 9.43E-04) and GS 7 versus GS 9 (p = 2.66E-03), (Figure 5 H). When examining KRT8 expression by nodal status, a significant difference was found between normal tissues and N0 status (p = 9.41E-07) and normal versus N1 status (p = 9.95E-04) (data not shown). Finally, like CPM, KRT8 expression resulted correlated with immune cell infiltration, specifically with B cells, CD4+ T cells, CD8+ T cells, macrophages, neutrophils, and dendritic cells (Figure 5 I).
3.6. TCGA Bioinformatic Analysis: LRPCa vs HRPCa
Following comparison of protein expression frequency in PCa samples classified as LRPCa versus HRPCa, we observed that ITIH2 was present in all LRPCa (4 out of 4) but absent in HRPCa samples (p = 0.034), while RCN1 was exclusively expressed in HRPCa (6 out of 7) and not in LRPCa samples (p = 0.034). These findings, illustrated in Figure 6 A and summarized in Table 2, suggest ITIH2 and RCN1 as potential distinguishing biomarkers for PCa risk stratification.
Figure 6 B and F show the TCGA expression data for ITIH2 and RCN1, respectively, across a pan-cancer dataset, comparing expression levels in tumor tissues versus their normal counterparts. This analysis highlights distinct expression patterns for ITIH2 and RCN1, suggesting their potential roles as biomarkers across various cancers. In PCa patients specifically, expression differences for both proteins were statistically significant (p = 7.70E-05 for ITIH2 and p = 5.08E-03 for RCN1, shown in Figure 6 C and G, respectively). Further analysis of ITIH2 expression in normal versus PCa tissues revealed statistically significant differences across several Gleason scores, including normal prostate tissue versus GS 7 (p = 7.01E-03), GS 8 (p = 1.23E-02), GS 9 (p = 1.41E-03), GS 6 versus GS 9 (p = 1.52E-02) And GS 9 versus GS 10 (p = 2.45E-02) (Figure 6 D). When examining ITIH2 expression by nodal status, a significant difference was found between normal tissues and N0 status (p = 5.22E-04), and normal tissue versus N1 status (p = 9.63E-03) (data not shown). Additionally, TIMER analysis indicated that ITIH2 expression is correlated with immune cell infiltration, specifically with B cells, CD4+ T cells, CD8+ T cells, macrophages, neutrophils, and dendritic cells (Figure 6 E), suggesting a potential role for ITIH2 in the tumor microenvironment and immune response. Also RCN1 expression in normal versus PCa tissues revealed statistically significant differences across several Gleason scores, including normal prostate tissue versus GS 6 (p = 7.56E-04) and GS 7 (p = 1.35E-04), GS 6 versus GS 9 (p = 1.17E-02) and GS 7 versus GS 9 (p = 1.97E-03) (Figure 6 H). When examining RCN1 expression by nodal status, a significant difference was found between normal tissues and N0 status (p = 1.29E-03), and normal tissue versus N1 status (p = 4.46E-02) (data not shown). Finally, like ITHI2, TIMER analysis indicated that RCN1 expression is correlated with immune cell infiltration, specifically with B cells, CD4+ T cells, CD8+ T cells, macrophages, neutrophils, and dendritic cells (Figure 6 I).
4. Discussion
The analysis of the urinary proteome from HDs and PCa patients enabled the identification of proteins that may play a crucial role in the pathogenesis of this tumor, based on their quantitative or topological significance. Many of these proteins, including YWHAQ [58], YWHAB [59], SERPINC1 [48], KIF23 [60], TUBB4B [48], AGRN [40,63,64], KRT19 [65], KRT8 [66], as well as members of the HSP70 [61] and HSP90 families [62], have already been correlated to PCa. Of note, KRT8, put under the magnifying light through TCGA analysis, encodes a cell surface protein commonly observed in PCa and recently linked to the expression of the non-coding RNA LINC00624, which may play a role in promoting PCa progression [68]. This overlap validates the effectiveness of our approach in selecting pertinent proteins by integrating quantitative proteomics and network analysis. Conversely, the findings that have not yet been associated with PCa provide a valuable source of targets for future research.
In terms of diagnostic potential, our study aimed not only to identify new biomarkers present in the urine of PCa patients but also to highlight proteins found in healthy subjects that showed decreased abundance in disease states. In this scenario, ITIH2 was specifically detected in the urine of LRPCa patients and has been proposed as a potential urinary biomarker for PCa [44]. Supporting our findings, Lima et al. previously identified ITIH2 as a potential urinary biomarker for PCa, observing a similar trend where ITIH2 expression decreased in tumor tissues, with distinct differences between adjacent normal tissue, LRPCa, and HRPCa samples. In their study, ITIH2 was dysregulated in PCa patient urine compared to healthy controls and benign prostatic hyperplasia (BPH) cases, although specific variations and fold changes were not fully quantified.
The strongest candidates for HRPCa patients were RCN1, CFL1 and HELZ, which were found in 6, 6 and 4 out of 7 HRPCa subjects, respectively. RCN1, a protein associated with both endothelial and PCa cell lines, has been linked to cancer progression. While primarily examined RCN1 at the RNA level in a non-linear cancer progression model, our findings at the protein level offer further insights [69]. Additionally, research by Liu et al. suggests that RCN1 may play a role in promoting cell survival, highlighting its potential as a therapeutic target in cancer treatment [70]. Similarly, CFL1 has been previously identified in tissue from HRPCa patients [71], although it was not shown to be a strong candidate biomarker for enhancing diagnostic accuracy in the early detection of PCa [57]. Nevertheless, the detection of CFL1 in urine [72], along with the reduced levels of EGF [50], has been associated with various glomerular and non-glomerular kidney disorders. Notably, both EGF and carboxypeptidase M (CPM), which were most abundant in our HDs, have been correlated in urine. In fact, CPM metabolize EGF to produce des-Arg53-EGF [51]. In lung adenocarcinomas, des-Arg53-EGF binds to the EGF receptor (EGFR), and tissue expression of CPM has been negatively correlated with disease survival [73]. Moreover, CPM plays a key role in several physiological processes, including blood coagulation and fibrinolysis, inflammation, digestion, and the processing of pro-hormones and neuropeptides. Of particular interest is CPM’s constitutive expression in active form on the surface of specialized cells and tissues throughout the body, suggesting its potential significance as a health-associated marker [74]. Interestingly, no studies have yet connected HELZ to PCa or its presence in urine.
To explore the molecular processes that are dysregulated in PCa patients, our study emphasized the topological relevance of the identified proteins within a network framework, positioning urine as a reflection of alterations in prostate tumor tissue. In addition to microtubule-related proteins, such as KIF23 [60] and TUBB4B [48], which could easily be related to proliferative processes, the LRPCa group exhibited the involvement of several proteins from the HSP70 family, including HSPA1L and HSPA8. Previous research has indicated that these proteins contribute to tumor cell survival [61], making them potential therapeutic targets. Conversely, the HRPCa group was characterized by the presence of HSP90 family components as hubs; their increased expression in PCa has been linked to resistance to denervation as well as promoting tumor resistance, invasion, and bone metastasis [62]. Within the network analysis results, we confirmed several proteins previously identified as hubs or bottlenecks in PCa, including AGRN [40], KRT19 [65] and KRT8 [75]. AGRN has been identified as a substrate of KLK14 [63], and the CDC5L-AGRN circuit has been proposed as crucial for the oncogenic role of NEAT1 in PCa cells [64]. Keratins have been correlated with PCa [66] and are more strongly associated with cancer cell invasion and metastasis [76]. However, unlike studies on bladder cancer [77], there has been limited investigation into their presence in the urine of PCa patients as potential diagnostic biomarkers. Our attention was also drawn to the presence of two heparan sulfate proteoglycans, SDC1 and SDC4, as hubs and bottlenecks in the HDs network. SDC1 plays a critical role in cell adhesion and maintaining epithelial integrity. Farfan et al. identified ZEB1 as a key repressor of SDC1 during PCa progression, highlighting that SDC1 expression is inversely related to PCa aggressiveness [67]. Other studies have associated the overexpression of SDC4 transcripts with better prognosis, while SDC1 is linked to more aggressive tumors and poorer prognosis [78].
Overall, a significant number of topologically relevant proteins were associated with the cell cycle in both LRPCa and HRPCa patients. Additionally, proteins were identified in biological processes related to proteolysis, immune response, and complement and coagulation cascades. The involvement of the complement and coagulation cascade has been documented in both PCa and prostate benign tissues, as well as in groups with varying metastatic tendencies [48]. It has also emerged as a proteomic signature of PCa in peripheral blood [56]. Quantitatively, we found that complement and coagulation cascades were characteristic of urine from LRPCa patients; however, corresponding proteins were not as abundantly represented in HRPCa. The modulation of the complement system during the early stages of PCa may play a significant role in the tumor microenvironment and immune evasion, providing a mechanism for disease progression. Differently, glutathione metabolism emerged as a hallmark of HRPCa. This pathway has been highlighted in other studies, which identified hubs enriched in glutathione metabolism by comparing the transcriptomes of PCa and adjacent normal tissues [79]. Recently, the diagnostic potential of GSTP1 methylation in serum has been explored [80]. However, both GSTP1 and GSTM2, which showed increased abundance in HRPCa, did not demonstrate significant correlations with PCa progression in urine samples [81]. Despite this, oxidative stress has been implicated in the initiation and progression of prostate carcinogenesis through various mechanisms [82].
Finally, in the urine of HDs, we identified proteins that may function as tumor suppressors and angiogenesis inhibitors. Among these, Cell adhesion molecule 4 (CADM4) has been shown to act as a tumor suppressor gene in multiple cancers, including PCa [83]. Roundabout homolog 4 (ROBO4), activated by Slit2 and Slit3, stabilizes the vascular network by inhibiting pathological angiogenesis and endothelial hyperpermeability [53,84]. Matrix remodeling-associated protein 8 (MXRA8) has been found to suppress angiogenesis by inhibiting endothelial cell migration and to enhance integrin-mediated apoptosis by suppressing AKT and p38 MAP kinase signaling [54]. However, contrary evidence has shown that the loss of MXRA8 in some cancers can reduce cell proliferation, delay tumor development, and diminish metastatic spread [85]. Similarly, contrasting findings have been reported for Multimerin-2 [52], where studies have indicated that MMRN2 interaction with CD93 promotes neovascularization [86].
5. Conclusions
Our study identified molecular processes that are dysregulated in the urine of PCa patients, serving as a reflection of the changes occurring in prostate tumor tissue. On the other hand, the combination of proteomic and and network analysis allowed the discovery of new putative biomarkers. We are well aware that the number of samples studied should be larger, since it is small, which could dilute some results and conclusions. However, the integration of our results with TCGA database and bioinformatic tools has preliminarly validated our findings across a broader in silico population, highlighting the potential of these approaches in selecting biomarkers that could improve diagnostic accuracy and guide treatment strategies.
Supplementary Materials
The following supporting information can be downloaded at the website of this paper posted on Preprints.org.
Author Contributions
“Conceptualization, D.DS., F.G., EM.B., G.T; methodology, R.R., I.Y., A.L., M.A.A.A.H; software, M.A.A.A.H., I.Y., A.L; formal analysis, R.R., EM.B, M.A.A.A.H., F.G., I.Y., A.L.,D.DS; resources, D.DS., PL.M., R.R., F.G., G.T; data curation, M.A.A.A.H., I.Y., A.L., D.DS; writing—original draft preparation, R.R., EM.B., F.G., D.DS; writing—review and editing, R.R., EM.B., F.G., G.T., PL.M., D.DS; supervision, D.DS; funding acquisition, PL.M., R.R., D.DS. All authors have read and agreed to the published version of the manuscript.”
Funding
This research was funded by Progetti di Ricerca@CNR 2021 (SAC.AD002.173), PRIN2022 (20228Z8C95)
Institutional Review Board Statement
The study was conducted in accordance with the Declaration of Helsinki, and approved by the Institutional Review Board (or Ethics Committee) of IRCCS Humanitas Research Hospital (Approval no. CE-ICH 260/11, 18/11/2011)
Informed Consent Statement
Informed consent was obtained from all subjects involved in the study
Data Availability Statement
Proteomics raw data used in this study have been deposited in MassIVE database ftp://MSV000096381@massive.ucsd.edu, password for reviewers: Urine_PCa24
Acknowledgments
We thank Valeria Bellettato for her administrative and technical support.
Conflicts of Interest
“The authors declare no conflicts of interest.”
Abbreviations
The following abbreviations are used in this manuscript:
| PCa | Prostate Cancer |
| PSA | Prostate-Specific Antigen |
| TCGA | The Cancer Genome Atlas |
| DRE | Digital Rectal Examination |
| TRUS | Transrectal Ultrasound |
| MRI | Magnetic Resonance Imaging |
| GS | Gleason Score |
| mpMRI | multi-parametric Magnetic Resonance Imaging |
| CT | Computed Tomography |
| PET | Positron Emission Tomography |
| ISUP | International Society of Urological Pathology |
| NCCN | National Comprehensive Cancer Network |
| CAPRA | Cancer of the Prostate Risk Assessment |
| AI | Artificial Intelligence |
| PPI | Protein-Protein Interaction |
| HDs | Healthy Donors |
| LRPCa | Low-risk PCa |
| HRPCa | High-risk PCa |
| TFA | Trifluoroacetic Acid |
| LC | Liquid Chromatography |
| MS | Mass Spectrometry |
| FDR | False Discovery Rates |
| LDA | Linear Discriminant Analysis |
| DAPs | Differentially Abundant Proteins |
| IF | Identification Frequency |
| PCA | Principal Component Analysis |
| DAve | Differential Average |
| PC | Principal Component |
| PSM | Peptide Spectrum Match |
| BPH | Benign Prostatic Hyperplasia |
References
- Sung, H.; Ferlay, J.; Siegel, R.L.; Laversanne, M.; Soerjomataram, I.; Jemal, A.; Bray, F. Global Cancer Statistics 2020: GLOBOCAN Estimates of Incidence and Mortality Worldwide for 36 Cancers in 185 Countries. CA: a cancer journal for clinicians 2021, 71, 209–249. [Google Scholar] [CrossRef] [PubMed]
- Kohaar, I.; Petrovics, G.; Srivastava, S. A Rich Array of Prostate Cancer Molecular Biomarkers: Opportunities and Challenges. International Journal of Molecular Sciences 2019, 20, 1813. [Google Scholar] [CrossRef] [PubMed]
- Ouyang, M.; Jia, M.; Chang, Z.; Wang, Y.; Wang, K.; Gao, X.; Tang, B. Precise prostate cancer diagnosis using fluorescent nanoprobes for detecting PSA and PSMA in serum. Chemical Communications 2024, 60, 5181–5184. [Google Scholar] [CrossRef]
- Humphrey, P.A.; Moch, H.; Cubilla, A.L.; Ulbright, T.M.; Reuter, V.E. The 2016 WHO Classification of Tumours of the Urinary System and Male Genital Organs—Part B: Prostate and Bladder Tumours. European Urology 2016, 70, 106–119. [Google Scholar] [CrossRef] [PubMed]
- Cooperberg, M.R. Clinical risk stratification for prostate cancer: Where are we, and where do we need to go? Canadian Urological Association Journal 2017, 11, 101. [Google Scholar] [CrossRef] [PubMed]
- Ahmed, H.U.; El-Shater Bosaily, A.; Brown, L.C.; Gabe, R.; Kaplan, R.; Parmar, M.K.; Collaco-Moraes, Y.; Ward, K.; Hindley, R.G.; Freeman, A.; et al. Diagnostic accuracy of multi-parametric MRI and TRUS biopsy in prostate cancer (PROMIS): a paired validating confirmatory study. The Lancet 2017, 389, 815–822. [Google Scholar] [CrossRef]
- Ghamlouche, F.; Yehya, A.; Zeid, Y.; Fakhereddine, H.; Fawaz, J.; Liu, Y.N.; Al-Sayegh, M.; Abou-Kheir, W. MicroRNAs as clinical tools for diagnosis, prognosis, and therapy in prostate cancer. Translational Oncology 2023, 28, 101613. [Google Scholar] [CrossRef]
- Morgan, R.; da Silveira, W.A.; Kelly, R.C.; Overton, I.; Allott, E.H.; Hardiman, G. Long non-coding RNAs and their potential impact on diagnosis, prognosis, and therapy in prostate cancer: racial, ethnic, and geographical considerations. Expert Review of Molecular Diagnostics 2021, 21, 1257–1271. [Google Scholar] [CrossRef] [PubMed]
- Montironi, R.; Cimadamore, A.; Lopez-Beltran, A.; Cheng, L.; Scarpelli, M. Update on Prostate Cancer Diagnosis, Prognosis, and Prediction to Response to Therapy. Cells 2020, 10, 20. [Google Scholar] [CrossRef]
- Faisal, F.A.; Lotan, T.L. The Genomic and Molecular Pathology of Prostate Cancer: Clinical Implications for Diagnosis, Prognosis, and Therapy. Advances in Anatomic Pathology 2019, 27, 11–19. [Google Scholar] [CrossRef] [PubMed]
- Minas, T.Z.; Candia, J.; Dorsey, T.H.; Baker, F.; Tang, W.; Kiely, M.; Smith, C.J.; Zhang, A.L.; Jordan, S.V.; Obadi, O.M.; et al. Serum proteomics links suppression of tumor immunity to ancestry and lethal prostate cancer. Nature Communications 2022, 13. [Google Scholar] [CrossRef]
- Modlin, I.M.; Kidd, M.; Drozdov, I.A.; Boegemann, M.; Bodei, L.; Kunikowska, J.; Malczewska, A.; Bernemann, C.; Koduru, S.V.; Rahbar, K. Development of a multigenomic liquid biopsy (PROSTest) for prostate cancer in whole blood. The Prostate 2024, 84, 850–865. [Google Scholar] [CrossRef] [PubMed]
- Coman, R.A.; Schitcu, V.H.; Budisan, L.; Raduly, L.; Braicu, C.; Petrut, B.; Coman, I.; Berindan-Neagoe, I.; Al Hajjar, N. Evaluation of miR-148a-3p and miR-106a-5p as Biomarkers for Prostate Cancer: Pilot Study. Genes 2024, 15, 584. [Google Scholar] [CrossRef] [PubMed]
- Saha, A.; Bosma, J.S.; Twilt, J.J.; van Ginneken, B.; Bjartell, A.; Padhani, A.R.; Bonekamp, D.; Villeirs, G.; Salomon, G.; Giannarini, G.; et al. Artificial intelligence and radiologists in prostate cancer detection on MRI (PI-CAI): an international, paired, non-inferiority, confirmatory study. The Lancet Oncology 2024. [Google Scholar] [CrossRef]
- Tanase, C.P.; Codrici, E.; Popescu, I.D.; Mihai, S.; Enciu, A.M.; Necula, L.G.; Preda, A.; Ismail, G.; Albulescu, R. Prostate cancer proteomics: Current trends and future perspectives for biomarker discovery. Oncotarget 2017, 8, 18497–18512. [Google Scholar] [CrossRef] [PubMed]
- Hamza, G.M.; Raghunathan, R.; Ashenden, S.; Zhang, B.; Miele, E.; Jarnuczak, A.F. Proteomics of prostate cancer serum and plasma using low and high throughput approaches. Clinical Proteomics 2024, 21. [Google Scholar] [CrossRef] [PubMed]
- Nordström, M.; Wingren, C.; Rose, C.; Bjartell, A.; Becker, C.; Lilja, H.; Borrebaeck, C.A.K. Identification of plasma protein profiles associated with risk groups of prostate cancer patients. PROTEOMICS – Clinical Applications 2014, 8, 951–962. [Google Scholar] [CrossRef]
- Shi, T.; Quek, S.I.; Gao, Y.; Nicora, C.D.; Nie, S.; Fillmore, T.L.; Liu, T.; Rodland, K.D.; Smith, R.D.; Leach, R.J.; et al. Multiplexed targeted mass spectrometry assays for prostate cancer-associated urinary proteins. Oncotarget 2017, 8, 101887–101898. [Google Scholar] [CrossRef] [PubMed]
- Frantzi, M.; Culig, Z.; Heidegger, I.; Mokou, M.; Latosinska, A.; Roesch, M.C.; Merseburger, A.S.; Makridakis, M.; Vlahou, A.; Blanca-Pedregosa, A.; et al. Mass Spectrometry-Based Biomarkers to Detect Prostate Cancer: A Multicentric Study Based on Non-Invasive Urine Collection without Prior Digital Rectal Examination. Cancers 2023, 15, 1166. [Google Scholar] [CrossRef] [PubMed]
- Lygirou, V.; Fasoulakis, K.; Stroggilos, R.; Makridakis, M.; Latosinska, A.; Frantzi, M.; Katafigiotis, I.; Alamanis, C.; Stravodimos, K.G.; Constantinides, C.A.; et al. Proteomic Analysis of Prostate Cancer FFPE Samples Reveals Markers of Disease Progression and Aggressiveness. Cancers 2022, 14, 3765. [Google Scholar] [CrossRef] [PubMed]
- Kawahara, R.; Recuero, S.; Nogueira, F.C.S.; Domont, G.B.; Leite, K.R.M.; Srougi, M.; Thaysen-Andersen, M.; Palmisano, G. Tissue Proteome Signatures Associated with Five Grades of Prostate Cancer and Benign Prostatic Hyperplasia. PROTEOMICS 2019, 19. [Google Scholar] [CrossRef] [PubMed]
- Dhondt, B.; Geeurickx, E.; Tulkens, J.; Van Deun, J.; Vergauwen, G.; Lippens, L.; Miinalainen, I.; Rappu, P.; Heino, J.; Ost, P.; et al. Unravelling the proteomic landscape of extracellular vesicles in prostate cancer by density-based fractionation of urine. Journal of Extracellular Vesicles 2020, 9. [Google Scholar] [CrossRef] [PubMed]
- Fujita, K.; Kume, H.; Matsuzaki, K.; Kawashima, A.; Ujike, T.; Nagahara, A.; Uemura, M.; Miyagawa, Y.; Tomonaga, T.; Nonomura, N. Proteomic analysis of urinary extracellular vesicles from high Gleason score prostate cancer. Scientific Reports 2017, 7. [Google Scholar] [CrossRef]
- Øverbye, A.; Skotland, T.; Koehler, C.J.; Thiede, B.; Seierstad, T.; Berge, V.; Sandvig, K.; Llorente, A. Identification of prostate cancer biomarkers in urinary exosomes. Oncotarget 2015, 6, 30357–30376. [Google Scholar] [CrossRef] [PubMed]
- Liu, P.; Wang, W.; Wang, F.; Fan, J.; Guo, J.; Wu, T.; Lu, D.; Zhou, Q.; Liu, Z.; Wang, Y.; et al. Alterations of plasma exosomal proteins and motabolies are associated with the progression of castration-resistant prostate cancer. Journal of Translational Medicine 2023, 21. [Google Scholar] [CrossRef]
- Aiello, D.; Casadonte, F.; Terracciano, R.; Damiano, R.; Savino, R.; Sindona, G.; Napoli, A. Targeted proteomic approach in prostatic tissue: a panel of potential biomarkers for cancer detection. Oncoscience 2016, 3, 220–241. [Google Scholar] [CrossRef] [PubMed]
- Latosinska, A.; Davalieva, K.; Makridakis, M.; Mullen, W.; Schanstra, J.P.; Vlahou, A.; Mischak, H.; Frantzi, M. Molecular Changes in Tissue Proteome during Prostate Cancer Development: Proof-of-Principle Investigation. Diagnostics 2020, 10, 655. [Google Scholar] [CrossRef] [PubMed]
- Desai, T.A. ; Hedman,.K.; Dimitriou, M.; Koprulu, M.; Figiel, S.; Yin, W.; Johansson, M.; Watts, E.L.; Atkins, J.R.; Sokolov, A.V.; et al. Identifying proteomic risk factors for overall, aggressive and early onset prostate cancer using Mendelian randomization and tumor spatial transcriptomics 2023. [CrossRef]
- Garcia-Marques, F.; Liu, S.; Totten, S.M.; Bermudez, A.; Tanimoto, C.; Hsu, E.; Nolley, R.; Hembree, A.; Stoyanova, T.; Brooks, J.D.; et al. Protein signatures to distinguish aggressive from indolent prostate cancer. The Prostate 2022, 82, 605–616. [Google Scholar] [CrossRef] [PubMed]
- CHEN, C.; SHEN, H.; ZHANG, L.G.; LIU, J.; CAO, X.G.; YAO, A.L.; KANG, S.S.; GAO, W.X.; HAN, H.; CAO, F.H.; et al. Construction and analysis of protein-protein interaction networks based on proteomics data of prostate cancer. International Journal of Molecular Medicine 2016, 37, 1576–1586. [Google Scholar] [CrossRef]
- Zhou, B.; Yan, Y.; Wang, Y.; You, S.; Freeman, M.R.; Yang, W. Quantitative proteomic analysis of prostate tissue specimens identifies deregulated protein complexes in primary prostate cancer. Clinical Proteomics 2019, 16. [Google Scholar] [CrossRef] [PubMed]
- Vella, D.; Zoppis, I.; Mauri, G.; Mauri, P.; Di Silvestre, D. From protein-protein interactions to protein co-expression networks: a new perspective to evaluate large-scale proteomic data. EURASIP journal on bioinformatics & systems biology 2017, 2017, 6. [Google Scholar] [CrossRef]
- Di Silvestre, D.; Brambilla, F.; Lavatelli, F.; Chirivì, M.; Canetti, D.; Bearzi, C.; Rizzi, R.; Bijzet, J.; Hazenberg, B.P.C.; Bellotti, V.; et al. The Protein Network in Subcutaneous Fat Biopsies from Patients with AL Amyloidosis: More Than Diagnosis? Cells 2023, 12. [Google Scholar] [CrossRef]
- Szklarczyk, D.; Gable, A.L.; Nastou, K.C.; Lyon, D.; Kirsch, R.; Pyysalo, S.; Doncheva, N.T.; Legeay, M.; Fang, T.; Bork, P.; et al. The STRING database in 2021: customizable protein-protein networks, and functional characterization of user-uploaded gene/measurement sets. Nucleic Acids Res. 2021, 49, D605–D612. [Google Scholar] [CrossRef] [PubMed]
- Wickham, H. ggplot2: Elegant Graphics for Data Analysis, 2 ed.; Springer-Verlag New York, 2016.
- Krzywinski, M.; Schein, J.; Birol. ; Connors, J.; Gascoyne, R.; Horsman, D.; Jones, S.J.; Marra, M.A. Circos: An information aesthetic for comparative genomics. Genome Research 2009, 19, 1639–1645. [Google Scholar] [CrossRef] [PubMed]
- Di Silvestre, D.; Brambilla, F.; Mauri, P.L. Multidimensional protein identification technology for direct-tissue proteomics of heart. Methods in molecular biology (Clifton, N.J.) 2013, 1005, 25–38. [Google Scholar] [CrossRef] [PubMed]
- Maere, S.; Heymans, K.; Kuiper, M. BiNGO: a Cytoscape plugin to assess overrepresentation of Gene Ontology categories in Biological Networks. Bioinformatics 2005, 21, 3448–3449. [Google Scholar] [CrossRef] [PubMed]
- Scardoni, G.; Tosadori, G.; Faizan, M.; Spoto, F.; Fabbri, F.; Laudanna, C. Biological network analysis with CentiScaPe: centralities and experimental dataset integration. F1000Research 2014, 3, 139. [Google Scholar] [CrossRef]
- Arfin, S.; Kumar, D.; Lomagno, A.; Mauri, P.L.; Di Silvestre, D. Differentially Expressed Genes, miRNAs and Network Models: A Strategy to Shed Light on Molecular Interactions Driving HNSCC Tumorigenesis. Cancers 2023, 15, 4420. [Google Scholar] [CrossRef] [PubMed]
- Tosadori, G.; Bestvina, I.; Spoto, F.; Laudanna, C.; Scardoni, G. Creating, generating and comparing random network models with NetworkRandomizer. F1000Research 2016, 5, 2524. [Google Scholar] [CrossRef] [PubMed]
- Chandrashekar, D.S.; Karthikeyan, S.K.; Korla, P.K.; Patel, H.; Shovon, A.R.; Athar, M.; Netto, G.J.; Qin, Z.S.; Kumar, S.; Manne, U.; et al. UALCAN: An update to the integrated cancer data analysis platform. Neoplasia 2022, 25, 18–27. [Google Scholar] [CrossRef]
- Li, T.; Fu, J.; Zeng, Z.; Cohen, D.; Li, J.; Chen, Q.; Li, B.; Liu, X.S. TIMER2.0 for analysis of tumor-infiltrating immune cells. Nucleic Acids Research 2020, 48, W509–W514. [Google Scholar] [CrossRef]
- Lima, T.; Henrique, R.; Vitorino, R.; Fardilha, M. Bioinformatic analysis of dysregulated proteins in prostate cancer patients reveals putative urinary biomarkers and key biological pathways. Medical Oncology 2021, 38. [Google Scholar] [CrossRef]
- Saraon, P.; Cretu, D.; Musrap, N.; Karagiannis, G.S.; Batruch, I.; Drabovich, A.P.; van der Kwast, T.; Mizokami, A.; Morrissey, C.; Jarvi, K.; et al. Quantitative Proteomics Reveals That Enzymes of the Ketogenic Pathway Are Associated with Prostate Cancer Progression. Molecular & Cellular Proteomics 2013, 12, 1589–1601. [Google Scholar] [CrossRef]
- Neuwirt, H.; Bouchal, J.; Kharaishvili, G.; Ploner, C.; Jöhrer, K.; Pitterl, F.; Weber, A.; Klocker, H.; Eder, I.E. Cancer-associated fibroblasts promote prostate tumor growth and progression through upregulation of cholesterol and steroid biosynthesis. Cell Communication and Signaling 2020, 18. [Google Scholar] [CrossRef]
- Melanie Hilario, A.K. Approaches to dimensionality reduction in proteomic biomarker studies. Briefings in Bioinformatics 2008, 2, 102–118. [Google Scholar] [CrossRef]
- Chen, C.; Cao, F.H.; Li, Z.G.; Zhang, L.G.; Liu, J.; Chen, N.; Yao, A.L.; Kang, S.S.; Gao, W.X.; Han, H.; et al. Bioinformatics analysis of differentially expressed proteins in prostate cancer based on proteomics data. OncoTargets and Therapy, 1545. [Google Scholar] [CrossRef]
- Davalieva, K.; Kiprijanovska, S.; Maleva Kostovska, I.; Stavridis, S.; Stankov, O.; Komina, S.; Petrusevska, G.; Polenakovic, M. Comparative Proteomics Analysis of Urine Reveals Down-Regulation of Acute Phase Response Signaling and LXR/RXR Activation Pathways in Prostate Cancer. Proteomes 2017, 6, 1. [Google Scholar] [CrossRef] [PubMed]
- Cortvrindt, C.; Speeckaert, R.; Delanghe, J.R.; Speeckaert, M.M. Urinary Epidermal Growth Factor: A Promising “Next Generation” Biomarker in Kidney Disease. American Journal of Nephrology 2022, 53, 372–387. [Google Scholar] [CrossRef]
- McGwire, G.B.; Skidgel, R.A. Extracellular Conversion of Epidermal Growth Factor (EGF) to des-Arg53-EGF by Carboxypeptidase M. Journal of Biological Chemistry 1995, 270, 17154–17158. [Google Scholar] [CrossRef] [PubMed]
- Lorenzon, E.; Colladel, R.; Andreuzzi, E.; Marastoni, S.; Todaro, F.; Schiappacassi, M.; Ligresti, G.; Colombatti, A.; Mongiat, M. MULTIMERIN2 impairs tumor angiogenesis and growth by interfering with VEGF-A/VEGFR2 pathway. Oncogene 2011, 31, 3136–3147. [Google Scholar] [CrossRef] [PubMed]
- Xiao, W.; Pinilla-Baquero, A.; Faulkner, J.; Song, X.; Prabhakar, P.; Qiu, H.; Moremen, K.W.; Ludwig, A.; Dempsey, P.J.; Azadi, P.; et al. Robo4 is constitutively shed by ADAMs from endothelial cells and the shed Robo4 functions to inhibit Slit3-induced angiogenesis. Scientific Reports 2022, 12. [Google Scholar] [CrossRef] [PubMed]
- Han, S.W.; Jung, Y.K.; Lee, E.J.; Park, H.R.; Kim, G.W.; Jeong, J.H.; Han, M.S.; Choi, J.Y. DICAM inhibits angiogenesis via suppression of AKT and p38 MAP kinase signalling. Cardiovascular Research 2013, 98, 73–82. [Google Scholar] [CrossRef]
- Rifatbegovic, F.; Frech, C.; Abbasi, M.R.; Taschner-Mandl, S.; Weiss, T.; Schmidt, W.M.; Schmidt, I.; Ladenstein, R.; Ambros, I.M.; Ambros, P.F. Neuroblastoma cells undergo transcriptomic alterations upon dissemination into the bone marrow and subsequent tumor progression. International Journal of Cancer 2017, 142, 297–307. [Google Scholar] [CrossRef] [PubMed]
- Muazzam, A.; Spick, M.; Cexus, O.N.F.; Geary, B.; Azhar, F.; Pandha, H.; Michael, A.; Reed, R.; Lennon, S.; Gethings, L.A.; et al. A Novel Blood Proteomic Signature for Prostate Cancer. Cancers 2023, 15, 1051. [Google Scholar] [CrossRef] [PubMed]
- Katafigioti, A.; Katafigiotis, I.; Sfoungaristos, S.; Alamanis, C.; Stravodimos, K.; Anastasiou, I.; Roumelioti, E.; Duvdevani, M.; Constantinides, C. In the search of novel urine biomarkers for the early diagnosis of prostate cancer. Intracellular or secreted proteins as the target group? Where and how to search for possible biomarkers useful in the everyday clinical practice. Archivio Italiano di Urologia e Andrologia 2016, 88, 195. [Google Scholar] [CrossRef]
- Zhang, Y.; Huang, Z.; Zhu, Z.; Liu, J.; Zheng, X.; Zhang, Y. Network analysis of ChIP-Seq data reveals key genes in prostate cancer. European Journal of Medical Research 2014, 19. [Google Scholar] [CrossRef]
- Singh, A.N.; Sharma, N. Quantitative SWATH-Based Proteomic Profiling for Identification of Mechanism-Driven Diagnostic Biomarkers Conferring in the Progression of Metastatic Prostate Cancer. Frontiers in Oncology 2020, 10. [Google Scholar] [CrossRef] [PubMed]
- Xu, N.; Dong, R.N.; Lin, T.T.; Lin, T.; Lin, Y.Z.; Chen, S.H.; Zhu, J.M.; Ke, Z.B.; Huang, F.; Chen, Y.H.; et al. Development and Validation of Novel Biomarkers Related to M2 Macrophages Infiltration by Weighted Gene Co-Expression Network Analysis in Prostate Cancer. Frontiers in Oncology 2021, 11. [Google Scholar] [CrossRef] [PubMed]
- Brünnert, D.; Langer, C.; Zimmermann, L.; Bargou, R.C.; Burchardt, M.; Chatterjee, M.; Stope, M.B. The heat shock protein 70 inhibitor VER155008 suppresses the expression of HSP27, HOP and HSP90β and the androgen receptor, induces apoptosis, and attenuates prostate cancer cell growth. Journal of Cellular Biochemistry 2019, 121, 407–417. [Google Scholar] [CrossRef]
- Fu, Z.; Jia, B. Advances in the role of heat shock protein 90 in prostate cancer. Andrologia 2022, 54. [Google Scholar] [CrossRef] [PubMed]
- Kryza, T.; Bock, N.; Lovell, S.; Rockstroh, A.; Lehman, M.L.; Lesner, A.; Panchadsaram, J.; Silva, L.M.; Srinivasan, S.; Snell, C.E.; et al. The molecular function of kallikrein-related peptidase 14 demonstrates a key modulatory role in advanced prostate cancer. Molecular Oncology 2019, 14, 105–128. [Google Scholar] [CrossRef]
- Li, X.; Wang, X.; Song, W.; Xu, H.; Huang, R.; Wang, Y.; Zhao, W.; Xiao, Z.; Yang, X. Oncogenic Properties of NEAT1 in Prostate Cancer Cells Depend on the CDC5L–AGRN Transcriptional Regulation Circuit. Cancer Research 2018, 78, 4138–4149. [Google Scholar] [CrossRef] [PubMed]
- Mukherjee, S.; Sudandiradoss, C. Transcriptomic analysis of castration, chemo-resistant and metastatic prostate cancer elucidates complex genetic crosstalk leading to disease progression. Functional & Integrative Genomics 2021, 21, 451–472. [Google Scholar] [CrossRef] [PubMed]
- Mori, J.O.; White, J.; Elhussin, I.; Duduyemi, B.M.; Karanam, B.; Yates, C.; Wang, H. Molecular and pathological subtypes related to prostate cancer disparities and disease outcomes in African American and European American patients. Frontiers in Oncology 2022, 12. [Google Scholar] [CrossRef]
- Farfán, N.; Ocarez, N.; Castellón, E.A.; Mejía, N.; de Herreros, A.G.; Contreras, H.R. The transcriptional factor ZEB1 represses Syndecan 1 expression in prostate cancer. Scientific Reports 2018, 8. [Google Scholar] [CrossRef]
- Ruiz, C.; Alborelli, I.; Manzo, M.; Calgua, B.; Keller, E.B.; Vuaroqueaux, V.; Quagliata, L.; Rentsch, C.A.; Spagnoli, G.C.; Diener, P.A.; et al. Critical Evaluation of Transcripts and Long Noncoding RNA Expression Levels in Prostate Cancer Following Radical Prostatectomy. Pathobiology 2023, 90, 400–408. [Google Scholar] [CrossRef] [PubMed]
- Cooper, C.R.; Graves, B.; Pruitt, F.; Chaib, H.; Lynch, J.E.; Cox, A.K.; Sequeria, L.; van Golen, K.L.; Evans, A.; Czymmek, K.; et al. Novel surface expression of reticulocalbin 1 on bone endothelial cells and human prostate cancer cells is regulated by TNF-α. Journal of Cellular Biochemistry 2008, 104, 2298–2309. [Google Scholar] [CrossRef]
- Liu, X.; Zhang, N.; Wang, D.; Zhu, D.; Yuan, Q.; Zhang, X.; Qian, L.; Niu, H.; Lu, Y.; Ren, G.; et al. Downregulation of reticulocalbin-1 differentially facilitates apoptosis and necroptosis in human prostate cancer cells. Cancer Science 2018, 109, 1147–1157. [Google Scholar] [CrossRef] [PubMed]
- LU, L.; FU, N.; LUO, X.; LI, X.Y.; LI, X.P. Overexpression of cofilin 1 in prostate cancer and the corresponding clinical implications. Oncology Letters 2015, 9, 2757–2761. [Google Scholar] [CrossRef] [PubMed]
- Chang, Y.F.; Chao, C.H.; Lin, L.Y.; Tsai, C.H.; Chou, C.; Lee, Y.J. Determination of urine cofilin-1 level in acute kidney injury using a high-throughput localized surface plasmon-coupled fluorescence biosensor. Journal of Biomedical Optics 2013, 19, 011004. [Google Scholar] [CrossRef] [PubMed]
- Tsakiris, I.; Soos, G.; Nemes, Z.; Kiss, S.S.; Andras, C.; Szantó, J.; Dezso, B. The presence of carboxypeptidase-M in tumour cells signifies epidermal growth factor receptor expression in lung adenocarcinomas: The coexistence predicts a poor prognosis regardless of EGFR levels. Journal of Cancer Research and Clinical Oncology 2007, 134, 439–451. [Google Scholar] [CrossRef]
- Deiteren, K.; Hendriks, D.; Scharpé, S.; Lambeir, A.M. Carboxypeptidase M: Multiple alliances and unknown partners. Clinica Chimica Acta 2009, 399, 24–39. [Google Scholar] [CrossRef] [PubMed]
- Tan, J.; Jin, X.; Wang, K. Integrated Bioinformatics Analysis of Potential Biomarkers for Prostate Cancer. Pathology & Oncology Research 2017, 25, 455–460. [Google Scholar] [CrossRef] [PubMed]
- Karantza, V. Keratins in health and cancer: more than mere epithelial cell markers. Oncogene 2010, 30, 127–138. [Google Scholar] [CrossRef]
- Porten, S.P.; Wang, E.Y.; Vohra, P.; Carroll, P.R.; Jahanfard, S.; Kim, N.W. Evaluation of URO17® to improve non-invasive detection of bladder cancer. Urologic Oncology: Seminars and Original Investigations 2024, 42, 176.e21–176.e28. [Google Scholar] [CrossRef] [PubMed]
- Santos, N.J.; Barquilha, C.N.; Barbosa, I.C.; Macedo, R.T.; Lima, F.O.; Justulin, L.A.; Barbosa, G.O.; Carvalho, H.F.; Felisbino, S.L. Syndecan Family Gene and Protein Expression and Their Prognostic Values for Prostate Cancer. International Journal of Molecular Sciences 2021, 22, 8669. [Google Scholar] [CrossRef]
- He Z, Tang F, L. Z.H.Y.L.H.L.Z.Z.G. Analysis of differentially expressed genes, clinical value and biological pathways in prostate cancer. America Journal of Translational Reseach 2028, 5, 1444–1456. [Google Scholar]
- Aykanli, E.; Arisan, S.; Arisan, E.D.; Yavuzsan, A.H. Diagnostic Value of GSTP1, RASSF1, AND RASSF2 Methylation in Serum of Prostate Cancer Patients. Urology Journal 2024, 20, 8014. [Google Scholar] [CrossRef]
- Vujicic, I.; Rusevski, A.; Stankov, O.; Popov, Z.; Dimovski, A.; Davalieva, K. Potential Role of Seven Proteomics Tissue Biomarkers for Diagnosis and Prognosis of Prostate Cancer in Urine. Diagnostics 2022, 12, 3184. [Google Scholar] [CrossRef] [PubMed]
- Biesiadecki, M.; Mołoń, M.; Balawender, K.; Kobylińska, Z.; Galiniak, S. Shedding light on the shadows: oxidative stress and its pivotal role in prostate cancer progression. Frontiers in Oncology 2024, 14. [Google Scholar] [CrossRef]
- Chang, G.; Xu, S.; Dhir, R.; Chandran, U.; O’Keefe, D.S.; Greenberg, N.M.; Gingrich, J.R. Hypoexpression and Epigenetic Regulation of Candidate Tumor Suppressor Gene CADM-2 in Human Prostate Cancer. Clinical Cancer Research 2010, 16, 5390–5401. [Google Scholar] [CrossRef]
- Jones, C.A.; London, N.R.; Chen, H.; Park, K.W.; Sauvaget, D.; Stockton, R.A.; Wythe, J.D.; Suh, W.; Larrieu-Lahargue, F.; Mukouyama, Y.s.; et al. Robo4 stabilizes the vascular network by inhibiting pathologic angiogenesis and endothelial hyperpermeability. Nature Medicine 2008, 14, 448–453. [Google Scholar] [CrossRef] [PubMed]
- Simpson, K.E.; Staikos, C.A.; Watson, K.L.; Moorehead, R.A. Loss of MXRA8 Delays Mammary Tumor Development and Impairs Metastasis. International Journal of Molecular Sciences 2023, 24, 13730. [Google Scholar] [CrossRef]
- Galvagni, F.; Nardi, F.; Spiga, O.; Trezza, A.; Tarticchio, G.; Pellicani, R.; Andreuzzi, E.; Caldi, E.; Toti, P.; Tosi, G.M.; et al. Dissecting the CD93-Multimerin 2 interaction involved in cell adhesion and migration of the activated endothelium. Matrix Biology 2017, 64, 112–127. [Google Scholar] [CrossRef] [PubMed]
Figure 1.
Proteomic analysis was performed on urine samples from HDs and PCa patients cate-gorized as LRPCa and HRPCa. (A) Spearman’s correlation was used to compare the global protein profiles of HD, LRPCa, and HRPCa groups. (B) A Venn diagram shows proteins uniquely identified in HD, LRPCa, and HRPCa groups, with red, green, and blue rectangles representing proteins found in at least 40% subjects per group. (C) Hierarchical clustering and (D) Principal Component Analysis (PCA) were conducted using peptide spectrum matches (PSMs) of differentially abundant proteins (DAPs) extracted via Linear Discriminant Analysis (LDA). PCA components PC1 and PC2 accounted for 65.4% and 8.7% of the variance, respectively. Hierarchical clustering employed Euclidean distance metrics and Ward’s method.
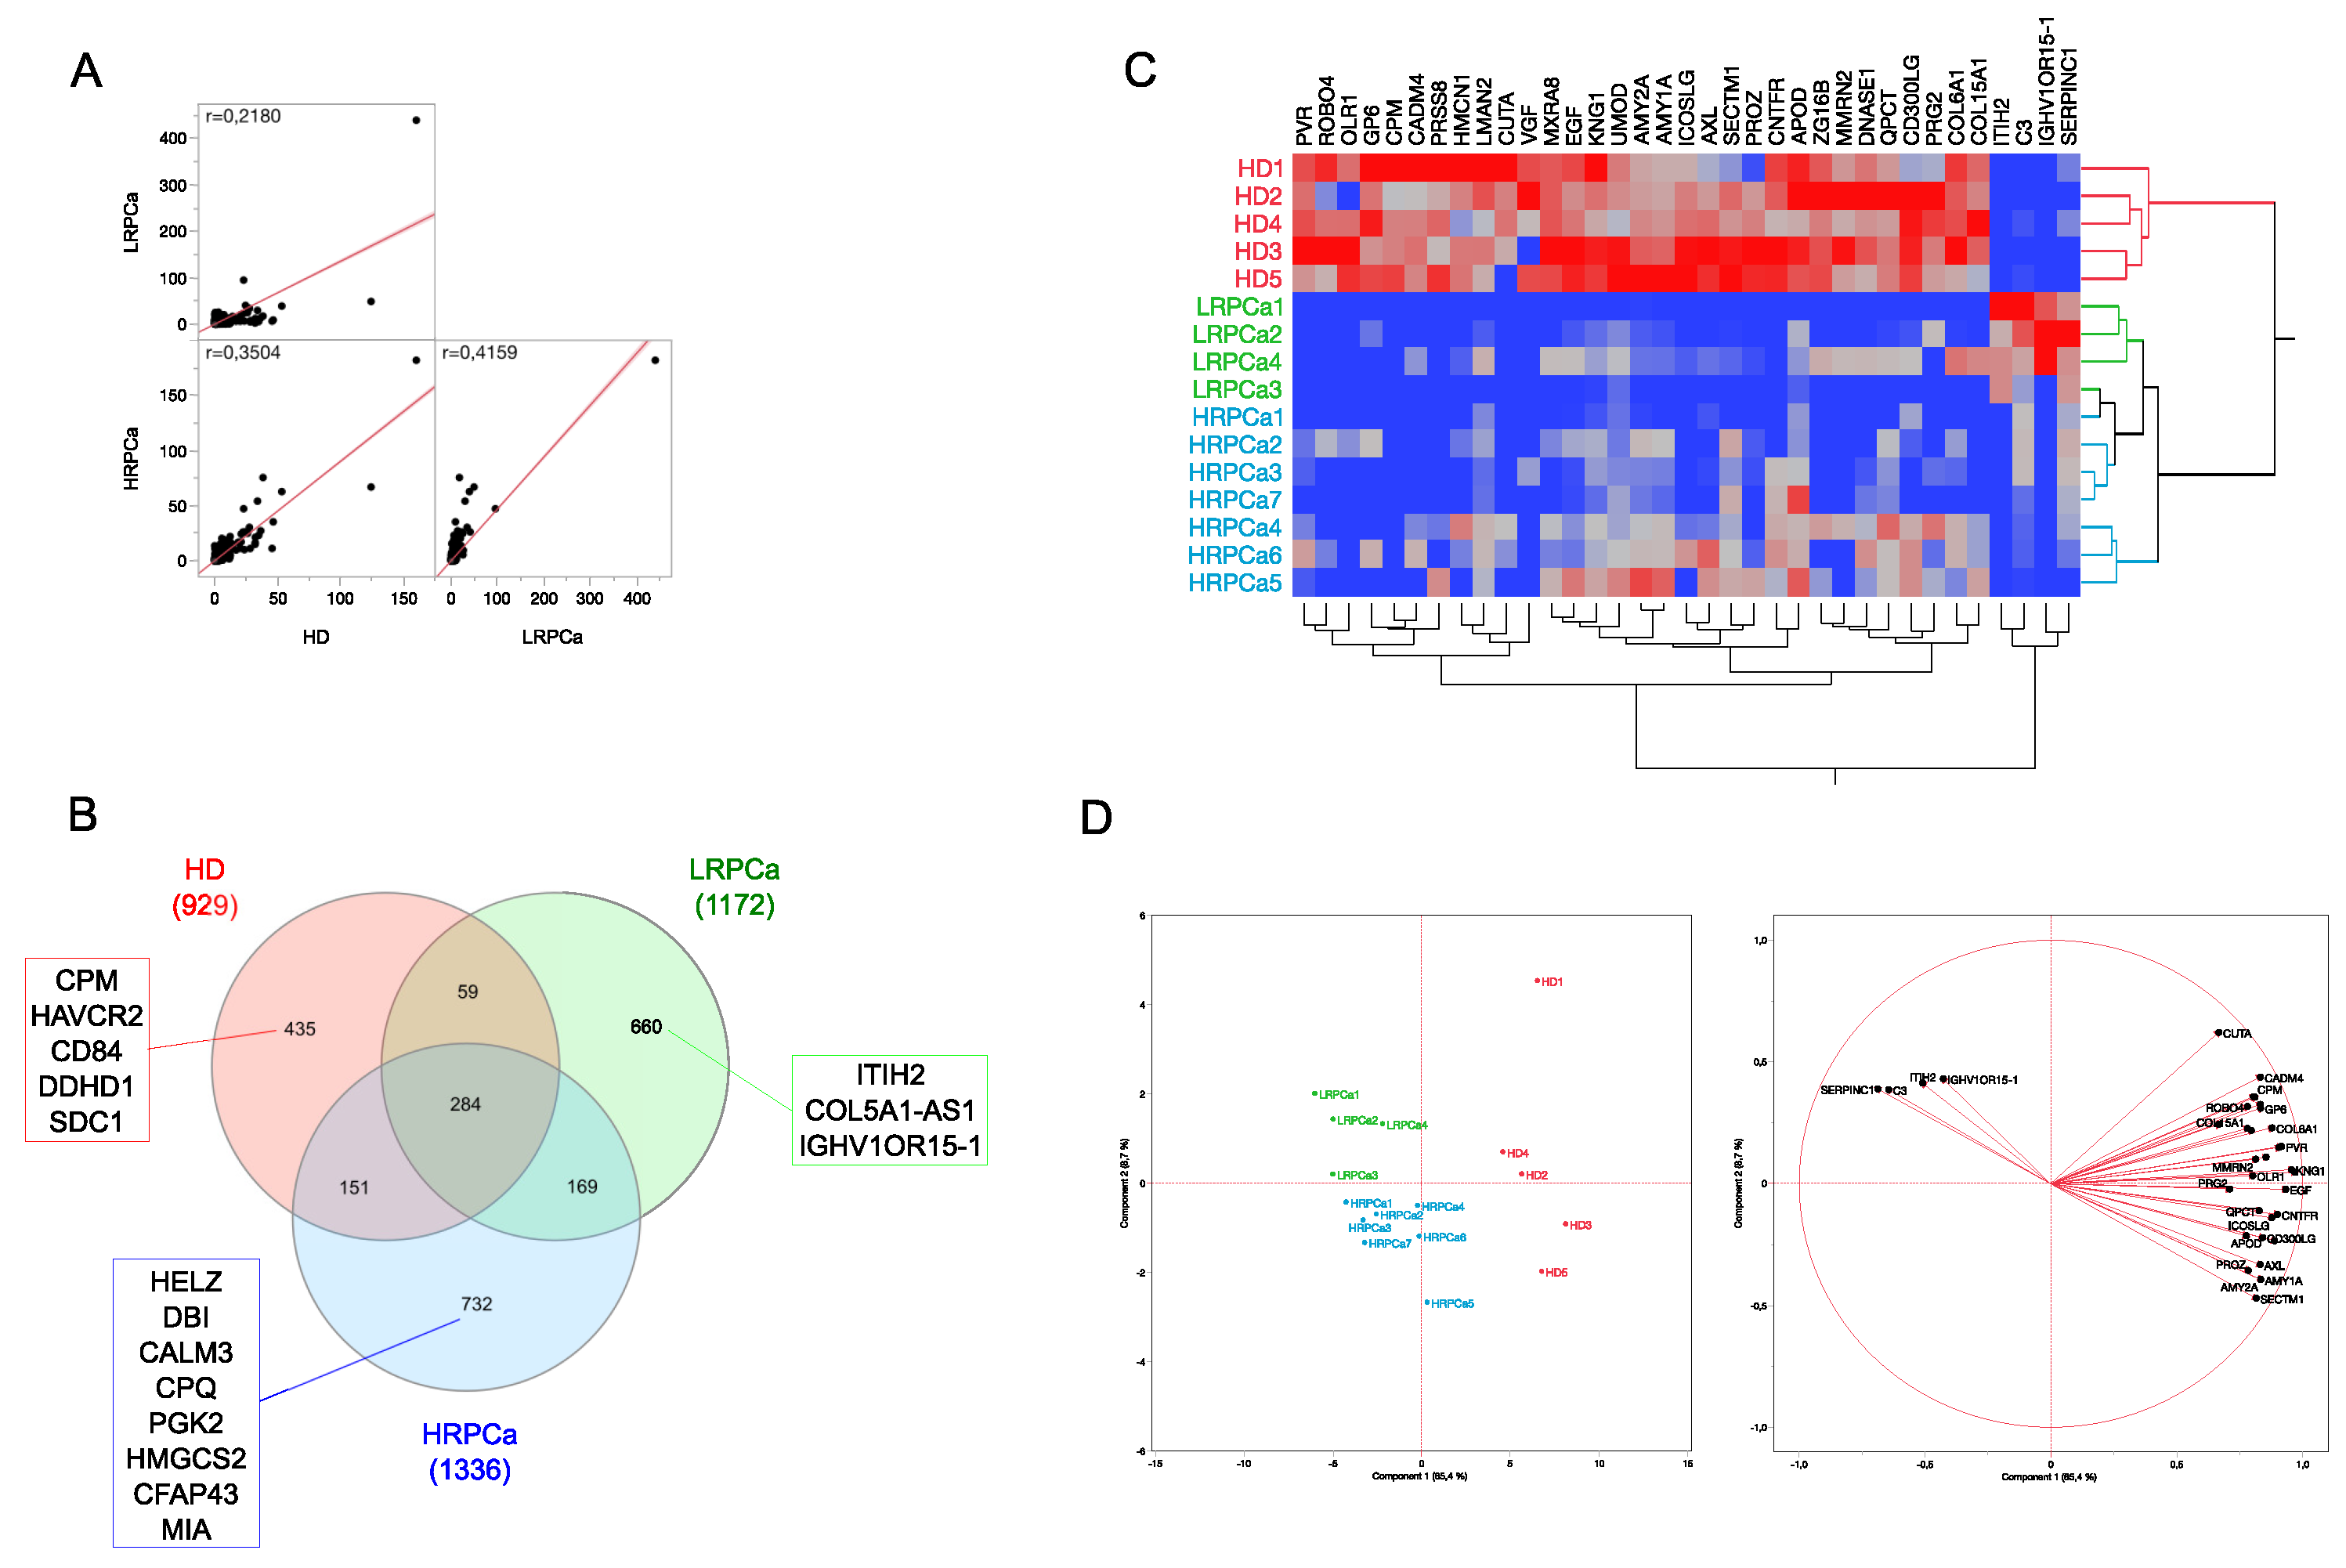
Figure 2.
Functional enrichment analysis. (A) Go Biological Process, (B) Pathways, (C) GO Molecular Function, (D) COMPARTMENT, (E), GO Cellular Component. Functional modules were enriched starting from the whole protein profile characterized per subject (FDR≤0.05), while the enrichment profiles were compared by LDA (P≤0.05).
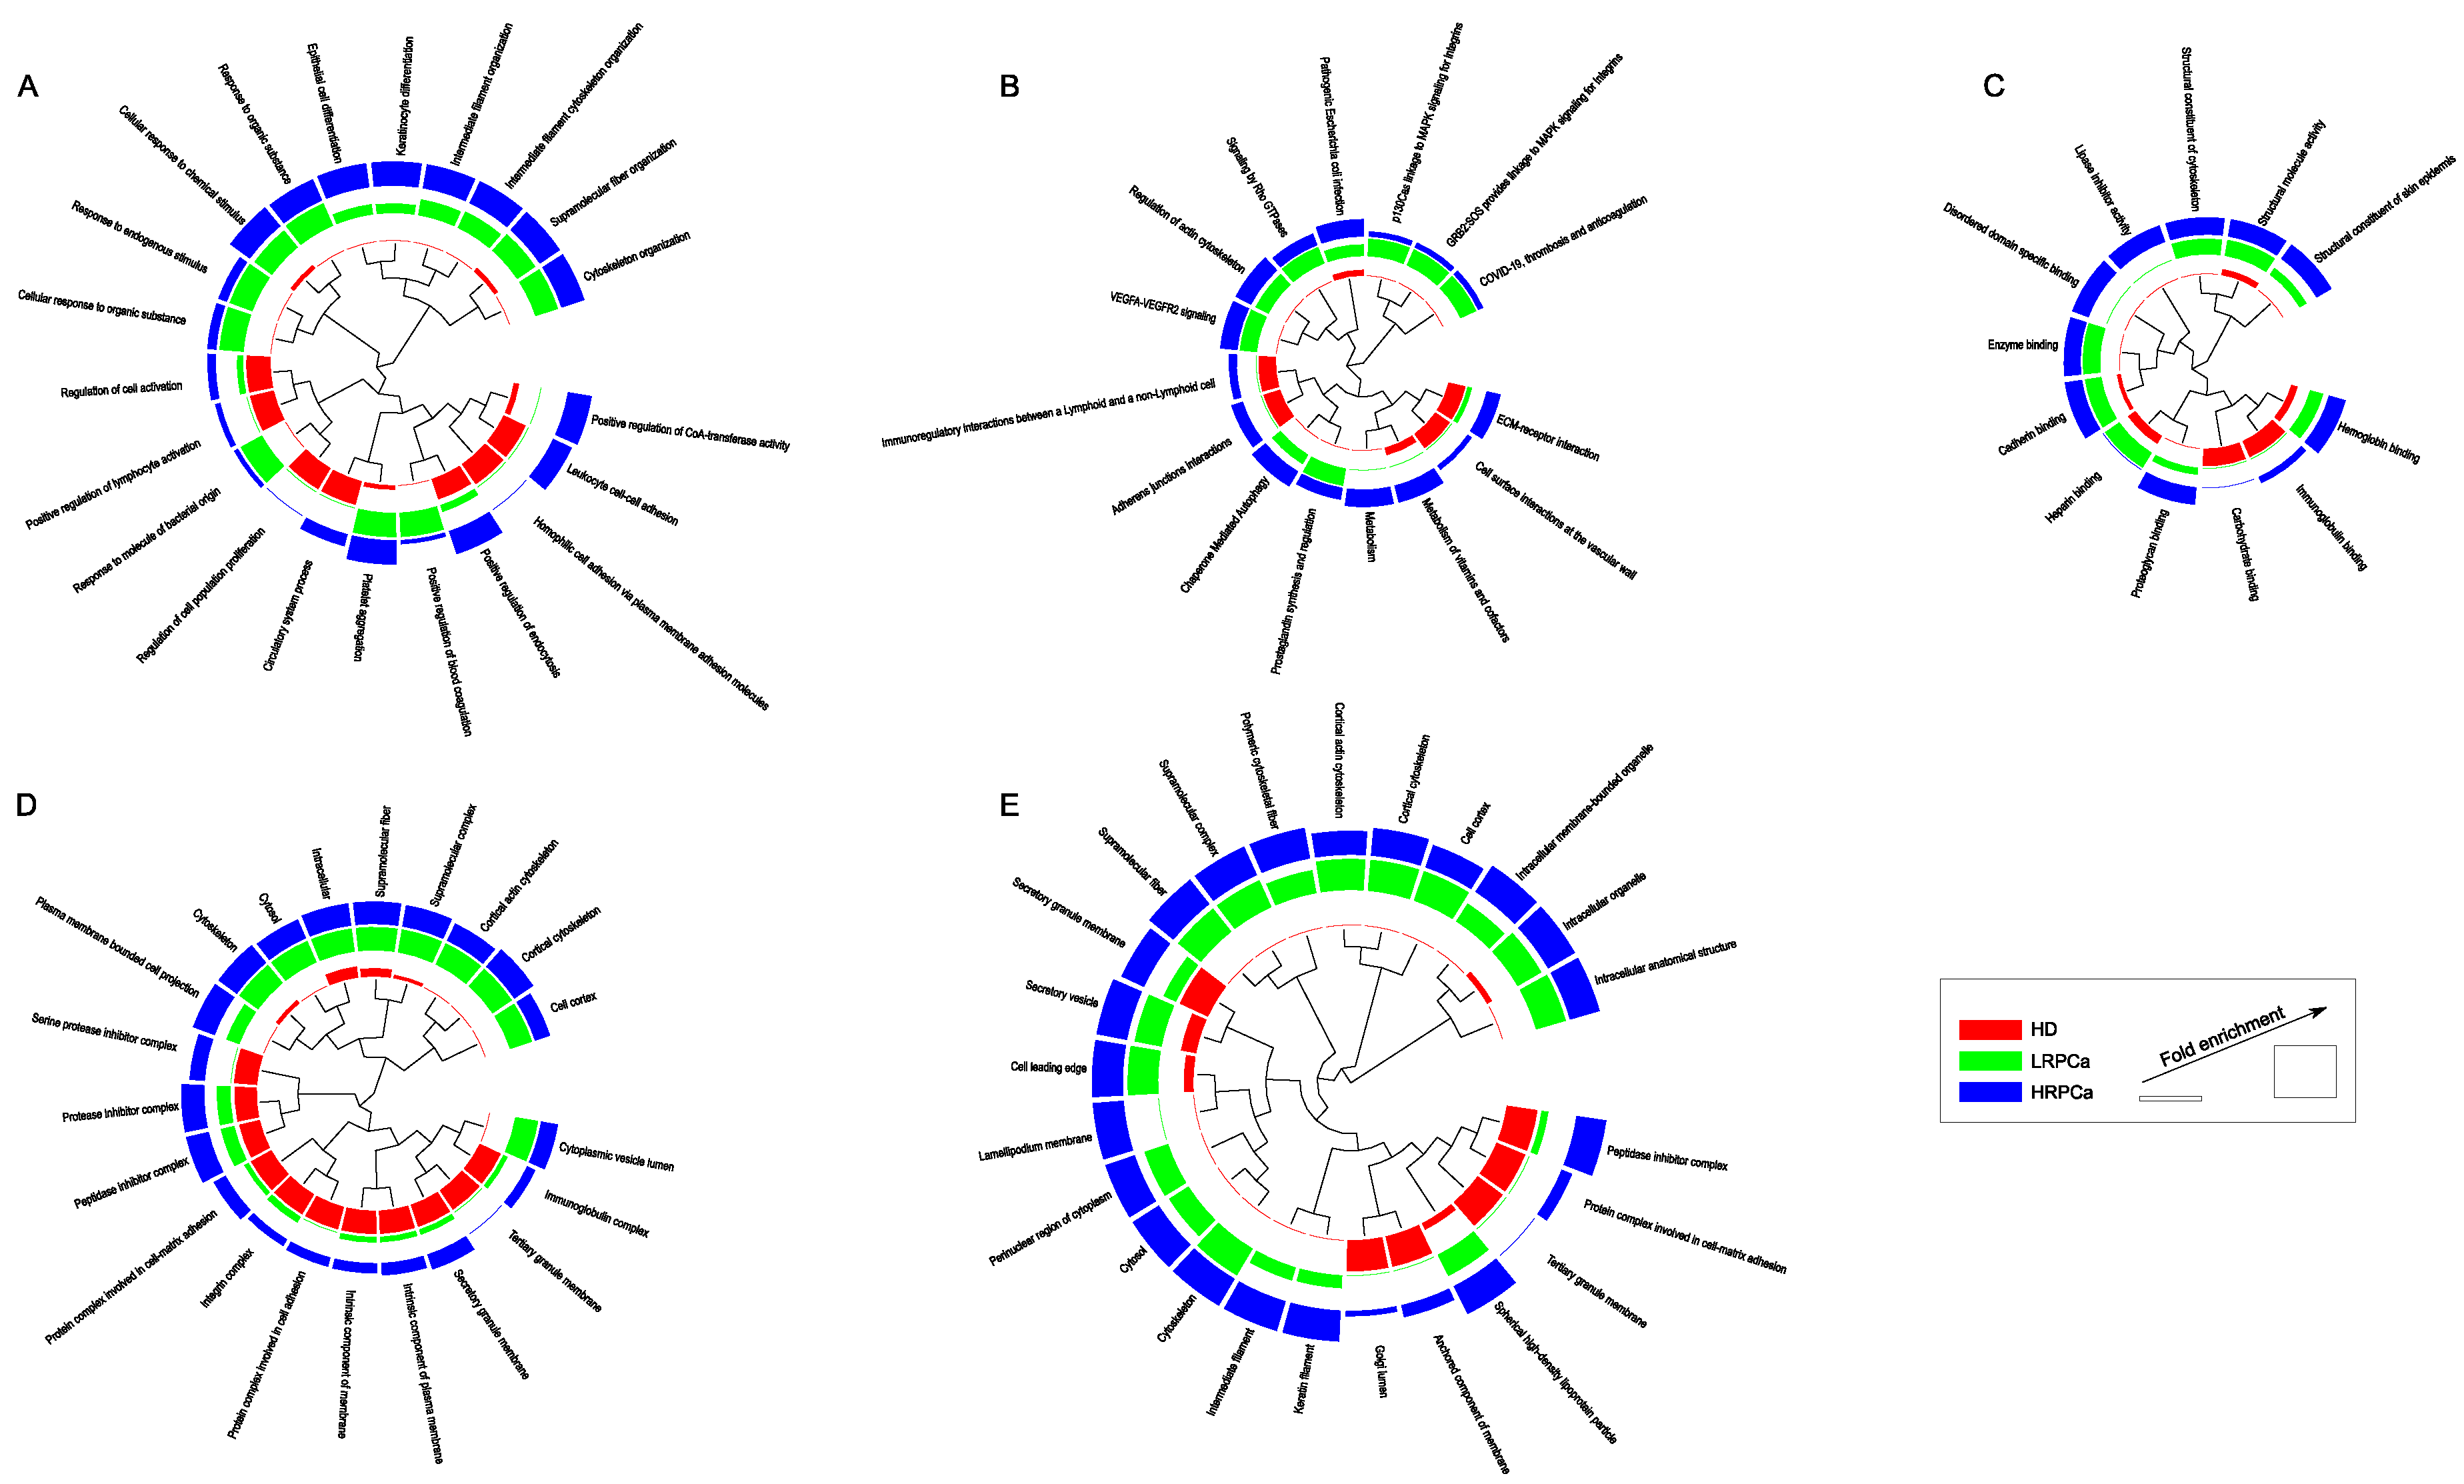
Figure 3.
Protein-protein interaction (PPI) network and functional modules differentially abundant in (A) HD, (B) LRPCa and (C) HRPCa. The networks were reconstructed starting from DAPs; only database (score ≥0.3) and experiments (score ≥0.15) annotated interactions were considered. The functional modules were defined through STRING and BINGO Cytoscape’s APPs (P≤0.05). The PSMs values were normalized in the range 0-100 and the color code indicates proteins low (blue) and high (red) abundant.
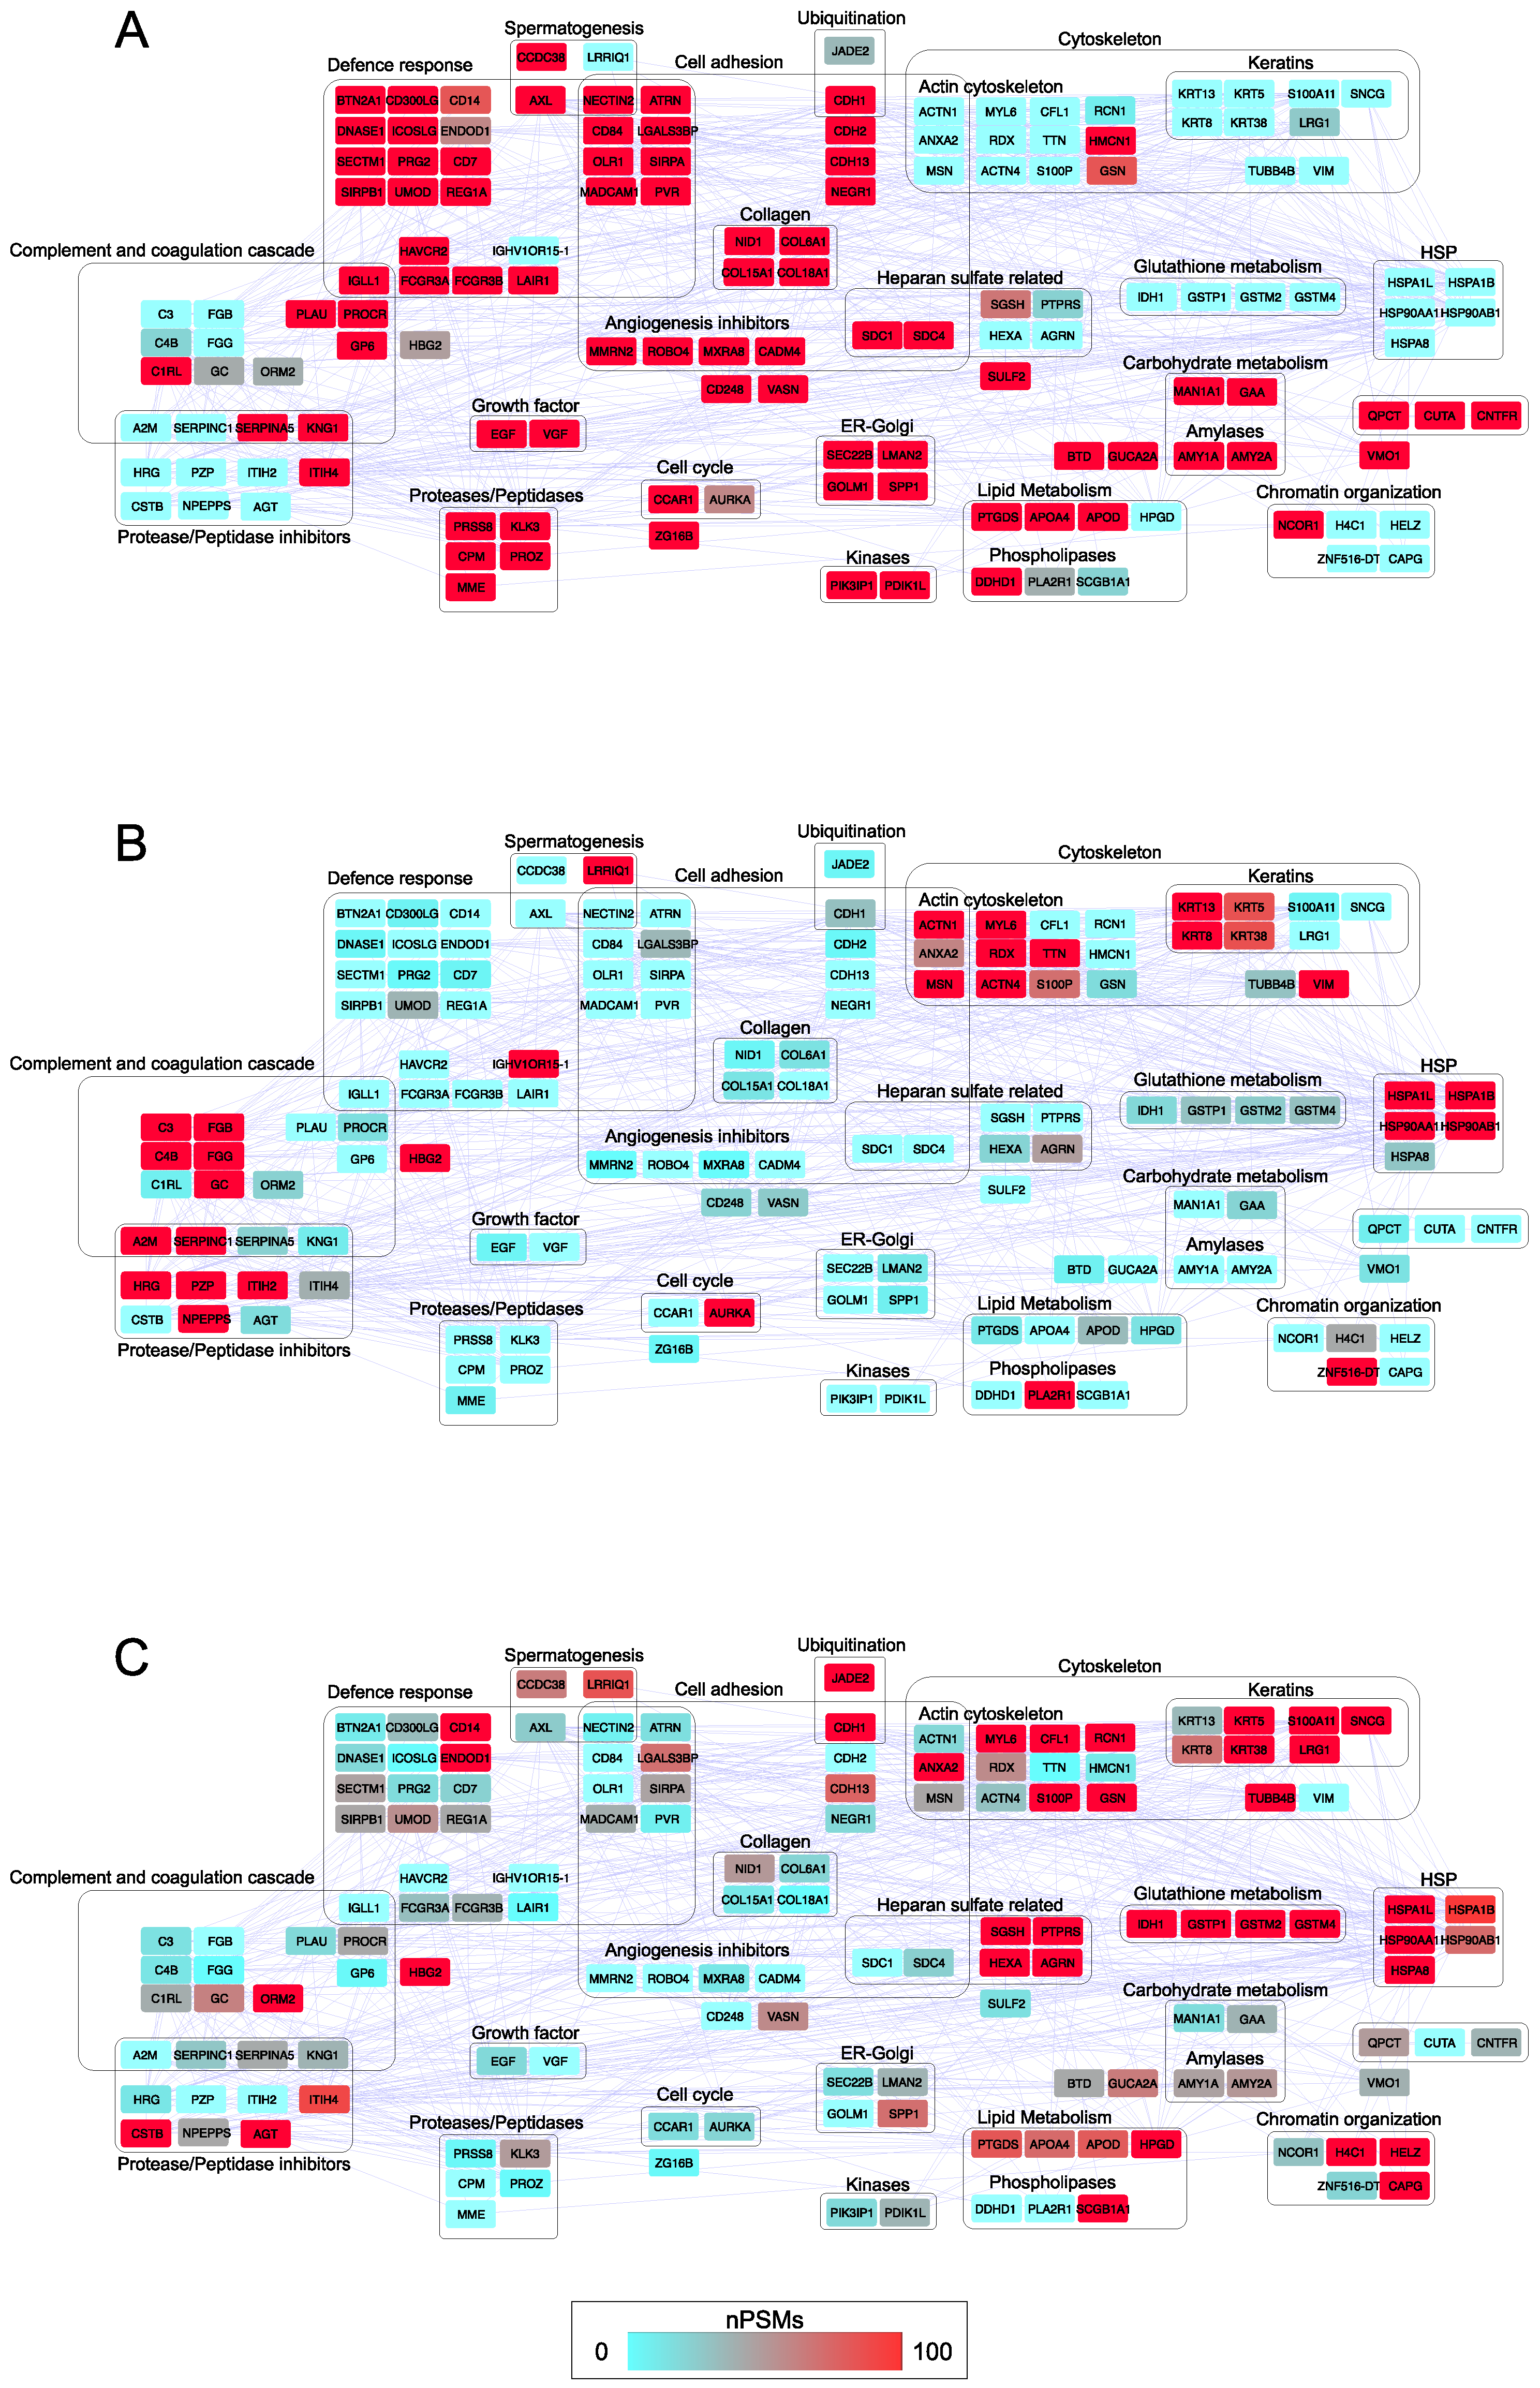
Figure 4.
Network topology. (A) Network centralities calculated for HD, LRPCa and HRPCa PPI network models. (B) Violin plots of betweenness from HD, LRPCa and HRPCa PPI random network models. (C) Hubs and bottlenecks from HD, (D) LRPCa and (E) HRPCa PPI network models; specifically, in blue are shown hubs selected by betweenness and centroid, in red are shown bottlenecks selected by betweenness and bridging, while in black bold are shown hubs/bottlenecks selected by betweenness, centroid and bridging.
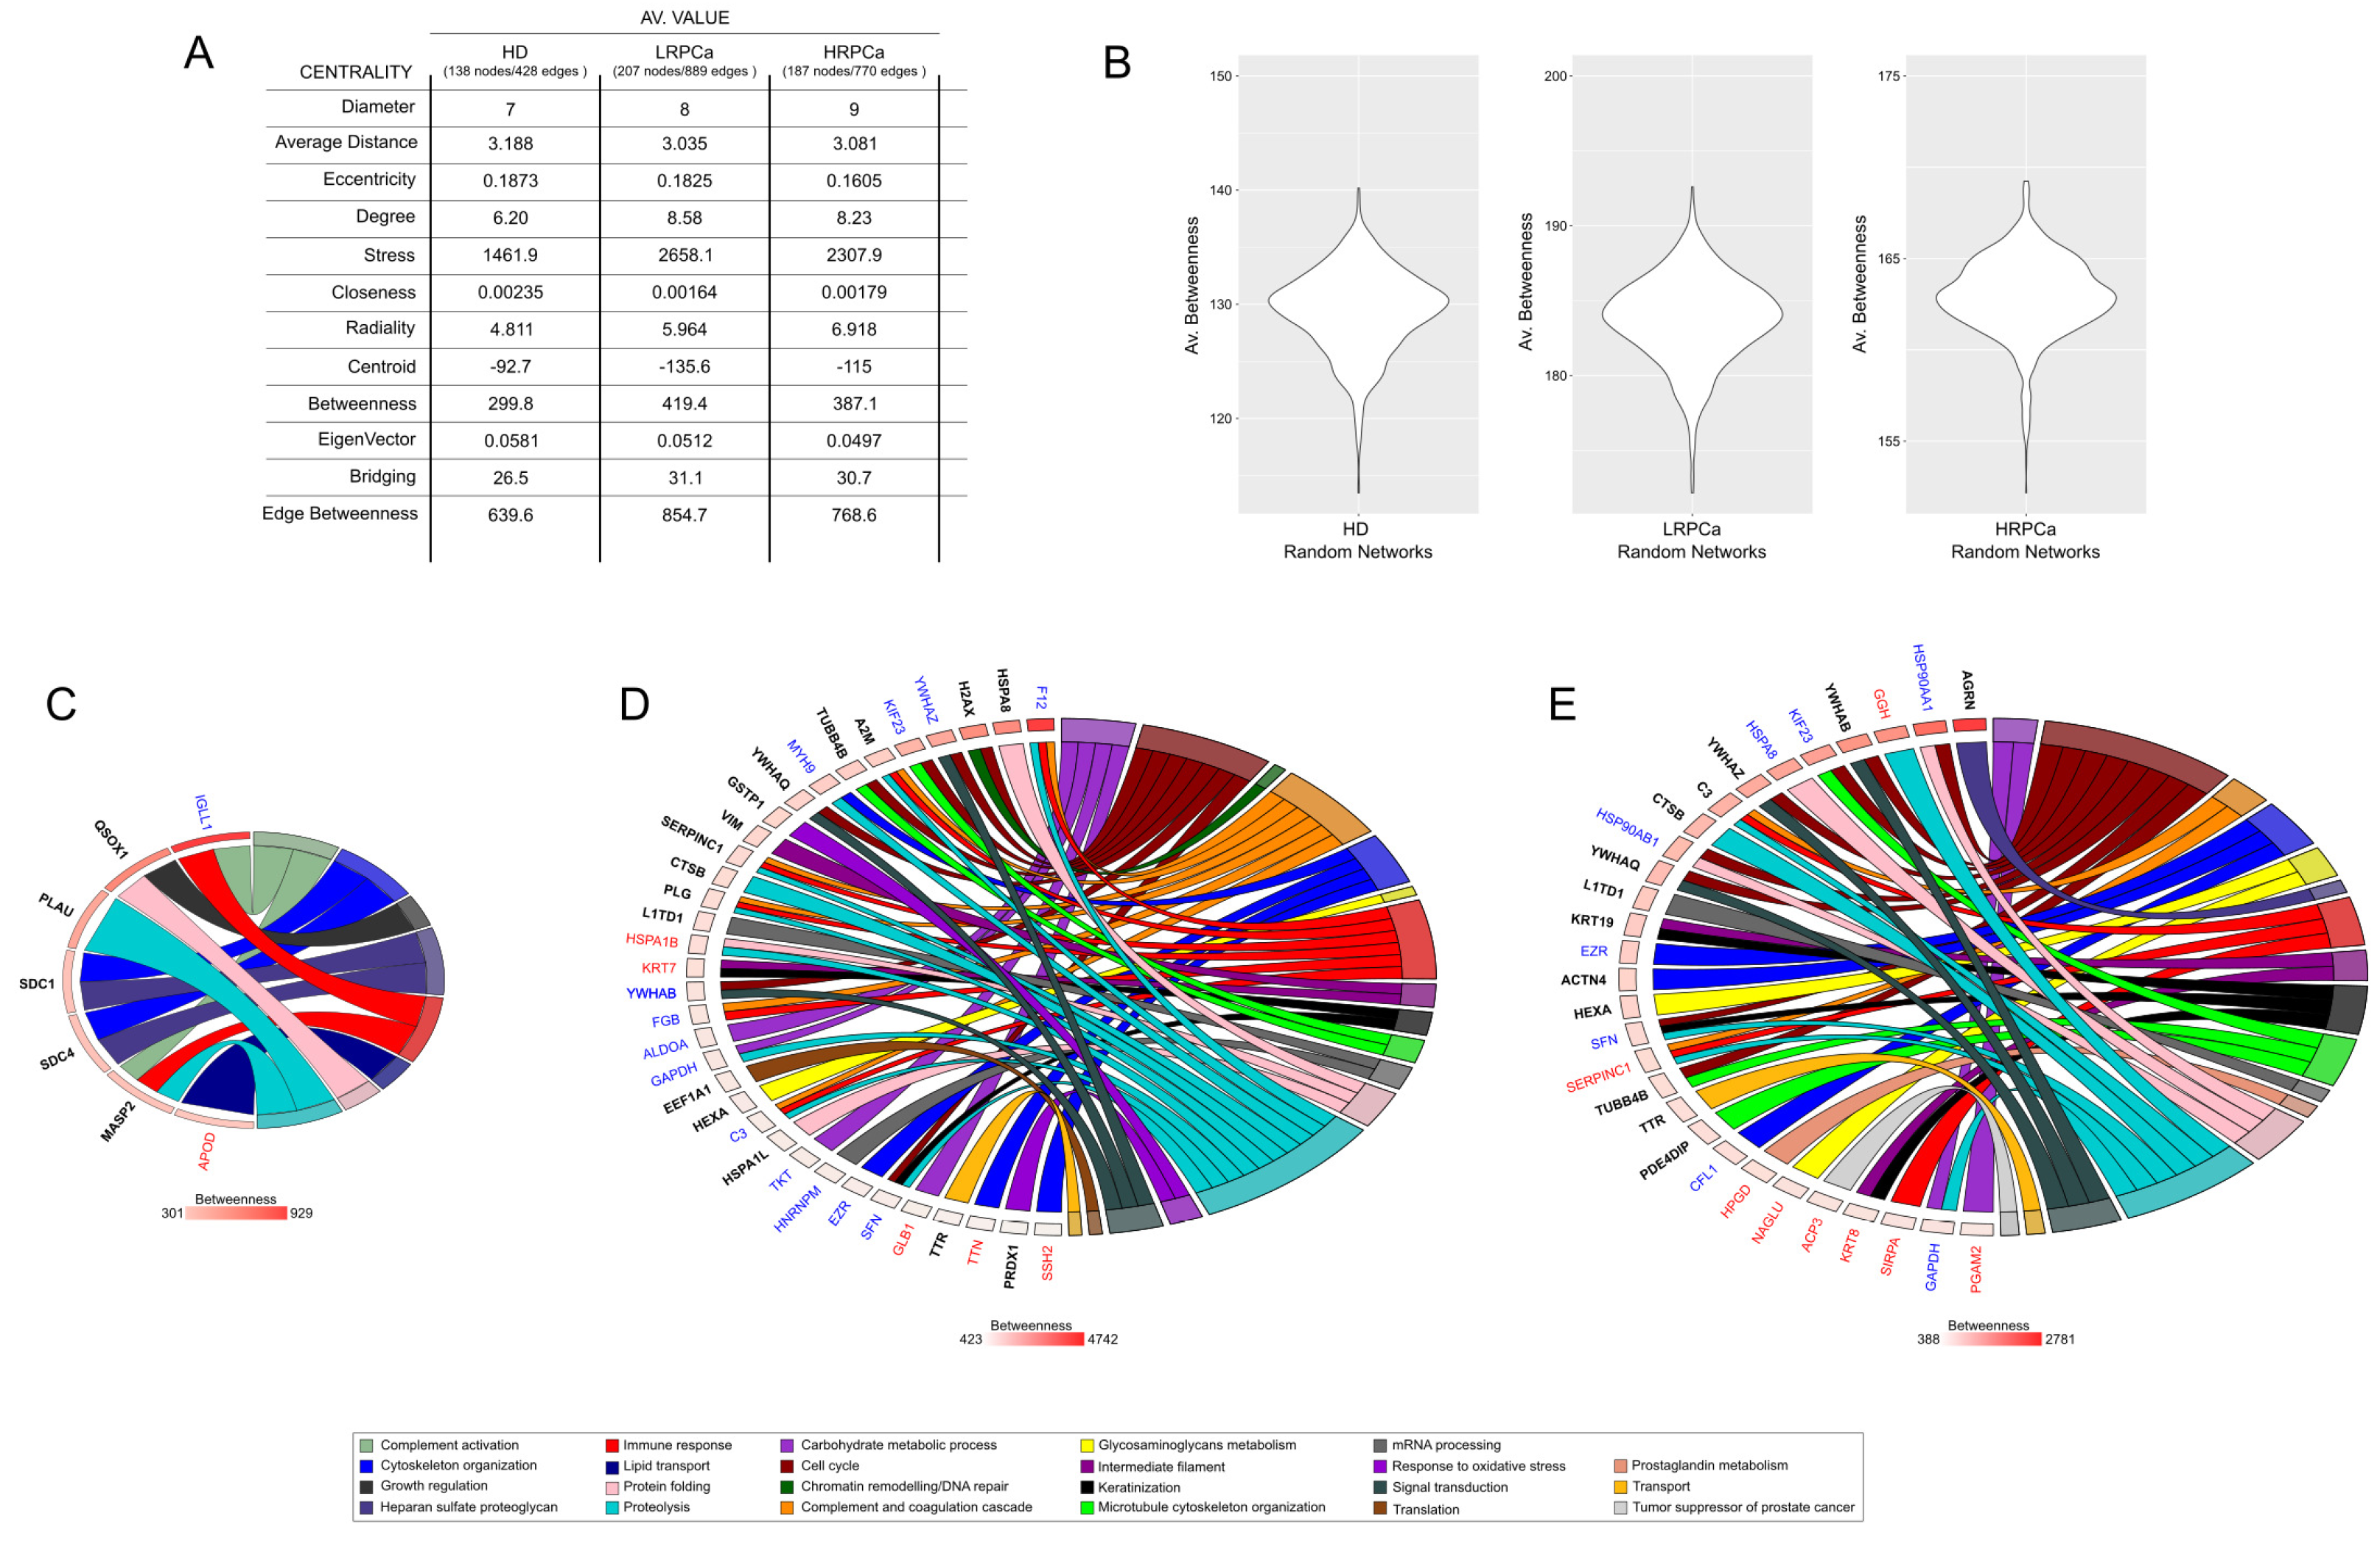
Figure 5.
TCGA bioinformatic analysis. (A) Heatmap illustrating the frequency of protein expression in urine samples from healthy donors (HDs) and prostate cancer-affected (PCa) individuals. (B) TCGA expression data for CPM across a pan-cancer dataset, comparing expression levels in tumor tissues versus their normal counterparts. (C) CPM expression in normal vs primary tumor. (D) CPM expression in normal versus PCa tissues with different Gleason score (GS). (E) TIMER analysis correlating CPM expression with immune cell infiltration. (F) TCGA expression data for KRT8 across a pan-cancer dataset, comparing expression levels in tumor tissues versus their normal counterparts; Wilcoxon test p≤0.05. (G) KRT8 expression in normal vs primary tumor. (H) KRT8 expression in normal versus PCa tissues with different Gleason score (GS); Wilcoxon test p≤0.05. (I) TIMER analysis correlating KRT8 expression with immune cell infiltration.
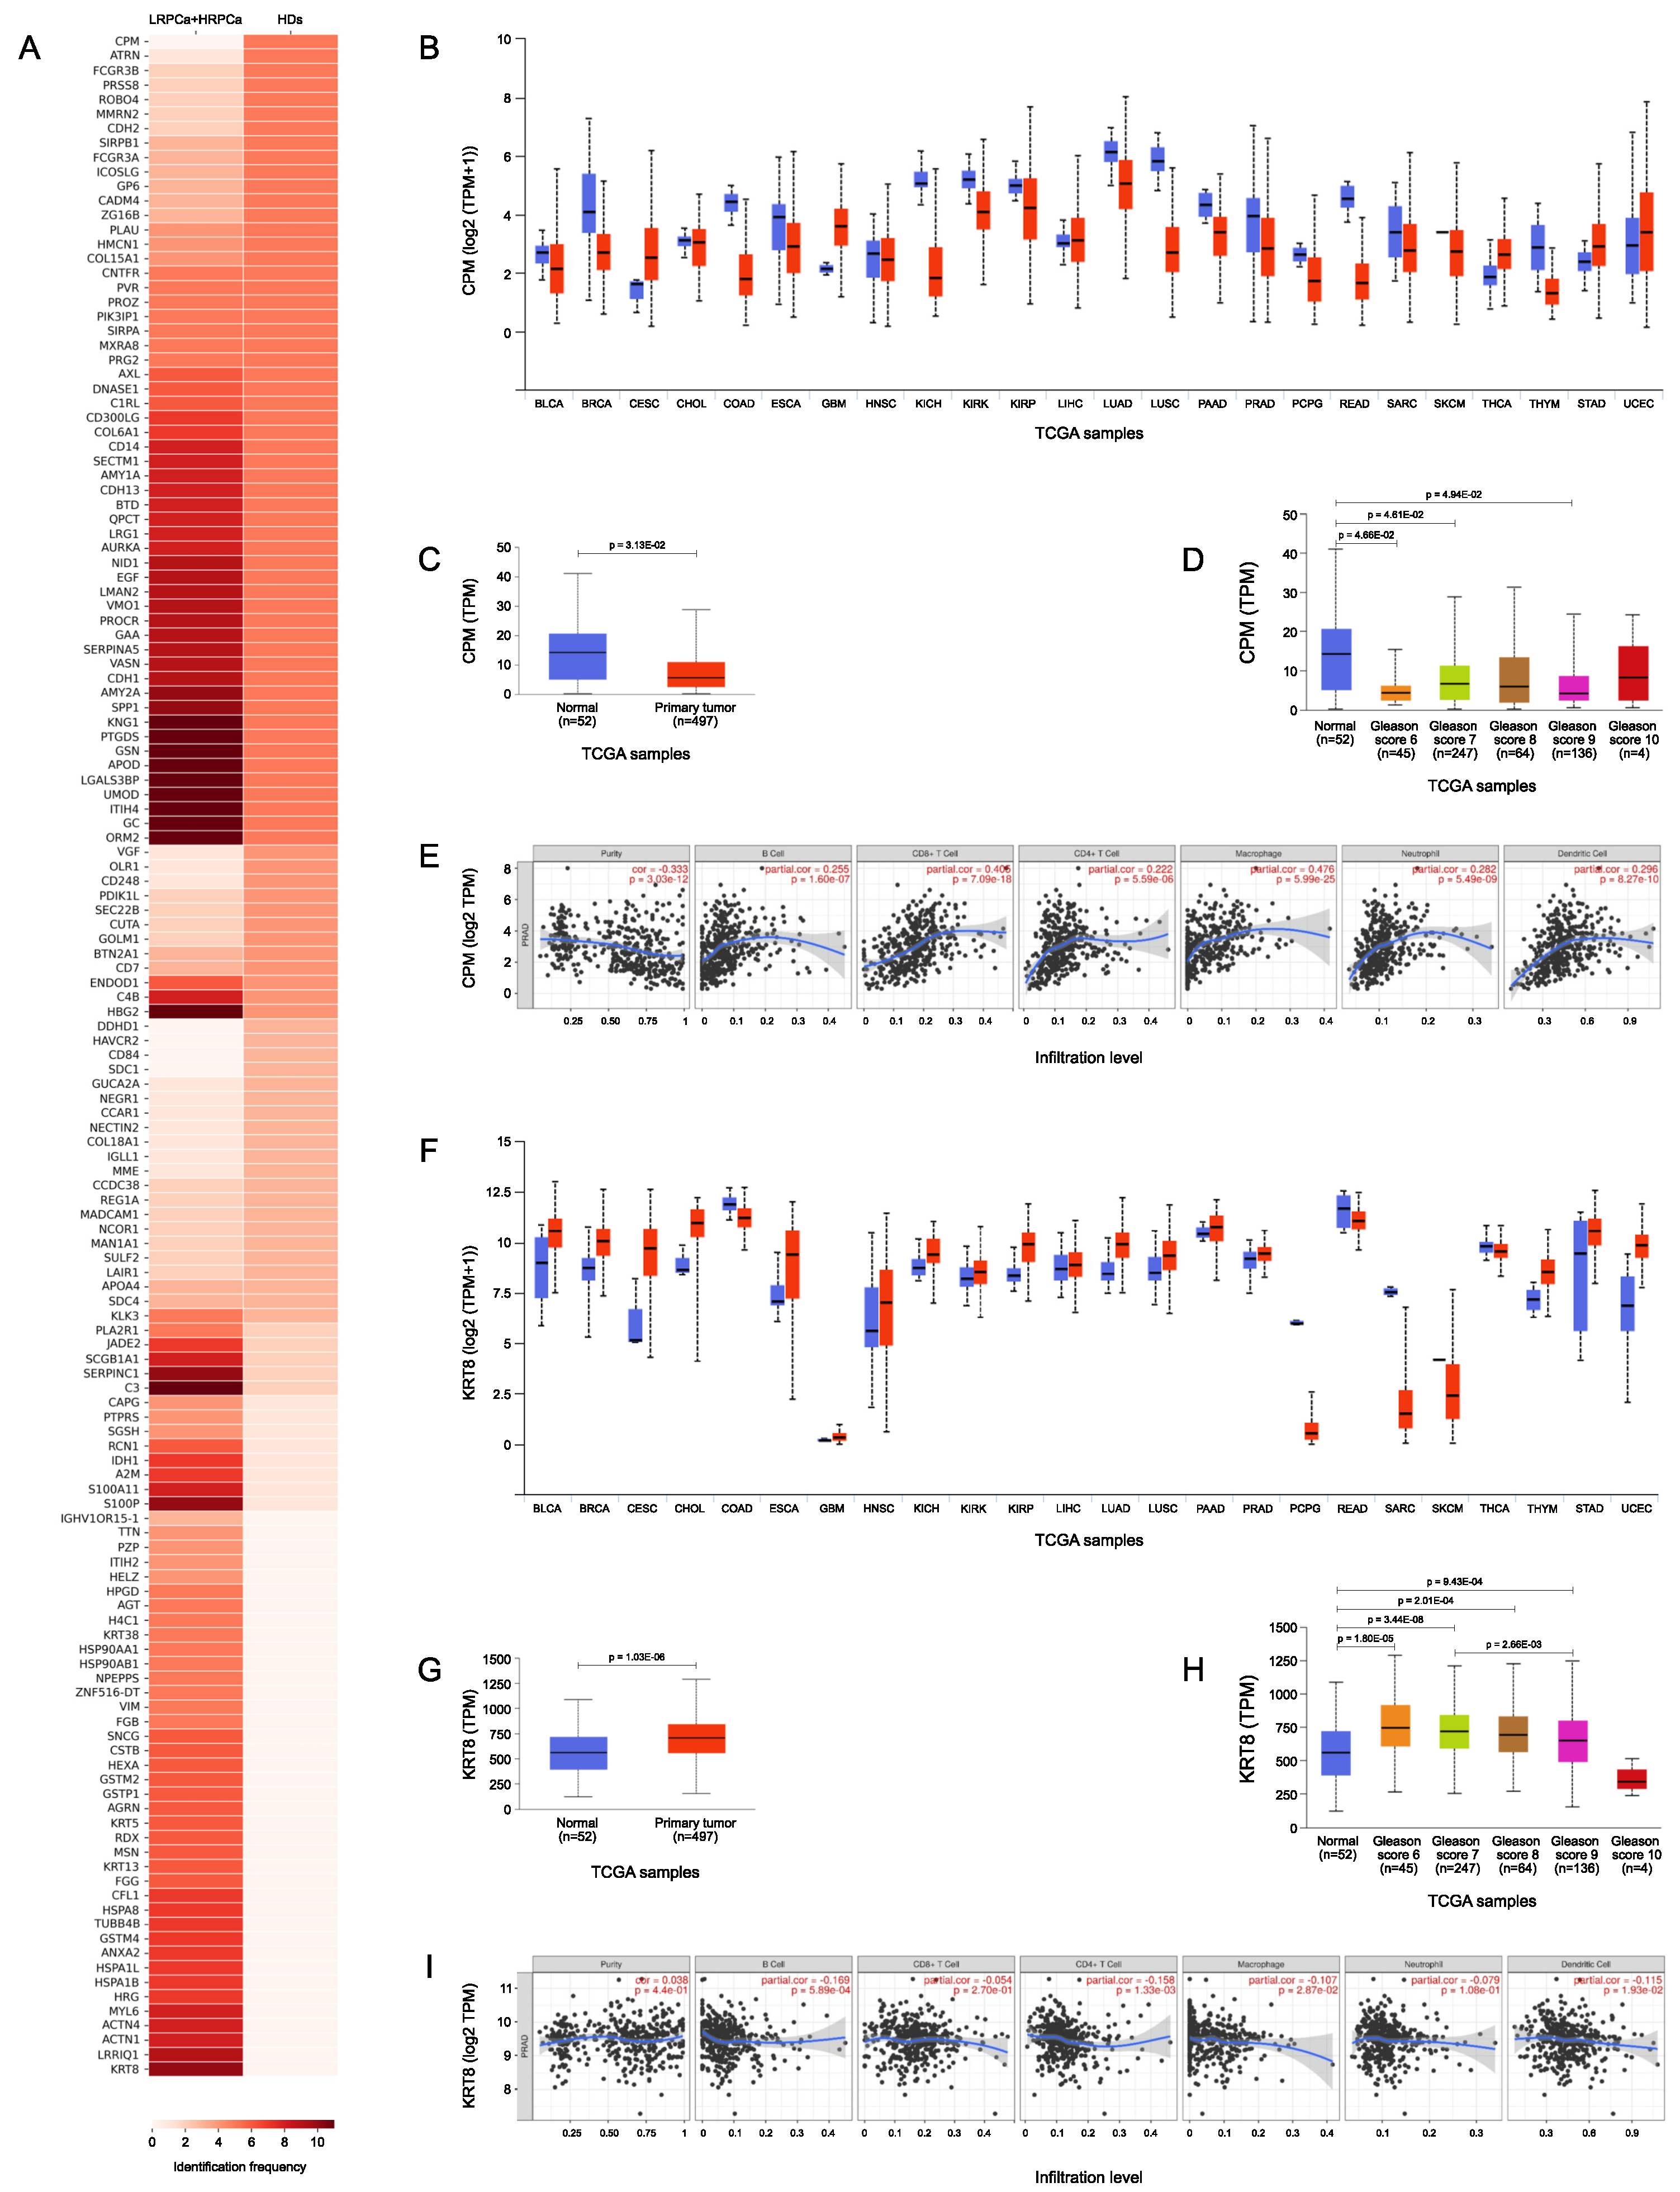
Figure 6.
TCGA bioinformatic analysis. (A) Heatmap illustrating the frequency of protein expression in urine samples from prostate cancer-affected individuals classified LRPCa and HRPCa. (B) TCGA expression data for ITIH2 across a pan-cancer dataset, comparing expression levels in tumor tissues versus their normal counterparts. (C) ITIH2 expression in normal vs primary tumor. (D) ITIH2 expression in normal versus PCa tissues with different Gleason score (GS). (E) TIMER analysis correlating ITIH2 expression with immune cell infiltration. (F) TCGA expression data for RCN1 across a pan-cancer dataset, comparing expression levels in tumor tissues versus their normal counterparts; Wilcoxon test p≤0.05. (G) RCN1 expression in normal vs primary tumor. (H) RCN1 expression in normal versus PCa tissues with different Gleason score (GS); Wilcoxon test p≤0.05. (I) TIMER analysis correlating RCN1 expression with immune cell infiltration.
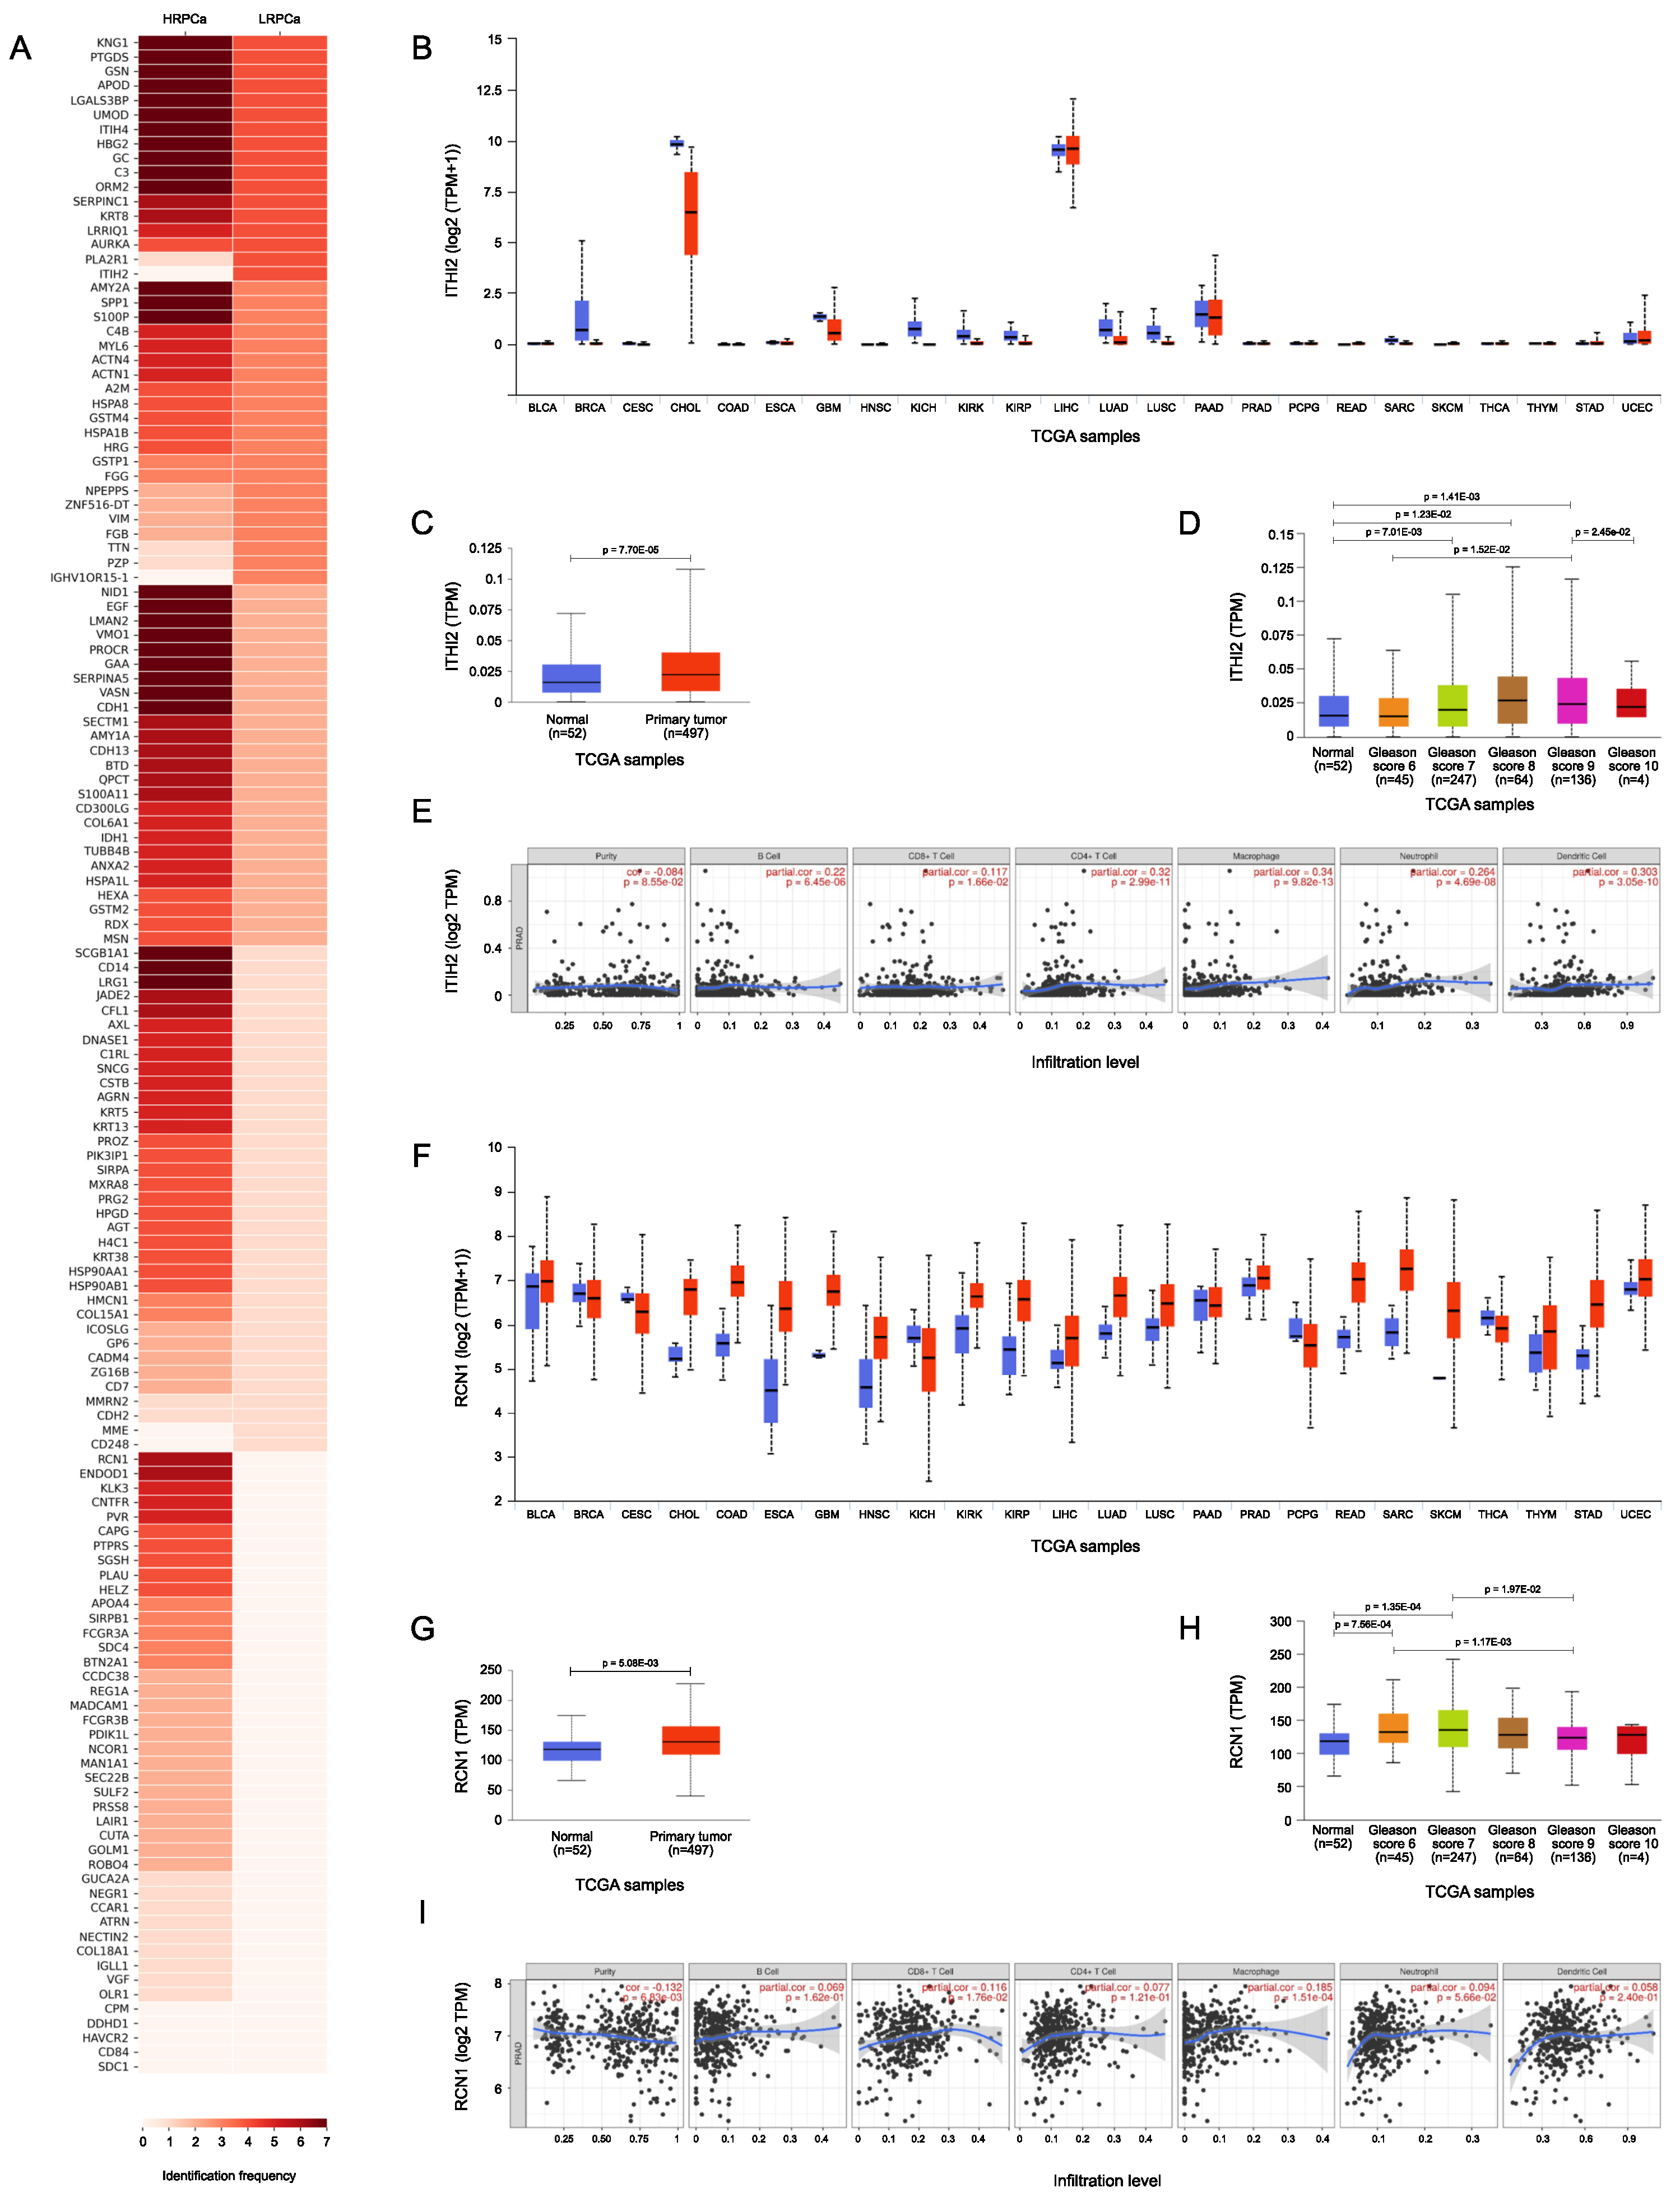

Table 1.
Proteins more frequently expressed, and statistically significant in the comparison between urine samples from HD subjects (n=5) versus those from patients diagnosed with PCa (n=11); Wilcoxon test p≤0.05
Table 1.
Proteins more frequently expressed, and statistically significant in the comparison between urine samples from HD subjects (n=5) versus those from patients diagnosed with PCa (n=11); Wilcoxon test p≤0.05
| UNIPROT ID | Protein Name | Gene Name | HDs | PCa | p-value |
|---|---|---|---|---|---|
| F8W111 | Carboxypeptidase M | CPM | 5 (100%) | 0 (0%) | 0.00063 |
| O75882 | Attractin | ATRN | 5 (100%) | 1 (9%) | 0.0034 |
| A0A3B3ISU3 | Low affinity immunoglobulin gamma Fc region receptor III-B | FCGR3B | 5 (100%) | 2 (18%) | 0.012 |
| Q16651 | Prostasin | PRSS8 | 5 (100%) | 2 (18%) | 0.012 |
| Q8WZ75 | Roundabout homolog 4 | ROBO4 | 5 (100%) | 2 (18%) | 0.012 |
| Q9H8L6 | Multimerin-2 | MMRN2 | 5 (100%) | 2 (18%) | 0.012 |
| P19022 | Cadherin-2 | CDH2 | 5 (100%) | 2 (18%) | 0.012 |
| P05787 | Keratin, type II cytoskeletal 8 | KRT8 | 0 (0%) | 10 (91%) | 0.0034 |
| P25815 | Protein S100-P | S100P | 1 (20%) | 10 (91%) | 0.024 |
| A8MY60 | Leucine-rich repeat and IQ domain-containing protein 1 | LRRIQ1 | 0 (0%) | 9 (82%) | 0.012 |
Table 2.
Proteins more frequently expressed, and statistically significant in the comparison between urine samples from LRPCa (n=4) versus HRPCa patients PCa (n=7); Wilcoxon test p≤0.05.
Table 2.
Proteins more frequently expressed, and statistically significant in the comparison between urine samples from LRPCa (n=4) versus HRPCa patients PCa (n=7); Wilcoxon test p≤0.05.
| UNIPROT ID | Protein Name | Gene Name | LRPCa | HRPCa | p-value |
|---|---|---|---|---|---|
| P19823 | Inter-alpha-trypsin inhibitor heavy chain H2 | ITIH2 | 4 (100%) | 0 (0%) | 0.034 |
| Q13018 | Secretory phospholipase A2 receptor | PLA2R1 | 4 (100%) | 1 (14%) | 0.034 |
| Q15293 | Reticulocalbin-1 | RCN1 | 0 (0%) | 6 (86%) | 0.034 |
| O94919 | Endonuclease domain-containing 1 protein | ENDOD1 | 0 (0%) | 6 (86%) | 0.034 |
| P11684 | Uteroglobin | SCGB1A1 | 1 (25%) | 7 (100%) | 0.047 |
| P08571 | Monocyte differentiation antigen CD14 | CD14 | 1 (25%) | 7 (100%) | 0.047 |
| P02750 | Leucine-rich alpha-2-glycoprotein | LRG1 | 1 (25%) | 7 (100%) | 0.047 |
* Tables may have a footer.
Disclaimer/Publisher’s Note: The statements, opinions and data contained in all publications are solely those of the individual author(s) and contributor(s) and not of MDPI and/or the editor(s). MDPI and/or the editor(s) disclaim responsibility for any injury to people or property resulting from any ideas, methods, instructions or products referred to in the content. |
© 2025 by the authors. Licensee MDPI, Basel, Switzerland. This article is an open access article distributed under the terms and conditions of the Creative Commons Attribution (CC BY) license (http://creativecommons.org/licenses/by/4.0/).
Copyright: This open access article is published under a Creative Commons CC BY 4.0 license, which permit the free download, distribution, and reuse, provided that the author and preprint are cited in any reuse.


