Preprint
Article

This version is not peer-reviewed.

Antioxidant and Antimicrobial Activity of Ferulic Acid Added to Dried Meat: Shelf-Life Evaluation

A peer-reviewed article of this preprint also exists.

Submitted:

09 January 2025

Posted:

13 January 2025

You are already at the latest version

Abstract

Ferulic acid (FA) is an antimicrobial and antioxidant phenolic compound located in the cell walls of plants and therefore classified as a natural antioxidant. The objective of this study was to assess the antimicrobial and antioxidant potential of FA as a substitute for nitrites in the elaboration of dried meat (DM) . Four treatments were evaluated: DM without nitrites or FA (control treatment; CT), DM with nitrites (NT), DM with 0.05% of FA (FT05), and DM with 0.1% of FA (FT1). The antioxidant activity (ABTS, DPPH, and FRAP), lipid oxidation (TBARS), and microbiological quality were evaluated throughout DM shelf life. Protein, fat, and ash content were not different among NT, FT05, and FT1 (p > 0.05). NT and FT05 had lower moisture content (p < 0.05) compared to CT and FT1. And NT had the highest sodium content (p < 0.05). Regarding color, no differences (p > 0.05) were found among NT and FT05 in L* and a* values, but FT05 presented the highest b* value among all treatments (p < 0.05). However, color differences (ΔE) values between NT and FA treatments indicate that the color change is not noticeable to the human eye. Meanwhile, FT1 and FT05 exhibited the highest (p < 0.05) AA and the lowest lipid oxidation throughout their shelf life. Total aerobic mesophiles counts were detected only on day 1 and were lower (p < 0.05) in the treatments with FA. Finally, the change in the formulation of dried meat by using ferulic acid instead of nitrites was not sensorially detected by panelists. These findings suggest that incorporating natural antioxidants such as FA can improve the oxidative stability of dried meat, and it has a potential application as an antioxidant in meat products. However, further research is needed to study the effect of nitrite substitution using FA in combination with other potential natural antioxidants.

Keywords: 
;  ;  ;  ;  

1. Introduction

Dehydration is one of the most important food preservation techniques, which involves reducing the moisture levels of food to prevent spoilage and preserve its quality [1]. The United States Department of Agriculture (USDA) defines dried meat as meat that has been preserved through the removal of moisture, typically by methods such as air drying, smoking, or using a dehydrator; this process not only enhances the flavor but also extends the shelf life of the meat by inhibiting microbial growth [2]. One of the first non-microbial causes of spoilage in dehydrated meat foods is oxidation [3].
Latin America has several regions that are famous for producing dried meat, which has a variety of flavors and preparation methods and even has different names depending on where it is made. It is made primarily from beef and does not undergo a maturation process before being dried. Supermarkets, liquor stores, and street vendors often offer this as a snack. This accessibility makes it a popular snack among locals and tourists.
Dried meat and beef jerky are often confused, but they have distinct characteristics and production methods. In general terms, dried meat refers to any meat that has undergone a drying process to remove moisture, which can include various methods, such as air drying, sun drying, or dehydrating. This can be made from different types of meat (beef, pork, etc.) and may not necessarily include the seasoning or curing processes, which are typical in jerky production [4]. Beef jerky is made from beef that is seasoned and cured before being dried. If a seasoning process is included, the brine usually contains salt, sugar, and nitrites.
Nitrites are used to give the dried meat its unique color and flavor characteristics. Although nitrites are also used to suppress the oxidation of lipids and proteins and limit the growth of microorganisms [5]. However, they are known carcinogens, especially if consumed constantly or in excess [5]. In fact, the International Agency for Research on Cancer (IARC) reported that ingested nitrite from processed meat can lead to colorectal cancer in humans [6]. The lethal oral dose for humans is 33 to 250 mg of nitrite per kilogram of body weight [6]. Meanwhile, prospective studies in the US and the EU, as well as meta-analyses of epidemiological data, have found that eating processed meat for a long time is linked to higher death rates, colorectal cancer, type 2 diabetes, and heart disease [7].
Alternatives to replace synthetic antioxidants are natural polyphenolic compounds extracted from plants, like ferulic acid (FA). FA is the most abundant phenolic compound of the hydroxycinnamates group; it is part of the cell wall of plants, fruits, vegetables, animal feed, and cereal grains. It has a wide range of health-related effects, including antioxidant, anti-inflammatory, antimicrobial, antiallergic, anticancer, antithrombotic, antiviral, hepatoprotective, and vasodilator [8,9]. By lowering the amount of UV light that hits these molecules [8], FA can protect other light-sensitive compounds from oxidative damage. But FA does more than just get rid of free radicals; it also stops enzymes that make free radicals and boosts the activity of enzymes that do the scavenging [10].
Likewise, protein consumption trends vary significantly from one region to another, due to cultural patterns, economic factors, and dietary habits. Thus, in Western countries, there is a preference for consuming proteins of plant origin, whereas other regions continue to prioritize traditional animal proteins. However, regardless of the protein source, a favorable proportion of consumers are looking for foods made with natural ingredients. Therefore, the objective of this study was to evaluate the effect of the addition of FA on the physicochemical, antioxidant, antimicrobial, and sensorial characteristics of dried meat during its shelf life.

2. Materials and Methods

2.1. Treatments

One liter of brine was prepared for each treatment. For the control treatment (CT), the brine was prepared by dissolving 50 g (5%) of salt and 10 g (1%) of sugar in 1 L of water. First, 50 grams (5%) of salt, 10 grams (1%) of sugar, and 20 grams (2%) of cured salt (6.25% sodium nitrite and 93.75% salt) were mixed in 1 liter of water to make the brine. The above formulation gives a sodium nitrite concentration of 1250 ppm (parts per million). The typical concentration of sodium nitrite in a brine solution for curing meats is generally around 0.1% to 0.2% by weight. This translates to approximately 1000 to 2000 ppm. For the ferulic treatments (FT), two addition percentages were used to substitute cured salt in the brine: 0.05 and 0.1% (FT05 and FT1, respectively).

2.2. Dried Meat Elaboration

A piece (6.500 kg) of Angus beef-round steak was trimmed free of external fat, frozen, slightly tempered (for uniform slicing purposes), and sliced (7mm thick) perpendicular to the muscle fibers. Manufacturing did not begin until all slices were completely thawed (0–3.3°C). Then, the meat was divided into 12 portions to elaborate three replicates (540 g) of each treatment. To prepare the dried meat, each slice was submerged for 15 seconds in the corresponding brine and then left to drain for 10 minutes on a tray at room temperature. Then, the meat was placed in the dehydrator (Nictemaw, FD-08DGP-L, China) for 4 hours at 70°C. Once the drying process was finished, the meat was left to cool and packed in polystyrene bags. During the shelf life, the meat was stored in a dry and dark place at room temperature.

2.3. Physicochemical Composition

Physicochemical analysis (moisture, ash, fat, and protein) of treatments were carried out in triplicate after 24 hours of storage according to the AOAC (926.08, 935.42, 989.05, and 991.20, respectively) [11].

2.4. pH

The pH was measured using a potentiometer (Thermo ScientificTM, OrionTM, Versa Star ProTM, Vantaa, Finland) previously calibrated. First the beef jerky was ground in a grinder (Hamilton Beach, 80335RV, China). Then, 5 g of meat were taken and mixed with 45 mL of distilled water and stirred for two minutes until the mixture was homogeneous. Then the pH electrode was immersed in the mixture until the pH value of the monitor became constant. This measurement was carried out in triplicate.

2.5. Sodium Determination

The sodium determination was conducted according to the Mexican Official Standard NOM-F-150 S-1981 (Food for Humans—Determination of sodium chloride in brines) [12]. First, from 0.15 to 0.17 g of ground meat was placed in an Erlenmeyer flask. Then, 75 mL of boiling water was added and allowed to stand for 10 to 15 minutes, stirring from time to time until a temperature between 50 and 55°C (titration temperature) was obtained. Then, 1 mL of potassium chromate indicator solution (5% w/v) was added. The solution was titrated with silver nitrate (0.1 N) while stirring until a permanent and detectable orange-brown color appeared. The following formula was used for the calculations and expression of the results:
% N a C l = 0.0585 * N V 1 V 0 * m * 100
where: N is the normality of the silver nitrate solution, V1 is the mL of silver nitrate spent in the titration, V0 is the mL of silver nitrate spent in the blank test (distilled water), m is mass in grams of the sample used, and 0.0585 is the milliequivalent of sodium chloride.

2.7. Color

Color was measured with a CR-410 colorimeter (Konica Minolta®, Japan) using the CIELAB system technique for L*, a*, and b*. Where L* is an indicator of lightness (black to white), the values of a* vary from green (negative numbers) to red (positive numbers), and b* vary from blue (negative values) to yellow (positive values). The determinations were performed in triplicate, and the L*, a*, and b* values were used to calculate the color difference (∆E). The ΔE of the treatments was calculated using as a reference the average of L*, a*, and b* parameter readings of the control treatment and using the following formula [13]:
Δ E = L s L c 2 + a h s a h c 2 + b h s b h c 2
where ΔE is the color difference; Lc, ahc, and bhc are the control L, a and b parameters; and Ls, ahs, and bhs are the treatment L, a and b parameters.

2.8. Antioxidant Activity (AA)

Antioxidant activity was investigated by the ABTS, DPPH, and FRAP methodologies. All determinations were performed in triplicate and as follows:.
Antioxidant activity by the ABTS ́ method was performed according to Thaipong et al. (2006) [14] and it was reported as mg Trolox equivalent (mg TE/100 g), using a Trolox calibration curve (y = -10.467x + 1.0323, R2 = 0.9758).
Antioxidant activity by the DPPH (2,2-Diphenyl-1-Picrylhydrazyl) methodology was conducted according to Thaipong et al. (2006) [14], and it was expressed as mg Trolox equivalent (mg TE/100 g), using a Trolox calibration curve (y = −0.83715x + 1.0209, R2 = 0.9602).
Antioxidant activity by the FRAP method was performed according to Sigma-Aldrich commercial kit instructions, and it was reported as mM ferrous equivalent (mM Fe2+ equivalents) using the standard curve (y = 0.0624971 + 0.0328649, R2 = 0.992). The following formula was used to determine the ferrous equivalent in mM of the sample:
S a m p l e   m M   F e r r o u s   e q u i v a l e n t = B   X   D V
where B is the ferrous ammonium sulfate amount from the standard curve (nmol), D is the sample dilution factor, and V is the sample volume added into the reaction well (µL).

2.9. Lipid Oxidation

Lipid oxidation was determined by the quantification of thiobarbituric acid reactive substances (TBARS) according to Pfalzgraf et al. (1995) with some modifications [15]. Briefly, 1 g of meat was homogenized with 5 mL of trichloroacetic acid (1%), then the homogenate was centrifuged, and the supernatant was decanted. Then, 2 mL of the filtrate was mixed with 2 mL of TBA reagent (20 mM). The mixture was heated in a water bath at 80°C for 20 minutes. Once it was cool, 200 μL were put into a 96-well microplate (3591, COSTAR®, Corning, NY, USA) and the absorbance at 531 nm was measured with a spectrophotometric plate reader (Multiskan go, Thermo Scientific, Vantaa, Finland). TBARS results values were expressed as milligrams of malondialdehyde (MDA) per kilogram of dried meat (mg MDA/Kg), according to a standard calibration curve constructed with increasing concentrations (1,1,3,3,3, 4.73 mM from 0 to 30 μL) of tetraethoxypropane (TEP), obtaining the following equation: y = 144.2x + 0.0066, R2 = 0.9977.

2.10. Microbiological Analysis

Enumerations for microbial determinations were made for total aerobic mesophilic count (TAC, AOAC 990.12) on plate count enriched agar (PCA, CM0325, Oxoid©, Basingstoke, UK), total coliforms (AOAC 991.14) on red bile violet agar (RBV, 70188, Fluka, Spruce, USA), and molds and yeasts (AOAC 997.02) on potato dextrose agar (PDA; 213300, BD BIOXON®, Heidelberg, Germany) acidified with 10% tartaric acid (T400 DL-tartaric, Merck, Saint Louis, MO, USA). For the above, 10 g of each treatment were aseptically homogenized in 90 mL of maximum recovery diluent (MRD, CM0733, Oxoid©, Basingstoke, UK) and mixed in a Stomacher® (Lab Blender, Seward, London, UK) at maximum speed for 2 min. The homogenized sample was serially diluted (1:10) in MRD (CM0733, Oxoid©, Basingstoke, UK) according to Mexican Official Standards. Each dilution (100 µL) was added to the media, and incubated for 48 h aerobically at 36°C, except for molds and yeasts, which were incubated at 25°C. Colony forming unit (CFU) numbers were counted on plates with numbers between 10 and 200 CFU, and the results were transformed from CFU/g to Log10 CFU/g [11].

2.11. Sensory Evaluation

The sensory evaluation was carried out with an untrained panel of 59 consumers. According to Meilgaard et al. (2007), who recommend a panel of 25 to 50 subjects per product in laboratory tests [16]. Individuals aged 18 to 60 years sensorially evaluated the beef jerky (NT and FT1) using a simple difference test. The objective of this test is to determine if there is a sensory difference between two products. Samples were identified with a 3-digit code and randomly presented to the panelists. Panelists were instructed to rinse their palates with water between samples. The NT and FT1 treatments were selected because the first includes dried meat prepared with nitrites, which is how most consumers consume it, and the second because it was the treatment that showed the greatest antioxidant activity. In addition, panelists were asked the frequency of consumption of beef jerky.

2.12. Statistical Analysis

A completely randomized one-way design was used. The response variables were physicochemical composition (moisture, ash, fat, and protein), pH, sodium content, color (L*, a*, b*, ΔE*), antioxidant activity (ABTS, DPPH, FRAP), lipid oxidation, microbiological quality (total aerobic count, molds and yeasts, and total coliforms). Data was analyzed by the ANOVA procedure using the General Linear Model (GLM) of SAS, version 9.4 (SAS Institute Inc., Cary, NC, USA). Subsequently, a multiple comparison of means was performed by Tukey's test, using a α value of 0.05. Regarding the sensory evaluation, a Chi2 test was performed, with the degrees of freedom equal to 1, and an α value of 0.05. Correlations among variables were performed with Pearson’s correlation test.
The physicochemical composition (moisture, ash, fat, and protein), color, pH, and sodium content were analyzed to compare means at a significance of p < 0.05 with the model:
yij = μ + τi + εij
where yij is the response variable measured in the j-th repetition of the i-th treatment, τi is the effect of the i-th treatment, and εij is the random error corresponding to the j-th repetition of the i-th treatment.
Antioxidant activity, lipid oxidation, and antimicrobial activity were evaluated over time with the model:
yijk = μ + τi + Pj + τP(ij)ijk
where yijk is the response variable measured in the k-th repetition of the i-th treatment in the j-th period, τi is the effect of the i-th treatment, Pj is the effect of the j-th period, τP(ij) is the effect of the interaction of the i-th treatment with the j-th period, and εijk is the random error corresponding to the k-th repetition of the i-th treatment in the j-th period.

3. Results and Discussion

3.1. Physicochemical Composition and Correlation Between Variables
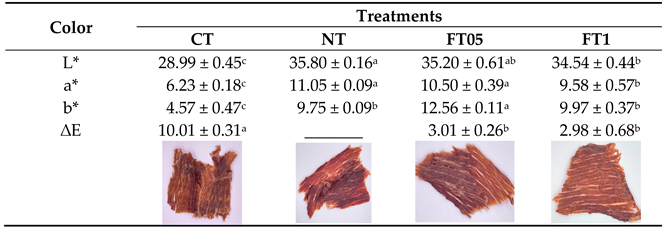
The physicochemical results are shown in Table 1. The pH of the samples was 5.5 (p > 0.05) for all the treatments. The protein and ash content did not show significant differences (p > 0.05) among treatments. Regarding fat percentage, CT (14.77 ± 0.51) had the lowest percentage, presenting the lowest content (p < 0.05) compared to the rest of the treatments, which did not show any difference between them (p > 0.05). Regarding moisture content, CT had the highest value (7.58 ± 0.52), followed by FT1 (6.4 ± 0.21) (p < 0.05), and then by NT (5.2 ± 0.30) and FT05 (5.24 ± 0.33), which showed no differences between them (p > 0.05). Besides, NT had the highest sodium content (p < 0.05, 3130.56 mg Na/100 g), and CT (2715.28 mg Na/100 g), TF05 (2507.64 mg Na/100 g), and FT1 (2539.58 mg Na/100 g) did not present differences (p > 0.05).
The pH of dried meat is influenced by a combination of intrinsic factors, such as meat composition and post-mortem changes, as well as extrinsic factors like processing methods and storage conditions. The pH found in this study coincides with that reported in beef jerky that was hot air-dried and microwave-assisted and ranged from 5.56 to 5.58 [17].
The fat content found in this study was lower than those reported in beef jerky (18.2 ± 0.551) and higher than those reported for chicken (8.23 ± 0.74) and ostrich (4.49 ± 0.14) jerky [18]. As mentioned, the fat percentage may vary depending on the animal's breed, age, and muscle used to develop dried meat [18]. On the other hand, the traditional method for making dried meat often involves removing the fat from the meat; however, as this is done manually, it is possible to retain some fat in the piece used. This could explain the differences found in the fat content between treatments in this study.
Regarding moisture content, dried meat should have up to 10% of moisture to protect meat quality during storage; in this study, the four treatments were below that value [18]. Besides, studies indicate a negative correlation between moisture and fat content in meat; as fat content increases, moisture content tends to decrease, and vice versa [19]. This correlation was observed in NT, FT05, and FT1 treatments (Table 4, Table 5, and Table 6). This relationship is particularly evident in various types of meat, including pork and beef. Although this correlation was not present in CT, the NT, FT05, and FT1 treatments had higher fat content and lower moisture content, contrary to CT, which had higher moisture and lower fat content (Table 1). In this regard, research indicates that when beef samples are cured with acidic solutions, the moisture content tends to be higher compared to control samples cured solely with salt [20]. The brine used in FT1 had a pH of 3.9, and the brine for FT05 had a pH of 4.3. In addition, FA has a carboxylic acid group (-COOH) and a phenolic hydroxyl group (-OH); these functional groups can interact with water through hydrogen bonding when they are protonated [21]. The above occurs when these functional groups are found in solutions at low pH.
Concerning sodium content, NT presented the highest sodium content; this could be attributed to the addition of the cured salt during the curing process, since these are composed of sodium [22]. Likewise, this treatment also showed the lowest moisture content, along with FT05. The presence of NaCl creates an osmotic environment, which causes water to leave the cells through osmosis. This process leads to cellular dehydration and therefore to moisture loss. Traditionally, meat curing is described as the addition of substances such as salt, nitrite, and sodium nitrate to fresh meat cuts to remove moisture and reduce the water activity of the tissues to prevent spoilage as well as to obtain its characteristic color [5,23,24,25].

3.2. Color

The values of color are shown in Table 2. In terms of L*, the CT had the lowest value (p < 0.05, 28.99 ± 0.45). The NT (35.80 ± 0.16) and FT05 (35.20 ± 0.61) had the greatest values (p < 0.05). Although FT05 was not different (p > 0.05) from FT1 (34.54 ± 0.44).
Regarding a*, all treatments were positive, indicating a tendency to red. The greatest a* values (p < 0.05) were for NT (11.05 ± 0.09) and FT05 (10.50 ± 0.39), although these did not present differences (p > 0.05) between them. These were followed by FT1 (9.58 ± 0.57) and CT (6.23 ± 0.18), which had the lowest a* value (p < 0.05).
In terms of b*, all treatments presented positive values indicating a tendency to yellow. The FT05 (12.56 ± 0.11) had the highest value (p < 0.05), followed by CT (9.75 ± 0.09) and FT1 (9.97 ± 0.37), which did not have differences between them (p > 0.05). And finally, CT, which presented the lowest b* value (4.57 ± 0.47, p < 0.05).
To obtain the ∆E, the NT values were considered as the control since nitrites are added to cured meat to develop its characteristic color and flavor [6]. Values of ΔE between 0 and 3.0 indicate that the color change is not noticeable to the human eye [26]. FT1 presented a value under 3 (2.98 ± 0.68), and FT05 had a value close to 3.0 (3.01 ± 0.26), and it was no different from FT1 (p > 0.05).
The color of dried meat is an important parameter that affects consumer perception and acceptability. Numerous studies have investigated the methods for assessing and comprehending the color attributes of beef, especially regarding jerky production. The ideal color for beef products, including dried meat, is a vibrant cherry red. Deviations towards brownish tones are often associated with quality loss, spoilage, or improper processing conditions [27]. Similarly, a* (10–12), L* (32–33), and b* (9–10) values were reported in dried meat salted by immersion in mixed solutions of NaCl and KCl [28]. However, lower a*, b*, and L* values were reported in beef jerky cured in a solution consisting of 11.5% salt, 3.0% sugar, 3.9% starch syrup, 0.2% black pepper, 0.024% sodium nitrite, and 9.0% salt-water (based on raw meat weight) [29]. These differences could be due to the cured composition solutions.
Meanwhile, a study reported no significant correlation between muscle color and total fat, protein, dry matter, and moisture content in beef meat [30]. In this study, the b* value of CT was positively correlated with moisture content (Table 3). While for NT, FT05, and FT1, L* and a* values were positively correlated with moisture and ashes content and, a* value correlated positively with moisture and ashes (Table 4, Table 5 and Table 6).
Color changes during drying are caused by oxidation, changes in meat surface structure, and non-enzymatic browning reactions [26,31,32]. In processed meats, myoglobin (Mb) chemical structure presents noticeable differences depending on the type of packaging used and the process applied. Cooking leads to variations in the color of meat products, from bright cherry red in bloomed fresh meat to dull brown in cooked meat [33]. The resistance to heat-induced denaturation of Mb is in the next order: deoxymyoglobin (DeoxyMb) (purple-red) > oxymyoglobin (OxyMb) (red) > metmyoglobin (MetMb) (brown) [34]. In the presence of oxygen, Mb is oxidized to oxymyoglobin and shows a bright pink-red color [30].
The formation of brown metMb during cooking results from the oxidation of the three ferrous forms to a ferric state and is associated with meat discoloration. However, a decrease in OxyMb concentration was observed with increasing acidity [30]. As mentioned above, the brine for FT1 had a lower pH than the brines for FT05 and NT, which could explain why FT1 presented a lower a* value compared to FT05 and NT and a lower L* value than NT.
FA is a phenolic compound known for its antioxidant capabilities. In the context of meat products, it helps to mitigate oxidation, which can adversely affect color stability, which is due to the formation of metmyoglobin and other pigments that can darken the meat.
Table 2. Color values of dried meat (mean ± standard deviation).
Preprints 145716 i001
CT, dried meat without nitrites or ferulic acid; NT, dried meat with nitrites; FT05, dried meat with 0.05% of ferulic acid; FT1, dried meat with 0.1% of ferulic acid. a,b,c Different literals between columns denote significant differences (p < 0.05) between treatments. L* = lightness, lighter (+) and darker (-); a* = green (-) and red (+); b* = blue (-) and yellow (+); ΔE = color difference. a,b,c Different literals between rows show a significant difference (p < 0.05) between treatments.
Table 3. Correlation between physicochemical composition and color variables of CT.
Moisture Ashes Fat Protein L* a* b* Sodium
Moisture 1 -0.375 0.879 -0.966 -0.817 0.018 1.000* -0.484
p-value 0.755 0.316 0.168 0.391 0.988 0.018 0.678
Ashes 1 -0.772 0.121 0.840 0.920 -0.401 0.993
p-value 0.439 0.923 0.365 0.256 0.737 0.077
Fat 1 -0.725 -0.993 -0.461 0.892 -0.843
p-value 0.484 0.074 0.695 0.298 0.362
Protein 1 0.639 -0.278 -0.958 0.240
p-value 0.558 0.821 0.186 0.846
L 1 0.561 -0.833 0.900
p-value 0.621 0.373 0.287
a 1 -0.010 0.866
p-value 0.993 0.333
b 1 -0.509
p-value 0.660
Sodium 1
CT, dried meat without nitrites or ferulic acid. p-value = Level of significance of the correlation.* = The correlation is significant at the 0.05 level (two-tailed). ** = The correlation is significant at the 0.01 level (two-tailed). L* = lightness, lighter (+) and darker (-); a* = green (-) and red (+); b* = blue (-) and yellow (+).
Table 4. Correlation between physicochemical composition and color variables of NT.
Moisture Ashes Fat Protein L a b Sodium
Moisture 1 1.000** -1.000** -1.000** 1.000** 1.000** -0.866 0.000
p-value 0.000 0.004 0.004 0.000 0.000 0.333 1.000
Ashes 1 -1.000** -1.000** 1.000** 1.000** -0.866 0.000
p-value 0.004 0.004 0.000 0.000 0.333 1.000
Fat 1 1.000** -1.000** -1.000** 0.869 0.007
p-value 0.009 0.004 0.004 0.329 0.996
Protein 1 -1.000** -1.000** 0.863 -0.006
p-value 0.004 0.004 0.337 0.996
L 1 1.000** -0.866 0.000
p-value 0.000 0.333 1.000
a 1 -0.866 0.000
p-value 0.333 1.000
b 1 0.500
p-value 0.667
Sodium 1
NT, dried meat with nitrites. p-value = Level of significance of the correlation.* = The correlation is significant at the 0.05 level (two-tailed). ** = The correlation is significant at the 0.01 level (two-tailed). L* = lightness, lighter (+) and darker (-); a* = green (-) and red (+); b* = blue (-) and yellow (+).
Table 5. Correlation between physicochemical composition and color variables of FT05.
Moisture Ashes Fat Protein L a b Sodium
Moisture 1 1.000** -1.000** -1.000** 1.000** 1.000** -.866 .866
p-value 0.000 0.004 0.004 0.000 0.000 0.333 0.333
Ashes 1 -1.000** -1.000** 1.000** 1.000** -0.866 0.866
p-value 0.004 0.004 0.000 0.000 0.333 0.333
Fat 1 1.000** -1.000** -1.000** 0.869 -0.869
p-value 0.000 0.004 0.004 0.329 0.329
Protein 1 -1.000** -1.000** 0.869 -0.869
p-value 0.004 0.004 0.329 0.329
L 1 1.000** -0.866 0.866
p-value 0.000 0.333 0.333
a 1 -0.866 0.866
p-value 0.333 0.333
b 1 -1.000**
p-value 0.000
Sodium 1
FT05, dried meat with 0.05% of ferulic acid. p-value = Level of significance of the correlation.* = The correlation is significant at the 0.05 level (two-tailed). ** = The correlation is significant at the 0.01 level (two-tailed). L* = lightness, lighter (+) and darker (-); a* = green (-) and red (+); b* = blue (-) and yellow (+).
Table 6. Correlation between physicochemical composition and color variables of FT1.
Moisture Ashes Fat Protein L a b Sodium
Moisture 1 1.000** -1.000** -1.000** 1.000** 1.000** -.866 .866
p-value 0.000 0.004 0.004 0.000 0.000 0.333 0.333
Ashes 1 -1.000** -1.000** 1.000** 1.000** -0.866 0.866
p-value 0.004 0.004 0.000 0.000 0.333 0.333
Fat 1 1.000** -1.000** -1.000** 0.869 -0.869
p-value 0.009 0.004 0.004 0.329 0.329
Protein 1 -1.000** -1.000** 0.863 -0.863
p-value 0.004 0.004 0.337 0.337
L 1 1.000** -0.866 0.866
p-value 0.000 0.333 0.333
a 1 -0.866 0.866
p-value 0.333 0.333
b 1 -1.000**
p-value 0.000
Sodium 1
FT1, dried meat with 0.1% of ferulic acid. p-value = Level of significance of the correlation. = The correlation is significant at the 0.05 level (two-tailed). **= The correlation is .significant at the 0.01 level (two-tailed). L* = lightness, lighter (+) and darker (-); a* = green (-) and red (+); *b = blue (-) and yellow (+).

3.3. Antioxidant Activity (AA)

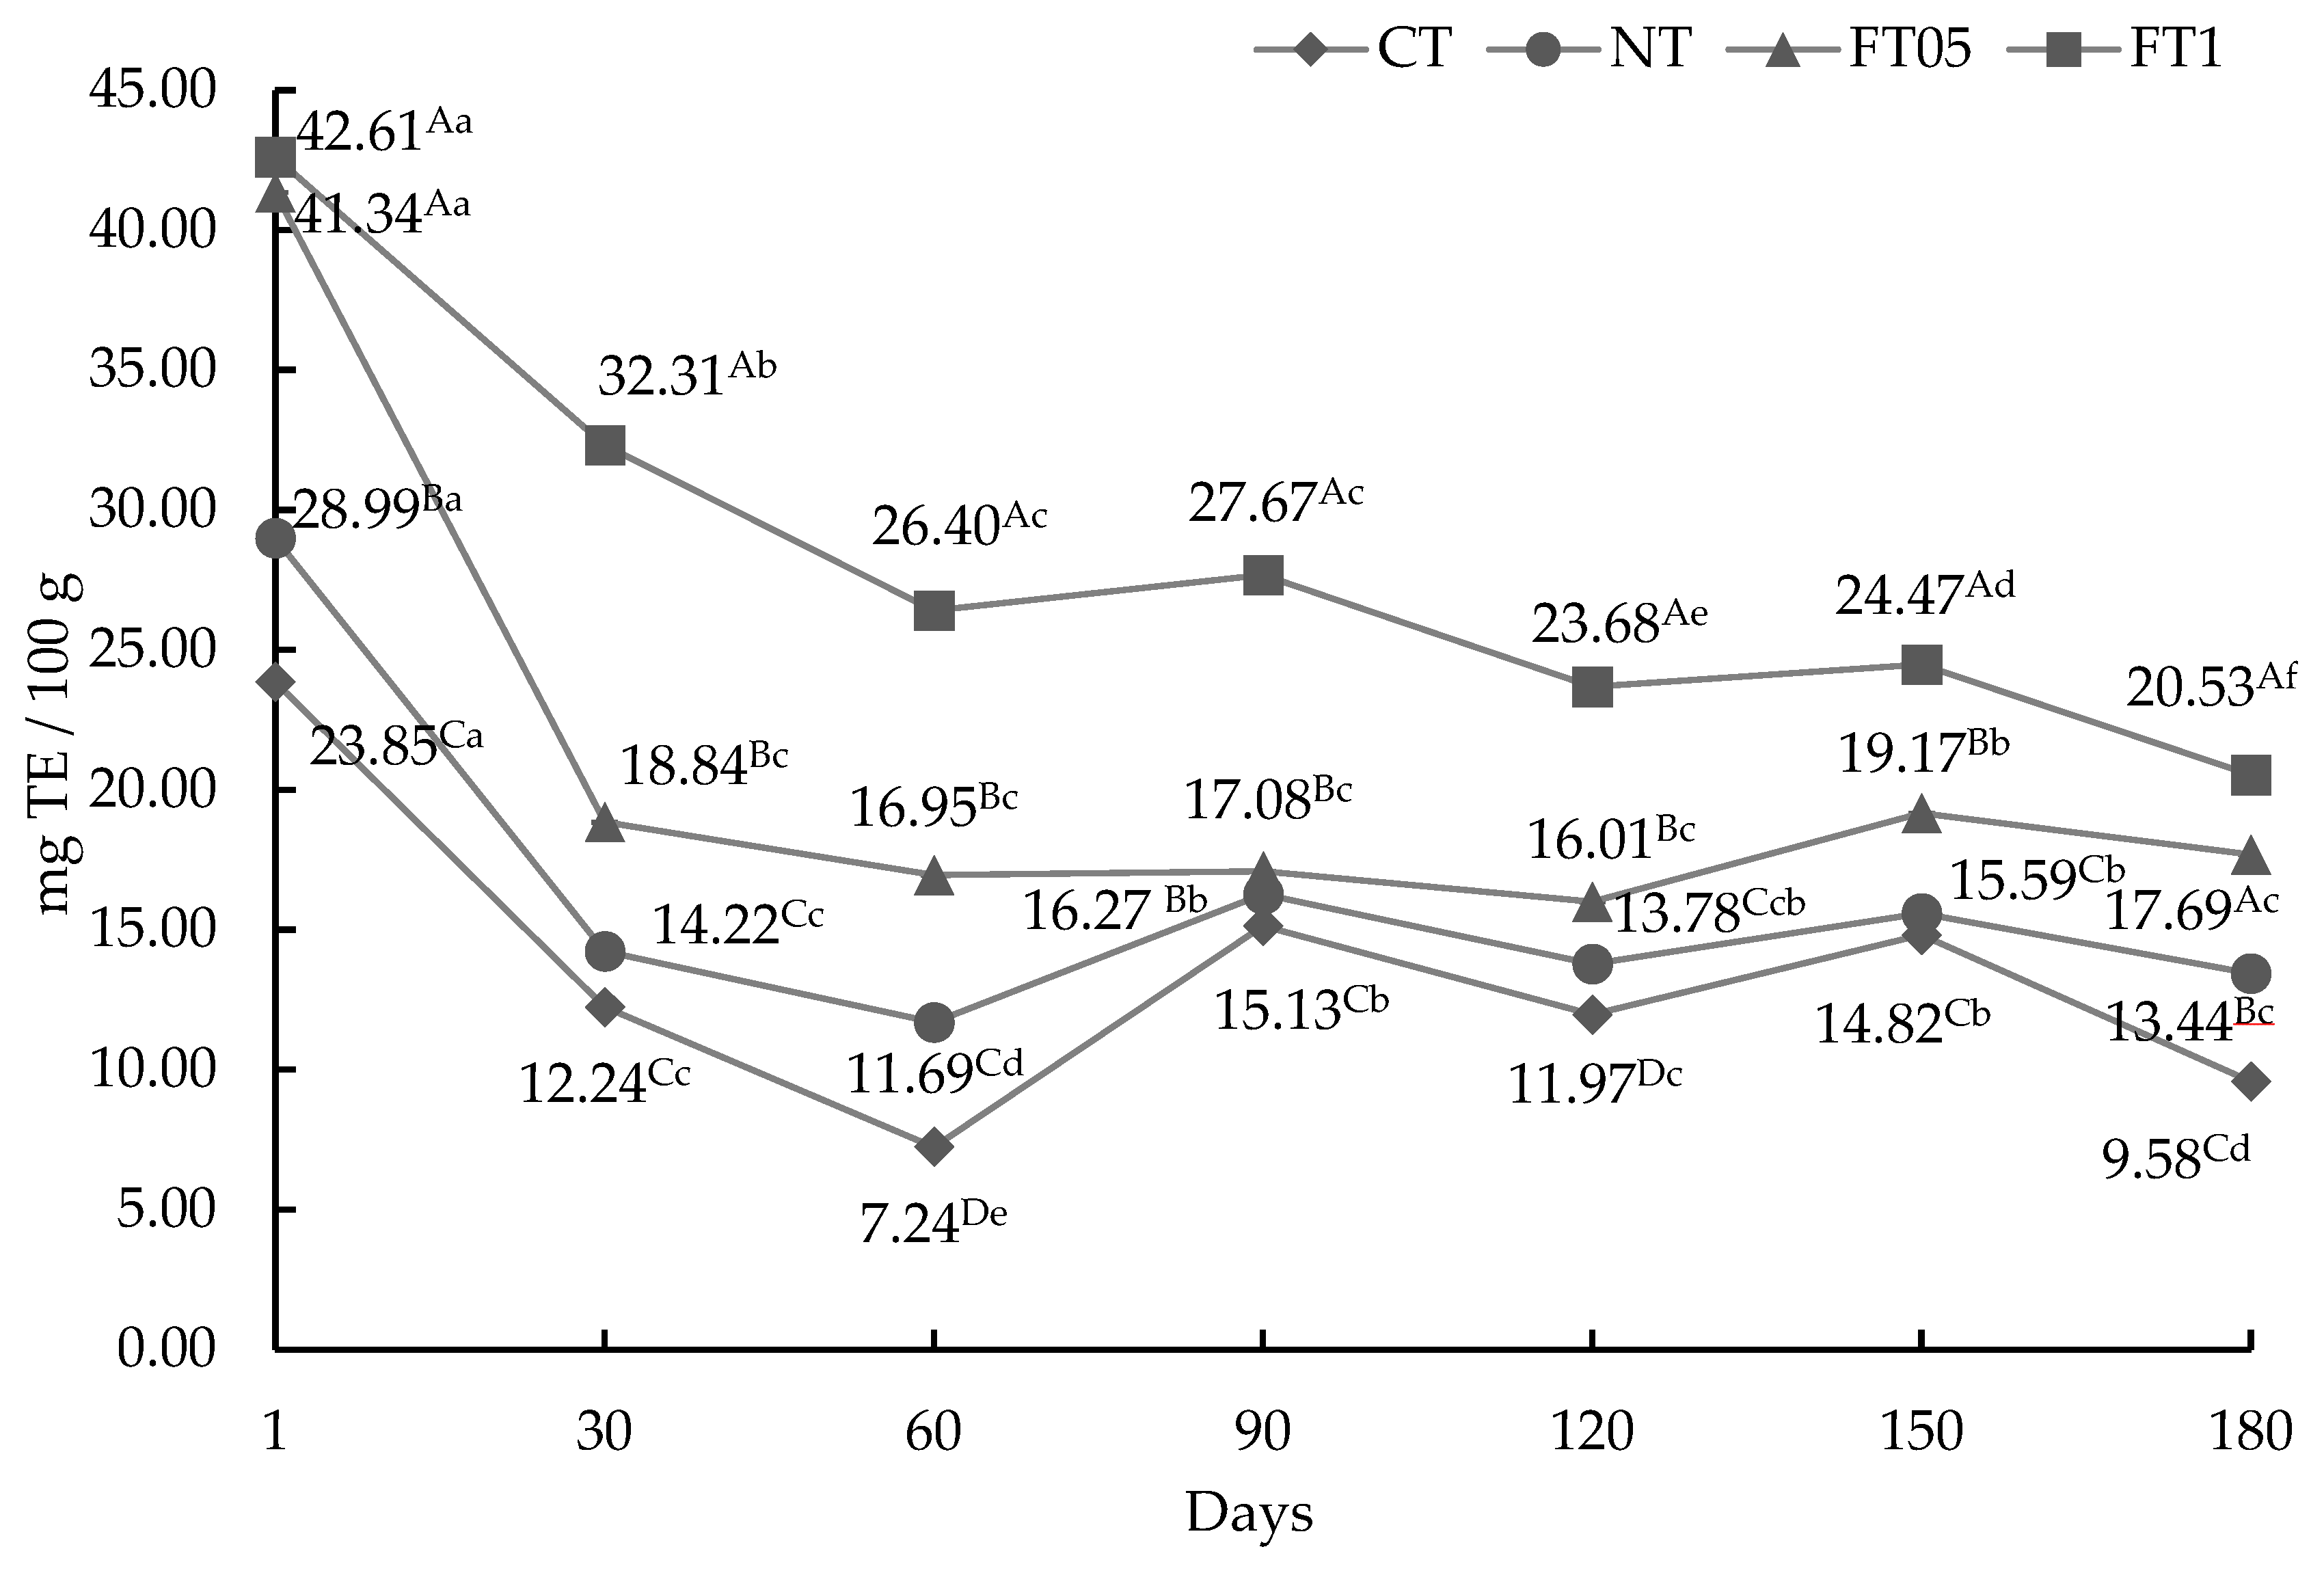
3.3.1. AA by ABTS Method

The ABTS assay measures the capacity of antioxidants to eliminate the ABTS cation radical, a blue-green chromophore with maximum absorption at 734 nm that decreases in intensity in the presence of antioxidants [35]. As for the results, differences were found (p < 0.05) between treatments (p < 0.05) and over time (Graph 1). The highest AA was observed at day 1 (p < 0.05) in FT05 and FT1 (41.34 and 42.61 mg TE/100 g, respectively), with no differences found (p > 0.05) between these treatments. The CT presented the lowest AA (23.85 mg TE/100 g) (p < 0.05). Finally, NT (28.99 mg TE/100 g) showed significant differences (p < 0.05) with the rest of the treatments. After 180 days of shelf life, FT1 (20.53 mg TE/100 g) and FT05 (17.69 mg TE/100 g) presented the highest AA (p < 0.05), showing no differences between them (p > 0.05), and CT presented the lowest AA value (9.58 mg TE/100 g) (p < 0.05). Regarding the behavior of AA over time, between days 30 and 60, all treatments showed a decrease in AA (p < 0.05). And, from day 60 to 90, all treatments showed an increase in AA, although this increase was only significant for the NT and CT treatments (p < 0.05). Subsequently, from day 90 to 120, all treatments presented a decrease in their AA, although this decrease was only significant for FT1 and CT (p < 0.05). Then, from day 120 to 150, all treatments increased their AA (p < 0.05) except for NT. Then, at the end of the shelf life, from day 150 to 180, all treatments decreased their AA (p < 0.05).

3.3.2. AA by DPPH Method

The 2,2-diphenyl-1-picrylhydrazyl radical (DPPH) scavenging method is among the most widely used and offers the first approach to assess total AA. The method is based on the donation of electrons from antioxidants to neutralize the DPPH radical. The reaction is accompanied by a color change measured at 517 nm, and the discoloration acts as an indicator of antioxidant efficiency [35]. The results of AA by the DPPH method are shown in Graph 2. In general, dried meat treatments with added AF showed consistently higher AA as measured by the ABTS, DPPH, and FRAP assays. This tendency remained across different treatments and over time. On day 1 of shelf life, all treatments showed significant differences (p < 0.05). FT1 (12.89 mg TE/100 g) showed higher antioxidant activity, followed by FT05 (11.09 mg TE/100 g), NT (4.96 mg TE/100 g), and finally CT (3.06 mg TE/100 g). Regarding the behavior of AA over time, all treatments showed a decrease in AA from day 1 to 60 (p < 0.05). Subsequently, from day 60 to 90, all treatments showed an increase in AA (p < 0.05). Subsequently, from day 90 to 180, FT1 and CT no longer showed changes in their AA (p > 0.05); however, FT05 and NT showed a decrease in their AA from day 90 to 120 (p < 0.05), and from that day forward they no longer presented changes (p > 0.05).
Figure 1. Antioxidant activity by ABTS method of dried meat (mean ± standard deviation) with and without addition of nitrites or ferulic acid (0.1 and 0.05%). TE, Trolox equivalent; CT, dried meat without nitrites or ferulic acid; NT, dried meat with 2% of nitrites; FT05, dried meat with 0.05% of ferulic acid; FT1, dried meat with 0.1% of ferulic acid. A,B,C,D = uppercase superscripts indicate significant statistical differences between days in the same treatment (p < 0.05). a,b,c,d = lowercase superscripts indicate significant statistical differences between treatments on the same day (p < 0.05).
Preprints 145716 g001

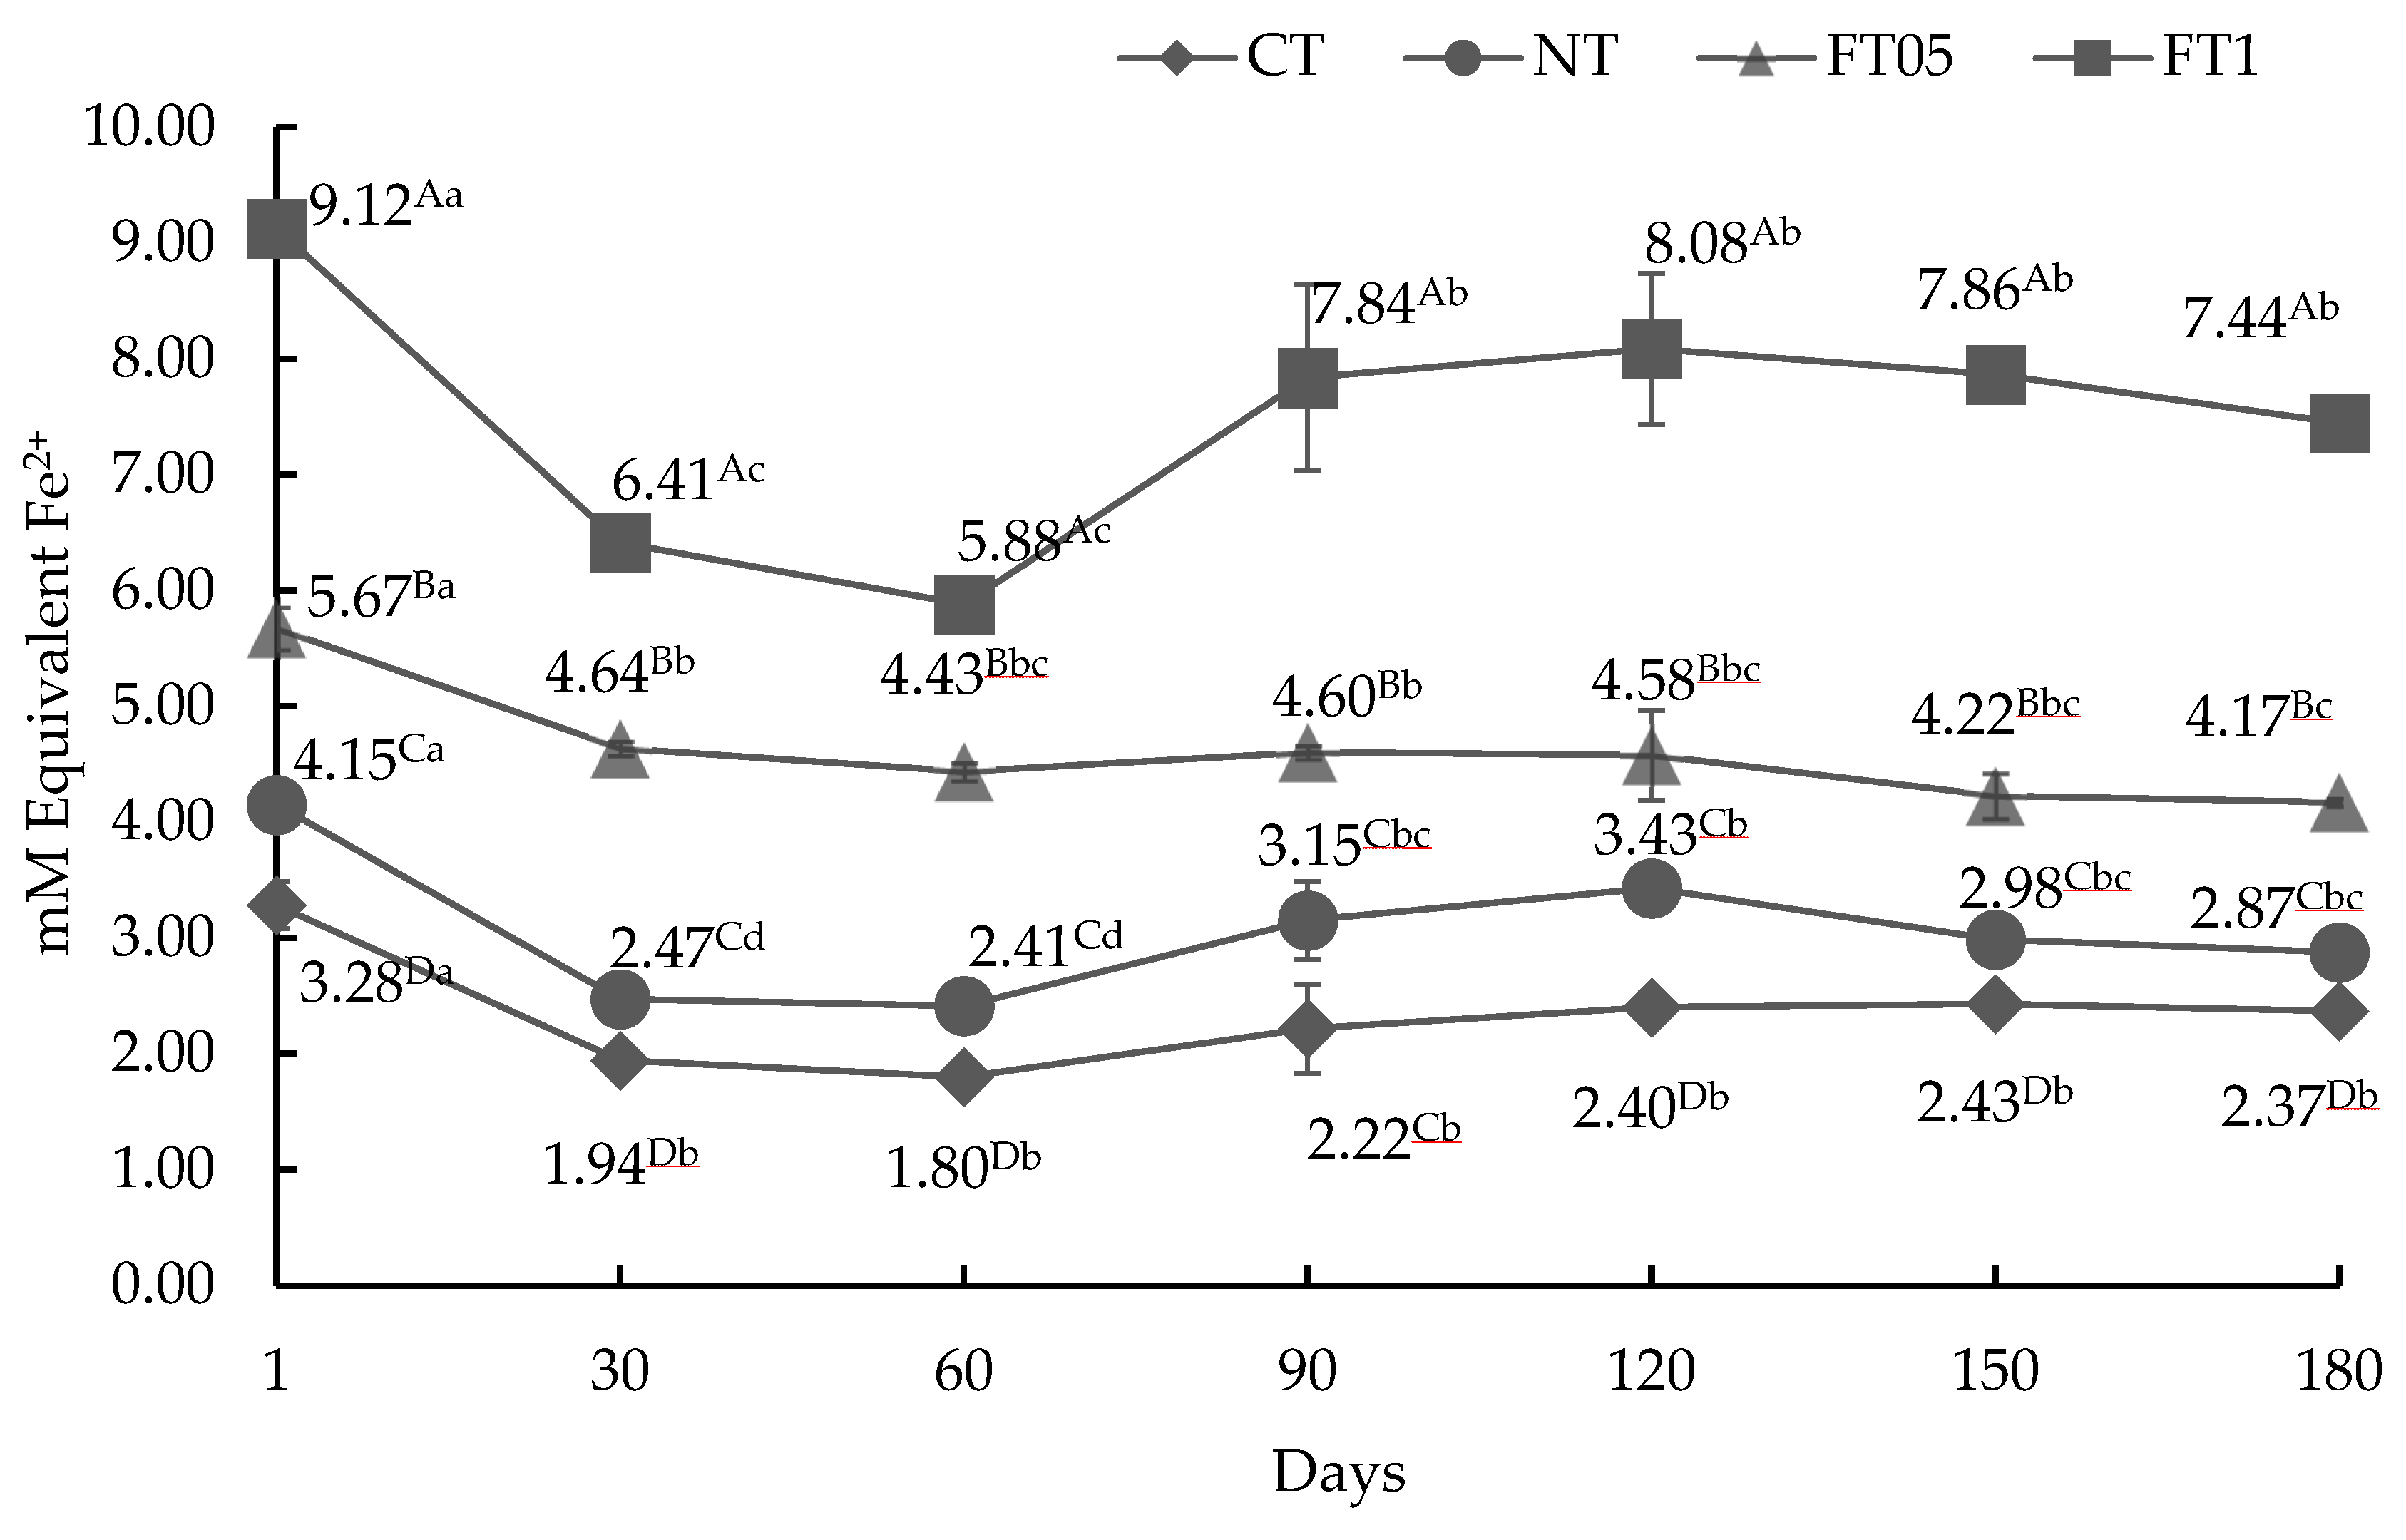
3.3.3. AA by FRAP Method

This technique measures the ability of antioxidants to reduce ferric ion (Fe³⁺) to ferrous ion (Fe²⁺). The AA by the FRAP method is shown in Graph 3. All treatments showed significant differences (p < 0.05). FT1 showed higher AA, starting with 9.287 mg TE/100 g and ending with 7.447 mg TE/100 g, followed by FT05 (5.675 and 4.175 mg TE/100 g), NT (4.152 and 2.878 mg TE/100 g), and finally CT (3.287 and 2.370 mg TE/100 g).
The most used methods for the assessment of antioxidants in meat systems are TBARS, TEAC, ORAC, DPPH, FRAP, and the Folin–Ciocalteu assay. Among these methods, the most used method to evaluate the antioxidant activity in meat is TBARS, which is based on the estimation of malondialdehyde (MDA) content. This is because MDA is one of the final products of lipid oxidation [36]. However, this technique does not estimate the residual antioxidant activity of foods. For this reason, the antioxidant activity of the treatments was evaluated by the DPPH, ABTS, and FRAP methods. To date, various studies have evaluated the antioxidant activity of natural antioxidants derived from vegetables and fruits on the quality and oxidation of beef and beef products [37,38]. and in dry fermented meat products [39]. However, no studies were found that evaluate the addition of FA on dried meat. In this study, compared to CT, the addition of FA at 0.1% (FT1) increased the antioxidant activity of dried meat in a range from 78.65 to 321.24% (depending on the technique used to evaluate AA). In FT05 it increased from 72.64 to 262.41%, and in NT it increased from 26.31 to 190%. The antioxidant potential of beef jerky increased by over 600% when elaborated with 15% of puréed raisins. In another study, balloon flower root extract (BFE), Japanese apricot extract (JAE), and grape extract (GE) were added (0.05% (v/v) in the formulation of beef jerky); although all extracts presented AA, none of these presented higher AA than that presented by the positive control containing butylated hydroxy anisole (BHA) [40].
Figure 2. Antioxidant activity by DPPH method of dried meat (mean ± standard deviation) with and without addition of nitrites or ferulic acid (0.1 and 0.05%). TE, Trolox equivalent; CT, dried meat without nitrites or ferulic acid; NT, dried meat with 2% of nitrites; FT05, dried meat with 0.05% of ferulic acid; FT1, dried meat with 0.1% of ferulic acid A,B,C,D = uppercase superscripts indicate significant statistical differences between days in the same treatment (p < 0.05). a,b,c,d = lowercase superscripts indicate significant statistical differences between treatments on the same day (p < 0.05).
Preprints 145716 g002
Figure 3. Antioxidant activity by FRAP method of dried meat (mean ± standard deviation) with and without addition of nitrites or ferulic acid (0.1 and 0.05%). CT, beef jerky without nitrites or ferulic acid; NT, dried meat with 2% of nitrites; FT05, dried meat with 0.05% of ferulic acid; FT1, dried meat with 0.1% of ferulic acid. A,B,C,D = uppercase superscripts indicate significant statistical differences between days in the same treatment (p < 0.05). a,b,c,d = lowercase superscripts indicate significant statistical differences between treatments on the same day (p < 0.05).
Preprints 145716 g003
The strong antioxidant effect of FA mainly includes the inhibition of the formation of reactive oxygen species (ROS) or nitrogen species (RNS) as well as the neutralization of free radicals, which inhibits a cascade of reactions that generate free radicals [41]. In addition, FA can be used as a hydrogen donor to directly provide atoms to free radicals to protect lipid acids from free radical oxidation. Furthermore, ferulic acid can chelate Cu(II) or Fe(II) metal ions, thus preventing the formation of toxic hydroxyl radicals. In addition to this, it also acts as an inhibitor of enzymes that catalyze the generation of free radicals and enhances the activity of scavenging [41]. This gives it an advantage over other natural antioxidants.

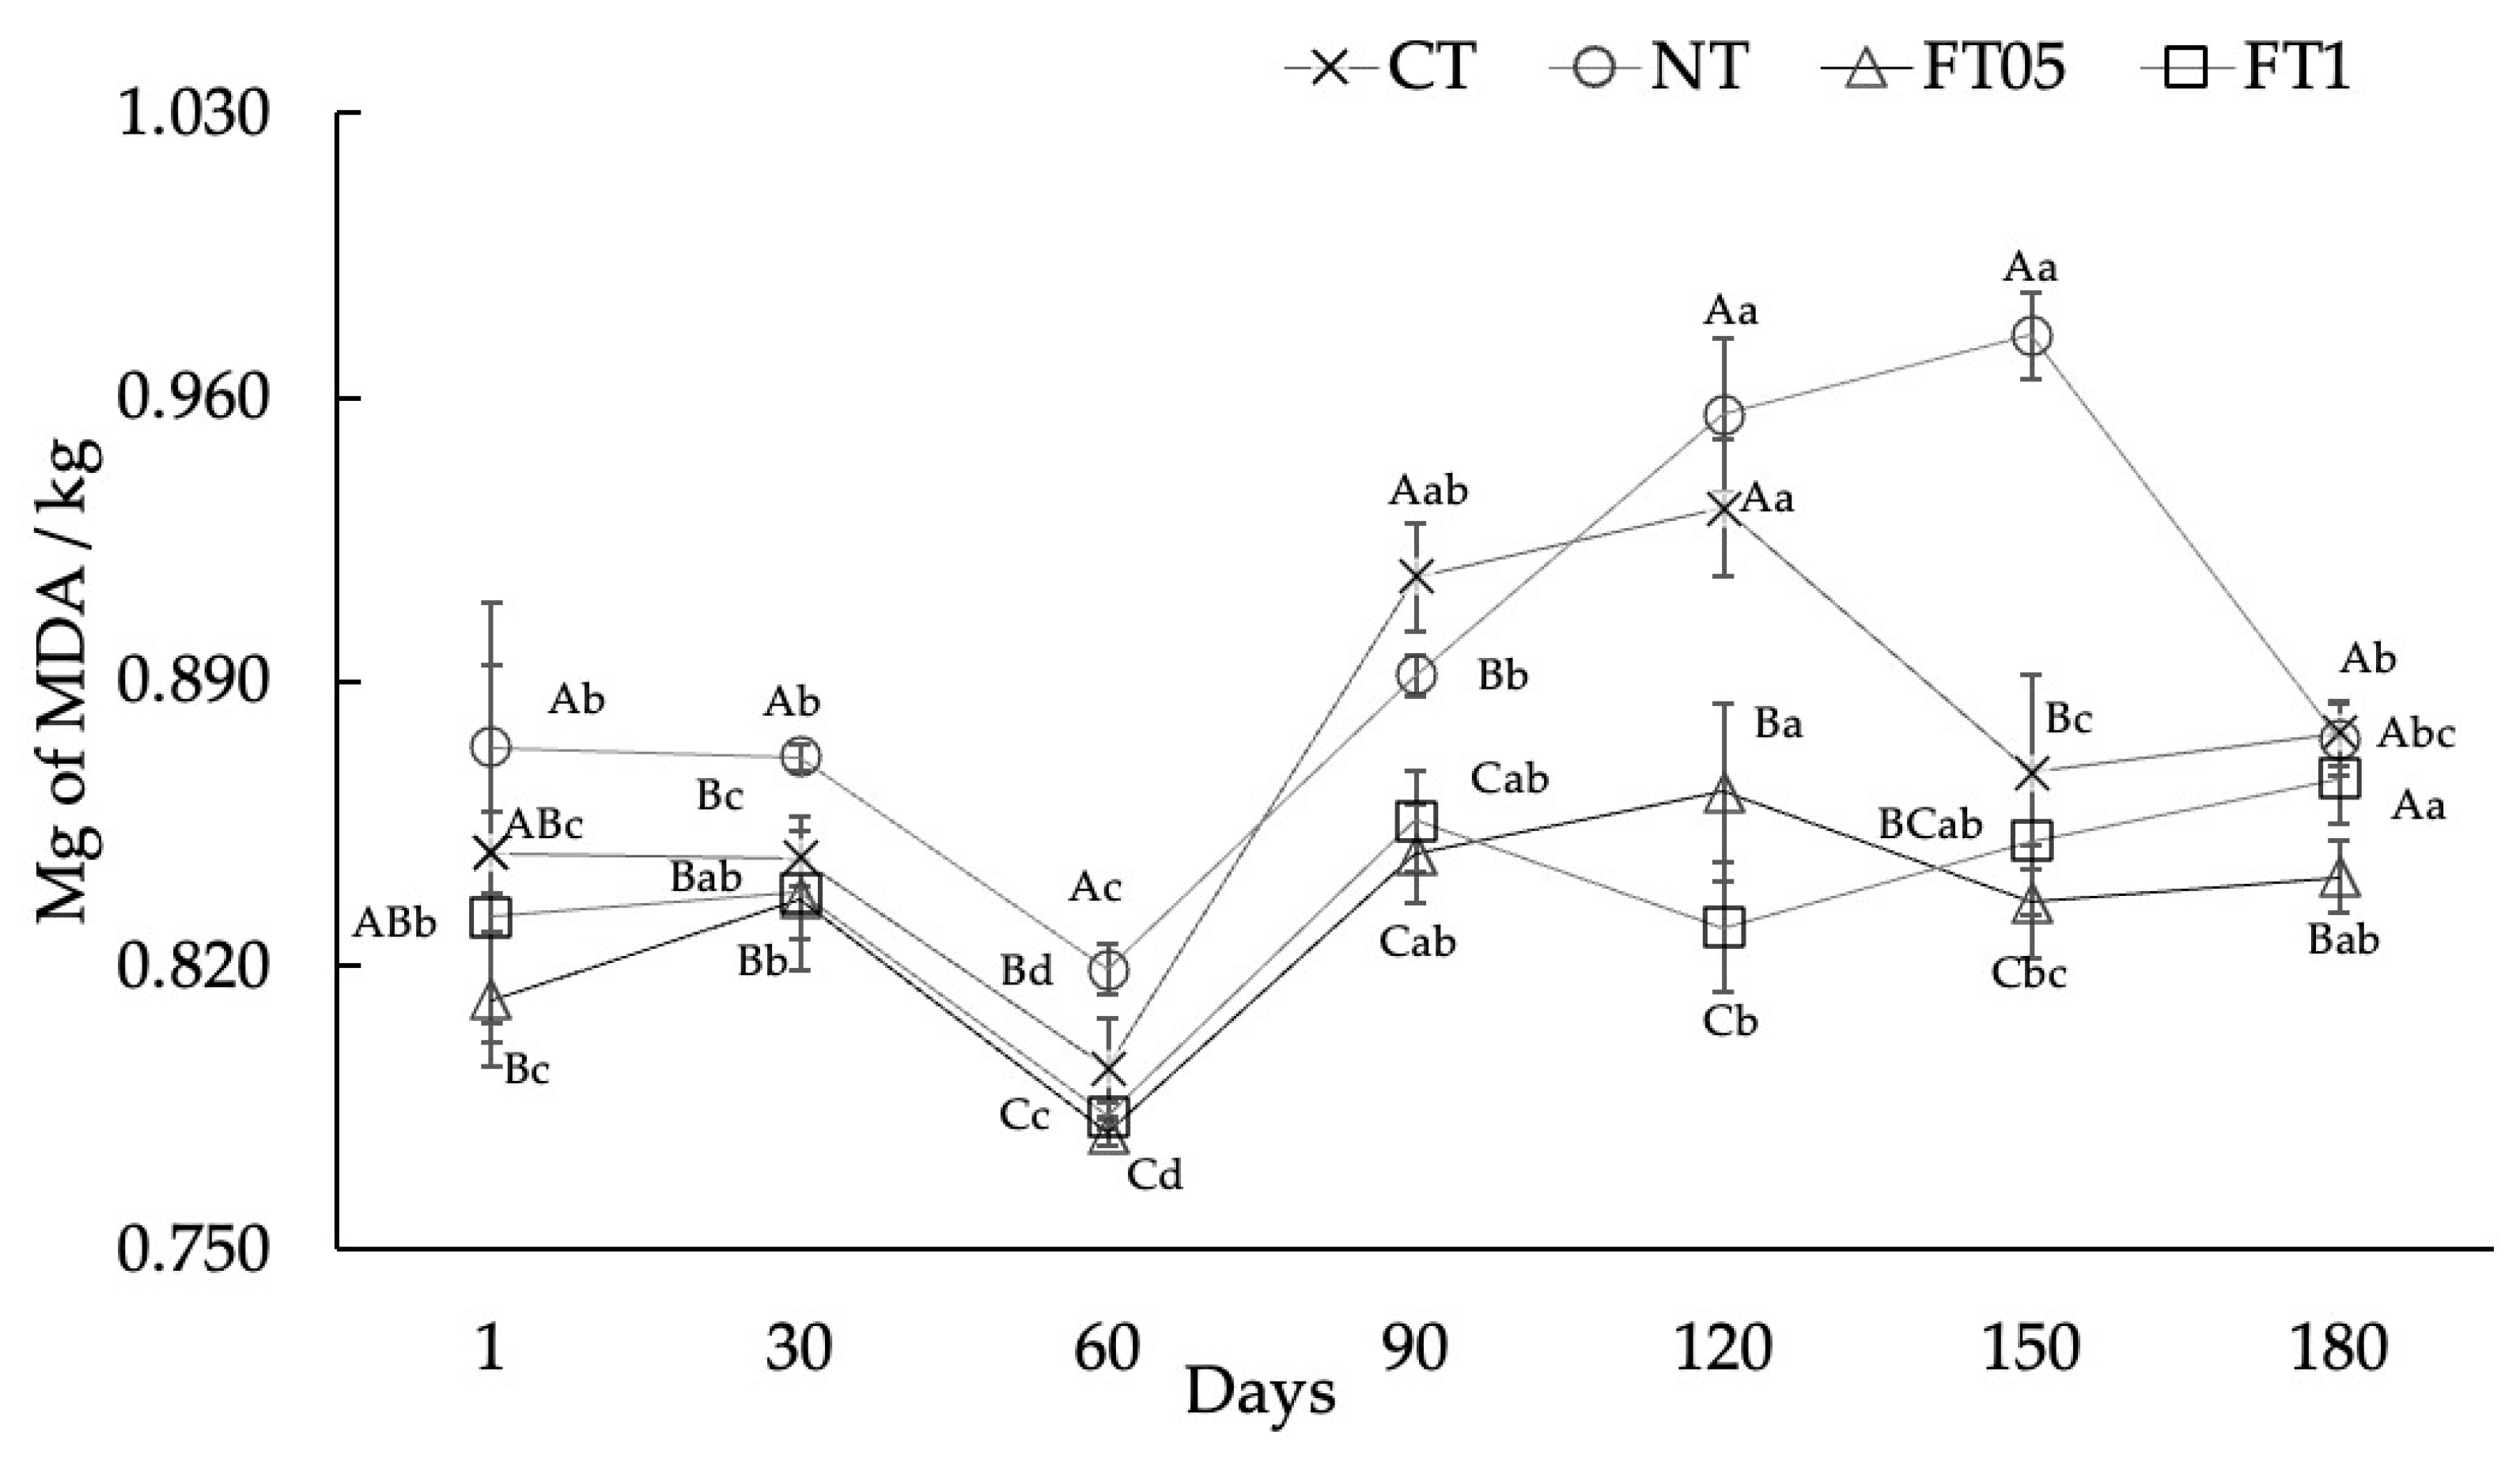
3.4. Lipid Oxidation

The most widely used method for determining oxidation is to measure the amount of malonaldehyde (MDA) oxidized in meat and meat products [42]. This is because MDA is one of the main end products of lipid oxidation and is associated with the development of undesirable odors in meat [43]. The oxidation results are shown in Graph 4. The four treatments showed a similar behavior during their shelf life, where FT05 and FT1 presented the lowest values and CT and NT the largest (p < 0.05). When FA was added to the FT05 and FT1, there were significant differences (p < 0.05) at days 30, 60, 90, 120, and 150 compared to NT. The MDA values were lowest in the FT05 and FT1.p All treatments presented the lowest MDA values on day 60 (p < 0.05). And, at the end of the shelf life, FT05 presented the lowest value (p < 0.05), followed by CT, NT, and FT1 that did not present differences among them (p > 0.05).
All values obtained in this study were below the threshold of perceived rancidity (2.0 mg MDA/kg) and remained below the acceptability threshold of 1 mg MDA/kg [44]. Zioud et al. (2023) reported lower values for lamb meat powdered spiced with garlic, coriander, salt, and paprika drying by a convective (0.35 mg MDA/kg) or sun (0.93 mg MDA/kg) methods [45]. Similarly, Mediani et al. (2022) reported lower values in sun-dried (0.77 mg MDA/kg) and air-dried (0.68 mg MDA/kg) meat [1]. Besides, higher values than those found in this study were reported in beef jerky cured for 24 hours with salt (2.94 ± 0.11 mg MDA/kg), soy sauce (3.85 ± 0.07 mg MDA/kg), red pepper paste (1.59 ± 0.20 mg MDA/kg) and soybean paste (2.46 ± 0.02 mg MDA/kg) [20].
Chen et al. (2004) saw that lipid oxidation went up proportionally when NaCl was present, because NaCl is a pro-oxidant [46]. This could explain the higher values of MDA found in NT, since nitrites are composed of residual sodium salts. It is important to emphasize that one limitation of using FA in food formulations is its low solubility in water.
However, in the treatments with FA,FA it was added at 0.05% (FT05) and 0.1% (FT1), and at these concentrations there were not solubility problems. This may be due to the presence of salts such as sodium chloride (NaCl). Although the dissociation constants (pKa, 4.5 for the carboxylic acid group and 9.0 for the phenolic hydroxyl group) of ferulic acid are above the pH of brines added with ferulic acid, in the presence of ions in solution, protective charges may form, affecting the ease with which protonate released from ferulic acid. Higher ionic strength often results in lower pKa values ​​due to reduced electrostatic repulsion between charged species. They can interact with sodium ions (Na⁺) through ionic interactions or hydrogen bonds if the carboxyl group is charged (deprotonated) and the phenolic hydroxyl group is not charged (protonated). This makes them more soluble.
Finally, despite the lower percentage of FA added in the treatments in this study, these presented lower MDA values. This reflects its potential as an antioxidant agent, although it is worth mentioning that no studies were found in which FA was used in dried meat.
Figure 4. Oxidation of dried meat (mean ± standard deviation) with and without addition of nitrites or ferulic acid (0.1 and 0.05%). MDA, malondialdehyde; CT, dried meat without nitrites or ferulic acid; NT, dried meat with 2% of nitrites; FT05, dried meat with 0.05% of ferulic acid; FT1, dried meat with 0.1% of ferulic acid A,B,C,D = uppercase superscripts indicate significant statistical differences between treatments on the same day (p < 0.05). a,b,c,d = lowercase superscripts indicate significant statistical differences between days on the same treatment (p < 0.05).
Preprints 145716 g004

3.5. Microbiological Analysis

Total coliforms and mold and yeast did not present growth on any sampled day, and total aerobic mesophiles grew on day 1. TC and TN (4.6 and 4.75 Log10 CFU/mg) did not show differences between them (p > 0.05); however, these were different from the TF05 and the TF1 (4.3 and 4.0 Log10 CFU/mg, respectively, p < 0.05). The FA treatments inhibited the growth of the aerobic mesophiles more effectively than the NT. [47] mention that spoilage microorganisms (gram-positive and -negative bacteria, molds, and yeasts) are sensitive to hydroxycinnamic acid derivatives, such as caffeic, ferulic, and p-coumaric acids [47]. FA not only inhibited spoilage organisms but also pathogens such as Escherichia coli and Listeria monocytogenes [48]. FA acid has an important role as a food additive due to its antimicrobial activity, related to the inhibition of arylamine N-acetyltransferase, a specific enzyme that catalyzes arylamine acetylation in bacteria, irreversibly changing cell morphology and membrane properties, such as charge and the intra- and extracellular permeability [8]. In general terms, the microbiological characteristics of dried meat are described in terms of the standard total plate count (< 5 Log10 CFU/g), with values like the results (4.0 to 4.86 Log10 CFU/g) in this study [1] (Table 2).
Table 2. Total aerobic mesophiles counts (Log10 CFU/g) of dried meat (mean ± standard deviation).
Days Treatments
CT NT FT05 FT1
1 4.86 ± 0.03a 4.75 ± 0.17a 4.3 ± 0.11b 4.0 ± 0.01b
60 ND ND ND ND
180 ND ND ND ND
CT, dried meat without nitrites or ferulic acid; NT, dried meat with nitrites; FT05, dried meat with 0.05% of ferulic acid; FT1, dried meat with 0.1% of ferulic acid. a,b,c = Different literals between columns denote significant differences (p < 0.05) among treatments.

3.6. Sensory Evaluation

Of the 59 panelists, 45.76% were women, and 54.23% were men. They were asked the frequency of consumption of dried meat; 16.9% ate it once a week, 40.6% 2-3 times a month, 40.6% once every 2 months, and 1.6% did not eat it. Panelists did not detect differences among the treatments (X2 = 2.10, p > 0.05); consequently, the addition of FA did not present changes in consumer perception. These days, most people agree that natural additives are better than synthetic ones. In the last ten years, more new meat products with better nutritional profiles have been made because people want meat products that don't have artificial preservatives, are minimally processed, and last longer [5].

5. Conclusions

This study investigated the effect of FA on the shelf life of dried meat. First, it is important to emphasize that the brines that contain FA were successfully prepared and utilized in the production of dried meat without presenting solubility problems. Treatments with FA instead of nitrites presented remarkable antioxidant activity, which may contribute to the preservation and flavor of the dried meat. FT1 and FT05 exhibited the highest AA and the lowest lipid oxidation throughout their shelf life. The physicochemical and color characteristics of dried meat produced with FA were found to be comparable to those of the dried meat elaborated with nitrites. Furthermore, NT had the highest sodium content. This suggests that the utilization of FA to produce dried meat does not negatively impact the principal characteristics of this meat snack, thus potentially extending its shelf life. The microbial results demonstrated that only total aerobic mesophiles counts were detected on day 1 and were lower in the treatments with FA and not detected on days 60 and 180. This indicates that the use of FA does not compromise the microbial safety of the dried meat. Additionally, the incorporation of FA into the formulation of dried meat enhanced its shelf life and sensory properties. The change from nitrites to ferulic acid was not sensorially detected by panelists. Notably, FA demonstrated potential as a viable alternative to substitute nitrites in the production of dried meat. However, further investigation is necessary to elucidate the biological impacts of replacing nitrites with natural antioxidants such as the FA in the meat industry.

Author Contributions

Conceptualization, A.C.-M.; data curation, E.S.-E.; formal analysis, A.G.H.-J.; funding acquisition, A.C.-M. and F.C.-R.; investigation, A.G.H.-J.; methodology, A.C.-M., M.M.A.-S.; project administration, A.C.-M.; supervision, A.C.-M., A.L.R.-M. and J.M.T.-G.; writing—original draft, A.G.H.-J; writing—review and editing, A.C.-M., A.L.R.-M., F.C.-R. and J.M.T.-G. All authors have read and agreed to the published version of the manuscript.

Funding

This research received no external funding.

Institutional Review Board Statement

Not applicable.

Informed Consent Statement

Not applicable.

Data Availability Statement

The data presented in this study are available on request from the corresponding author.

Acknowledgments

The authors acknowledge that the Universidad Autónoma de Chihuahua supported this investigation. The Science and Technology National Council of Mexico (CONAHCYT) provided a graduate study scholarship for Any Guadalupe Hernández-Jaime.

Conflicts of Interest

The authors declare no conflict of interest.

References

  1. Mediani, A.; Hamezah, H.S.; Jam, F.A.; Mahadi, N.F.; Chan, S.X.Y.; Rohani, E.R.; Che-Lah, N.H.; Azlan, U.K.; Khairul-Annuar, N.A.; Azman, N.A.F.; Bunawan, H.; Sarian, M.N.; Kamal, N.; Abas, F. A comprehensive review of drying meat products and the associated effects and changes. Front. Nutr. 2022, 9, 1057366. [CrossRef]
  2. Directriz de cumplimiento del FSIS para carne seca y carne seca de aves de corral producida por establecimientos pequeños y muy pequeños. Directriz de cumplimiento de 2014. U.S. Department of Agriculture. Food Safety and Inspection Service. Available online: https://www.fsis.usda.gov/guidelines/2014-0010. (accesed on 30 October 2024).
  3. Echegaray, N.; Pateiro, M.; Munekata, P.E.S.; Lorenzo, J.M.; Chabani, Z.; Farag, M.A.; Domínguez, R. Measurement of antioxidant capacity of meat and meat products: Methods and applications. Molecules 2021, 26(13), 3880. [CrossRef]
  4. Ramírez-Cárdenas, L. (2015). Efecto del tiempo de secado y de distintos cortes de músculos de res en las características fisicoquímicas y sensoriales de carne seca (cecina). ACI Avances En Ciencias E Ingenierías, 7(1). [CrossRef]
  5. Gómez, I.; Janardhanan, R.; Ibañez, F.C.; Beriain, M.J. The effects of processing and preservation technologies on meat quality: Sensory and nutritional aspects. Foods 2020, 9(10), 1416. [CrossRef]
  6. Shakil, M. H., Trisha, A. T., Rahman, M., Talukdar, S., Kobun, R., Huda, N., & Zzaman, W. (2022). Nitrites in cured meats, health risk issues, alternatives to nitrites: a review. Foods, 11(21), 3355. [CrossRef]
  7. Battaglia Richi, E., Baumer, B., Conrad, B., Darioli, R., Schmid, A., & Keller, U. (2015). Health risks associated with meat consumption: a review of epidemiological studies. International journal for vitamin and nutrition research. Internationale Zeitschrift fur Vitamin- und Ernahrungsforschung. Int. J. Vitam. Nutr. Res, 85(1-2), 70–78. [CrossRef]
  8. de Oliveira-Silva, E.; Batista, R. Ferulic acid and naturally occurring compounds bearing a feruloyl moiety: a review on their structures, occurrence, and potential health benefits. CRFSFS 2017, 16(4), 580-616. [CrossRef]
  9. Li, D.; Rui, Y.; Guo, S.; Luan, F.; Liu, R.; Zeng, N. Ferulic acid: A review of its pharmacology, pharmacokinetics and derivatives. Life Sci. 2021, 284, 119921. [CrossRef]
  10. Zduńska, K.; Dana, A.; Kolodziejczak, A.; Rotsztejn, H. Antioxidant properties of ferulic acid and its possible application. Skin Pharmacol. Physiol. 2018, 31(6), 332-336. [CrossRef]
  11. AOAC International. Official Methods of Analysis, 15th ed.; Association of Official Analytical Chemists, Inc., Virginia, USA, 1990.
  12. Norma Oficial Mexicana NOM-F-150 S-1981. Determinación de cloruro de sodio en salmueras. Alimentos Para Humanos . Available online: https://dof.gob.mx/nota_detalle.php?codigo=4716889&fecha=15/02/1982#gsc.tab=0 (accesed on 30 October 2024).
  13. Aportela-Palacios, A.; Sosa-Morales, M.E.; Vélez-Ruiz, J.F. Rheological and physicochemical behavior of fortified yogurt, with fiber and calcium. J. Texture Stud. 2005, 36, 333–349. [CrossRef]
  14. Thaipong, K.; Boonprakob, U.; Crosby, K.; Cisneros-Zevallos, L.; Hawkins Byrne, D. Comparison of ABTS, DPPH, FRAP, and ORAC assays for estimating antioxidant activity from guava fruit extracts. J. Food Compos. Anal. 2006, 19(6–7), 669–675. [CrossRef]
  15. Pfalzgraf, A.; Frigg, M.; Steinhart, H. Contenido de tocoferol y oxidación lipídica en el músculo y el tejido adiposo del cerdo durante Almacenamiento. J. Agric. 1995, 43, 1339-1342.
  16. Meilgaard, M.C.; Civille, G.V.; Carr, B.T. Sensory evaluation techniques, 4th ed.; CRC Press: Boca Raton, Florida, 2007; https://doi.org/10.1201/b16452.
  17. Aykin-Dinçer, E.; Atli, B.; Çakmak, Ö.; Canavar, S.; Çalışkan, A. Drying kinetics and quality characteristics of microwave-assisted hot air-dried beef chips. JMPEE 2021, 55(3), 219-235. [CrossRef]
  18. Zdanowska-Sasiadek, Z.; Marchewka, J.; Horbanczuk, J.O.; Wierzbicka, A.; Lipinska, P.; Józwik, A.; Atanasov, A.G.; Huminiecki, Ł.; Sieron, A.; Sieron, K.; Strzałkowska, N.; Stelmasiak, A.; De Smet, S.; Hecke, T.V.; Hoffman, L.C. Nutrients composition in fit snacks made from ostrich, beef and chicken dried meat. Molecules 2018, 23(6), 1267. [CrossRef]
  19. Seo, J. K., Eom, J. U., & Yang, H. S. (2023). Comparison between Berkshire and crossbreed on meat quality, and investigation of the relationship with fatty acid composition and meat quality. J Anim Sci Technol, 65(5), 1081–1093. [CrossRef]
  20. Lim, H. J., Kim, G. D., Jung, E. Y., Seo, H. W., Joo, S. T., Jin, S. K., & Yang, H. S. (2014). Effect of curing time on the physicochemical and sensory properties of beef jerky replaced salt with soy sauce, red pepper paste and soybean paste. J Anim. Sci. (Asian-Australasian), 27(8), 1174–1180. [CrossRef]
  21. Chen, L., Zhu, M., Hu, X., Pan, J., & Zhang, G. (2022). Exploring the binding mechanism of ferulic acid and ovalbumin: insights from spectroscopy, molecular docking and dynamics simulation. J. Agric. Food. Sci. 102(9), 3835–3846. [CrossRef]
  22. Villamil-Galindo, E.; Piagentini, A.M. Uso de nitritos y nitratos en la industria cárnica lo bueno, lo malo, y el modelo matemático para optimizar su uso. Una revisión. Revista de La Asociación Colombiana de Ciencia y Tecnología de Alimentos (ACTA).
  23. 2021, 29(56), 41-76.
  24. Dimakopoulou-Papazoglou, D.; Katsanidis, E. Effect of maltodextrin, sodium chloride, and liquid smoke on the mass transfer kinetics and storage stability of osmotically dehydrated beef meat. Food Bioprocess Technol. 2017, 10(11), 2034-2045. [CrossRef]
  25. Parthasarathy, D.K.; Bryan, N. S. Sodium nitrite: The “cure” for nitric oxide insufficiency. Meat Science 2012, 92(3), 274-279. [CrossRef]
  26. Sorroza-Rojas, N.A.; Jinez-Sorroza, B.E.; Grijalva-Endara, A. de las M.; Naranjo-Álvarez, J. de L. El cloruro de sodio (NaCl) y los efectos en la alimentación. Recimundo 2019, 3(1), 913-937. [CrossRef]
  27. Ramírez-Navas, J.S.; Rodríguez De Stouvenel, A. Characterization of Colombian quesillo cheese by spectrocolorimetry. Vitae 2012, 19(2), 178-185. [CrossRef]
  28. Sánchez, C. N., Orvañanos-Guerrero, M. T., Domínguez-Soberanes, J., & Álvarez-Cisneros, Y. M. (2023). Analysis of beef quality according to color changes using computer vision and white-box machine learning techniques. Heliyon, 9(7), e17976. [CrossRef]
  29. Bampi, M.; Schmidt, F.C.; Laurindo, J.B. A fast-drying method for the production of salted-and-dried meat. Food Sci. Technol. (Brazil) 2019, 39, 526-534. [CrossRef]
  30. Kim, G. D., Go, G. W., Lim, H. J., Jung, E. Y., Seo, H. W., Jeong, J. Y., Joo, S. T., & Yang, H. S. (2014). Physicochemical characteristics of beef jerky cured with salted-fermented anchovy and shrimp. Food Sci. Anim. (Korean), 34(1), 99–105. [CrossRef]
  31. Kruk, O., & Ugnivenko, A. (2024). Relationship between the chemical composition, physical, technological, and sensory properties of beef and the colour of muscle tissue. Anim. Sci. Food Technol, 15(1), 42-54. [CrossRef]
  32. Rahman, M.S.; Salman, Z.; Kadim, I.T.; Mothershaw, A.; Al-Riziqi, M.H.; Guizani, N.; Mahgoub, O.; Ali, A. Microbial and physico-chemical characteristics of dried meat processed by different methods. Int. J. Food Eng. 2005, 1(2), 3. [CrossRef]
  33. Aksoy, A.; Karasu, S.; Akcicek, A.; Kayacan, S. Effects of different drying methods on drying kinetics, microstructure, color, and the rehydration ratio of minced meat. Foods 2019, 8(6), 216. [CrossRef]
  34. Suman, S. P., & Joseph, P. (2013). Myoglobin chemistry and meat color. Annual Review of Food Sci. Technol. 4, 79–99. [CrossRef]
  35. Sepe HA, Faustman C, Lee S, Tang J, Suman SP, Venkitanarayanan KS. 2005. Effects of reducing agents on premature browning in ground beef. Food chem. 93:571–76. [CrossRef]
  36. Vázquez-Ovando, A.; Mejía-Reyes, J.D.; García-Cabrera, K.E.; Velázquez-Ovalle, G. Capacidad antioxidante: conceptos, métodos de cuantificación y su aplicación en la caracterización de frutos tropicales y productos derivados. RCIA 2022, 9(1), 9-33. [CrossRef]
  37. Ghani, M. A., Barril, C., Bedgood, D. R., Jr, & Prenzler, P. D. (2017). Measurement of antioxidant activity with the thiobarbituric acid reactive substances assay. Food chemistry, 230, 195–207. [CrossRef]
  38. Horbańczuk, O. K., Kurek, M. A., Atanasov, A. G., Brnčić, M., & Rimac Brnčić, S. (2019). The effect of natural antioxidants on quality and shelf life of beef and beef products. Food Technol. Biotech, 57(4), 439–447. [CrossRef]
  39. Lee, S. Y., Lee, D. Y., Kim, O. Y., Kang, H. J., Kim, H. S., & Hur, S. J. (2020). Overview of studies on the use of natural antioxidative materials in meat products. Food Sci. Anim. Res. 40(6), 863–880. [CrossRef]
  40. Selani, M. M., Herrero, A. M., & Ruiz-Capillas, C. (2022). Plant antioxidants in dry fermented meat products with a healthier lipid profile. Foods, 11(22), 3558. [CrossRef]
  41. Bower, C.K., Schilke, K.F. and Daeschel, M.A. (2003), Antimicrobial properties of raisins in beef jerky preservation. J. Food Sci. 68: 1484-1489. [CrossRef]
  42. Zheng, M.; Liu, Y.; Zhang, G.; Yang, Z.; Xu, W.; Chen, Q.; The antioxidant properties, metabolism, application and mechanism of ferulic acid in medicine, food, cosmetics, livestock and poultry. Antioxidants 2024, 13 (853). [CrossRef]
  43. Elmas, F.; Bodruk, A.; Köprüalan, Ö.; Arikaya, Ş.; Koca, N.; Serdaroğlu, F.M.; Kaymak-Ertekin, F.; Koç, M. The effect of pre-drying methods on physicochemical, textural and sensory characteristics on puff dried Turkey breast meat. LWT 2021, 145, 111350. [CrossRef]
  44. Manessis, G.; Kalogianni, A.I.; Lazou, T.; Moschovas, M.; Bossis, I.; Gelasakis, A.I. Plant-derived natural antioxidants in meat and meat products. Antioxidants 2020, 9(12), 1-30. [CrossRef]
  45. Selani, M.M.; Shirado, G.A.N.; Margiotta, G.B.; Saldaña, E.; Spada, F.P.; Piedade, S.M.S.; Contreras-Castillo, C.J.; Canniatti-Brazaca, S.G. Effects of pineapple byproduct and canola oil as fat replacers on physicochemical and sensory qualities of low-fat beef burger. Meat science 2016, 112, 69-76. [CrossRef]
  46. Zioud, A.; Hajji, W.; Lobón, S.; Joy, M.; Bertolin, J.R.; Smeti, S.; Chabbouh, M.; Bellagha, S.; Essid, I. Effects of drying methods on chemical composition, lipid oxidation, and fatty acid profile of a traditional dried meat kaddid. Foods 2023, 12(20), 3837. [CrossRef]
  47. Lim, D.G.; Lee, S.S.; Seo, K.S.; Nam, K.C. Effects of different drying methods on quality traits of hanwoo beef jerky from low-valued cuts during storage. Korean J. Food Sci. An. 2012, 32(5), 531-539. [CrossRef]
  48. Nereyda, E., & Sauceda, R. Uso de agentes antimicrobianos naturales en la conservación de frutas y hortalizas. Ra Ximbai 2011, 7(1), 153-170. http://www.redalyc.org/articulo.oa?id=46116742014.
  49. Ijabadeniyi, O.A.; Govender, A.; Olagunju, O.F.; Oyedeji, A.B. The antimicrobial activity of two phenolic acids against foodborne Escherichia coli and Listeria monocytogenes and their effectiveness in a meat system. Italian J. Food Sci. 2021, 33(1), 39-45. [CrossRef]
Table 1. Physicochemical composition (%) of dried meat (mean ± standard deviation).
Variables Treatments
CT NT FT05 FT1
Protein 64.05 ± 3.08a 64.05 ± 1.63a 64.84 ± 1.56a 62.82 ±1.16a
Fat 14.77± 0.51b 15.77 ± 0.50a 15.42 ± 0.28ab 15.75 ± 0.09a
Ashes 13.4 ± 0.9a 12.38 ± 1.01a 14.25 ± 1.26a 14.49 ± 1.26a
Moisture 7.58 ± 0.52a 5.2 ± 0.30c 5.24 ± 0.33c 6.4 ± 0.21b
Sodium (mg/100g) 2715.28 ± 22.11a 3130.56 ± 25.80b 2507.64 ± 30.83a 2539.58 ± 29.25a
CT, dried meat without nitrites or ferulic acid; NT, dried meat with nitrites; FT05, dried meat with 0.05% of ferulic acid; FT1, dried meat with 0.1% of ferulic acid. a,b,c = Different literals between columns denote significant differences (p < 0.05) among treatments.
Disclaimer/Publisher’s Note: The statements, opinions and data contained in all publications are solely those of the individual author(s) and contributor(s) and not of MDPI and/or the editor(s). MDPI and/or the editor(s) disclaim responsibility for any injury to people or property resulting from any ideas, methods, instructions or products referred to in the content.
Copyright: This open access article is published under a Creative Commons CC BY 4.0 license, which permit the free download, distribution, and reuse, provided that the author and preprint are cited in any reuse.
Prerpints.org logo

Preprints.org is a free preprint server supported by MDPI in Basel, Switzerland.

Subscribe

Disclaimer

Terms of Use

Privacy Policy

Privacy Settings

© 2025 MDPI (Basel, Switzerland) unless otherwise stated