
Submitted:
08 January 2025
Posted:
09 January 2025
You are already at the latest version
Abstract
We present a model of ATP production in pancreatic beta cells, focusing on ATP dynamics within the bulk cytosol, submembrane region, and microdomains near KATP channels. ATP is generated through glycolysis, the mitochondrial oxidative phosphorylation (OxPhos) and glycolytic pyruvate kinase-mediated phosphoenolpyruvate (PEP) production, supported by PEP cycling between mitochondria and the cytosol. The model examines ATP production in relation to Ca2+ oscillations, elucidating their interdependent dynamics. Our findings demonstrate that both mitochondrial OxPhos and PEP-mediated ATP production contribute substantially to cellular ATP levels. Specifically, glycolysis and mitochondrial OxPhos are crucial for the initial (first-phase) increase in bulk and subplasmalemmal ATP, effectively “filling up” the ATP pool in beta cells. In the second phase, coordinated cycling between OxPhos and PEP pathways enables cost-effective fine-tuning of ATP levels, with localized effects in the KATP channel microdomains. This model addresses and clarifies the recent debate regarding the mechanisms by which sufficient ATP concentrations are achieved to close KATP channels in glucose-stimulated beta cells, offering novel insights into the regulation of energy production and KATP channel activity.
Keywords:
Beta cell
; Model
; ATP microdomain
; Anaplerosis
; NADPH
1. Introduction
Pancreatic beta cells secrete insulin, a hormone that plays a crucial role in metabolic regulation by controlling glucose uptake, fatty acid storage, and amino acid distribution in the body. It has long been known that, after glucose stimulation, beta cells experience an increase in intracellular ATP concentration. Once ATP reaches a threshold level, it closes plasma membrane ATP-sensitive potassium channels (KATP). The closure of KATP channels triggers membrane depolarization, activating voltage-gated Ca2+ channels. Elevated Ca2+ concentrations then signal the activation of cellular machinery, ultimately leading to insulin secretion. For a recent model linking key metabolic substrates—glucose, free fatty acids, and glutamine—to insulin secretion, see [1]. This model highlights the complex interplay between ATP production and anaplerotic pathways that are essential for metabolite sensing and insulin secretion in response to elevated metabolite concentrations.
While the beta cell response to high glucose is well-described and widely accepted, the exact pathways and mechanisms of ATP production remain less understood. Specifically, there is no unified explanation of how ATP is produced to close KATP channels. A straightforward possibility is that global intracellular ATP increases sufficiently to close the channels. However, experimental measurements confirm that submembrane ATP concentration rises after glucose stimulation [2,3], while the bulk ATP is only moderately changed [4]. Evidence suggests that mitochondria, particularly a subpopulation located near the plasma membrane, play a significant role in this process [5,6]. The close proximity of these mitochondria to KATP channels indicates that local ATP production in the subplasmalemmal region could suffice to close the channels, without the need for a large increase in bulk ATP concentration. This localized production represents an energy-efficient mechanism, which is crucial for beta cells and aligns with the principles of cellular energy conservation.
Recently, studies have demonstrated that ATP production can occur even closer to KATP channels, in microdomains where pyruvate kinase (PK) is located [7,8]. PK catalyzes the conversion of phosphoenolpyruvate (PEP) to pyruvate, producing ATP locally in these microdomains. This localized ATP production can efficiently achieve the high concentrations required to close KATP channels. A detailed model describing this process, the MitoCat-MitoOx model, has been developed by Merrins et al. [9]. This model accounts not only for glycolytic PEP production but also for mitochondrial PEP production, an anaplerotic pathway involving the carboxylation of pyruvate to oxaloacetate (OAA) by pyruvate carboxylase (PC) followed by the conversion of OAA to PEP by mitochondrial PEP carboxykinase (PCK2), in the so-called PEP cycle [10,11,12,13]. This pathway effectively drives the TCA cycle in an “anticlockwise” direction, emphasizing the role of anaplerotic fluxes, as also highlighted by Grubelnik et al. [1].
A recent debate in the literature has focused on the importance of ATP production in microdomains near KATP channels versus the role of mitochondrial ATP in the subplasmalemmal region. Specifically, researchers have questioned whether PK-mediated ATP production in microdomains is essential or whether mitochondrial ATP alone suffices to close KATP channels and trigger insulin secretion [14,15,16].
In this study, we evaluate the processes and fluxes that regulate ATP concentrations in the key cellular compartments: the bulk cytosol, the subplasmalemmal region, and the microdomains near KATP channels. We integrate experimental findings and existing models to provide a comprehensive framework. Our results demonstrate that previously reported observations align logically when considered in the appropriate context. Importantly, we distinguish between the first and second phases of beta cell response.
In the first phase, the cell must “fill up” its ATP reserves, requiring significant glycolytic and mitochondrial oxidative phosphorylation (OxPhos) activity to raise ATP concentrations in both the bulk cytosol and subplasmalemmal region. In the second phase, when global ATP levels are higher, a fine-tuned interplay between mitochondrial OxPhos and PEP production (from both glycolytic and mitochondrial sources) plays a dominant role. We discuss the advantages of this fine-tuned process, emphasizing its energy efficiency, particularly during the prolonged second phase of beta cell response to elevated glucose.
This paper is organized as follows: First, we present the model, which describes the primary ATP pools and the fluxes associated with ATP production and consumption. Next, we present the results in three sections: (1) processes in the first phase, (2) dynamics during the second phase, and (3) the cyclic production of NADH and NADPH. We link NADH to mitochondrial OxPhos and NADPH to the anaplerotic “anticlockwise” TCA cycle. Notably, our model enables the separate prediction of NADH and NADPH concentrations, which are experimentally indistinguishable and measured as NAD(P)H. By summing these predicted concentrations, we validate the model against experimental data for NAD(P)H and other metabolic substrates.
2. Model
The model of glucose-stimulated beta cells encompasses the processes of glycolysis, mitochondrial OxPhos, and anaplerotic processes, with an emphasis on the PEP cycle. After glycolysis, which converts glucose to pyruvate, the fate of pyruvate diverges into two primary pathways: entering the oxidative pathway via pyruvate dehydrogenase (PDH) or participating in the anaplerotic pathway via PC into the PEP cycle (Figure 1A).
In the model, we focus on ATP production at different scales: the global concentration in the cell (), at the plasma membrane (), and in the microdomains close to KATP channels (). Since ATP can diffuse through the cytosol, these three regions are conceptualized as interconnected "leaky" compartments, where the fluxes of ATP into, out of, and between the compartments play a critical role in reaching the threshold ATP concentration () required to activate the KATP channels (Figure 1B).
Glucose entering the cell serves as a substrate for glycolysis, where PEP is produced. In the final step of glycolysis, PEP is converted into pyruvate by PK. This conversion, which occurs near KATP channels where PK is located, contributes to the localized rise in ATP concentration within the microdomains () [8]. Based on the molecular weights of pyruvate (approximately 88 g/mol), PEP (around 168 g/mol), and ATP (about 507 g/mol) [17], we estimate that pyruvate diffuses significantly more efficiently than PEP or ATP, with approximate relative diffusion factors of 20% and 60%, respectively, compared to pyruvate. As a result, pyruvate, serving as a substrate for the TCA cycle, can readily diffuse to mitochondria located throughout the cell, particularly to mitochondria near the plasma membrane [5,6] and in proximity to ATPases, where it supports ATP production for their activity.
In addition to its role in the OxPhos pathway through the “clockwise” direction of the TCA cycle, pyruvate also enters the TCA cycle in its “anticlockwise” direction, producing PEP via PC in the PEP cycle. As illustrated in Figure 1, the red-labeled OxPhos phase and the blue-marked PEP cycle alternate in their activities, resulting in oscillatory patterns of ATP production across different cellular compartments (, , and ).
3. Results
Our results demonstrate that in the first phase of the beta cell response to elevated glucose, glycolysis and mitochondrial OxPhos play a crucial role in generating ATP, which needs to “fill up” the cell to establish conditions necessary for beta cell function, including insulin secretion controlled by Ca2+ signaling and cataplerotic/anaplerotic fluxes in the TCA cycle. The process begins with glucose-derived pyruvate being channeled into the “clockwise” TCA cycle, generating NADH and FADH2 as energetic molecules that fuel the electron transport chain to produce ATP. This first phase, associated with the first Ca2+ pulse, culminates in a significant increase in cellular ATP, particularly in the primary ATP compartments: and . This rise in ATP inhibits the “clockwise” TCA cycle by downregulating PDH activity, shifting the TCA cycle into the “anticlockwise” direction. This shift activates PC, redirecting pyruvate into the PEP cycle, which translocates mitochondrial ATP into the microdomains () near KATP channels.
The activation of the PEP cycle represents the terminal step of the first phase and the entry into the second phase of the beta cell response to glucose stimulation. The second phase is characterized by a repetitive cycling of PEP cycle activity and OxPhos phases. This phase relies on the fine regulation of ATP production across all compartments, with the most precise regulation occurring in the microdomains (). During this phase, the cell can reduce the glycolytic flux of fresh carbon, operating in a highly energy-efficient manner to regulate insulin secretion. We provide a rough estimate of the energy cost-efficiency achieved through local ATP () regulation, demonstrating that the interplay with PEP cycling allows the cell to “reduce costs” while maintaining the signaling needed for effective insulin secretion.
3.1. Glycolytic and Mitochondrial ATP Production in the 1st Phase
In beta cells, stimulation with glucose triggers a biphasic response characterized by ATP production, Ca2+ signaling, and insulin secretion. We emphasize that the first-phase response differs dynamically from the second-phase response. Experimental studies have shown that during the first phase, ATP production precedes the Ca2+ response. In contrast, during the second phase, Ca2+ dynamics take precedence over ATP production [2]. Our model, in alignment with these experimental findings, enables detailed flux analyses and determination of the resulting concentrations. Figure 2 illustrates the interplay between ATP fluxes and Ca2+ dynamics, specifically considering ATP production via mitochondrial OxPhos and ATP consumption by ATPases (see the central part B of Figure 2).
At the onset of the first phase, ATP production is dominated by glycolysis and OxPhos, driven by the "metabolic push" initiated by glucose (Figure 2A). The ATP generated from glycolytic PEP (PEPGly) and mitochondrial OxPhos significantly exceeds the smaller contribution from mitochondrial PEP (PEPm) production. Overall, ATP production surpasses the minimal ATP consumption by ATPases, which remain relatively inactive before the first Ca2+ spike. This phase is characterized by glycolysis and OxPhos “pumping” ATP into the system. During this phase, glucose undergoes glycolysis and rapid oxidation, resulting in a swift rise in ATP production that contributes to a gradual increase in bulk ATP concentration (), a more pronounced increase in subplasma membrane ATP concentration (), and ultimately an ATP rise in the microdomains near the KATP channels (). This localized ATP increase leads to the closure of KATP channels, triggering the first Ca2+ spike (Figure 2C). However, despite the rapid glycolytic ATP production and the OxPhos activity at the beginning of the first phase, the initial rise in ATP concentration within the microdomains surrounding the KATP channels barely reaches the threshold required to close these channels. This is due to high diffusion of ATP away from the subplasmalemmal region, where ATP concentrations are initially low (Figure 2C).
After the first Ca2+ spike, ATPases are activated, primarily to pump Ca2+ into the endoplasmic reticulum (ER). The resulting ATP consumption causes a transient decrease in ATP concentration, which activates mitochondrial OxPhos to replenish ATP. This transition signifies the metabolic shift to the “metabolic pull” phase, where ATPase activity and Ca2+ dynamics drive ATP production. In this phase, ATP demand activates OxPhos, pulling pyruvate into the TCA cycle to sustain ATP generation (Figure 2B).
It is important to emphasize that following the initial closure of KATP channels and the first Ca2+ spike, ATP levels first transiently decrease due to activation of ATPases but then continue to rise. The elevated ATP concentrations, combined with the gradual reduction in ATPase activity following the diminished Ca2+ dynamics, lead to a slowdown in OxPhos and further shift the TCA cycle toward its reverse direction. This metabolic transition marks the onset of the anaplerotic phase and the upregulation of the PEP cycle. High concentrations of PEPm drive localized ATP production, further elevating ATP levels within the microdomains surrounding the KATP channels (). The localized ATP increase initiates the second Ca2+ spike, signaling the start of the second phase (Figure 2B).
Throughout the second phase, bulk ATP concentrations remain elevated, albeit with slight oscillations. Mitochondrial PEP cycling functions as a finely tuned mechanism, providing additional ATP on top of the already elevated subplasmalemmal ATP levels. This localized ATP production ensures that, due to the oscillatory nature of the process, ATP concentrations within the microdomains near the KATP channels () alternately reach sufficiently high levels to close the channels and trigger subsequent Ca2+ pulses.
3.2. Role of PEP Cycle and local ATP Production in the 2nd Phase
As noted in the previous section, the first phase is characterized by ATP being “filled up” in the cell, primarily driven by a large glycolytic flux that provides a high influx of glucose-derived carbon and energy. The end products of glycolysis, PEP and pyruvate, serve as key sources of ATP: PEP is directly converted into pyruvate via PK, generating ATP locally, while pyruvate is channeled into the TCA cycle via PDH, contributing to OxPhos-driven ATP production. In contrast, the second phase is marked by a finely tuned interplay between the PEP cycle and alternating OxPhos activity. This interplay enables energy-efficient and precise regulation of KATP channel activity and Ca2+ dynamics, ensuring effective beta cell function. The detailed mechanisms underlying this regulatory interplay and their implications for cellular function are explored in the following section. Figure 3 illustrates the ATP production dynamics in the 1st and 2nd phases. In Figure 3A, the primary processes involved in these pathways are highlighted, while Figure 3B presents an analysis of the associated flux and concentration dynamics.
The first phase of the beta cell response to high glucose corresponds to the initial Ca2+ pulse and encompasses the metabolic pathway “Push OxPhos”–“Pull OxPhos”–“Anaplerotic PEP Cycle”, denoted as steps 1-2-3 in Figure 3A. Steps 1 (marked with grey circle in Figure 3) and 2 (marked with a red circle in Figure 3) are oxidative processes characterized by “Push OxPhos” and “Pull OxPhos”. Step 1 represents the “metabolic push” of glucose directly driving OxPhos activity, whereas in Step 2, OxPhos is “pulled” by high ATPase activity following the first Ca2+ spike in the cell. By the end of Step 2, ATPase activity slows down, allowing OxPhos flux to exceed ATPase flux, leading to a rise in ATP levels. This increase in ATP slows down glycolysis and PDH activity, effectively reducing the “clockwise” flux of the TCA cycle. This marks the transition to the step 3 (marked with a blue circle in Figure 3) representing “Anaplerotic PEP Cycle”, characterized by a significant pyruvate flux into the PEP cycle via PC and an increase in mitochondrial PEP flux () into the cytosol. The rise in cytosolic PEP, particularly near KATP channels, supports local ATP production via PK. This localized ATP increase to the threshold value (), closing the KATP channels and triggering a new Ca2+ spike, marking the start of the second phase.
The second phase operates as a repetitive cycling process of “Pull OxPhos”–“Anaplerotic PEP Cycle” (denoted as cycling steps 2-3 in Figure 3A). In Step 2, pyruvate enters the TCA cycle in the “clockwise” direction via PDH, producing NADH and FADH2, which are channeled into the electron transport chain (ETC) for ATP production. This OxPhos phase is “pulled” by high ATPase activity, which sequesters Ca2+ into the ER and partially removes it from the cell (Figure 3B). At the beginning of Step 2, and are at their maximal levels, and reaches the threshold value (), triggering the Ca2+ spike. The elevated Ca2+ concentration immediately after the spike requires increased ATPase activity to sequester Ca2+ into the ER and pump it out of the cell. As ATPase activity exceeds ATP production by OxPhos, and begin to decline (Figure 3B). However, despite this decline, remains above the threshold () throughout Step 2, supported by the high initial flux of mitochondrial PEP (). Although gradually decreases during Step 2, the KATP channels remain closed, the membrane stays depolarized, and the Ca2+ pulse is prolonged. This is consistent with experimental data showing reduced KATP channel conductance under depolarized membrane conditions [18,19]
In Step 3, OxPhos activity surpasses ATPase activity, allowing and to rise, reaching their maximal levels by the end of this phase. The increased ATP concentration inhibits PDH activity and stimulates PC activity, effectively redirecting pyruvate into the “anticlockwise” TCA cycle via PC, fueling the “Anaplerotic PEP Cycle”. This cycle redistributes ATP from mitochondria into the microdomains near KATP channels, where PK activity is high. The conversion of PEP into pyruvate via PK further elevates local . By the end of Step 3, is sufficiently high to close the KATP channels, triggering a new Ca2+ pulse and marking the return to Step 2. The repetitive cycling between Step 2 (“Pull OxPhos”) and Step 3 (“Anaplerotic PEP Cycle”) defines the entire second phase of the beta cell response to high glucose stimulation, as depicted in Figure 3.
From Figure 3, we observe that PEP production is not critically important during the first phase. Although local ATP production occurs in the microdomains near KATP channels, the diffusion of ATP is driven by a steep concentration gradient due to the relatively low bulk ATP concentration. Only temporarily does the ATP concentration in the microdomain reach the threshold value (), initiating the first Ca2+ spike. However, the cell must “fill up” its ATP pool to a level that enables the operation of the second phase.
During the second phase, the PEP cycle plays a leading role, characterized by a “filled-up” ATP pool throughout the cell, facilitating fine-tuned local ATP production in the microdomains near KATP channels. This anaplerotic PEP cycle effectively translocates ATP from mitochondria to these microdomains, triggering Ca2+ pulses. The elevated Ca2+ concentrations subsequently activate ATPases, which reduce ATP levels. This decrease in ATP concentration, combined with high Ca2+ levels, activates PDH, enhancing TCA cycle flux and promoting OxPhos. These two processes—the anaplerotic PEP cycle and the OxPhos “pulled” by ATPases—operate in an alternating manner as long as there is sufficient carbon input (e.g., glucose).
The glycolytic flux during the second phase is lower than in the first phase, as energy demands are reduced. This observation is supported by Foster et al. [11], who demonstrated that the amplitude, duty cycle, and period of Ca2+ oscillations increase when PC activity in mitochondria (PC2), and consequently mitochondrial PEP production, is inhibited. Inhibited PEP cycling reduces PEP delivery to the subplasmalemmal region near KATP channels, which slows ATP production via PK, delays the increase in , and prolongs the time required to reach the threshold value for triggering the next Ca2+ spike ().
This delay implies that more time is needed to produce sufficient ATP for the subplasmalemmal ATP concentration () to reach the threshold value required to trigger a Ca2+ spike (). During this longer process, greater amounts of Ca2+ must be released and re-sequestered, resulting in increased energy fluxes in the system. To estimate the additional power required for Ca2+ release and re-sequestration, experimental traces of Ca2+ oscillations from Foster et al. [11] were analyzed.
We modeled the experimental Ca2+ traces using a modified Heaviside function:
Equation (1)
where A is the amplitude, T is period, D is duty cycle (fraction of each oscillation spent in the electrically active state), and S is parameter controlling oscillation steepness. The function was fitted separately for the wild-type mice (WT) and mice with β-cell PCK2 deletion of PCK2 (PCK2-KO) (Figure 4A).
The power () required for Ca2+ handling was estimated by calculating the area under the curve (AUC) of ATPase flux for each individual oscillation using the formula:
Equation (2)
where T is the oscillation period, and represents the ATP flux () governed by the Ca2+-dependent kinetics of calcium store refilling:
Equation (3)
where is the maximum rate of pumping, n = 2 (cooperativity of calcium binding) and Km = 0.5 µM (half-saturation constant) [20].
By inserting Equation (3) into Equation (2) and calculating the relative difference between the AUC for WT and PCK2-βKO mice, the parameter cancels out. Thus, can be set to an arbitrary value, and for simplicity, we set . The calculated AUC values were 0.78 for WT mice and 1.20 for PCK2-βKO mice (see Figure 4B). After normalizing the AUC values by the duration of each oscillation period ( s and s), the power ratio between WT and PCK2-βKO mice was found to be 1:1.18. This indicates that calcium handling in PCK2-βKO mice requires approximately 18% more power, reflecting reduced efficiency compared to WT mice.
As shown in Figure 4, the approximately 18% energy savings facilitated by the PEP cycle and localized ATP production in microdomains are critically important. While an 18% saving might seem modest, it is essential to emphasize that the second phase of the beta cell response to elevated glucose can be lasting several tens of minutes to hours [21]. Therefore, this efficient handling of small amounts of Ca2+ and the corresponding localized ATP elevations in microdomains play a crucial role in maintaining normal and healthy beta cell function, ensuring effective and sustained insulin secretion.
3.3. Cyclic NADH and NADPH Production in the 2nd Phase
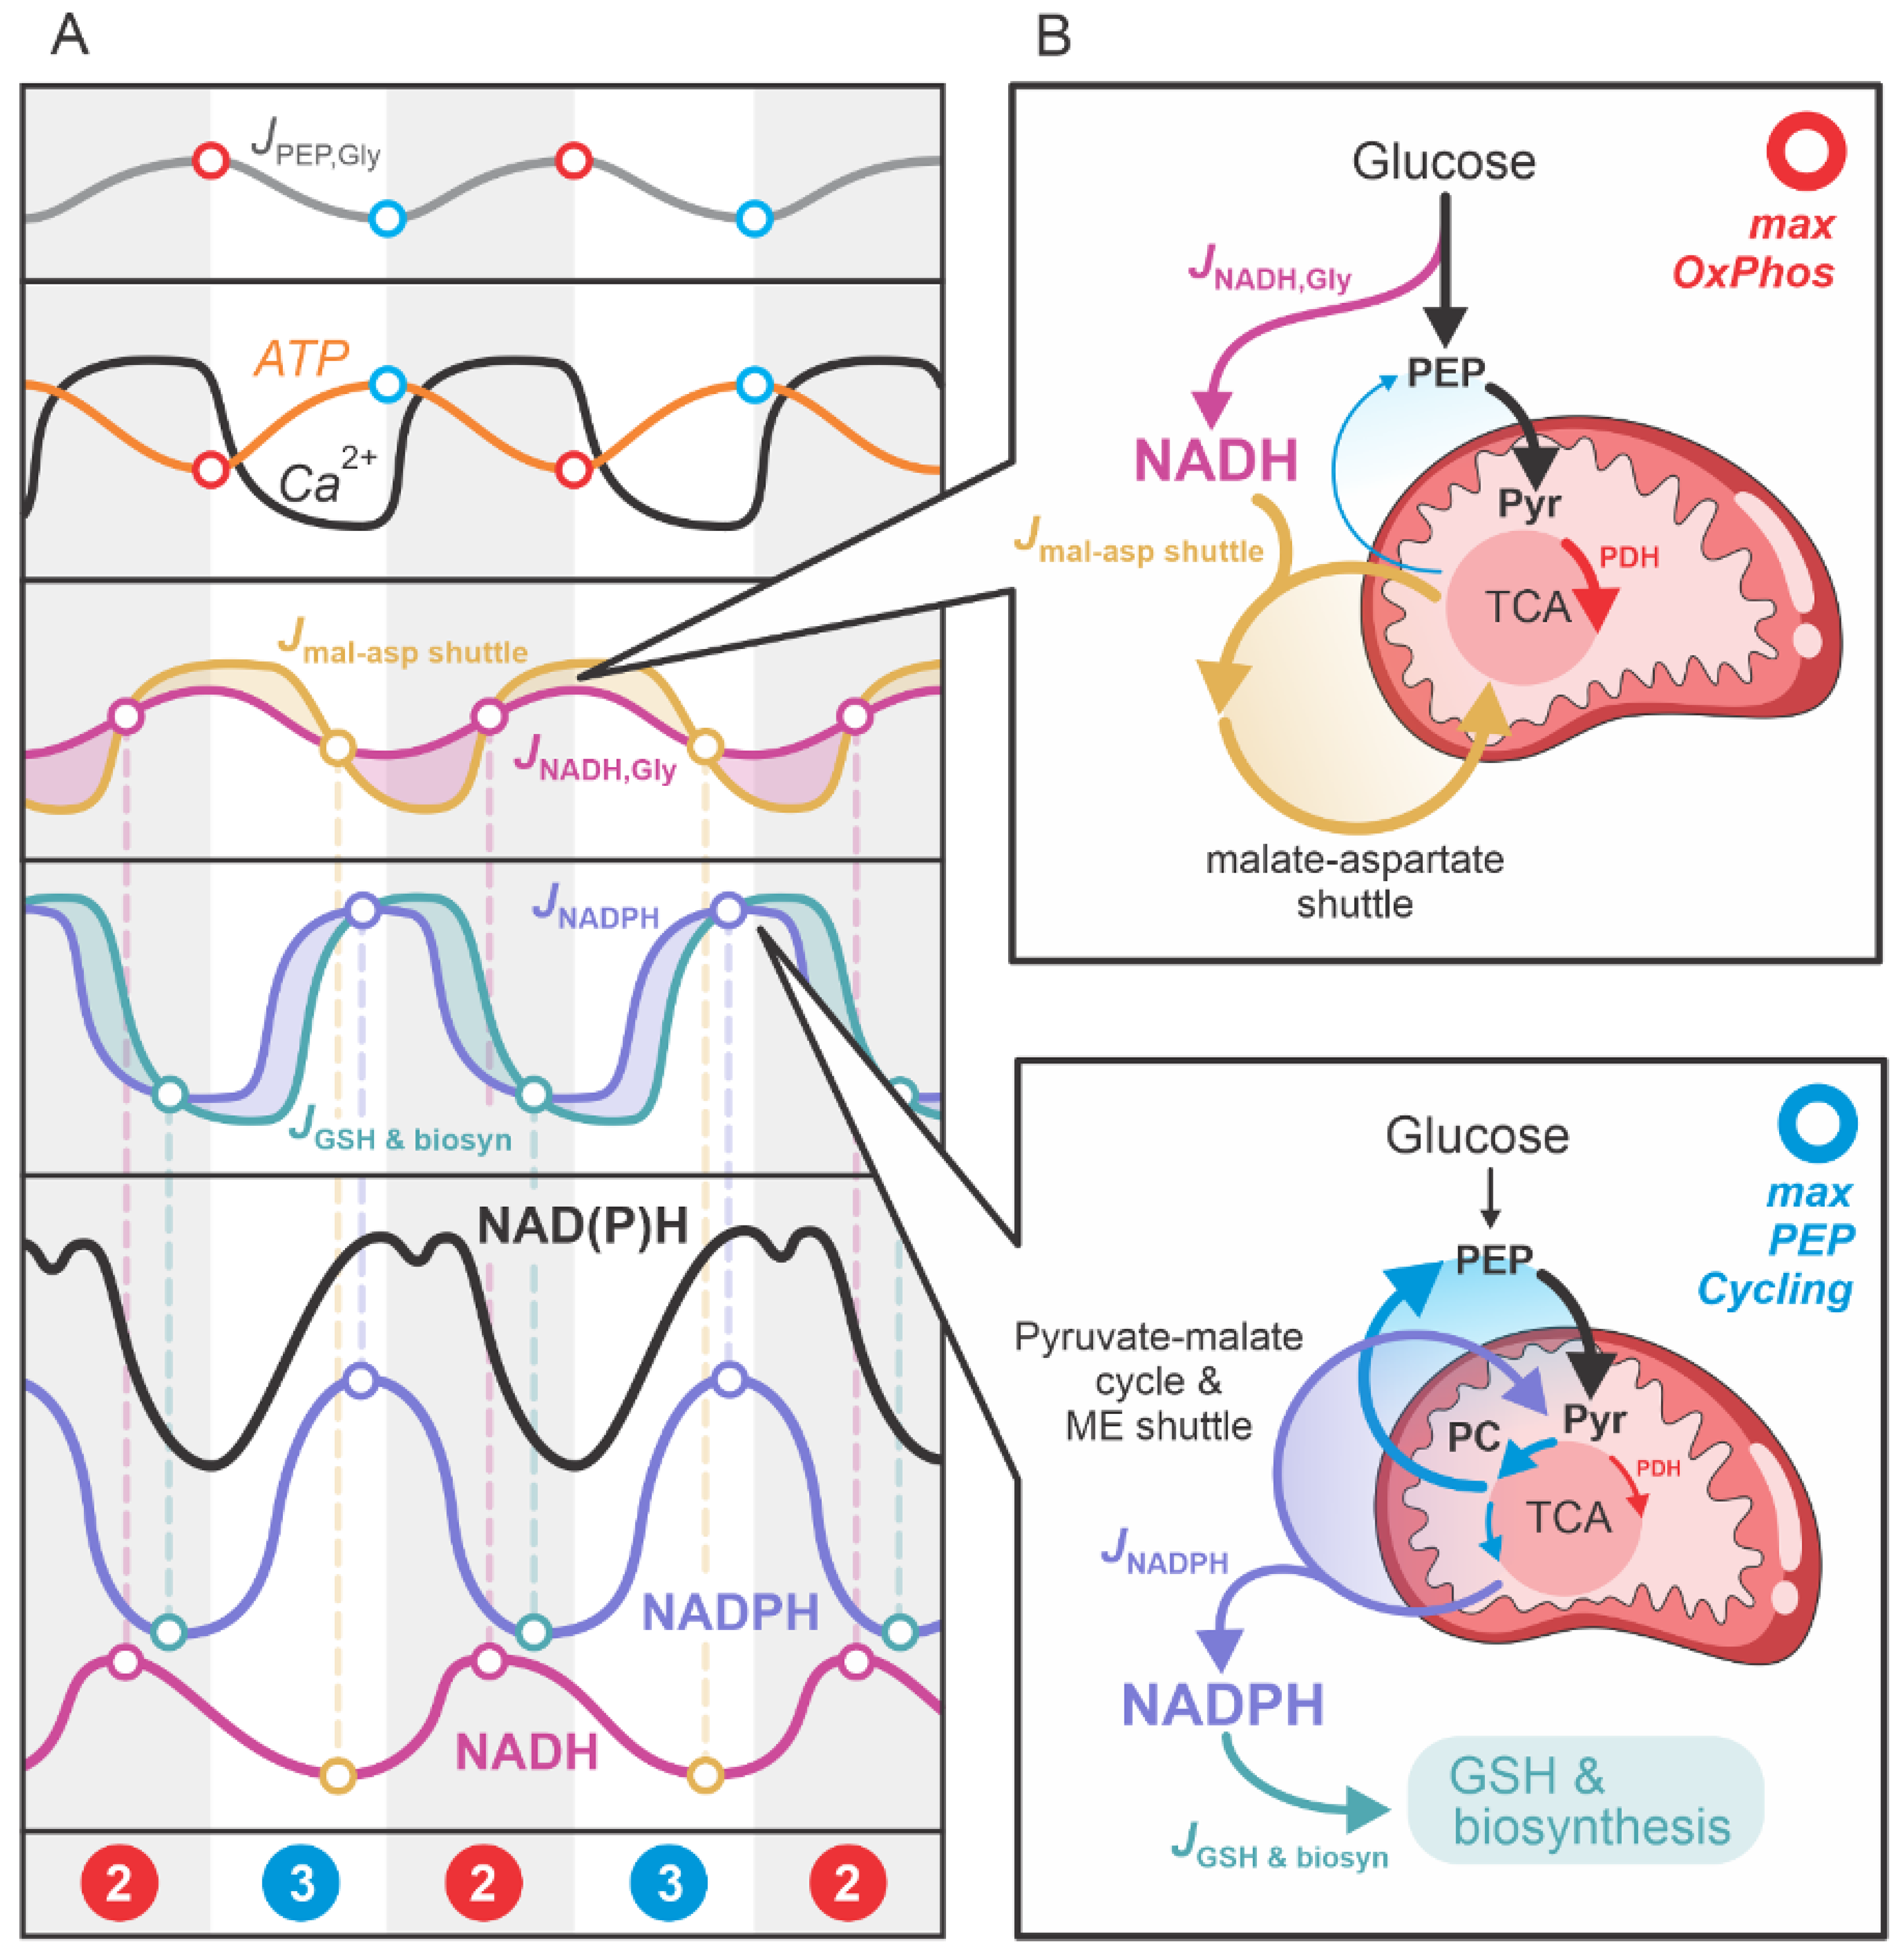
The second phase of the beta cell response to high glucose operates as a repetitive cycling process of “Pull OxPhos”–“Anaplerotic PEP Cycle”, as illustrated in Figure 3. The transition from Step 2 to Step 3 is characterized by the highest rates of OxPhos activity, denoted in red in Figure 3. This notation is maintained in Figure 5, where the critical features of the OxPhos phase are highlighted. During this phase, pyruvate is channeled via PDH into the “clockwise” TCA cycle, producing NADH, which is subsequently utilized for ATP production in the ETC. Conversely, the transition from Step 3 to Step 2, denoted in blue, represents the peak activity of the PEP cycle, with pyruvate fluxing in the “anticlockwise” TCA cycle direction via PC and feeding into the PEP cycle. The “anticlockwise” TCA cycle direction is associated with NADPH production through several metabolic pathways linked to glucose and, in physiological conditions, glutamine metabolism. For a recent model of this metabolism in beta cells, see [1].
One of the strengths of this model is its ability to predict the production of NADH and NADPH in stimulated beta cells. This is particularly important because experimentally it is challenging—if not impossible in most cases—to distinguish between NADH and NADPH concentrations. Experimental data are typically represented as NAD(P)H concentrations, indicating joint measurement of NADH and NADPH. In the experiments by Merrins et al. [22], high-resolution measurements of NAD(P)H concentrations revealed an impressive “double spike” pattern in the oscillatory traces. Our model successfully explains the “double-spike” dynamics of NAD(P)H concentrations in stimulated beta cells.
To facilitate understanding of this process, Figure 5 graphically illustrates the primary metabolic pathways contributing to NADH (red) and NADPH (blue) production. Figure 5A provides a flux analysis of the main processes involved in NADH and NADPH production: NADH production by glycolysis (); NADH transport from the cytosol to mitochondria via the malate-aspartate shuttle (); the net NADPH influx into the cytosol (), which includes NADPH production through the anaplerotic pyruvate-malate cycle and anaplerotically driven NADPH shuttles, primarily the malic enzyme (ME) and isocitrate dehydrogenase (IDH) shuttles; and the net NADPH efflux from the cytosol (), which accounts for NADPH usage in glutathione (GSH) synthesis and other biosynthetic processes. These fluxes vary significantly over time, resulting in oscillatory NADH and NADPH concentrations. The phase difference between these oscillations explains the experimentally observed “double-spike” patterns in the NAD(P)H traces of activated beta cells.
To better understand the temporal dynamics of the main fluxes contributing to the cytosolic concentrations of NADH and NADPH, Figure 5B presents the fluxes , , , and in relation to the primary glycolytic input flux and the TCA cycle fluxes. During the maximum OxPhos phase, the glycolytic flux is high, and the resulting pyruvate is primarily directed via PDH into the oxidative “clockwise” TCA cycle. Glycolytic NADH production is elevated, and the NADH is shuttled into mitochondria through the malate-aspartate shuttle.
As NADH is converted to ATP and cytosolic ATP levels rise, glycolysis is inhibited. Additionally, elevated ATP levels inhibit PDH and activate PC, progressively shifting the TCA cycle toward the “anticlockwise” direction, including the PEP cycle. This anaplerotic phase generates NADPH through the pyruvate-malate cycle and facilitates NADPH transport from mitochondria to the cytosol via the ME and IDH shuttles. Concurrently, NADPH is utilized for antioxidative processes, such as GSH synthesis, and other biosynthetic pathways.
4. Discussion
The presented model emphasizes the importance of separately considering the first and second phases of the beta cell response to elevated glucose concentrations. In the first phase, high glucose drives ATP production through a “metabolic push”, with glycolysis and mitochondrial OxPhos playing crucial roles. The initial elevation of ATP induced by this metabolic push involves substantial energy investment. This aligns with experimental measurements of oxygen consumption in beta cells, which show that oxidation and OxPhos are highly active during the early response to glucose stimulation [2,23].
Moreover, the model is consistent with experimental findings that highlight the significance of specific mitochondrial distribution within the cell, particularly the subpopulation located beneath the plasma membrane [5,6]. As ATP elevation occurs primarily in the subplasmalemmal region without a substantial increase in bulk ATP levels [2,3,4], our results underscore the critical role of this subplasmalemmal mitochondrial subpopulation in ATP production.
This understanding is particularly relevant for studying the pathogenesis of type 2 diabetes mellitus (T2DM), where alterations in the first-phase response to glucose stimulation in beta cells have been observed [21,24]. Additionally, the consequences of mitochondrial dysfunction in alpha and beta cells have been extensively studied in relation to T2DM [25,26].
As demonstrated by our model and supported by experimental data [2], ATP elevation in the first phase is followed by the slower and less pronounced rise in calcium. The model attributes this phenomenon to the substantial energy demand necessary to initiate the system. Following the rise in Ca2+ during the first phase, elevated Ca2+ concentrations activate ATPases to sequester Ca2+, primarily into the ER. This increased ATPase activity consumes significant amounts of ATP, effectively “pulling” OxPhos to sustain ATP production via the TCA cycle. This ATPase-driven “pull” on oxidative processes continues throughout the second phase.
The second phase begins after the ATP pool in the cell is “filled up”, providing the foundation for fine-tuned ATP production in microdomains near KATP channels. In this phase, ATP is locally produced by converting PEP into pyruvate via PK. The model’s predictions align with experimental findings showing that PK is located close to the plasma membrane, where KATP channels are situated [8,9,11]. Local ATP production in these microdomains is also energetically advantageous. According to our model calculations, energy savings of approximately 18% were achieved when comparing wild-type beta cells to PCK2-βKO mice, based on calcium oscillation data from Foster et al. [11]. This energy conservation is particularly important during the second phase, which is long-lasting and essential for sustained insulin secretion, especially under conditions of high metabolic demand. Although this 18% is a rough estimate, it appears to be realistic given the prolonged nature of the second phase and the associated energy requirements.
Calcium transport across compartments and ATPase activity are inherently energy-intensive. For instance, recent studies on adipocytes demonstrated that a so-called “Ca2+ futile cycle” induced by GIPR activation significantly increased energy consumption, leading to weight loss of approximately 35% [27]. Thus, localized ATP production near KATP channels is critical for energy efficiency. Moreover, recent research highlights the importance of highly localized compartments in glucose-stimulated beta cell processes. For example, human islets exhibit primary cilia observed by electron microscopy, which may act as vital glucose-sensing organelles [28].
The second phase, a long-lasting and energy-efficient phase, is critically characterized by anaplerotic pathways. In addition to the PEP cycle highlighted in our model, other anaplerotic pathways play significant roles in enabling beta cells to sense metabolite abundance and produce substantial amounts of insulin in response to food intake under physiological conditions [1]. For example, citrate—one of the key anaplerotic metabolites derived from the TCA cycle—has been experimentally shown to oscillate in antiphase with Ca2+ [29]. This observation aligns with our model’s predictions, which show NADPH—another critical metabolite produced via the “anticlockwise” TCA cycle—exhibiting similar oscillatory behavior.
Additionally, our model’s depiction of glycolytic flux aligns well with experimentally measured glycolytic intermediates, such as fructose-1,6-bisphosphate, which oscillates in phase with cytosolic Ca2+ concentrations [22]. The high glycolytic flux, coupled with elevated OxPhos activity (as shown by the in-phase dynamics in Figure 3B), underscores the critical role of mitochondrial ATP production. It is important to emphasize that our model does not contradict the “traditional” view of beta cell function—referred to by Merrins et al. [9] as the “canonical” model—in which OxPhos raises the ATP/ADP ratio to trigger KATP channel closure, Ca2+ influx, and insulin release. This “canonical” model has been the subject of recent discussions about its validity [14,15,16]. Rather, our model demonstrates that the “canonical” model represents only part of the complex metabolic response of beta cells to high glucose. Specifically, while the “canonical” model elucidates mitochondrial oxidative ATP production during the “push-OxPhos” first phase, our model extends this understanding by incorporating the “pull-OxPhos” phase, in which ATPases drive NADH production and subsequent ATP synthesis via the ETC.
Our model provides a more comprehensive perspective on the intricate metabolic processes in beta cells following glucose stimulation. This approach integrates previous models and experimental findings, offering a unified explanation for observations obtained under varying conditions and at different time points during beta cell responses. For example, some experimental results focus on the early response (first phase), while others pertain to the prolonged response in the second phase.
Importantly, our model captures the dynamics of key fluxes that regulate the concentrations of Ca2+, ATP, PEP, and other metabolites. These temporal dynamics can be challenging to intuit because substrate concentrations arise from a balance between influx and efflux processes. Moreover, the model highlights the importance of compartmentalized metabolite production. For instance, high NADH concentrations in the cytosol during OxPhos activity might be misinterpreted as being directly caused by mitochondrial NADH production. However, mitochondrial NADH is confined to mitochondria, as NADH cannot cross the inner mitochondrial membrane. Instead, cytosolic NADH increases are primarily driven by glycolysis.
The strength of the model is also its ability to predict separate concentrations of NADH and NADPH in the cytosol. Experimentally, these metabolites are typically measured as their combined signal, NAD(P)H, without the ability to distinguish between the two. By predicting NADH and NADPH separately and summing them, the model achieves a direct match with experimental NAD(P)H data from Merrins et al. [22]. This is a significant result that provides insights and directions for future experimental studies. As experimental techniques advance, the model’s predictions can be further validated, demonstrating how theoretical approaches can inspire new experimental research. This synergy between theoretical and experimental studies fosters scientific development and opens pathways for new discoveries.
Author Contributions
Conceptualization, M.M.; methodology, V.G.; software, V.G. and J.Z.; formal analysis, V.G.; writing—original draft preparation, V.G., M.M. and J.Z.; writing—review and editing, M.M. and J.Z.; visualization, V.G. and J.Z.; supervision, M.M.; All authors have read and agreed to the published version of the manuscript.
Funding
This research was funded by the Slovenian Research and Innovation Agency (research core funding no. P1-0055 and research project no. J3-3077).
Institutional Review Board Statement
Not applicable.
Informed Consent Statement
Not applicable.
Conflicts of Interest
The authors declare no conflicts of interest.
Abbreviations
The following abbreviations are used in this manuscript:
| KATP | ATP-sensitive potassium channels |
| PK | Pyruvate kinase |
| PEP | Phosphoenolpyruvate |
| OAA | Oxaloacetate |
| PC | Pyruvate carboxylase |
| PCK2 | PEP carboxykinase |
| OxPhos | Oxidative Phosphorylation |
| PDH | Pyruvate Dehydrogenase |
| PEPGly | Glycolytic PEP |
| PEPm | Mitochondrial PEP |
| ER | Endoplasmic reticulum |
| ETC | Electron transport chain |
| PCK2-βKO | β-cell deletion of PCK2 |
| ME | Malic enzyme |
| IDH | Isocitrate dehydrogenase |
| GSH | Glutathione |
| T2DM | Type 2 diabetes mellitus |
References
- Grubelnik, V.; Zmazek, J.; Gosak, M.; Marhl, M. The Role of Anaplerotic Metabolism of Glucose and Glutamine in Insulin Secretion: A Model Approach. Biophys Chem 2024, 311, 107270. [Google Scholar] [CrossRef] [PubMed]
- Li, J.; Shuai, H.Y.; Gylfe, E.; Tengholm, A. Oscillations of Sub-Membrane ATP in Glucose-Stimulated Beta Cells Depend on Negative Feedback from Ca2+. Diabetologia 2013, 56, 1577–1586. [Google Scholar] [CrossRef] [PubMed]
- Li, J.; Yu, Q.; Ahooghalandari, P.; Gribble, F.M.; Reimann, F.; Tengholm, A.; Gylfe, E. Submembrane ATP and Ca 2+ Kinetics in α-Cells: Unexpected Signaling for Glucagon Secretion. The FASEB Journal 2015, 29, 3379–3388. [Google Scholar] [CrossRef] [PubMed]
- Lorenz, M.A.; El Azzouny, M.A.; Kennedy, R.T.; Burant, C.F. Metabolome Response to Glucose in the β-Cell Line INS-1 832/13. Journal of Biological Chemistry 2013, 288, 10923–10935. [Google Scholar] [CrossRef] [PubMed]
- Kennedy, H.J.; Pouli, A.E.; Ainscow, E.K.; Jouaville, L.S.; Rizzuto, R.; Rutter, G.A. Glucose Generates Sub-Plasma Membrane ATP Microdomains in Single Islet β-Cells. Journal of Biological Chemistry 1999, 274, 13281–13291. [Google Scholar] [CrossRef]
- Wang, Z.; Gurlo, T.; Matveyenko, A. V.; Elashoff, D.; Wang, P.; Rosenberger, M.; Junge, J.A.; Stevens, R.C.; White, K.L.; Fraser, S.E.; et al. Live-Cell Imaging of Glucose-Induced Metabolic Coupling of β and α Cell Metabolism in Health and Type 2 Diabetes. Commun Biol 2021, 4, 594. [Google Scholar] [CrossRef]
- Abulizi, A.; Cardone, R.L.; Stark, R.; Lewandowski, S.L.; Zhao, X.; Hillion, J.; Ma, L.; Sehgal, R.; Alves, T.C.; Thomas, C.; et al. Multi-Tissue Acceleration of the Mitochondrial Phosphoenolpyruvate Cycle Improves Whole-Body Metabolic Health. Cell Metab 2020, 32, 751–766.e11. [Google Scholar] [CrossRef] [PubMed]
- Lewandowski, S.L.; Cardone, R.L.; Foster, H.R.; Ho, T.; Potapenko, E.; Poudel, C.; VanDeusen, H.R.; Sdao, S.M.; Alves, T.C.; Zhao, X.; et al. Pyruvate Kinase Controls Signal Strength in the Insulin Secretory Pathway. Cell Metab 2020, 32, 736–750.e5. [Google Scholar] [CrossRef]
- Merrins, M.J.; Corkey, B.E.; Kibbey, R.G.; Prentki, M. Metabolic Cycles and Signals for Insulin Secretion. Cell Metab 2022, 34, 947–968. [Google Scholar] [CrossRef] [PubMed]
- Stark, R.; Kibbey, R.G. The Mitochondrial Isoform of Phosphoenolpyruvate Carboxykinase (PEPCK-M) and Glucose Homeostasis: Has It Been Overlooked? Biochimica et Biophysica Acta (BBA) - General Subjects 2014, 1840, 1313–1330. [Google Scholar] [CrossRef] [PubMed]
- Foster, H.R.; Ho, T.; Potapenko, E.; Sdao, S.M.; Huang, S.M.; Lewandowski, S.L.; VanDeusen, H.R.; Davidson, S.M.; Cardone, R.L.; Prentki, M.; et al. β-Cell Deletion of the PKm1 and PKm2 Isoforms of Pyruvate Kinase in Mice Reveals Their Essential Role as Nutrient Sensors for the KATP Channel. Elife 2022, 11. [Google Scholar] [CrossRef]
- Stark, R.; Guebre-Egziabher, F.; Zhao, X.; Feriod, C.; Dong, J.; Alves, T.C.; Ioja, S.; Pongratz, R.L.; Bhanot, S.; Roden, M.; et al. A Role for Mitochondrial Phosphoenolpyruvate Carboxykinase (PEPCK-M) in the Regulation of Hepatic Gluconeogenesis. Journal of Biological Chemistry 2014, 289, 7257–7263. [Google Scholar] [CrossRef] [PubMed]
- Stark, R.; Pasquel, F.; Turcu, A.; Pongratz, R.L.; Roden, M.; Cline, G.W.; Shulman, G.I.; Kibbey, R.G. Phosphoenolpyruvate Cycling via Mitochondrial Phosphoenolpyruvate Carboxykinase Links Anaplerosis and Mitochondrial GTP with Insulin Secretion. Journal of Biological Chemistry 2009, 284, 26578–26590. [Google Scholar] [CrossRef] [PubMed]
- Merrins, M.J.; Kibbey, R.G. Glucose Regulation of β-Cell KATP Channels: It Is Time for a New Model! Diabetes 2024, 73, 856–863. [Google Scholar] [CrossRef] [PubMed]
- Rutter, G.A.; Sweet, I.R. Glucose Regulation of β-Cell KATP Channels: Is a New Model Needed? Diabetes 2024, 73, 849–855. [Google Scholar] [CrossRef] [PubMed]
- Satin, L.S.; Corradi, J.; Sherman, A.S. Do We Need a New Hypothesis for KATP Closure in β-Cells? Distinguishing the Baby From the Bathwater. Diabetes 2024, 73, 844–848. [Google Scholar] [CrossRef]
- Berg, J.; Tymoczko, J.; Stryer, L. Biochemistry, 5th Edition; 2002.
- Cook, D.L.; Hales, N. Intracellular ATP Directly Blocks K+ Channels in Pancreatic B-Cells. Nature 1984, 311, 271–273. [Google Scholar] [CrossRef] [PubMed]
- Vivaudou, M.; Moreau, C.J.; Terzic, A. ATP-Sensitive K+ Channels. In lon Channels: From Structure to Function; Kew, J., Davies, C., Eds.; Oxford University Press, 2009; pp. 454–473.
- Grubelnik, V.; Zahle Larsen, A.; Kummer, U.; Folke Olsen, L.; Marhl, M. Mitochondria Regulate the Amplitude of Simple and Complex Calcium Oscillations. Biophys Chem 2001, 94, 59–74. [Google Scholar] [CrossRef] [PubMed]
- Di Giuseppe, G.; Ciccarelli, G.; Soldovieri, L.; Capece, U.; Cefalo, C.M.A.; Moffa, S.; Nista, E.C.; Brunetti, M.; Cinti, F.; Gasbarrini, A.; et al. First-Phase Insulin Secretion: Can Its Evaluation Direct Therapeutic Approaches? Trends in Endocrinology & Metabolism 2023, 34, 216–230. [Google Scholar] [CrossRef]
- Merrins, M.J.; Poudel, C.; McKenna, J.P.; Ha, J.; Sherman, A.; Bertram, R.; Satin, L.S. Phase Analysis of Metabolic Oscillations and Membrane Potential in Pancreatic Islet β -Cells. Biophys J 2016, 110, 691–699. [Google Scholar] [CrossRef]
- Jung, S.-K.; Kauri, L.M.; Qian, W.-J.; Kennedy, R.T. Correlated Oscillations in Glucose Consumption, Oxygen Consumption, and Intracellular Free Ca2+ in Single Islets of Langerhans. Journal of Biological Chemistry 2000, 275, 6642–6650. [Google Scholar] [CrossRef] [PubMed]
- Del Prato, S.; Tiengo, A. The Importance of First-Phase Insulin Secretion: Implications for the Therapy of Type 2 Diabetes Mellitus. Diabetes Metab Res Rev 2001, 17, 164–174. [Google Scholar] [CrossRef]
- Grubelnik, V.; Markovič, R.; Lipovšek, S.; Leitinger, G.; Gosak, M.; Dolenšek, J.; Valladolid-Acebes, I.; Berggren, P.-O.; Stožer, A.; Perc, M.; et al. Modelling of Dysregulated Glucagon Secretion in Type 2 Diabetes by Considering Mitochondrial Alterations in Pancreatic α-Cells. R Soc Open Sci 2020, 7, 191171. [Google Scholar] [CrossRef] [PubMed]
- Grubelnik, V.; Zmazek, J.; Markovič, R.; Gosak, M.; Marhl, M. Mitochondrial Dysfunction in Pancreatic Alpha and Beta Cells Associated with Type 2 Diabetes Mellitus. Life 2020, 10, 348. [Google Scholar] [CrossRef]
- Yu, X.; Chen, S.; Funcke, J.-B.; Straub, L.G.; Pirro, V.; Emont, M.P.; Droz, B.A.; Collins, K.AI.; Joung, C.; Pearson, M.J.; et al. The GIP Receptor Activates Futile Calcium Cycling in White Adipose Tissue to Increase Energy Expenditure and Drive Weight Loss in Mice. Cell Metab 2025, 37, 187–204.e7. [Google Scholar] [CrossRef] [PubMed]
- Polino, A.J.; Sviben, S.; Melena, I.; Piston, D.W.; Hughes, J.W. Scanning Electron Microscopy of Human Islet Cilia. Proceedings of the National Academy of Sciences 2023, 120. [Google Scholar] [CrossRef] [PubMed]
- Gregg, T.; Sdao, S.M.; Dhillon, R.S.; Rensvold, J.W.; Lewandowski, S.L.; Pagliarini, D.J.; Denu, J.M.; Merrins, M.J. Obesity-Dependent CDK1 Signaling Stimulates Mitochondrial Respiration at Complex I in Pancreatic β-Cells. Journal of Biological Chemistry 2019, 294, 4656–4666. [Google Scholar] [CrossRef]
Figure 1.
Schematic representation of the key energetic processes in a glucose-stimulated beta cell. (A) ATP is produced via glycolysis (Gly) and mitochondrial oxidative phosphorylation (OxPhos), and translocated by the PEP cycle, with its primary utilization by ATPases. (B) The model considers three main pools of ATP: the global cytosolic concentration (), the subplasmalemmal concentration near the plasma membrane (), and the localized concentration in the microdomains near KATP channels ().
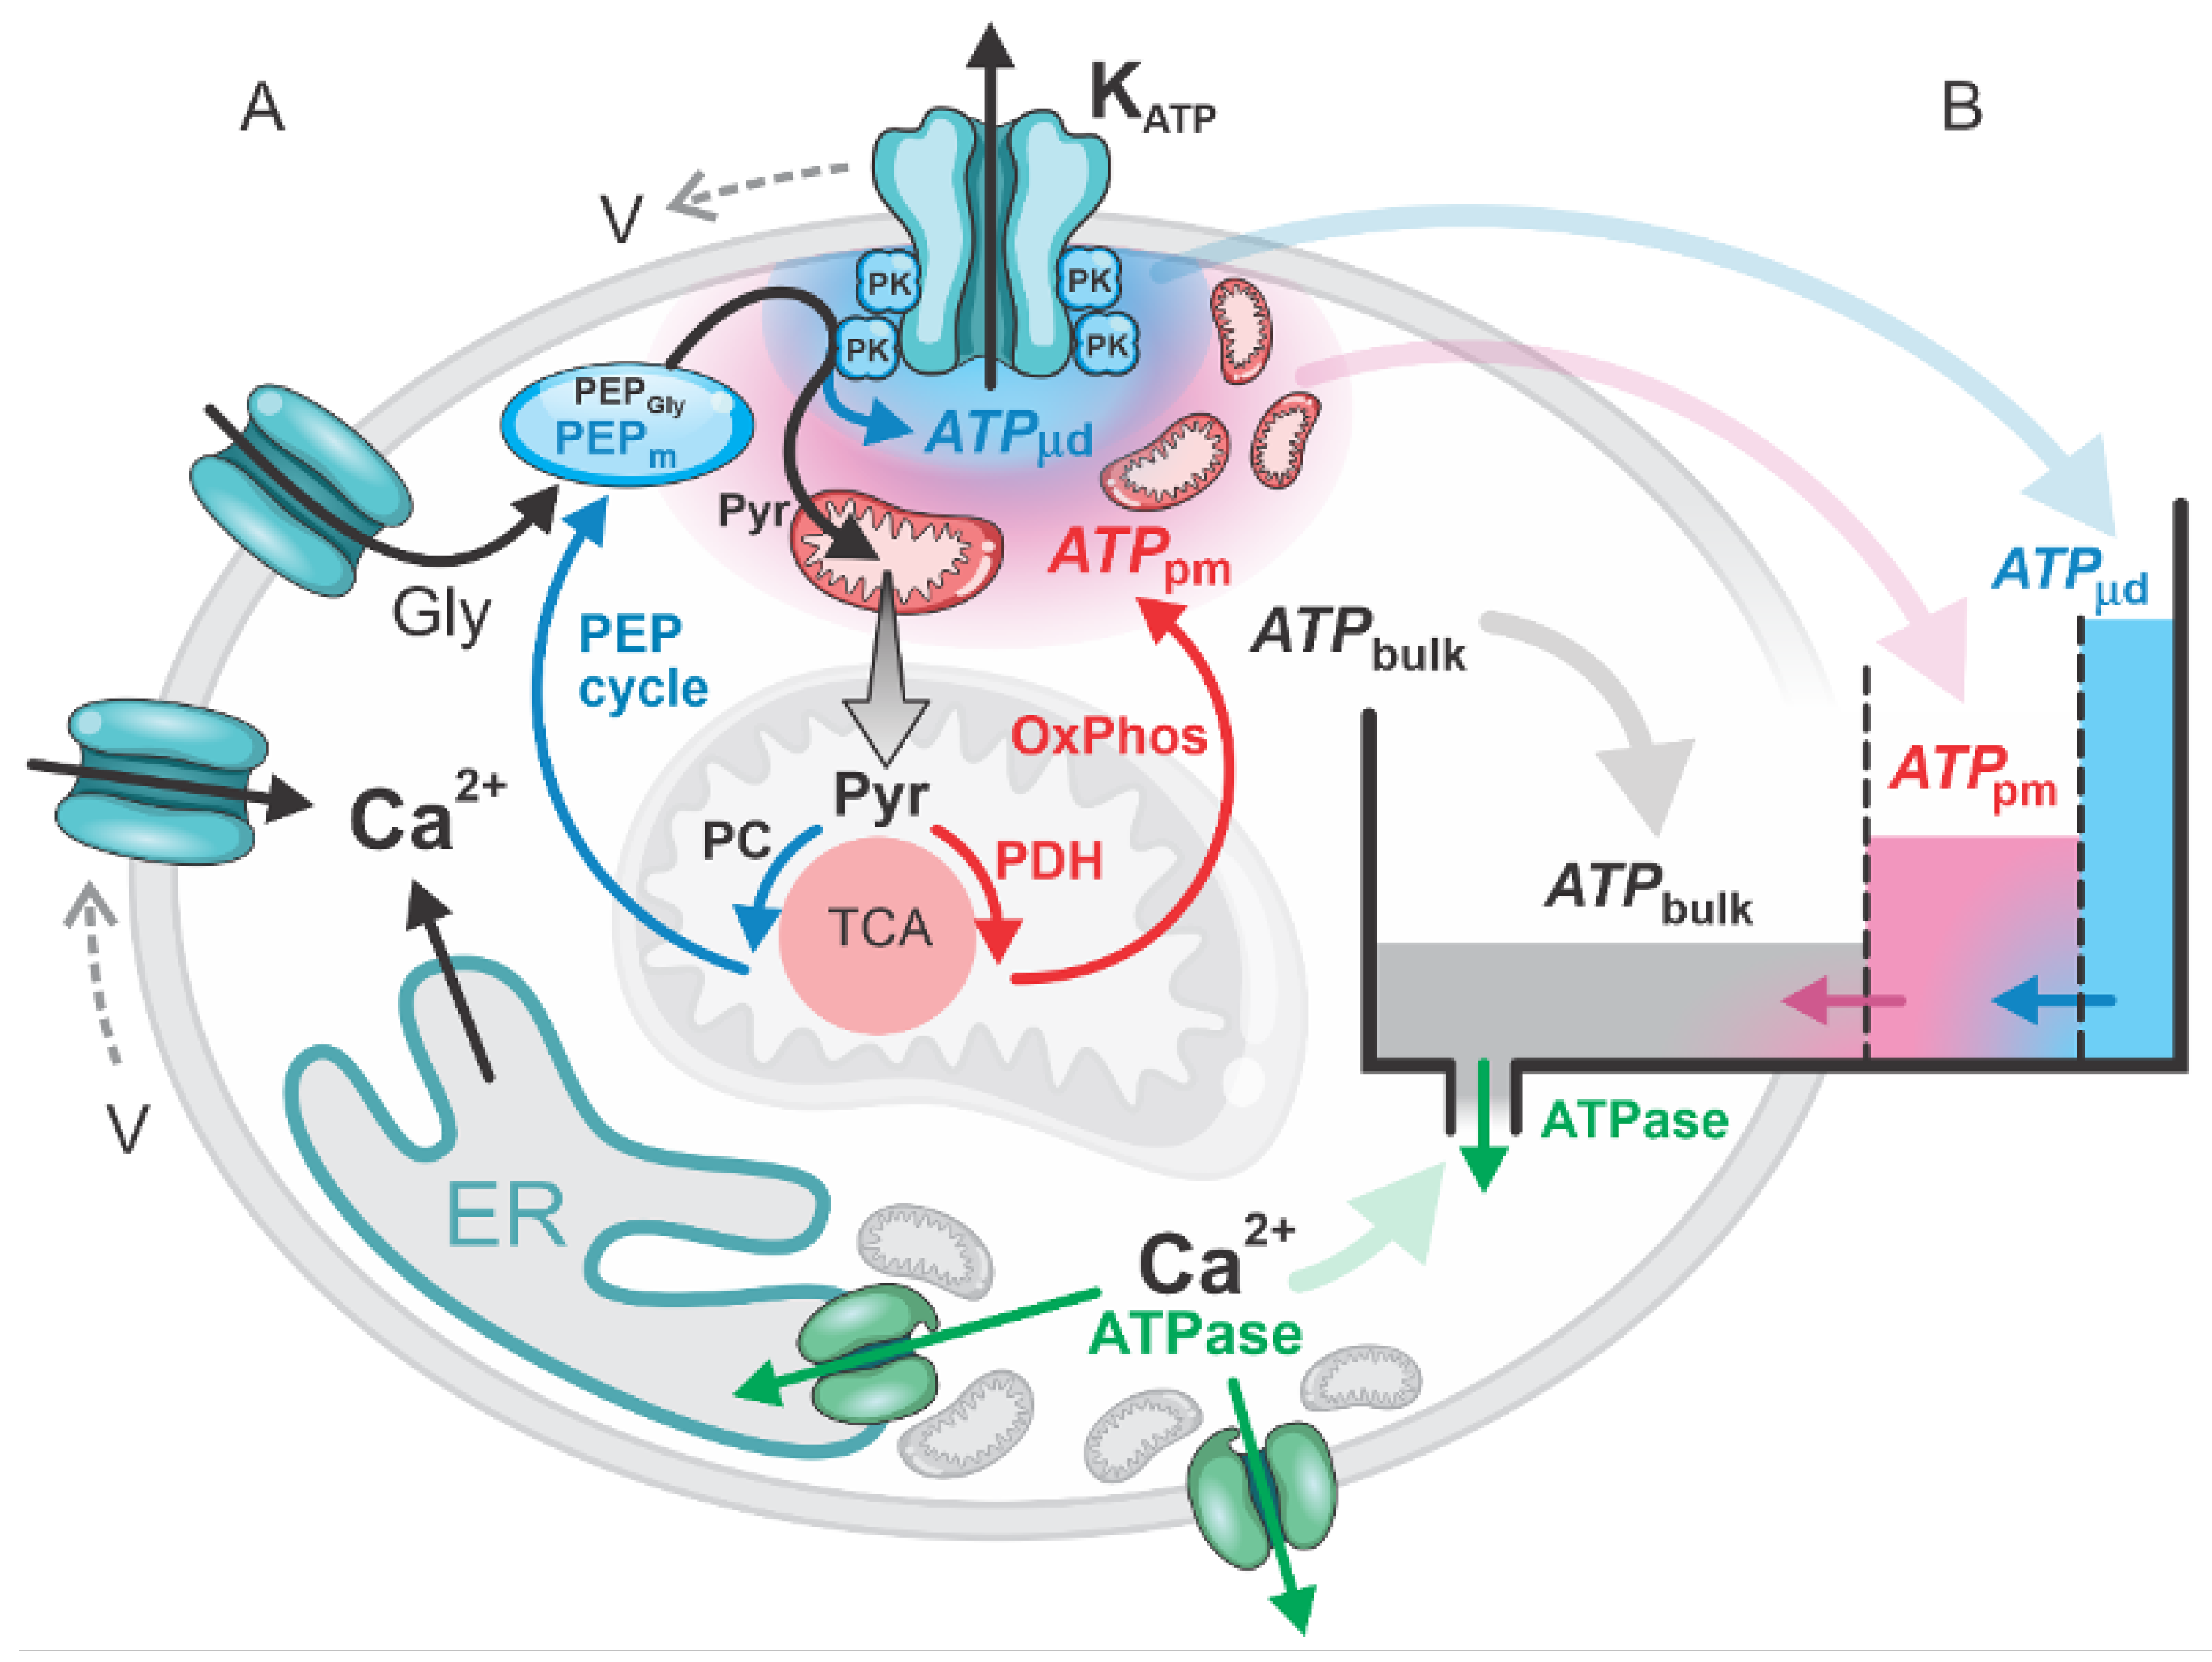
Figure 2.
ATP “filling up” during the first phase in a glucose-stimulated beta cell, driven by the “metabolic push” of glucose through high glycolytic flux and elevated OxPhos activity. The subsequent “pull phase” occurs when ATPase activity “pulls” OxPhos to meet the ATP demand. In the second phase, bulk ATP concentrations remain elevated but exhibit slight oscillations due to the alternating activity of OxPhos and PEP cycle activation. (A) Glucose-driven “push” on glycolysis and OxPhos. (B) ATP and Ca2+ dynamics during the 1st and 2nd phases. (C) ATP fluxes into and out of the three pools: , , and .
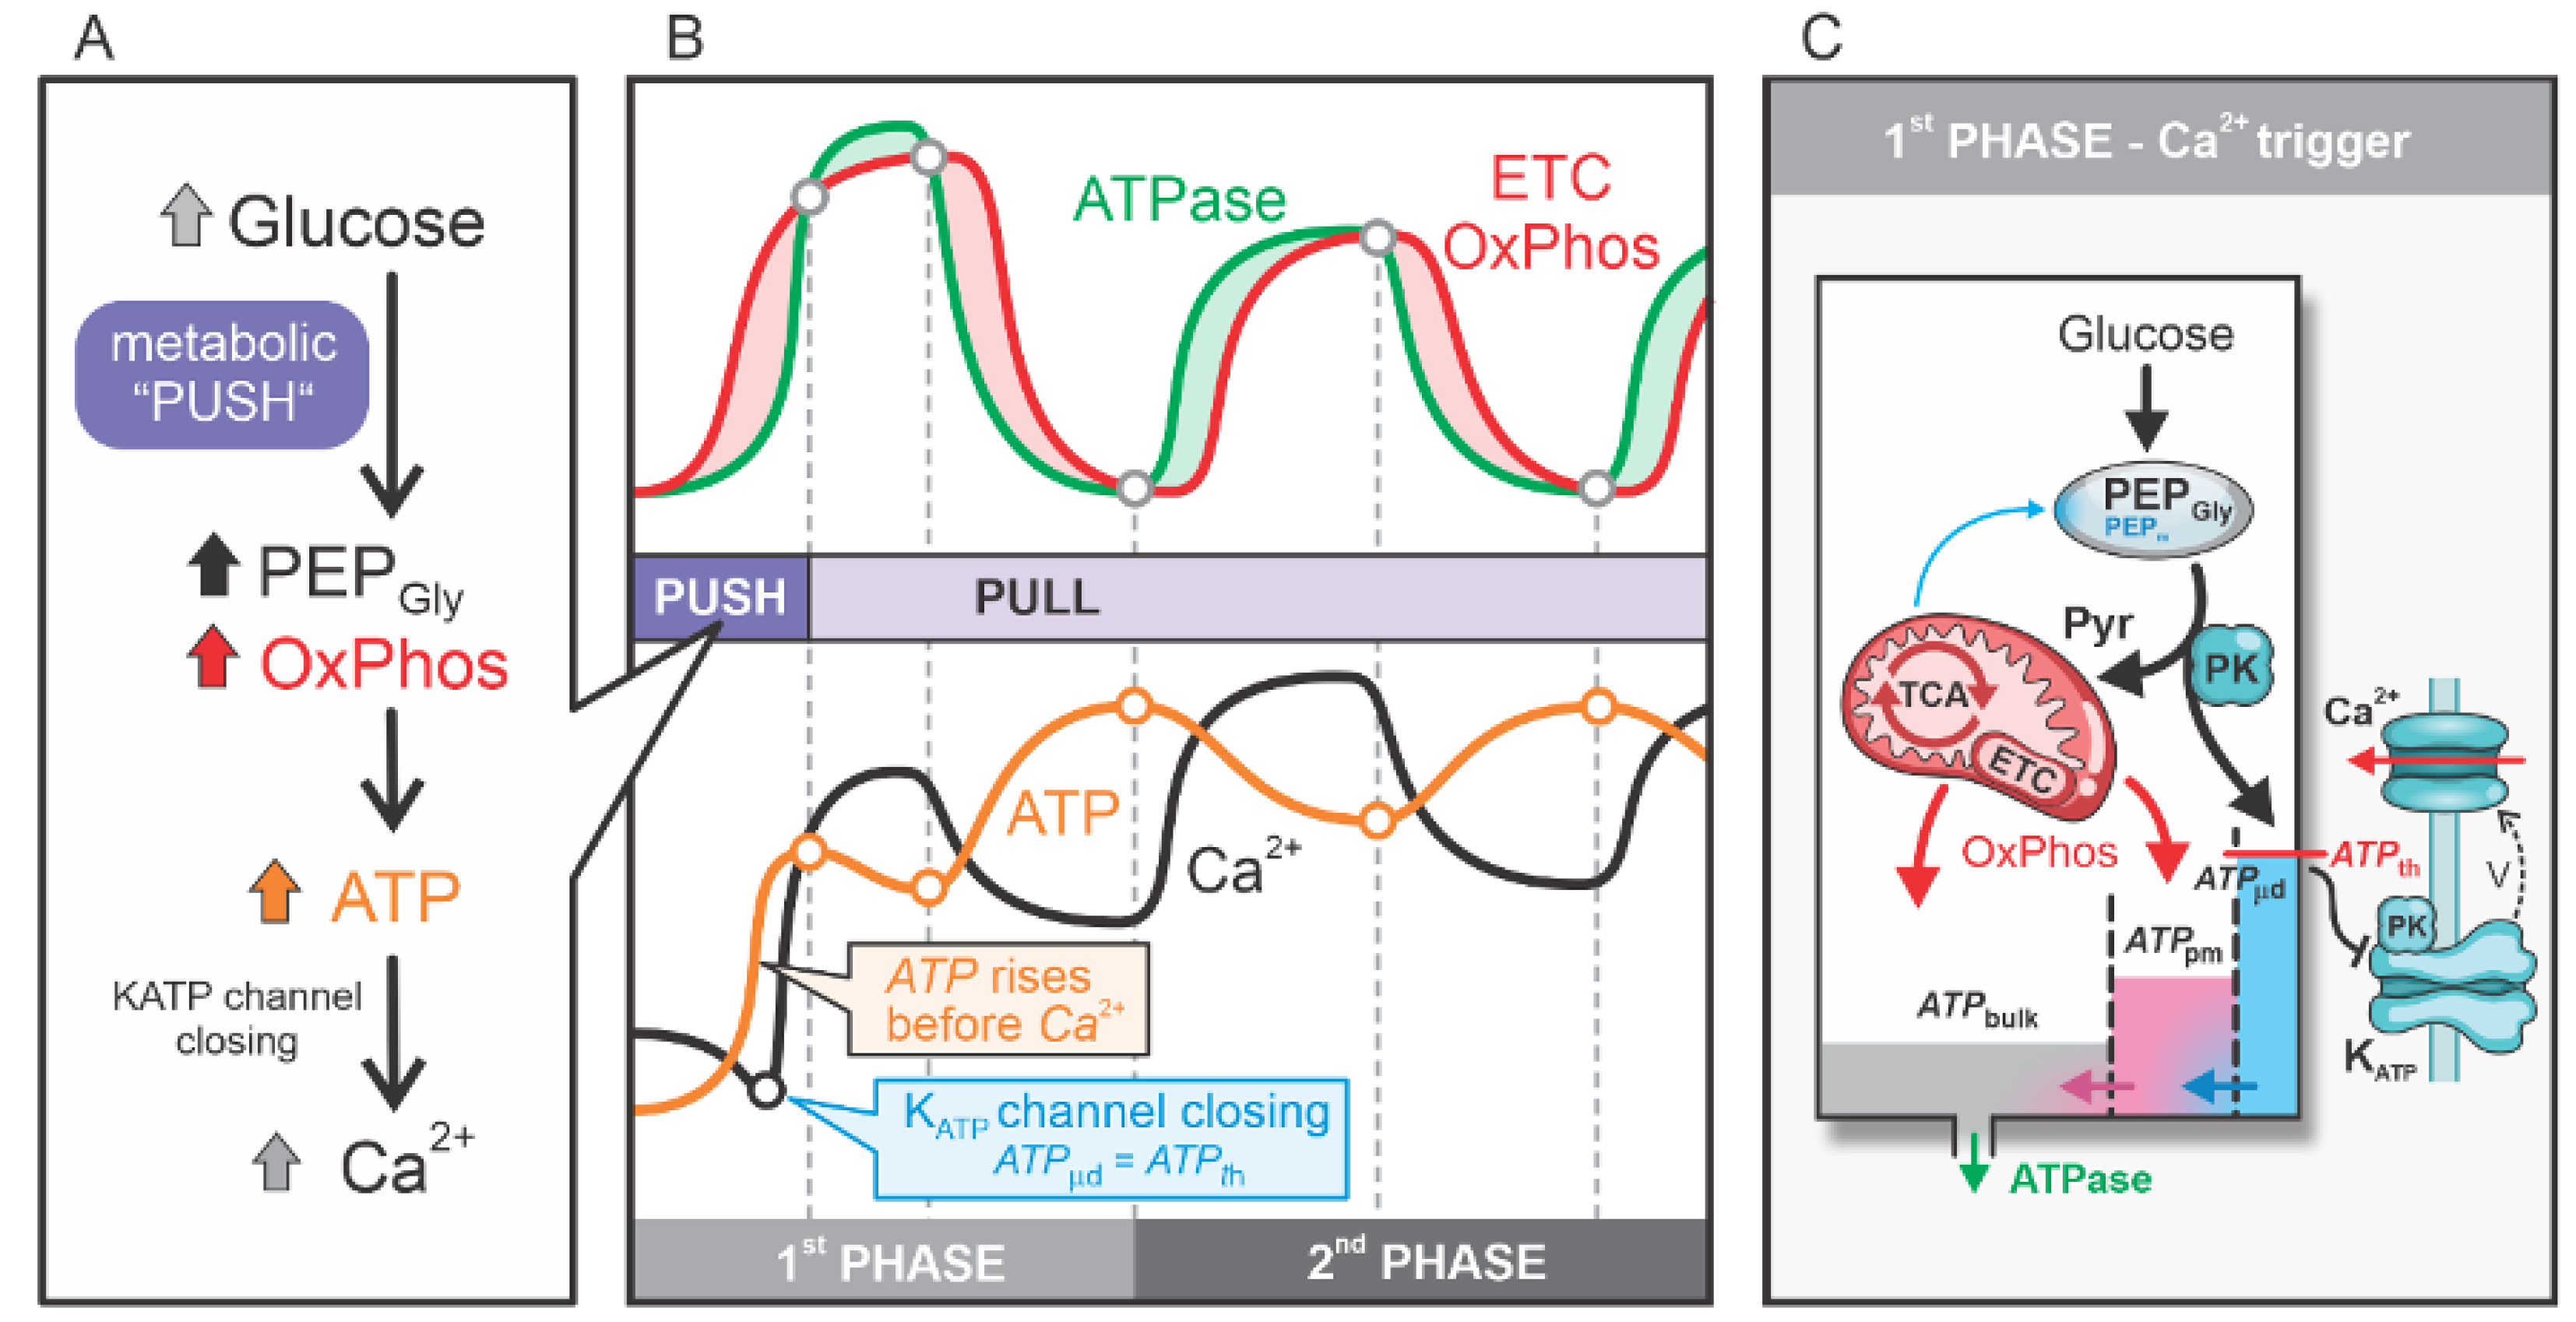
Figure 3.
ATP production in a glucose-stimulated beta cell. (A) The 1st consists of three steps: “(1) Push OxPhos” – “(2) Pull OxPhos” – “(3) Catabolic PEP Cycle”. The 2nd phase is characterized by a cycling process alternating between steps 2 and 3. The OxPhos step is represented by a solid red circle, while the PEP cycle is denoted by a solid blue circle. The maximum OxPhos state is marked with a hollow red circle, and the maximum PEP cycling state is marked with a hollow blue circle. (B) Fluxes contributing to ATP production: (blue), (black), ATPase flux (green), and ETC OxPhos flux (red). Also shown are the concentrations of subplasma cytosolic ATP (), the ATP threshold (), and Ca2+.
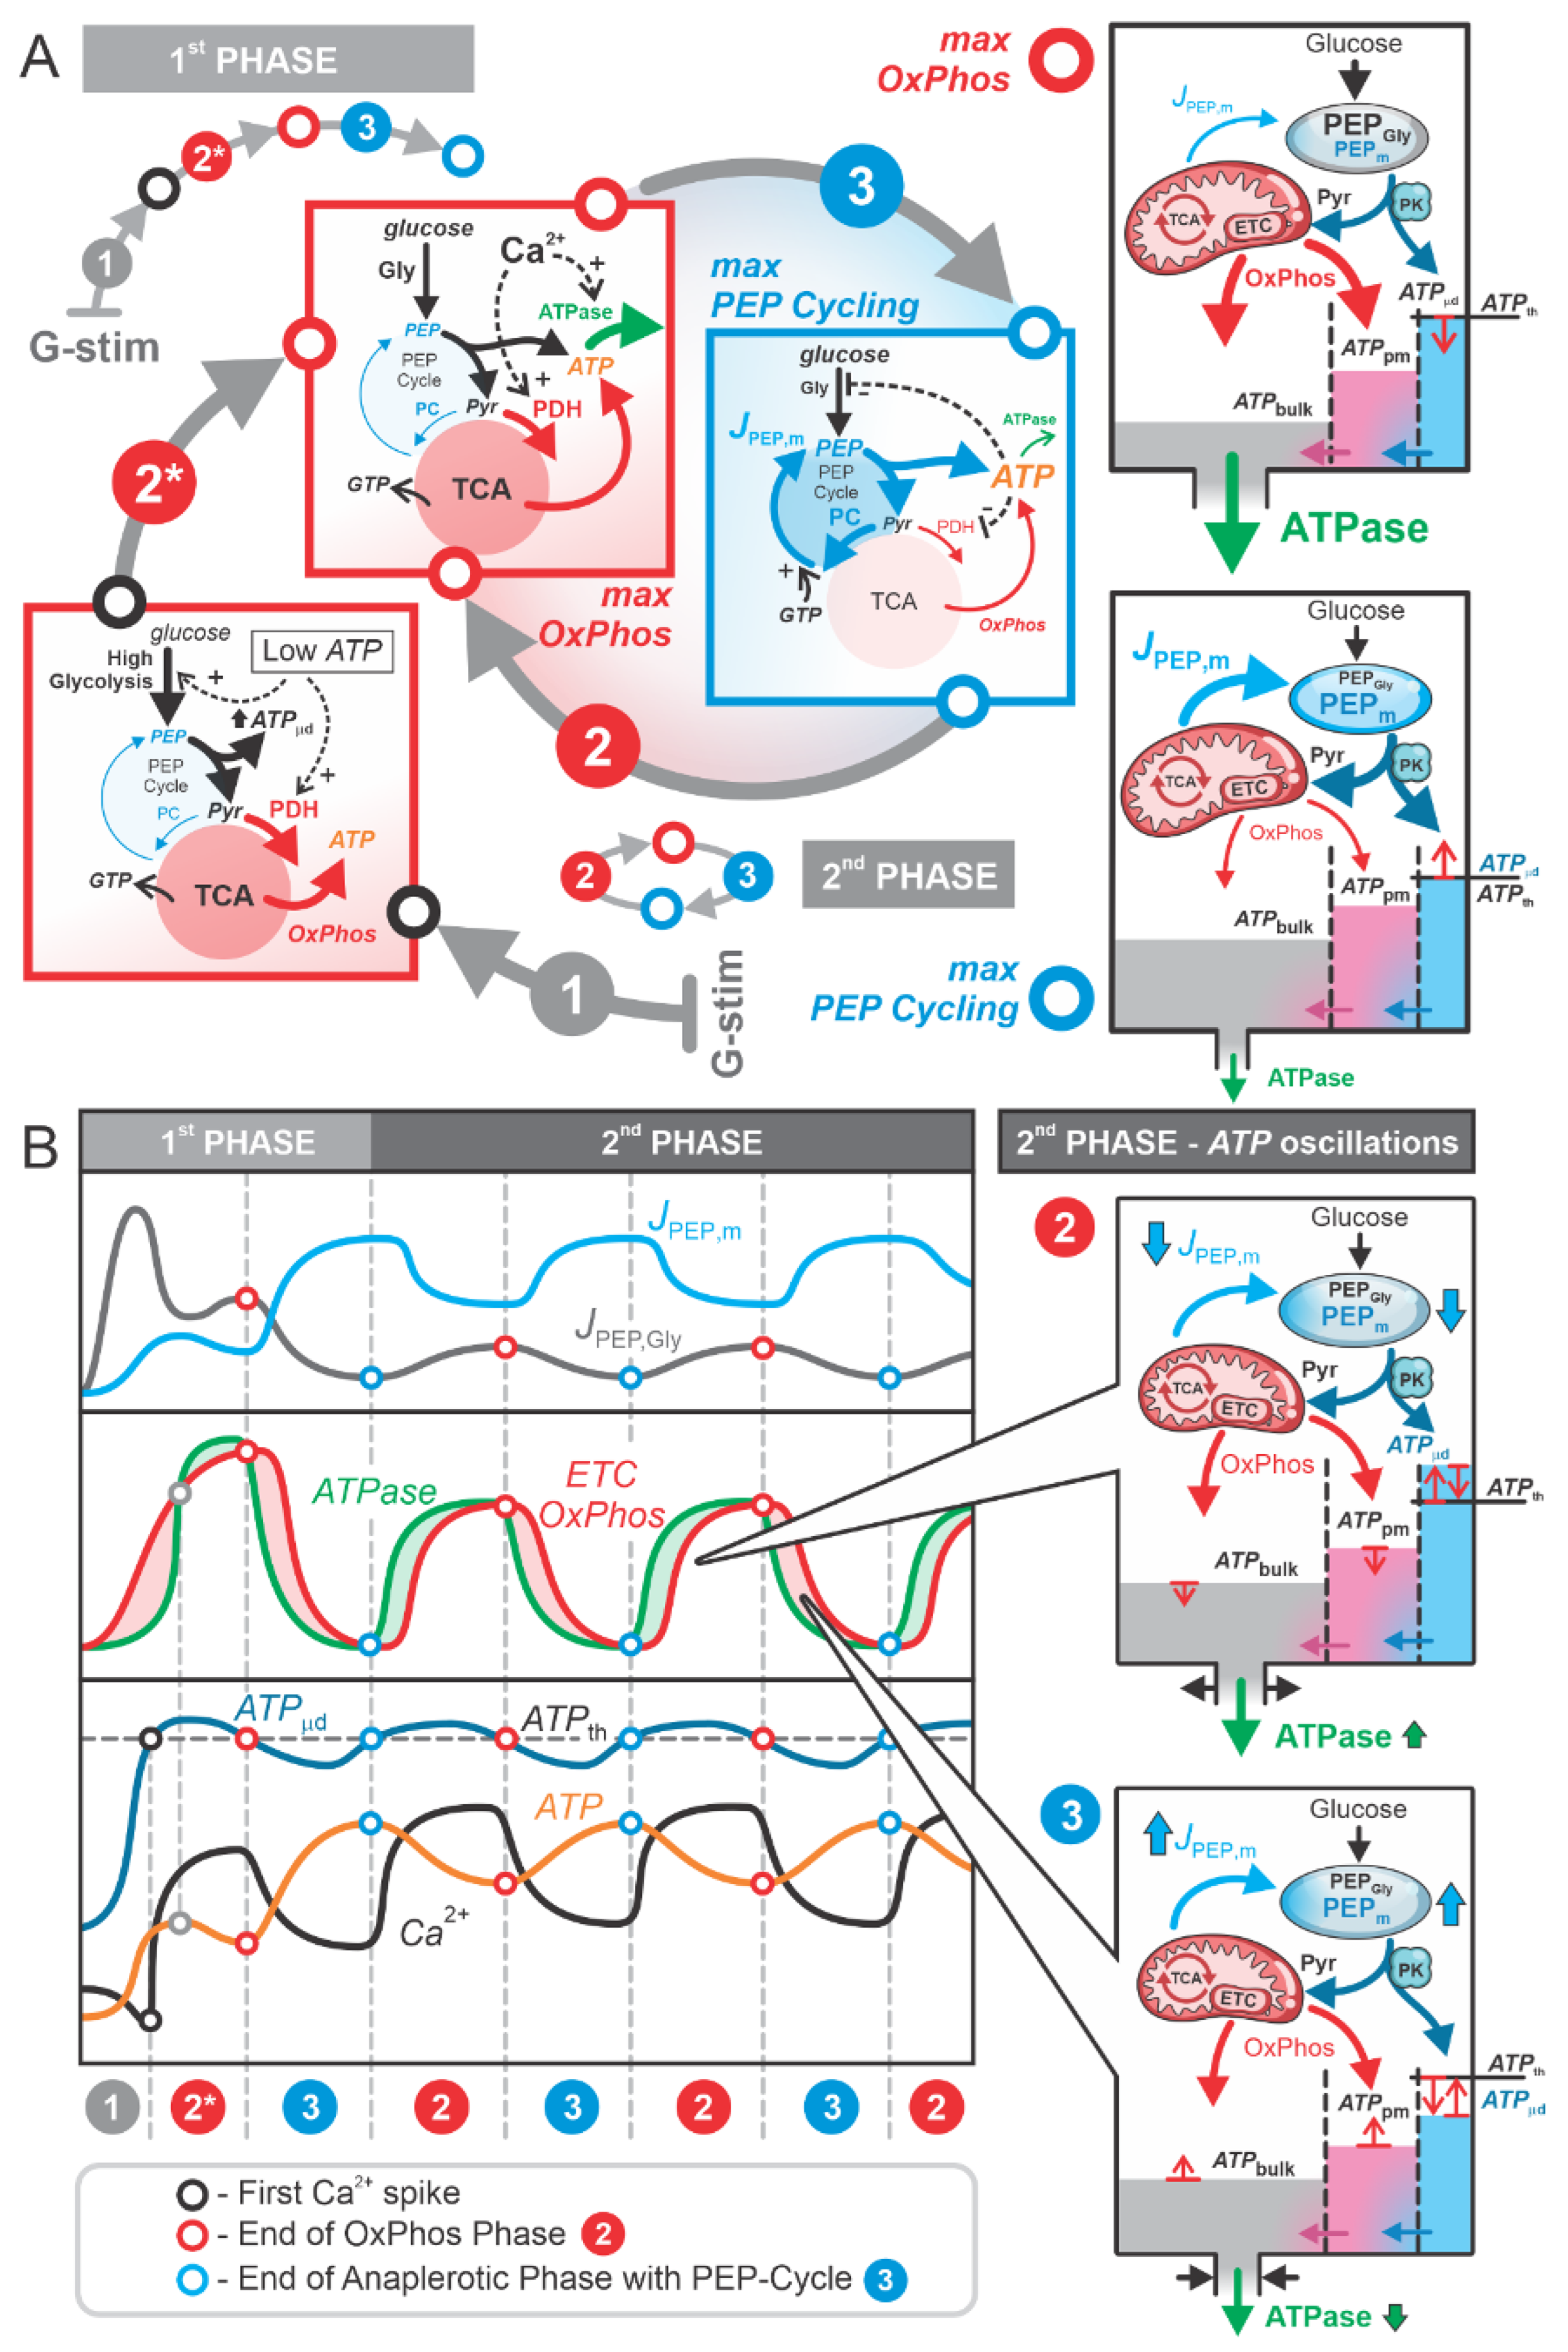
Figure 4.
Estimation of the translocated Ca2+ amount, used as a proxy for energy expenditure, in PCK2-KO and control (WT) mice as studied in the experiments by Foster et al. [11]. A) Fitted Ca2+ oscillation traces for WT and PCK2-BKO mice using the modified Heaviside function H(t). For WT, parameters used were A=0.847, D=0.496, P=2.111, S=3, and for PCK2-KO, parameters used were A=1, D=0.532, P=2.740, S=3, highlighting differences in amplitude, period, and duty cycle. (B) Energy expenditure of calcium pumps during oscillations, calculated as the area under the curve (AUC) for the refilling kinetics . WT mice exhibit lower energy expenditure compared to PCK2-KO mice, with a normalized power ratio of 1:1.18, indicating a ~18% increase in energy demand for PCK2-KO mice.
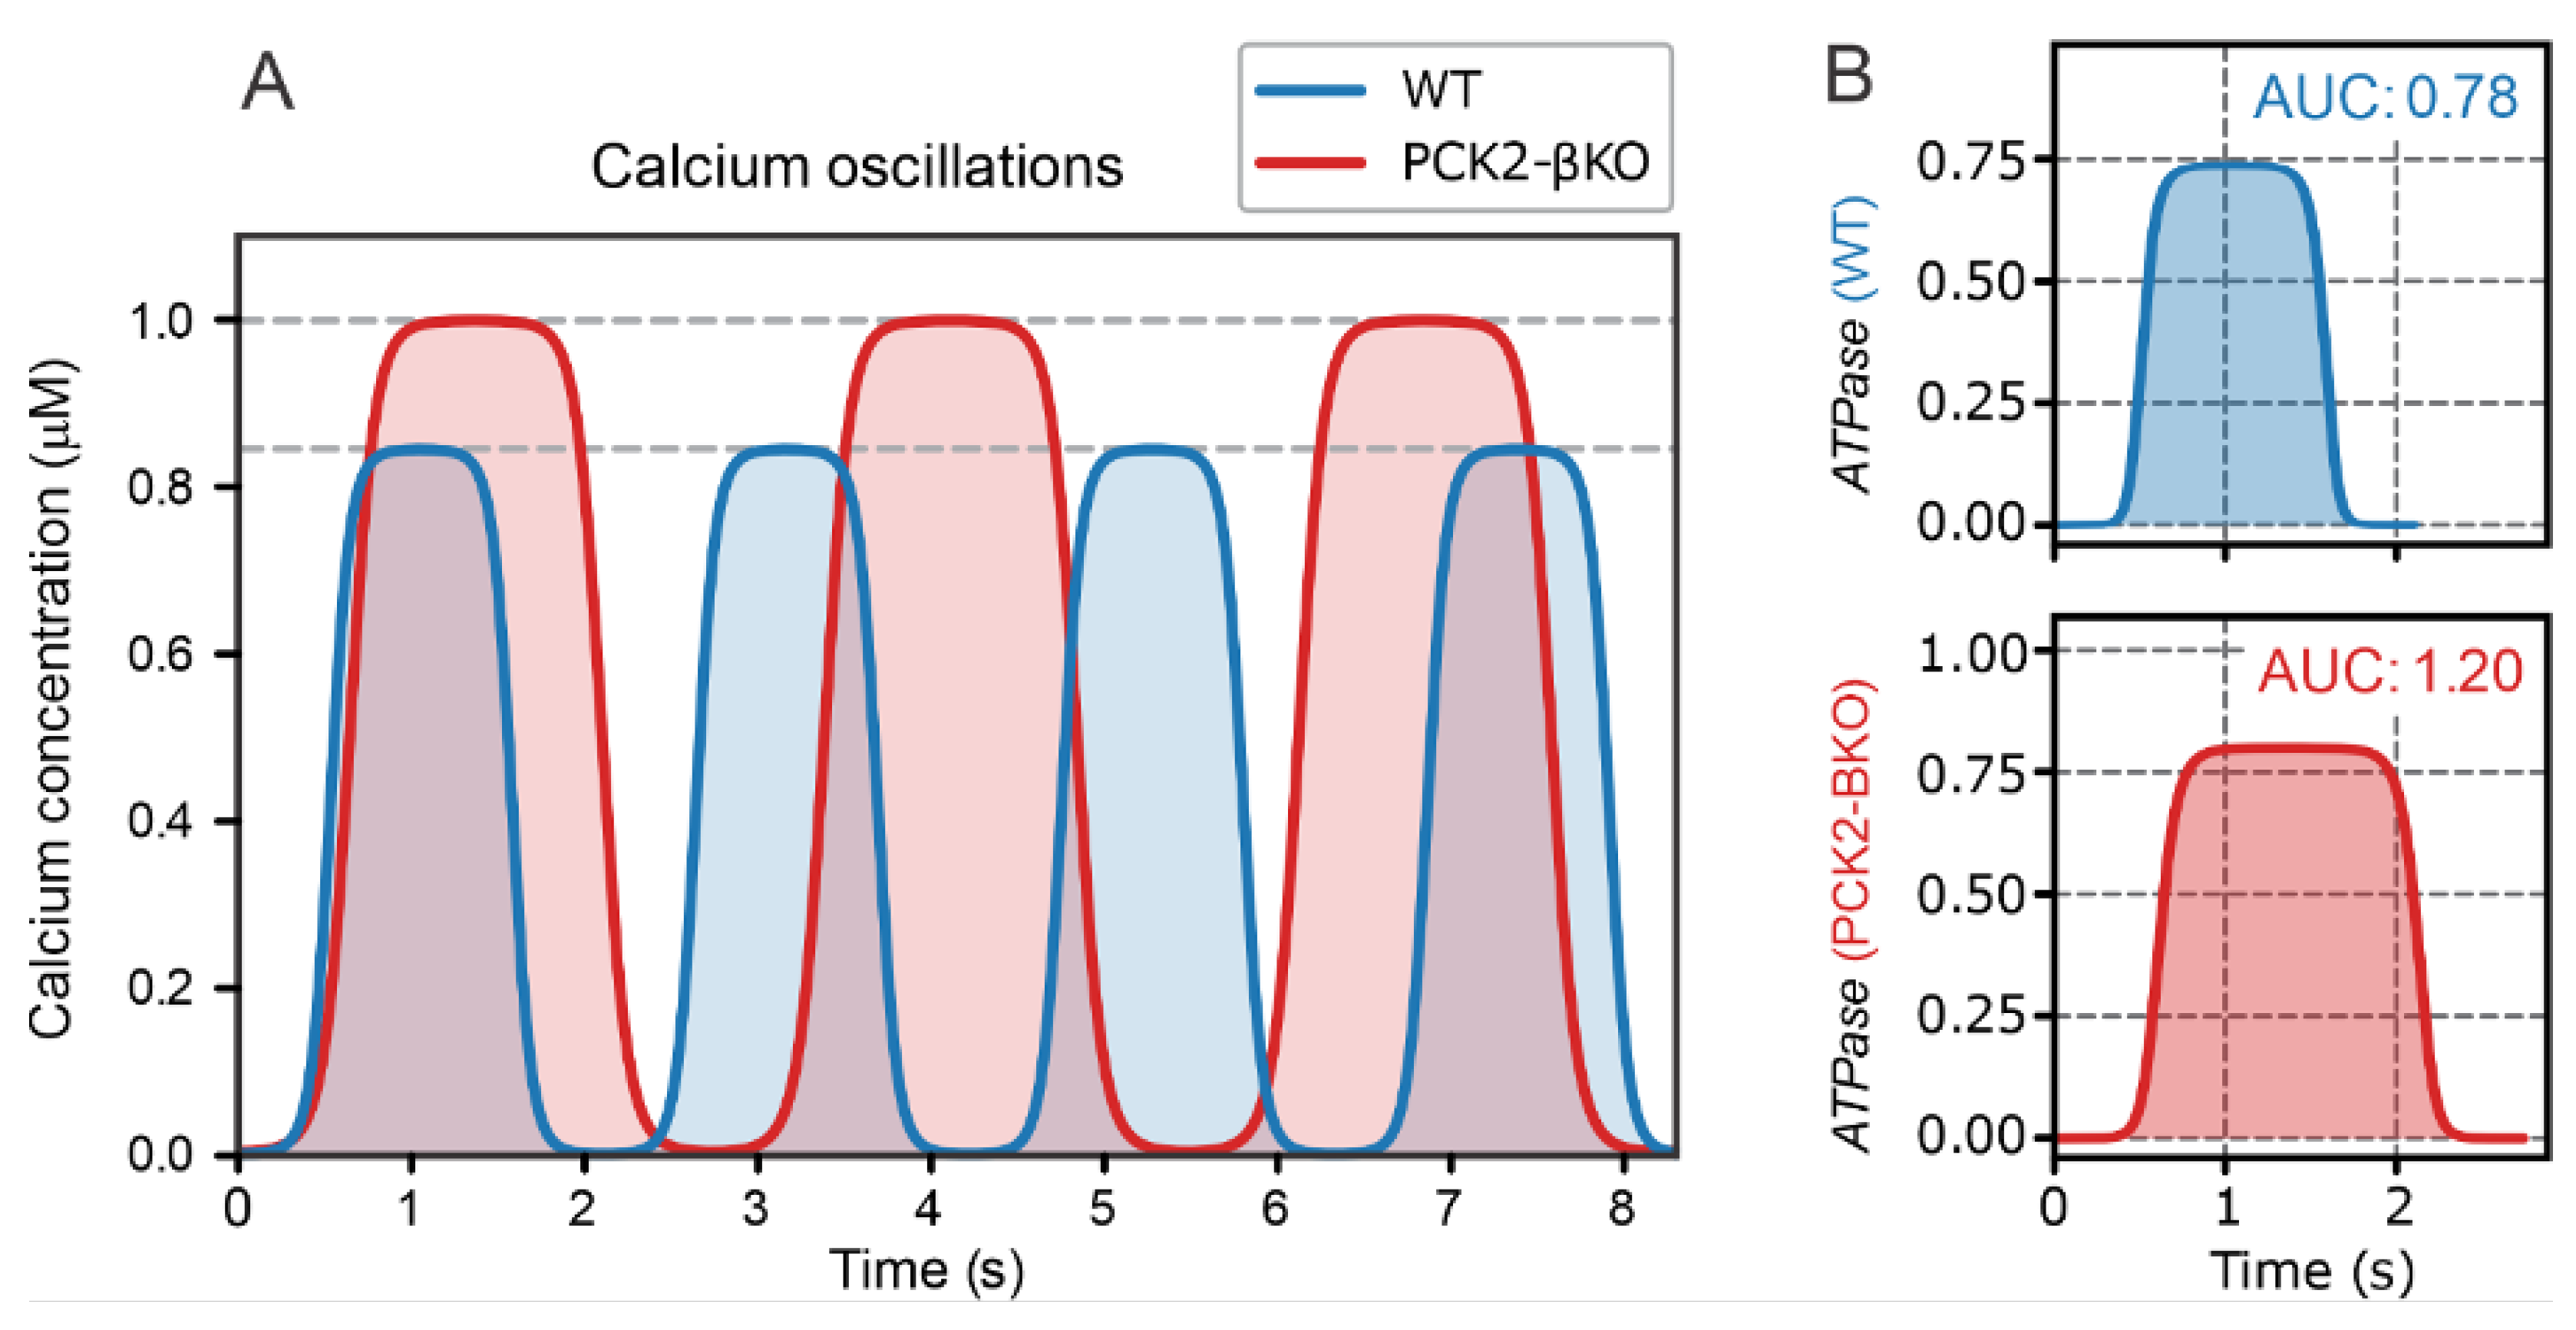
Figure 5.
Graphical representation of the metabolic pathways contributing to NADH (red) and NADPH (blue) production. (A) Flux analysis of the main processes responsible for NADH and NADPH production: , , , and . (B) Illustration of the main fluxes associated with the “clockwise direction” of the TCA cycle during the maximum OxPhos phase and the “anticlockwise direction” of the TCA cycle during the PEP cycle phase.
Disclaimer/Publisher’s Note: The statements, opinions and data contained in all publications are solely those of the individual author(s) and contributor(s) and not of MDPI and/or the editor(s). MDPI and/or the editor(s) disclaim responsibility for any injury to people or property resulting from any ideas, methods, instructions or products referred to in the content. |
© 2025 by the authors. Licensee MDPI, Basel, Switzerland. This article is an open access article distributed under the terms and conditions of the Creative Commons Attribution (CC BY) license (http://creativecommons.org/licenses/by/4.0/).
Copyright: This open access article is published under a Creative Commons CC BY 4.0 license, which permit the free download, distribution, and reuse, provided that the author and preprint are cited in any reuse.


