
Submitted:
08 January 2025
Posted:
09 January 2025
You are already at the latest version
Abstract
Corporate sustainability performance becomes the central element in many current business developments: the total value of ESG investment grows, more and more clients want to invest in projects that deliver more than the pure financial return, companies are innovating and transforming their business models and adopting the B-Corp values. Environmental and wider societal impact becomes the central focus of the businesses that want to become the force for good.
This article adopts an empirical approach and builds an ESG index of corporate performance based on 8 critical metrics representing the economic, social and environmental dimensions under varying policy priorities. Furthermore, it investigates correlations between these aggregate ESG indices and share prices as well as return on investment or ROE of companies. The article goes on to investigate empirically the correlation between Employees/Turnover, Diversity, CO2 emissions, Waste generation and Water use of companies and share prices and ROE metrics respectively.
The reasons for divergence between correlations of Sustainability Performance Indicators with share prices, ROE and Profits/Turnover are discussed in detail with particular attention drawn to the reasons why diversity might matter more for the share prices than ROE, and why waste generation, water use and CO2 emissions might still be poorly reflected in the ROE, while some of these metrics have a significant connection with the Profit/Turnover ratio. The article will undoubtedly be of interest to ESG fund managers, investors, corporate sustainability officers and policy makers.
Keywords:
ESG
; performance
; indicator
; corporate
; ROE
; share price
; business
; impact
1. Introduction
Nowadays, Environmental, Social, and Governance (ESG) factors have emerged as critical considerations in the realms of business and finance. This heightened focus reflects a broader shift towards sustainability and responsible investing, driven by increasing awareness of global challenges and the need for corporate accountability. Numerous studies have examined various dimensions of ESG investing, including its impact on financial performance, reporting practices, and the strategic integration of ESG principles. These studies indicate that, on average, ESG investments perform comparably to or even better than traditional investments. However, inconsistencies in the findings across different studies underscore the necessity for further research. To delve deeper, this study will aim to understand the relationship between the ESG and financial performance through the analysis of a set of statistical regressions built upon a sample of thirty companies representing a diversity of sectors: food, banking, aviation, tech, automotive, e-commerce, fashion, beauty. The findings will be then compared with the already existing studies which are collected in the literature review, examining the most important dimensions in ESG discourse and practices.
Raising awareness and increasing improvements in innovation and technologies regarding sustainable practices have shed a light on many issues that weren’t considered before. More and more investors and shareholders are giving more importance to sustainable issues and companies are starting to feel the pressure for adopting processes and practices that could help in achieving sustainable goals. The dynamics behind the relationship between ESG engagement and financial performance is still not certain, some research confirms the positive relationship while some doesn’t support this hypothesis. The problem is always that it’s difficult to compare companies and their results when there is a lack of standardization in sustainability reporting. There are many issues regarding this topic.
Amazon, one of the largest e-commerce companies, generates significant amounts of packaging waste due to its high volume of deliveries. However, calculating and accurately reporting this waste is challenging for several reasons: Amazon's extensive and complex supply chain makes it difficult to track the exact amount of packaging used and wasted. Packages come from various suppliers with different packaging standards. Packaging waste also depends on consumer behavior. For instance, customers returning products or receiving damaged goods can increase the amount of waste generated. The variability in packaging materials (e.g., cardboard, plastic, biodegradable options) complicates the calculation of the overall environmental impact. There have been concerns that Amazon's sustainability reports might not fully account for all packaging waste, particularly in cases where third-party sellers use their own packaging materials. This can lead to underreporting and an inaccurate portrayal of the company's environmental impact.
Apple, known for its electronic devices, reports Scope 3 emissions, which include all indirect emissions that occur in the value chain, such as product use and disposal. Accurately calculating these emissions is complex due to the fact that emissions depend on how consumers use their devices. Variations in usage patterns, energy sources (renewable vs. non-renewable), and the lifespan of devices all affect the total emissions. Apple's devices are used worldwide, where energy consumption patterns and sources vary significantly, making it difficult to estimate a standard emissions figure. The disposal and recycling of devices at the end of their life cycle contribute to Scope 3 emissions. Inaccuracies in estimating how many devices are recycled versus discarded in landfills can skew the reported emissions. Apple might report a lower Scope 3 emission figure if they assume an average device usage pattern that does not accurately reflect the higher energy consumption of intensive users. Additionally, if Apple assumes a higher recycling rate than what actually occurs, their Scope 3 emissions could be underreported.
Car manufacturers often report vastly different Scope 3 emissions, which include emissions from the entire lifecycle of the vehicle (production, use, and disposal). Discrepancies arise due to differences in manufacturing processes and materials used can lead to varying emissions. Some manufacturers might source more components from regions with cleaner energy. The assumed average distance driven, fuel efficiency, and types of fuel (e.g., gasoline, diesel, electric) significantly impact Scope 3 emissions. Different manufacturers may use different assumptions for these factors. The handling of vehicles at the end of their life cycle, such as recycling rates and methods, varies between manufacturers and regions. Indeed, Volkswagen has faced scrutiny for discrepancies in their reported emissions, particularly following the emissions scandal where they were found to have manipulated emissions tests. This raises questions about the accuracy of their Scope 3 emissions reporting. Another example could be a car manufacturer underestimating the average distance their vehicles are driven annually, leading to a lower reported figure for emissions during the use phase.
These are only some examples that highlight the difficulties faced by the companies in reporting fair and transparent data, but there are many more issues that must be faced and this paper will try to cover the majority of them, analyzing the actual global situation.
Several international and global actions and regulatory initiatives have been put in place, including EU Sustainable Finance Disclosure Regulation, Global Reporting Initiative, Sustainability Accounting Standards Board and Taskforce on Nature-related Financial Disclosures, however these approaches have not reached a level of universally accepted standard. That is why, the aim of this paper is to understand if the hypotheses of the positive correlation between ESG and financial performances hold or not:
H0.
Positive ESG performance has a positive impact on financial performance and therefore a positive influence on companies share prices;
H1.
ESG impact varies depending on the financial indicator that is considered. For example, the social dimension has a larger impact on share prices than on ROE;
H2.
Various ESG indicators are reflected in the financial performance of companies and their share prices in the different ways.
To investigate these hypotheses, the paper will be organized as follows: after a brief literature review, which presents existing academic literature on the topic, we will present the visualizations and statistical analysis conducted in the core of this research project. The presentation will be divided into three sections: methodology in which the modus operandi adopted is presented, the analysis where the graphics and the relationships between the indicators are described in detail, followed by conclusions discussing the findings giving an overview of the insights gained in this project.
2. Literature Review
In recent years, ESG has gained momentum as a critical factor in business and finance. Several studies have explored the various aspects of ESG investing, reporting and its impact on financial performance. These studies have shed light on the different approaches to ESG investing and their relative returns compared to traditional market benchmarks. The aggregate findings suggest that ESG investing has, on average, performed similarly to conventional investing and sometimes even better. However, it is important to note that the research in the wider management literature and industry reports often contradict these findings, highlighting the need for further investigation. Additionally, according to some studies ESG investing has been found to provide asymmetric benefits, particularly during social or economic crises, while in other studies it has been found that the companies with high engagement with ESG managed to perform better in periods of crisis thanks to high levels of resilience and a lower volatility in the market (Broadstock et al., 2020). Overall, there is a growing popularity of sustainability and ESG in both research and practice. ESG integration as a strategy seems to be more effective than screening or divestment. It is highly apparent, that more research and clarity in the field of ESG is needed, as there are conflicting findings between different studies and sources.
This review covers academic articles and publications on ESG studies published in the last fifteen years. Although ESG is a multidisciplinary field and researchers have studied ESG issues in various domains, such as corporate governance, corporate social responsibility, and sustainable finance, this review primarily focuses on finance and investment related studies.
As previously mentioned, ESG is a strategic priority for many companies and interested stakeholders nowadays; indeed, it has been found that many studies were focused on analysing the internal and external drivers of ESG engagement. According to Crace and Gehman (2023), the most impactful drivers are linked to the firm and the CEO, being, therefore, internal drivers. More specifically, the authors stated that negative ESG performance is usually correlated with external factors, whereas positive ESG performance is driven by internal ones. These findings went to support previous analysis on internal drivers that were made by Eccles et al. (2011) who had stated the significant influence of the board of directors and firm’s governance. This factor is essential due to the fact that the board of directors plays a crucial role in monitoring and advising management to ensure decisions align with organizational objectives. In sustainable corporations, boards are more keen on overseeing environmental and social issues, while management compensation may include sustainability metrics alongside financial ones. It is, therefore, important to understand, which factors might have an impact on ESG performance, in order to narrow the focus of the enterprises on the key issues, which are defined as material issues. Eccles and Serafim (2013) have provided a step-by-step approach that helps in defining materiality. To do this, businesses need to take four actions: determine which ESG concerns are most important for their specific industry; calculate how much money would be saved if those problems were resolved; attain the improvements, implement significant innovation in products, procedures, and business models and finally share the innovations with stakeholders. Integrated reporting, which compiles financial and ESG performance data into a single document, is a useful tool for this. Freiberg et al. (2020) examined how ESG issues become material for financial performance studying the business case of Purdue Pharma. The authors have divided the transition from immateriality to materiality into five stages that follow a journey that starts with the identification of a particular externality (related to an ESG issue) and reaches the disclosure of a specific regulation that tries to manage that specific ESG issue.
Porter et al. (2019) have pointed out that investors must consider social factors alongside financial metrics, recognizing their influence on long-term competitive advantage (shared-value investing). The article criticizes the efficiency of traditional ESG rankings. The importance of effective communication between companies and investors regarding the economic value of social impact has increased noticeably. Examples of success of this type of investments are Generation Investment Management and Summa Equity. Several authors support the view that investors should allocate capital towards companies driving social progress profitability, where capitalism is harnessed to address society’s most pressing needs while generating sustainable shareholder returns. By embracing shared-value thinking, investors can unlock growth, foster innovation, and contribute to a more equitable and prosperous future for all stakeholders. ESG scores have gained prominence as primary financial tools for constructing green portfolios and evaluating companies’ performances in the field of responsible investment as well as for enhancing transparency, trust and credibility among stakeholders (Suhita et al., 2020) (Linnenluencke, 2021) (Clement et al., 2023). According to Bloomberg Intelligence, the projected ESG assets under management amounting to $53 trillion by 2025 would represent approximately 36.9% of the total global assets under management, assuming a steady growth rate of 6.5%.
§ESG scores mitigate risks associated with environmental or social scandals by anticipating potential negative impact on investments. Companies that prioritize ESG considerations stand to gain not only enhanced market value but also improved financial performance and reduced risk exposure, indeed, they are integral components of corporate strategy and value creation (Suhita et al., 2020) (Wang et al., 2022) (Clement et al., 2023). Friedea et al. (2015) have also discussed the evolving landscape of Environmental, Social and Governance criteria within investment decisions and highlight the slow adoption of sustainable investment practices among mainstream investors despite the significant assets managed under Principles for Responsible Investment signatories; and Liennenluecke (2021) argues that even if there is a shift towards sustainable investments, there are many challenges in the market due to weaker institutions, less stringent regulatory environments and limited transparency.
Although there has been a higher interest in nonfinancial information, it has been noticed that the correlation between financial performance and environmental, governance and social performance varies. Indeed, Huang (2019) argues that environmental ESGP measures tend to exhibit a stronger relationship with operational CFP measures compared to social or governance ESGP measures. Eccles et al. (2011) instead have stated that environmental and governance metrics are the ones in which investors are more interested in. Equity investors show more interest in ESG disclosure and GHG emissions data compared to fixed income investors. This study highlights also disparities between broker-dealers and money managers with the same distinction of the previous ones. Serafim and Yoon (2022) studied market reactions to diverse ESG news items and assessed the predictive power of ESG performance scores. Key findings reveal substantial market reactions to financially material ESG news, particularly positive news related to social capital issues like product impact. The study challenges traditional assumptions about investor responses to ESG news and underscores the evolving role of ESG considerations in investment strategies. Positive ESG news, especially regarding product quality and safety, drives significant market reactions, while negative news, particularly concerning customer welfare and GHG emissions, impacts market performance. The study highlights the importance of unexpected news in influencing market dynamics and emphasizes the selective nature of market reactions to ESG news.
Menicucci and Paolucci (2022) have pointed out the effects of ESG in the banking sector. They assessed the feasibility of enhanced corporate governance, reduced environmental impact, and social responsibility programs. Environmental commitments positively impact efficiency and trust, while social initiatives may challenge profitability. Corporate governance, especially board diversity and risk governance, correlates positively with performance. Empirical findings suggest varying impacts of ESG dimensions on bank performance, highlighting the complex relationship between ESG factors and profitability.
One of the consequences of the increase in engagement with ESG activities has been the development of ESG reporting and integration. Organizations like Global Reporting Initiatives (GRI), Sustainability Accounting Standard Board (SASB), International Integrated Reporting Committee (IIRC) and Carbon Disclosure Project (CDP) are playing a crucial role in promoting disclosure and accountability (Kotsantonis et al., 2016) (Eccles et al., 2011). Efforts by organizations like the Global Sustainable Investment Alliance and sustainable stock exchanges aim to improve ESG data availability and quality. There is still skepticism about its accuracy, specifically in relation to data imputation methods that should be transparent as to ensure consistency and reliability of data (Kotsantonis et al., 2019). Linked to this trend, there has been an increase in the number of sustainability reports published to enhance transparency. There is still a need for improvement in ESG reporting: Arvidsson et al. (2021) underscore the importance of aligning ESG reporting with global standards and addressing sustainability challenges through proactive policies and enhanced reporting practices.
Eccles et al. (2014) have deeply studied the difference in performance between 90 high sustainability firms of the mis-1990s with similar low sustainability firms. The main conclusions of their research are that high sustainability firms exhibit a stronger governance structure, link executive compensation to sustainability metrics, engage stakeholders more proactively and disclose more nonfinancial data. This suggests that integrating social and environmental issues into business strategies may yield long-term financial benefits and improve stakeholder relationships. Regarding corporate performance, high sustainability firms tend to outperform low sustainability firms over the long term. Overall, the results show that high sustainability firms exhibit superior performance, with ESG activities as a source of competitive advantage which helps companies in SRI in the long term. (Eccles et al., 2011). However, Eccles et al. argue that high sustainability firms may underperform due to constraints imposed by their sustainability culture, or they may outperform due to better human capital, supply chains, community relations and innovation. Research has found that high sustainability firms significantly outperform low sustainability firms, with annual abnormal performance higher by 4.8% on a value-weighted basis and 2.3% on an equal-weighted basis, at the same time exhibiting a lower volatility in their performance.
Serafim, Yoon (2011) studied the effects of sustainability disclosure regulations on corporate practices and valuations and highlighted that, while the disclosure of ESG information could enhance firm value through improved management practices and stakeholder perceptions, it also imposes potential costs and risks on firms. Researchers have identified positive aspects: improvement in management practices, operational efficiency, enhanced stakeholder trust, attraction of socially responsible investors and improved access to capital; and negative effects: compliance costs that could strain financial resources, mandatory disclosure may reveal proprietary or competitively sensitive information, potentially causing strategic risks or disadvantages negatively affecting firm value. In another study, Serafim and Yoon (2022) investigated whether consensus ESG ratings predict future ESG-related news and how disagreement among raters affect this predictive ability. Despite challenges in assessing ESG rating quality due to disagreement among raters and the multidimensional nature of ESG issues, consensus ratings can forecast future news. Positive ESG news prompts a market response, although firms with high ESG ratings show smaller reactions, suggesting such news is already priced in. Firms with low rating disagreement experience stronger stock price reactions, indicating higher expectations for future news. ESG ratings from different providers vary in predictive ability, with the most predictive rating influencing future stock returns, particularly in cases of high disagreement. Overall, ESG ratings serve as proxies for market expectations and can forecast future news and stock returns, despite rating disagreement. While acknowledging that predictive ability is just one aspect of rating quality, the findings highlight the importance of ratings in reflecting organizational commitments to ESG outcomes. Furthermore, Broadsrock et al. (2020) found that firms with higher ESG ratings experience smaller stock price declines and lower volatility during period of crisis, with a specific study about stock prices during the pandemic period (COVID-19).
In contrast with the previous findings, Halbritter and Dorfleitner (2015) stated that ESG portfolios do not exhibit significant return differences between companies with high and low ESG ratings; the study finds that the influence of ESG variables on returns is inconsistent across different ESG rating providers, indicating that the relationship is highly dependent on the specific rating methodology. Over time, there appears to be a diminishing impact of ESG variables on returns therefore suggesting a potential weakening of the relationship between CSP and CFP.
The study of Sadiqa et al. (2022) explores global challenges arising from industrial expansion and the limited engagement in environmental and social initiatives despite increasing awareness. It discusses the 2030 Agenda for Sustainable Development, comprising 17 SDGs targeting environmental, social, and economic sustainability. ESG criteria are pivotal in evaluating firms commitment to these goals, emphasizing environmental protection, social welfare, and corporate governance. In ASEAN countries, progress varies across social, environmental, and economic indicators. While strides have been made in poverty reduction and gender equality, environmental challenges persist. The article stresses the need for enhanced environmental, social, and corporate governance to accelerate SDG attainment (Sadiqa et al., 2022).
The Brazilian case studied by Miralles-Quirós et al. (2018) states that investors positively value CSR practices in Brazialian listed firms according to the value enhancing theory. However, while the market significantly values environmental practices, it does not equally value all three pillars of ESG. Specifically, social and corporate practices in environmentally sensitive industries generate significant added value in stock prices.
The analysis conducted by Strekalina et al. (2023) delves into the intricate dynamics between ESG performance and financial outcomes, reflecting the evolving landscape where businesses increasingly integrate sustainability into their operations pointing out that there is not a universally accepted positive/negative impact of ESGP on FP. Furthermore, the paper points out geographical variations in the ESG-FP relationships, noting difference between developed and emerging economies. While advanced economies may have stronger regulatory frameworks and shareholder activism, emerging markets face unique challenges related to institutional capacity and information dissemination; so it is important to study geographical influences on the ESG financial performance relationships, particularly within emerging markets like the BRICS countries, where each country adapts the sustainable development agenda differently.
3. Methodology
This paper aims to investigate corporate sustainability through the lens of Environmental, Social, and Governance (ESG) indicators among 30 companies across diverse 8 industries: banking, aviation, automotive, food, fashion, beauty, e-commerce, technology, that include both manufacturing industries and service providers. While the sample is not representative of the whole world, it includes some of the largest companies currently operating globally. The total market capitalization of our sample is approximately 10.02 trln, which constitutes a significant 9.2% of the 109 trln $ global market capitalization. The study focuses on eight key indicators, encompassing economic, social, and environmental dimensions and refer to FY2022. By analyzing the connections between ESG and financial indicators, the study seeks to provide insights into the sustainability performance and practices of the selected companies as well as the way in which the market reflects on ESG performance.
The study adopts a quantitative approach, gathering data on the selected companies' performance across the identified ESG indicators. Data will be collected from publicly available sources, such as annual reports, sustainability reports, and corporate websites. Each indicator will be meticulously analyzed to provide a comprehensive understanding of the companies' sustainability efforts and outcomes. ESG Indicators are presented in Table 1 and normalized as well as raw data used in the analysis can be found in Appendix A and Appendix B respectively.
In order to comprehend the impact of environmental and social indicators on economic performance of enterprises, several regression analyses have been conducted through the use of Tableau software, capable of elegantly managing complex datasets, quickly visualizing data using multiple variables and providing regression output, which was applied to the relevant statistic data collected in Excel (Appendix D). This analysis generated interesting insights regarding the ESG performance of some of the world’s largest companies. To be able to compare companies of different sizes among each other, relevant indicators have been divided by turnover, making it easier to derive conclusions, even if from the sample collected it could appear difficult due to a high degree of variety in company size and sectoral identification.
In order to better understand the influence that each dimension (environmental, social or economic) has on the companies’ financial performance, ESG integrated performance indexes were calculated based on normalized indicators, obtained projecting the best performance among companies onto 1 and the worst onto 0 in the [0:1] interval (Appendix A). In particular, four ESG indexes have been built with varying policy priorities based on the well-cited body of our previous research (Shmelev, 2019; Shmelev and Shmeleva, 2018; Shmelev and Shmeleva, 2019; Shmelev et al, 2023). The essence of this approach is in giving the priority dimension a weight twice as high as the weight of the non-priority dimensions, while the last index was built using equal weights for each dimension. Linear aggregation with weights is one of the simplest Multi-Criteria Decision Aid (MCDA) techniques. The approach using varying policy priorities is justified in that it allows alternative readings of the assessment from various perspectives (economic, environmental, social) without resording to modelling randomized weights or using more complex outranking MCDA tools. It has to be emphasized that all ESG indicators are present in each case, just their weights differ. This approach seems to be superior to those where a fixed weights are used without proper justification. Varying policy priorities allow immediate indication as to which dimensions are playing a stronger role in relation to financial performance indicators. The aforementioned indexes have been compared through a regression analysis with the companies’ average share prices for FY2022 which were collected on Yahoo.finance website; this comparison was useful to understand if there is truly a positive correlation between ESG investment and financial performance which will help us in testing our hypotheses.
4. Analysis
To better understand the relationship between ESG indicators and financial performance of the company, this section will go through the analysis of each regression study performed, through the description of the graphs and results obtained. Specifically, the first part will discuss the relationship between ESG indexes computed using a linear aggregation approach with varying policy priorities compared with average share prices and ROE (return on equity), for then arguing the impact of social as well as environmental indicators on ROE and share prices. All these relationships will take into consideration the graphs showed in the Appendix A- Graphs.
4.1. ESG Indexes and Average Share Price (FY2022)
The Figure 1, Figure 2 and Figure 3 display the relationship between Share Prices and different aggregate ESG indexes: Economic, Environmental, and Social. Each index shows the performance of each individual company and places a different weight on ESG indicators, affecting the correlation observed in each graph.
From the analysis of the three graphs and the Ordinary Least Squares regression statistical output, it's evident that the ESG Index Social has the strongest and statistically significant correlation with share prices. Companies that score higher on social ESG factors tend to have higher share prices, indicating investors may value social responsibility highly.
The ESG Index Social includes social factors such as labour practices, diversity in employment and number of employees.
| P-value: | 0.0323771 |
| Equation: | Share Prices = 619.639*ESG Index Social -115 |
| Coefficients | ||||
| Term | Value | StdErr | t-value | p-value |
| Esg Index Social | 619.639 | 275.194 | 2.25164 | 0.0323771 |
| Intercept | -115 | 113.511 | -1.01311 | 0.319682 |
This index has a statistically significant correlation with share prices (P-value: 0.0323771), suggesting that social indicators have the most substantial impact on share prices among the three ESG indexes.
Companies with strong social responsibility practices often enjoy better reputations, leading to increased consumer trust and loyalty, which can positively affect financial performance and share prices. Good labor practices and a positive work environment can lead to higher employee satisfaction and productivity, which can enhance company performance and, consequently, share prices. Increasingly, investors are prioritizing socially responsible investments, driving up the demand and valuation of companies with strong social ESG scores.
The ESG Social Index affects average share prices the most due to the tangible and intangible benefits that strong social practices bring to a company. These benefits include enhanced brand loyalty, increased employee productivity, positive public perception, investor preference for socially responsible investments, regulatory compliance, and competitive market differentiation. As a result, companies with high social ESG scores are often rewarded with higher share prices, reflecting their perceived long-term stability and lower risk profile.
The ESG Index Economic, despite being crucial for long-term sustainability, shows a not statistically significant correlation with share prices (P-value: 0.146505). Investors might already factor in economic indicators through traditional financial analysis. Therefore, additional ESG-specific economic metrics may not provide new insights that significantly affect share prices.
The ESG Index Environmental focuses on environmental factors like carbon footprint, resource usage, and environmental impact. This index shows a slightly stronger correlation with share prices than the economic index, but it is still not statistically significant (P-value: 0.115288).
A significant need, therefore, exists for educating companies, investors, and shareholders about sustainable practices. Furthermore, improvements in the quality and transparency of data are essential. Reliable data ensures that reported ESG metrics accurately reflect a company's true environmental and social impact. In some countries there is a complete lack of standardization, no carbon tax and no penalties for companies avoiding recycling procedures. Standardization would ensure comparability across companies, sectors, and regions, involving consistent units of measurement and comprehensive reporting of all business processes, including indirect impacts such as Scope 3 emissions. However, it’s important to consider that there is a rising awareness regarding environmental issues, environmental regulations and potential penalties for non-compliance can affect company valuations, making these indicators more relevant to investors. Furthermore, the impact of environmental indicators can be more pronounced in industries with high environmental footprints, like energy and manufacturing, leading to varied correlations across sectors.
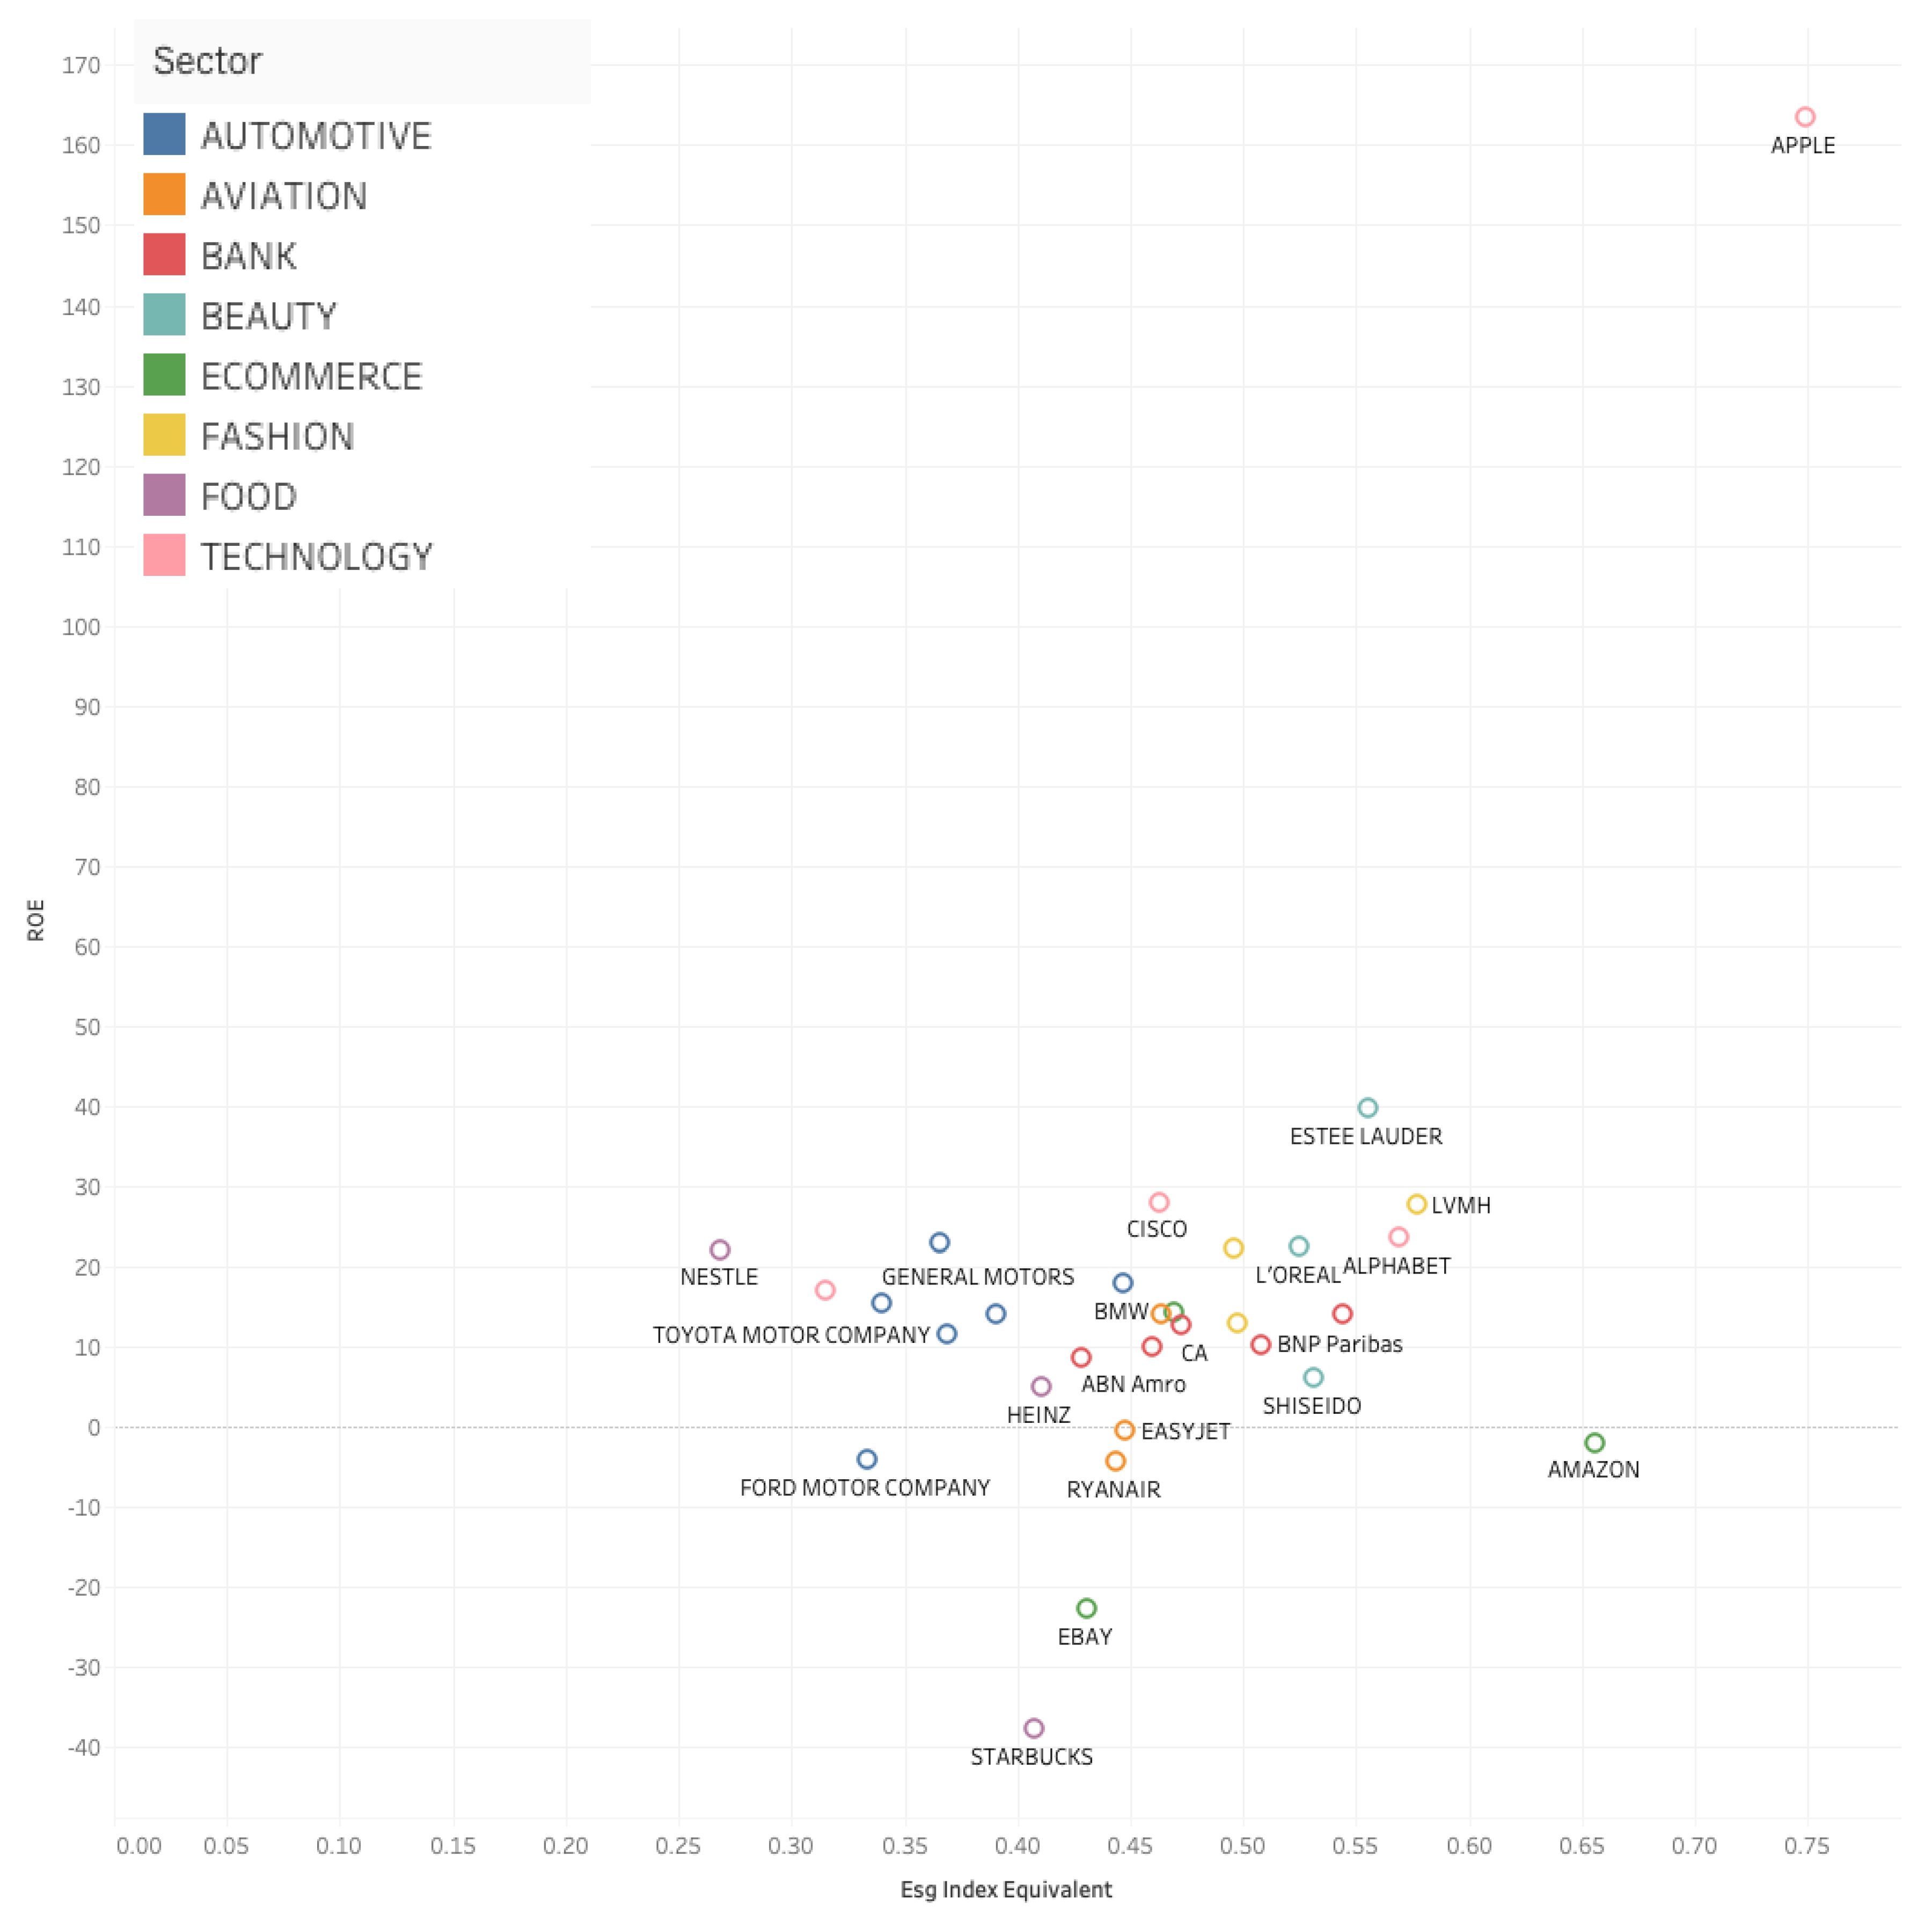
In order to provide also an impartial vision of the impact of ESG on share prices, a further ESG index has been built using equal weights among the dimensions (Figure 4). The P-value of 0.109742 suggests that the correlation between the ESG Index Equivalent and share prices is not statistically significant at the conventional 5% level. However, the t-value of 1.65183 indicates a positive relationship.
We will now examine specific economic sectors represented in our research from the point of view of sensitivity to ESG issues, reflecting on the existing regulations and evaluating the correlation between ESG scores and share prices. The companies’ performance can be seen in Figure 3 with colour coding representing different economic sectors.
Beauty and Fashion (e.g., LVMH, Estee Lauder, L'Oréal):
These companies exhibit high share prices and high ESG scores. The luxury sector is highly sensitive to ESG issues, as consumer perception of sustainability and social responsibility significantly impacts brand value and customer loyalty. Consumer awareness is particularly strong around sustainable sourcing (non-animal products, ethically sourced wood, sustainably produced fabrics like silk, wool, cotton), environmental impacts (such as carbon emissions and waste, especially microplastics), and ethical labour practices. Regulatory frameworks, particularly in the EU, demand compliance with strict environmental and labor standards. More specifically, The EU’s Cosmetic Products Regulation (EC 1223/2009) mandates stringent safety standards, while the EU Green Deal encourages companies to reduce carbon footprints and embrace sustainable practices. Additionally, global sustainability certifications like ISO 14001 for environmental management and the ECOCERT and Fair Trade certifications for ethical sourcing are significant within this sector.
Technology (e.g., Apple):
Apple shows modest share prices with a high ESG score. The technology sector has become highly ESG-sensitive, particularly due to pressures related to carbon emissions, energy use, supply chain transparency, and data privacy. Regulations in the EU and other markets are increasingly targeting tech companies for their environmental footprint and social responsibilities. In the tech industry, regulations such as the EU’s General Data Protection Regulation (GDPR) mandate strict data privacy and protection standards. The European Green Digital Coalition is pushing tech firms to minimize environmental impacts, and regulations like the Right to Repair laws (mandated in the EU and proposed in various states in the U.S.) are influencing lifecycle management of tech products. Additionally, ISO 50001 for energy management and EPEAT certifications guide sustainable practices in electronics.Tech companies like Apple, with robust ESG commitments, attract ESG-conscious investors and consumers, which tends to boost share prices. Positive ESG performance in this sector is increasingly seen as a factor in long-term financial sustainability and risk mitigation.
Aviation (e.g., EasyJet, Ryanair, AirFrance):
The aviation sector is subject to intense regulatory scrutiny around carbon emissions. The EU Emissions Trading System (EU ETS) imposes a cap-and-trade system for emissions, requiring airlines to offset their carbon output. The Carbon Offsetting and Reduction Scheme for International Aviation (CORSIA), led by the International Civil Aviation Organization (ICAO), mandates airlines to compensate for growth in international aviation emissions. Additionally, ISO 14001 environmental management standards guide operational practices to reduce environmental impacts. EasyJet, with a high share price and a modest ESG score, suggests the airline industry’s sensitivity to ESG issues, particularly environmental impact and carbon footprint management.
Automotive (e.g., BMW, Volkswagen, Toyota):
The aviation sector is subject to intense regulatory scrutiny around carbon emissions. The EU Emissions Trading System (EU ETS) imposes a cap-and-trade system for emissions, requiring airlines to offset their carbon output. The Carbon Offsetting and Reduction Scheme for International Aviation (CORSIA), led by the International Civil Aviation Organization (ICAO), mandates airlines to compensate for growth in international aviation emissions. Additionally, ISO 14001 environmental management standards guide operational practices to reduce environmental impacts. Companies in the automotive sector, such as Toyota and Volkswagen, display moderate share prices and ESG scores. The sector is increasingly sensitive to ESG issues, driven by regulatory standards for emissions and by consumer demand for low-emission and electric vehicles. Automotive companies that invest in EVs and sustainable practices are better positioned to comply with future regulations and meet changing market preferences.
Financial Services (e.g., JPMorgan, BNP Paribas):
Financial services companies are increasingly regulated in terms of ESG disclosures and sustainable finance. The EU Sustainable Finance Disclosure Regulation (SFDR) mandates transparency on sustainability risks, while Task Force on Climate-related Financial Disclosures (TCFD) and UN Principles for Responsible Banking provide frameworks for climate-related risk reporting and responsible investment. Additionally, ISO 14097 sets standards for quantifying and reporting on greenhouse gas (GHG) emissions in finance. Financial institutions like JPMorgan and BNP Paribas show moderate to high share prices and ESG scores. The sector's sensitivity to ESG issues is growing, particularly in responsible investing and sustainable finance. High ESG scores in the financial sector lead to greater investor trust and stability in share prices, especially as regulatory scrutiny on climate risk in finance increases globally.
Our findings are consistent with previous studies, indicating that the social dimension of ESG has a stronger impact on share prices compared to economic and environmental dimensions. Companies aiming to enhance their market valuation should prioritize improving their social responsibility practices, alongside addressing environmental and economic sustainability.
In summary, while the equal weighting of ESG indicators provides a holistic view, the social aspects of ESG remain the most influential in driving share prices. Our H0 hypothesis is, therefore, confirmed, and positive ESG performance has a statistically significant impact on share price, especially in the short term. This holds, most importantly, for the ESG Index under social policy priorities, while correlations with ESG Index under economic or environmental priorities are much less significantly correlated with the share price. As investor and consumer awareness of sustainability issues continues to grow, the integration of robust ESG practices will become increasingly critical for companies across all sectors.
4.2. ESG Indexes and ROE
Contrary to the patterns of ESG and share price relationships the ESG and ROE connections have been shown to be much more statistically significant. From the statistical regression it appears that the relationship between ESG Indexes and ROE is stronger than the one with average share prices; indeed:
P-value < 0.0001 (Economic ESG Index – ROE, Figure 5)
P-value: 0.0670906 (Environmental ESG Index – ROE, Figure 6)
P-value: 0.0987201 (Social ESG Index – ROE, Figure 7).
The interpretation of the results obtained highlights that investments in economic ESG aspects like governance, ethical business practices, and economic sustainability are highly beneficial for equity returns. For what concerns the Environmental ESG Index there is a positive trend, but it is less pronounced compared to the economic index. Companies are spread across various environmental index values with low to moderate ROE. This suggests mixed performance on environmental factors, indicating that not all companies with good environmental practices achieve high ROE. Companies should still focus on environmental sustainability, as it can enhance long-term financial performance and risk management. The weaker significance might be due to the initial costs and longer time horizons associated with environmental investments. For the ESG Social Index instead there is a moderate correlation, companies with higher social scores, such as Estee Lauder and LVMH, exhibit higher ROE, suggesting that good social practices contribute to financial performance. Focusing on social sustainability can enhance corporate reputation, employee satisfaction, and customer loyalty, indirectly contributing to financial performance. The benefits of social practices might be more apparent in the long term and may require consistent and strategic efforts.
As well as in the previous section, the study has also conducted the regression for ESG Equivalent Index and ROE which provided the following results:
| P-value: | 0.002408 | |||
| Equation: | ROE = 167.117*ESG Index Equivalent - 61.4953 | |||
| Coefficients | ||||
| Term | Value | StdErr | t-value | p-value |
| Esg Index Equivalent | 167.117 | 50.0952 | 3.33599 | 0.002408 |
| intercept | -61.4953 | 23.7927 | -2.58462 | 0.0152534 |
The positive impact of the combined ESG index (economic, environmental, and social factors weighted equally) on ROE suggests that integrating all three dimensions of ESG performance can significantly enhance financial performance. Although the impact is slightly less than in the case of ESG Index under economic policy priorities, , it shows that incorporating environmental and social factors is still crucial for overall sustainability and long-term profitability. It could be very relevant here to examine the seeming contradiction between the ESG Index under social policy priorities strongly correlating with share prices while ESG Index under economic and equal policy priorities correlating stronger with ROE.
Economic ESG Index Correlating with ROE
- Profitability Focus: Companies with high scores in the Economic dimension of ESG are likely prioritizing efficient operations, strong governance, cost management, and profitability, which naturally aligns with higher ROE. A focus on governance and economic stability often translates to more sustainable financial performance, particularly in terms of equity returns.
- Shareholder Interest Alignment: Economic ESG metrics often include aspects related to governance, risk management, and efficient capital use, all of which tend to attract shareholders looking for stable returns. These measures often correlate with financial efficiency and profitability ratios, like ROE, which measure how effectively a company is using its equity capital.
Environmentally or Socially-weighted ESG Index Not Correlating Strongly with ROE
- Long-term Focus and Impact Lag: Environmental and Social investments often yield benefits over the long term, which may not immediately impact short-term profitability or ROE. For example, investments in reducing carbon footprint or enhancing employee welfare can increase costs in the short term without an immediate boost to financial returns.
- Cost-Intensive Nature of E&S Investments: Environmental and Social initiatives often require significant upfront investments, such as eco-friendly technologies or community projects, which can reduce profit margins in the short term. This can lead to lower ROE in the near term, even if these investments may improve long-term sustainability and brand equity.
Social ESG Index Correlating with Average Share Price:
- Investor Sentiment and Brand Perception: Socially responsible companies often have stronger public images, positively influencing investor sentiment and share price. In 2022, investors and consumers increasingly valued companies prioritizing social issues like employee treatment, diversity, and community impact, which could explain the correlation with share prices as these companies become more attractive to socially conscious investors.
- Market Demand for Socially-Responsible Investments: With rising consumer and investor awareness around social responsibility, companies with high Social ESG scores may attract more investment, driving up their share prices. Investors often see companies with strong social practices as less risky or more resilient in the face of public relations crises, which can contribute to a higher and more stable share price.
Companies should, therefore, focus on strong governance and ethical business practices as these have the most substantial impact on financial performance. While economic factors are critical, integrating environmental and social practices can enhance long-term sustainability, risk management, and stakeholder trust, which indirectly contribute to financial performance. A balanced approach to ESG, giving equal importance to economic, environmental, and social factors, can lead to significant improvements in ROE, supporting the case for comprehensive and integrated ESG strategies.
Let’s now delve deeper in the results that have been presented, why do ESG indicators have higher and stronger impact on ROE rather than on share prices? Can we explain the different influences, e.g. the strong impact of social issues on share prices compared to the lower one on ROE?
While ESG indexes can positively influence both ROE and share prices, the mechanisms through which they impact ROE are often more direct and operational in nature. Share prices, on the other hand, are subject to a broader range of influences, including market trends, investor sentiment, and economic conditions, which can dilute the immediate impact of strong ESG performance. Thus, the impact on ROE tends to be more pronounced and visible in the short to medium term compared to share prices.
Figure 8.
ESG Index Equivalent and ROE Regression Analysist.
Furthermore, Environmental, Social, and Governance (ESG) indexes can have a higher impact on Return on Equity (ROE) rather than on share prices due to several reasons:
Long-Term Operational Efficiency: companies that score highly on ESG indexes often implement sustainable practices, which can lead to cost savings (e.g., energy efficiency, waste reduction) and improved operational efficiencies. These savings can improve profit margins and, subsequently, ROE without immediately influencing share prices.
Risk Management: ESG-compliant companies are generally better at managing risks related to environmental regulations, social issues, and governance scandals. This proactive risk management can stabilize earnings and reduce the likelihood of costly incidents, positively impacting ROE by ensuring more consistent profitability.
Stakeholder Trust and Brand Loyalty: high ESG performance can enhance a company's reputation, leading to increased customer loyalty, attracting better talent, and fostering investor trust. These factors contribute to higher revenues and lower operational costs, improving ROE. However, these benefits may not be immediately reflected in share prices, which can be influenced by broader market conditions and investor sentiment.
Access to Capital: companies with strong ESG profiles often have better access to capital at lower costs due to the growing interest of ESG-focused investors. Lower financing costs can lead to higher net income relative to equity, enhancing ROE. While improved capital access is positive, its impact on share prices might be more gradual and less direct.
Regulatory Benefits: compliance with ESG standards can position companies favourably with regulators, potentially leading to tax incentives, subsidies, or reduced regulatory penalties. These benefits can enhance profitability and ROE more directly than share prices, which may be influenced by a wider array of market factors.
Long-Term Investor Focus: ESG indexes often attract long-term investors who value sustainability and responsible business practices. These investors may prioritize stable, long-term returns (e.g., ROE) over short-term share price fluctuations. As a result, the market may not immediately price in the benefits of ESG compliance, leading to a more pronounced effect on ROE.
Enhanced Employee Productivity and Retention: high ESG performance often correlates with better employee morale, higher productivity, and lower turnover rates. This leads to reduced recruitment and training costs, positively impacting profit margins and, consequently, ROE. The effects on share prices, however, may not be as immediate or visible.
Effective Resource Allocation: companies with strong ESG profiles are often better at allocating resources efficiently. This can include prudent capital investments and efficient management of assets, leading to higher returns on equity. Share prices, however, might be influenced by broader market trends and investor perceptions, which are not always aligned with efficient resource management.
Delayed Market Reactions: the benefits of high ESG performance might be recognized internally and reflected in improved ROE before the market fully appreciates these benefits. Share prices can be slow to react due to delayed market perception or skepticism about the long-term benefits of ESG initiatives.
In fact, there are already many studies supporting these findings. As previously explained Eccles et al. (2012) support the idea that companies with high sustainability practices significantly outperformed their counterparts in terms of stock market performance and accounting performance (including ROE). The impact on accounting performance metrics like ROE was more direct and pronounced due to operational efficiencies and improved risk management. In the same way also a Deutsche Bank Study (2012) analysed over 100 academic studies and found that companies with strong ESG scores often exhibited better operational performance and were more likely to have lower costs of capital, leading to higher ROE, but they also highlighted that the influence on share prices was evident but less consistent and immediate. To conclude, Friede et al. (2015) conducted a meta-analysis which argues that there is a positive correlation between ESG factors and corporate financial performance, particularly in accounting-based measures like ROE: the impact on share prices instead, while positive, was more subject to market conditions and investor sentiment. This final consideration might explain the big difference in the social issues as drivers for share prices, but not for ROE, or at least, not as much impactful as with the first one. But going further with this last point we can discuss that share prices are more influenced by social indicators because they directly affect investor sentiment, brand reputation, and consumer behavior. Return on Equity (ROE) is less affected by this, mostly because ROE places more emphasis on operational efficiency and internal financial measures. Investor perception and attitude are influenced by social factors, including a company's labor standards, community involvement, and diversity commitment. Good social performance boosts investor confidence, which may result in more people wanting to buy shares and paying more for them. Furthermore, excellent social performance builds consumer loyalty and brand reputation, which in turn propels revenue development and eventually affects share prices. Moreover, because they are seen as less risky investments, businesses with strong social performance frequently have easier access to finance. This results in lower borrowing costs and increased profitability, which indirectly affect share prices. Long-term sustainability is further enhanced by good social performance, efficient risk management, and regulatory compliance, all of which draw long-term investors and raise share values. But there is less of a direct correlation between social variables and ROE. Internal operational savings and financial management techniques have an impact on return on equity (ROE), which is typically used to measure financial performance in relation to equity. Social variables can help with risk management and operational efficiency, but they might not have as much of an impact on return on equity (ROE) as characteristics that are directly linked to profitability and financial efficiency. Social variables have a less impact on ROE calculations in financial analysis since they are usually given less weight than operational and financial issues.
This analysis definitely confirms our H1 because, as stated at the beginning, share prices and ROE are affected differently by ESG performance, particularly when referring to social indicators.
4.3. Social Indicators and Economic Indicators
This section will go through the discussion of the influence that Social indicators have on the financial performance of companies. Starting from the graph represented in the Figure 9, there is the correlation between the ratio between Employees to Turnover and ROE. Here we use an Empolyees/Turnover ratio to make cross-company comparisons for companies of different size more accurate. The correlation detected is negative: regression equation: ROE = -5.6871e+06 * (Employees/Turnover) + 31.2945, so as E/T increases, ROE tends to decrease.
The p-value is 0.0283611, which indicates that the relationship between E/T and ROE is statistically significant. The coefficient for the E/T ratio is -5.6871e+06. This large negative coefficient suggests that even small changes in the E/T ratio can have a substantial impact on ROE. Specifically, for every unit increase in the E/T ratio, ROE decreases by approximately 5.6871 million units, which underscores the strength of this relationship. The correlation might vary across different industries. Sectors that are labor-intensive (e.g., manufacturing) might naturally have higher E/T ratios compared to capital-intensive industries (e.g., technology). Therefore, the negative impact on ROE might be more pronounced in sectors where labor costs are a significant component of total costs.
Companies could focus on optimizing their workforce relative to their turnover to improve ROE. Strategies might include investing in employee training to boost productivity, adopting technologies that enhance efficiency, or restructuring operations to better align the workforce with revenue generation.
To summarize, it doesn’t seem that the number of employees has a positive influence on the financial impact, indeed, more employment is actually “bad” for ROE and this perfectly explains why all the companies are trying to introduce more AI and automation in their business. For now, it appears that there is an increasing focus on efficiency rather than achieving a low level of global unemployment.
Going forward, let’s see if the results regarding the percentage of women employed (diversity) is not a material topic either.
Figure 10 and Figure 11 describe respectively the regression analysis between Diversity indicator and ROE, and the one with the share prices. Although the first regression the p-value is not at all significant, because it’s 0.891465, the second one is significant: p-value = 0.0204607. Investors might perceive companies with higher diversity as more progressive, innovative, and better at managing diverse talent. This perception can lead to increased investor confidence, thereby driving up share prices. Companies with better gender diversity often have a stronger public image and brand value, which can positively influence their share prices. ROE reflects a company’s operational performance and profitability. Diversity might not have an immediate or direct impact on these financial metrics. Share prices are influenced by a wide array of factors, including investor sentiment, market trends, and external perceptions, which can be more sensitive to changes in diversity.
The differential impact of diversity on share prices versus Return on Equity (ROE) can be understood better by diving deeper into several dimensions: market perception, investor behaviour, operational efficiency, and broader corporate strategies. In fact, there are many studies supporting this difference in the impact. A study by Catalyst (2020) found that companies with more women on their boards had higher financial performance, which was attributed to the positive perception of diversity by investors. The MSCI World ESG Leaders Index, which includes companies with high ESG ratings, has consistently outperformed the standard MSCI World Index, indicating that good ESG practices, including diversity, positively influence share prices. A McKinsey report (2020) noted that while diversity correlates with profitability, the effect is more pronounced in companies with inclusive cultures that effectively harness the benefits of diverse teams.
4.4. Environmental Indicators and Economic Indicators
This last section of the Analysis will go through the discussion of the correlation between environmental indicators and economic indicators starting from the relationship between CO2/Turnover both with ROE and Profit/Turnover ratio respectively (Figure 12 and Figure 13).
The regression analysis shows a statistically significant negative relationship between CO2/Turnover and Profit/Turnover (p-value = 0.0152467). This means that as CO2 emissions relative to turnover increase, the profit margin tends to decrease. Several factors could explain this relationship: higher CO2 emissions often indicate less efficient production processes, leading to higher operational costs. Companies with inefficient processes may spend more on energy, waste management, and raw materials, reducing overall profitability. Companies with high emissions are subject to stricter environmental regulations and potential penalties. Compliance with these regulations can be costly, impacting profit margins. This includes investments in cleaner technologies, fines for exceeding emission limits, and costs associated with carbon credits. Investors and consumers are increasingly favoring companies with lower carbon footprints. Companies with higher emissions might face market penalties, such as lower stock valuations and reduced sales, as environmentally conscious consumers and investors seek greener alternatives. High CO2 emissions can negatively impact a company's brand image. Companies perceived as environmentally irresponsible may lose customer loyalty and face public relations challenges, which can directly affect profitability.
While the analysis indicates a negative coefficient for CO2/Turnover in the ROE regression, this relationship is not statistically significant (p-value = 0.316774). Several reasons could account for this: ROE is influenced by a wide range of factors beyond operational efficiency, including financial leverage, asset management, and strategic investment decisions. The complexity and variability of these factors may overshadow the impact of CO2 emissions on ROE. Companies have different capital structures and financing strategies, leading to variability in how equity is managed. This variability can dilute the apparent impact of CO2 emissions on ROE, making it harder to detect a significant relationship. The data used for ROE might have higher variability or noise compared to Profit/Turnover. Factors such as market conditions, interest rates, and company-specific events can introduce noise, complicating the detection of significant relationships. The impact of CO2 emissions on ROE might manifest over a longer time horizon than the data captures. While Profit/Turnover can be influenced by immediate operational costs, ROE might be affected by longer-term strategic decisions and investments related to emissions management.
Regulatory frameworks around the world are becoming increasingly stringent regarding carbon emissions. Companies must invest in cleaner technologies, implement emission reduction strategies, and possibly purchase carbon credits. For example, the European Union's Emissions Trading System (EU ETS) requires companies to purchase allowances for their emissions, which can be a substantial cost if emissions are high. These compliance costs can directly impact profitability, as reflected in the negative correlation between CO2/Turnover and Profit/Turnover. Non-compliance with emission regulations can result in fines and penalties, further reducing profitability and eroding shareholder value. For instance, the carbon tax, implemented in countries like Canada and Sweden, imposes a direct tax on greenhouse gas emissions. Companies exceeding their emission limits without appropriate credits face significant financial penalties, incentivizing them to reduce emissions but also adding to their cost burden if they fail to comply. Companies must invest in systems and processes to accurately track and report their emissions. This is seen in the UK's Streamlined Energy and Carbon Reporting (SECR) requirements, which mandate detailed annual reporting of energy use and carbon emissions. The need for precise reporting can increase operational costs, as companies need to ensure they meet these rigorous standards. As governments commit to more ambitious climate goals, regulations are expected to become even stricter. The Paris Agreement, for example, aims to limit global warming to below 2 degrees Celsius, which will likely lead to tighter emission caps and more rigorous enforcement. Companies that do not proactively manage their emissions may face escalating compliance costs and operational disruptions, impacting their long-term viability.
Companies must increasingly focus on Scope 3 emissions, which encompass all other indirect emissions in a company’s value chain. These emissions often represent the largest portion of a company’s carbon footprint, including those from purchased goods and services, business travel, employee commuting, waste disposal, and use of sold products. In fact, values collected in the sample of this study show that Scope 3 emissions are enormously higher than Scope 1 and 2. Addressing Scope 3 emissions is critical as they provide a comprehensive view of a company's environmental impact. Effective management of Scope 3 emissions can enhance supply chain efficiency, reduce risks associated with future regulatory changes, and meet the growing expectations of consumers and investors who demand greater transparency and sustainability throughout the entire value chain. In summary, the impact of CO2 emissions on financial performance underscores the importance of sustainable practices. Companies that navigate the regulatory landscape effectively and leverage market trends towards sustainability will be better positioned for future growth and success. The interplay between regulatory compliance, market dynamics, and operational efficiency highlights the critical role of environmental performance in shaping the business landscape of the future.
Considering now the relationship between the amount of Waste generated by companies per annum divided by turnover to make company performance more comparable and ROE (Figure 14), it has been detected that it has a negative relationship with ROE. In fact:
| P-value: | 0.109412 |
| Equation: | ROE = -1.1313e+06*Waste /Turnover + 20.9248. |
The scatter plot depicts various companies with their respective ROE and Waste/Turnover ratios. A few observations include:
- Apple: stands out with a very high ROE and low Waste/Turnover, indicating high operational efficiency and effective waste management.
- Estee Lauder, L'Oréal: represent the consumer goods sector with moderate Waste/Turnover and positive ROE, suggesting that waste management is a notable factor in their financial performance. The production processes in this sector often generate substantial waste, but companies that manage to minimize this waste can achieve better financial outcomes. It could be improved using biodegradable or recyclable packaging material s well as by implementing lean manufacturing principles for reducing waste.
- Airlines (AirFrance, Ryanair, EasyJet): display low ROE and Waste/Turnover, indicating that while they manage waste effectively, other factors may be impacting their profitability.
- Automotive (BMW, General Motors, Volkswagen): exhibit a range of ROEs and moderate Waste/Turnover ratios, reflecting varied efficiencies and waste management practices within the sector. This sector faces challenges with waste from manufacturing processes and end-of-life vehicles.
- Food and Beverage (Nestlé, Starbucks): show high Waste/Turnover ratios with varying ROEs, indicating differing impacts of waste on financial performance within the sector.- Companies like Starbucks, with high waste and negative ROE, highlight the adverse impact of poor waste management on financial performance. Conversely, Nestlé shows that effective waste management can mitigate some of the negative impacts.
The analysis reveals that waste management's impact on financial performance varies significantly across sectors. However, the overarching theme is clear: efficient waste management can positively influence a company’s ROE by reducing costs, enhancing operational efficiencies, and improving brand reputation.
There are many practices that companies could adopt to improve their performance in waste management. First of all, the adoption of Circular Economy Model which emphasizes the reuse, recycling and regeneration (3R) of materials. Investments in technologies could also play a critical role thanks to AI (Artificial Intelligence) or IoT (Internet of Things) as a waste tracker. Strengthening supply chain management as well as stakeholders’ knowledge would help in the application of sustainable practices overall the entire business process and, to conclude, the implementation of new regulations is essential, because companies must have to feel the pressure of achieving certain standards in order to truly see a global engagement.
Figure 15.
Water/Turnover and ROE.
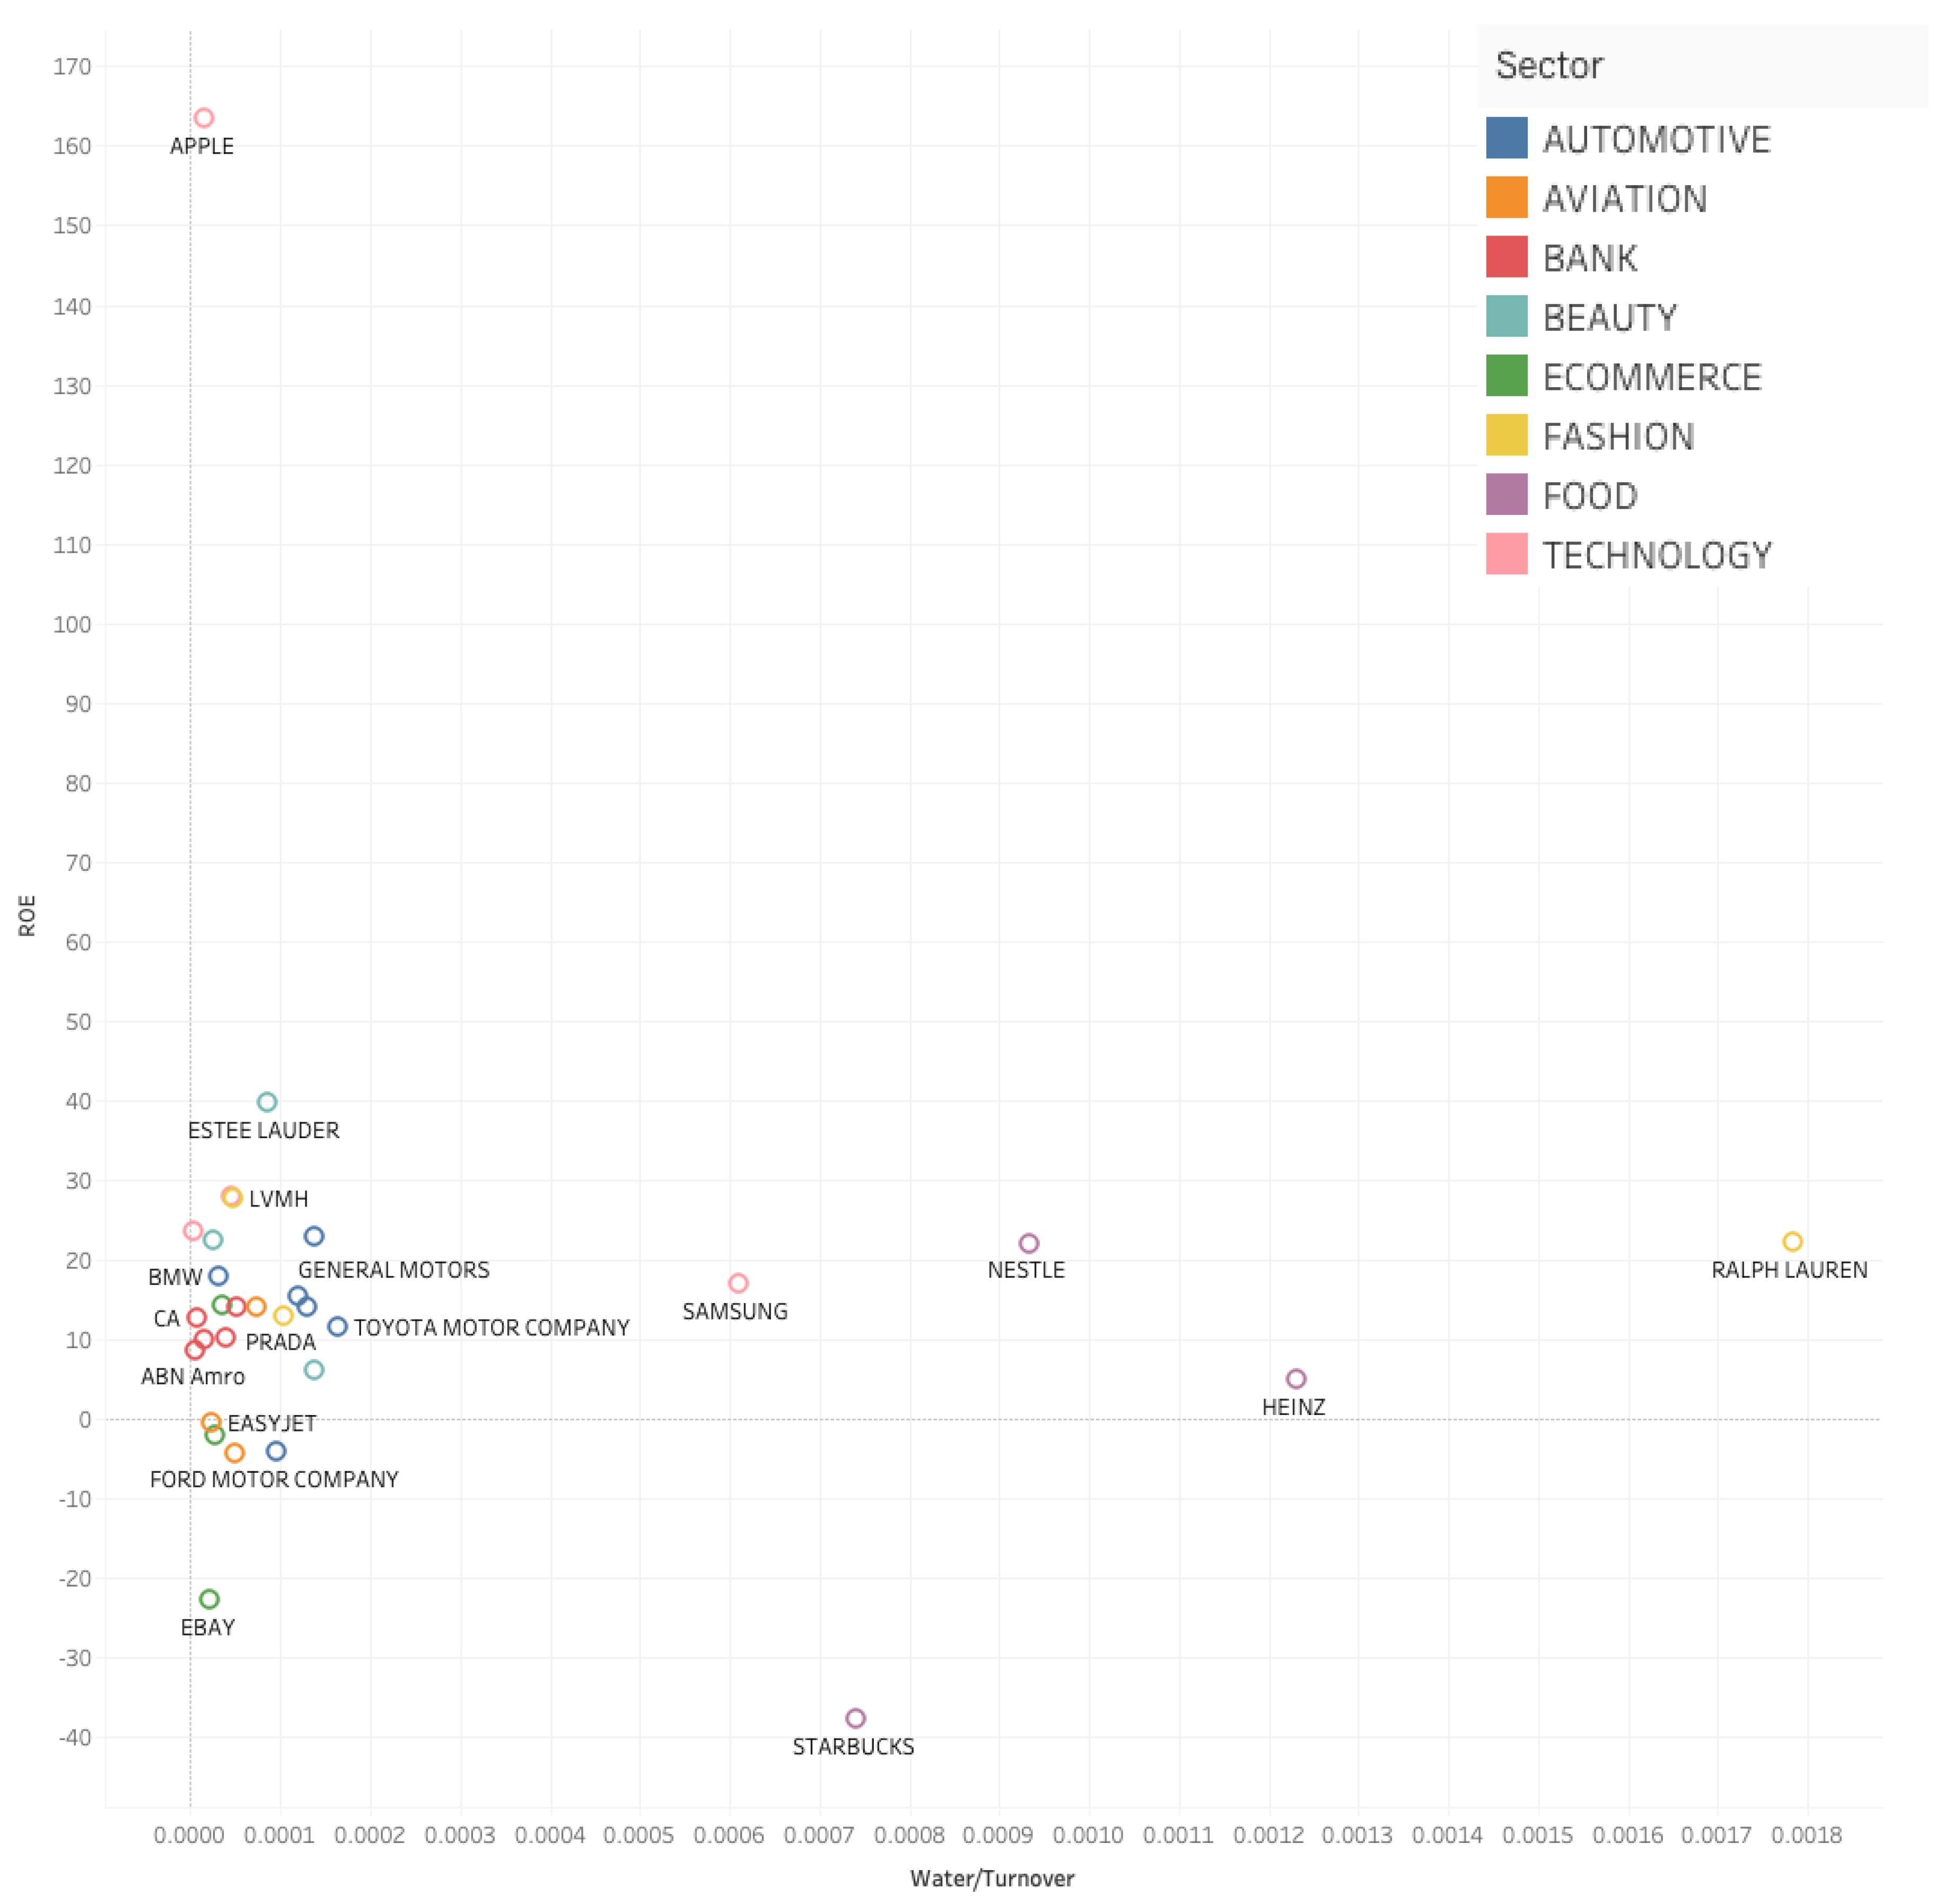
The last analysis proposed describes the regression of the company water use over turnover (Water/Turnover) and ROE represented in Appendix D.4. The statistical results are as follow:
| P-value: | 0.596231 |
| Equation: | ROE = -7602.67*Water/Turnover + 17.8443 |
The correlation between the two variables is negative but, due to the high p-value, it’s not statistically significant. A possible reason, and this will be the conclusion supported from this study, is that companies don’t provide fair and transparent values regarding water consumption. Despite increasing awareness and regulations regarding sustainability, the accuracy and comprehensiveness of water consumption data reported by companies often fall short. This could be related to a lack of standardization in terms of methodologies and metrics for reporting this variable. Companies often use different frameworks and units, making it challenging to compare data across industries or even within the same industry. During the collection of data for this study, water consumption has been the most difficult data to collect due to the variety of reporting methodologies, indeed, for some companies the water consumption has been manually calculated considering the total number of employees, multiplied for the general water footprint of an individual, multiplied for the hours of work during a year. It has been calculated specifically for EasyJet and Amazon which don’t even include this value in their sustainability reports because ‘not material’. The question is how is it possible that water consumption is not considered a material issue? Water is consumed every day in any kind of activity so, if the companies were considering the total water consumption and not only the one related to operational activities, it should be always a material topic. The CDP (Carbon Disclosure Project) publishes an annual Global Water Report, assessing water security in companies. The 2020 report highlighted that while more companies are disclosing water-related data, there are still significant gaps in transparency and comprehensiveness. Only a fraction of the companies provides full and transparent data on their water risks and consumption. Another important point to highlight is that many companies currently focus primarily on operational water use, which includes water used in their facilities for production processes, cooling, sanitation, etc. This approach often neglects the broader impacts of water use throughout the supply chain and product lifecycle. Indirect water use includes water consumed during the production of raw materials, in the supply chain, and in the disposal and recycling processes. This can often represent a significant portion of a company’s total water footprint. The process adopted should be the same used for CO2 emissions (Scope 1,2 and 3) because water consumption should be divided as:
- Direct Water Use: water used directly in company operations.
- Indirect Water Use: water used in the production of purchased goods and services.
- Value Chain Water Use: water used throughout the entire value chain, including product use and disposal.
The WBCSD has developed guidelines for sustainable water management that advocate for considering the entire value chain. Their approach highlights the need for robust data collection and reporting mechanisms to capture indirect water use.
The analysis presented above clearly showed that our Hypothesis H2 holds. Adopting a comprehensive reporting framework that includes direct and indirect water use would provide a more accurate representation of a company's water footprint. This holistic approach would help companies identify and address water-related risks more effectively, promoting sustainable water management practices across the entire value chain.
5. Concluding Remarks
Given the results collected and the findings coming out from the statistical study it’s possible to confirm the initial hypotheses: on the overall there is evidence that ESG performance is positively correlated with financial performance (H0) and that share prices and ROE are affected differently by ESG indicators (H1). At the same time, we found that various ESG indicators are reflected in the financial performance of companies in different ways (H2).
One of the limitations of this study is a small sample of companies, which however represent up to 9.2% of global market capitalization. A potential way forward could be to expand the pool of the companies under consideration to include mining, oil and gas, electricity and renewable energy companies, retail, food, aiming to make the sample more representative of the global economy. Time dimension might need to be taken into account more explicitly examining long term impacts as opposed to short term impacts.
Many companies, investors and shareholders still need to be educated on sustainable topics, and will have to embrace sustainability bringing it to the heart of their business models. At the same time, improvements in the data quality as well as a process of standardization on a global scale will have to be implemented. It’s important that all the companies use the same units of measurement and that every data reported is transparent and comprehensive of all the business process activities. Many upgrades have been already put in place for Scope 1, 2, and 3 CO2 emissions (even if not all the companies report all the data yet) but there is the necessity for transparency and accuracy in the reporting of all the data, specifically for environmental dimensions such as water and waste generation. Access to corporate sustainability data might need to be improved and information should be made more easily comparable. Most platforms offering ESG data, including Bloomberg, Dow Jones or MSCI currently offer paid subscription options only, the data being proprietary.
Some concerns regarding data quality remain. Are we sure that Amazon considers all the packaging waste in their sustainability report? Can we assure that the food sector is reporting their water consumption fully and accurately? There is evidence that Starbucks, for example, makes significant efforts, however total water consumption of such a large company, taking into account the whole supply chain, is far greater than water use in operations. Many companies still lack sufficient transparency not specifying clearly what the data refers to. It would be beneficial for companies to report Scope 1, Scope 2 and Scope 3 water consumption as to cover the entire business process and not only the direct impact. Further discussions could be also made on the sustainability reporting regarding financial sector, with banks and financial institutions really required to report on their full investment portfolios regarding environmental, social and economic performance. There are several questions, for instance, regarding the big difference between ABN Amro (which has recently been recognized as one of the best in sustainability reporting) and JP Morgan or BNP Paribas for example, how can the difference in data be explained?
Another example could be Apple, there are several studies arguing that their Scope 3 emissions might not be transparent. Does Apple include all the CO2 emissions resulting from the use of their products charged daily all around the world using electricity with different energy mixes? The same is valid also for the automotive sector, knowing that in the past some companies like Volkswagen have been deliberately distorting their sustainability data, how can we assure that there are no companies reporting inaccurate information? There could be a further discussion regarding the real assurance and verification processes for sustainability data.
The positive correlation between ESG investments and financial performance has far-reaching implications for society. Companies that prioritize ESG criteria contribute to environmental sustainability, social equity, and good governance, leading to broader societal benefits. For instance, environmentally responsible companies help reduce carbon footprints, mitigate climate change, and preserve natural resources. Socially responsible companies promote fair labor practices, community engagement, and equality, thereby enhancing social cohesion and quality of life. Good governance ensures ethical business practices, transparency, and accountability, which are crucial for building trust and stability in society.
Moreover, as investors increasingly demand sustainable practices, companies are incentivized to align their operations with societal values. This shift not only enhances corporate reputation but also fosters a culture of responsibility and ethical behavior, ultimately contributing to a more sustainable and equitable world. One recent example of an initiative in this field is B-Corp or Benefit Corporation initiative that inspires companies to change their legal statutes to include the interests of a wider set of stakeholders as opposed to just shareholders. This movement is capable of truly revolutionizing business models and make businesses one of the driving forces of the sustainability transition.
The integration of ESG factors drives significant business model innovation. Companies that adopt sustainable practices are often at the forefront of technological advancements and innovative solutions. For example, businesses investing in renewable energy, waste reduction technologies, and sustainable supply chains are not only reducing their environmental impact but also pioneering new markets and revenue streams.
The necessity for continuous research and adaptation to new developments ensures that companies remain agile and innovative. As they strive to meet evolving ESG standards, businesses are compelled to rethink traditional models and embrace new, sustainable approaches. This can lead to the development of products and services that address environmental and social challenges, creating competitive advantages and opening up new opportunities for growth.
As a result, implementation of further regulations and precisely standardization procedures in the future is strongly recommended in order to reach the point of global ESG engagement in which all the companies can be compared to each other. It’s important to understand which are the real drivers of sustainability, transparency must be assured for investors who are increasingly interested in supporting green companies. This paper aimed to shed new light on the importance of ESG issues hoping that there will soon be a global action in place for a common universal goal: building a truly green and sustainable economy.
Author Contributions
Dr Stanislav Shmelev: research supervision, methodology, conceptualization, editing, data visualization, final corrections. Elisa Gilardi: data collection, literature review, research, drafting the manuscript.
Funding
N/A.
Appendix A. Normalised ESG Data Table, FY2022
| COMPANY NAME | TURNOVER | PROFIT | ROE | EMPLOYEES | DIVERSITY | SCOPE 1 | SCOPE 2 | SCOPE 3 | TOT CO2 | WATER | WASTE |
| HEINZ | 0,0455 | 0,0293 | 0,2115 | 0,0202 | 0,2973 | 0,9708 | 0,9496 | 0,9519 | 0,9502 | 0,7607 | 0,9697 |
| STARBUCKS | 0,0568 | 0,0157 | 0,0000 | 0,2585 | 0,5477 | 0,9792 | 0,9677 | 0,9752 | 0,9741 | 0,8249 | 0,5788 |
| NESTLE' | 0,1974 | 0,0746 | 0,2972 | 0,1758 | 0,3224 | 0,8108 | 0,9163 | 0,8021 | 0,7951 | 0,2867 | 0,0000 |
| BNP Paris | 0,0993 | 0,0785 | 0,2381 | 0,1224 | 0,5477 | 0,9976 | 0,9783 | 0,9999 | 0,9999 | 0,9851 | 0,9941 |
| ABN Amro | 0,0098 | 0,0157 | 0,2306 | 0,0098 | 0,2034 | 1,0000 | 0,9997 | 0,9603 | 0,9603 | 1,0000 | 1,0000 |
| CA | 0,0736 | 0,0659 | 0,2500 | 0,0912 | 0,3052 | 0,9990 | 0,9972 | 1,0000 | 1,0000 | 0,9984 | 0,9947 |
| JPMORGAN | 0,2456 | 0,2324 | 0,2570 | 0,1880 | 0,4851 | 0,9950 | 0,9137 | 0,9997 | 0,9997 | 0,9521 | 0,9899 |
| MEDIOBANCA | 0,0000 | 0,0214 | 0,2371 | 0,0000 | 0,4225 | 0,9999 | 0,9995 | 0,9996 | 0,9996 | 1,0000 | 1,0000 |
| AIRFRANCE | 0,0498 | 0,0201 | 0,2570 | 0,0459 | 0,4069 | 0,1995 | 0,9945 | 0,9800 | 0,9559 | 0,9849 | 0,9882 |
| EASYJET | 0,0082 | 0,0108 | 0,1844 | 0,0059 | 0,3912 | 0,6249 | 1,0000 | 0,9971 | 0,9858 | 0,9991 | 0,9984 |
| RYANAIR | 0,0031 | 0,0143 | 0,1660 | 0,0092 | 0,3599 | 0,4629 | 0,9995 | 0,9964 | 0,9964 | 0,9986 | 0,9991 |
| CISCO | 0,0947 | 0,0918 | 0,3266 | 0,0510 | 0,1878 | 0,9981 | 0,9379 | 0,9687 | 0,9687 | 0,9829 | 0,9972 |
| APPLE | 0,7658 | 1,0000 | 1,0000 | 0,1042 | 0,2660 | 0,9969 | 0,9997 | 0,9640 | 0,9640 | 0,9579 | 0,9366 |
| ALPHABET | 0,5474 | 0,3613 | 0,3044 | 0,1206 | 0,2488 | 0,9948 | 0,7255 | 0,9867 | 0,9867 | 0,9928 | 0,9899 |
| SAMSUNG | 0,4309 | 0,0159 | 0,2714 | 0,1728 | 0,1252 | 0,6512 | 0,0000 | 0,7814 | 0,7814 | 0,0000 | 0,7238 |
| VOLKSWAGEN GROUP | 0,5832 | 0,1138 | 0,2570 | 0,4367 | 0,0000 | 0,7395 | 0,7676 | 0,3065 | 0,3065 | 0,7124 | 0,7121 |
| BMW | 0,2937 | 0,1306 | 0,2764 | 0,0941 | 0,2973 | 0,9596 | 0,9899 | 0,7956 | 0,7956 | 0,9648 | 0,7212 |
| STELLANTIS | 0,3715 | 0,1196 | 0,3017 | 0,1741 | 0,0437 | 0,9109 | 0,7890 | 0,2161 | 0,2161 | 0,8044 | 0,8969 |
| FORD MOTOR COMPANY | 0,3031 | 0,0042 | 0,1669 | 0,1093 | 0,1690 | 0,8669 | 0,6586 | 0,4131 | 0,4131 | 0,8894 | 0,6150 |
| TOYOTA MOTOR COMPANY | 0,3881 | 0,1212 | 0,2446 | 0,2395 | 0,2817 | 0,8617 | 0,6840 | 0,0000 | 0,0000 | 0,7578 | 0,9207 |
| GENERAL MOTORS | 0,3005 | 0,0716 | 0,2634 | 0,0971 | 0,1033 | 0,9235 | 0,7501 | 0,4263 | 0,4263 | 0,8632 | 0,5928 |
| AMAZON | 1,0000 | 0,0000 | 0,1775 | 1,0000 | 0,3914 | 0,2170 | 0,6818 | 0,9036 | 0,9036 | 0,8974 | 0,8793 |
| EBAY | 0,0128 | 0,0084 | 0,0742 | 0,0043 | 0,3756 | 0,9999 | 0,9958 | 0,9966 | 0,9966 | 0,9988 | 0,9752 |
| FEDEX | 0,1768 | 0,0376 | 0,2586 | 0,3342 | 0,1878 | 0,0000 | 0,9048 | 0,9925 | 0,9925 | 0,9765 | 0,7897 |
| PRADA | 0,0025 | 0,0186 | 0,2520 | 0,0058 | 0,7042 | 0,9997 | 0,9968 | 0,9995 | 0,9995 | 0,9969 | 0,9994 |
| LVMH | 0,1608 | 0,1033 | 0,3246 | 0,1244 | 0,9703 | 0,9962 | 0,9791 | 0,9990 | 0,9990 | 0,9710 | 0,9598 |
| RALPH LAUREN | 0,0058 | 0,0191 | 0,2975 | 0,0112 | 0,7199 | 0,9995 | 0,9924 | 0,9979 | 0,9978 | 0,9189 | 0,9973 |
| L'OREAL | 0,0742 | 0,0511 | 0,2992 | 0,0537 | 0,7825 | 0,9990 | 0,9994 | 0,9803 | 0,9803 | 0,9926 | 0,9672 |
| ESTEE LAUDER | 0,0284 | 0,0296 | 0,3843 | 0,0378 | 0,9859 | 0,9986 | 0,9940 | 1,0000 | 1,0000 | 0,9893 | 0,9890 |
| SHISEIDO | 0,0093 | 0,0169 | 0,2172 | 0,0222 | 1,0000 | 0,9988 | 0,9975 | 0,9974 | 0,9974 | 0,9923 | 0,9958 |
Appendix B. Corporate ESG Performance Data, FY2022
| SECTOR | ECONOMIC | SOCIAL | ENVIRONMENTAL | ||||||||||
| TURNOVER | PROFIT | ROE | AV SHARE PRICE | EMPLOYEES | DIVERSITY |
CO2 SCOPE 1 |
CO2 SCOPE 2 |
CO2 SCOPE 3 |
Total CO2 | WATER | WASTE | ||
| COMPANIES | $ | $ | % | $ | pers | % | tons of CO2 | tons of CO2 | tons of CO2 | tons of CO2 | m3 | tons | |
| FOOD | HEINZ | 26.485.000.000,00 | 2.368.000.000,00 | 4,86 | 38,14 | 36.000 | 37 | 501.786 | 457.547 | 27.426.878 | 28.386.211 | 32.608.000 | 89.296 |
| FOOD | STARBUCKS | 32.250.300.000,00 | 3.281.600.000,00 | -37,69 | 87,63 | 402.000 | 53 | 358500 | 293364 | 14.134.864 | 14.786.729 | 23.867.000 | 1.236.000 |
| FOOD | NESTLE | 104.042.110.400,00 | 10.216.847.070,00 | 22,08 | 120,2 | 275.000 | 38,6 | 3.240.000 | 760000 | 112.900.000 | 116.900.000 | 97.100.000 | 2.934.237 |
| BANK | BNP Paribas | 53.926.649.830,00 | 10.905.335.720,00 | 10,2 | 55,32 | 193.000 | 53 | 43353 | 197286 | 75850 | 316489 | 2.072.981 | 17.771 |
| BANK | ABN Amro | 8.233.549.860,00 | 2.000.000,00 | 8,7 | 12,15 | 20.038 | 31 | 3000 | 3000 | 22.628.000 | 22.634.000 | 49.528 | 521 |
| BANK | CA | 40.805.847.800,00 | 8.710.578.080,00 | 12,6 | 10,97 | 145.000 | 37,5 | 19.404 | 25439 | 18990 | 63.833 | 265.466 | 15.879 |
| BANK | JPMORGAN | 128.690.000.000,00 | 37.600.000.000,00 | 14 | 128,1291 | 293.723 | 49 | 88553 | 783616 | 156845 | 1029014 | 6.566.867 | 29.932 |
| BANK | MEDIOBANCA | 3.234.478.500,00 | 988.639.590,00 | 10 | 9,85 | 4.921 | 45 | 5.200 | 4.500 | 210.000 | 219.700 | 46.000 | 380 |
| AVIATION | AIRFRANCE | 28.654.296.000,00 | 759.773.000,00 | 14 | 17,65 | 75.431 | 44 | 13.700.000 | 50000 | 11400000 | 25.150.000 | 2.100.000 | 35.000 |
| AVIATION | EASYJET | 7.400.429.000,00 | -840.387.700,00 | -0,6 | 568,02 | 13.951 | 43 | 6.421.434 | 0 | 1.660.512 | 8081946 | 174.375 | 5.193 |
| AVIATION | RYANAIR | 4.801.000.000,00 | -241.000.000,00 | -4,3 | 106,2696 | 19.116 | 41 | 9.193.324 | 4.150 | 2.075.941 | 11.273.415 | 239.450 | 2.981 |
| TECH | CISCO | 51.600.000.000,00 | 13.200.000.000,00 | 28 | 53,6288 | 83.300 | 30 | 34.931 | 564.012 | 17.845.589 | 18.444.532 | 2.369.000 | 8.561 |
| TECH | APPLE | 394.340.000.000,00 | 170.782.000.000,00 | 163,45 | 165,1837 | 165.000 | 35 | 55200 | 3000 | 20.550.000 | 20.608.200 | 5.780.324 | 186.483 |
| TECH | ALPHABET | 282.836.000.000,00 | 59.972.000.000,00 | 23,54 | 115,1937 | 190.234 | 33,9 | 91.200 | 2.492.900 | 7.600.000 | 10.184.100 | 1.025.846 | 30.144 |
| TECH | SAMSUNG | 223.300.736.215,94 | 41.117.180,37 | 16,9 | 46,663 | 270.372 | 26 | 5972000 | 9081000 | 124715000 | 139.768.000,00 | 136.118.000 | 810.599 |
| AUTO | VOLKSWAGEN GROUP | 301.122.784.000,00 | 17.015.227.740,00 | 14 | 159,71 | 675.800 | 18 | 4.460.000 | 2.110.000 | 395.620.000 | 402.190.000,00 | 39.180.000 | 845.000 |
| AUTO | BMW | 153.229.453.650,00 | 19.943.038.590,00 | 17,9 | 93,43 | 149.475 | 37 | 694.057 | 91.300 | 116.586.786 | 117.372.143 | 4.840.161 | 818.387 |
| AUTO | STELLANTIS | 192.965.318.280,00 | 18.028.448.235,00 | 23 | 14,9261 | 272.367 | 20,79 | 1.526.765 | 1.916.359 | 447.200.000 | 450.643.124 | 26.661.000 | 302.858 |
| AUTO | FORD MOTOR COMPANY | 158.057.000.000,00 | -2.000.000.000,00 | -4,11 | 14,872 | 172.762 | 28,8 | 2.280.000 | 3.100.000 | 334.800.000 | 340.180.000 | 15.100.000 | 1.130.000 |
| AUTO | TOYOTA MOTOR COMPANY | 201.457.500.194,80 | 18.305.407.500,00 | 11,5 | 177,347 | 372.817 | 36 | 2.370.000 | 2.870.000 | 570.490.000 | 575.730.000 | 33.000.000 | 233.000 |
| AUTO | GENERAL MOTORS | 156.735.000.000,00 | 9.708.000.000,00 | 15,3 | 40,223 | 154.113 | 24,6 | 1.312.309 | 2.268.964 | 327.269.768 | 330.851.041 | 18.665.000 | 1.195.018 |
| ECOMM | AMAZON | 513.980.000.000,00 | -2.722.000.000,00 | -1,98 | 126,0988 | 1.541.000 | 43,01 | 13.400.000 | 2.890.000 | 54.980.000 | 71.270.000 | 14.006.024 | 354.500 |
| ECOMM | EBAY | 9.795.000.000,00 | 1.270.000.000,00 | -22,76 | 48,18478 | 11.600 | 42 | 5.133 | 38.478 | 1.937.298 | 1.980.909 | 207.247 | 73.000 |
| E-COMM | FEDEX | 93.512.000.000,00 | 3.800.000.000,00 | 14,33 | 233,7833 | 518.249 | 30 | 17.113.617 | 864.711 | 4.269.004 | 22.247.332 | 3.240.000 | 617.452 |
| FASHION | PRADA | 4.516.501.674,69 | 500.168.535,71 | 13 | 11,154 | 13.768 | 63 | 7.475 | 29.445 | 310.671 | 347.591 | 463.380 | 2.037 |
| FASHION | LVMH | 85.371.041.840,00 | 15.201.703.500,00 | 27,6 | 695,42 | 196.006 | 80 | 67.393 | 190.051 | 576.142 | 833.586 | 3.992.223 | 118.332 |
| FASHION | RALPH LAUREN | 6.218.500.000,00 | 600.100.000,00 | 22,14 | 119,63 | 22.200 | 64 | 11.582 | 69.291 | 1.192.249 | 1.273.122 | 11.087.765 | 8.271 |
| BEAUTY | L'OREAL | 41.153.029.900,00 | 6.138.104.559,00 | 22,5 | 372,19 | 87.400 | 68 | 19.733 | 5.367 | 11.245.000 | 11.270.100 | 1.048.245 | 96.675 |
| BEAUTY | ESTEE LAUDER | 17.737.000.000,00 | 2.408.000.000,00 | 39,6 | 305,81 | 63.000 | 81 | 27.800 | 54.800 | 2.355 | 84.955 | 1.500.000 | 32.600 |
| BEAUTY | SHISEIDO | 7.970.000.000,00 | 218.608.100,00 | 6 | 36,48 | 39.000 | 81,9 | 23.912 | 22.527 | 1.510.000 | 1.556.439 | 1.100.000 | 12.560 |
Appendix C. Data Sources
- ABN AMRO. (2022). Integrated Annual Report. Retrieved from https://assets.ctfassets.net/1u811bvgvthc/3tn2c2U6QjiBj1IWRNX9cl/c2dde83a535488509bbf0c37726fa407/ABN_AMRO_____Integrated_Annual_Report_2022.pdf
- ABN AMRO. (2023). Integrated Annual Report. Retrieved from https://carbonaccountingfinancials.com/files/institutions_downloads/ABN-AMRO-Integrated-Annual-Report-2023.pdf
- Air France-KLM Group. (2022). Full-Year 2022 Results. Retrieved from https://www.airfranceklm.com/en/newsroom/full-year-2022-results
- Air France-KLM Group. (2023). Financial Statements and Notes. Retrieved from https://www.airfranceklm.com/sites/default/files/2023-02/2022_12_AFKLM_Financial_statements_and_notes_as_of_December%2031_2022.pdf
- Air France-KLM Group. (2023). FY 2022 Results Presentation. Retrieved from https://www.airfranceklm.com/sites/default/files/2023-02/AFKLM_FY_2022_Results_Presentation_1.pdf
- Alphabet Inc. (2022). Annual Report. Retrieved from https://www.macrotrends.net/stocks/charts/EBAY/ebay/roe
- Alphabet Inc. (2022). ESG. Retrieved from https://abc.xyz/investor/esg/
- Amazon.com, Inc. (2023). Annual Report. Retrieved from https://s2.q4cdn.com/299287126/files/doc_financials/2023/ar/Annual-Report.pdf
- Amazon. (n.d.). Water. Retrieved from https://sustainability.aboutamazon.com/natural-resources/water
- Amazon. (2022). Sustainability Report. Retrieved from https://sustainability.aboutamazon.com/2022-sustainability-report.pdf
- Apple Inc. (n.d.). Diversity. Retrieved from https://www.apple.com/diversity/
- Apple Inc. (n.d.). Investor Relations. Retrieved from https://investor.apple.com/investor-relations/default.aspx
- Apple Inc. (2023). Environmental Progress Report. Retrieved from https://www.apple.com/environment/pdf/Apple_Environmental_Progress_Report_2023.pdf
- BMW Group. (2023). BMW Group Report. Retrieved from https://www.bmwgroup.com/content/dam/grpw/websites/bmwgroup_com/ir/downloads/en/2023/bericht/BMW-Group-Report-2022-en.pdf
- BNP Paribas. (2022). Universal Registration Document. Retrieved from https://invest.bnpparibas/en/document/universal-registration-document-2022
- Cisco Systems, Inc. (2022). Annual Report. Retrieved from https://www.cisco.com/c/dam/en_us/about/annual-report/cisco-annual-report-2022.pdf
- Cisco Systems, Inc. (2022). Purpose Report. Retrieved from https://www.cisco.com/c/dam/m/en_us/about/csr/esg-hub/_pdf/purpose-report-2022.pdf
- Cisco Systems, Inc. (n.d.). Product Returns. Retrieved from https://www.cisco.com/c/m/en_us/about/csr/esg-hub/environment/product-returns.html
- Crédit Agricole Group. (n.d.). Financial Results. Retrieved from https://www.credit-agricole.com/en/pdfPreview/197771
- Crédit Agricole Group. (n.d.). Financial Results. Retrieved from https://www.credit-agricole.com/en/pdfPreview/198829
- easyJet plc. (2022). Annual Report. Retrieved from https://corporate.easyjet.com/files/shareholder_docs/2023/annual-report-2022.pdf
- easyJet plc. (2022). Sustainability Report. Retrieved from https://www.easyjet.com/ejcms/cache/medialibrary/Files/Sustainability/easyJet_2022_ARA_Sustainability_221215.pdf
- eBay Inc. (2022). Annual Report. Retrieved from https://ebay.q4cdn.com/610426115/files/doc_financials/2022/ar/2022-annual-report.pdf
- eBay Inc. (2022). Impact Report. Retrieved from https://static.ebayinc.com/assets/Uploads/Documents/eBay-Impact-2022-Executive-Summary.pdf
- FedEx Corporation. (2023). ESG Report. Retrieved from https://www.fedex.com/content/dam/fedex/us-united-states/sustainability/gcrs/FedEx_2023_ESG_Report.pdf
- Ford Motor Company (2023). Integrated Sustainability and Financial Report (2023). Retrieved from https://s201.q4cdn.com/693218008/files/doc_financials/2022/ar/2023-Integrated-Sustainability-and-Financial-Report.pdf
- Ford Motor Company (2022). Form 10-K (2022). Retrieved from https://s201.q4cdn.com/693218008/files/doc_financials/2023/03/2022-Form-10-K.pdf
- General Motors Company. (n.d.). Financial Information. Retrieved from https://investor.gm.com/static-files/12adf215-2927-498e-a958-66345e607b98
- JPMorgan Chase & Co. (2022). Annual Report. Retrieved from https://www.jpmorganchase.com/content/dam/jpmc/jpmorgan-chase-and-co/investor-relations/documents/annualreport-2022.pdf
- JPMorgan Chase & Co. (2022). ESG Report. Retrieved from https://www.jpmorganchase.com/content/dam/jpmc/jpmorgan-chase-and-co/documents/jpmc-esg-report-2022.pdf
- Kraft Heinz Company. (2022). 2022 ESG Report. Retrieved from https://www.kraftheinzcompany.com/esg/pdf/KraftHeinz-2022-ESG-Report.pdf
- Kraft Heinz Company. (2023). 2023 ESG Report. Retrieved from https://www.kraftheinzcompany.com/esg/pdf/KraftHeinz-2023-ESG-Report.pdf
- Kraft Heinz Company. (n.d.). Investors - SEC Filings. Retrieved from https://ir.kraftheinzcompany.com/static-files/5066c60c-cf3b-41bd-9b0f-d404755f78fa
- L'Oréal. (n.d.). Gender Equity at L'Oréal. Retrieved from https://www.loreal.com/-/media/project/loreal/brand-sites/corp/master/lcorp/3-commitments/for-the-people/gender-equity-at-loreal.pdf?rev=a6a571a78c014ef1b52f98474f3b6a98&hash=80FAC35101E0E63EC7FA66D9A8DE41EF
- L'Oréal. (2023). Annual Report. Retrieved from https://www.loreal-finance.com/system/files/2023-03/LOREAL_2022_Annual_Report.pdf
- LVMH Moët Hennessy Louis Vuitton SE. (2020). Environment and Sustainability Report. Retrieved from https://r.lvmh-static.com/uploads/2020/02/2022-environment-and-sustainability.pdf
- LVMH Moët Hennessy Louis Vuitton SE. (2023). Financial Document 2022. Retrieved from https://r.lvmh-static.com/uploads/2023/01/lvmh_document-financier-2022_uk-final.pdf
- LVMH Moët Hennessy Louis Vuitton SE. (2022). RSE 2022: Report on Social Responsibility. Retrieved from https://r.lvmh-static.com/uploads/2023/06/lvmh_rse_2022_gb_pp_e-accessible.pdf
- Mediobanca S.p.A. (n.d.). Investor Documentation. Retrieved from https://www.mediobancaint.lu/en/investor-documentation.html
- Mediobanca S.p.A. (n.d.). Results and Presentations. Retrieved from https://www.mediobanca.com/en/investor-relations/results-presentations/results-and-presentations.html
- Mediobanca S.p.A. (n.d.). Press Releases. Retrieved from https://www.mediobanca.com/en/media-relations/press-releases/approvato-il-progetto-di-bilancio-2021-2022-e-la-dichiarazione-non-finanziaria-convocata-l-assemblea-ordinaria-dei-soci.html
- Nestlé. (2022). Annual Review. Retrieved from https://www.nestle.com/sites/default/files/2023-03/2022-annual-review-en.pdf
- Nestlé. (2022). Creating Shared Value Sustainability Report. Retrieved from https://www.nestle.com/sites/default/files/2023-03/creating-shared-value-sustainability-report-2022-en.pdf
- Nestlé. (2023). Bloomberg Gender Equality Index. Retrieved from https://www.nestle.com/sites/default/files/2023-10/bloomberg-gender-equality-index.pdf
- Nestlé. (n.d.). Sustainable Water Efficiency Operations. Retrieved from https://www.nestle.com/sustainability/water/sustainable-water-efficiency-operations
- Prada Group. (2022). Annual Report. Retrieved from https://www.pradagroup.com/content/dam/pradagroup/documents/Shareholderinformation/2023/inglese/annual-report-2022/e-Prada_Group_2022_Sustainability_Report.pdf
- Ralph Lauren Corporation. (2022). Annual Report. Retrieved from https://www.annualreports.com/HostedData/AnnualReports/PDF/NYSE_RL_2022.pdf
- Ralph Lauren Corporation. (2022). Global Citizenship and Sustainability Report. Retrieved from https://video.ralphlauren.com/202301/20230124-sustainability-citizenship-hub/2022-RL-GCSReport.pdf
- Ryanair Holdings plc. (2022). Annual Report. Retrieved from https://investor.ryanair.com/wp-content/uploads/2022/07/Ryanair-2022-Annual-Report.pdf
- Ryanair Holdings plc. (2022). Sustainability Report. Retrieved from https://corporate.ryanair.com/wp-content/uploads/2022/07/Ryanair-2022-Sustainability-Report-Interactive.pdf
- Samsung Electronics Co., Ltd. (2022). Business Report. Retrieved from https://images.samsung.com/is/content/samsung/assets/global/ir/docs/2022-4q-Business-Report.pdf
- Samsung Electronics Co., Ltd. (2023). Environmental Report. Retrieved from https://www.gstatic.com/gumdrop/sustainability/google-2023-environmental-report.pdf
- Samsung Electronics Co., Ltd. (2023). Sustainability Report. Retrieved from https://www.samsung.com/global/sustainability/media/pdf/Samsung_Electronics_Sustainability_Report_2023_ENG.pdf
- Samsung Electronics Co., Ltd. (n.d.). Resource Efficiency. Retrieved from https://www.samsung.com/hk_en/sustainability/environment/resource-efficiency/
- Shiseido Co., Ltd. (n.d.). Annual Report. Retrieved from https://corp.shiseido.com/report/en/2022/pdf/report-en.pdf
- Shiseido Co., Ltd. (n.d.). Sustainability Report. Retrieved from https://corp.shiseido.com/sustainabilityreport/en/2022/pdf/sustainability-report-en.pdf
- Starbucks Corporation. (2022). Annual Report. Retrieved from https://s22.q4cdn.com/869488222/files/doc_financials/2023/ar/Starbucks-FY22-Annual-Report.pdf
- Starbucks Corporation. (2023). Global Environmental and Social Impact Report. Retrieved from https://stories.starbucks.com/uploads/2023/06/Starbucks-2022-Global-Environmental-and-Social-Impact-Report.pdf
- Stellantis N.V. (2022). Annual Report. Retrieved from https://www.stellantis.com/content/dam/stellantis-corporate/investors/financial-reports/Stellantis-NV-20221231-Annual-Report.pdf
- Stellantis N.V. (2022). CSR Report. Retrieved from https://www.stellantis.com/content/dam/stellantis-corporate/sustainability/csr-disclosure/stellantis/2022/Stellantis-2022-CSR-Report.pdf
- The Estée Lauder Companies Inc. (2022). Form 10-K. Retrieved from https://media.elcompanies.com/files/e/estee-laudercompanies/universal/investors/investor-resources/toolkit/form-10k-08242022.pdf?_ga=2.218505503.702053567.1715261871-1231626960.1713941597&_gl=1*1ryx7rq*_ga*MTIzMTYyNjk2MC4xNzEzOTQxNTk3*_ga_V9QZ4PSDRY*MTcxNTI2MTg3MS4zLjEuMTcxNTI2MTg4Mi40OS4wLjA.
- The Estée Lauder Companies Inc. (2022). Sustainability Report. Retrieved from https://media.elcompanies.com/files/e/estee-lauder-companies/universal/our-commitments/2022-si-s-report/sis-report-2022.pdf?_ga=2.143052339.702053567.1715261871-1231626960.1713941597&_gl=1*1wxpwdu*_ga*MTIzMTYyNjk2MC4xNzEzOTQxNTk3*_ga_V9QZ4PSDRY*MTcxNTI2MTg3MS4zLjEuMTcxNTI2MjU4NC41My4wLjA.
- The Estée Lauder Companies Inc. (2023). Sustainability Report. Retrieved from https://media.elcompanies.com/files/e/estee-lauder-companies/universal/our-commitments/2023-si-s-report/sis-report-2023.pdf?_ga=2.248540289.702053567.1715261871-1231626960.1713941597&_gl=1*1nvsvq6*_ga*MTIzMTYyNjk2MC4xNzEzOTQxNTk3*_ga_V9QZ4PSDRY*MTcxNTI2MTg3MS4zLjEuMTcxNTI2Mjk0NC42MC4wLjA.
- Toyota Motor Corporation. (n.d.). Finance. Retrieved from https://global.toyota/en/ir/finance/
- Toyota Motor Corporation. (n.d.). Sustainability Report. Retrieved from https://global.toyota/pages/global_toyota/sustainability/report/sdb/sdb23_en.pdf
- Volkswagen AG. (2022). Annual Report. Retrieved from https://annualreport2022.volkswagenag.com/_assets/downloads/entire-vw-ar22.pdf
- Volkswagen AG. (2022). Group Sustainability Report. Retrieved from https://www.volkswagen-group.com/en/publications/more/group-sustainability-report-2022-1644
- Volkswagen AG. (2022). SASB Index. Retrieved from https://www.volkswagen-group.com/en/publications/more/sasb-index-2022-2196/download?disposition=attachment
- Yahoo Finance. (n.d.). Yahoo Finance. Retrieved from https://finance.yahoo.com/
References
- Arvidsson, s. & Dumay, J. (2021). Corporate ESG reporting quantity, quality and performance: Where to now for environmental policy and practice? [CrossRef]
- Babynina, L., Kartashova, L., Busalov, D., Chernitsova, K., & Akhmedov, F. (2023). Effective ESG Transformation of Russian Companies in the New Environment: Current Challenges and Priorities. Academic Journal of Interdisciplinary Studies. [CrossRef]
- Broadstock, D. C., Chan, K., Cheng, L. T.W., & Wang, X. (2020). The role of ESG performance during times of financial crisis: Evidence from COVID-19 in China. Finance Research Letters. [CrossRef]
- Catalyst. (2020). The Bottom Line: Connecting Corporate Performance and Gender Diversity.
- Clement, A., Robinot, E., Trespeuch, L. (2023). The use of ESG scores in academic literature: a systematic literature review. Journal of Enterprising Communities: People and Places in the Global Econom. [CrossRef]
- Cohen, S. R. (2020). Impact: Reshaping Capitalism to Drive Real Change.
- Crace, L. & Gehman, J. (2023). What Really Explains ESG Performance? Disentangling the Asymmetrical Drivers of the Triple Bottom Line (Vol. 36). Organization & Environment 2023. [CrossRef]
- Eccles, R. G. Ioannou, I., & Serafeim, G. (2011). The Impact of a Corporate Culture of Sustainability on Corporate Behavior and Performance. Harvard Business School.
- Eccles, R. G. Ioannou, I., & Serafeim, G. (2014). The impact of corporate sustainability on Organizational Processes and performance.
- Eccles, R. G. & Serafeim, G. (2013). Innovation for a sustainable strategy.
- Eccles, R. G. Serafeim, G., & Krzus, M. P. (2011). Market Interest in Nonfinancial Information. Journal of applied corporate finance. [CrossRef]
- Elkington, J. (2004). Enter the Triple Bottom line. In The triple bottom line: does it all add up?
- Freiberg, D. Rogers, J., & Serafeim, G. (2020). How ESG Issues Become Financially Material to Corporations and Their Investors. Harvard Business School.
- Friedea, G., Buschb, T., Bassenb, A. (2015). ESG and financial performance: aggregated evidence from more than 2000 empirical studies. Journal of Sustainable Finance Investment. [CrossRef]
- Fulton, M., Kahn, B., Sharples, C. (2012). Sustainable investing: Establishing long-term value and performance. Available at SSRN 2222740.
- Halbritter, G. & Dorfleitner, g. (2015). The wages of social responsibility — where are they? A critical review of ESG investing. Review of Financial Economics.
- Huang, D. Z.X. (2019). Environmental, social and governance (ESG) activity and firm performance: a review and consolidation. Accounting Finance. [CrossRef]
- Kotsantonis, S., Pinne, C., Serafeim, G. (2016). ESG Integration in Investment Management: Myths and Realities. Journal of applied corporate finance. [CrossRef]
- Kotsantonis, S. Pinne, C., & Serafeim, G. (2019). Four things no one will tell you about ESG data. Journal of applied corporate finance. [CrossRef]
- Linnenluecke, M. K. (2021). Environmental, social and governance (ESG) performance in the context of multinational business research. Multinational Business Review. [CrossRef]
- McKinsey Company. (2020). Diversity Wins: How Inclusion Matters.
- Menicucci, E., Paolucci, G. (2022). ESG dimensions and bank performance: an empirical investigation in Italy. Emerald Publishing Limited. [CrossRef]
- Miralles-Quirós, M. M., Miralles-Quirós, J. L., Valente Gonçalves, L. M. (2018). The Value Relevance of Environmental, Social, and Governance Performance: The Brazilian Case. Sustainability. [CrossRef]
- MSCI. (2021). MSCI World ESG Leaders Index.
- Porter, M. E. Serafeim, G., & Kramer, M. (2019). Where ESG fails? Institutional Investor.
- Sadiqa, M., Ngob, T. Q., Pantameec, A. A., Khudoykulovd, K., Ngane, T. T., Tan, L. P. (2022). The role of environmental social and governance in achieving sustainable development goals: evidence from ASEAN countries. Economic Research-Ekonomska Istraživanja.
- Serafeim, G. & Yoon, A. (2011). The Consequences of Mandatory Corporate Sustainability Reporting.
- Serafeim, G., Yoon, A. (2022). Stock price reactions to ESG news: the role of ESG ratings and disagreement. Review of Accounting Studies (2023). [CrossRef]
- Serafeim, G. & Yoon, A. (2022). Which Corporate ESG News Does the Market React To? Financial Analysts Journal. [CrossRef]
- Setyahuni, S. W., Handayani, R. S. (2020). On the value relevance of information on environmental, social, and governance (ESG): an evidence from Indonesia. Journal of critical reviews.
- Shmelev, S. (Ed.). (2019). Sustainable Cities Reimagined: Multidimensional Assessment and Smart Solutions. Routledge. Retrieved from https://www.routledge.com/Sustainable-Cities-Reimagined-Multidimensional- Assessment-and-Smart-Solutions/Shmelev/p/book/9780367254209.
- Shmelev S. E., Shmeleva I. A. (2018). Global urban sustainability assessment: A multidimensional approach. Sustainable Development, Volume 26, Issue 6, pp. 904-920.
- Shmelev S. E., Shmeleva I.A. (2019) Multidimensional sustainability benchmarking for smart megacities, Cities, 92, pp. 134-163.
- Shmelev, S.E.; Lefievre, N.; Saadi, N.; Shmeleva, I.A. Interdisciplinary Linkages among Sustainability Dimensions in the Context of European Cities and Regions Research. Sustainability, 2023; 15, 1473. [Google Scholar] [CrossRef]
- Strekalina, A., Zakirova, R., Shinkarenko, A., Vatsaniuk, E. (2023). The Impact of ESG Ratings on Financial Performance of the Companies: Evidence from BRICS Countries. Journal of Corporate Finance Research. [CrossRef]
- Wang, N. Pan, H., & Du, S. (2022). How do ESG practices create value for businesses? Research review and prospects. Sustainability Accounting, Management and Policy Journal. [CrossRef]
- Wendy, S. (2017). Sustainable entrepreneurship and B corps. Business Strategy and the Environment. [CrossRef]
Figure 1.
ESG Economic Index and Average Share Prices (FY2022).
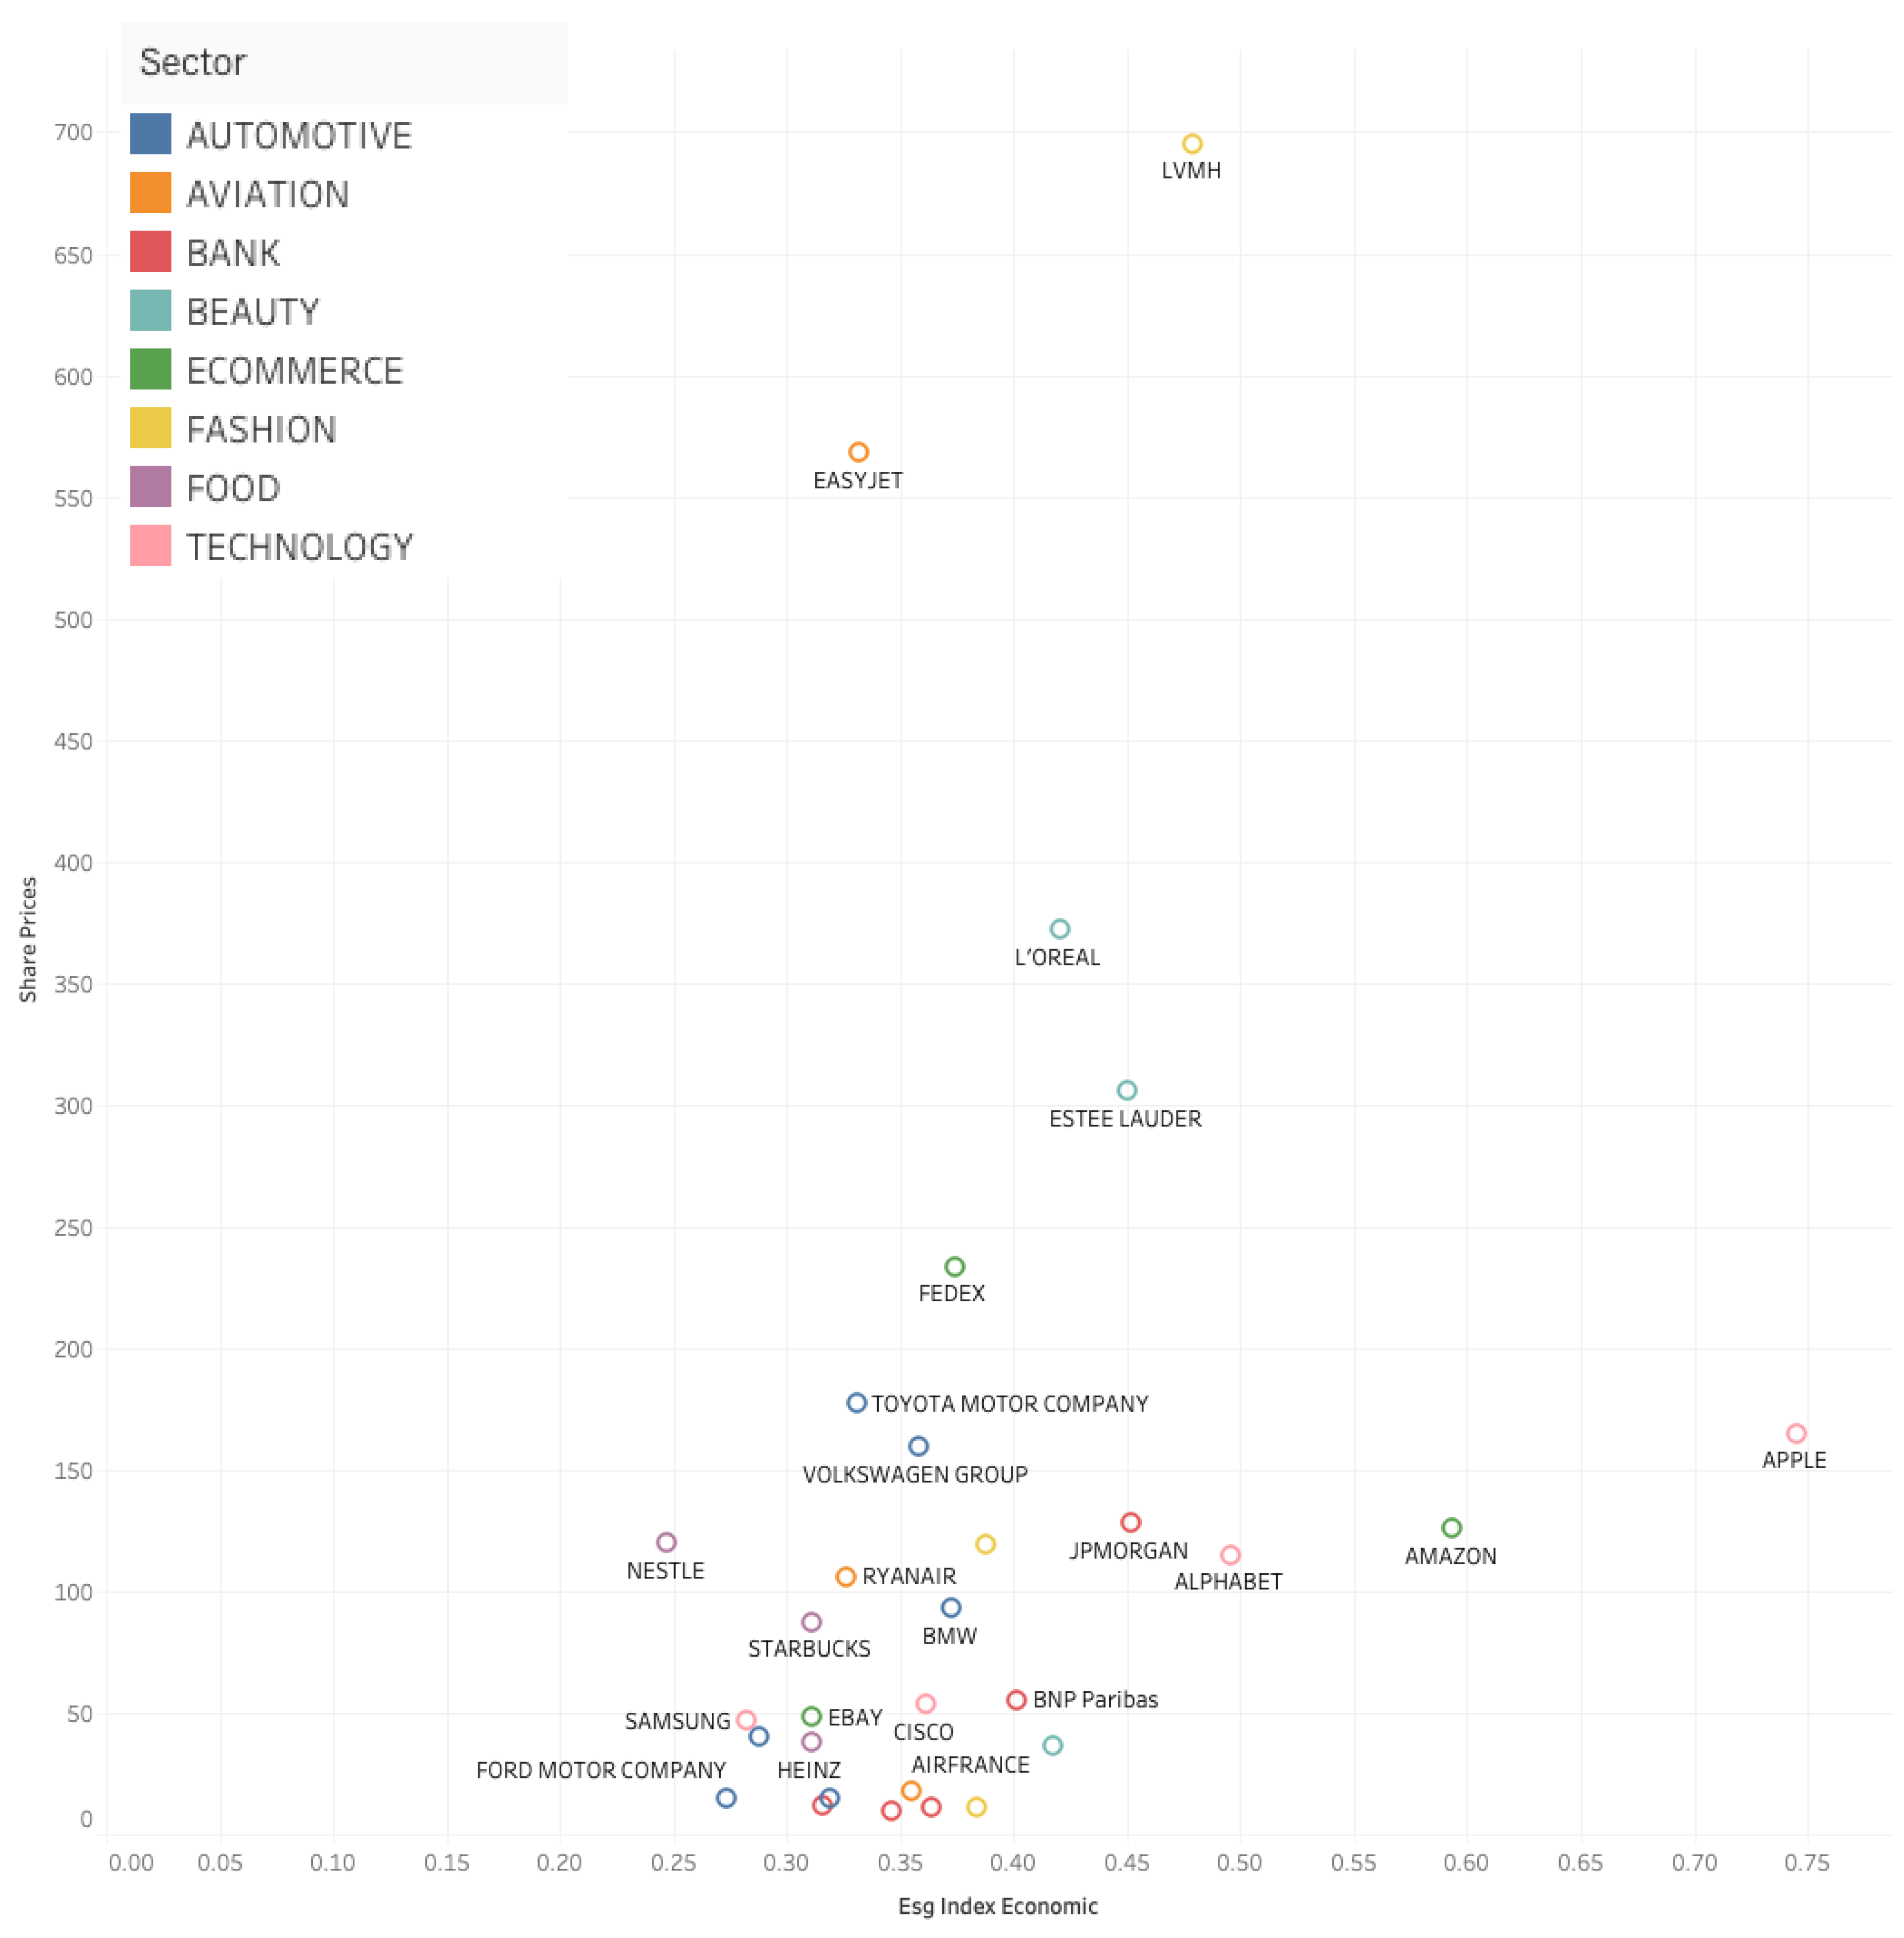
Figure 2.
ESG Environmental and Average Share Prices (FY2022).
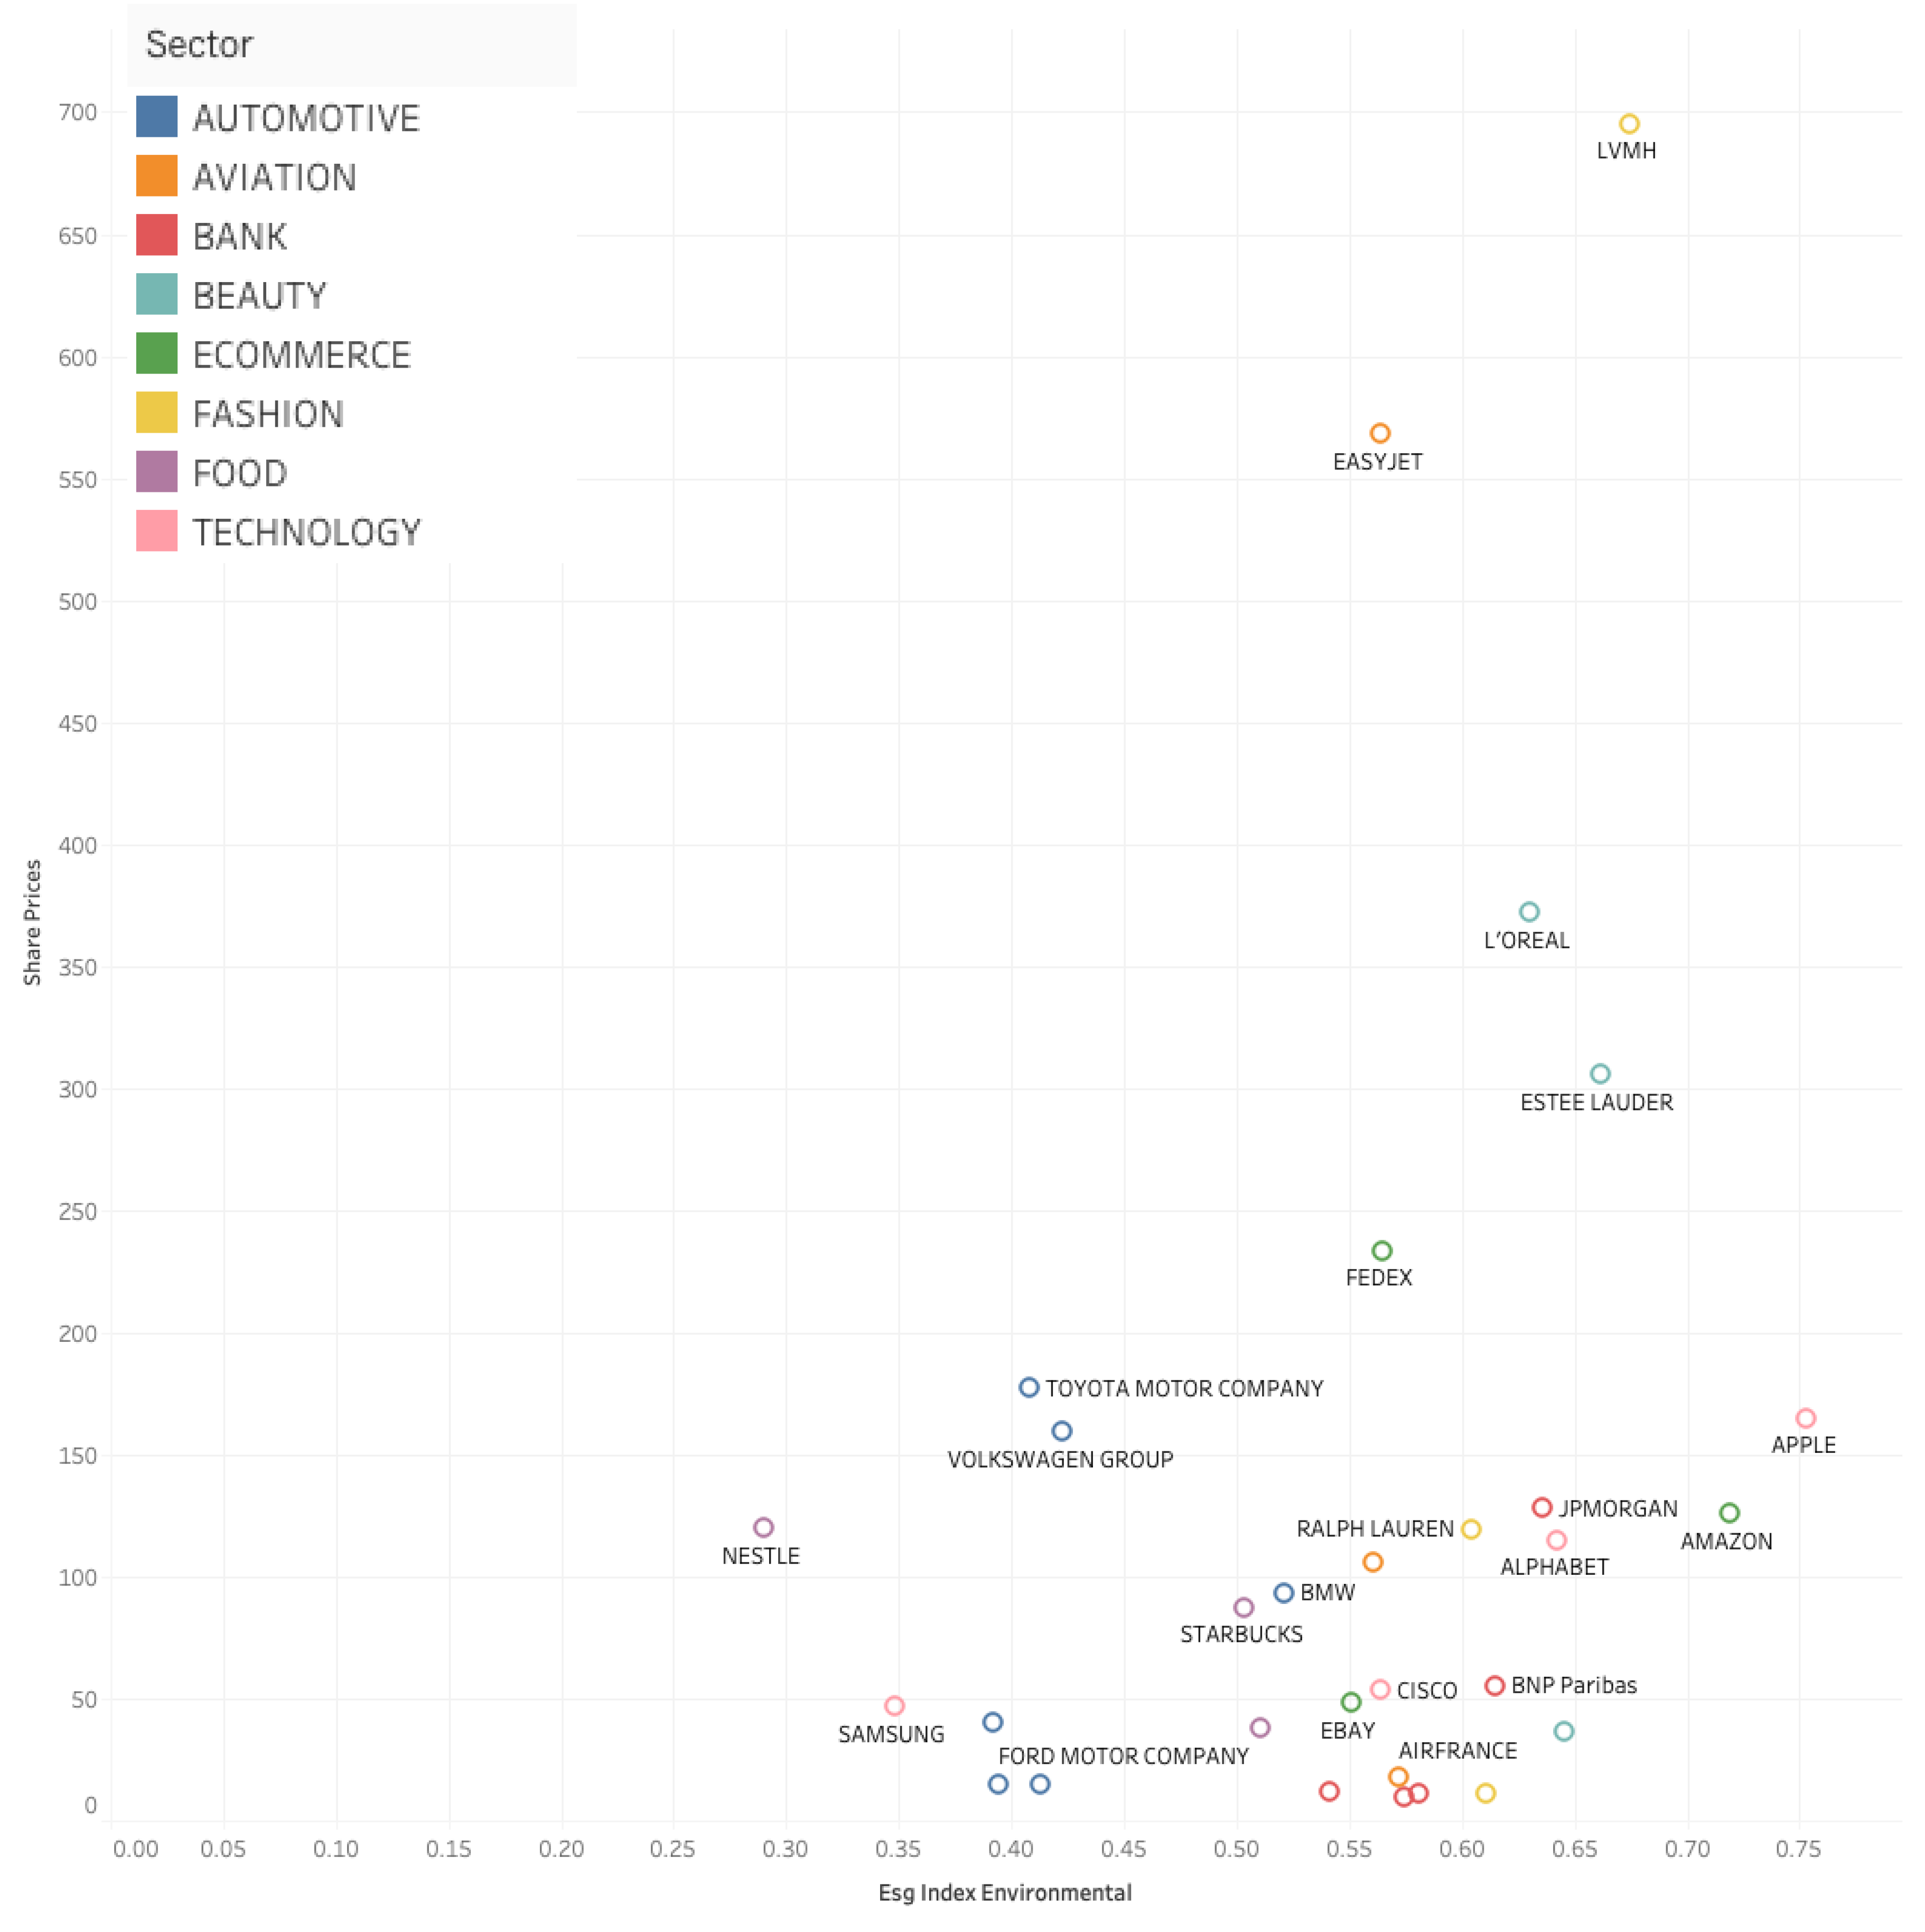
Figure 3.
ESG Social Index and Average Share Prices (FY2022).
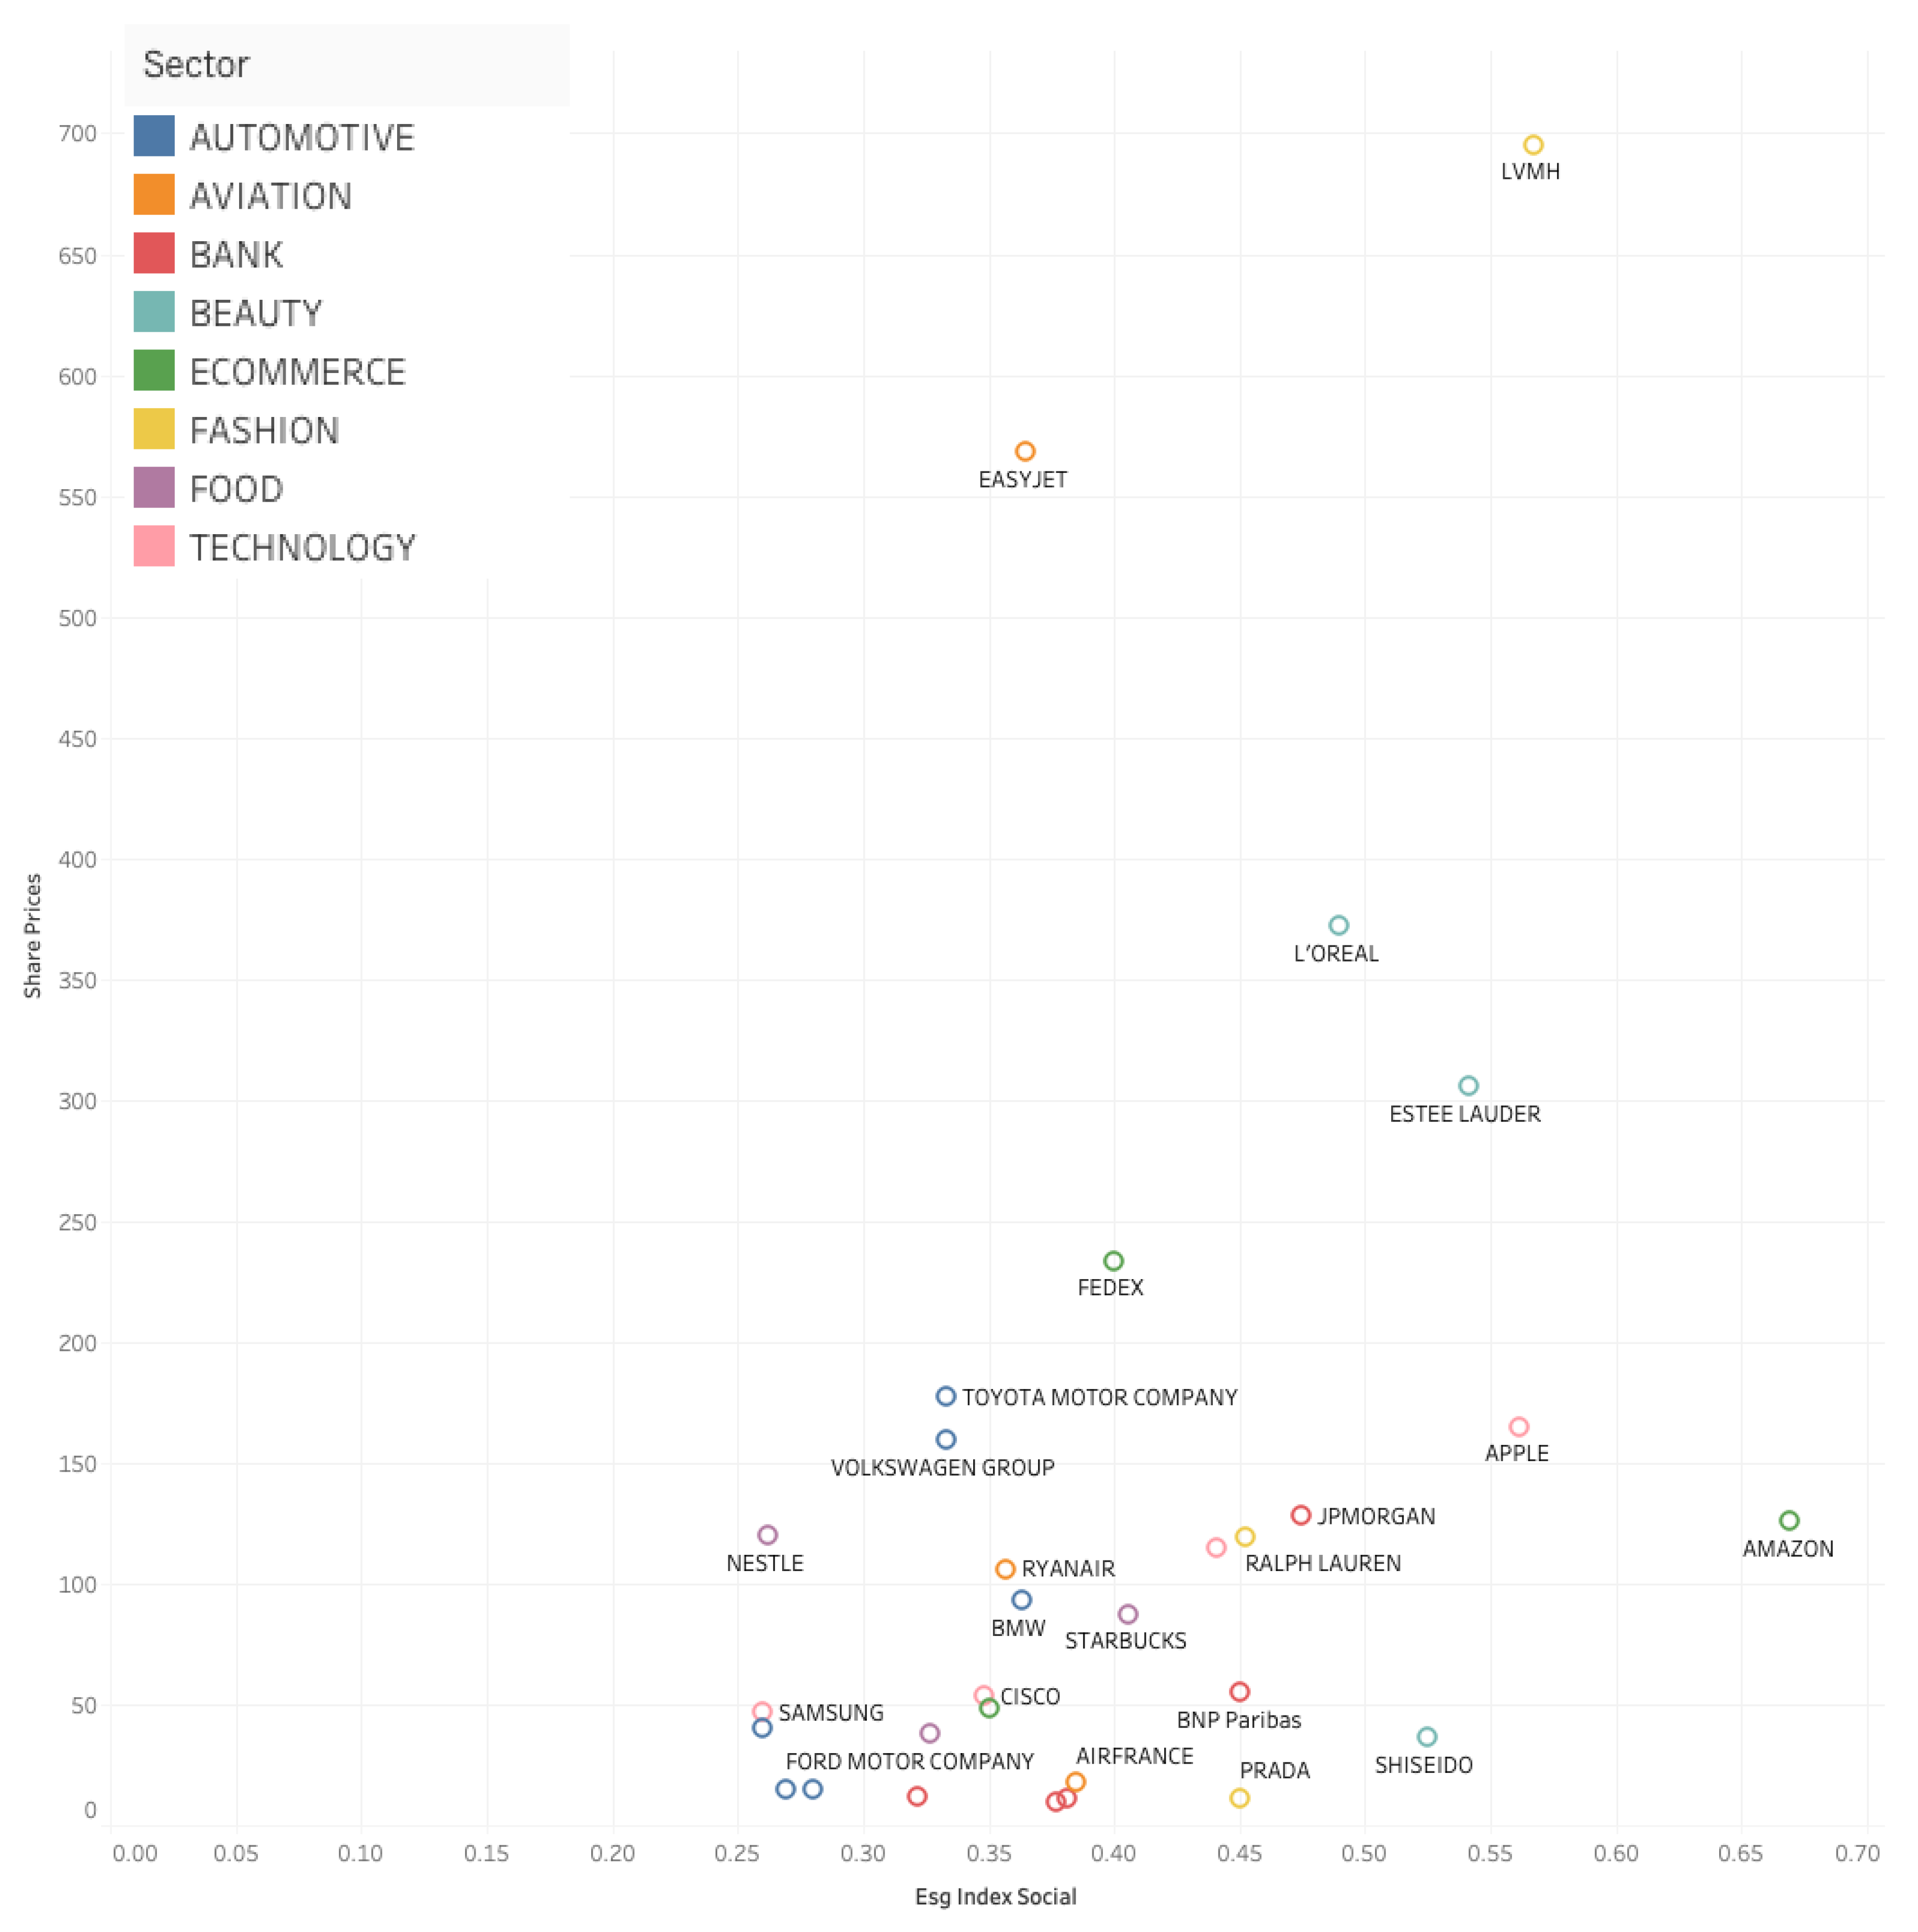
Figure 4.
ESG Equivalent Index and Average Share Prices (FY2022).
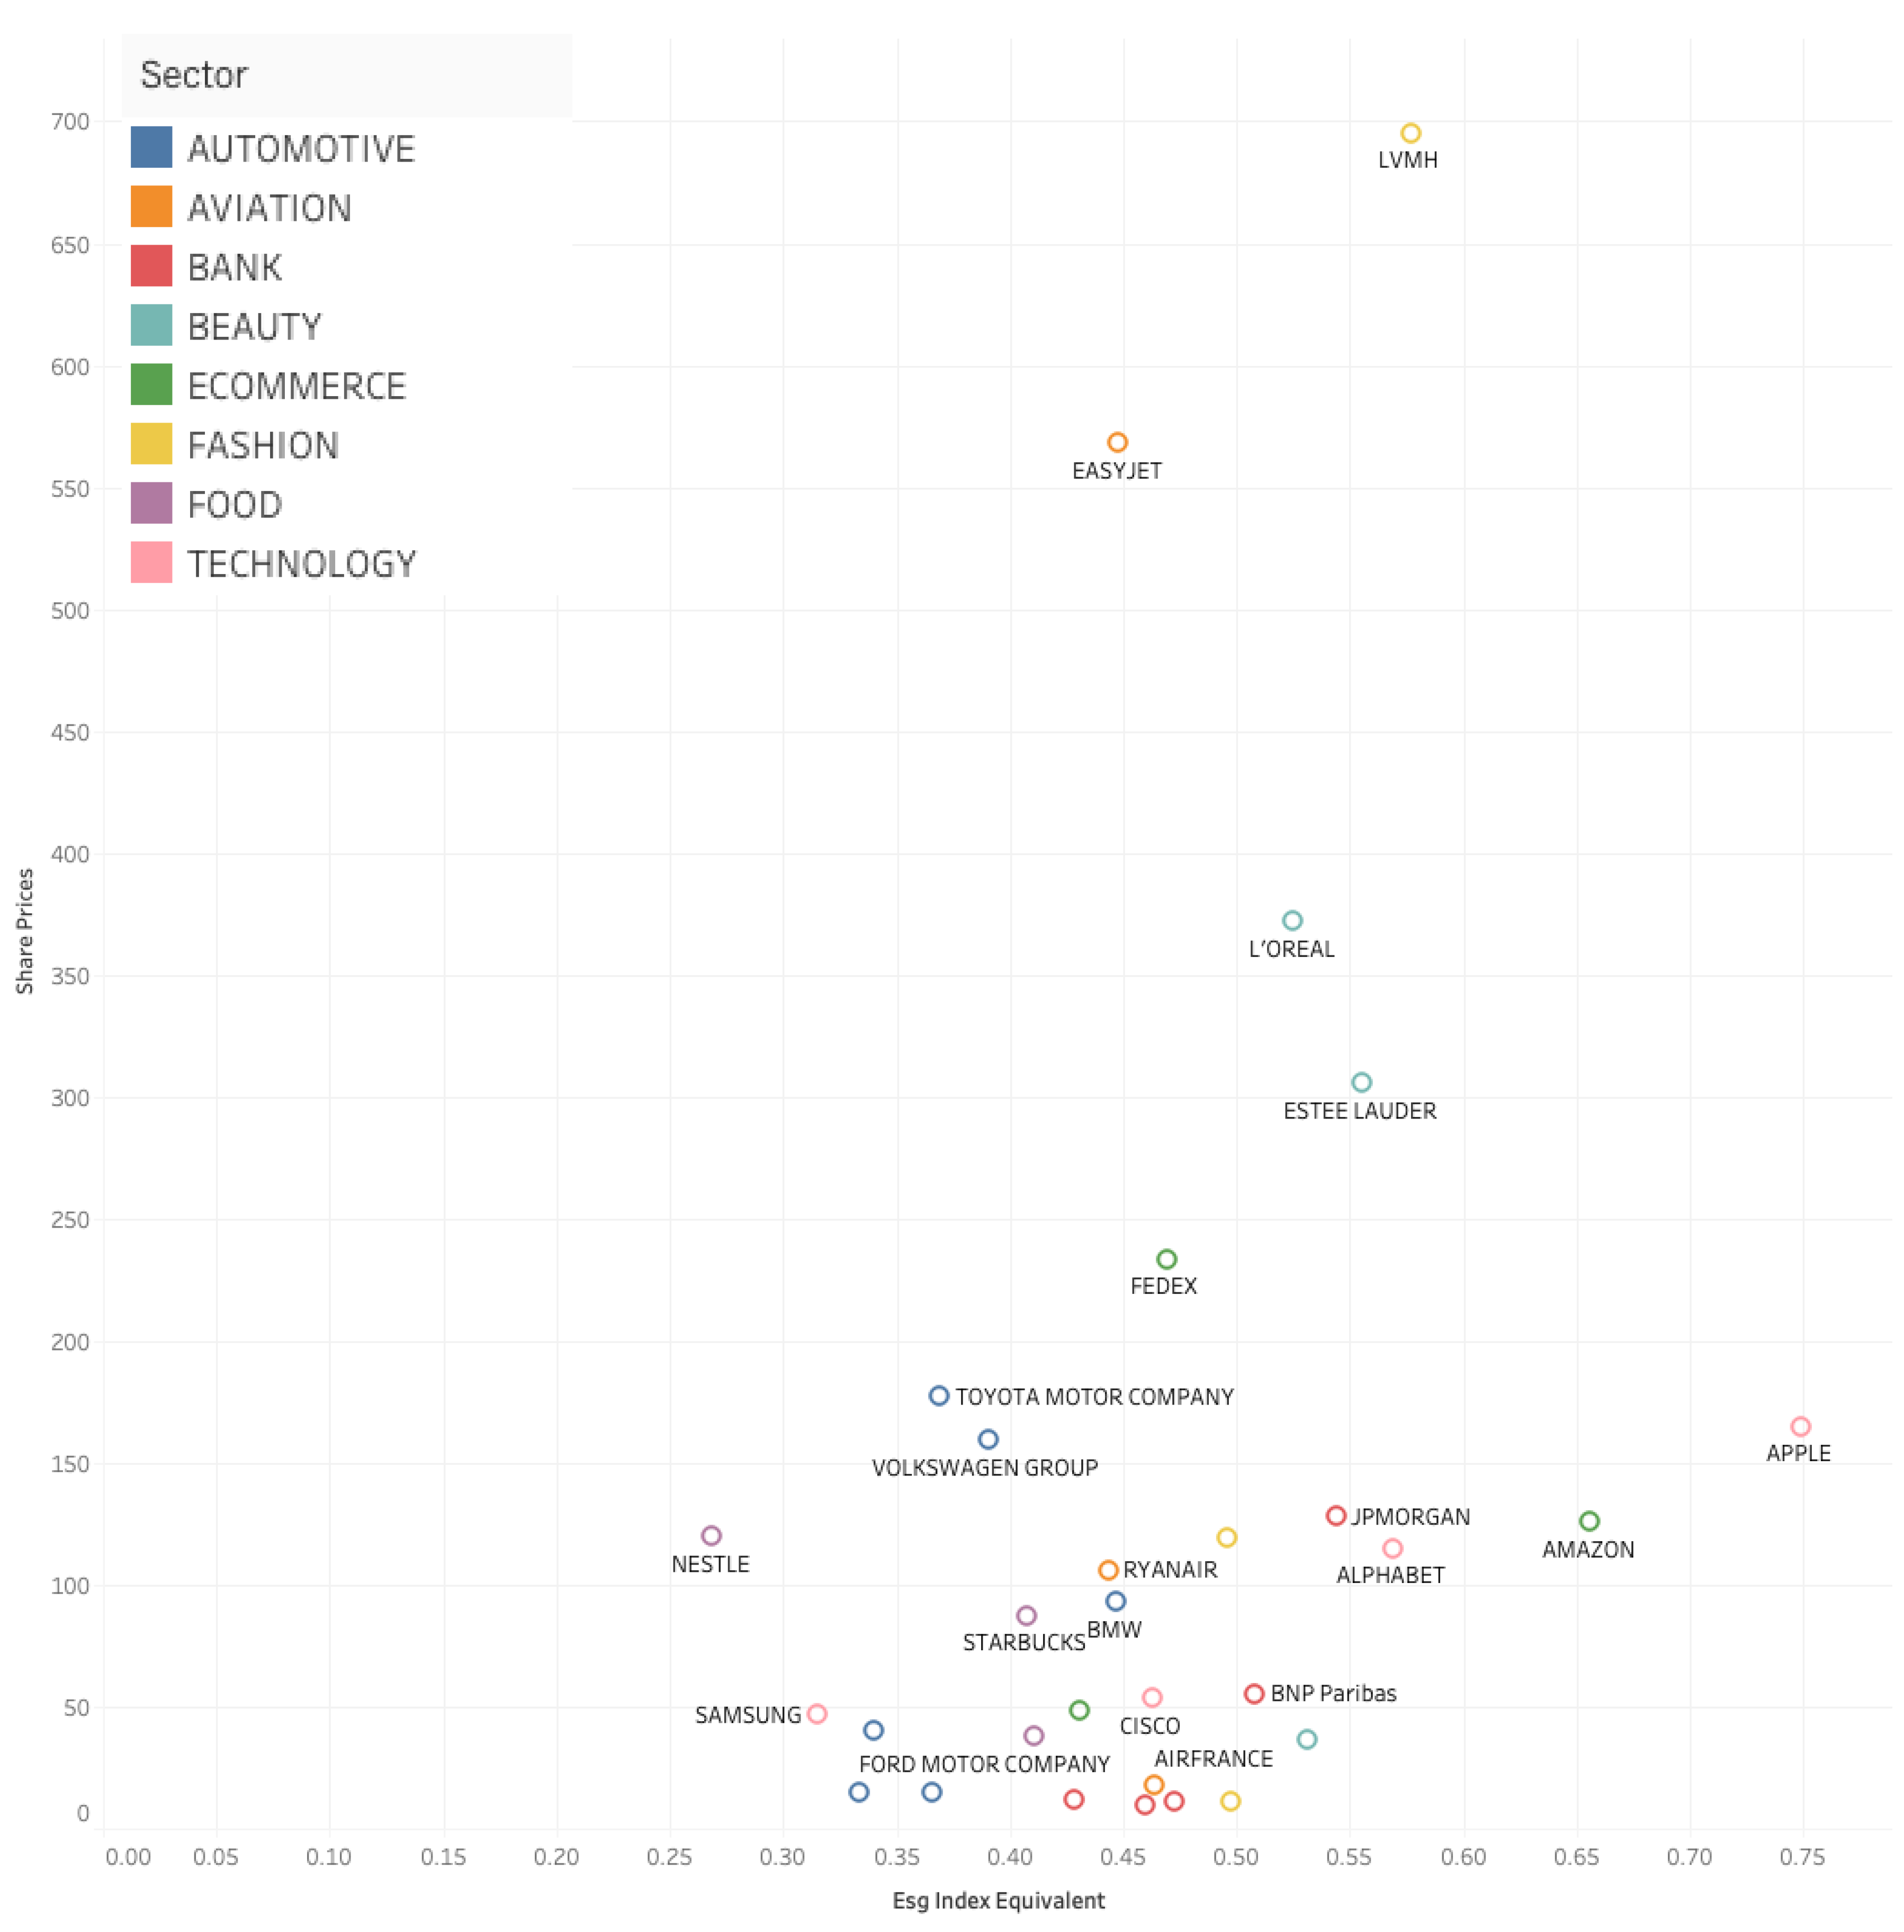
Figure 5.
ESG Economic Index and ROE.
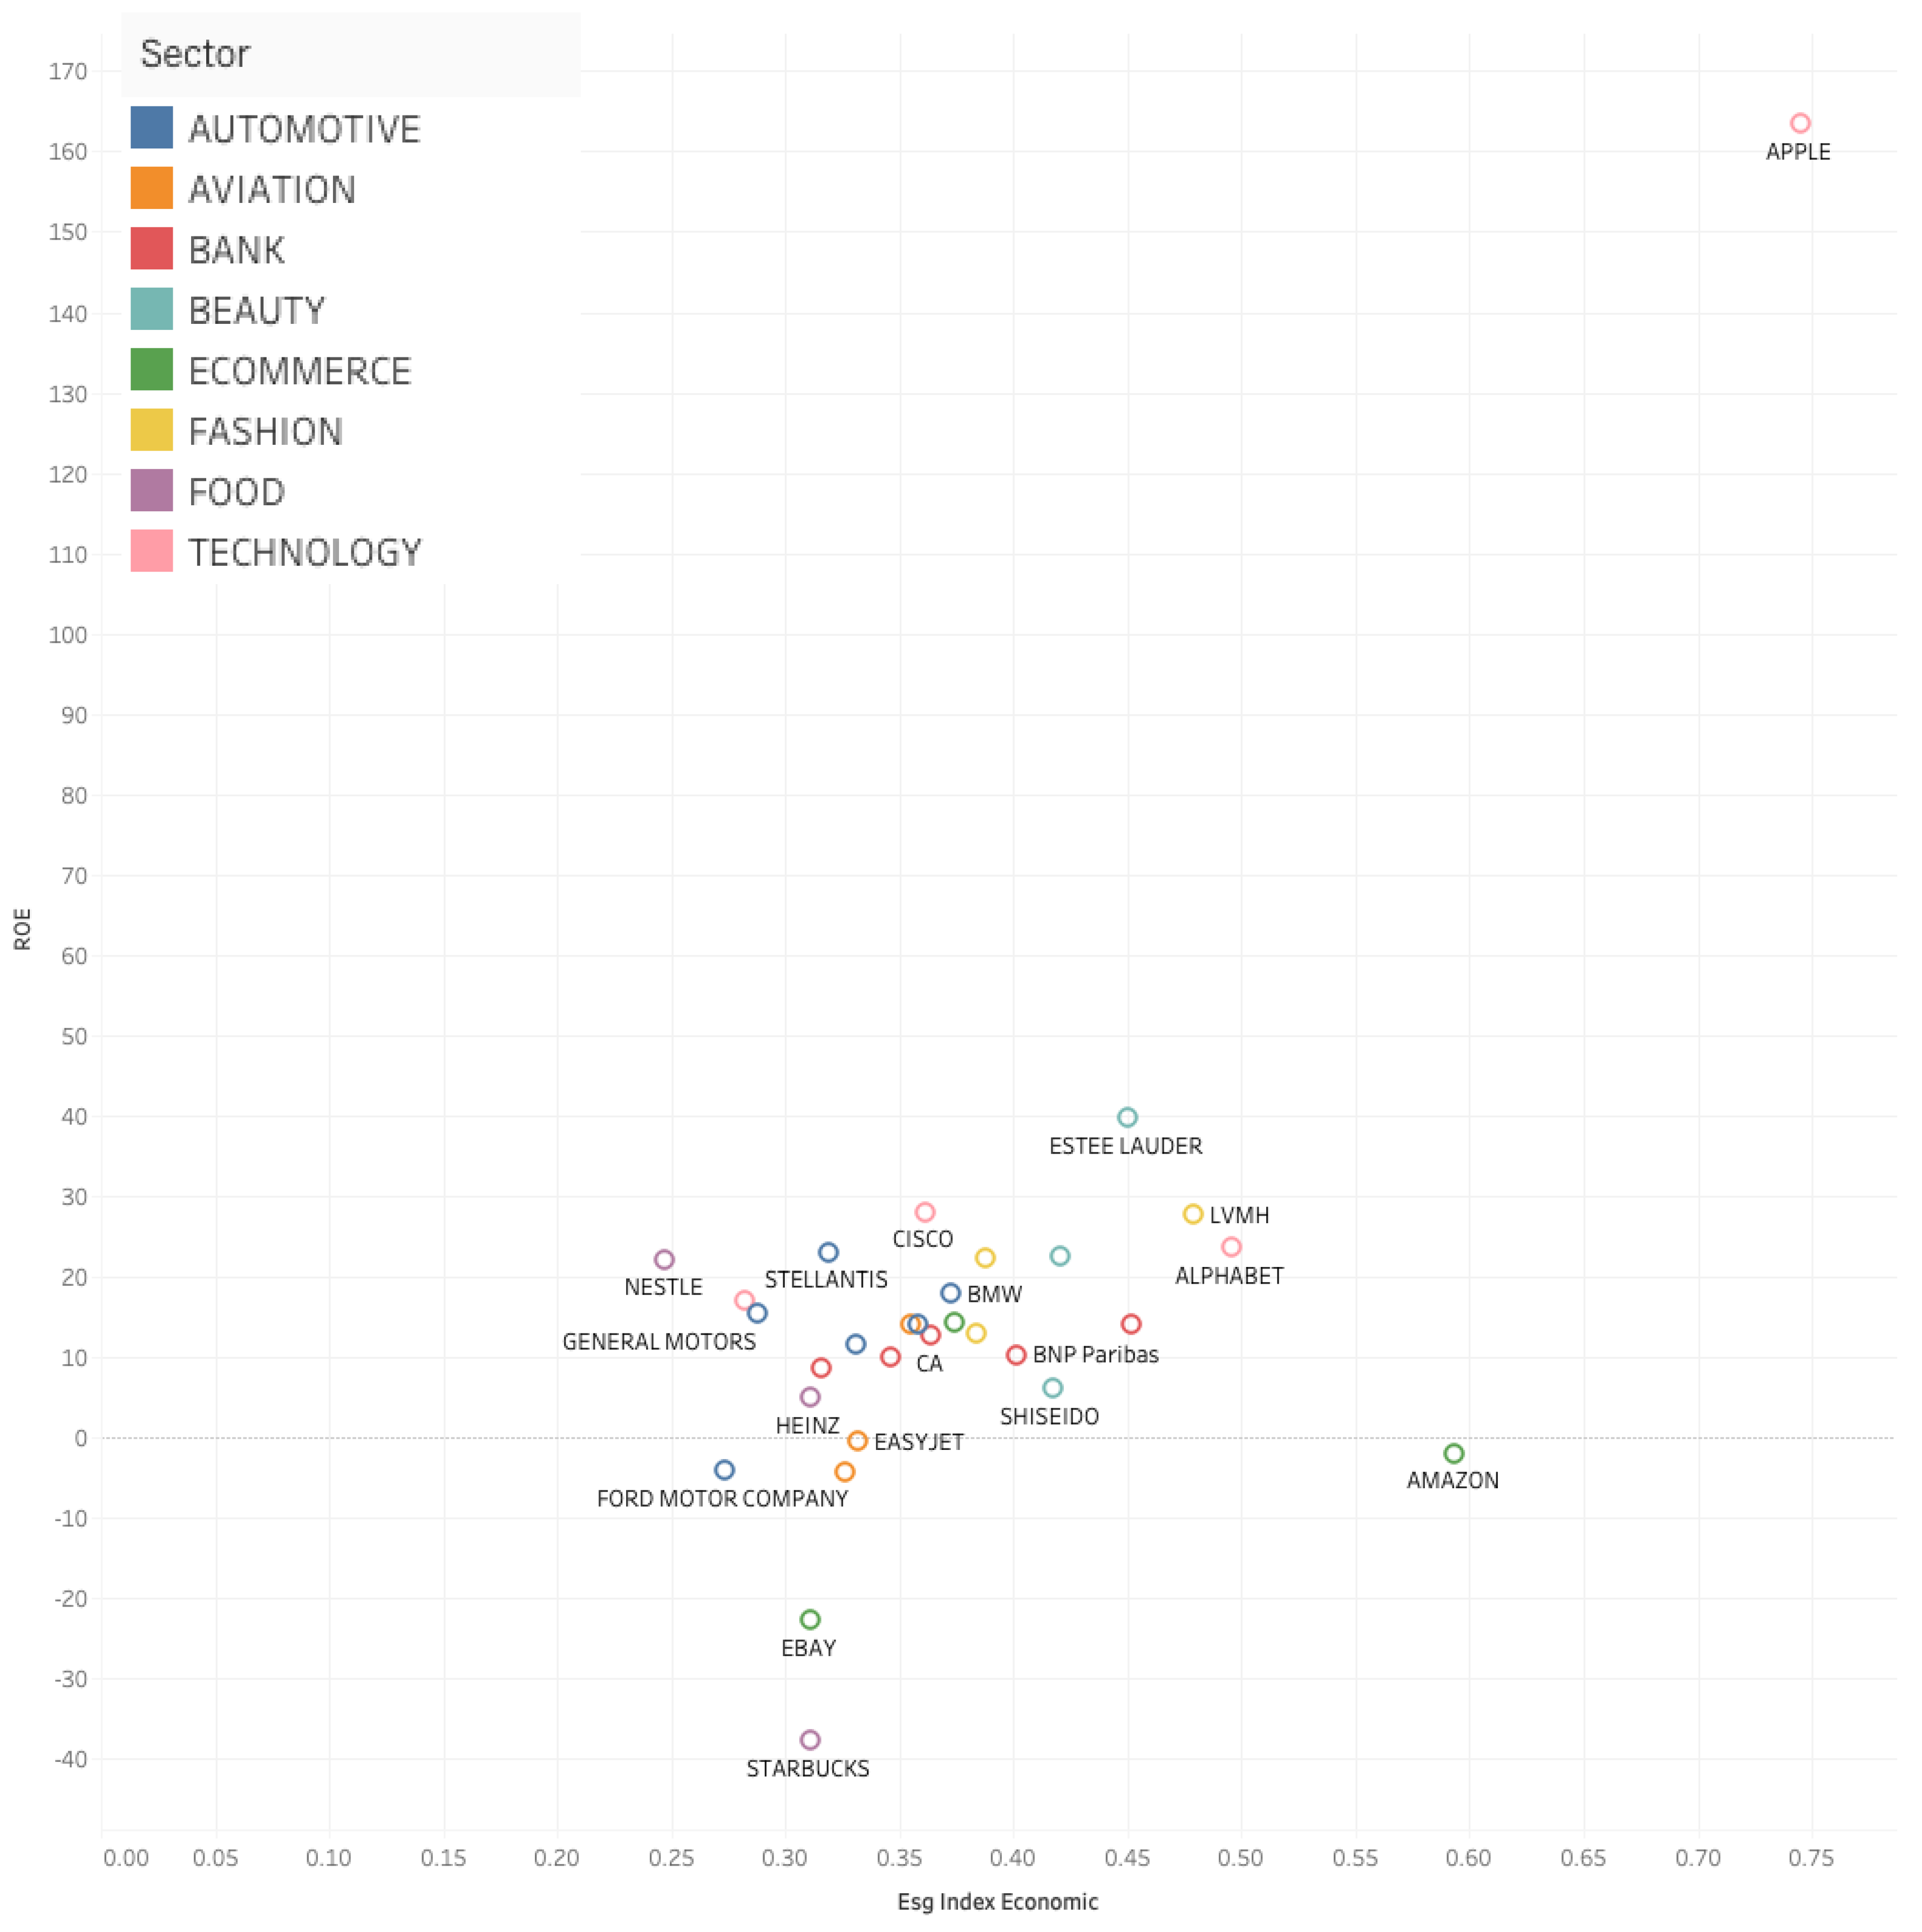
Figure 6.
ESG Environmental Index and ROE.
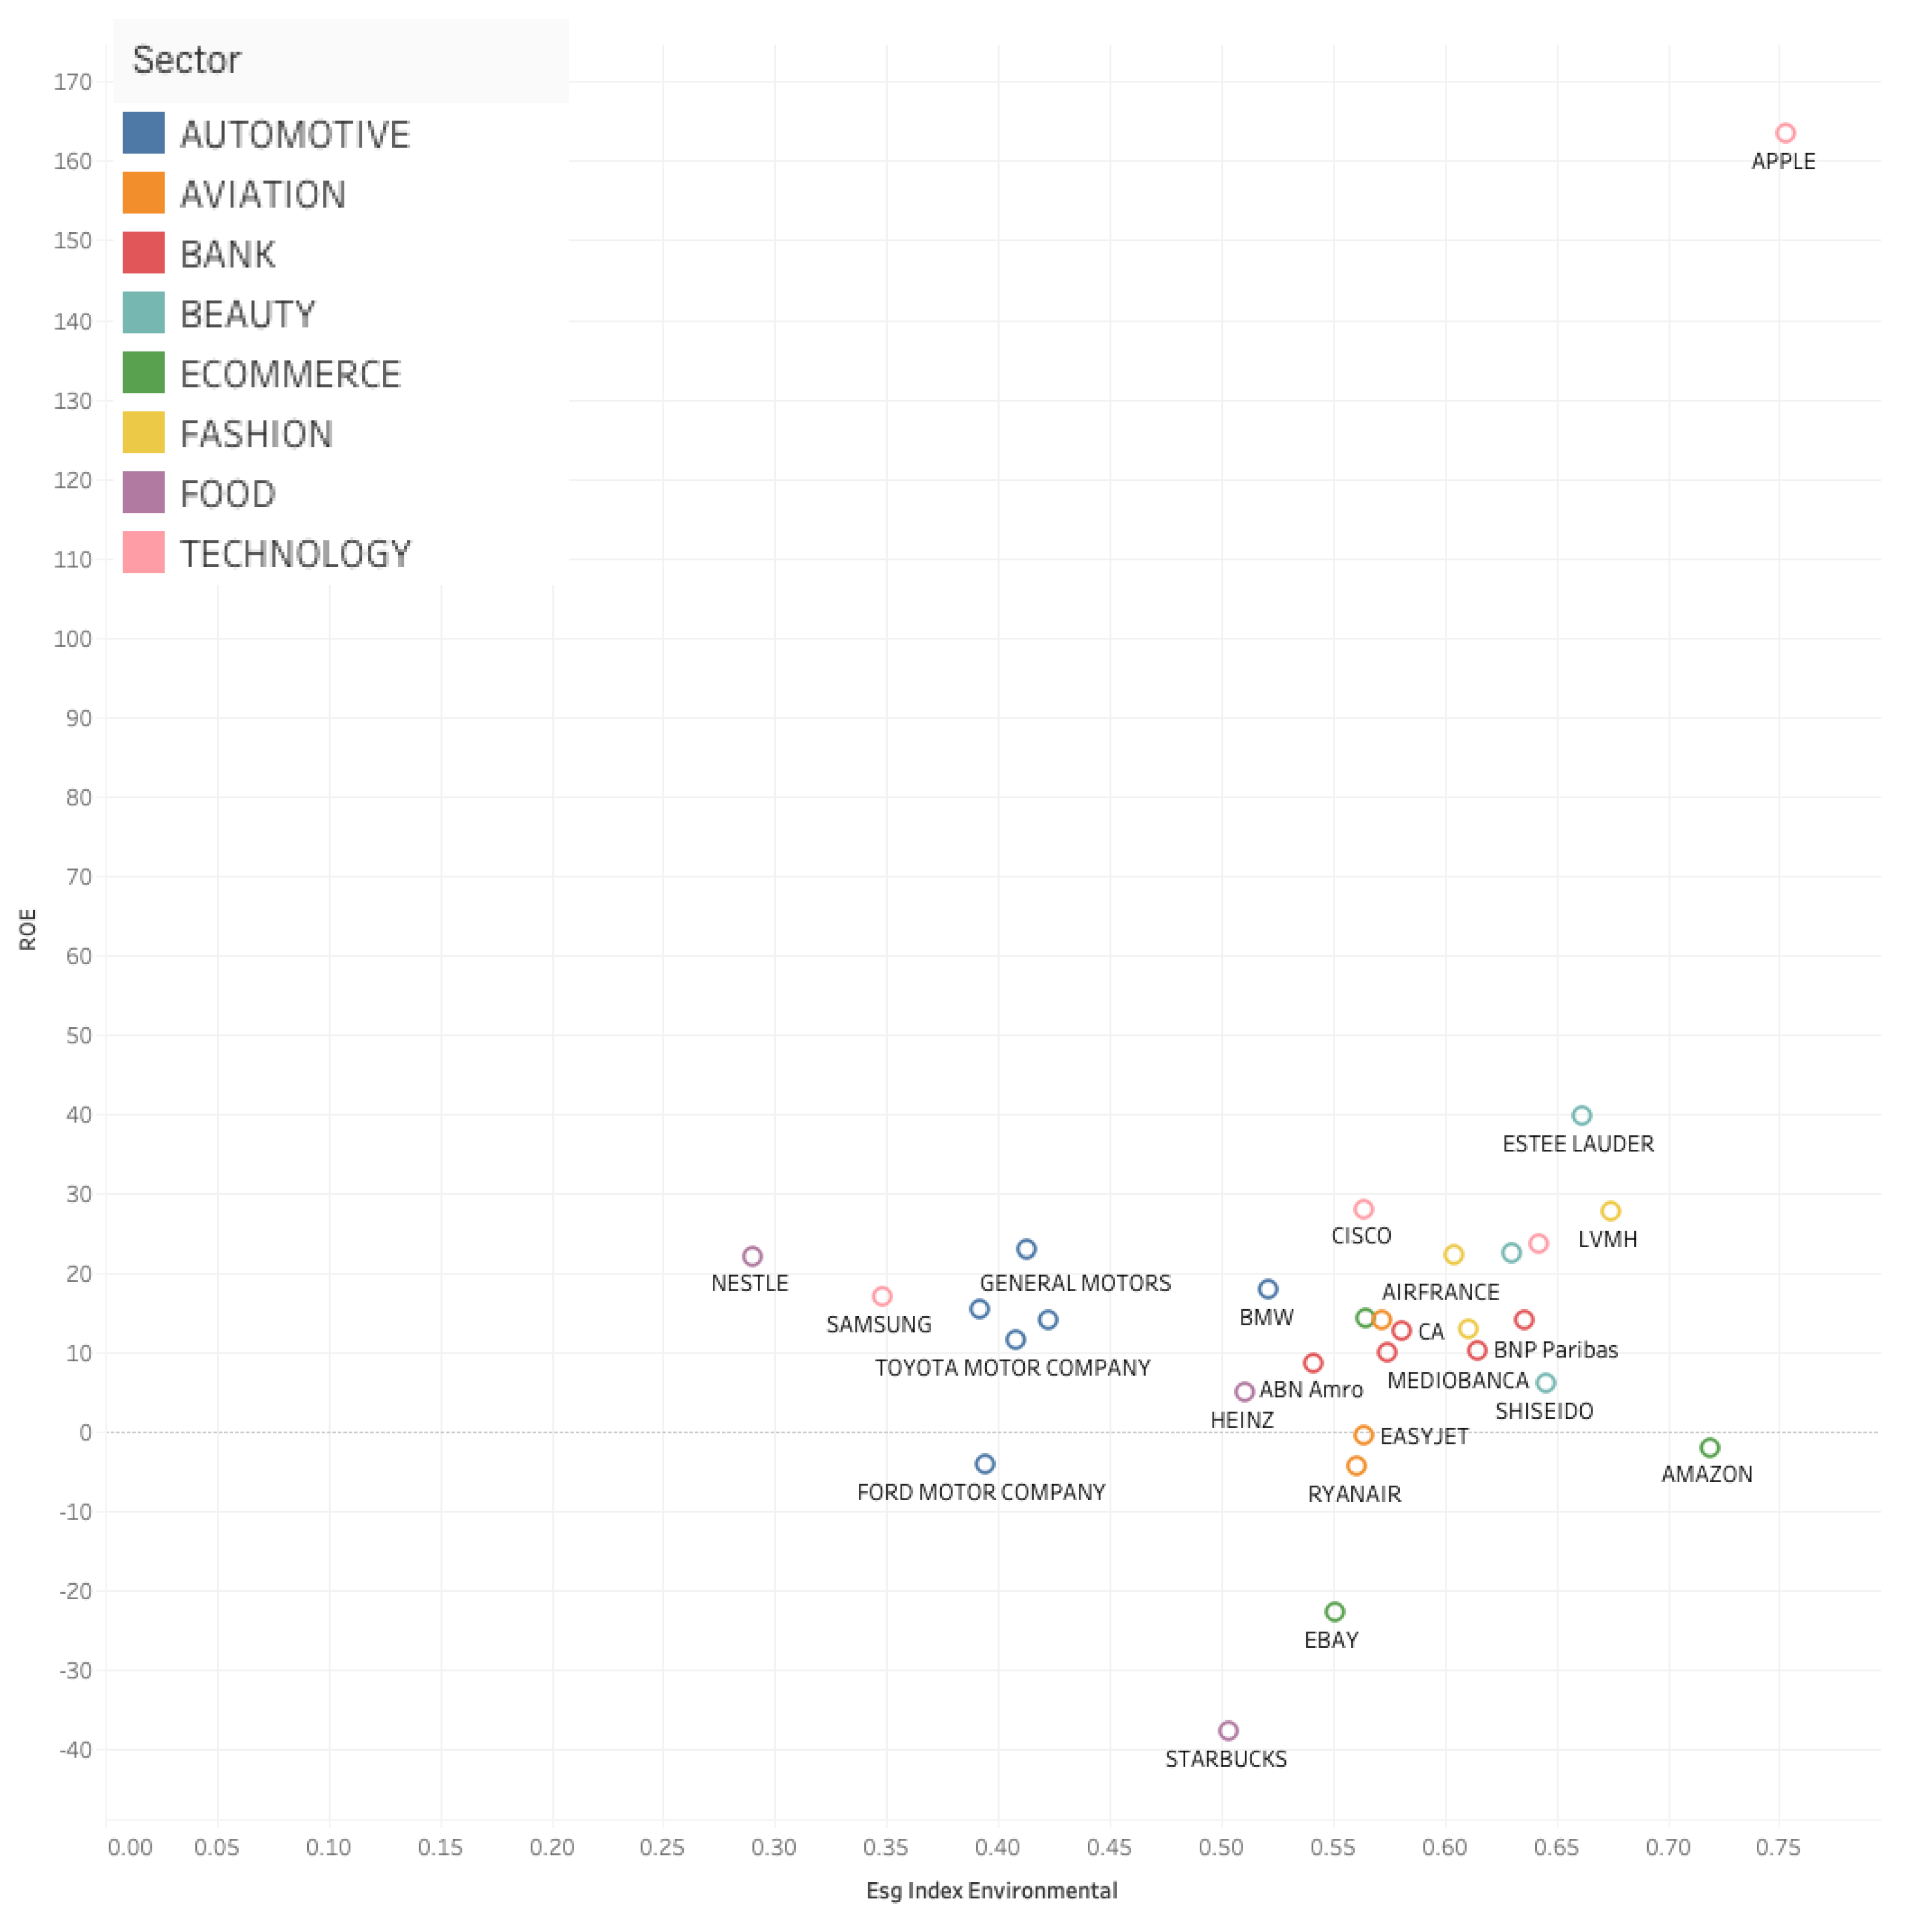
Figure 7.
ESG Social Index and ROE.
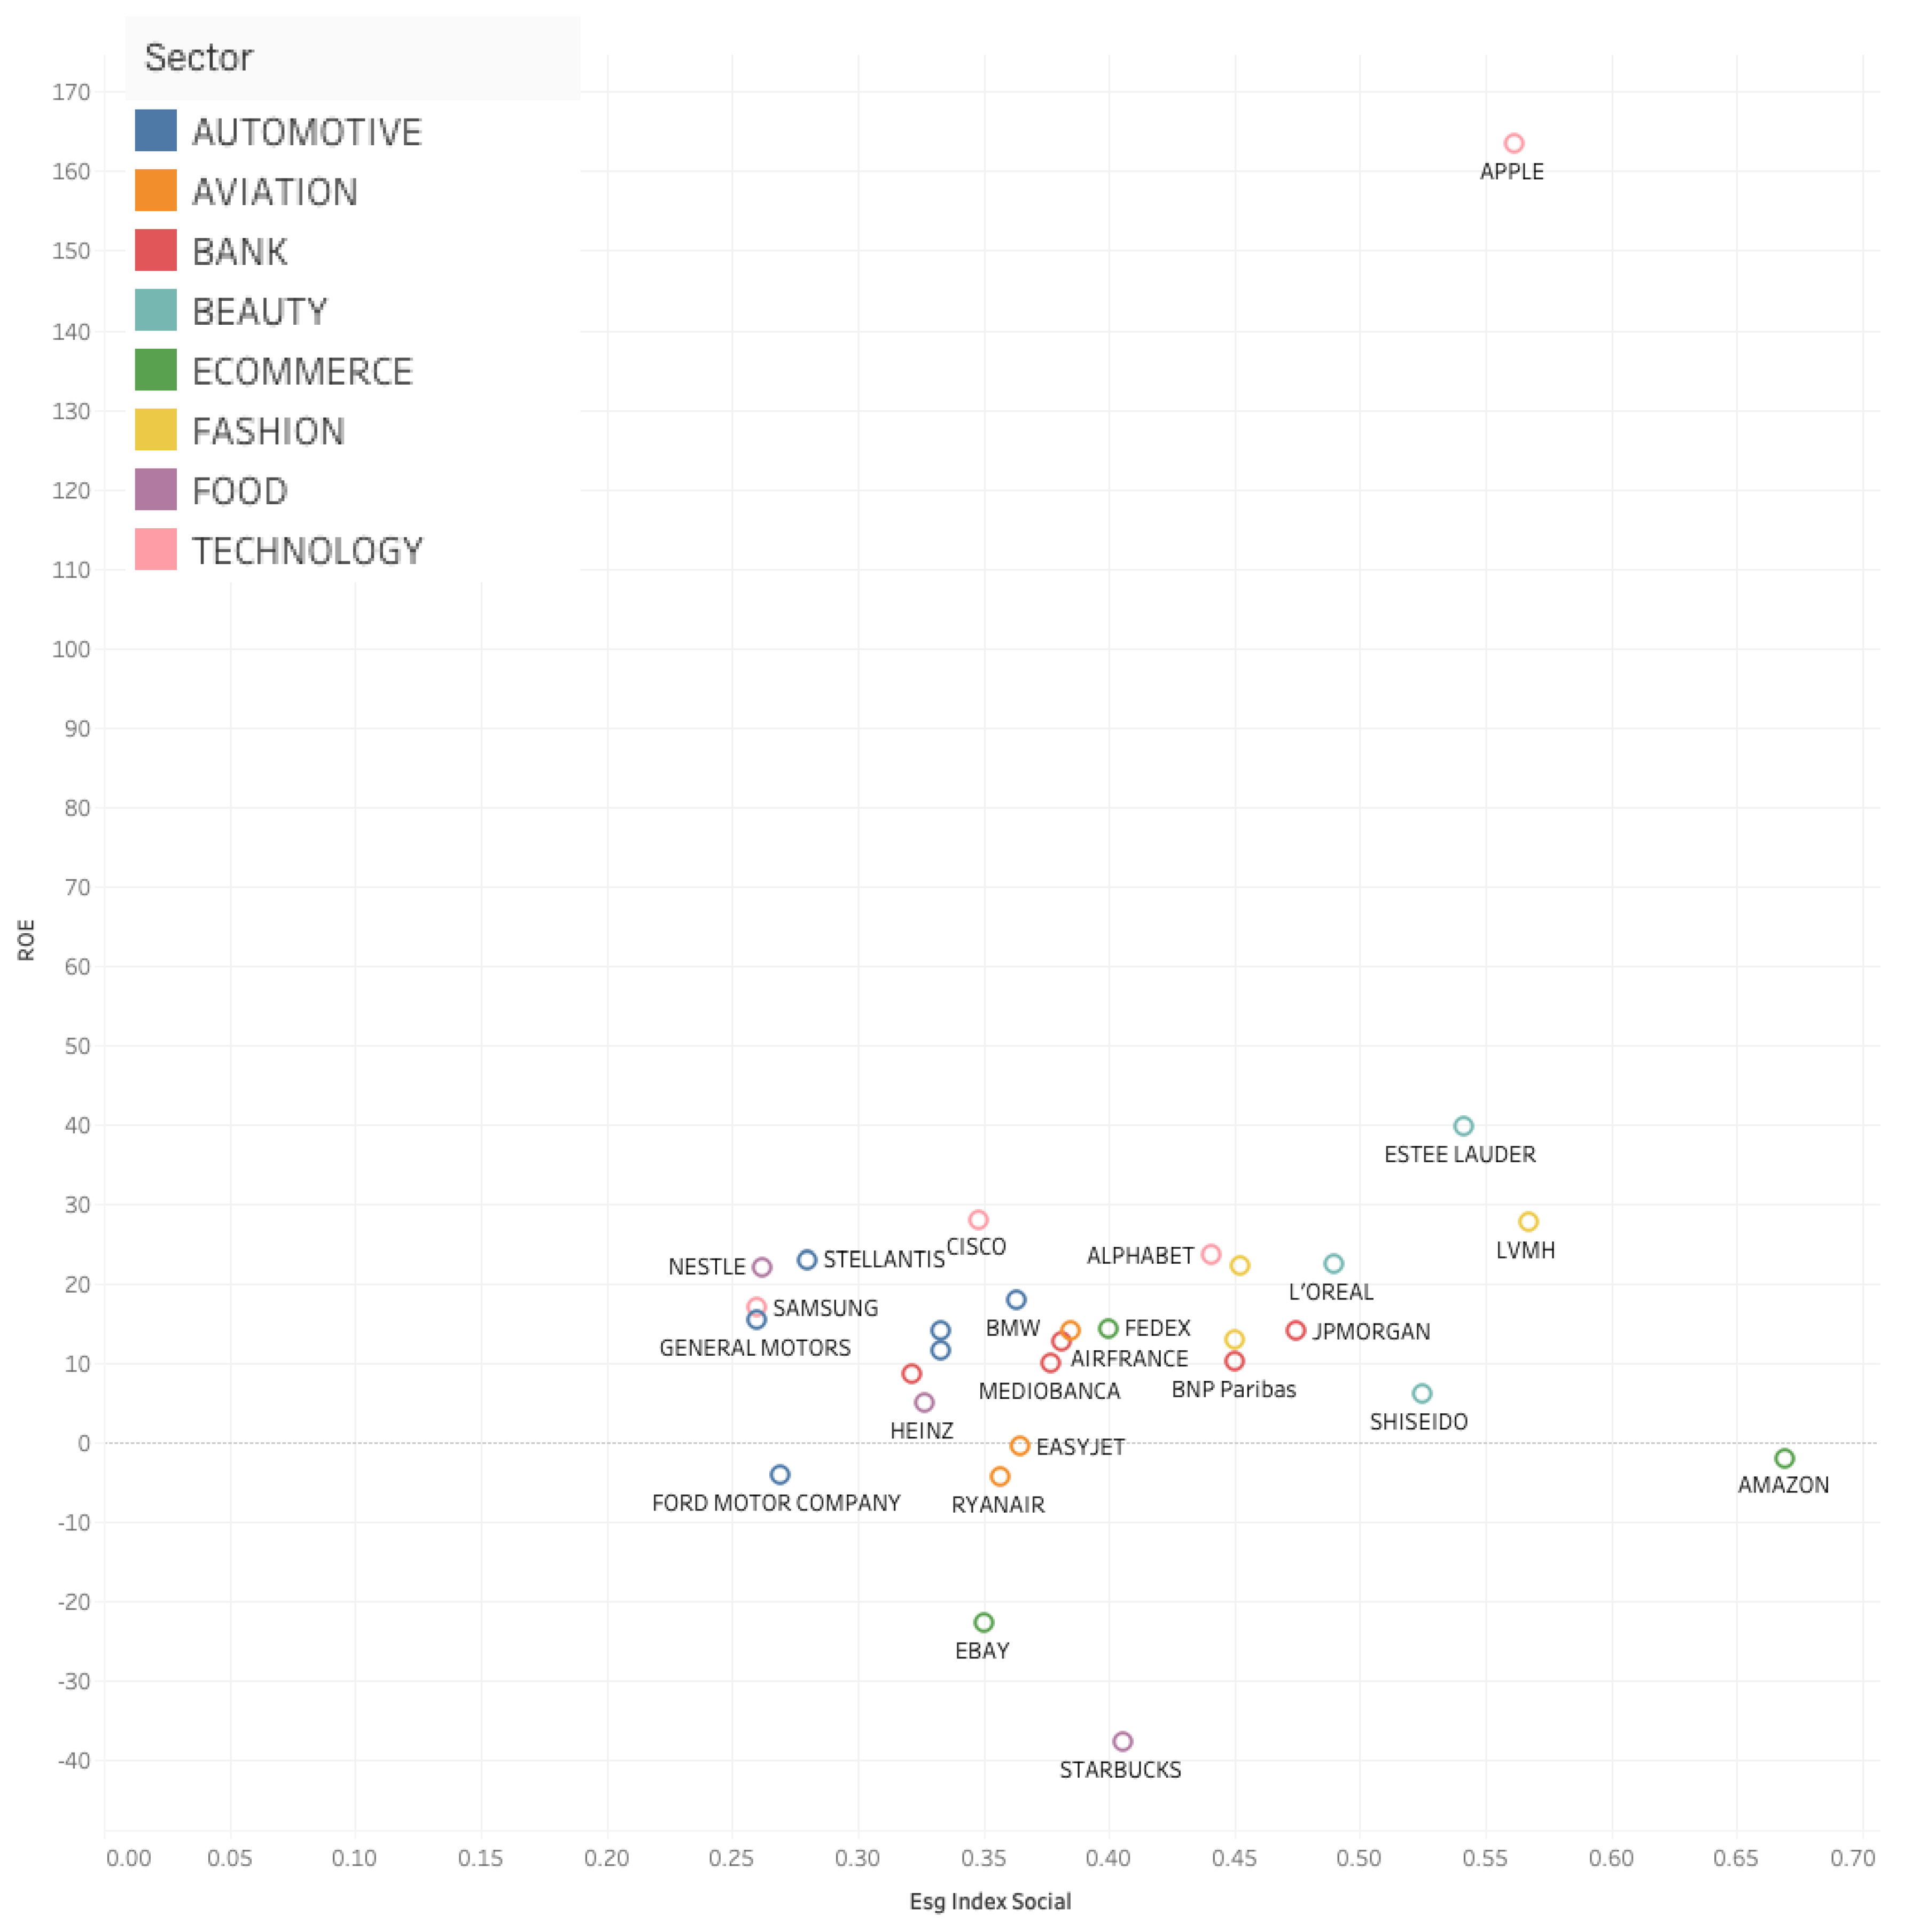
Figure 9.
Employees/Turnover and ROE.
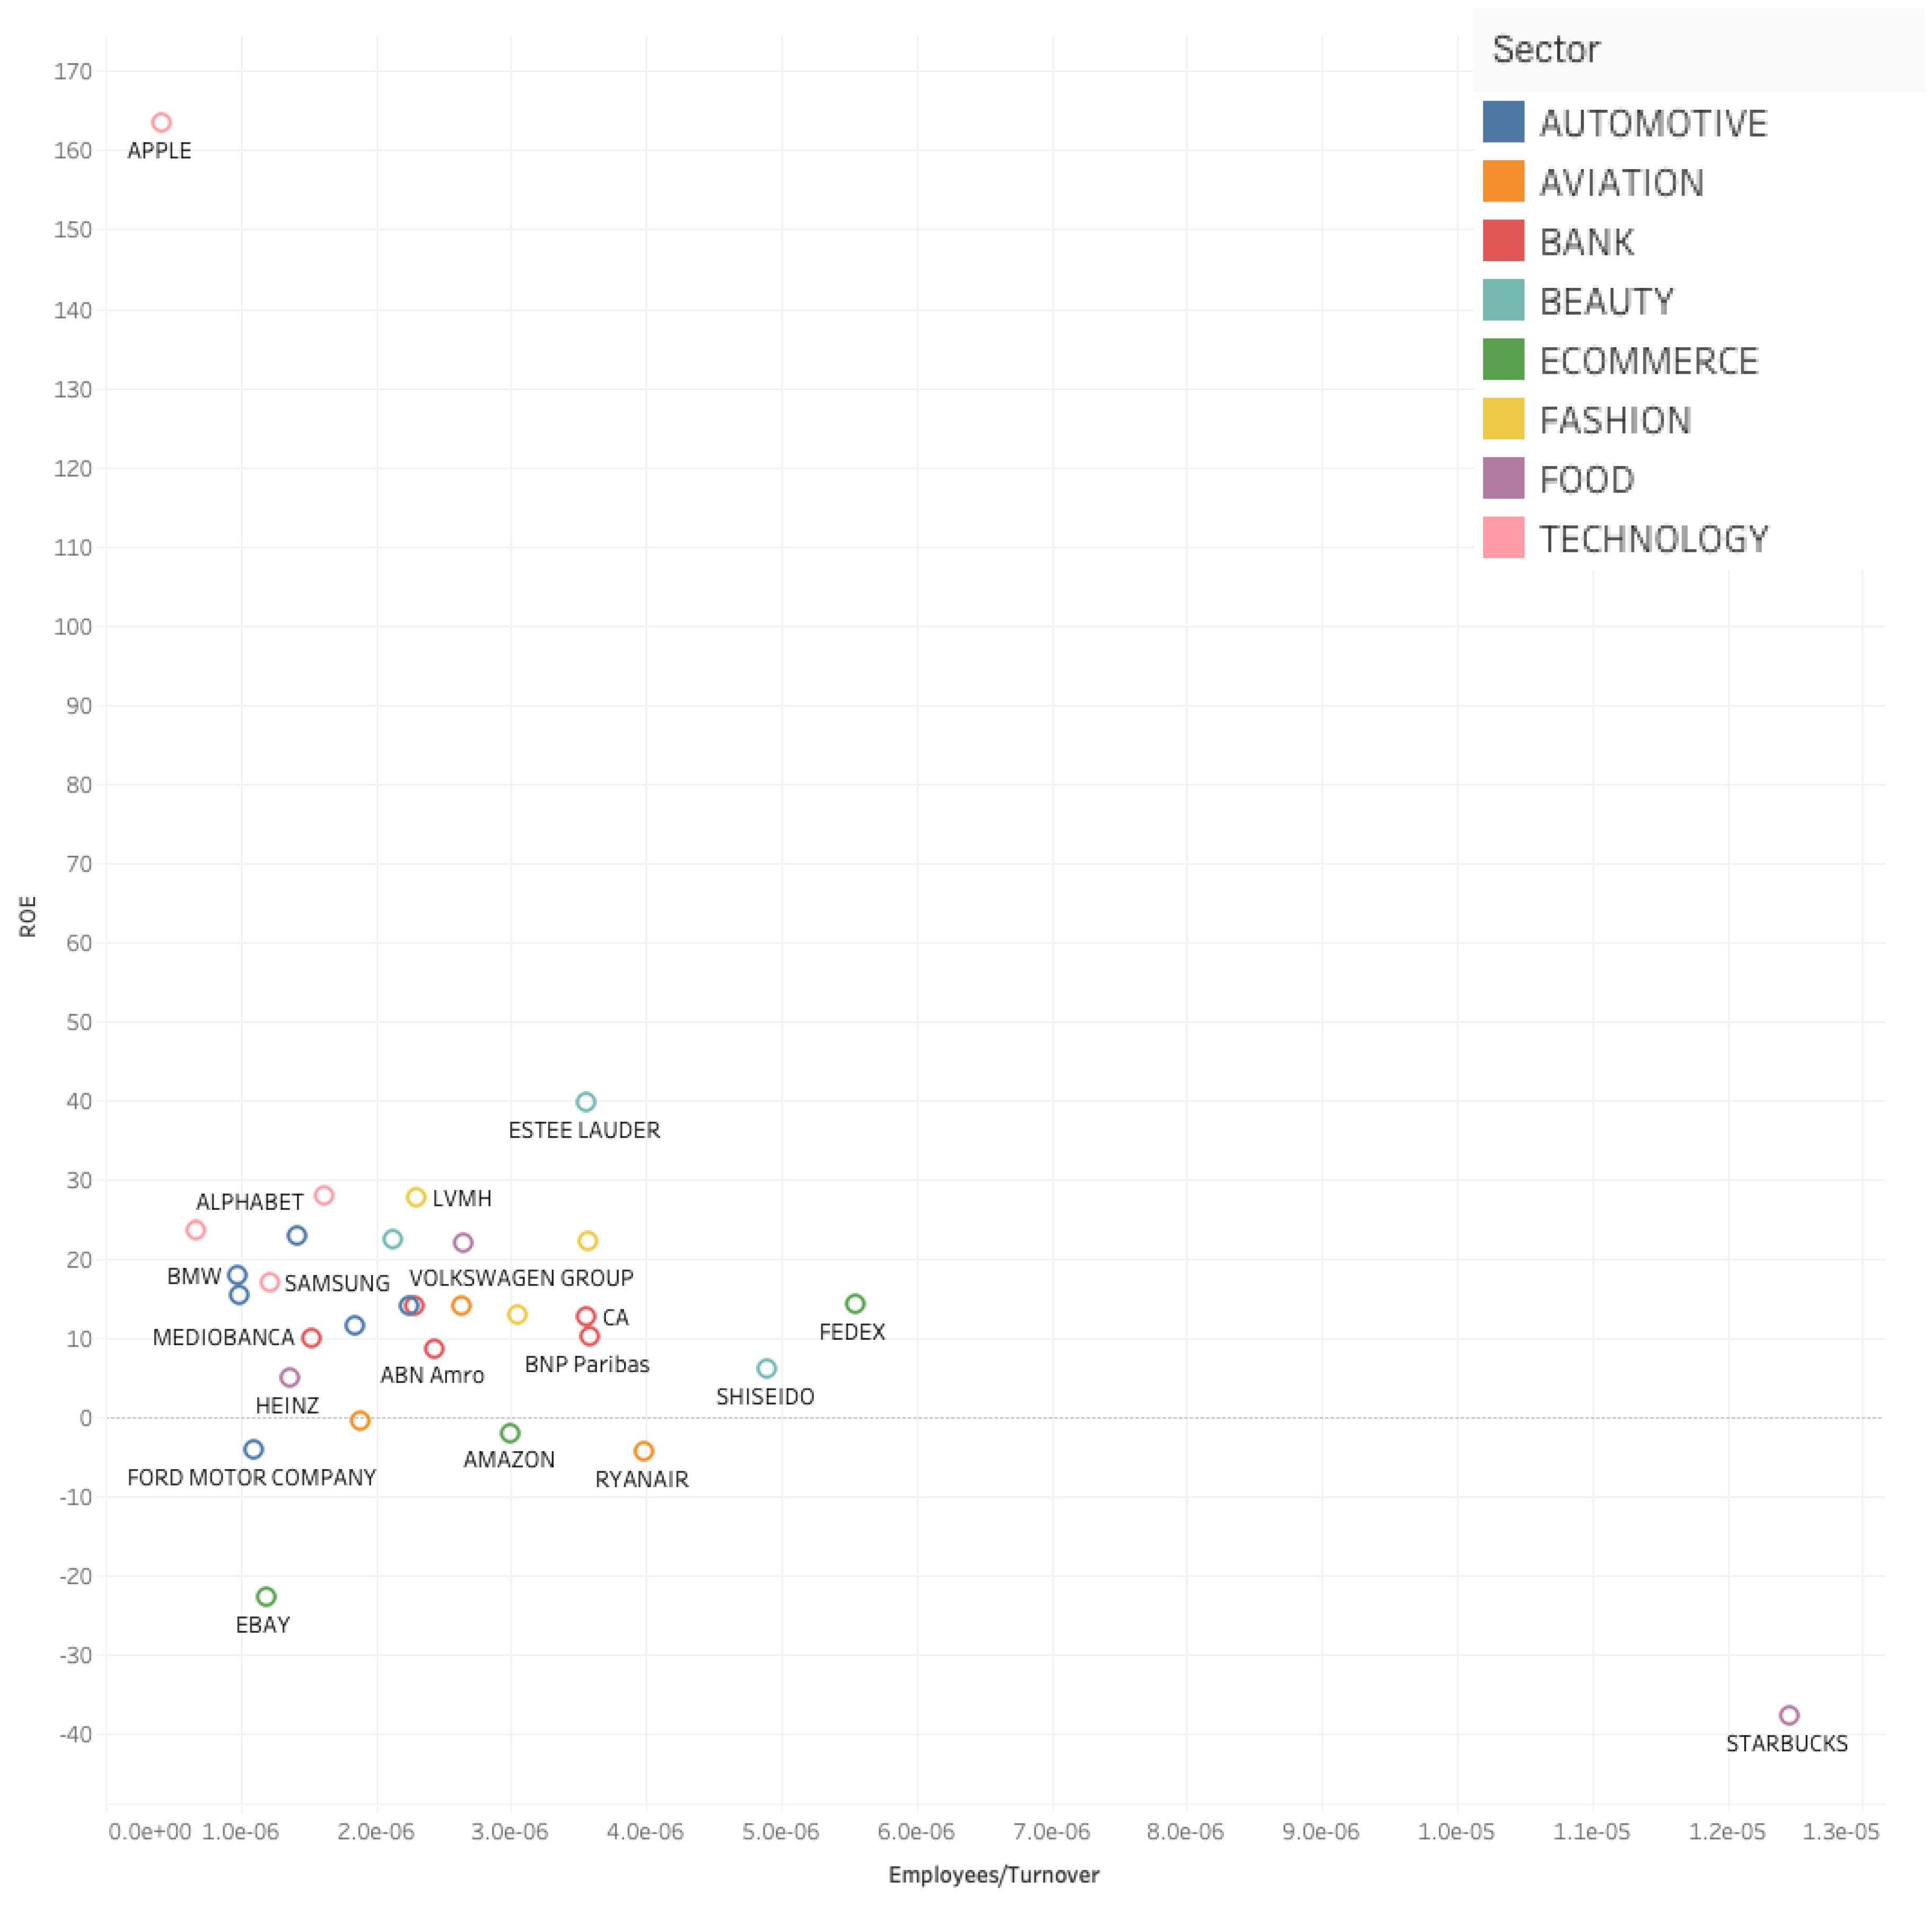
Figure 10.
Diversity and ROE.
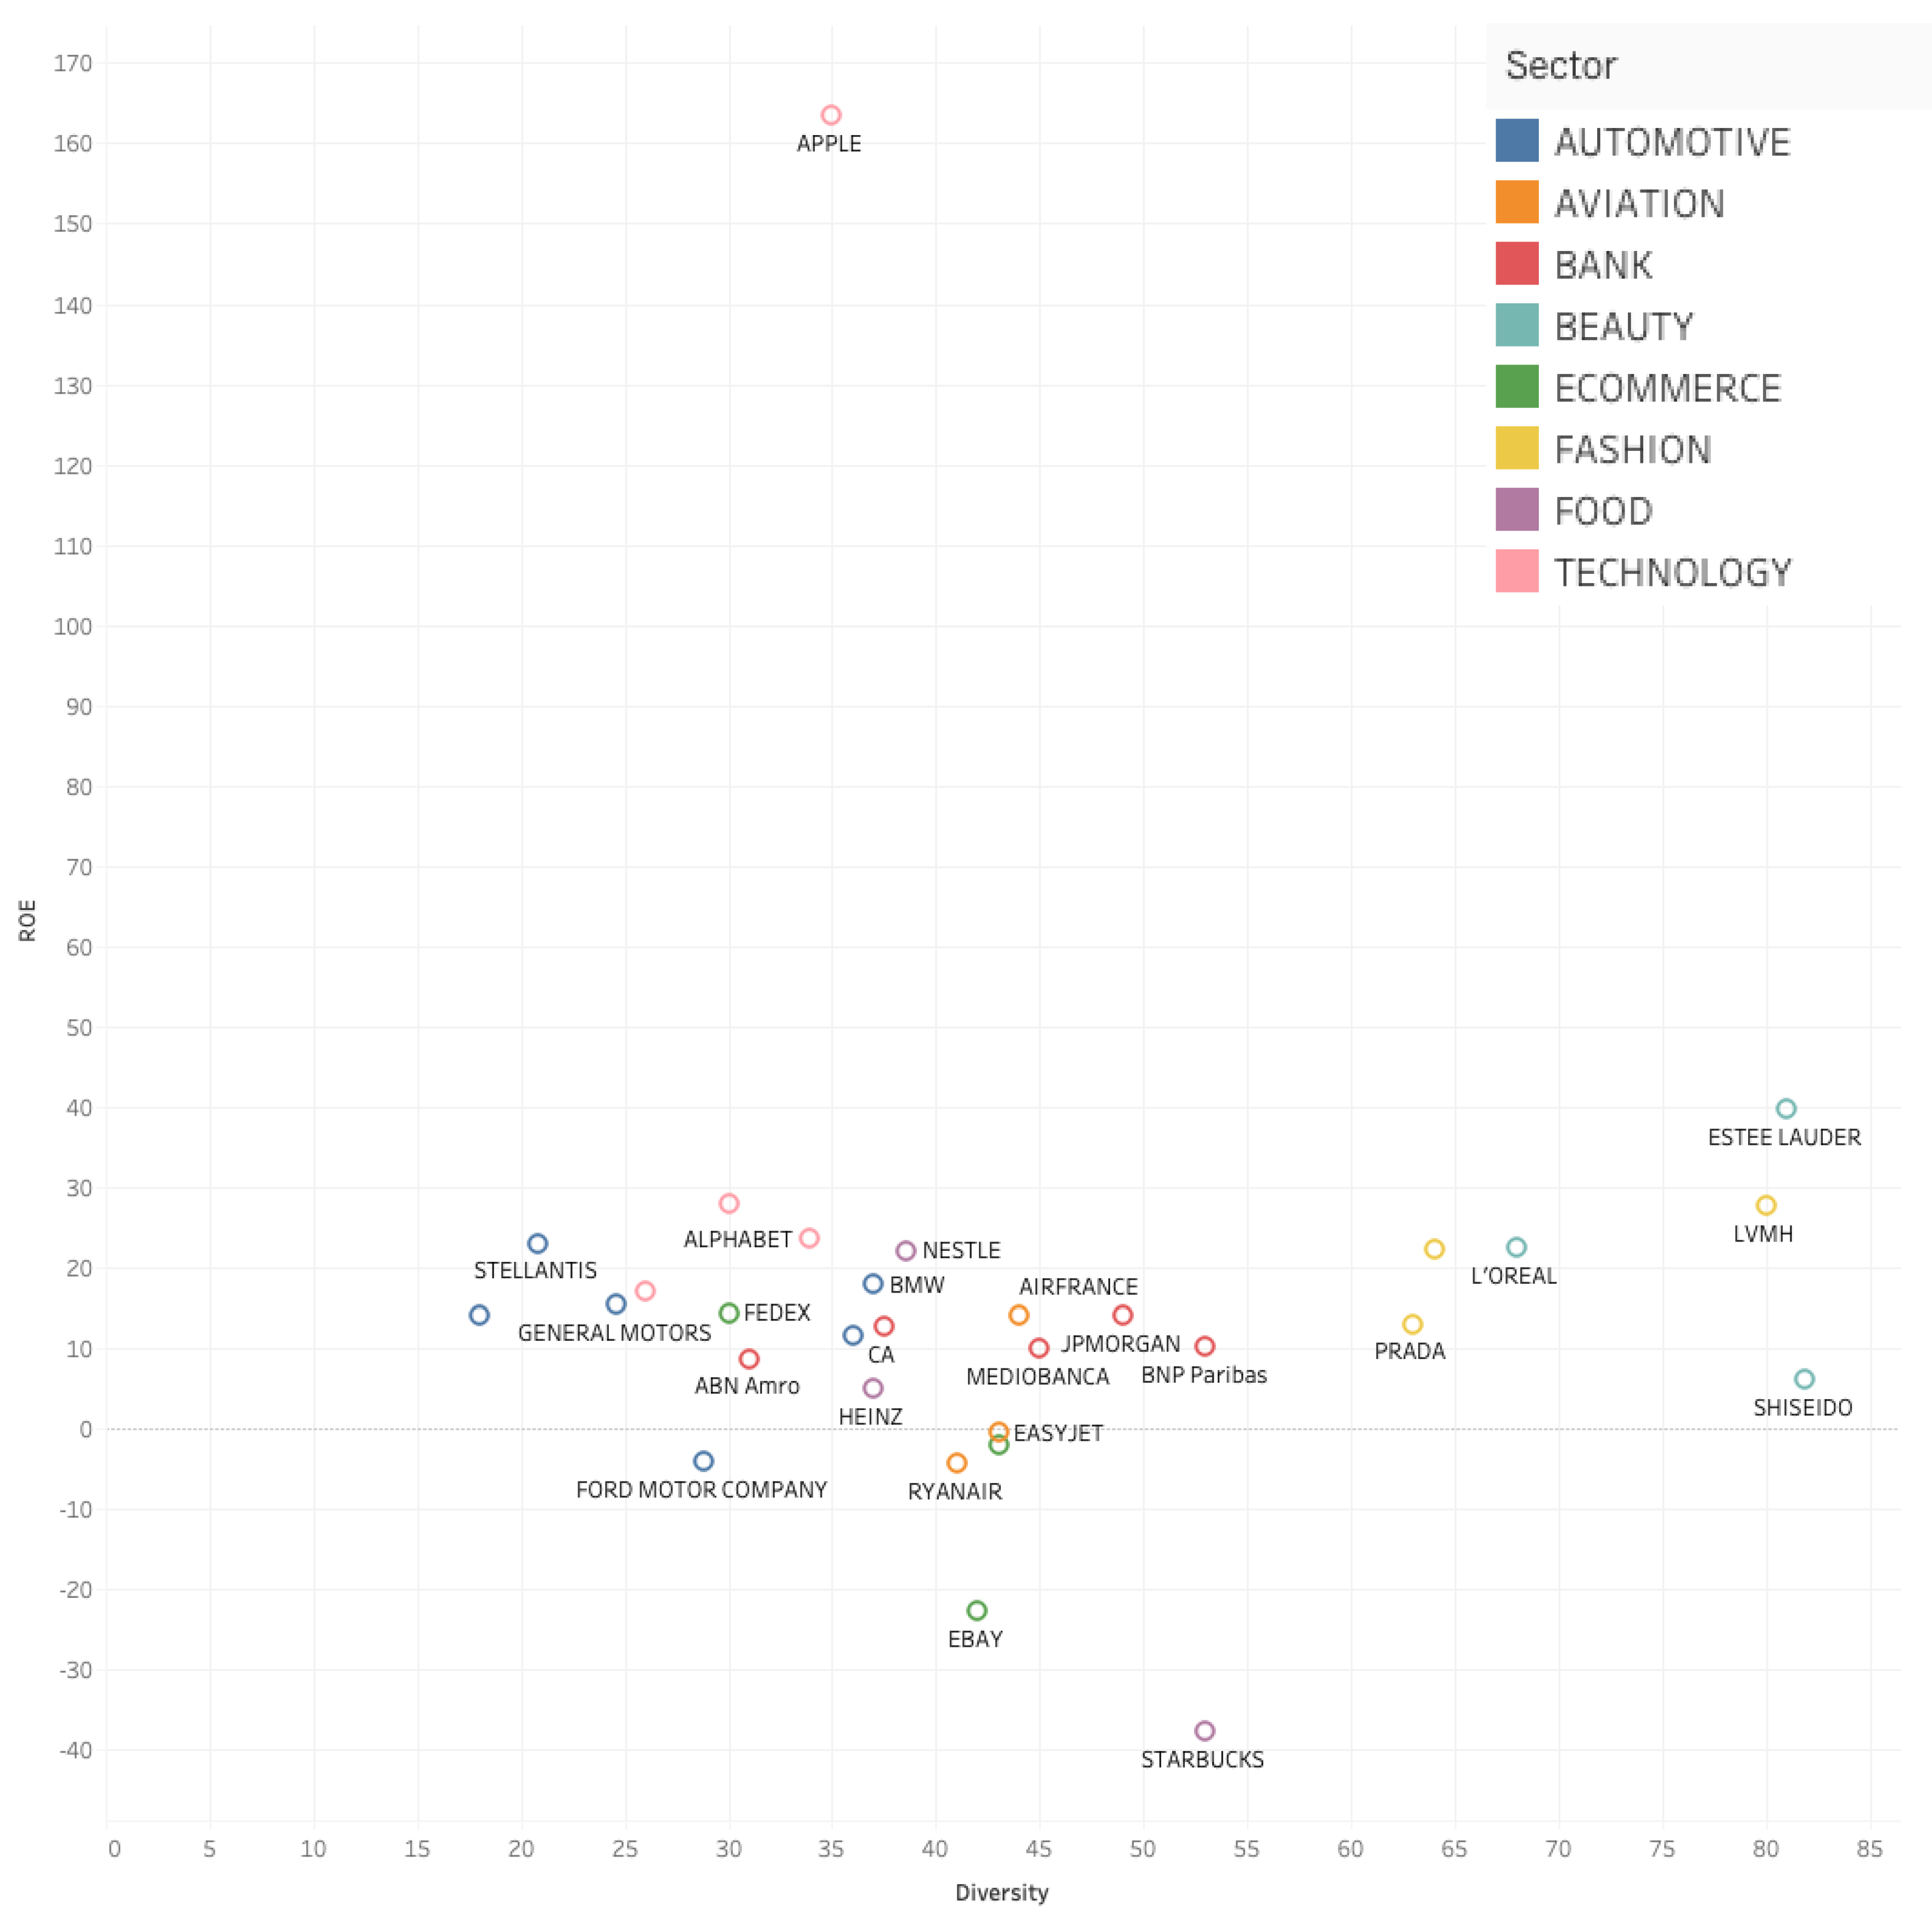
Figure 11.
Diversity and Average Share Prices (FY2022).
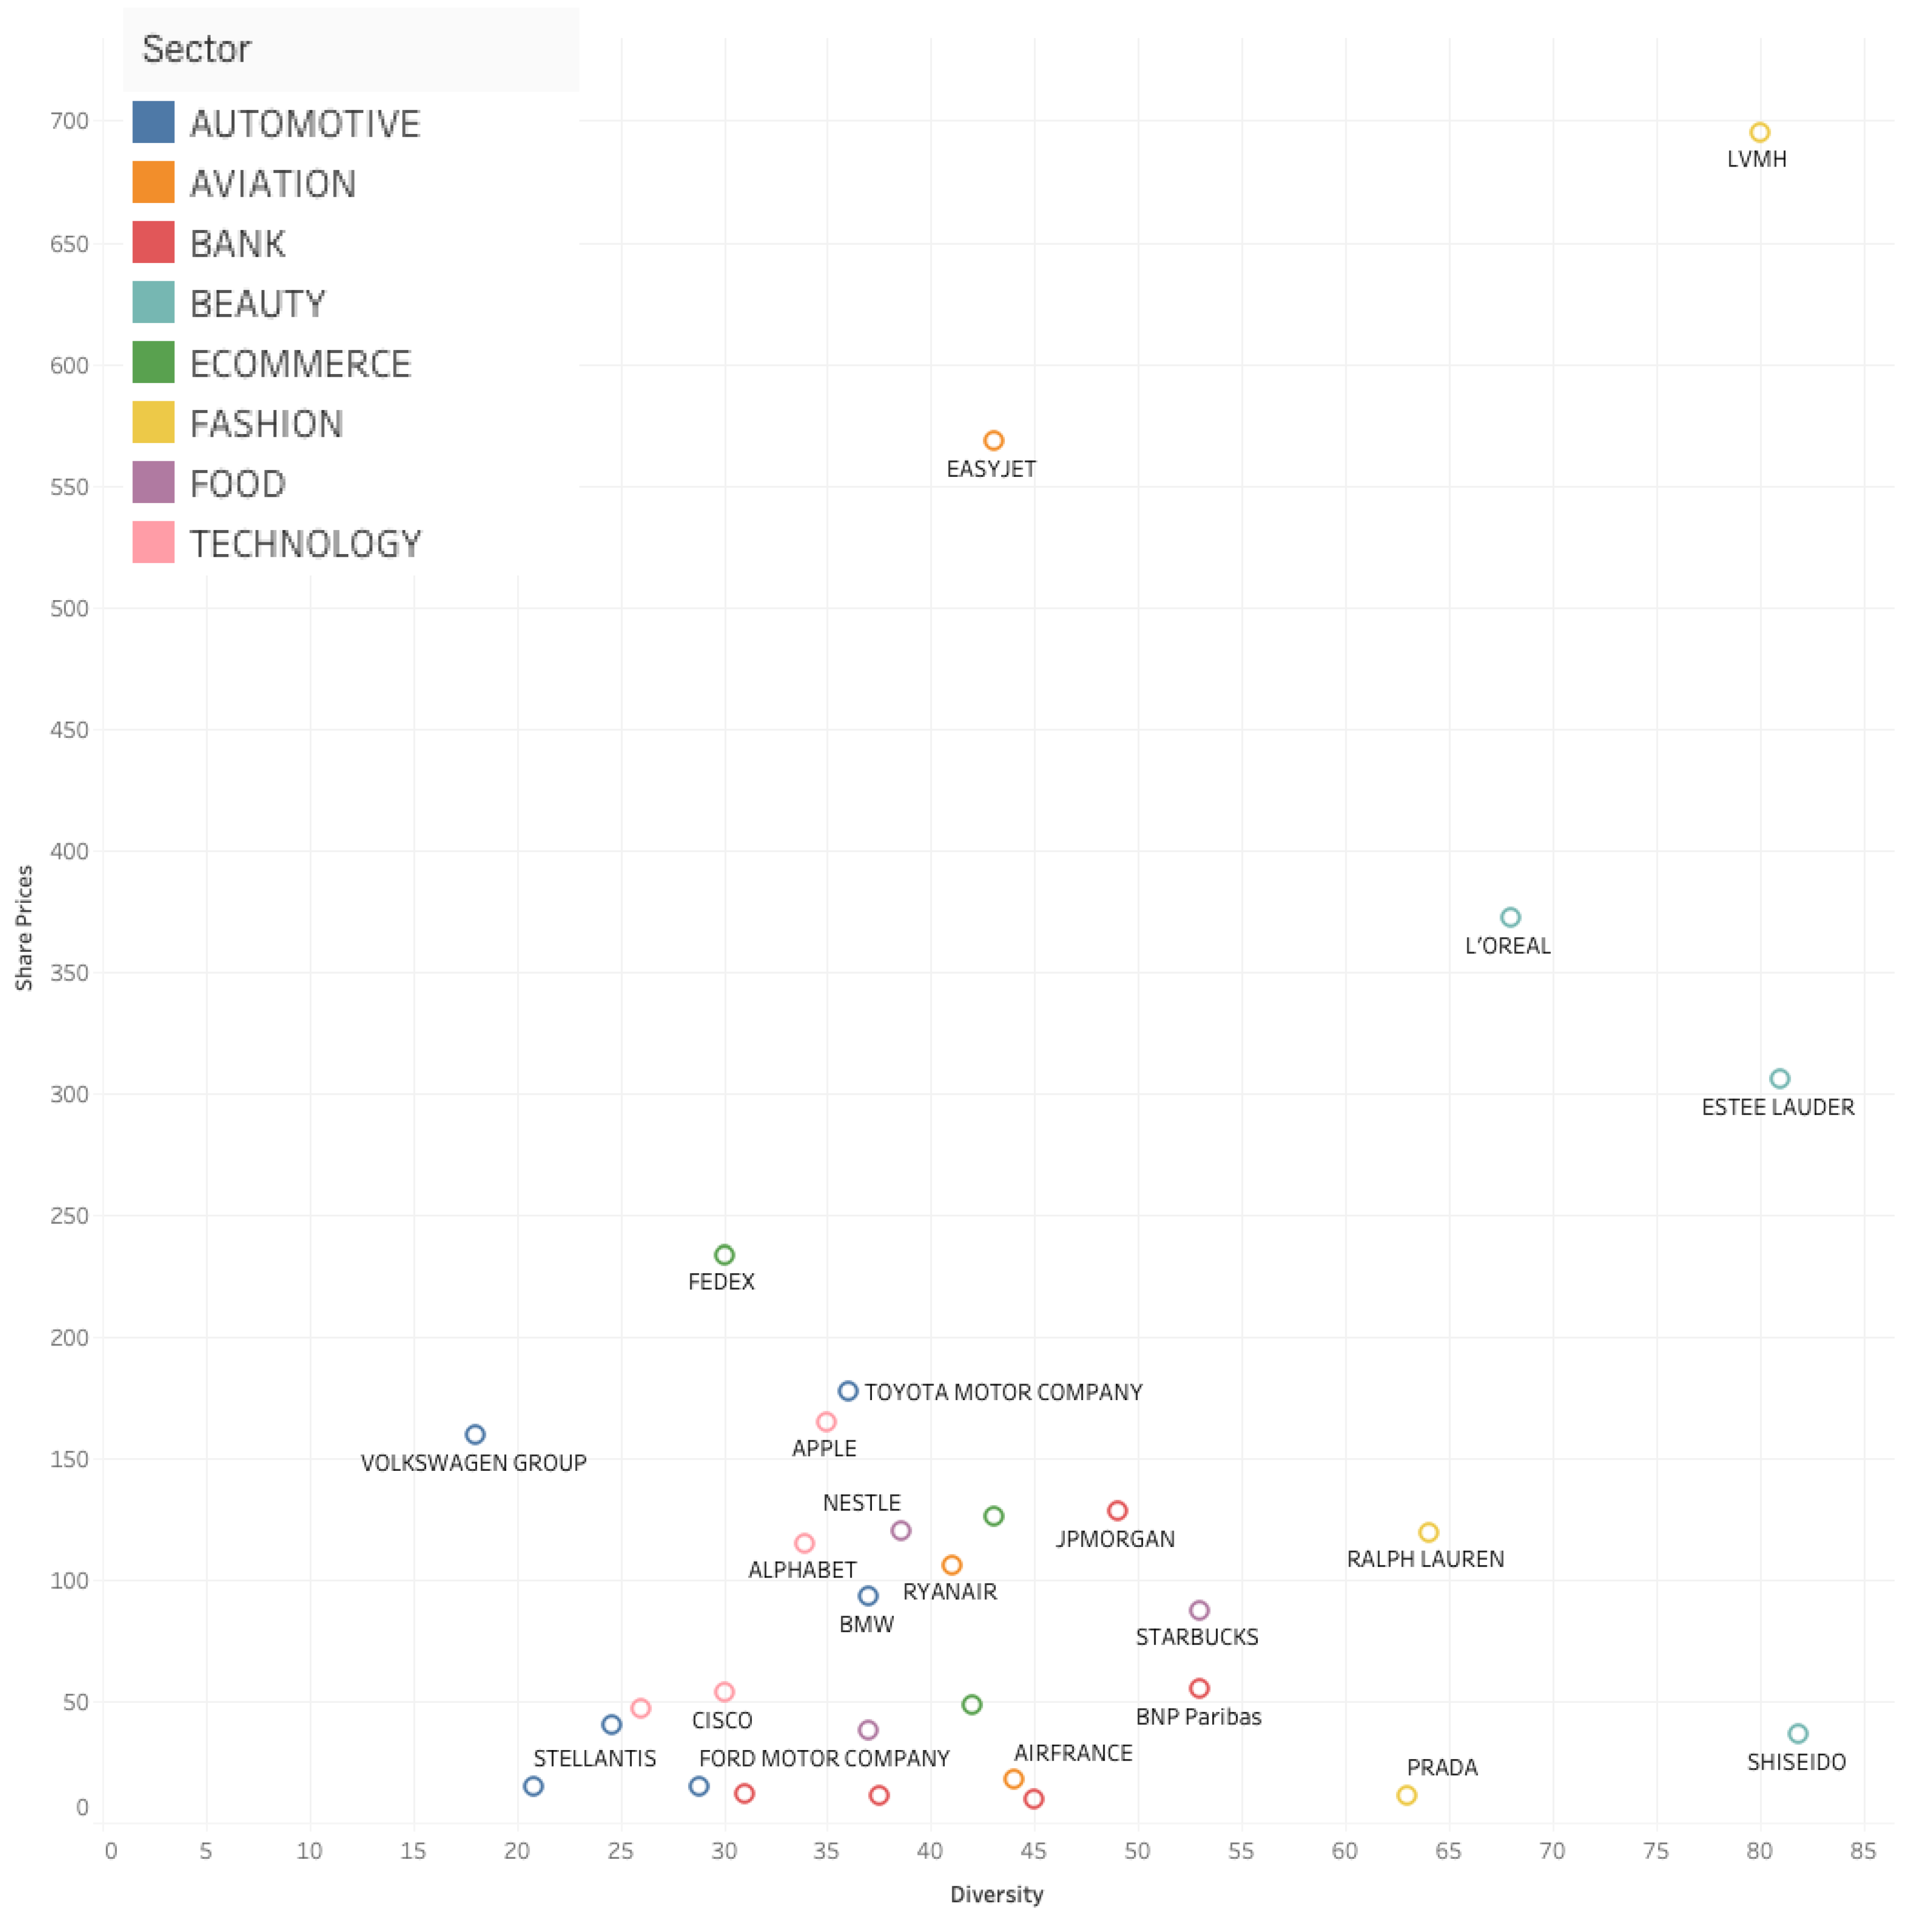
Figure 12.
CO2/Turnover and ROE.
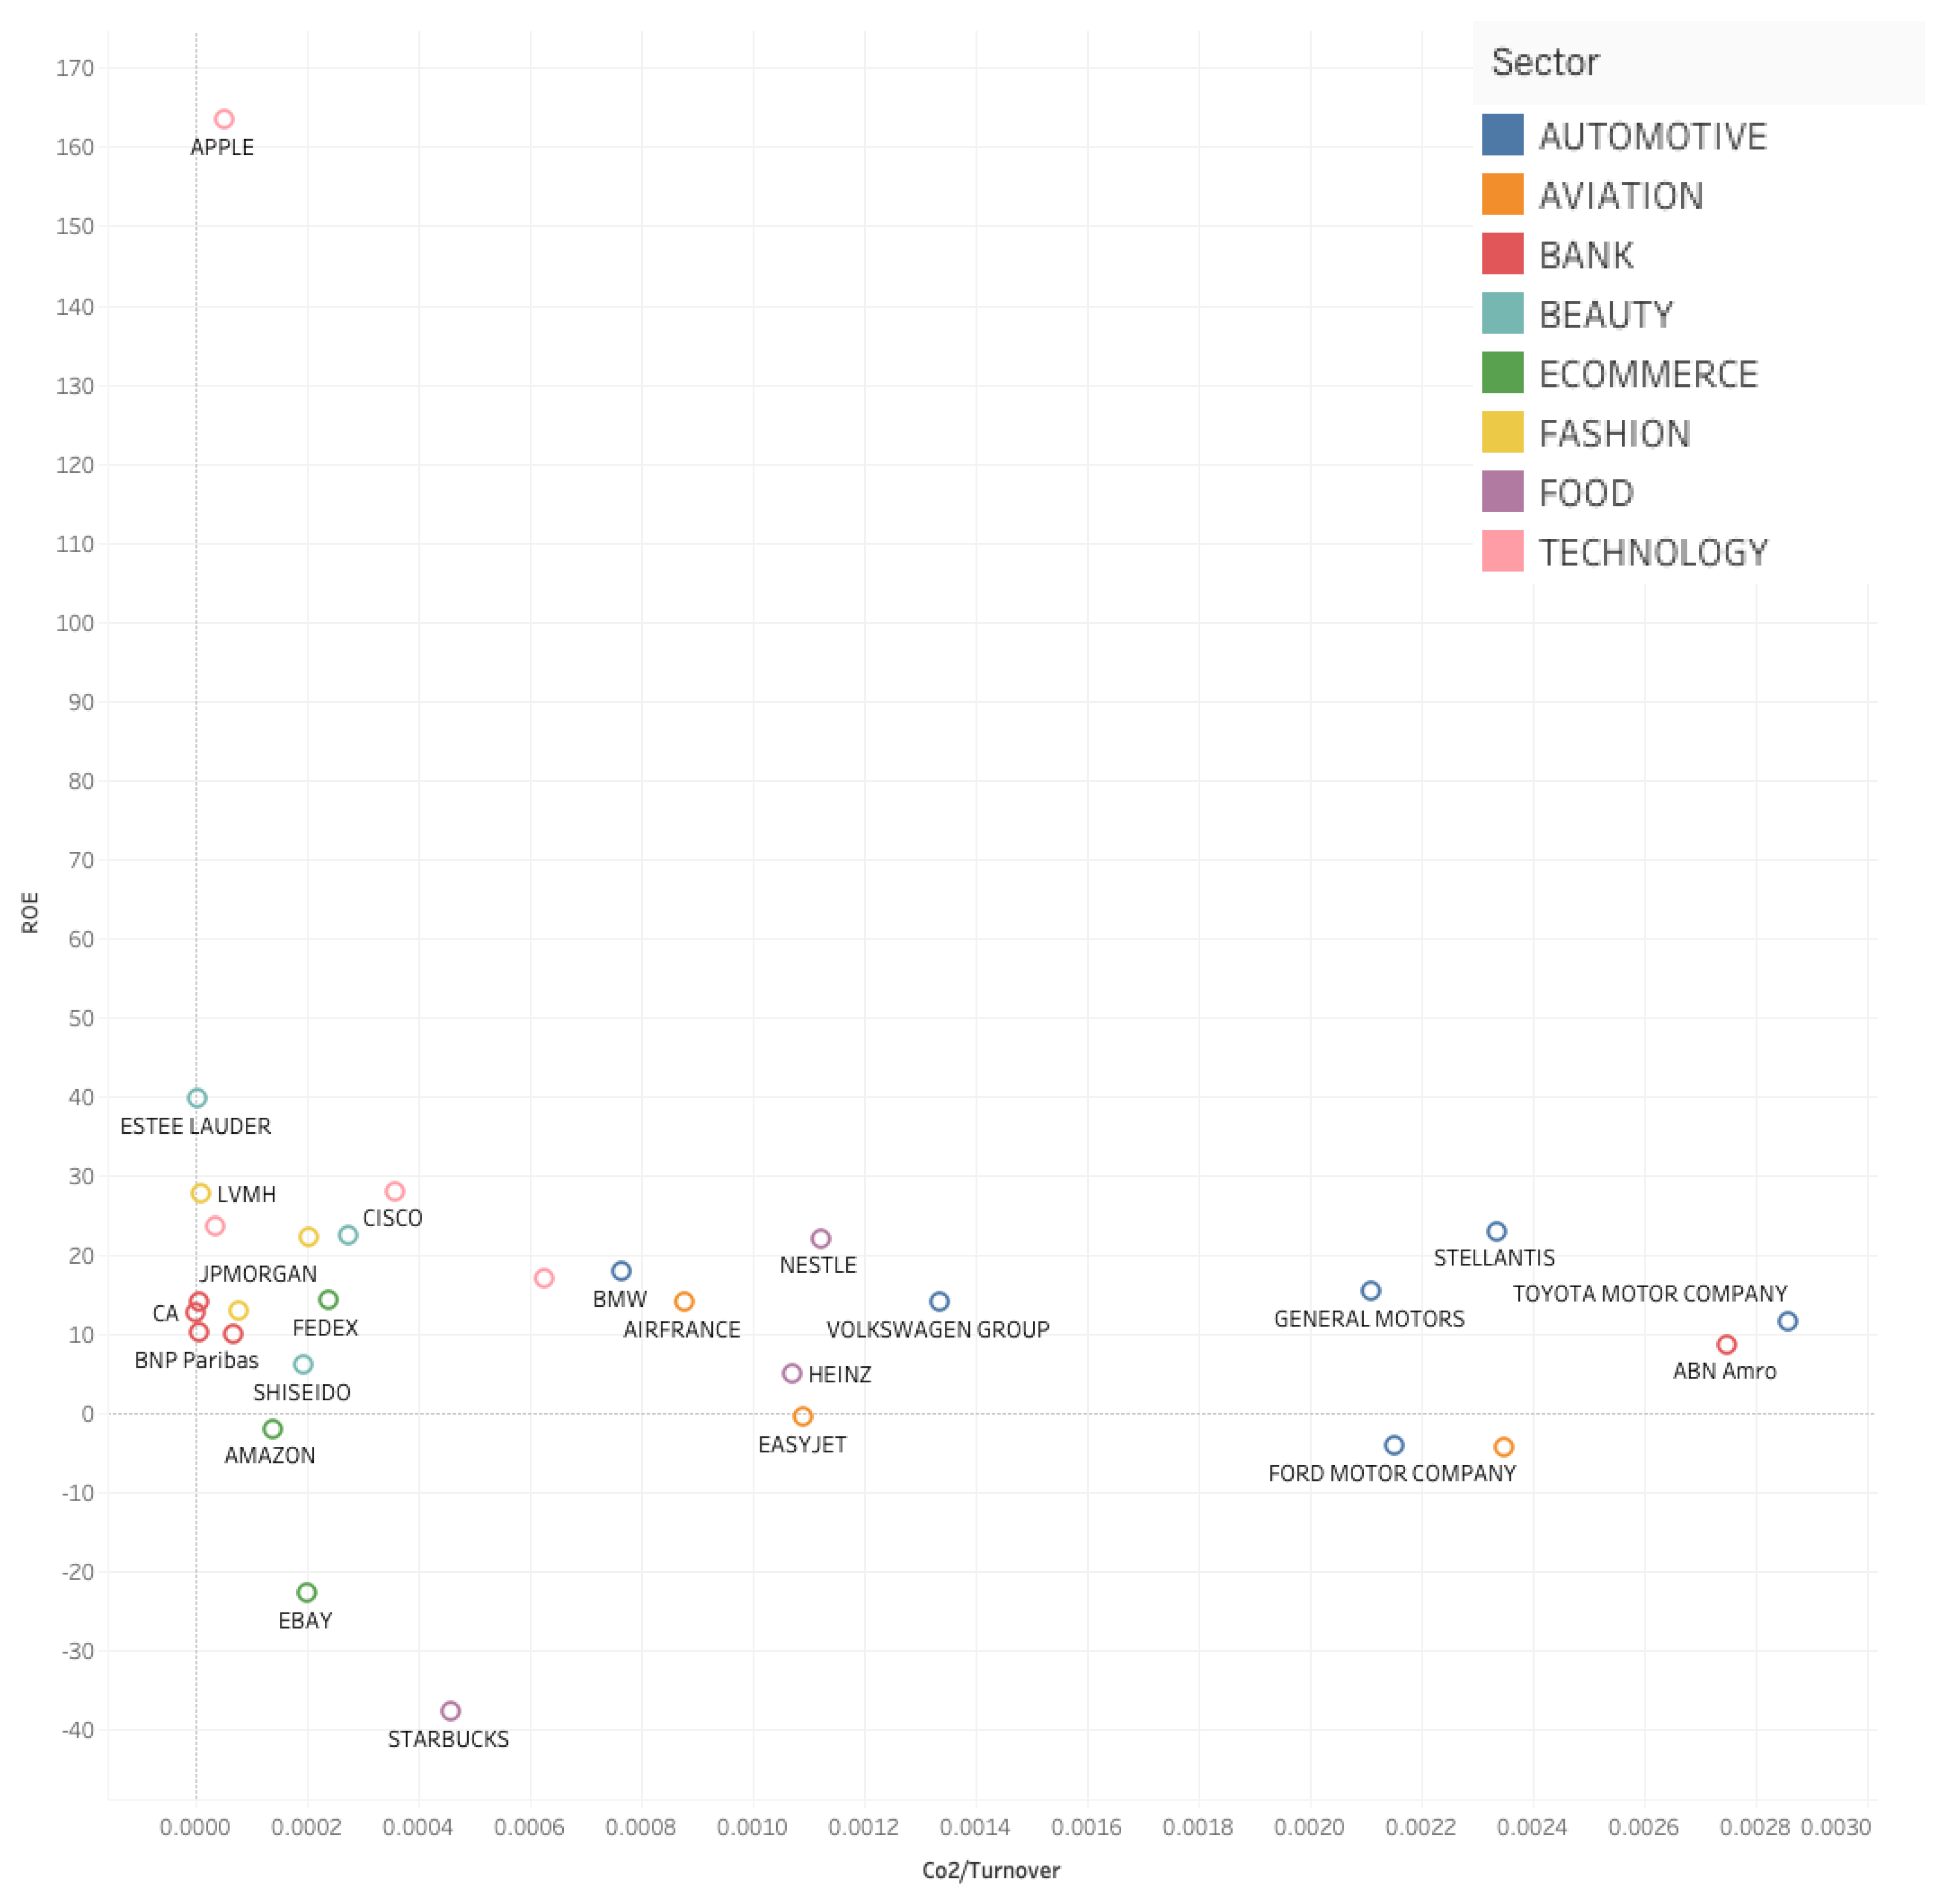
Figure 13.
CO2/Turnover and Profit/Turnover.
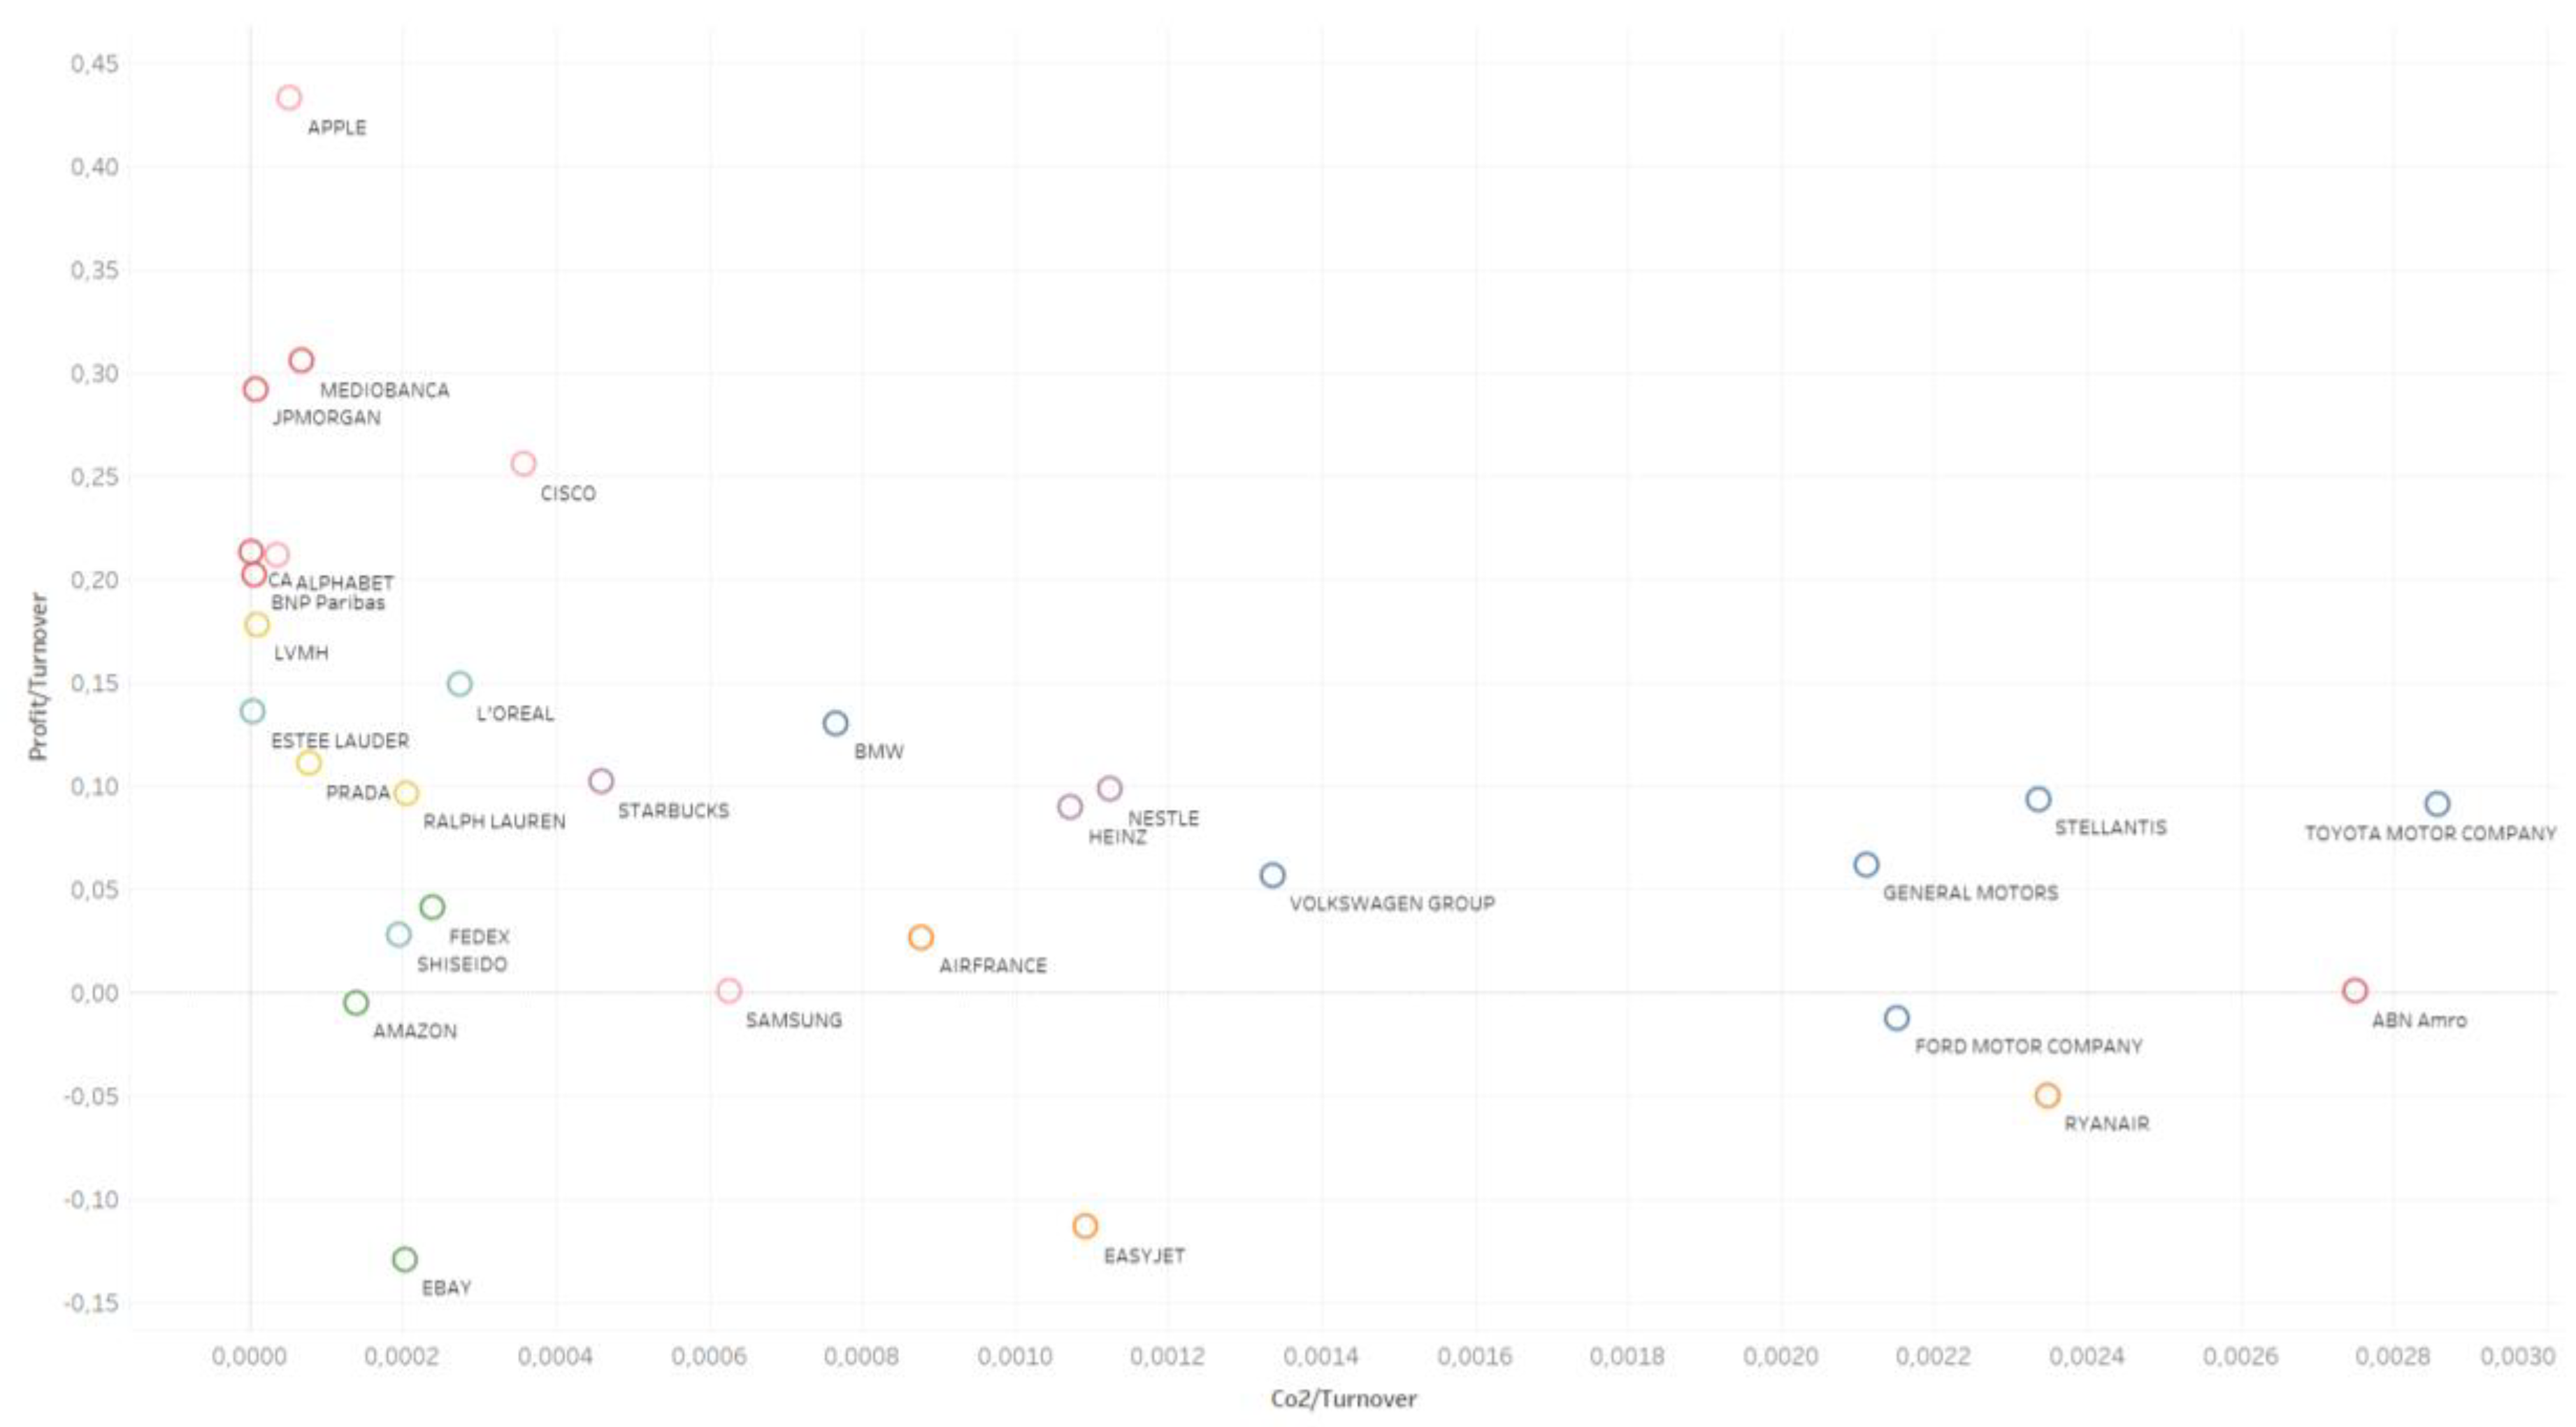
Figure 14.
Waste/Turnover and ROE.
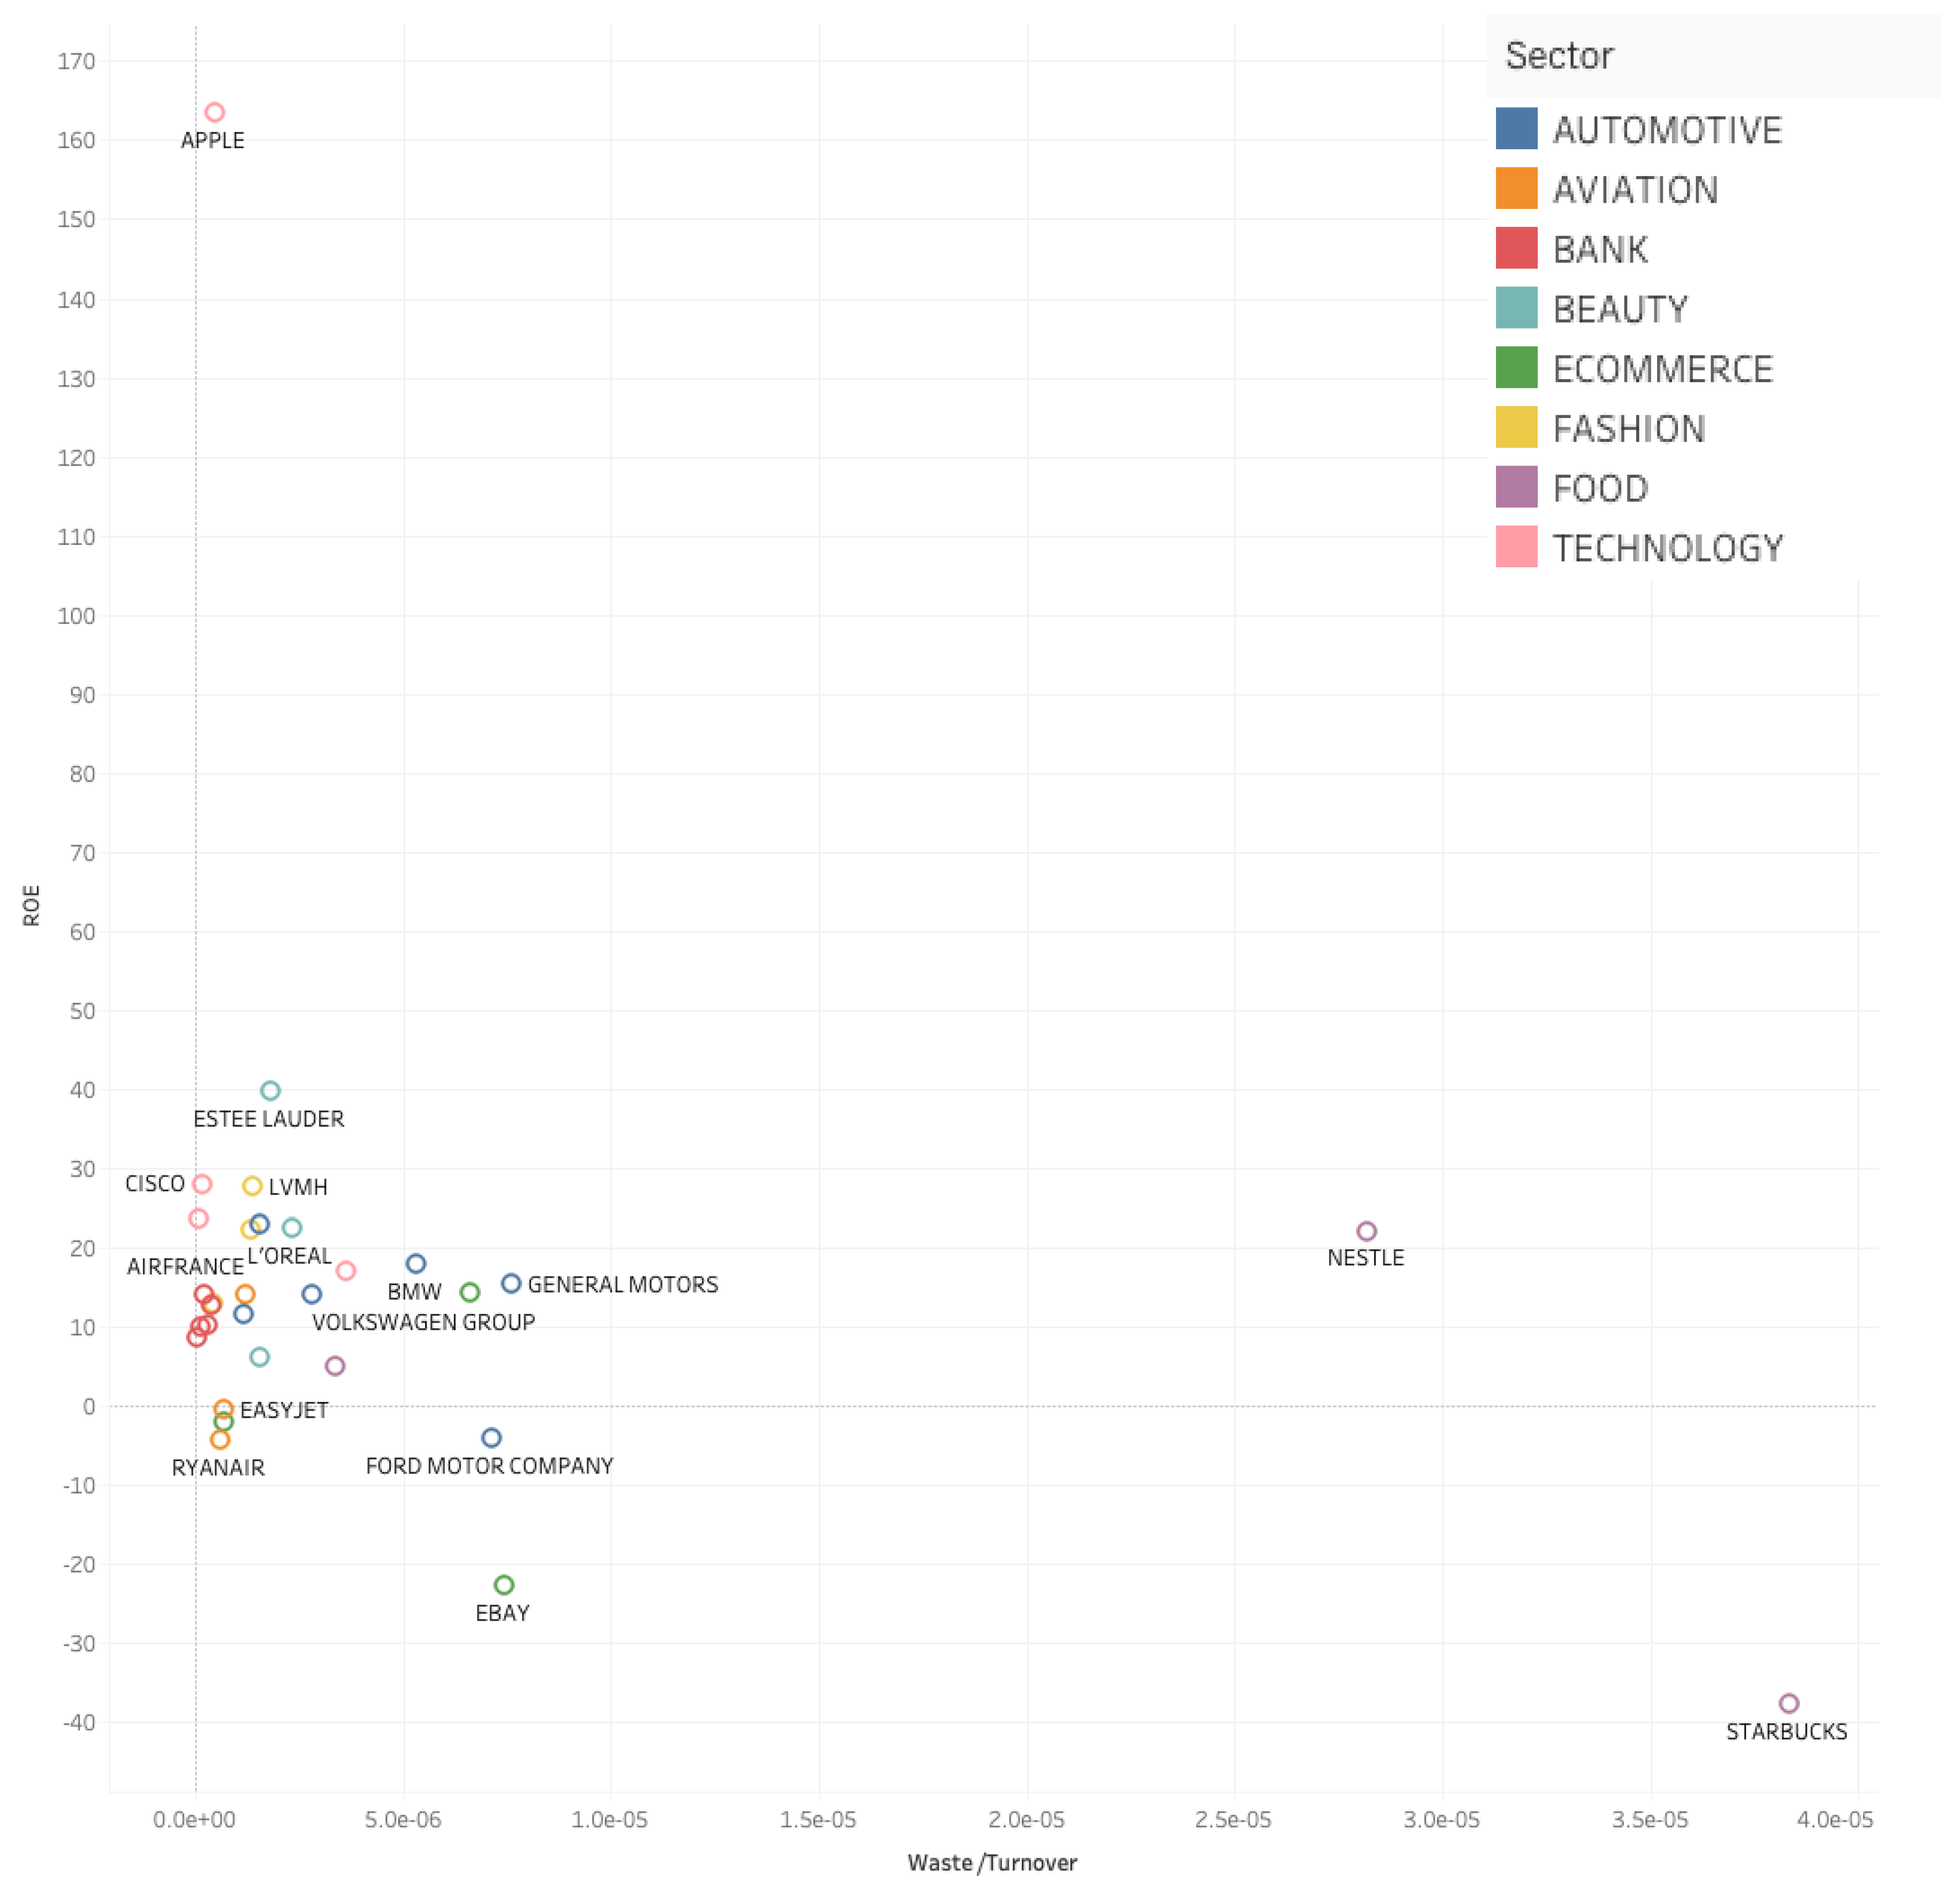

Table 1.
ESG Indicators Used in the Company Assessment.
| Economic | Revenue | Revenue serves as a fundamental economic indicator, reflecting a company's financial performance and market competitiveness. |
| Return on Equity (ROE) | ROE measures a company's profitability relative to shareholders' equity, indicating its efficiency in generating profits with shareholder investments. | |
| Profit | Profitability is a crucial metric, signifying a company's ability to generate surplus income after deducting expenses. | |
| Social | Number of Employees | The number of employees reflects a company's workforce size and its commitment to job creation and labor practices. |
| Gender Equity | Gender equality measures the representation and equitable treatment of genders within the workforce and leadership roles. | |
| Environmental | CO2 Emissions | CO2 emissions are segmented into three scopes: Scope 1 represents direct emissions from owned or controlled sources, Scope 2 encompasses indirect emissions from purchased electricity, and Scope 3 covers indirect emissions from the value chain. |
| Water Consumption | Water consumption quantifies the amount of water used in a company's operations, reflecting its water management practices and conservation efforts. | |
| Total Waste Generated | The total waste generated by a company is the combined volume of all unwanted materials produced through its operations, including production, office activities, and maintenance. |
Disclaimer/Publisher’s Note: The statements, opinions and data contained in all publications are solely those of the individual author(s) and contributor(s) and not of MDPI and/or the editor(s). MDPI and/or the editor(s) disclaim responsibility for any injury to people or property resulting from any ideas, methods, instructions or products referred to in the content. |
© 2025 by the authors. Licensee MDPI, Basel, Switzerland. This article is an open access article distributed under the terms and conditions of the Creative Commons Attribution (CC BY) license (http://creativecommons.org/licenses/by/4.0/).
Copyright: This open access article is published under a Creative Commons CC BY 4.0 license, which permit the free download, distribution, and reuse, provided that the author and preprint are cited in any reuse.


