
Submitted:
08 January 2025
Posted:
09 January 2025
You are already at the latest version
Abstract
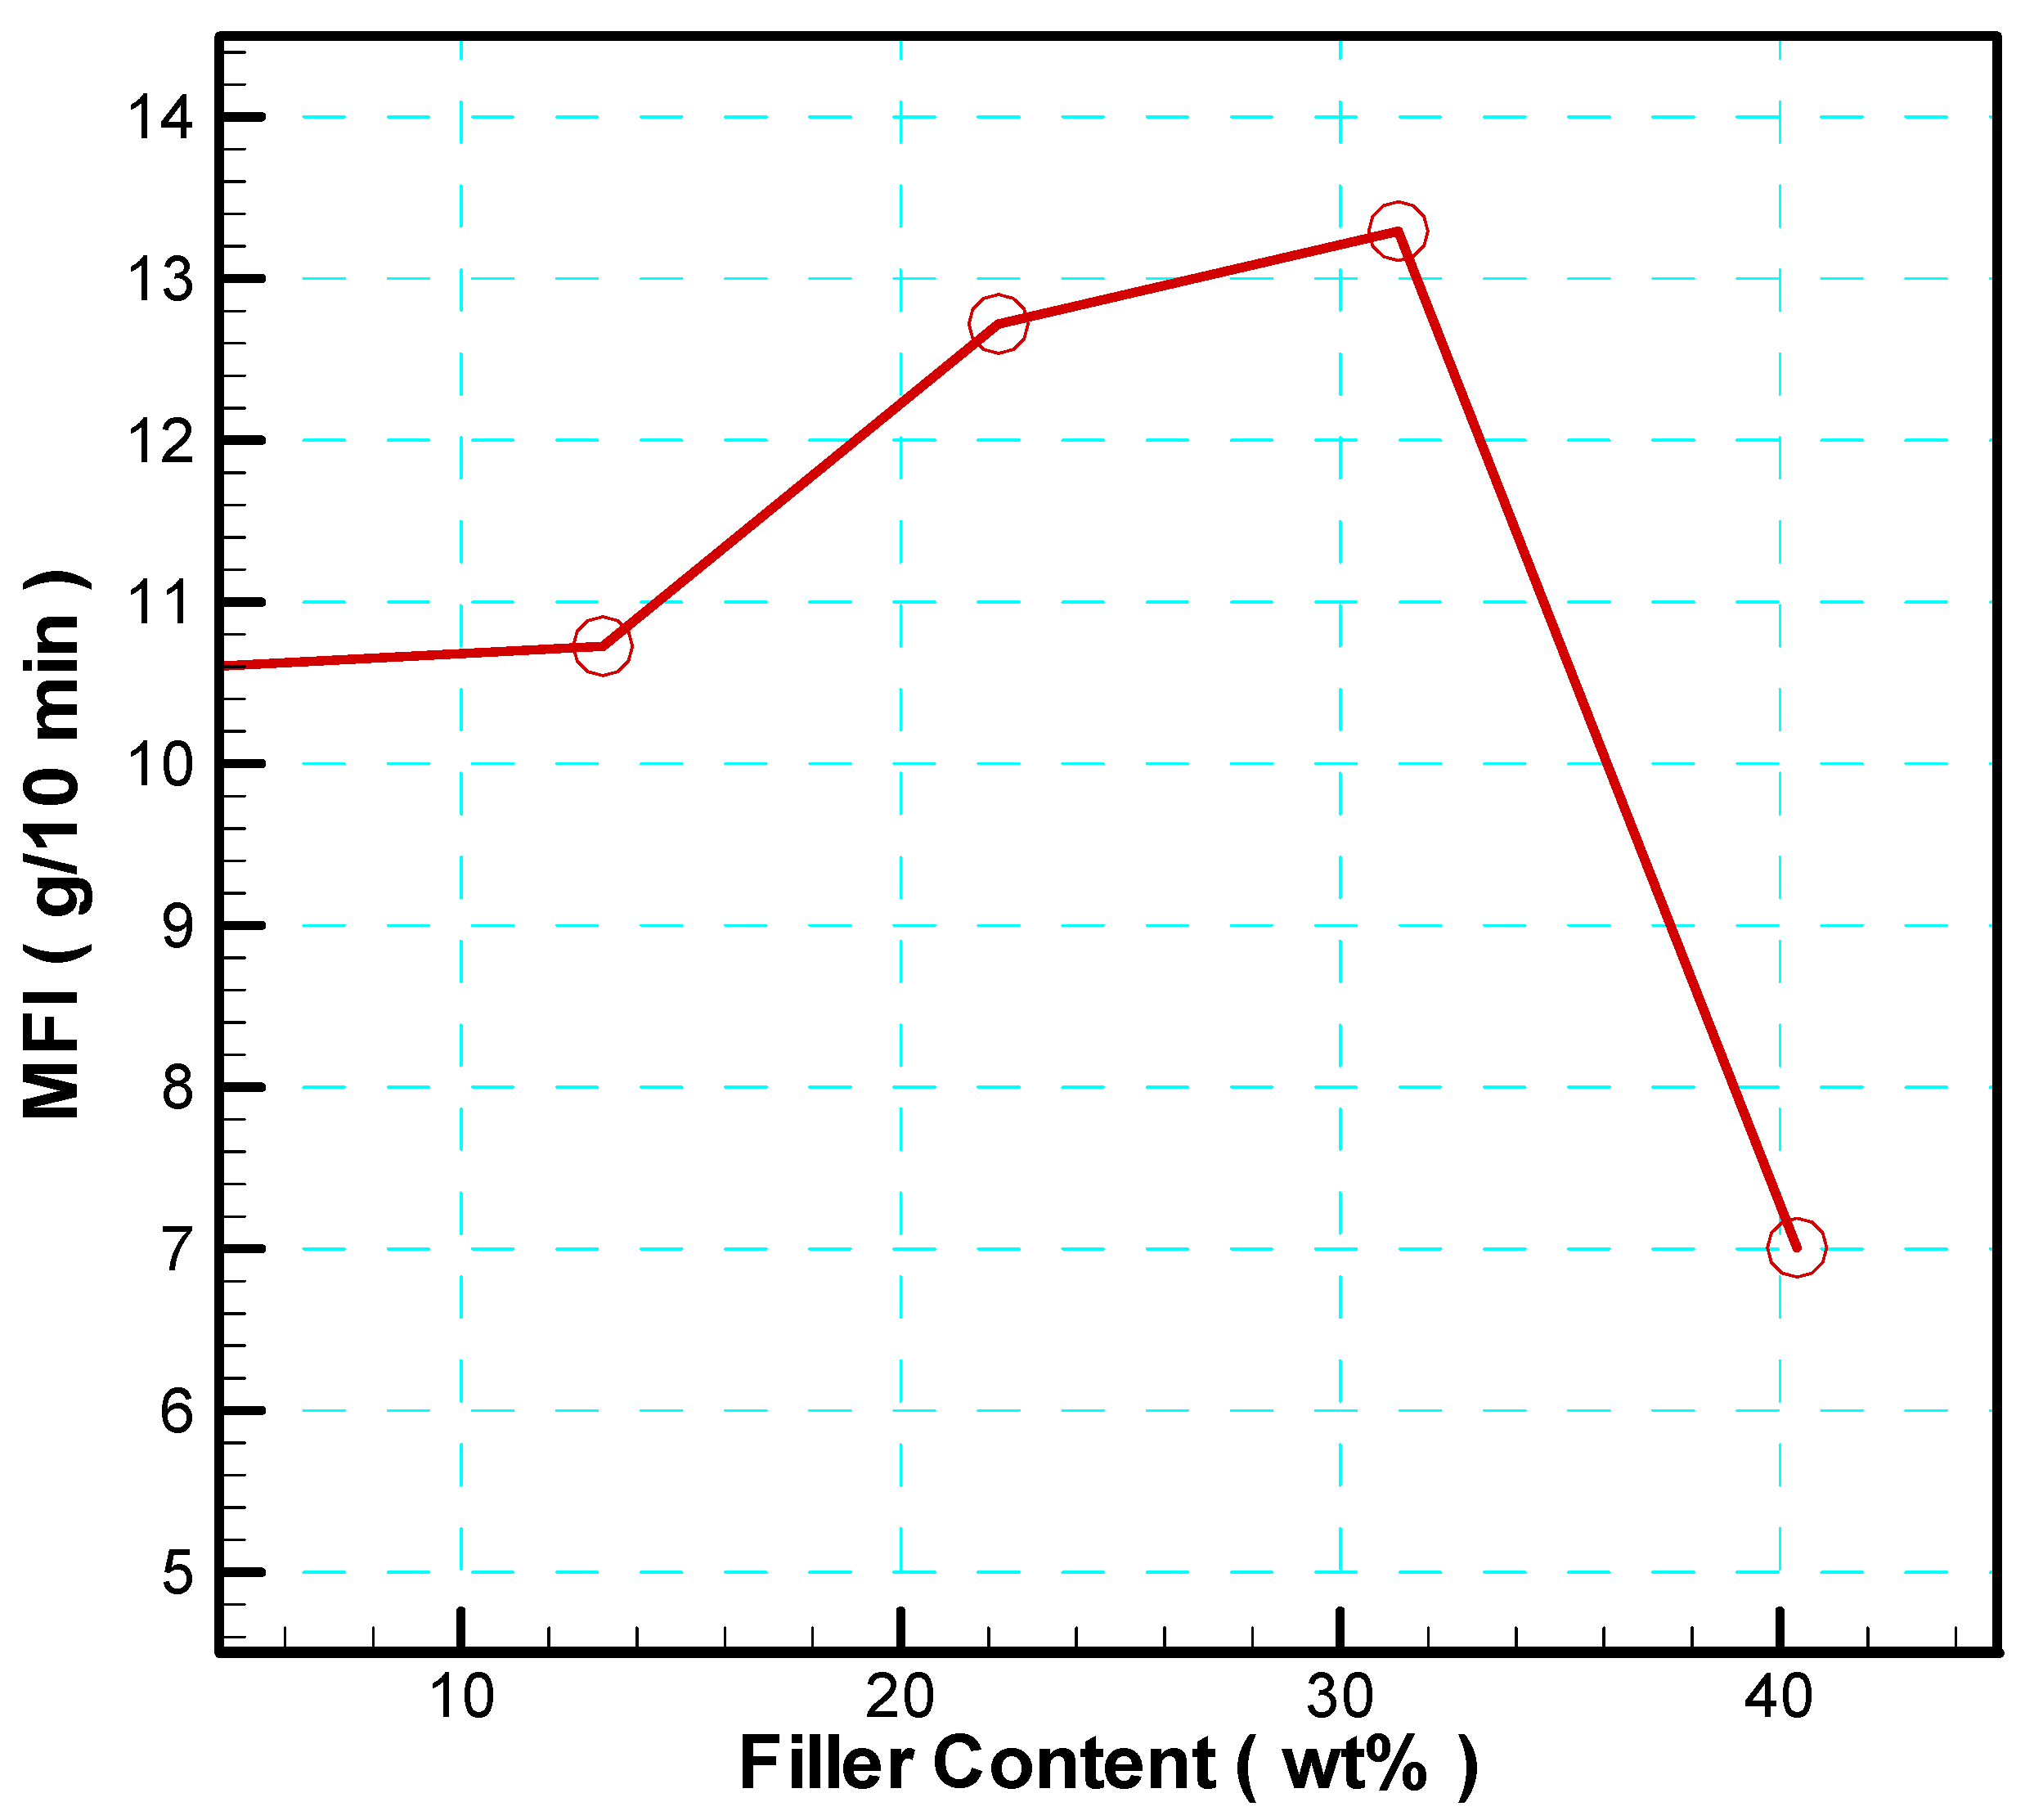
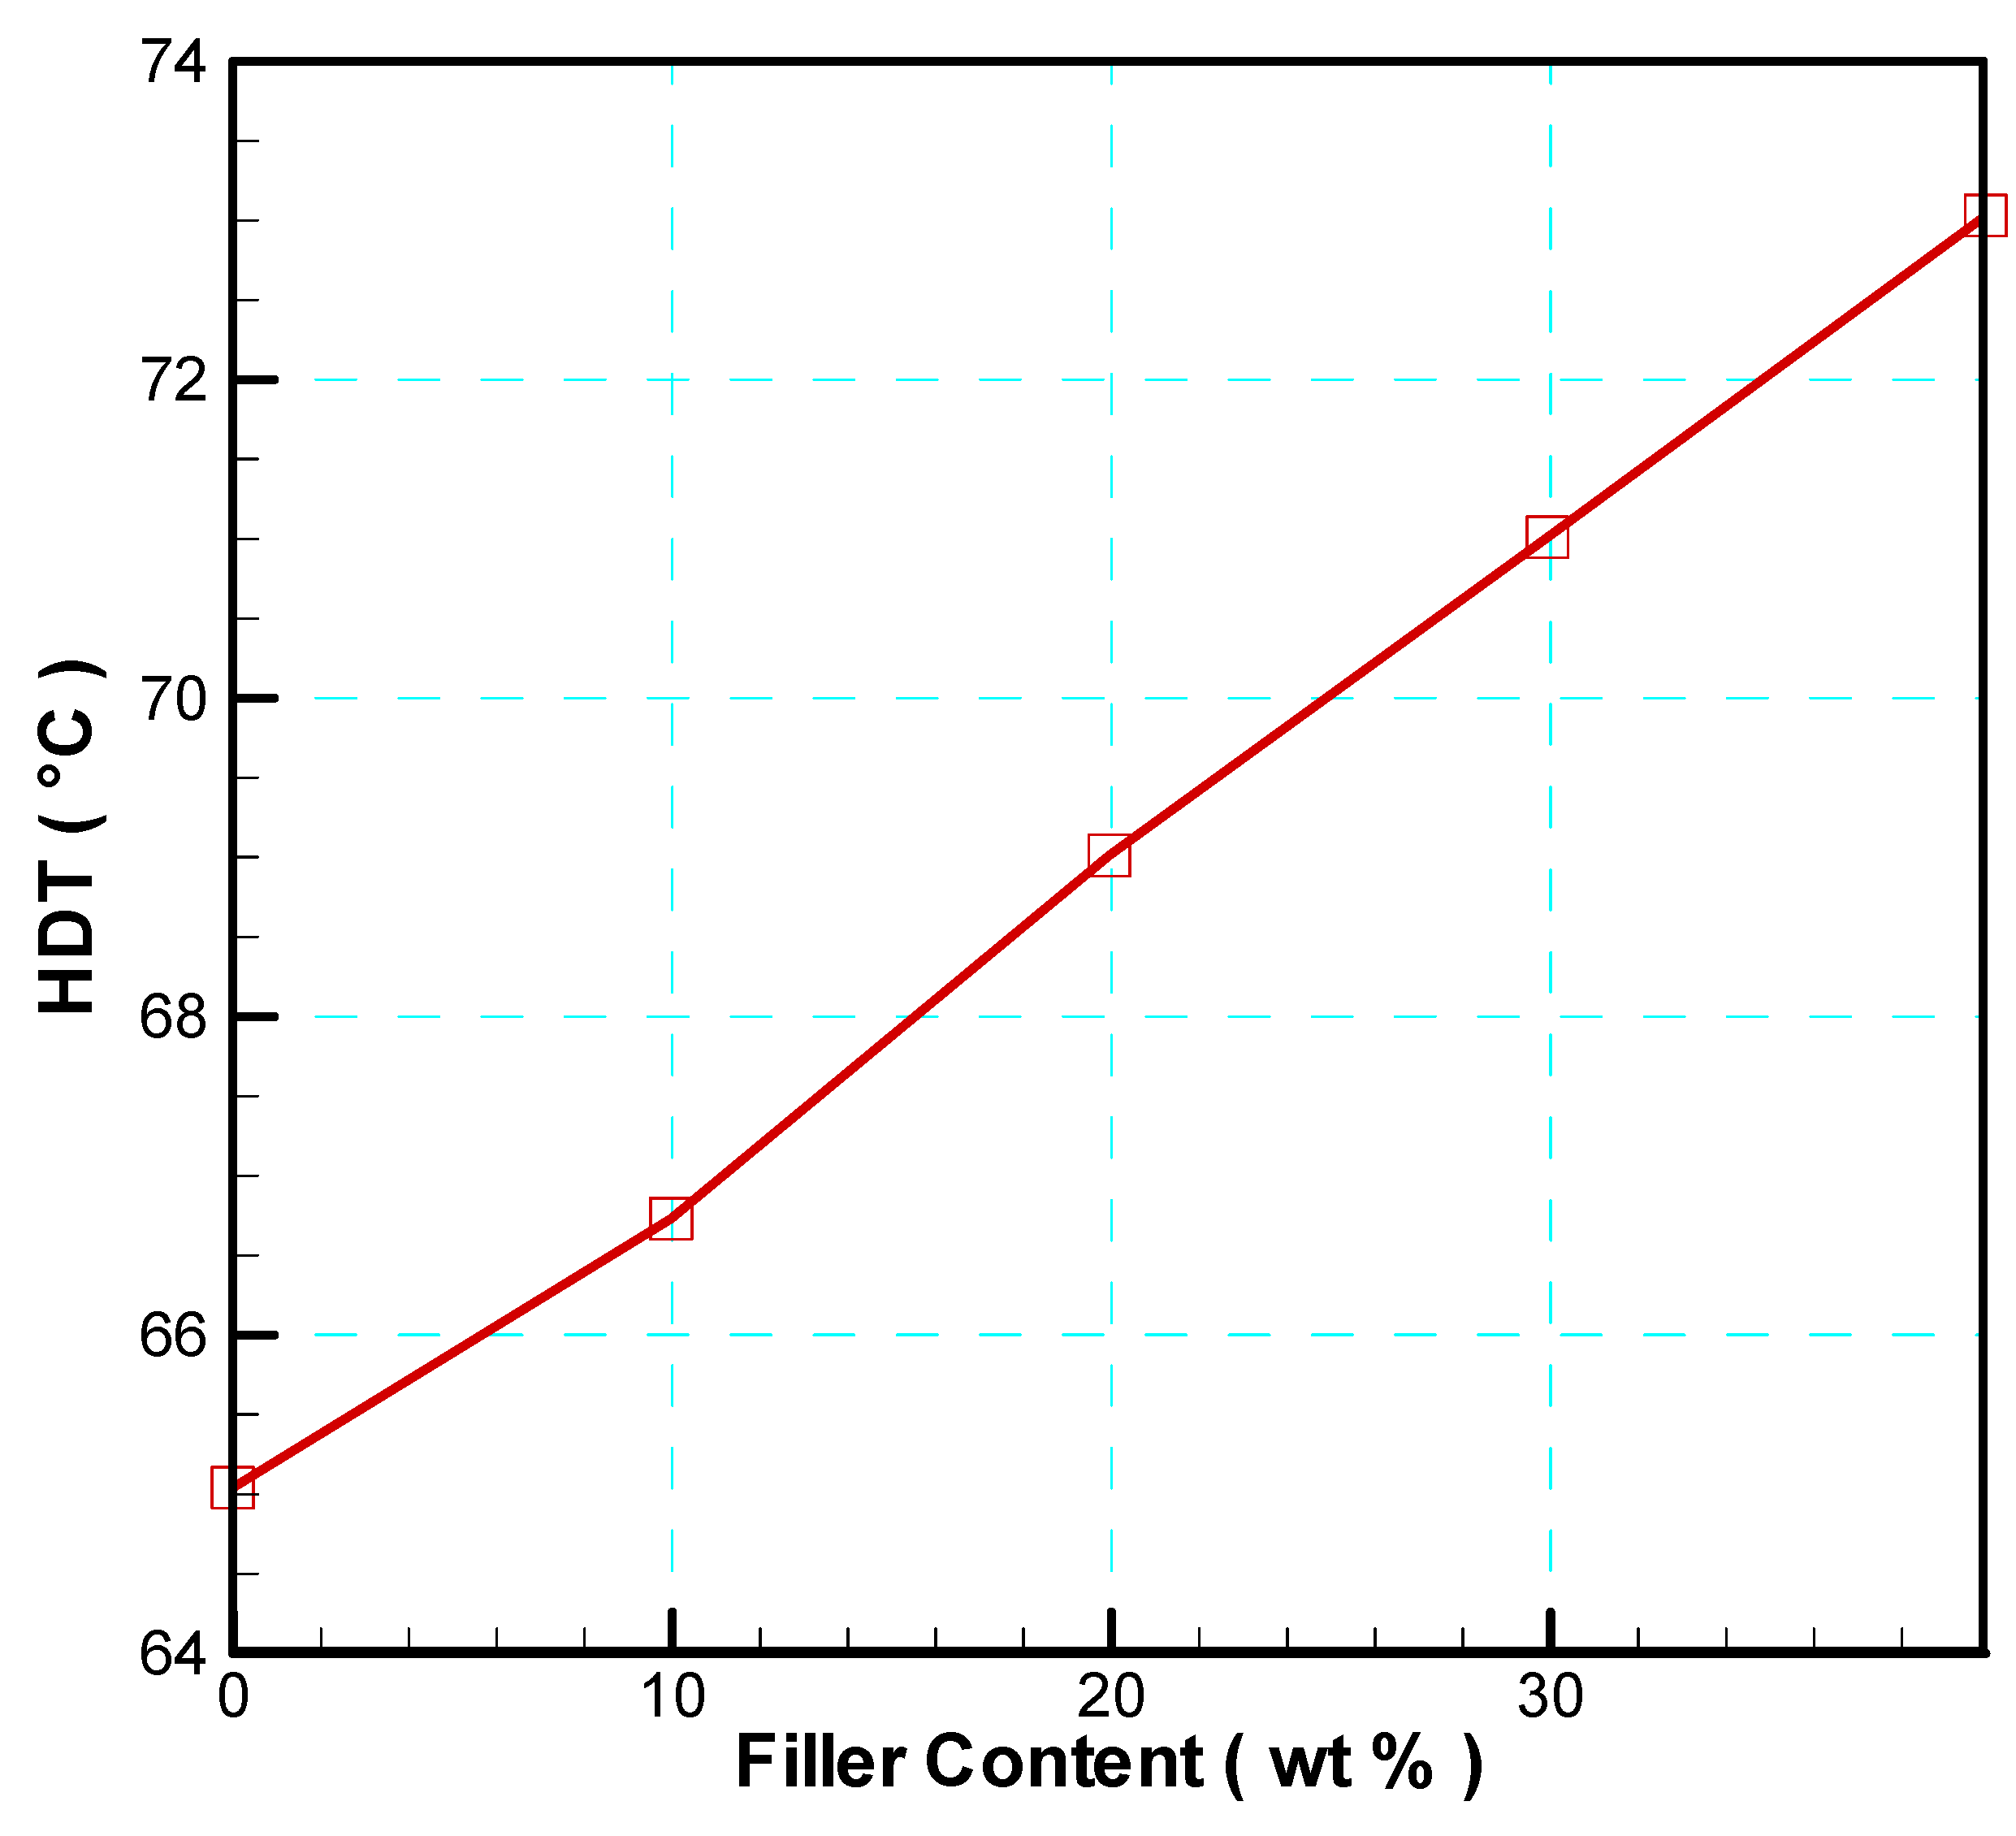
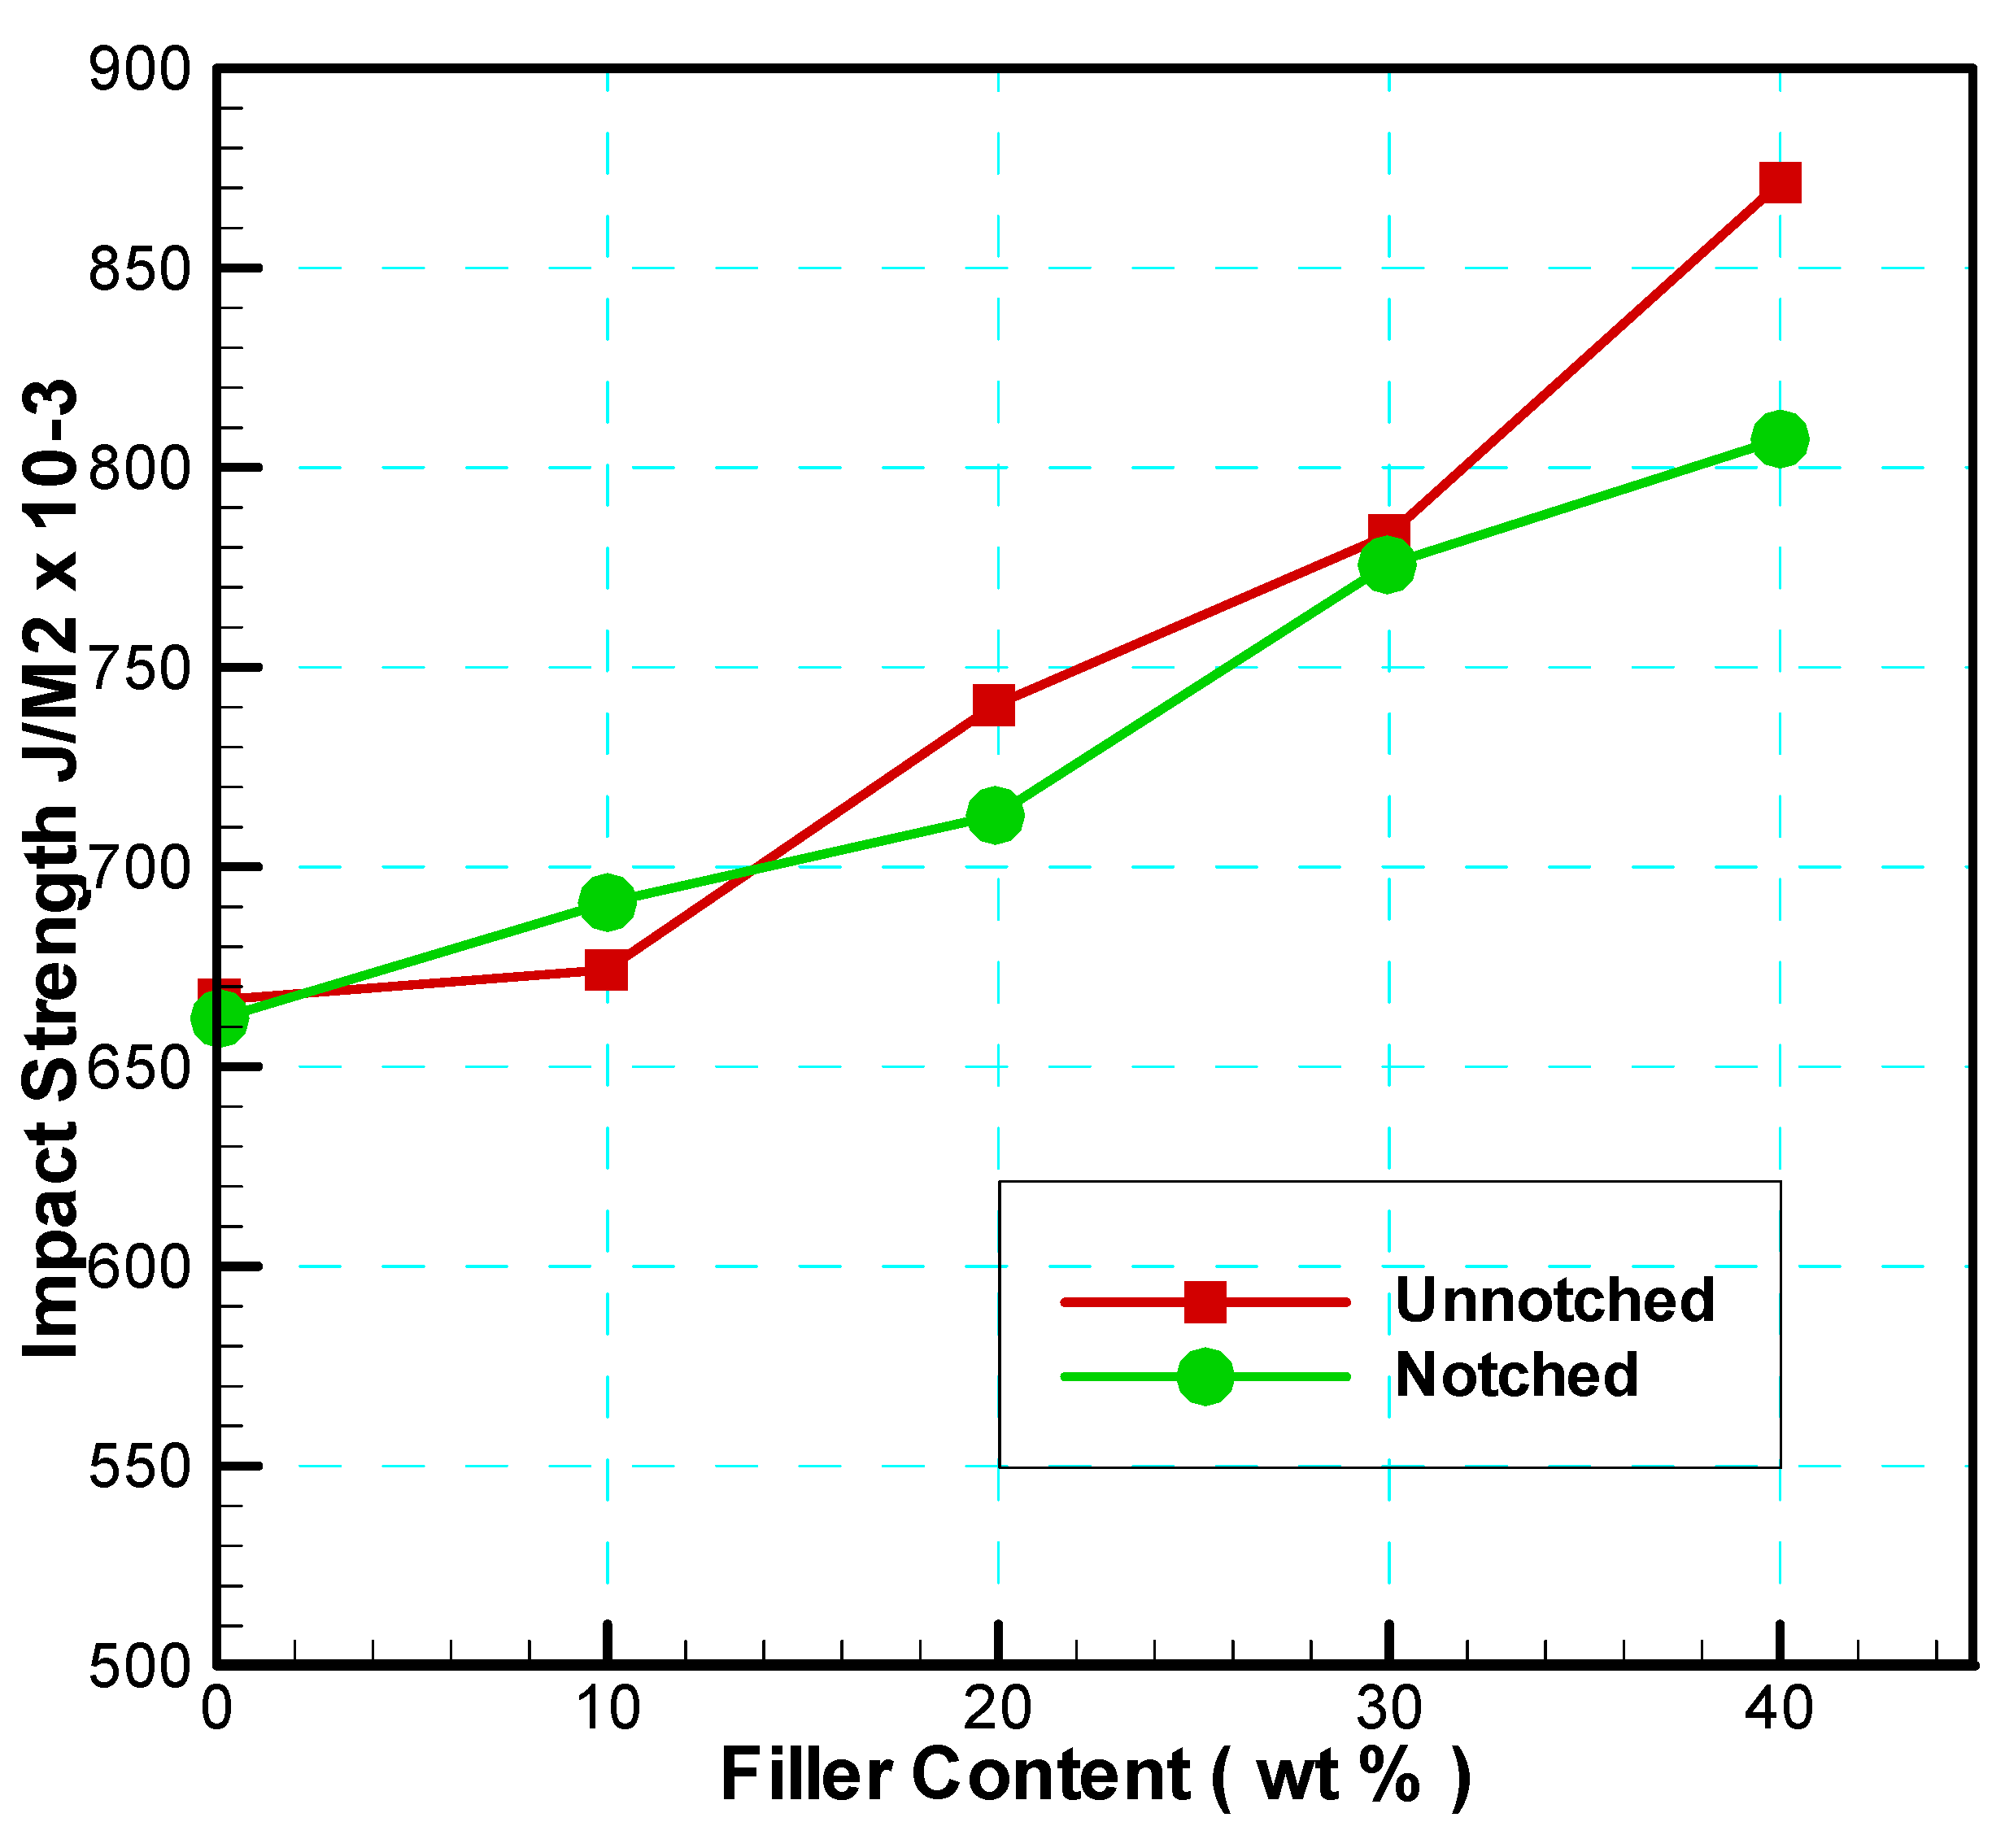
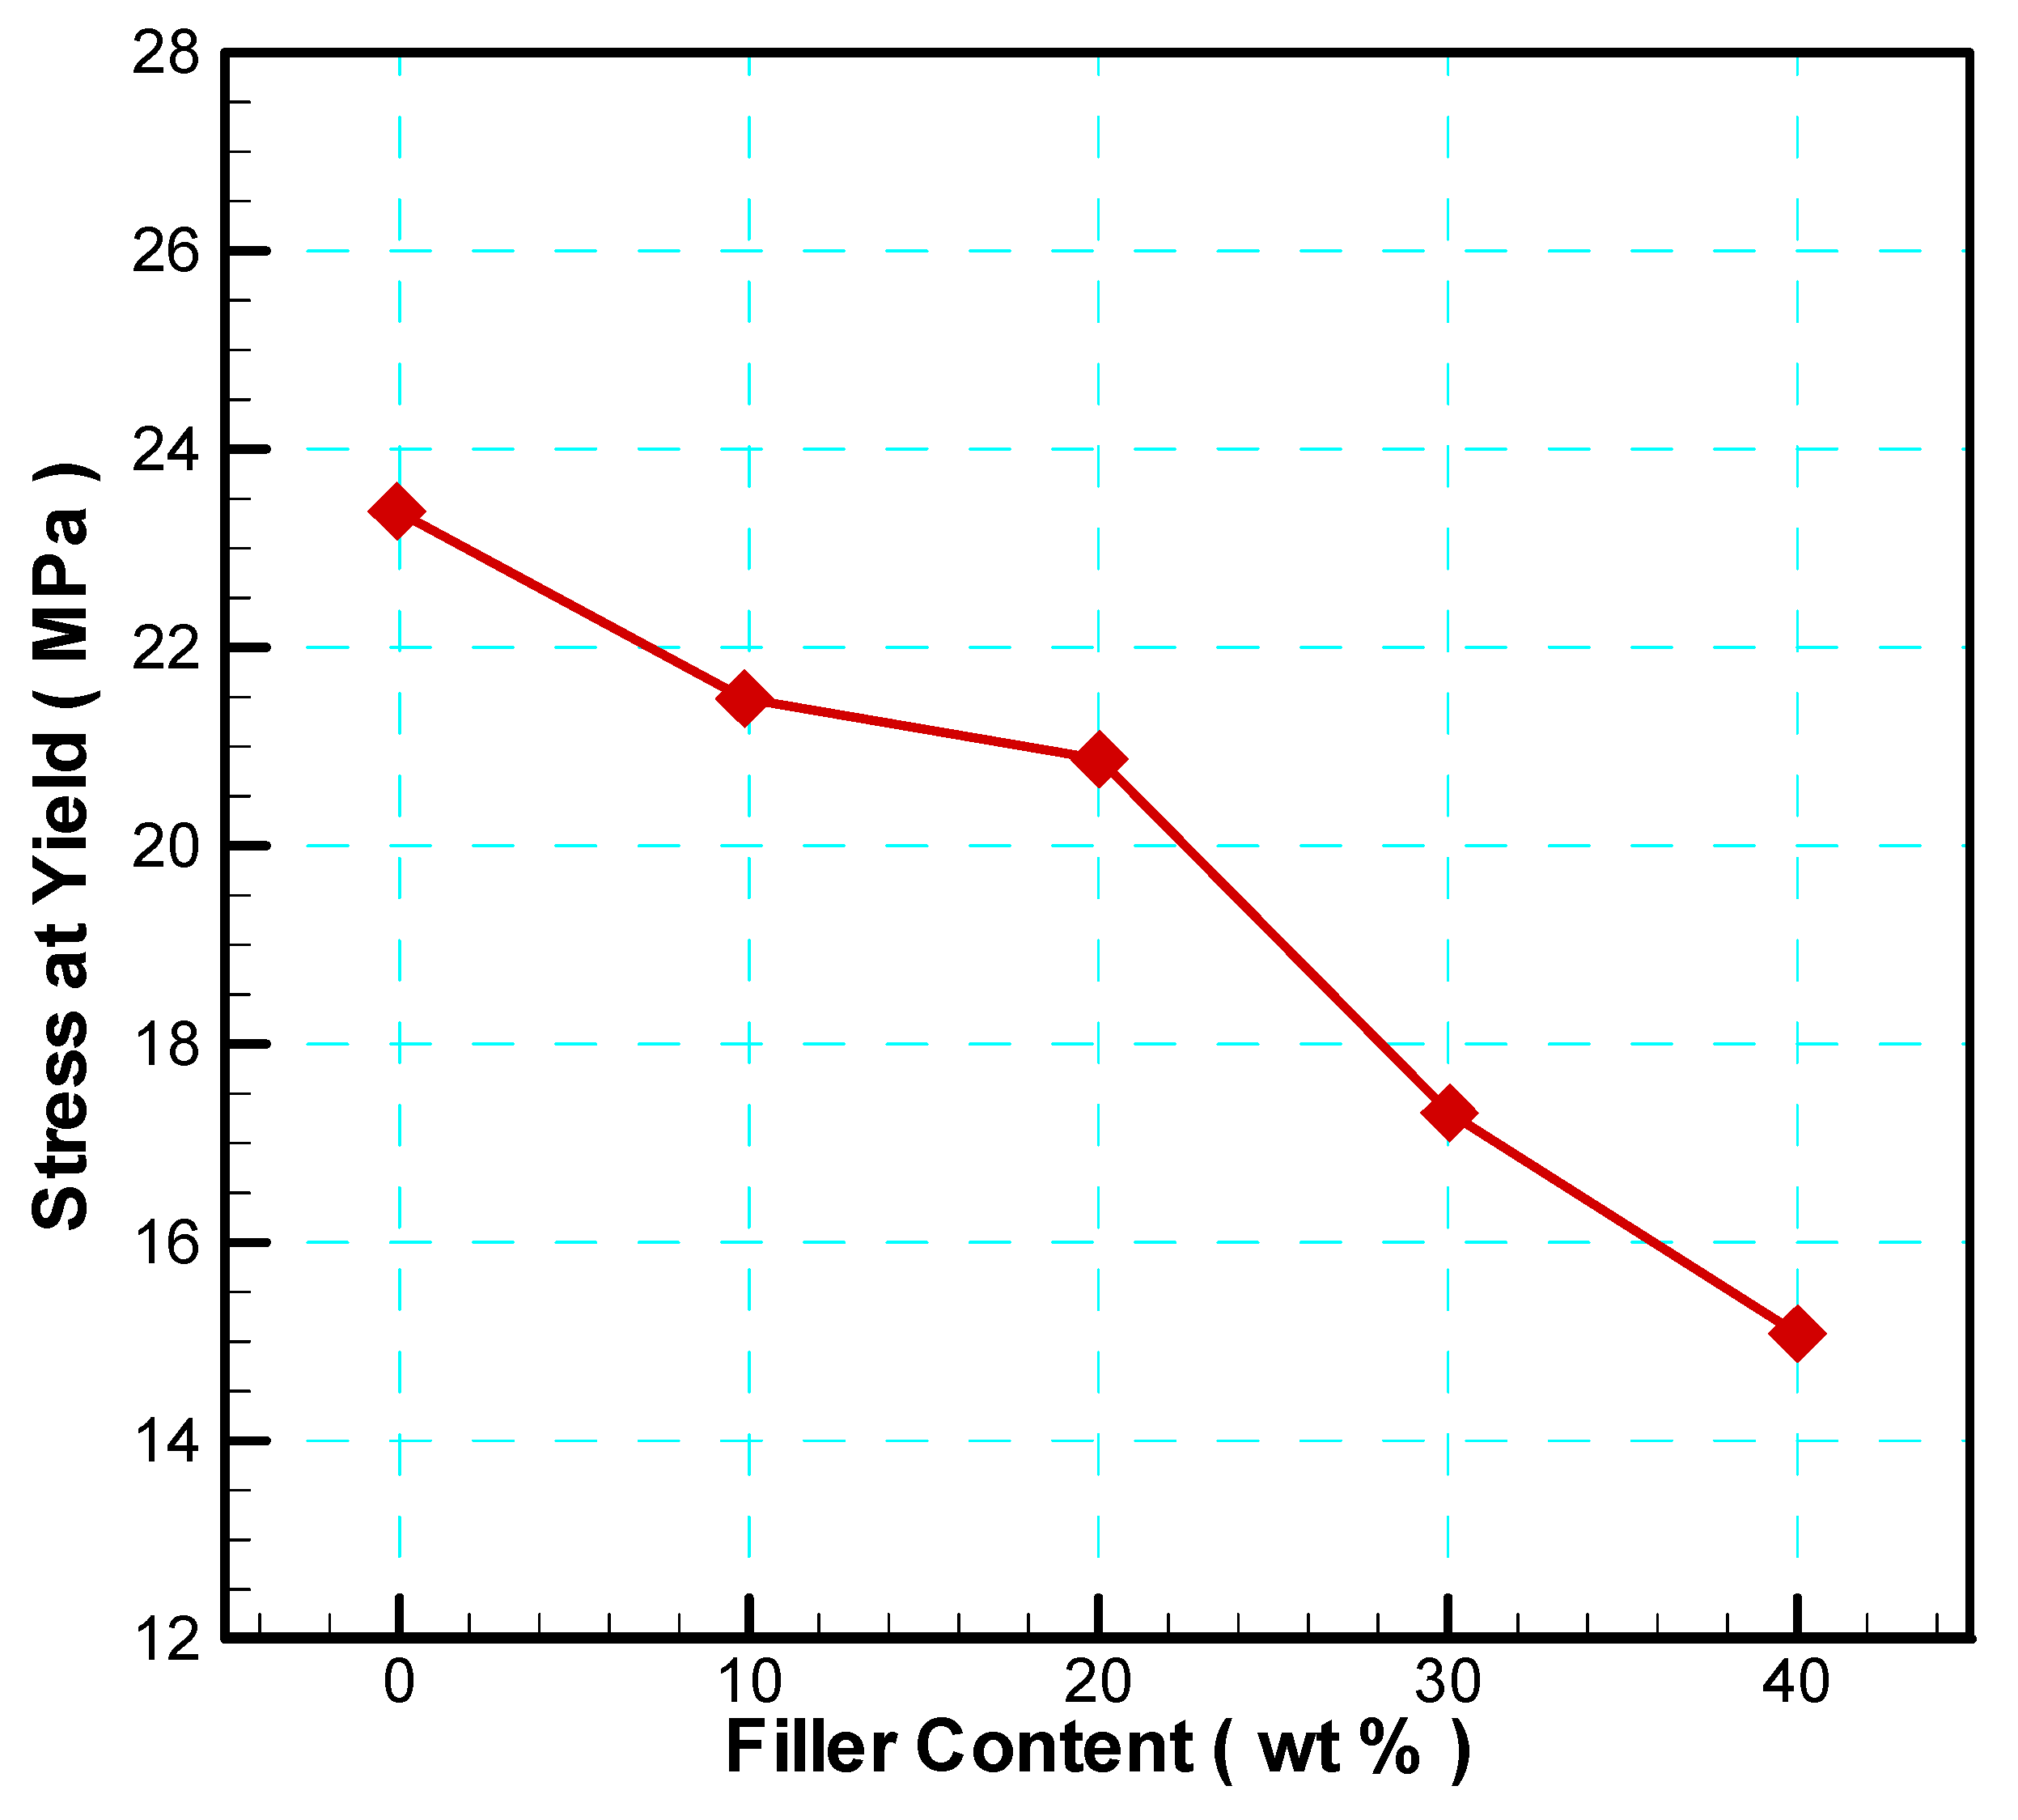
This work deals with the thermoformability of calcium carbonate CaCO3 filled polypropylene PP sheet intended for packaging applications. The effect of calcium carbonate was investigated. Formulations of virgin polypropylene (PP) and 10, 20, 30 and 40 wt % of calcium carbonate were prepared and melt compounded in a single screw extruder, then compression molded to get an about 1 mm thick sheets. Vacuum forming on a constructed laboratory scale machine seems to be an adequate way to select the appropriate thermoforming conditions (temperatures and draw ratios) for CaCO3 filled polypropylene. Rheological, thermal as well as mechanical tests were performed in terms of filler effect in order to optimize properties while improving processability. The MFI slightly increased, the HDT increased, the tensile properties decreased but the impact strength increased. 30% by weight of CaCO3 filler can be incorporated into polypropylene with relatively minor effects on vacuum forming properties. The presence of CaCO3 leads to 50% reduction the thermoforming cycle time.
Keywords:
1. Introduction
2. Leterature Review
- ✓
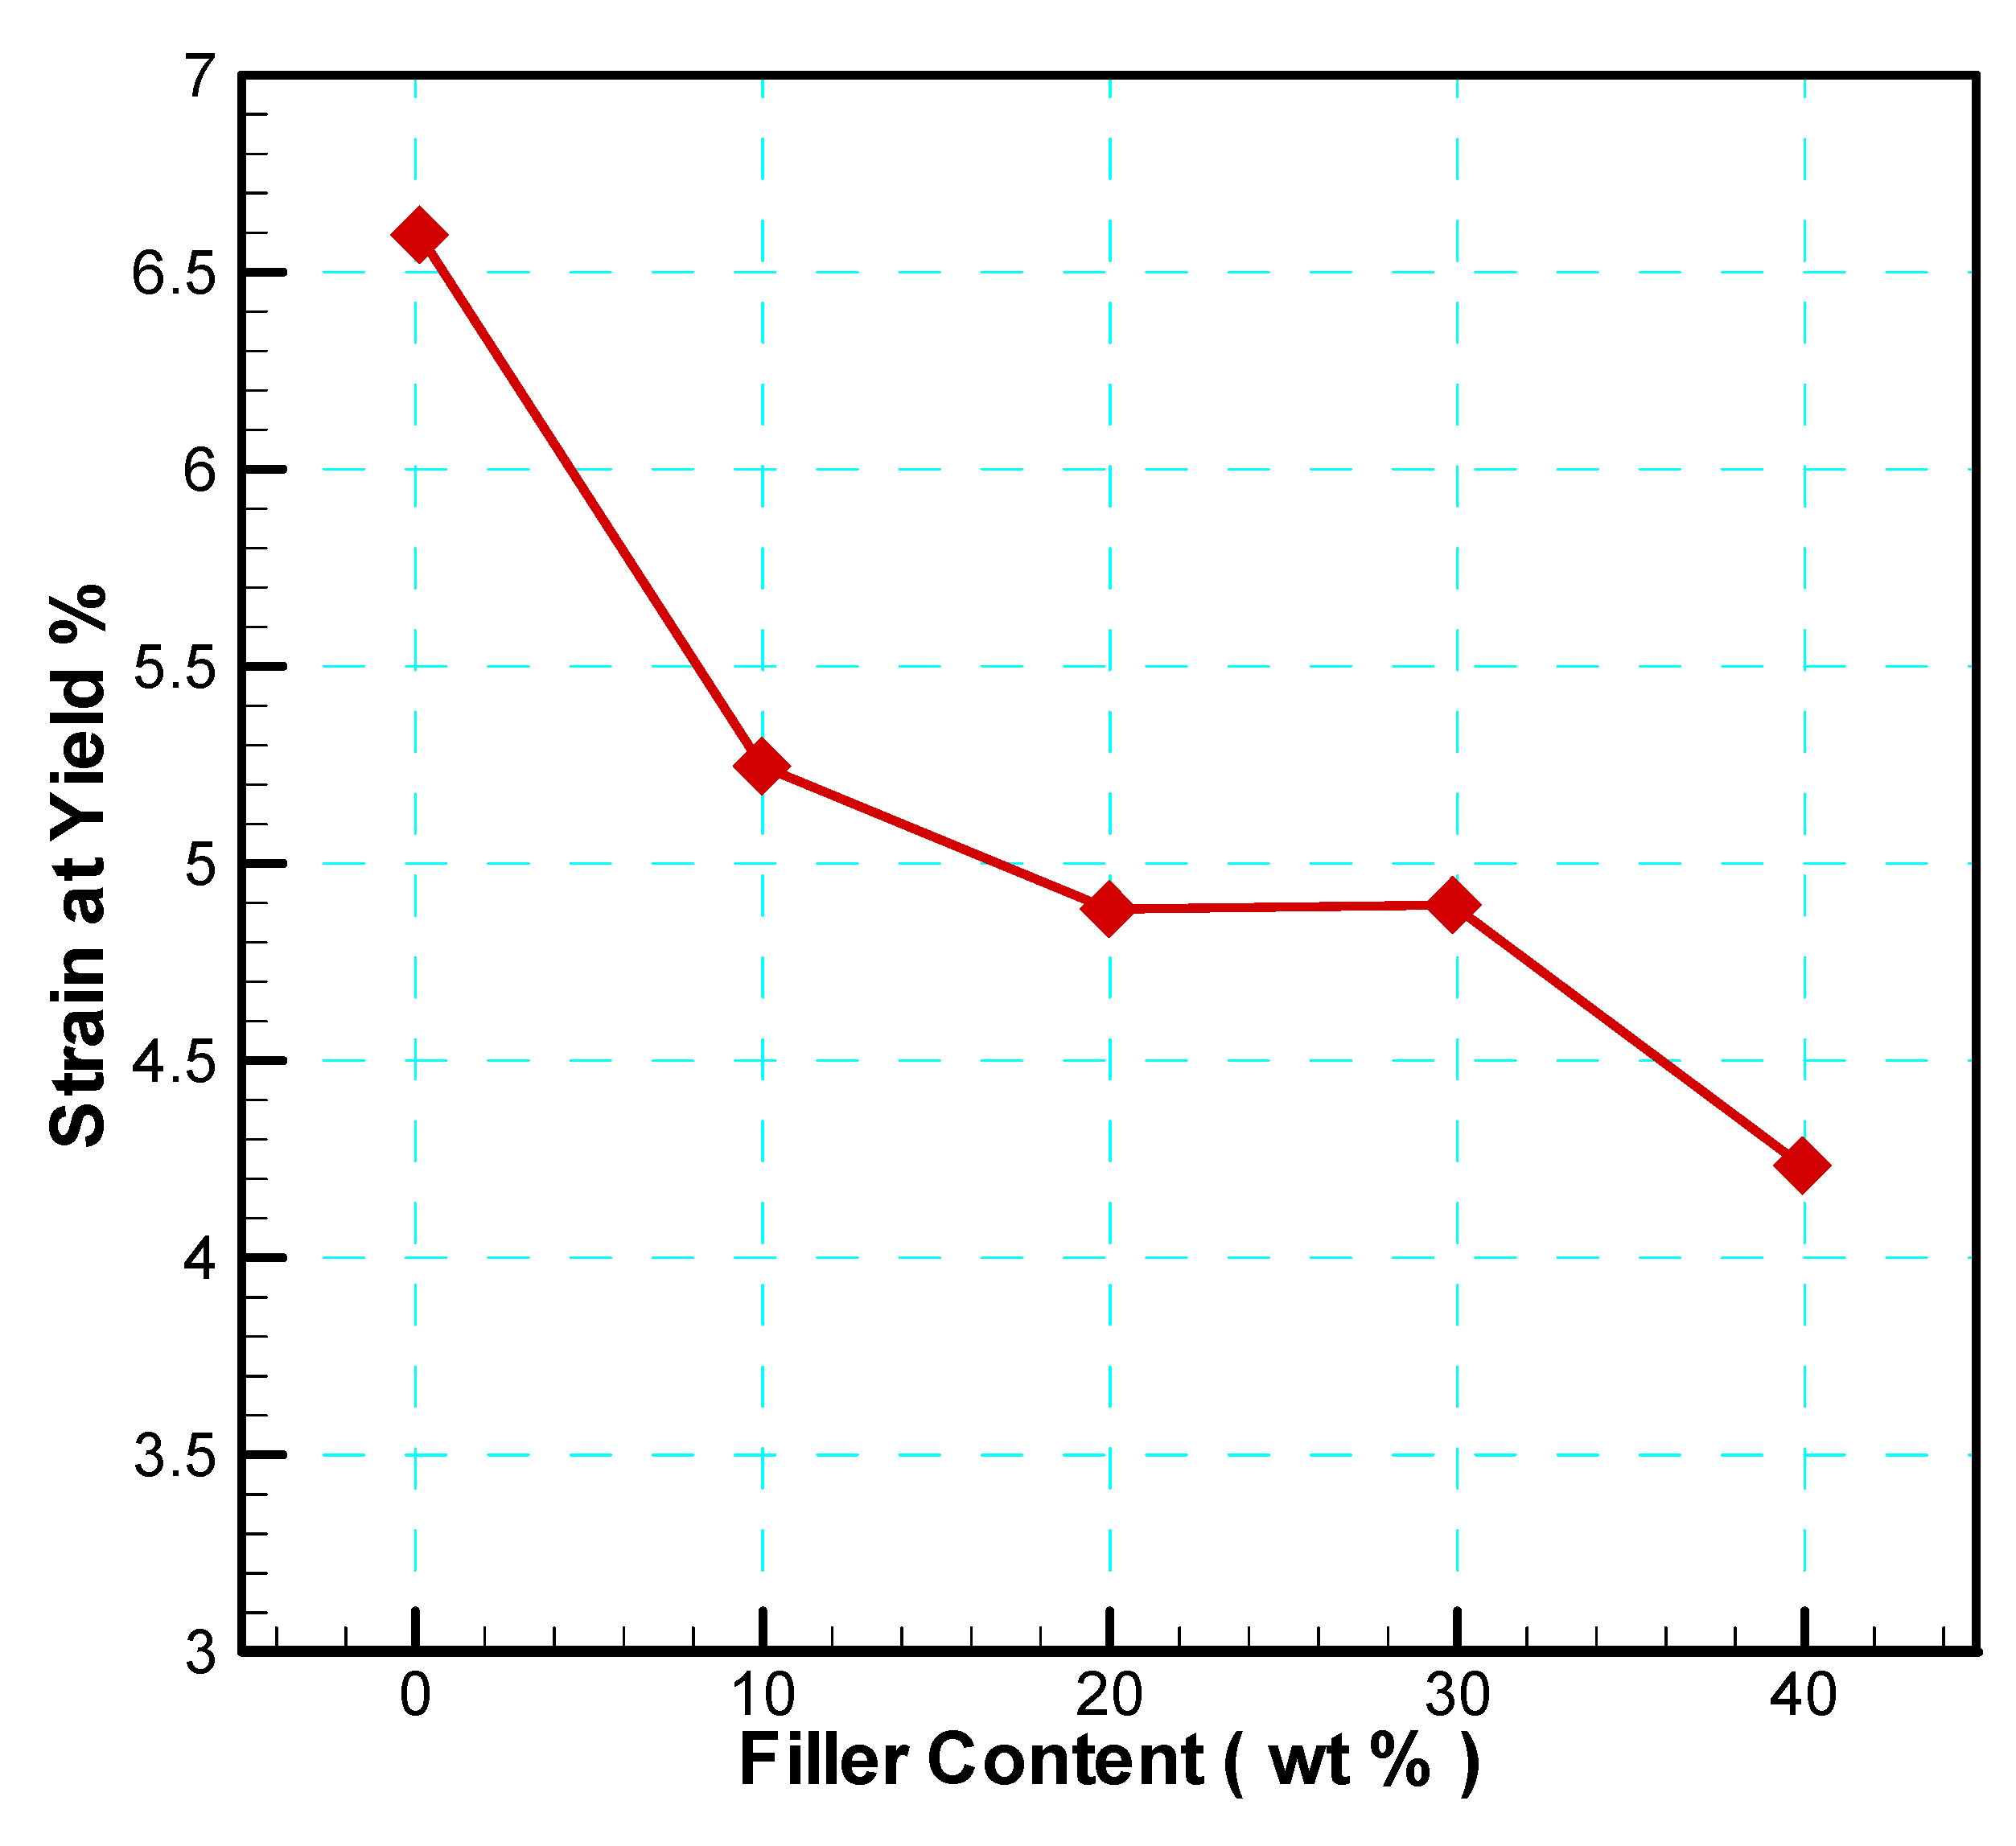
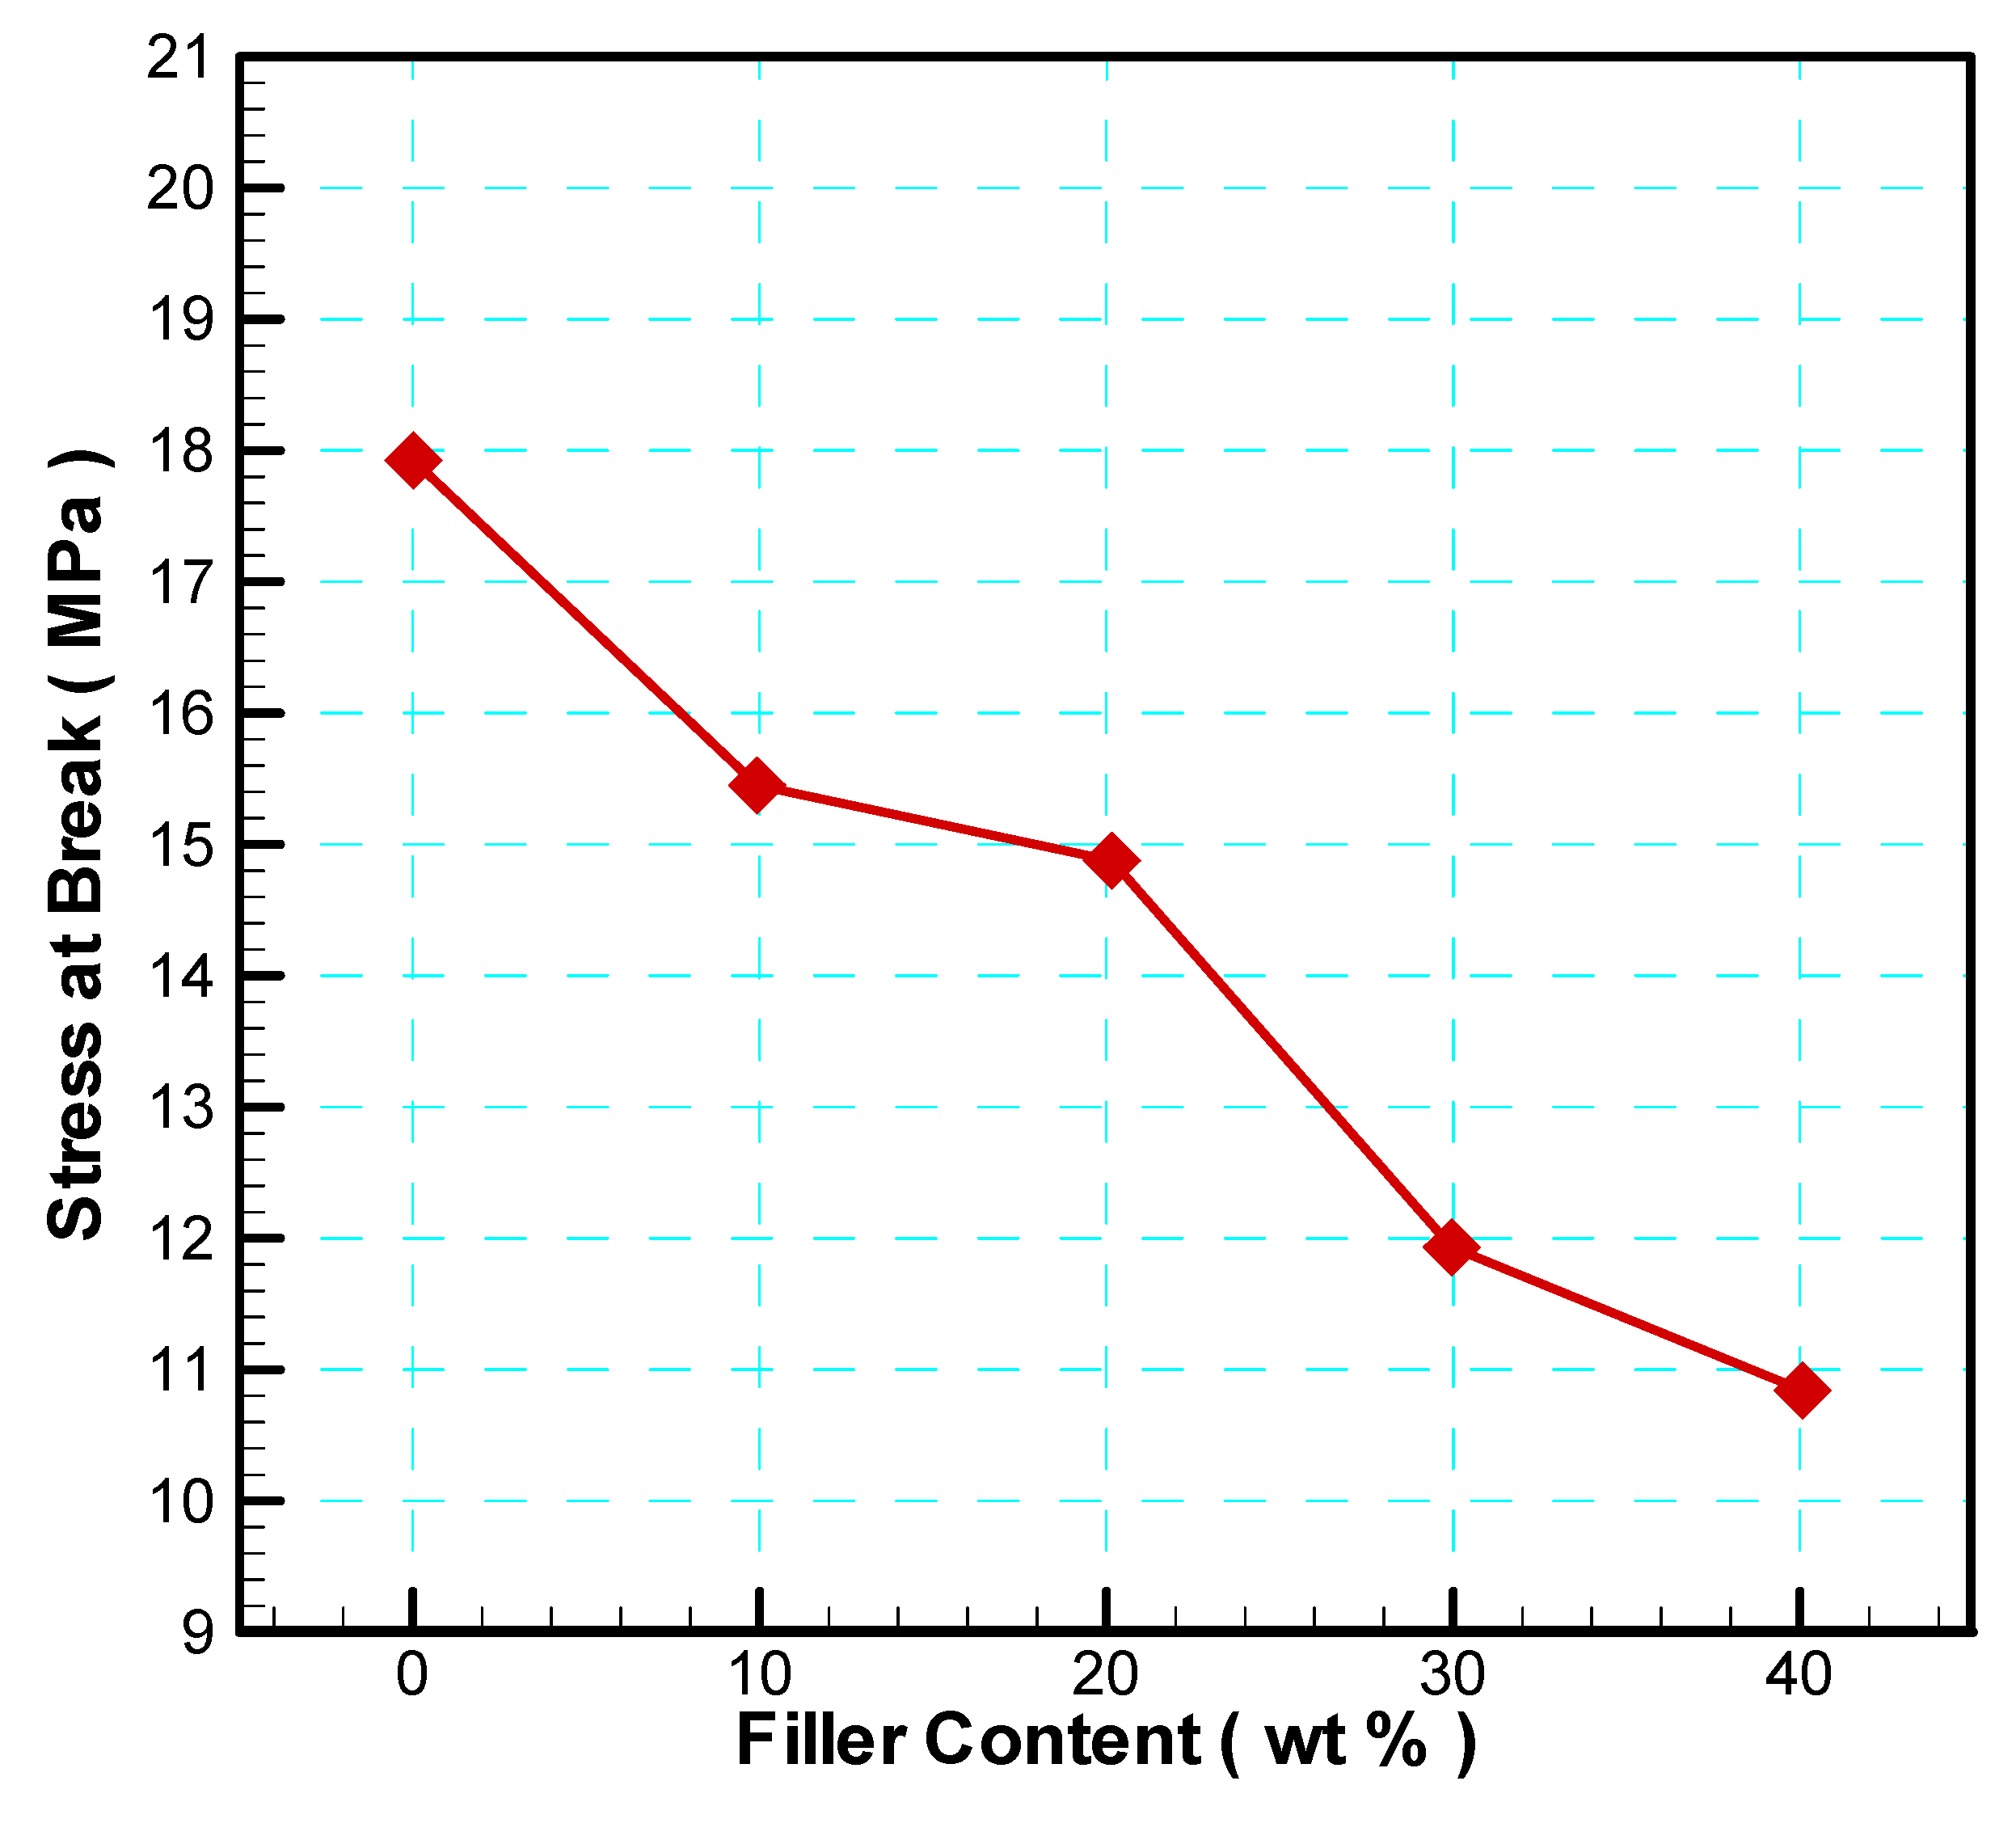
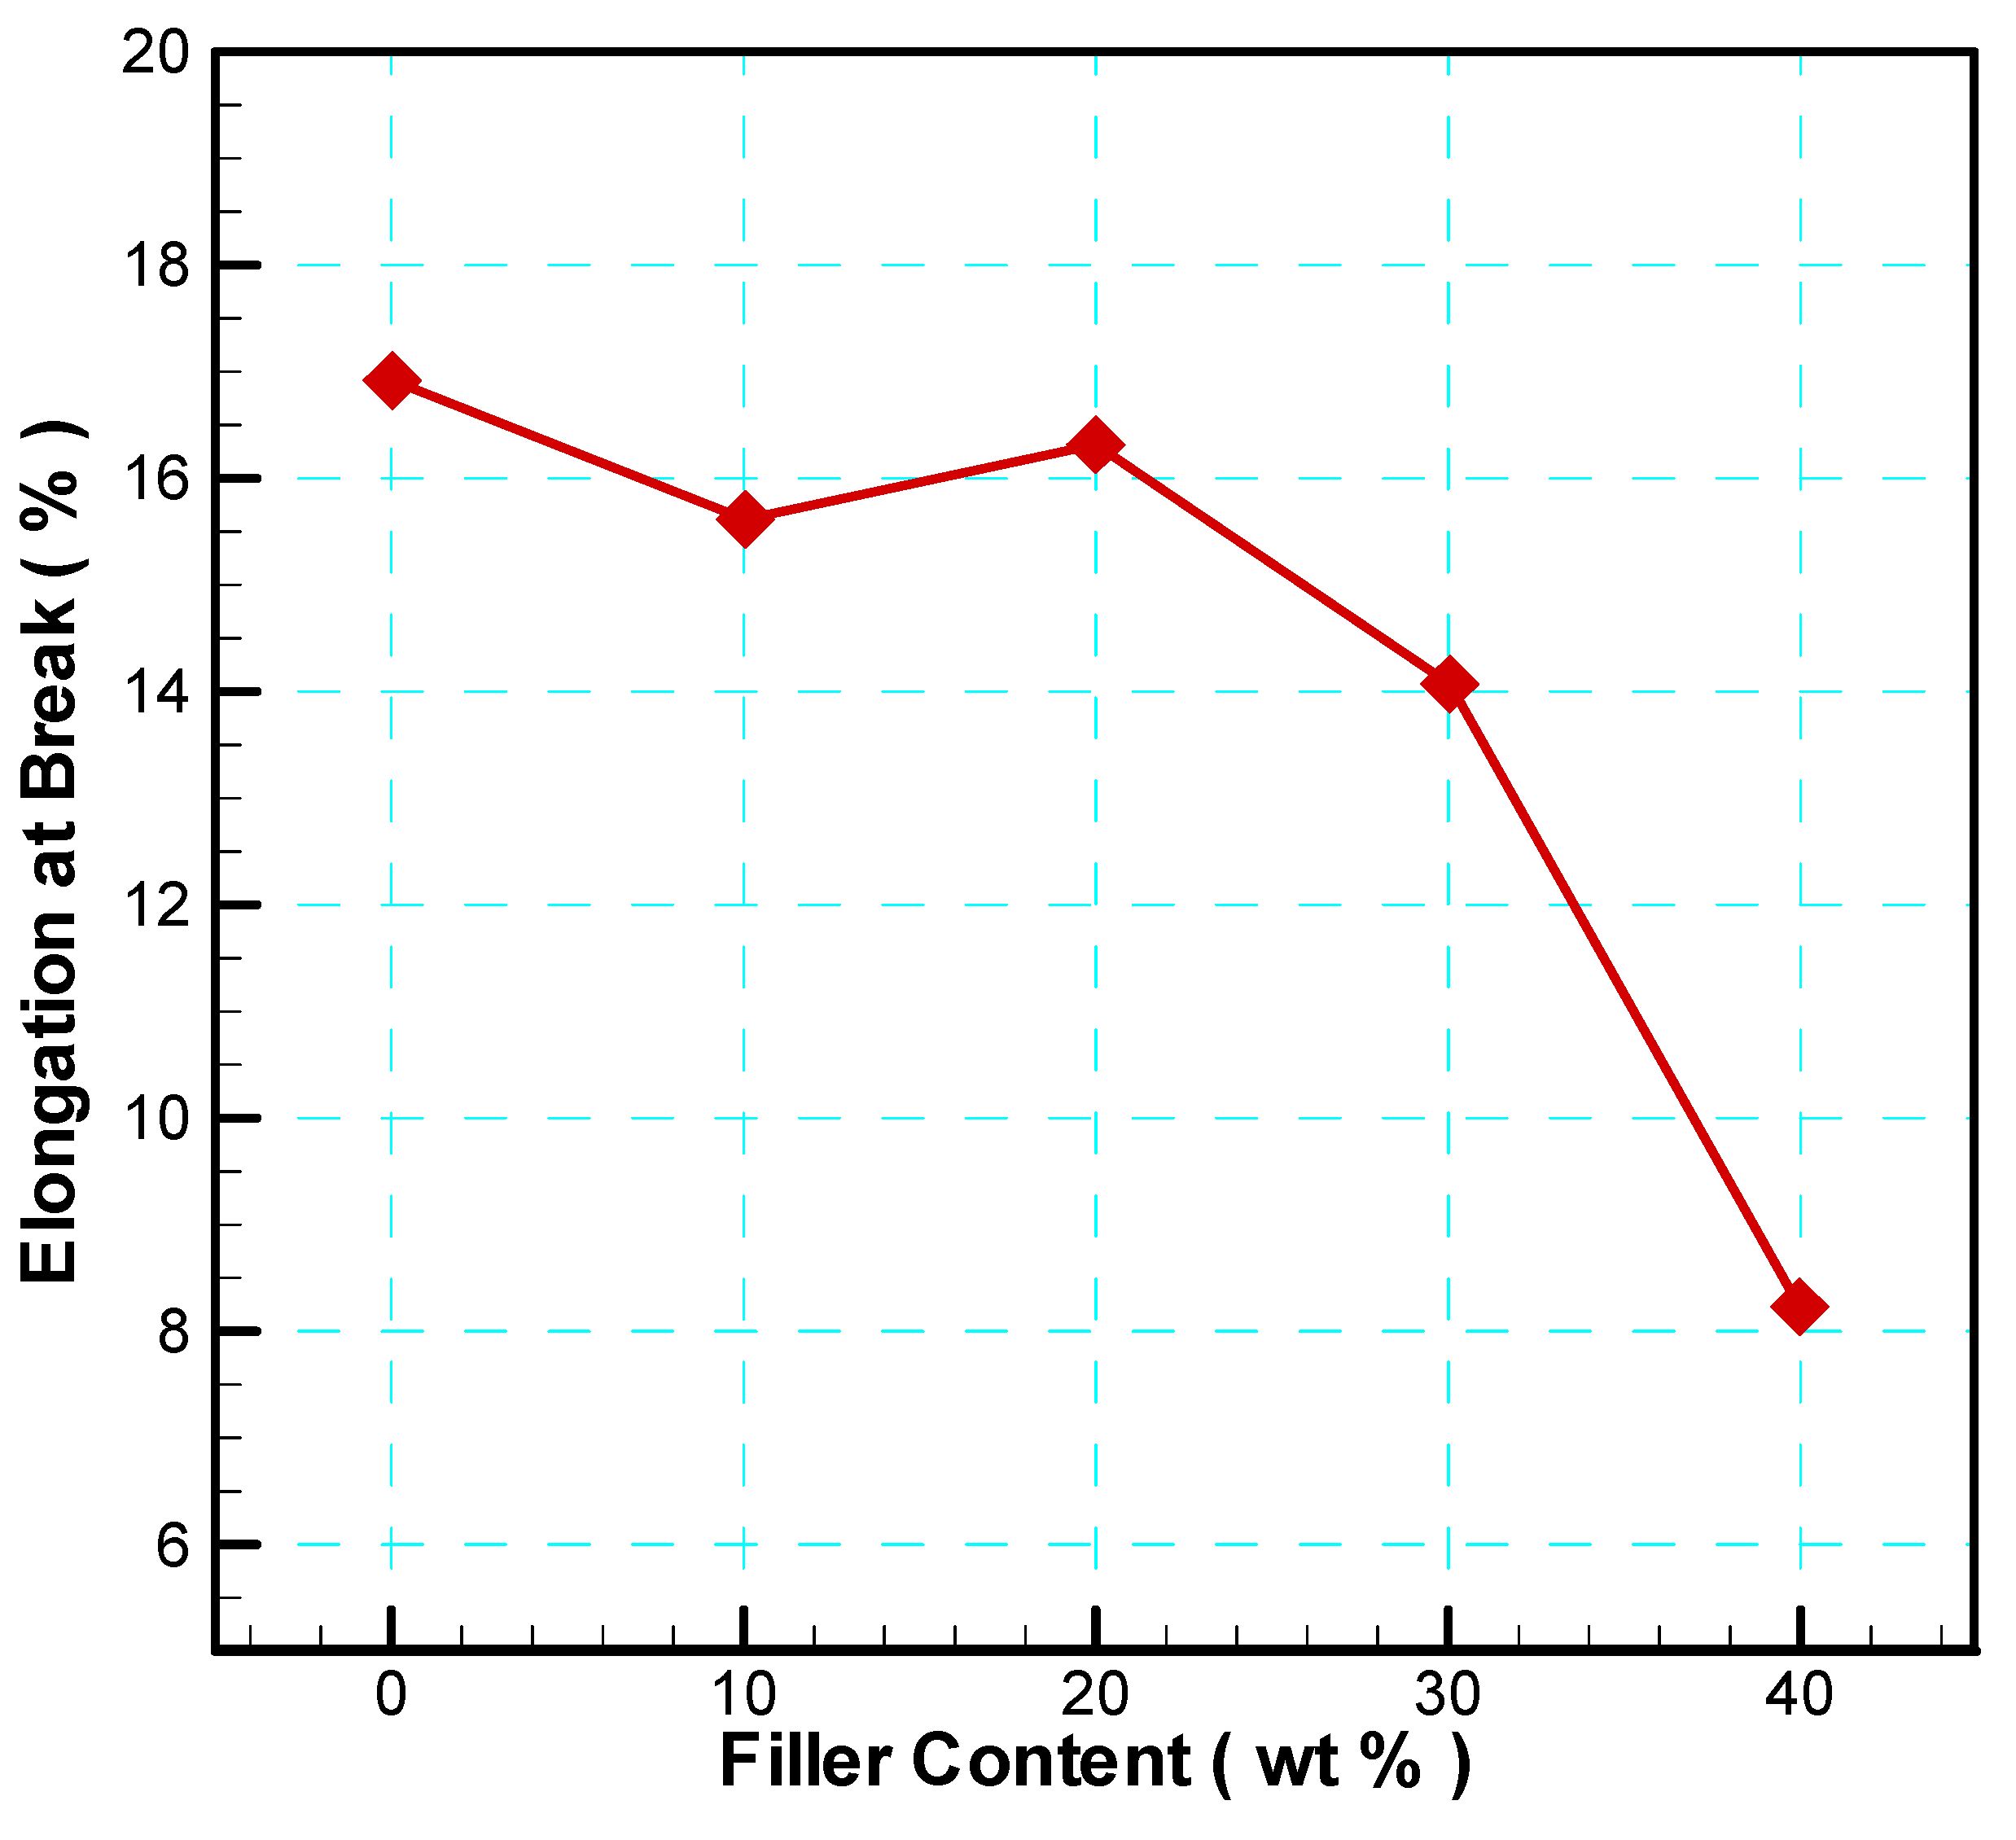
- The mechanical properties (tensile strength, elastic modulus, elongation at break) were decreased with the increase of CaCO3 content,
- ✓
- The reduction in these properties was much higher as the temperature increased from 5 °C to 60 °C due to the poor interaction between PP and CaCO3.
- ✓
- The impact strength improved only at 8% of CaCO3 due to the good homogeneity and distribution of CaCO3.
- ✓
- Rheological results showed that the melt flow rate MFR was increased at both test temperatures, 190 °C and 230 °C, and had its highest value at 16 wt. % of CaCO3.
3. Experemental Work
3.1. Equipement Used
3.1.1. Injection Molding Machine
3.1.2. Melt Compounding
3.1.3. Compression Molding
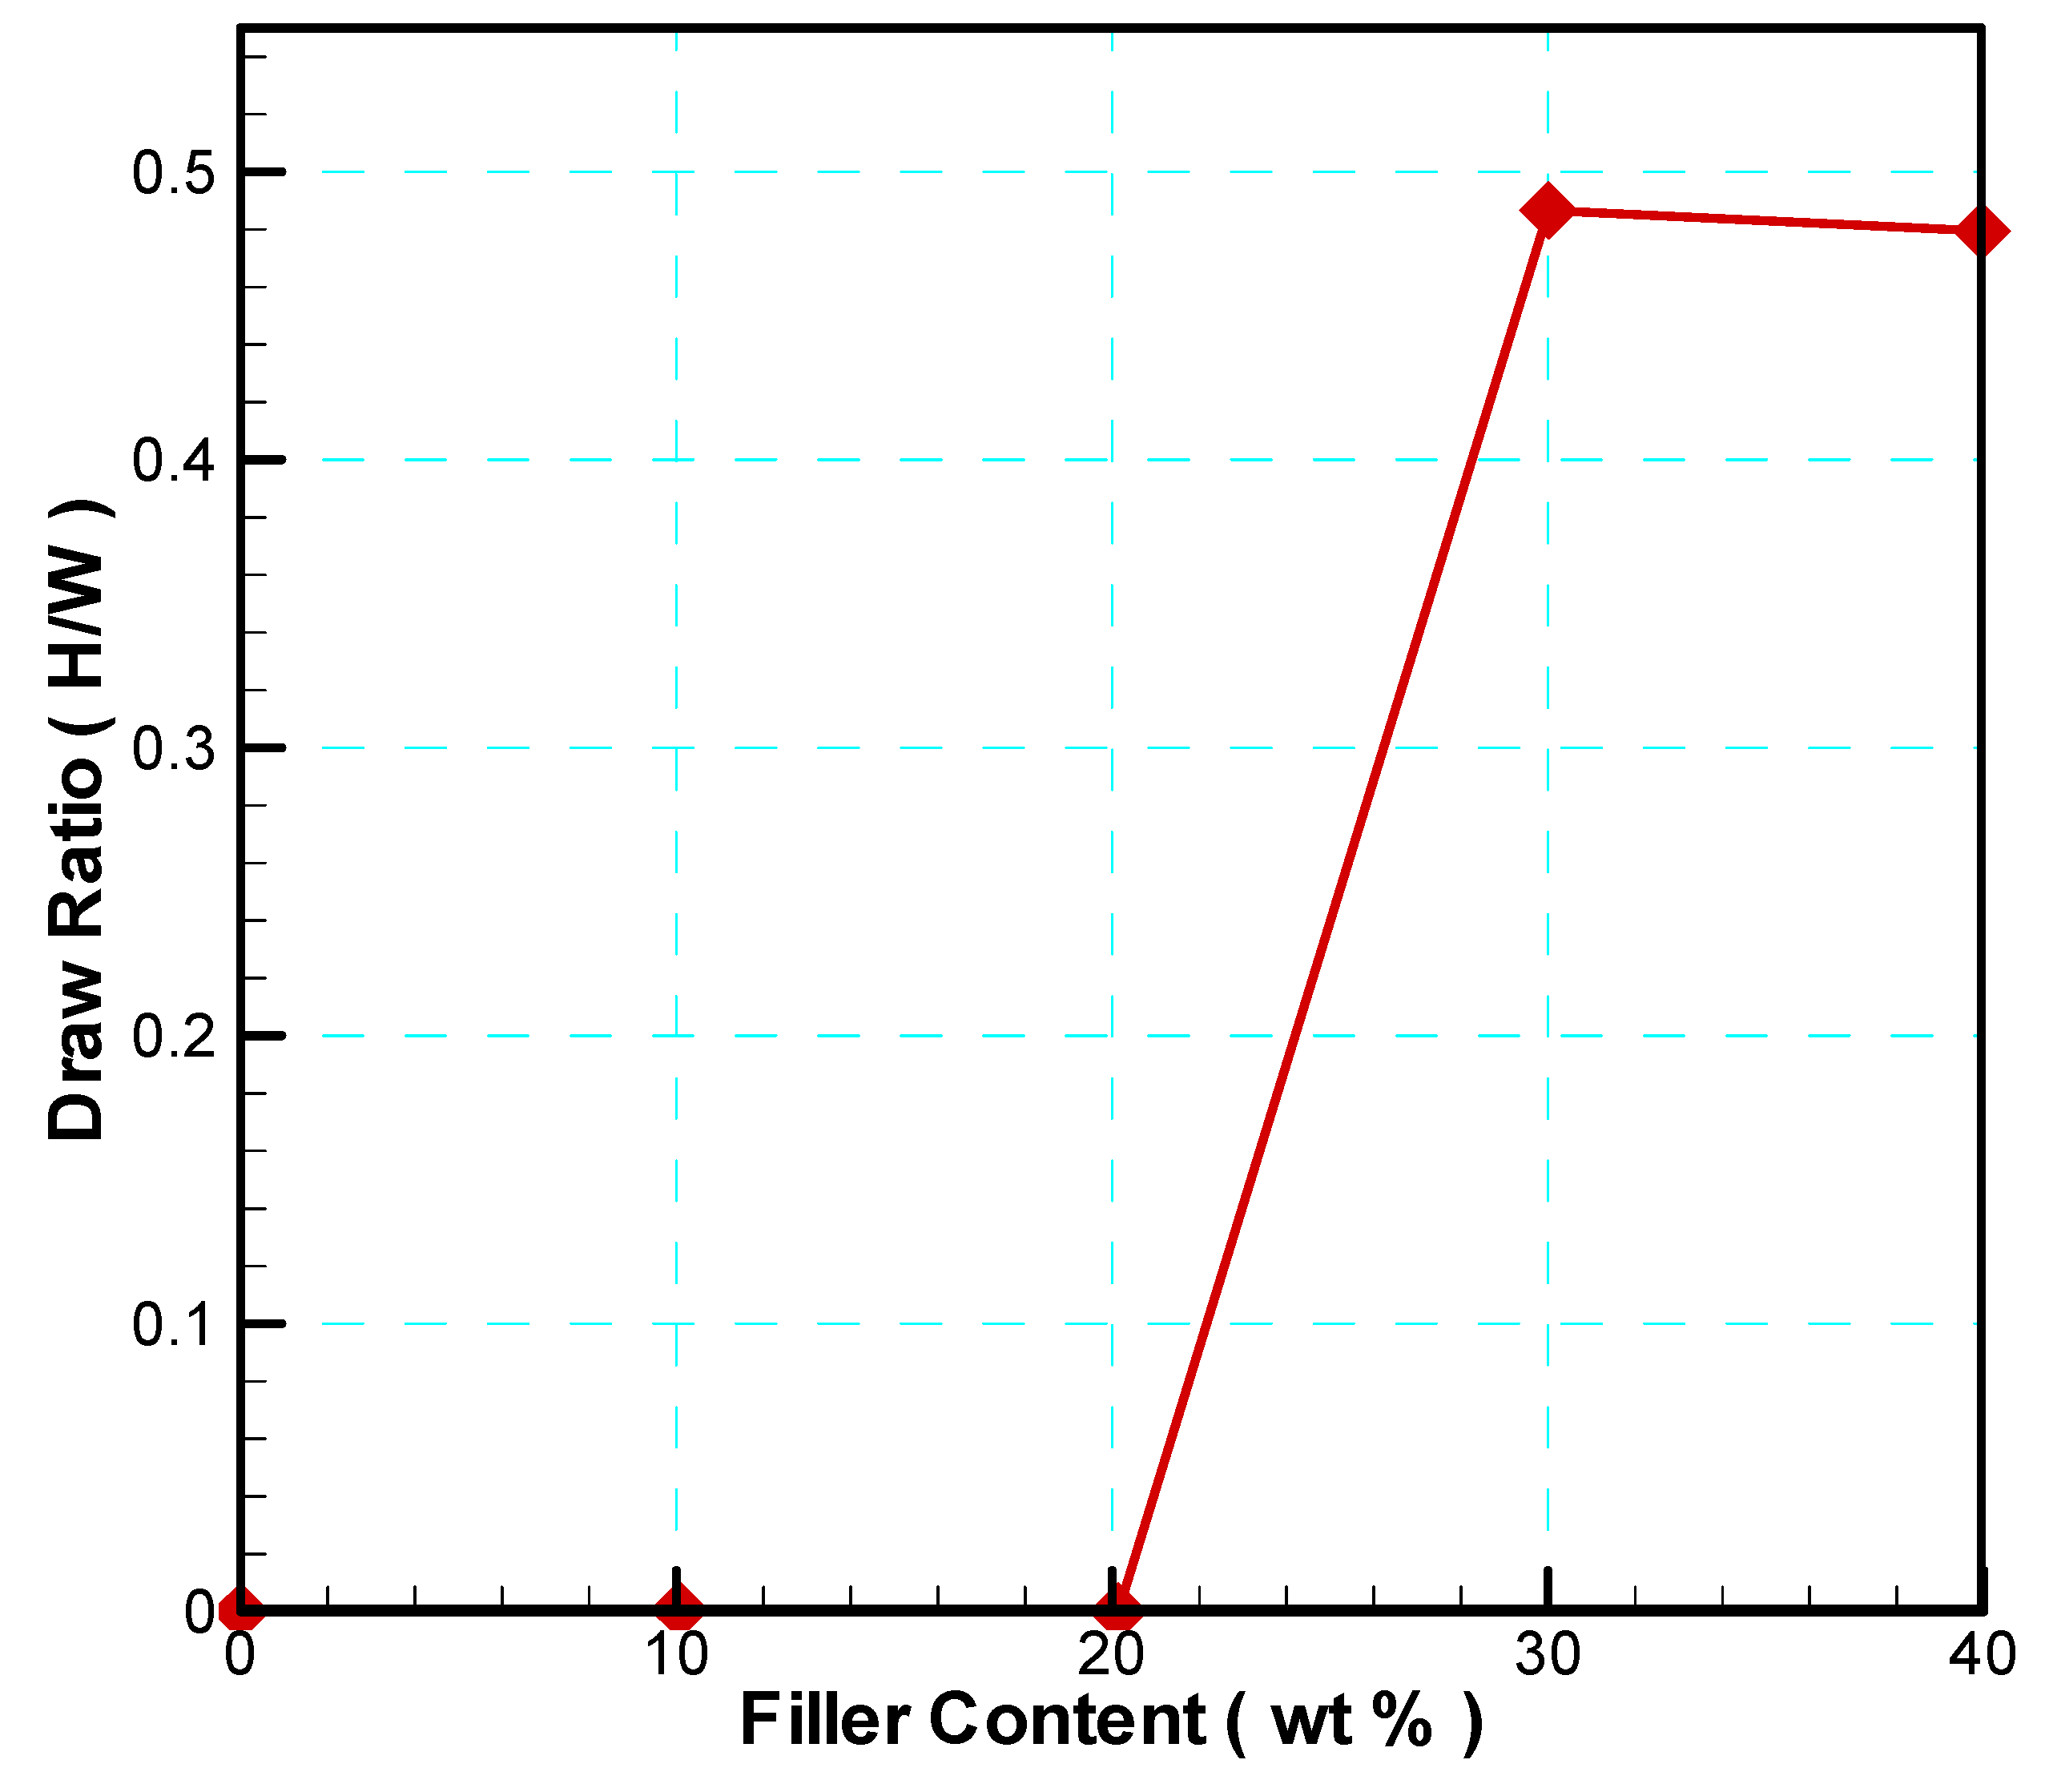
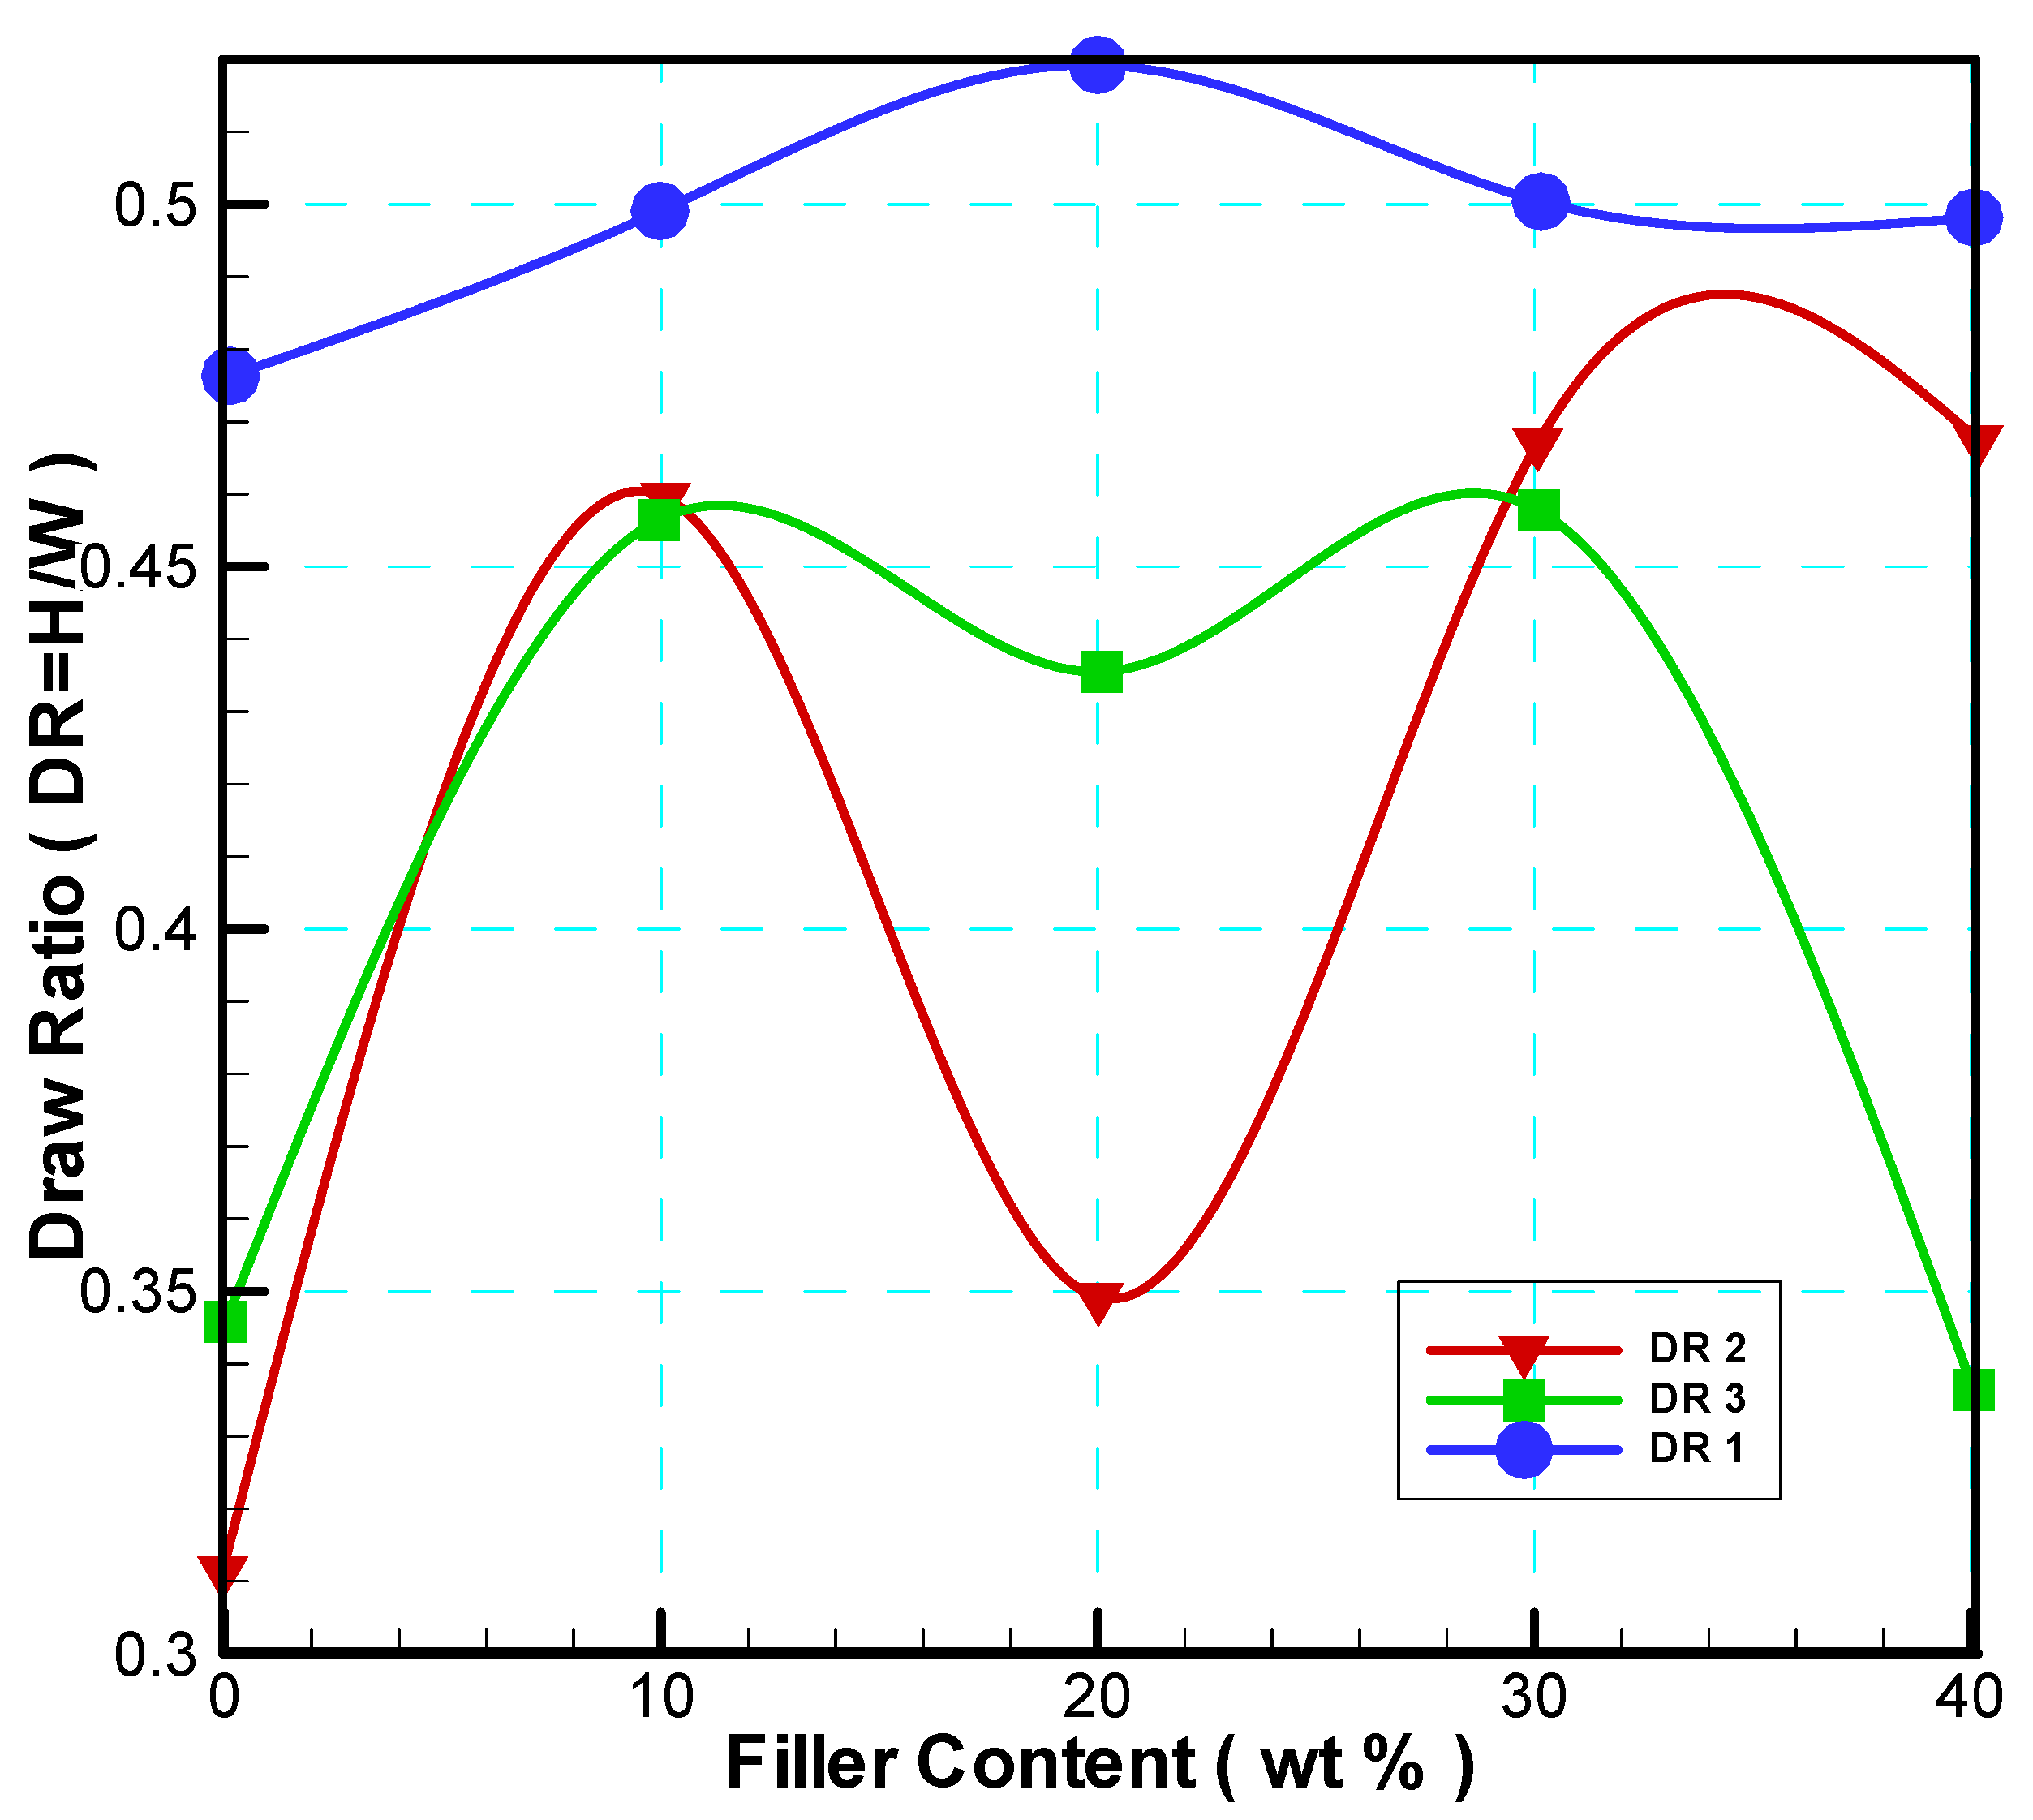
3.1.4. Vacuum Forming
3.2. Used Materials Characteristics
3.2.1. Resin
3.2.2. Filler
3.2.3. Formulations
| Formule | F00 | F10 | F20 | F30 | F40 |
| CaCO3 | 0 | 10 | 20 | 30 | 40 |
3.3. Testing Procedure
3.3.1. Rheological Properties
3.3.1.1. MFI
3.3.2. Thermal Properties
3.3.2.1. Heat Deflection Under Load (HDT)
3.3.3. Mechanical Properties
3.3.3.1. Impact Strength
3.3.3.2. Tensile Test
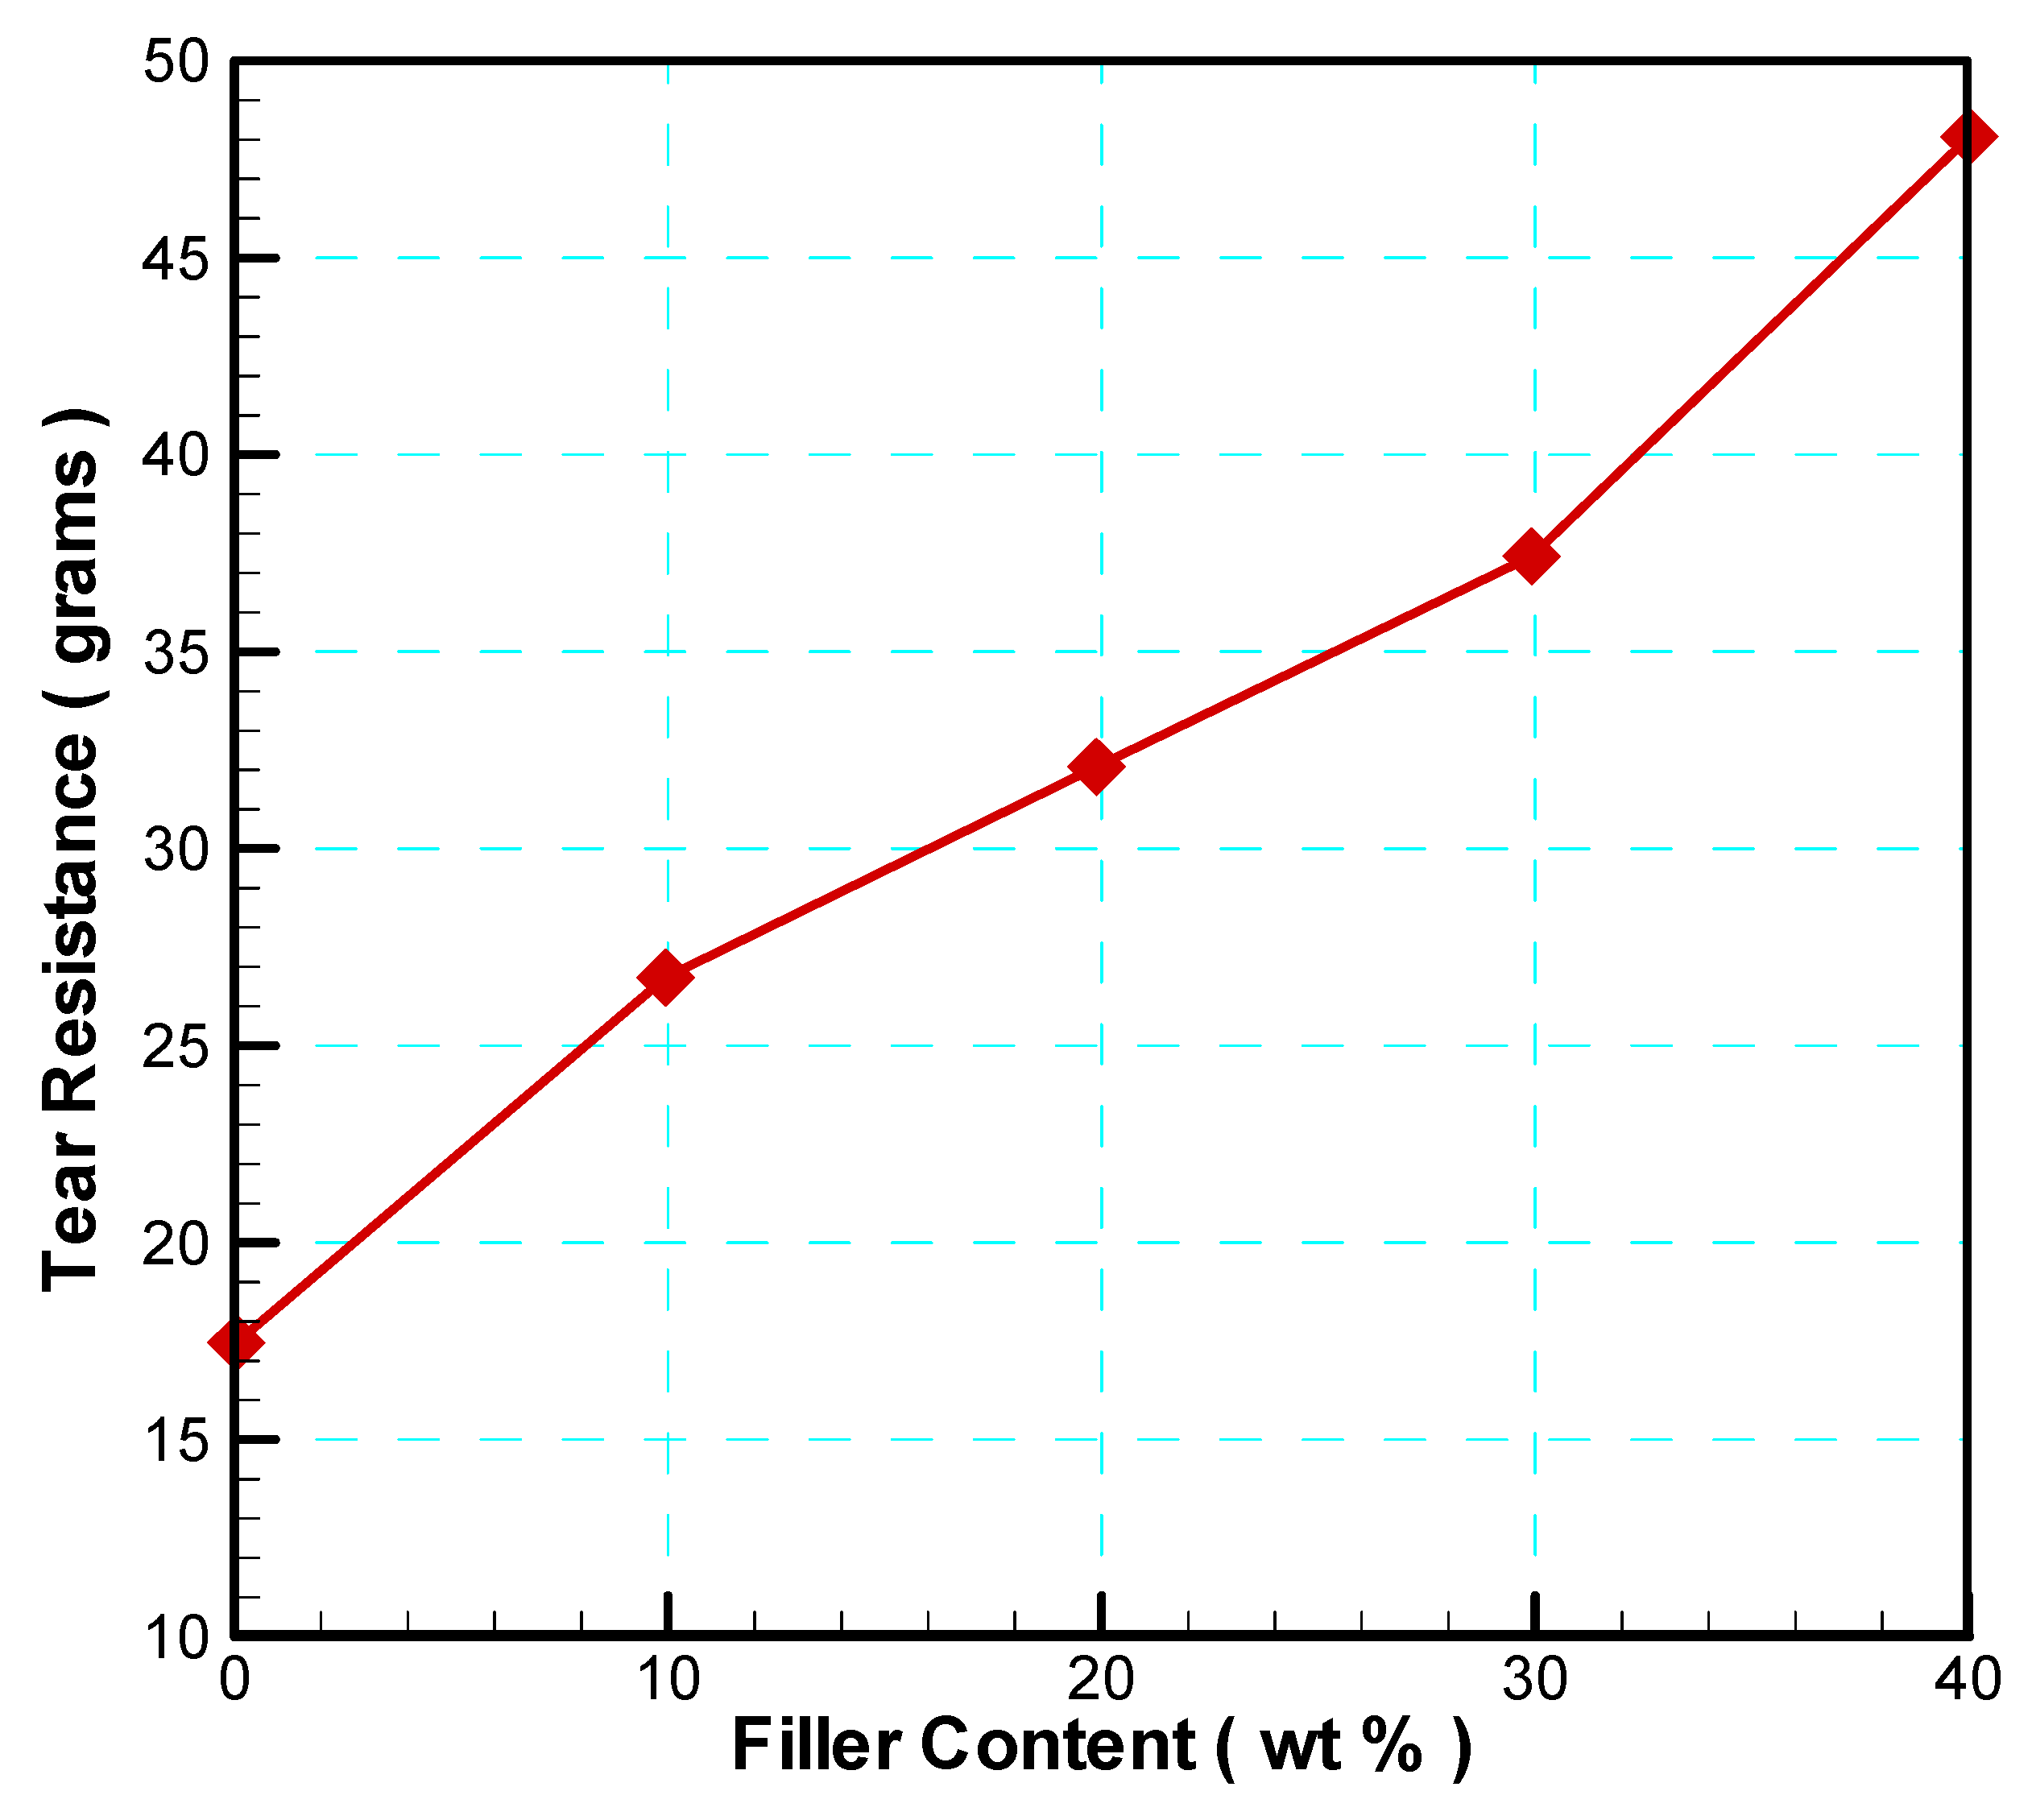
3.3.3.3. Tear Resistance Test
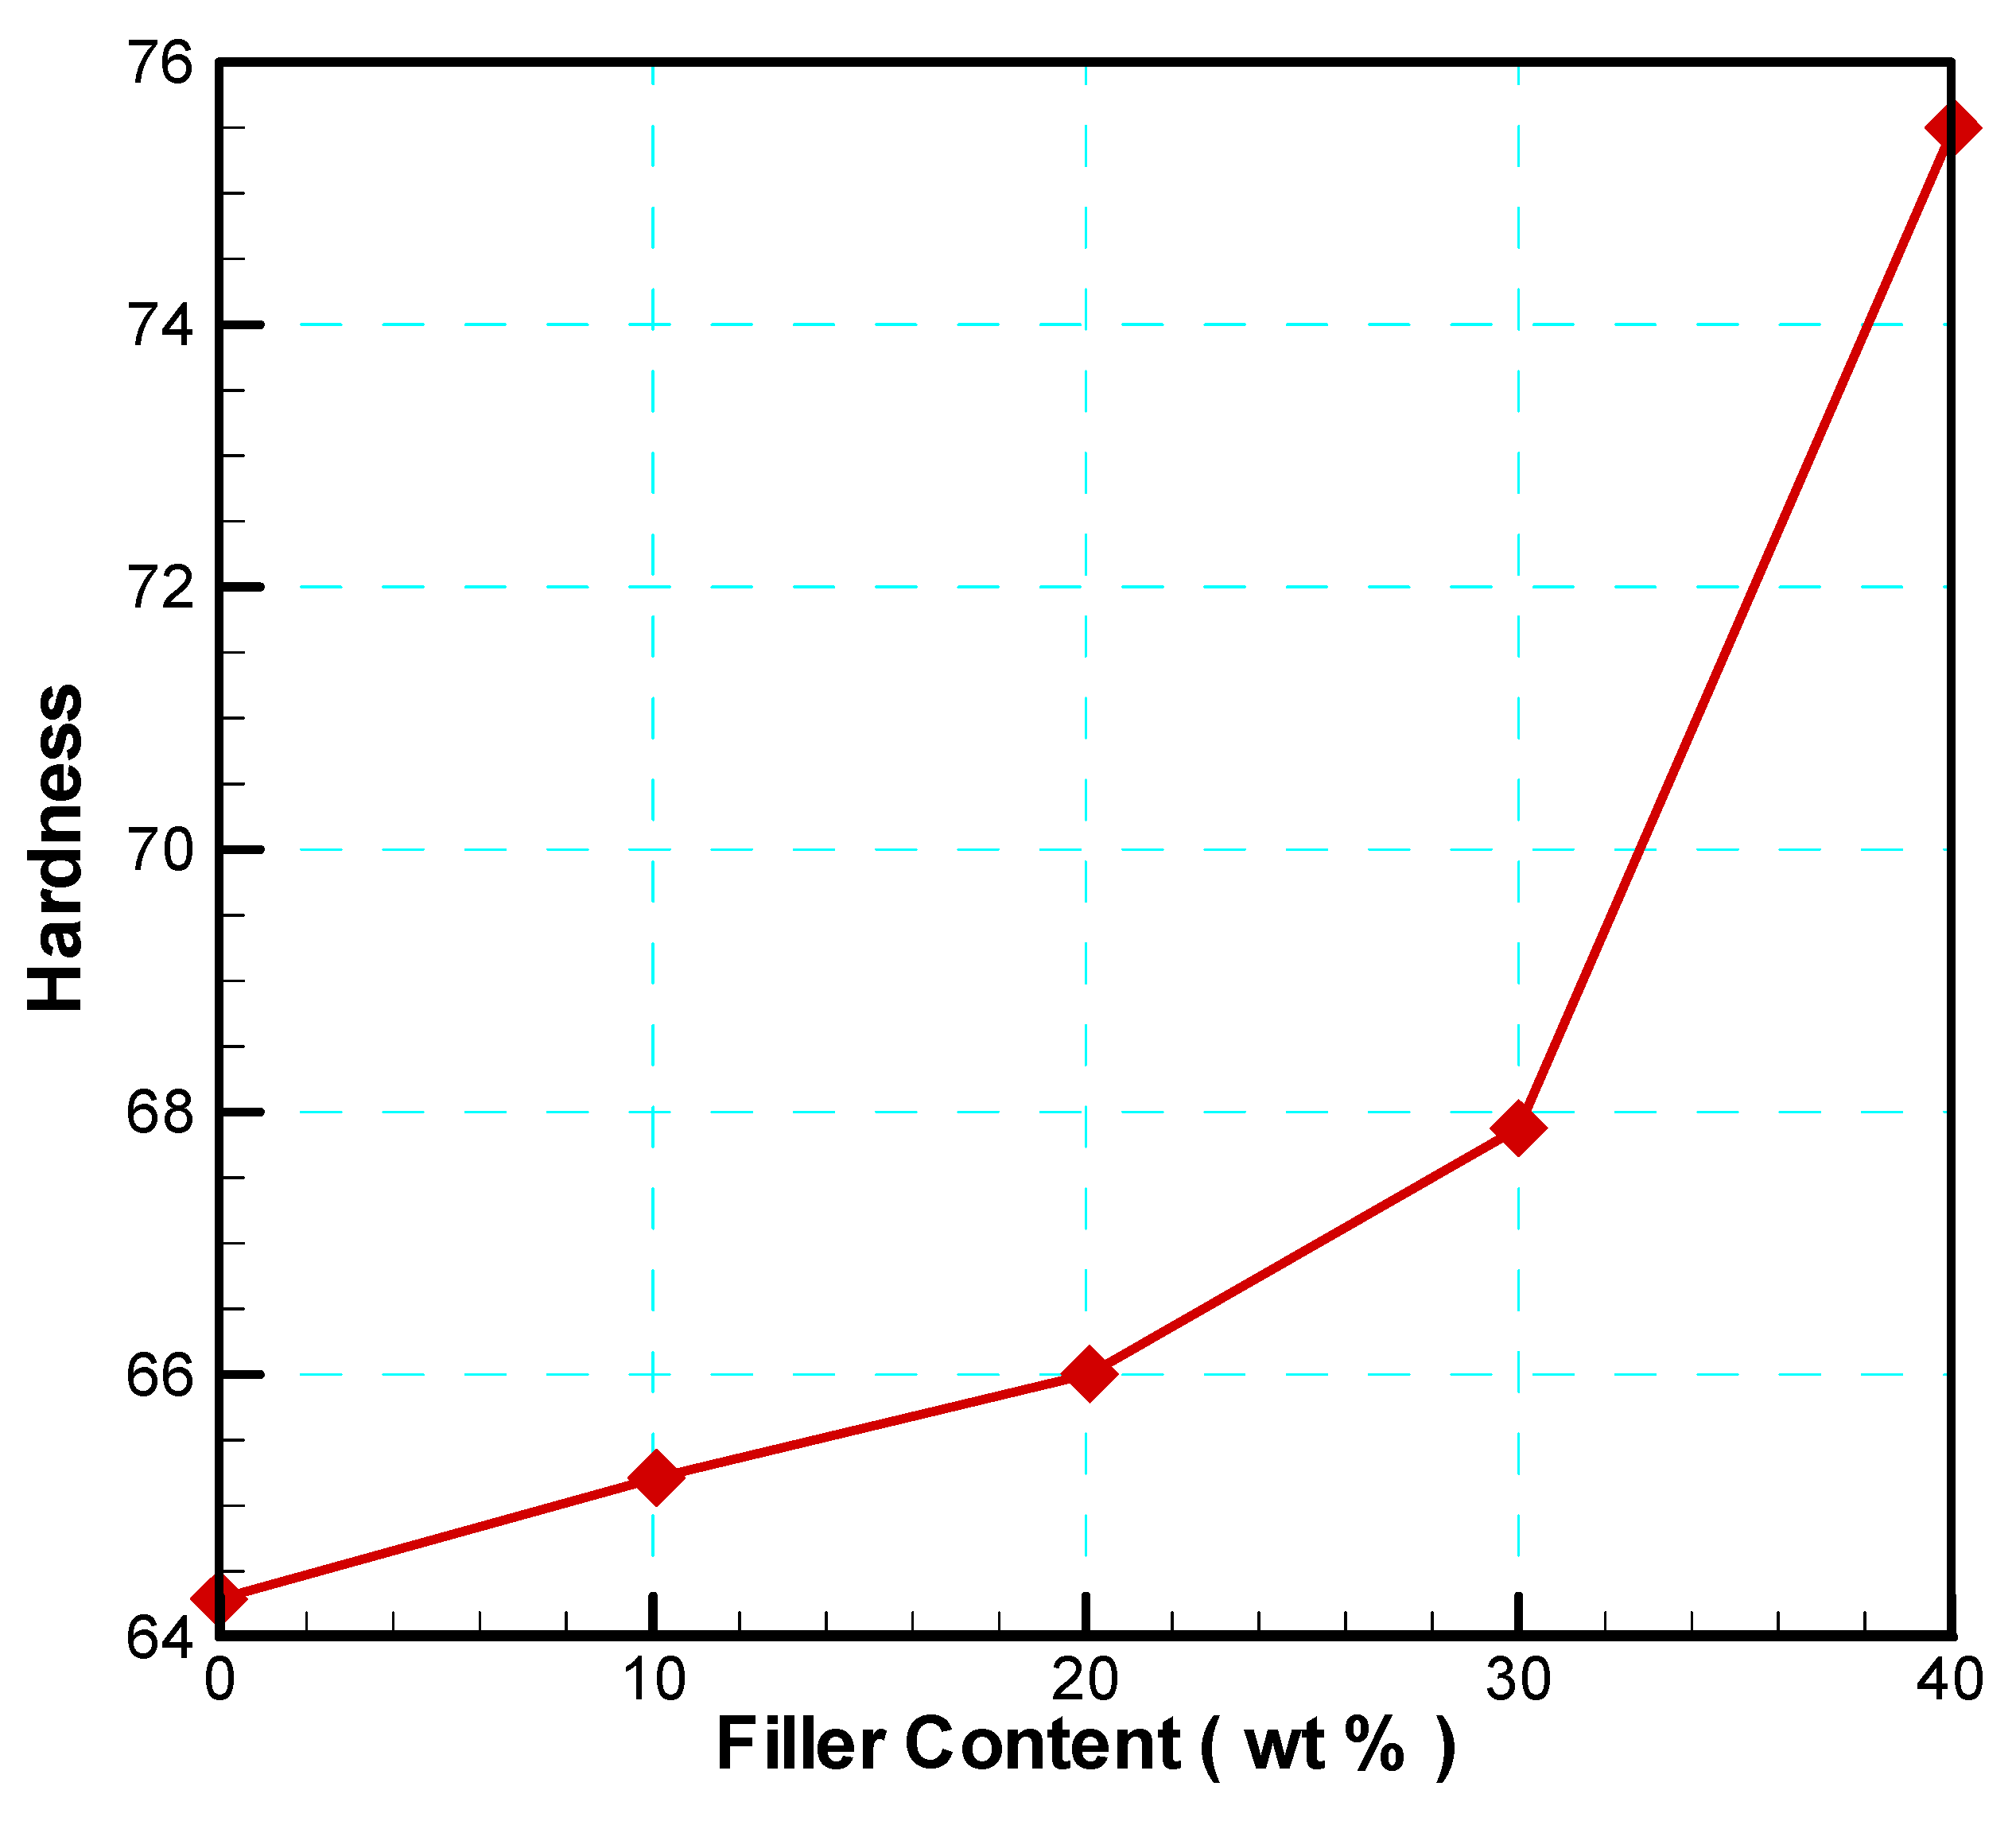
3.3.3.4. Hardness Test
4. Results & Discussions
4.1. Rheological Properties
4.1.1. Melt Flow Index (M.F.I)
4.2. Thermal Properties
4.2.1. Heat Deflection Temperature (HDT)
4.3. Mechanical Properties
4.3.1. Impact Strength (Charpy)
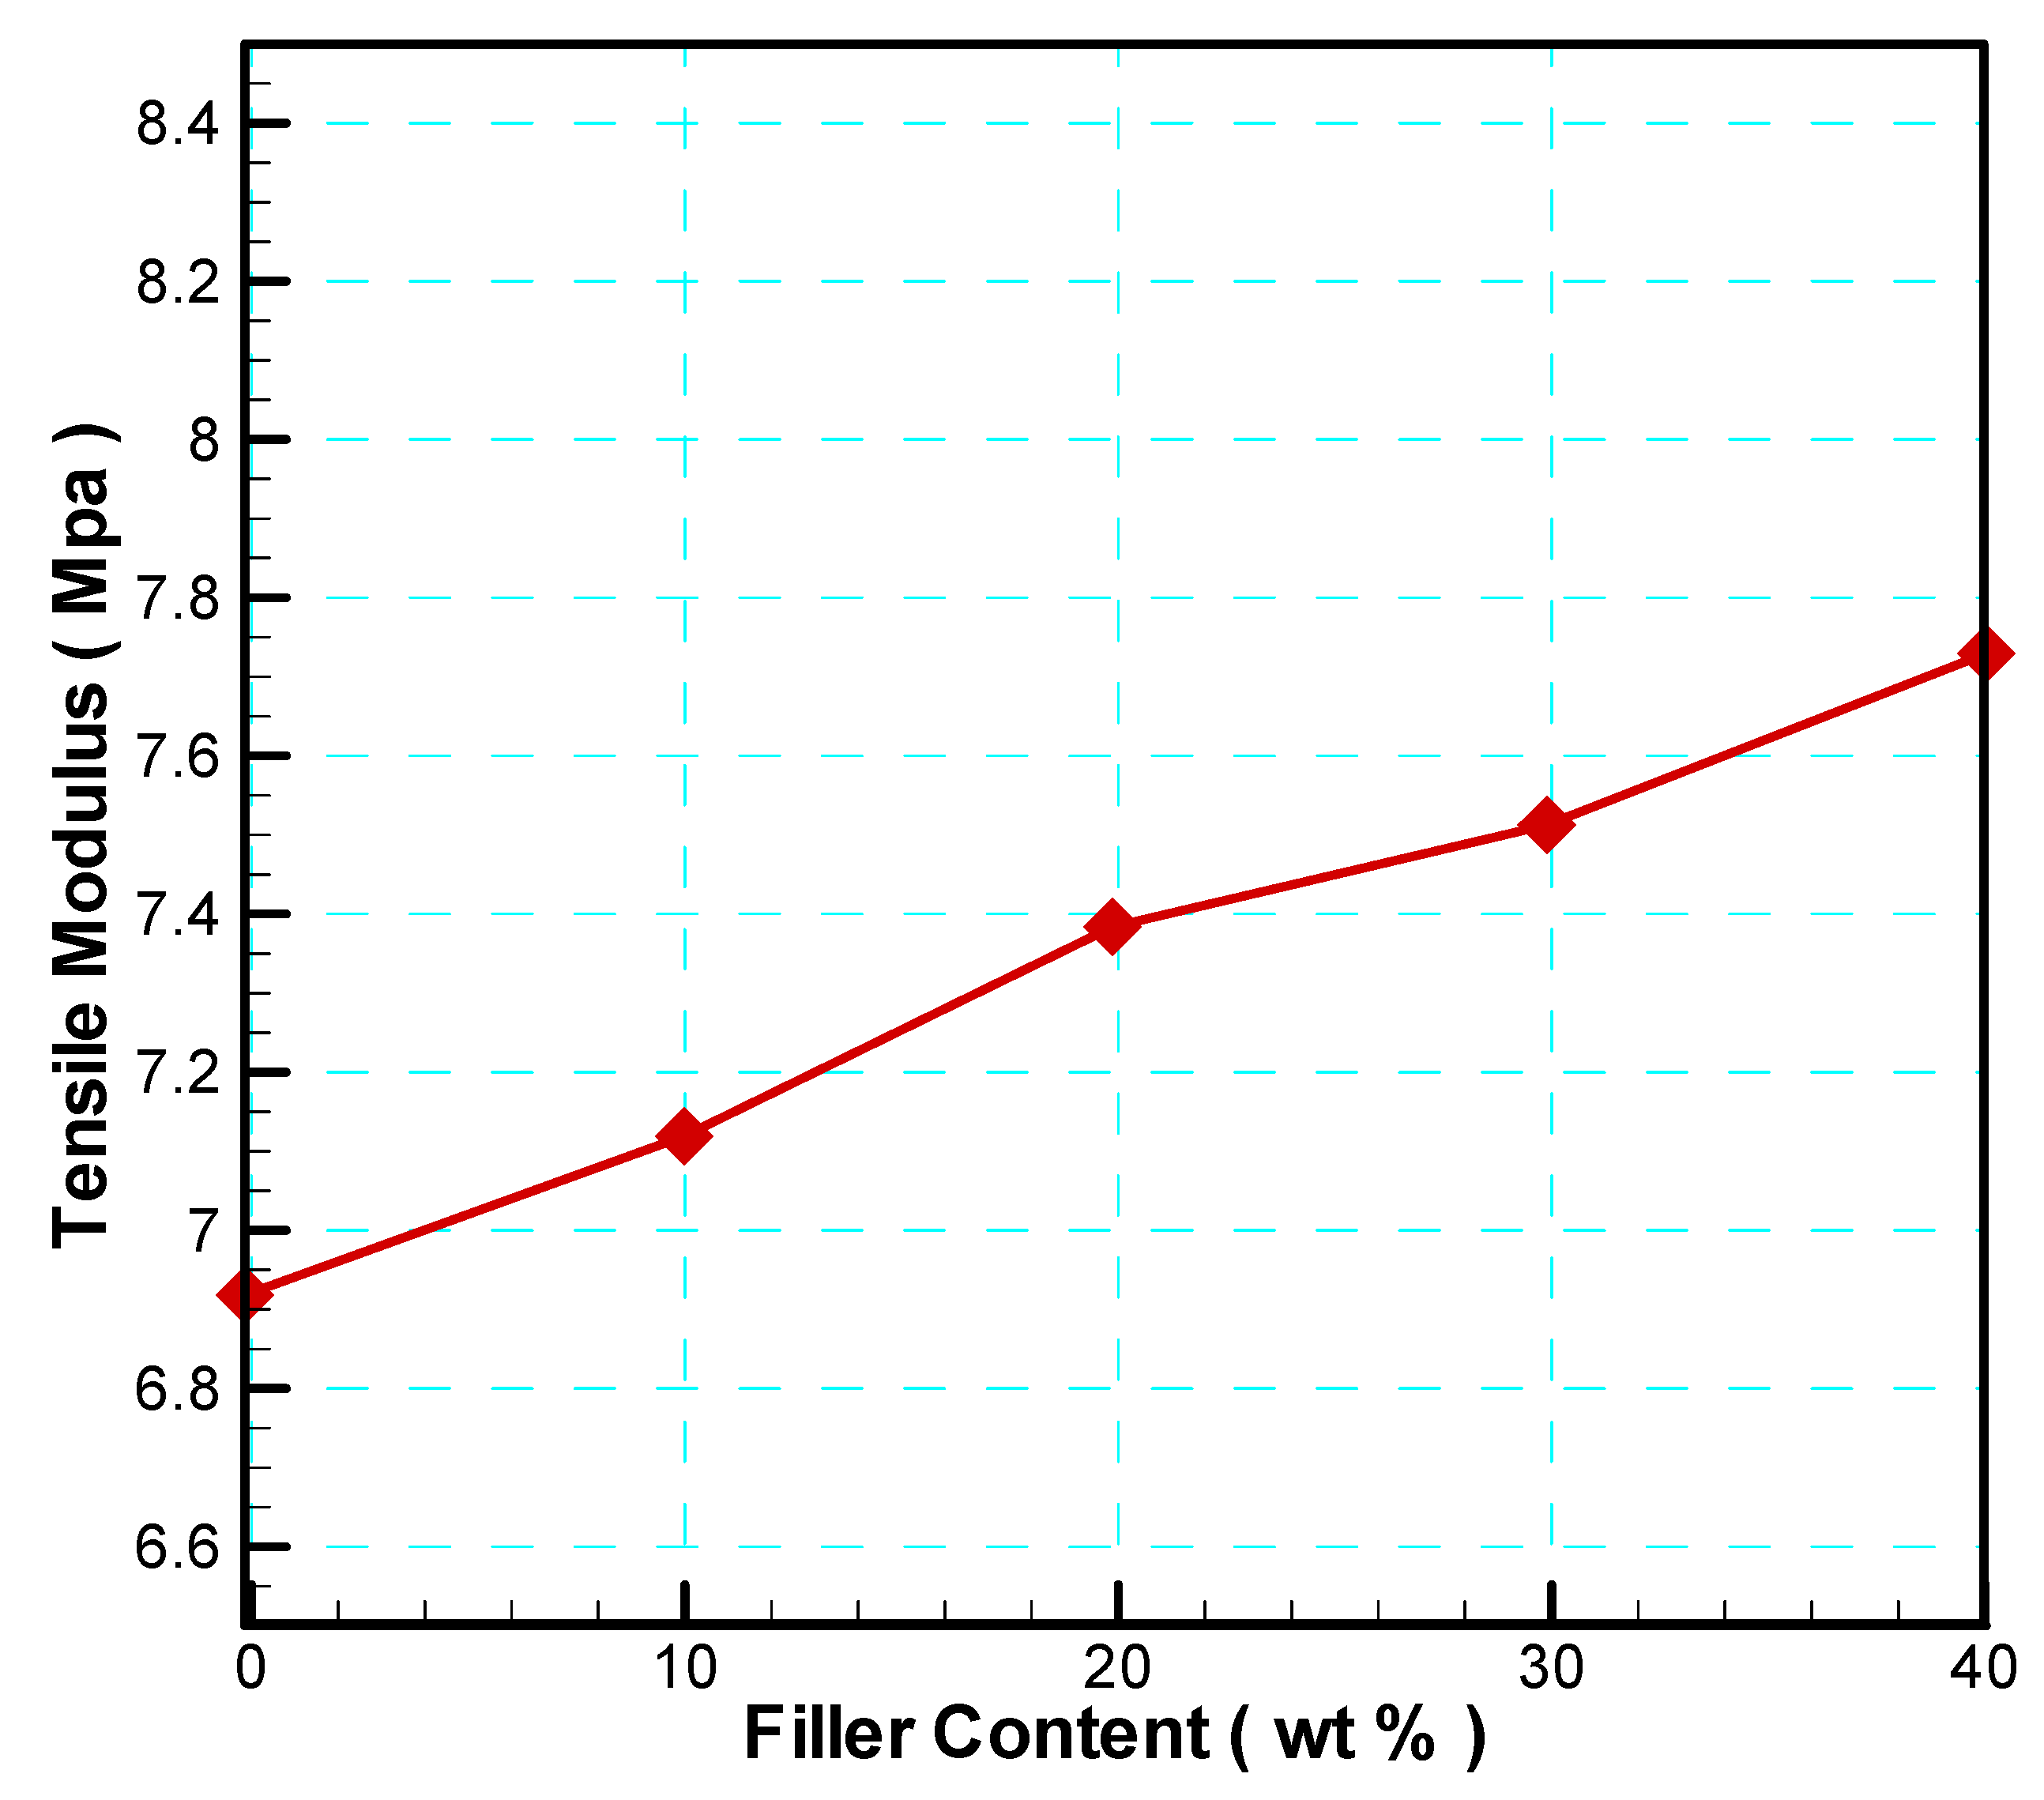
4.3.2. Tensile Properties
4.3.3. Tear Test
4.3.4. Hardness
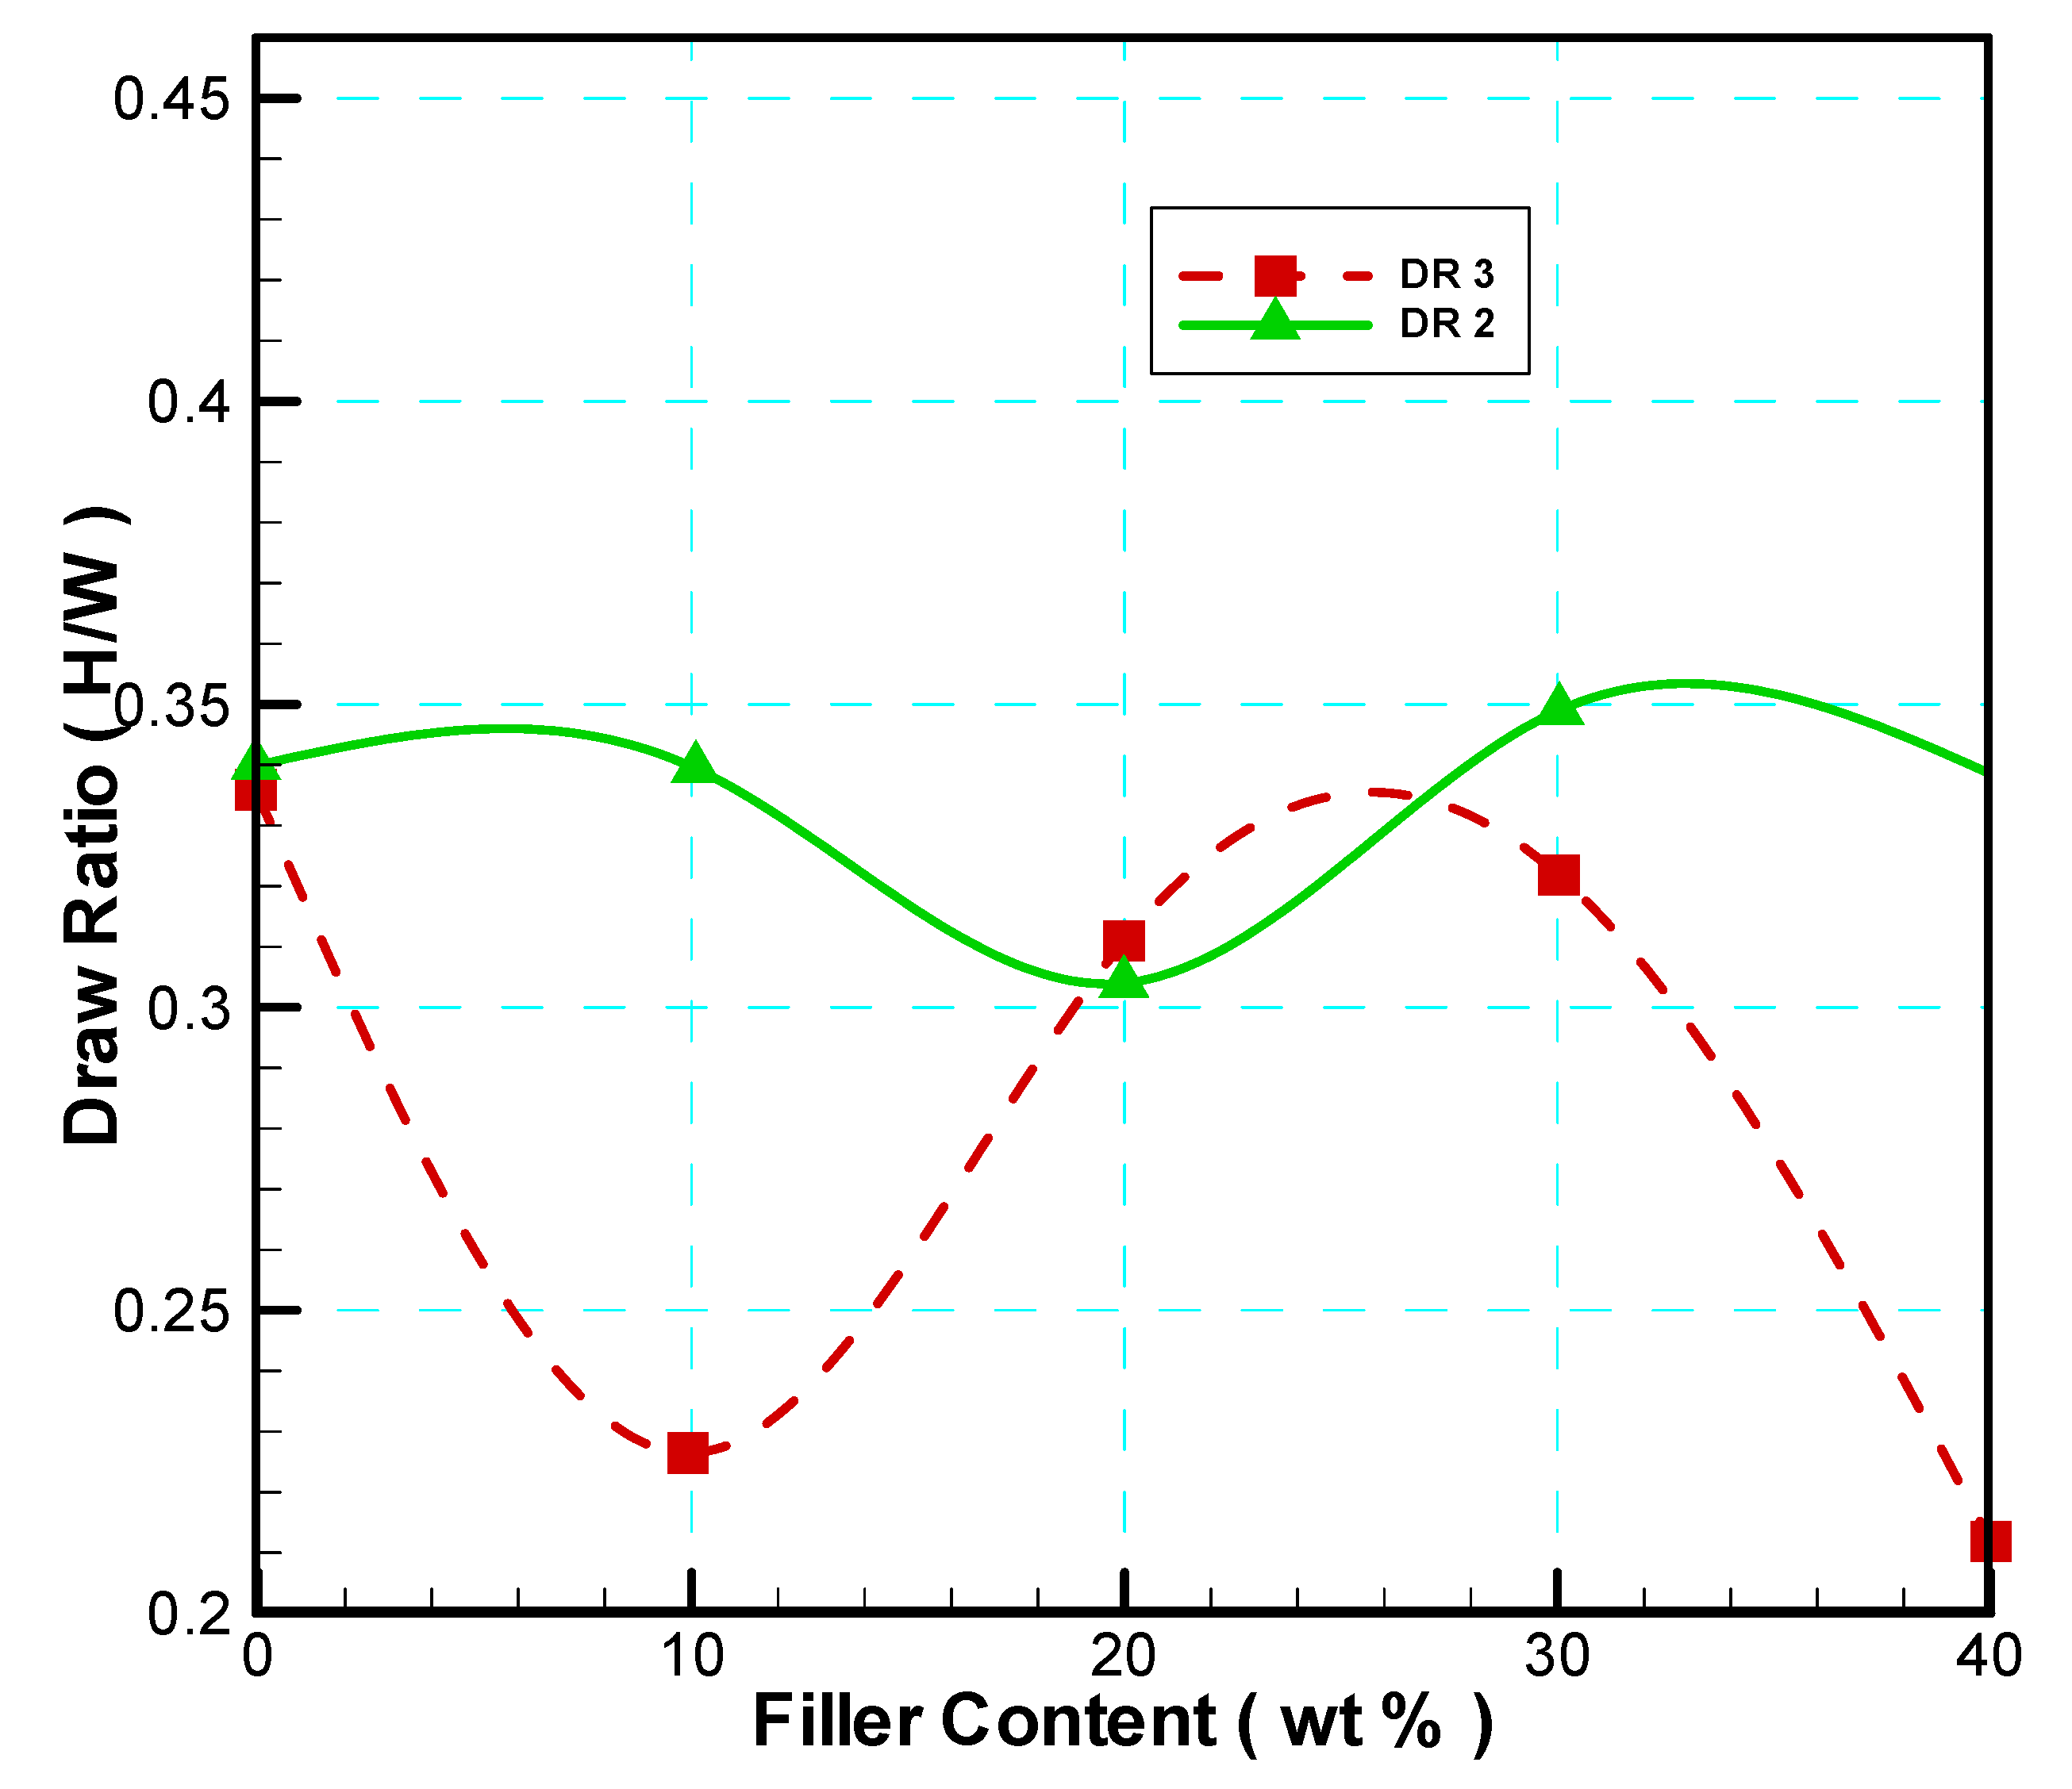
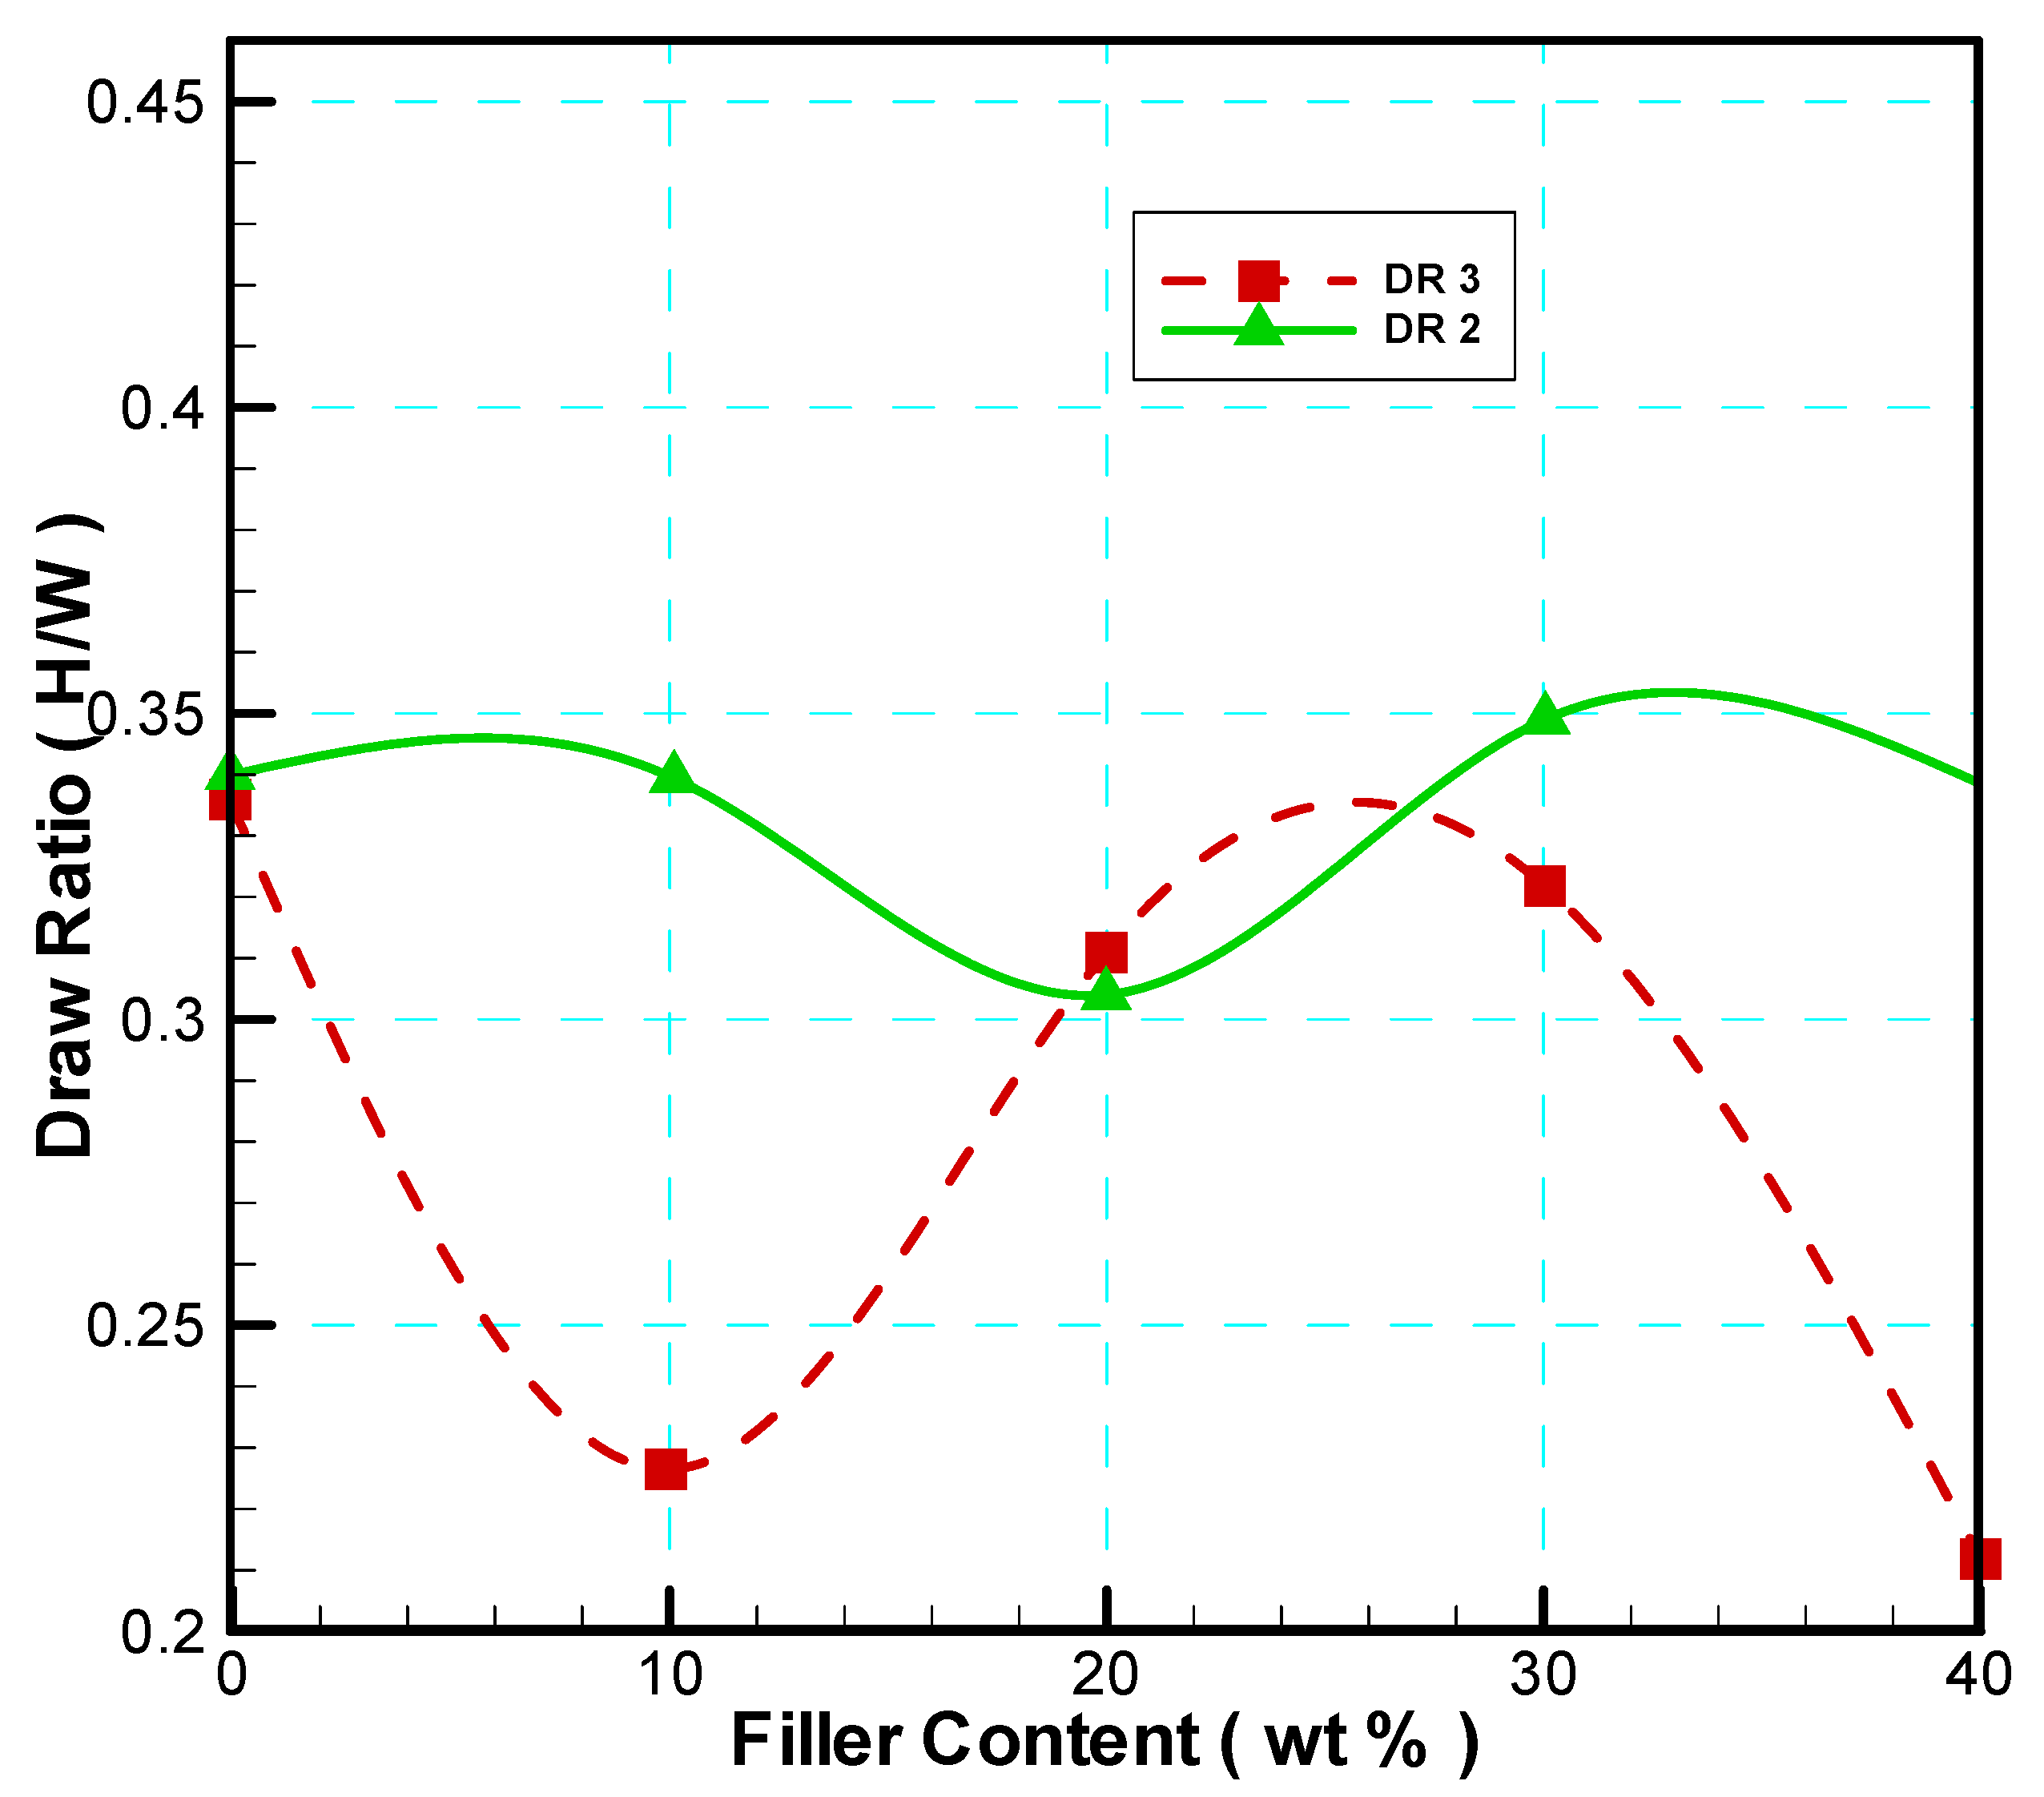
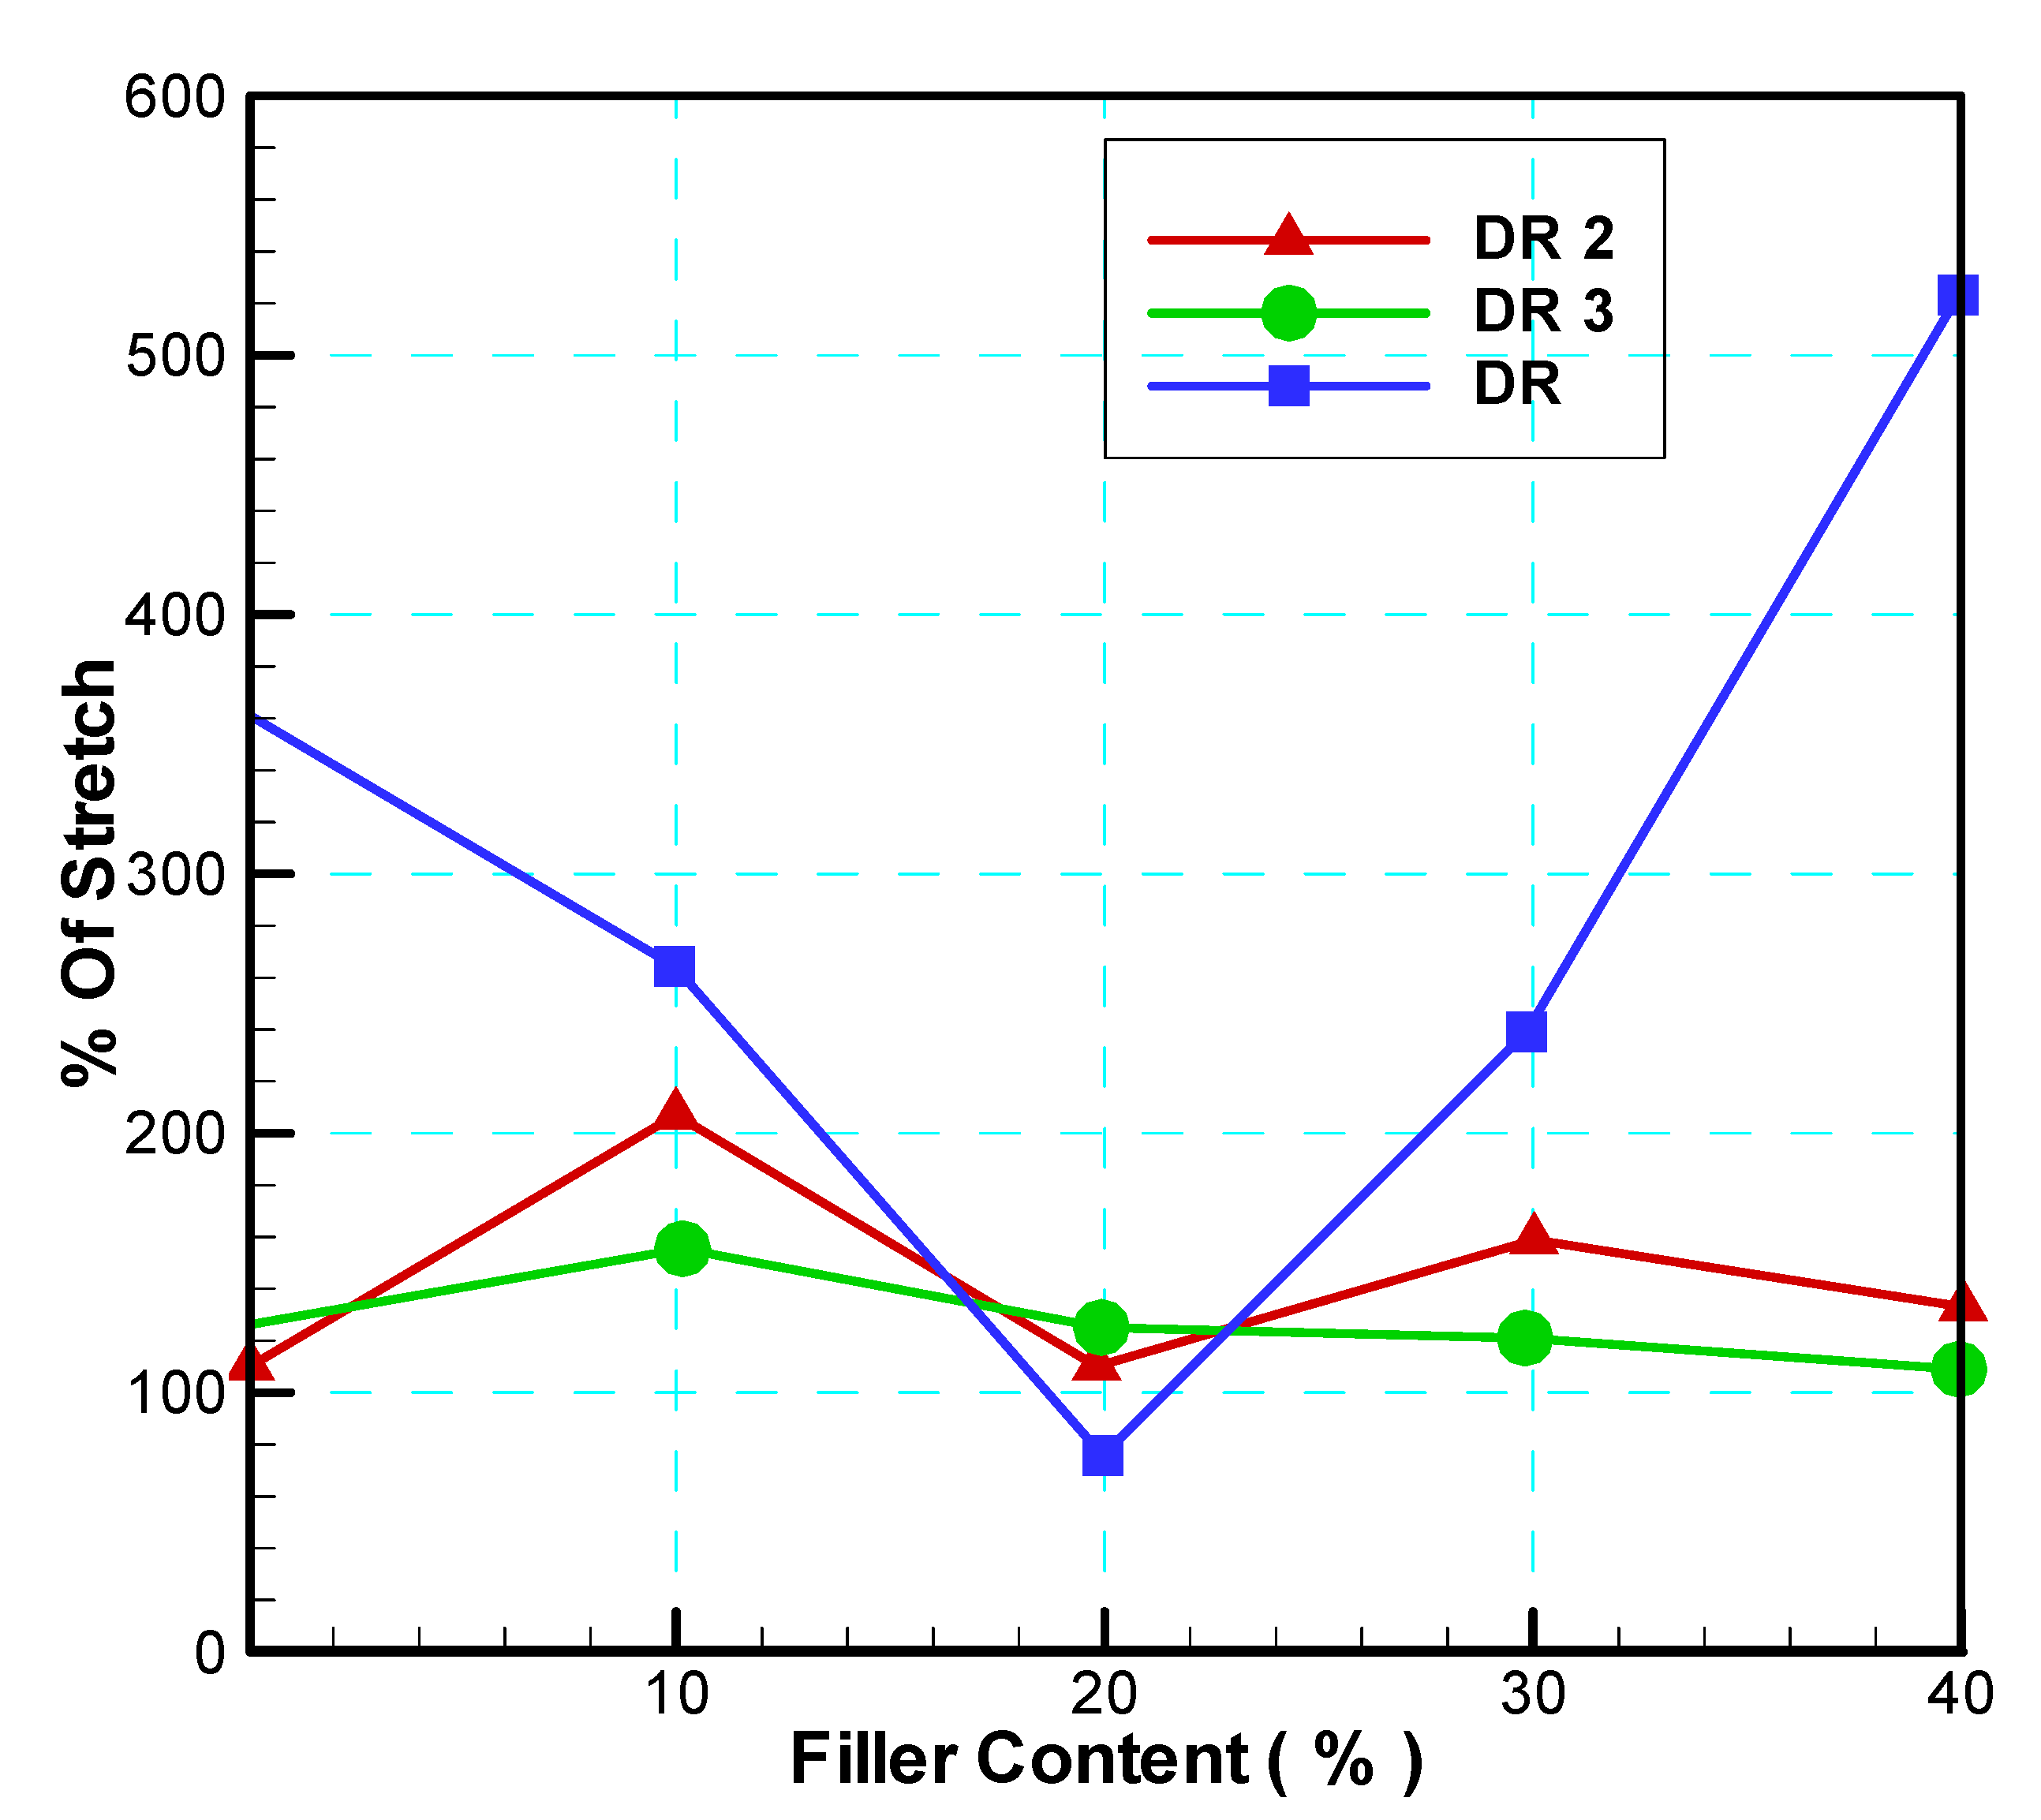
4.4. Vacuum Forming
4.5. Effect of CaCO3 on Thermal Propertis of PP
4.5.1. Thermal Conductivity
4.5.2. Specific Heat
5. Conclusions
- Vacuum forming on a constructed laboratory scale machine seems to be an adequate way to select the appropriate thermoforming conditions for CaCO3 filled polypropylene.
- The major conclusion of this work is that 30% by weight of CaCO3 filler can be incorporated into polypropylene with relatively minor effects on vacuum forming properties.
- The above formulation seems to be very comparable to the conventional material used for such applications i.e HIPS and therefore is a potential candidate to be used as a replacement for it.
- The most important effect of mineral fillers is the significantly shorter thermoforming cycle time (faster heating and cooling).
- As a consequence, the cycle time of production is reduced by about 50%.
- A reduction of 30% in the income cost is obtained using 30 wt % of CaCO3 filled polypropylene (PP) as replacement of high impact polystyrene (HIPS).
References
- P. Jacoloy., W.J Kissel. A new PP resin with enhanced thermoformability. Antec 1994.
- V.E. Malpass., C.H. V.E. Malpass., C.H. White.: laboratory comparison of thermoforming properties of two ABS-R.F.W. Caird (Thermoforming HDPE). From “Basic principles of thermoforming”; Gordan&breach publishers; New York; 1973.
- Djaidja. PVC thermoforming sheet for packaging application. Fifth year project, IAP, 1995.
- Theodore, O.J. Kresser.: Polyolefin plastic. Platsic applied series, New York,1969.
- Joel Frados. Plastic engineering handbook. Society of plastic industry, New York, 1976.
- Robert, A. Shanks., Longku. Fillers, PP. Polymeric material encyclopedia (CD- ROM), 1996.
- Lawrence, E. Neilson. Mechanical properties of polymers and composites. vol II, Marecel Dekker, New York, 1974.
- Abderhmane meddad. Analyse de l’andommagement des materiaux multiphases à matrix viscoelastique. PH.D Thèse, universite de montréal, 1996.
- Katz., H.S. Katz., H.S.Milewski. Handbook of fillers and reinforcements. Van nostrand reinhold,; New York, 1978.
- Vivan, E. Malpass., Anthony F.Dean. Estimating thermoforming behaviour of mineral filled polypropylene. Plastics engineering journal,1989.
- A.K. Nurdina., M. A.K. Nurdina., M. Mariatti., P. Samayamutthirian. :Effect Of Single-Mineral Filler And Hybrid-Mineral Filler Additives On The Properties Of Polypropylene Composites, Journal Of Vinyl & Additive Technology,2009,Doi 10.1002/Vnl.20173.
- Mustafa Abu Ghalia., Azman Hassan., Abdirahman Yussuf. Mechanical and Thermal properties of Calcium Carbonate-Filled PP/LLDPE Composite, Journal of Applied Polymer Science. 2011; 121, 2413–2421. [CrossRef]
- Buasri.N., Chaiyut.K., Borvornchettanuwat.N., Chantanachai.K.. Khongor. Thermal and Mechanical Properties of Modified CaCO /PP Nanocomposites, International Journal of Materials and Metallurgical Engineering, vol 6 N° 8.2012.
- Samson Oluropo Adeosun. , Mohammed Awwalu Usman., Wasiu Ajibola Ayoola. Muyideen Adebayo Bodude. Physico-Mechanical Responses of Polypropylene-CaCO3 Composite, Journal of Minerals and Materials Characterization and Engineering, 2013, 1, 145–152; [CrossRef]
- Danbee Lee., Seungkyun Kim., Birm-June Kim., Sang-Jin Chun., Sun-Young Lee., qinglin Wu. Effect of Nano-CaCO3 and Talc on Property and Weathering Performance of PP Composites. International Journal of Polymer Science. 2017; 2017, 4512378. [CrossRef]
- Saitarly.S., Rezanova.N., Plavan.V., Beleška.K.: Rheological and mechanical properties of filled with calcite concentrate polypropylene blends. International Conference Baltic Polymer Symposium 2018, IOP Conf. Series, Materials Science and Engineering. 2019; 500, 012034. [CrossRef]
- Budiyantoro.C., Sosiati.H., Kamiel.B., Fikri.K. The effect of CaCO3 filler component on mechanical properties of polypropylene. The 1st Materials Research Society Indonesia Conference and Congress, IOP Conf. Series, Materials Science and Engineering. 2018; 432, 012043. [CrossRef]
- Shuaibu.A., Mamza.P, Hamza.,A. Isa.,T : Mechanical Properties Of Ficus Polita Seeds Powder And Calcium Carbonate Filled Polypropylene. Polystyrene And Polyvinyl acetate Blends, Nigerian Research Journal of Chemical Sciences (ISSN: 2682-6054) Volume 8, Issue 2, 2020, http://www.unn.edu.ng/nigerian-research-journal-of-chemical-sciences.
- Pierre Marcel Anicet Noah. , Fabien Betene Ebanda., Louis-Max Ayina Ohandja., Ateba Atangana. Study of the Relative Variations of the Thermal Properties and Crystallinity of Blends (PP/EPR)/Calcium Carbonate. Modeling and Numerical Simulation of Material Science 2021, 11, 19–33; https://wwwscirporg/journal/mnsms.
- Samira Kherici., Djillali Benouali., Chekhar Nouredine: The Effects of Calcium Carbonate Filler on HDPE Pipe; Advances in Science and Technology Research Journal. 2022; 16, 213–218. [CrossRef]
- Nawar. S., Bakly., Nabeel. H., Al-Mutairi., Ali.A., Layla., Mohammed Hamzah Almaamori. Investigate the Effect of Temperature Change on the Properties of the PP/CaCO3 Composites. A Comparative Study, Al-Mustaqbal Journal of Sustainability in Engineering Sciences. 2023. [CrossRef]

| Compound | Thermel properties x 104(gcal/sec cm2 (°C/cm) | Heat input, calories x 10-3 | Time to heat/coll (sec) |
|---|---|---|---|
| HIPS | 4.850 | 7.23 | 7.19 |
| F00 | 5 | 4.64 | 7.11 |
| F10 | 5.526 | 7.69 | 5.65 |
| F20 | 5.870 | 7.72 | 4.02 |
| F30 | 6.52 | 7.77 | 3.16 |
| F40 | 7.42 | 7.85 | 2.55 |
Disclaimer/Publisher’s Note: The statements, opinions and data contained in all publications are solely those of the individual author(s) and contributor(s) and not of MDPI and/or the editor(s). MDPI and/or the editor(s) disclaim responsibility for any injury to people or property resulting from any ideas, methods, instructions or products referred to in the content. |
© 2025 by the authors. Licensee MDPI, Basel, Switzerland. This article is an open access article distributed under the terms and conditions of the Creative Commons Attribution (CC BY) license (https://creativecommons.org/licenses/by/4.0/).


