
Submitted:
08 January 2025
Posted:
09 January 2025
You are already at the latest version
Abstract
The early stages of flame dynamics and the development and evolution of tulip flames in closed tubes of various aspect ratios and in a half-open tube are studied by solving the fully compressible reactive Navier–Stokes equations using a high-order numerical method coupled to detailed chemical models in stoichiometric hydrogen/air and methane/air mixtures. The use of adaptive mesh refinement (AMR) provides adequate resolution of the flame reaction zone, pressure waves, and flame-pressure wave interactions. The purpose of this study is to gain a deeper insight into the influence of chemical kinetics on the combustion regimes leading to the formation of a tulip flame and its subsequent evolution. The simulations highlight the effect of laminar flame velocity and reaction order on the physical mechanism of tulip flame formation and evolution. It is shown that the intensity of the pressure and rarefaction waves generated by the flame at the acceleration and deceleration stages depends on the rate of flame acceleration and deceleration. Since the rate of flame acceleration and deceleration depends on the value of the laminar flame velocity, tulip flame formation and evolution are much faster in a highly reactive mixture.
Keywords:
Tulip flame
; Rarefaction waves
; Pressure waves
; Boundary layer
1. Introduction
The injection of hydrogen into natural gas is an effective method of improving combustion in the energy industry [1,2,3,4]. Blending hydrogen with natural gas can reduce carbon emissions and increase energy efficiency [5]. Hydrogen additive can improve the combustion of hydrocarbon fuel due to its low ignition energy, high reactivity and fast burning rate, making hydrogen enriched natural gas a promising alternative fuel. Therefore, there are currently extensive experimental and numerical studies on the combustion of premixed methane/hydrogen/air mixtures in closed or semi-open tubes to gain a deeper insight into the different combustion regimes and efficiencies, see e.g., [5,6,7,8]. The effect of laminar flame velocity on flame dynamics was investigated by Deng et al. [9] using a two-dimensional laminar combustion model and simplified reaction mechanisms derived from the one-step methane/air reaction model. The effect of reaction order on flame propagation was studied by Qi et al. [10] using numerical models with three single step reaction mechanisms .
Flame propagation in tubes is important for understanding combustion processes under confinement, such as explosions and safety issues as well as for industrial and technological applications. It is the basic physical-chemical platform for the analysis of more complex engineering and technological problems, and for the development of appropriate analytical methods and numerical models. Understanding of the structure and acceleration of premixed flames is therefore of primary interest to the combustion community.
It is well known that a flame ignited near the closed end of a tube and propagating to the opposite closed or open end suddenly slows down, and the shape of the flame front rapidly changes from a convex with the tip pointing forward to a concave shape with the tip pointing backward. This phenomenon has been first photographed in experiments by Ellis [11] and later named “Tulip Flame” (TF). Subsequent experimental studies have shown that tulip flame formation is remarkably robust across combustible mixtures, highly or slowly reactive mixtures, and downstream conditions: such as open or closed tube ends and tube shapes, tube wall roughness, and obstructed tubes [12,13]. The numerical study [14] has shown that the formation of the tulip flame is similar for adiabatic and isothermal wall boundary conditions. It has also been shown in [15,16] that the geometry of the ignition source is not critical for flame dynamics in tulip flame formation.
It should be noted that flame front inversion can be caused by various processes, such as flame collision with a shock wave or pressure wave, various hydrodynamic instabilities inherent to the propagating flame, such as Darrieus-Landau (DL) or Rayleigh-Taylor (RT) instabilities. This makes the concept of tulip flame formation somewhat ambiguous, and has led to a number of different scenarios in attempts to explain the physical mechanism of tulip flame formation. Flame collision with a shock wave [17], flame front instabilities such as DL instability [18] and RT instability [19,20] have been considered as possible mechanisms of tulip flame formation. Flame-vortex interaction has been considered in [21,22,23,24,25] as a seemingly plausible scenario for flame front inversion, although no evidence has been provided that this is actually the case. The reader is referred to the reviews [12,13] for references to numerous studies of the physical mechanisms associated with tulip flame formation. However, despite considerable efforts, until recently numerous theoretical, computational and experimental studies have failed to provide a convincing and experimentally consistent explanation for the physical mechanism of tulip flame formation, and this problem remains one of the fundamental unsolved problems in combustion science.
The tulip flame considered in the present study is the inversion of the flame front from the convex to the concave shape that occurs during the deceleration phase associated with the reduction of the flame surface area when the lateral parts of the finger-shaped flame touch the tube sidewalls. Recently, Liberman et al. [26] have shown for the first time that the rarefaction wave generated by the flame during the deceleration phase is the key process in tulip flame formation. This mechanism of the tulip flame formation explains various phenomena observed in experimental studies and numerical simulations, such as reverse flow, adverse pressure gradient, etc. This also means that tulip flame formation is a purely hydrodynamic phenomenon as it occurs much faster than the time required for flame front instabilities to develop, which is supported by the experimental study of a tulip flame formation [27].
Recent experimental and numerical studies [6,7,8,28,29,30] have revived interest in the physical mechanism of tulip flame formation at different blending of methane and hydrogen mixtures. The purpose of the present work is to gain a deeper insight into the influence of chemical kinetics on the combustion regimes leading to the formation of a tulip flame and its subsequent evolution for a flame in the highly reactive H2/air mixture compared to a flame in the slowly reactive CH4/air mixture. To do this, we compare and contrast unsteady, fully compressible high accuracy solutions of the Navier–Stokes equations coupled with the multi-step detailed chemical models for hydrogen-air flames with the solutions for methane-air flames.
The paper is organized as follows. In Section 2 the details of the numerical simulation, chemical models and boundary conditions are presented. In Section 3.1, Section 3.2 and Section 3.3 we present results from a series of two-dimensional simulations of H2/air and CH4/air flames propagation in closed tubes of various aspect ratios and in a half-open tube. The results of these simulations are analyzed and compared with experimental studies of H2/air and CH4/air flames propagation in closed and half-open tubes. Brief discussions and conclusions of the results obtained are presented in Section 4.
2. Numerical Models
2.1. Two-Dimensional DNS
Our previous studies [16,26] have shown that the flame dynamics obtained from 2D modeling are qualitatively very similar to those observed in experimental studies. In the present work the two-dimensional computational domains are modelled using high-resolution DNS of the fully compressible reactive Navier–Stokes equations coupled to detailed multistep chemical models for combustion in a stoichiometric hydrogen/air and methane/air mixtures. A detailed chemical kinetic model for a stoichiometric hydrogen/air mixture consisting of 21 reactions and 9 species developed by Li et al. [31] was implemented and used in the simulations. The multi-step detailed chemistry for a stoichiometric methane/air is the reduced detailed TSR-CDF-13 skeletal mechanism [32], which consists of 13 species and 46 reversible reaction steps. The TSR-CDF-13 skeletal mechanism has been chosen as it was extensively validated for combustion characteristics of CH4/air over a wide range of pressures, temperatures, and equivalence ratios [33,34]. The chemical models were thoroughly tested and compared with the standard GRIMech 3.01 [35] and validated against experimental data in [36]. The considered 2D computational domains are rectangular channels of width with both ends closed and aspect ratios of and a rectangular channel of width with an open right end.
The numerical simulations solve the 2D time-dependent, reactive compressible Navier-Stokes equations including molecular diffusion, thermal conduction, viscosity and detailed chemical kinetics. The governing equations are
The quantities , , , , , , are density, velocity components, temperature, pressure, specific total energy, viscosity stress tensor, and the heat fluxes. is the universal gas constant, are mass fraction, molar mass and diffusion velocity of species . The viscosity, thermal conduction and diffusion coefficients of the mixture are calculated by the method presented in [37]. The reaction rate of species is determined as
where and are stoichiometric coefficients of species of the reactant and product sides of reaction .
The governing equations are solved using open-source code AMReX-Combustion PeleC [38], which is a load-balanced Adaptive Mesh Refinement (AMR) compressible reacting flow solver. The convection terms are discretized by classical 5th order WENO-JS scheme of Jiang and Shu [39]. The 2nd order centered difference method is used to calculate the diffusion terms. The time integral method is based on a spectral deferred correction approach [40]. The integrator of chemical source terms is the explicit Runge-Kutta methods in the ARKODE packages of SUNDIALS [41].
An adaptive mesh refinement (AMR) method was used to reduce the computational time required for the numerical simulations with detailed chemistry for H2/air and CH4/air flames. The criterion for grid adaptation was a mass fraction of HO2 in the computational domain. The AMR method in PeleC is based on the AMReX framework [42], which supports massively parallel, block-structured adaptive mesh refinement. The non-reflecting outflow boundary condition [43] was used to calculate the subsonic outflow.
Reliable modeling of reactive flows requires adequate resolution of the internal structure of the flame. Since the thickness of a laminar flame decreases with increasing pressure, higher resolution is required to determine the flame structure at elevated pressure. For hydrogen/air flame the reaction order is , which means that the hydrogen/air flame does not depend on pressure since [44]. For the flame thickness we obtain
where is kinematic viscosity. Therefore, the flame thickness decreases with pressure as . The reaction order of methane/air flame is .1. In the same way for the methane/air flame we obtain, , . The maximum pressure during tulip flame formation is about 4atm for a hydrogen/air flame in a short tube with closed ends, resulting in a reduction in flame front thickness from to .
The uniform coarse grid resolution of 40μm was used. With each refinement, the grid size is halved, allowing for a maximum of two refinements. As a result, the grid resolution near the flame front reaches 10μm. Thorough resolution and convergence (a grid independence) tests were performed in our previous publications [16,26] by varying the value of to ensure that the resolution is adequate to capture details of the problem in question and to avoid computational artefacts.
2.2. Boundary and Initial Conditions; Modeling Parameters
The flame is ignited by a small (3mm) semi-circular pocket of burned gas at adiabatic flame temperature, for H2/air and for CH4/air, near the left closed end. The initial conditions are , . The center of the ignition spot is on the mid-plane of the channel near the left closed end.
The adiabatic, no-slip reflective boundary conditions at the channel walls are
where is the normal to the wall. The coordinate is taken along the channel, is the mid-plane coordinate and the sidewalls are at .
During tulip flame formation symmetry boundary conditions can be applied at the mid-plane, , between the plane sidewalls
The symmetric formulation of the problem is justified by the fact that symmetric tulip flame formation relative to the tube axis has been observed in many experimental studies, see e.g., [6,8,24]. Depending on the experimental conditions, the gravitational buoyancy effect can cause asymmetric shape of the tulip flame. However, the characteristic time for the buoyancy is usually larger than the time of a tulip flame formation even for methane/air flames.
3. Results and Discussions
In Section 3.1, Section 3.2 and Section 3.3, we use 2D simulations to compare the flame dynamics leading to the flame front inversion and tulip flame formation in a highly reactive H2/air mixture and a slowly reactive CH4/air mixture in channels of different aspect ratios and in a half-open channel. In previous study [26] it was shown the rarefaction wave generated by the flame during the flame deceleration phase is the primary physical process leading to flame front inversion and tulip flame formation. The underlying physics of the flame front inversion is very simple if we consider a theoretical thin flame model [44,45], where the flame is considered as a discontinuous surface separating unburned and burned gases. During the acceleration phase, the flame acts as a semi-transparent accelerating piston, generating pressure waves whose amplitude increases with the piston acceleration. The initial rarefaction wave is generated by the flame as the flame skirt touches the sidewalls of the tube, resulting in a reduction in flame surface area and a subsequent reduction in flame velocity. In the reference frame of the unburned flow, the decelerating flame is similar to the piston that begins to move with acceleration out of the tube. It is well known [46] that such a piston generates a simple rarefaction wave, whose “head” propagates forward (to the right) with the sound speed. While a reverse flow of the unburned gas is created between the piston and the head of the rarefaction wave. The velocity in the reverse flow is equal to the piston velocity and it is maximum on the piston surface and tends to zero towards the head of the rarefaction wave. It is important to note that in the classical problem of a rarefaction wave initiated by a flat piston (one-dimensional problem) [46], the reverse flow velocity is uniform. On the contrary, the reverse flow velocity generated by a convex piston is not uniform. Near the piston, the axial velocity is maximum at the tube axis and decreases towards the side walls. The resulting flow in the unburned gas is a superposition of the unburned gas flow created by the flame during the acceleration phases and the reverse flow created by the rarefaction wave. Obviously, this results in the unburned gas flow acquiring a mirror tulip-shaped axial velocity profile, at least in the vicinity of the flame front. In the thin flame model, the velocity of a small part of the flame front is equal to the sum of the laminar flame velocity, at which the flame propagates relative to the unburned gas, and the velocity of the unburned gas immediately ahead of that part, at which the unburned gas entrains that part of the flame front. Therefore, the mirror tulip velocity profile formed in the unburned gas in the vicinity of the flame leads to inversion of the flame front and formation of a tulip-shaped flame. The results of the thin flame model are in surprisingly good agreement with 2-D and 3-D simulations [26].
In a closed tube, the collision of a flame with a pressure wave reflected from the opposite end also causes the flame to decelerate, thereby enhancing the effect of the first rarefaction wave, or leading to distorted tulip flame.
3.1. 2D Channel with Both Ends Closed and Aspect Ratio
In this section we compare the results of modelling the dynamics of hydrogen/air flame with the dynamics of methane/air flame in a 2D channel with both ends closed and aspect ratio . Figure 1(a) shows the time evolution of the flame front velocities along the channel axis, , and close to sidewall, calculated for hydrogen/air flame. Figure 1(b) shows the calculated time evolution of the flame front velocities along the tube axis, and near the side wall, , calculated for methane/air flame. In both figures the increase in pressure, , and the pressure growth rate at the centerline just ahead of the flame front are shown. The pressure growth rate shows the location of the reflected pressure waves immediately before their collisions with the flame.
Figure 2(a, b) shows temporal evolution of the unburned flow velocities at the tube axis, and near the sidewall, at , calculated closely ahead of the flame front, at , for hydrogen/air flame (a); and similar values and for CH4/air.
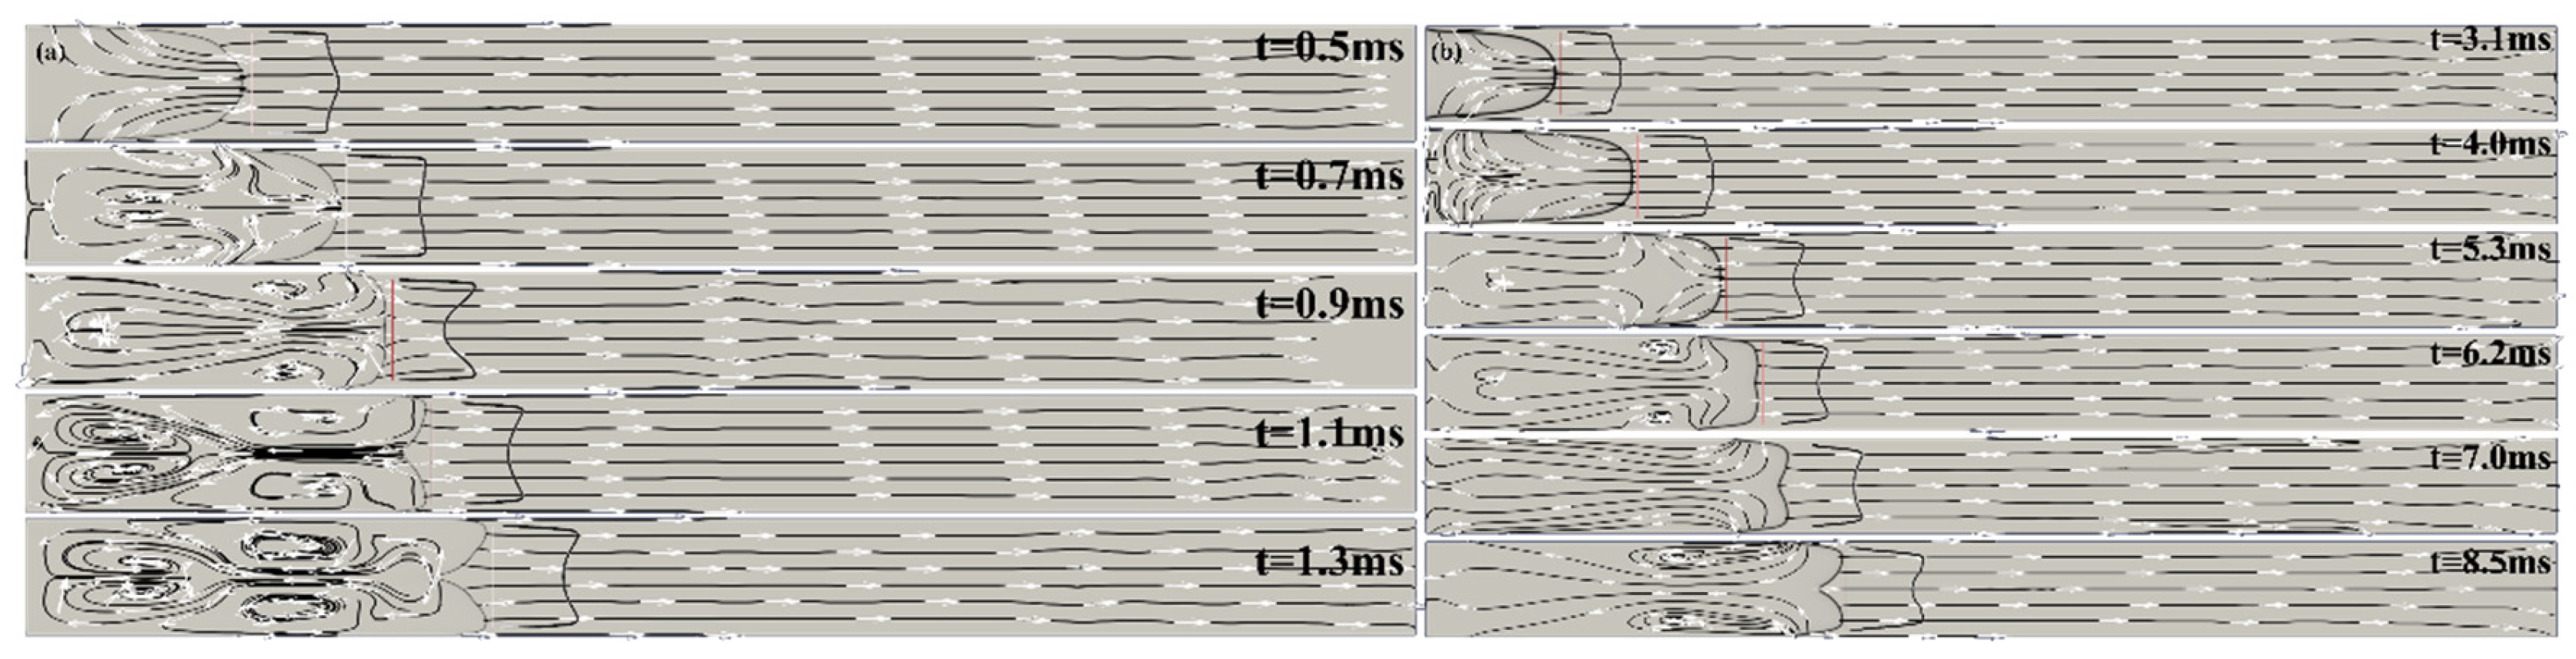
Dashed lines in show the differences in Figure 2a and in Figure 2b. It can be seen that for hydrogen/ air the velocity in the unburned gas near the sidewall exceeds the unburned gas velocity at the channel axis (mid-plane), at . Shortly thereafter, the axial velocity profile in the unburned gas begins to take on a tulip-shape, which leads to the inversion of the flame front and the formation of a tulip flame, as can be seen in Figure 3а.
In general, the tulip flame formation scenario in the methane/air shown in Figure 2b is similar to that for the hydrogen/air flame in Figure 2a. The main difference is that the tulip flame formation for hydrogen/air flame occurs approximately ten times faster than for methane/air flame. This is due to the much larger value of the negative acceleration at the hydrogen-air flame deceleration stage, which causes a much more intense initial rarefaction wave and, consequently, a much faster formation of the tulip flame. Another difference is the much greater acceleration of the hydrogen-air flame during the finger stage, just before the decelerating stage. During this stage the accelerating flame front generates strong pressure waves, which can be seen as the pressure growth rate in Figure 1a. The amplitude of the pressure waves generated by accelerating hydrogen/air flame is much greater (at least more than ten times) than the amplitude of pressure waves generated by methane/air flame. These strong pressure waves reflect from the opposite closed end of the channel travelling back and forth. They first enhance the effect of the initial rarefaction wave, and later, by creating a negative acceleration, they can induce a Rayleigh-Taylor instability leading to the formation of a distorting tulip flame [24,25], as shown in Figure 3a at .
On the contrary, in case of a methane/air flame there is the pressure waves are very weak and do not cause the flame velocity oscillations seen in Figure 1a and Figure 2a, or a flame instability, which can be seen in Figure 3a. Figure 3b shows that the methane/air flame is formed smoothly, without oscillations or instabilities.
3.2. 2D Channel with Both Ends Closed and Aspect Ratio
Figure 4a,b show the temporal evolution of the flame front velocities along the mid-plane of the channel and near the sidewall, the pressure rise, , and the pressure growth rate at the centerline ahead of the flame front calculated for the hydrogen/air (Figure 4a) and methane/air (Figure 4b) flames propagating in a 2D channel with aspect ratio .
It can be seen in Figure 4a that there are fewer reflected pressure waves colliding with the flame compared to the shorter channel considered in the previous Section 3.1. I Figure 1a shows that the collision of the flame with the reflected pressure wave at 0.25ms results in a lower maximum flame front velocity . While in Figure 4a the maximum flame front velocity along the center line is . A comparison of Figure 3a and Figure 6a shows that in the long channel, flame collisions with reflected pressure waves, if they can lead to the formation of a distorted tulip flame, do so at a much later time than in the short channel. The laminar velocity of methane/air flame is small and therefore the scenario of tulip flame formation is practically the same for channels with aspect ratio and .
Figure 5(a, b) shows (a) the temporal evolution of the unburned gas velocities at 0.5mm ahead of the flame front for hydrogen/air, and (b) for the methane/air flame. A higher velocity along the center line compared to shorter channel in Figure 1(a) is the result of higher flame front velocity Due to fewer collisions with the reflected pressure wave, the distorted tulip flame may develop later, if at all. Except for small fluctuations in unburned flow velocities and caused by weak pressure waves, the whole scenario of tulip flame formation in CH4/air is the same as in the shorter channel .
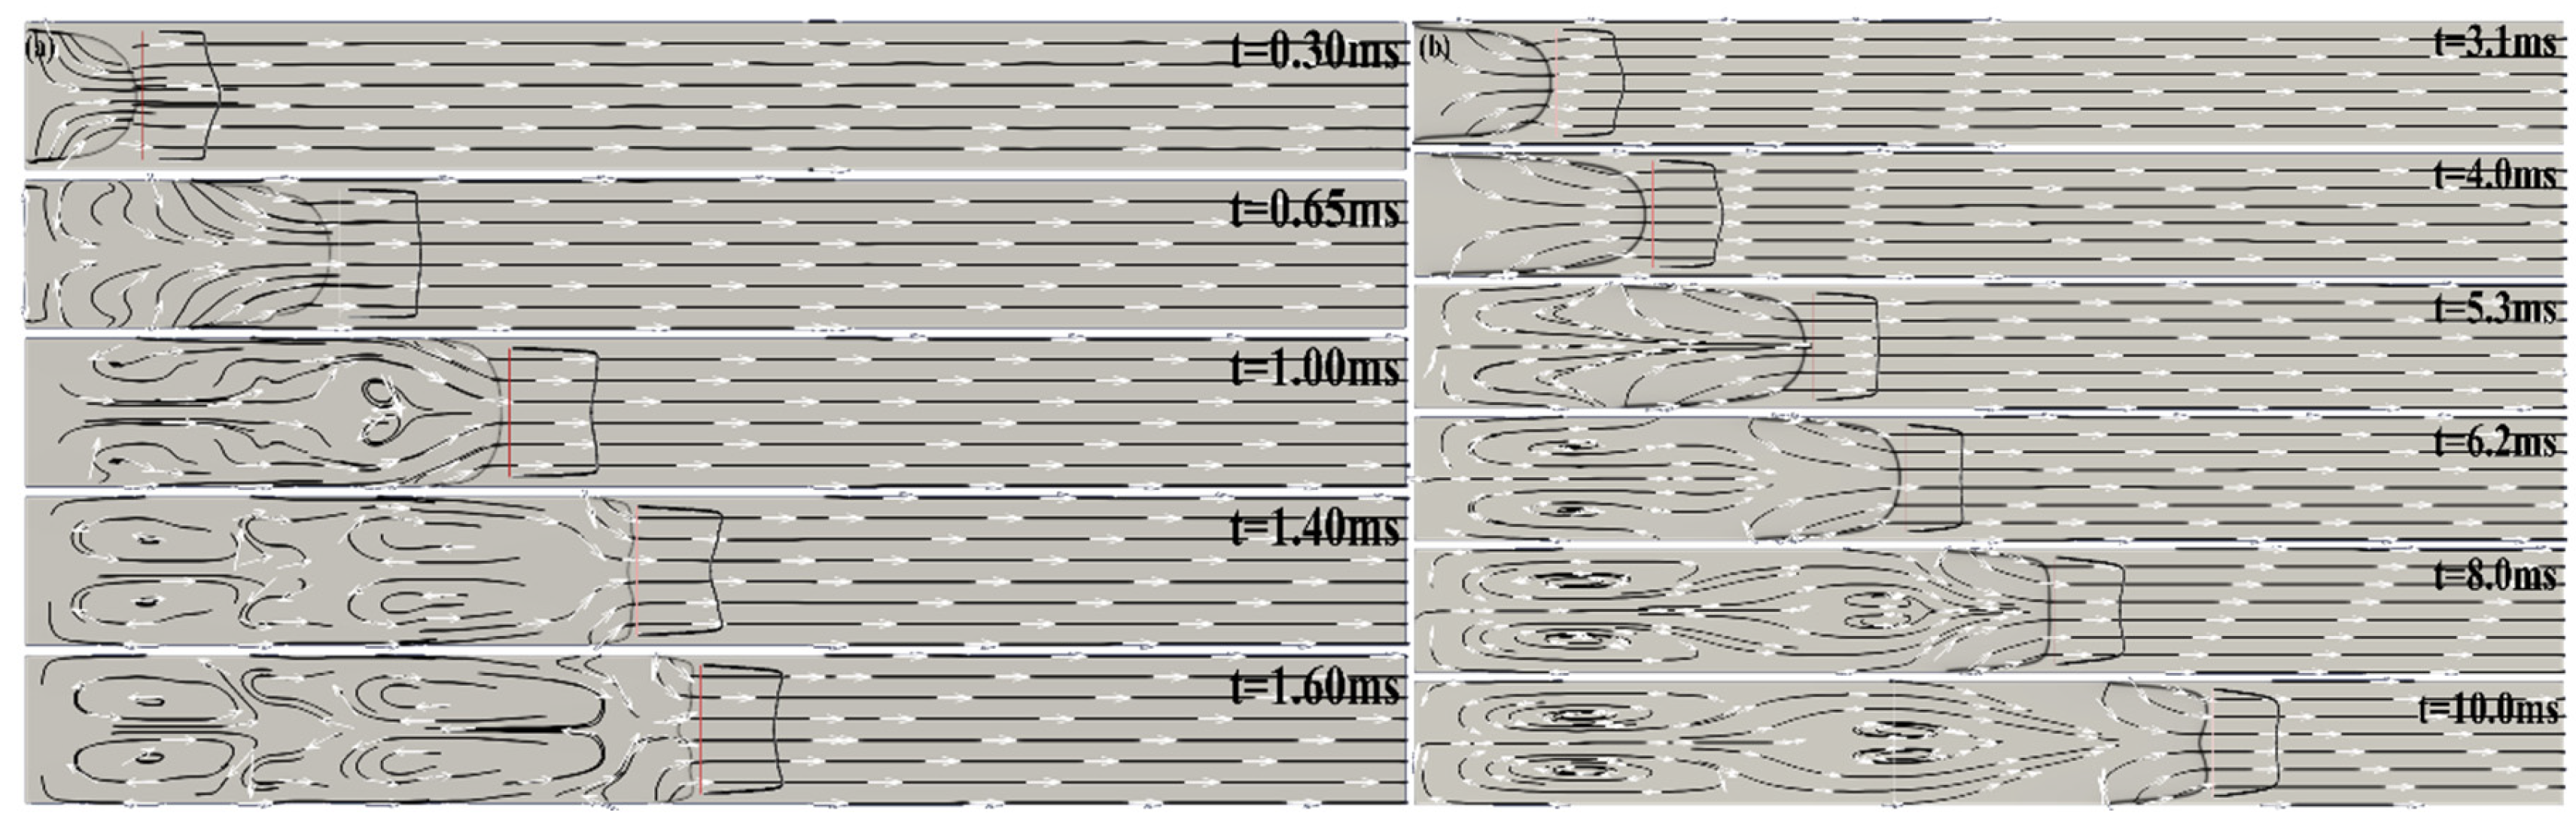
Figure 6(a, b) shows computed schlieren images and streamlines during tulip flame formation in (a) H2/air and (b) CH4/air mixtures in the long channel .
Figure 6.
(a) Sequences of computed schlieren images, streamlines during tulip flame formation in H2/air; and for Ch4/air mixtures; the channel aspect ratio is .
Figure 6.
(a) Sequences of computed schlieren images, streamlines during tulip flame formation in H2/air; and for Ch4/air mixtures; the channel aspect ratio is .
3.3. 2D Half-Open Channel
A half-open channel can be considered as a limiting case of a channel with a very large aspect ratio. In a half-open channel, there is no reflected pressure waves and the pressure is almost constant. Without pressure waves, which in a closed channel enhance the effect of the initial rarefaction wave and can initiate RT instability leading to a distorted tulip flame, tulip flame formation in a half-open channel takes longer time (Figure 9a) and proceeds smoothly.
Figure 7(a, b) shows the temporal evolution of the flame front velocities along the centerline and near the sidewall, the overpressure and the pressure growth rate calculated for the hydrogen/air (Figure 7a) and methane/air (Figure 7b) flames. The weak changes in the pressure growth rate and small oscillations of the flame front velocity seen in Figure 7a are related to the moment when the flame skirt touches the sidewall, which causes a weak expansion wave propagating towards the channel centerline and later reflecting from the sidewalls. They are much weaker for the methane/air flame in Figure 7b. The temporal evolutions of the velocity profile in the unburned gas just ahead of the flame front, which take on a tulip shape, is shown in Figure 8(a, b) and it is seen that they also proceed smoothly.
Finally, Figure 9(a, b) show sequences of computed schlieren images, streamlines during tulip flame formation in a half-open tube. It can be seen that in both cases, fast hydrogen/air flame and slow methane/air flame, the tulip flame formation takes longer time in a half-open channel (without reflected pressure waves) than in a closed channel.
Figure 9.
Sequences of computed schlieren images, streamlines during tulip flame formation in a half-open tube.
Figure 9.
Sequences of computed schlieren images, streamlines during tulip flame formation in a half-open tube.
4. Summary and Discussions
It is found that 2D simulations provide a good qualitative agreement with experimentally observed flame dynamics, development of tulip and distorted tulip flames in the highly reactive hydrogen/air and in the low reactive methane/air flames, in particular the dependence on the channel aspect ratio [30,47,48]. It is shown that the laminar flame velocity strongly affects flame dynamics in the early stages of flame propagation, in agreement with numerical simulations by Deng et al. [9], which used a one-step chemical model. The effect of reaction order was studied by Qi et al. [10]. The present study shows that the reaction order has little effect on the formation of tulip flames, but may be important in later stages during the formation of distorted flames.
One of the important conclusions of this study is that laminar flame velocity and flame acceleration are the main factors responsible for the formation of tulip flame. In particular, the ratio of the tulip flame formation times for H2/air and for CH4/air is equal to the ratio of their laminar flame velocities, , as can be seen in Figure 9.
Clanet and Searby [19] identified four characteristic times for the earlier stages of flame propagation: the time of transition from a spherical flame to a finger shape flame ; the time when the flame skirt of the finger shape flame touches the sidewall ; the time when flame inversion is initiated and the plane flame is formed ; the time of tulip flame formation . Using a geometric model by Clanet and Searby [19], we can write the equation for the flame tip velocity during the finger flame phase as
where is the coordinate of the finger flame tip, is the expansion factor, is the channel width, and is the laminar flame velocity. Differentiating Equation (12) with respect to time gives the dependence of flame acceleration on the laminar flame velocity
It should be emphasized that in the phase of flame deceleration, when the skirt of the flame begins to touch the side walls, the skirt of the finger flame is almost parallel to the side walls of the channel. This leads to even greater difference in flame accelerations for flames with different laminar flame velocities. For example, the numerical values of the flame accelerations during the acceleration () and deceleration () phases for the 2D channel considered in Sec. 3.1 are as follows: H2/air flame ; CH4/air flame , .
It should be noted that the hydrodynamic processes in 3D flames proceed considerably faster than those in 2D flames [26,49]. Therefore, the characteristic times and are longer for 2D flames than for 3D flames [26]. This explains the discrepancy between the theoretical prediction of the characteristic times and obtained using a simple 2D model, and the experimental times and measured in [24,48].
In recent paper by Lei et al. [50] it was assumed that effect of self-induced turbulence of burning velocity, and the flame wrinkling induced by DL instability is the main mechanism of tulip flame formation: “Darrieus-Landau instability and thermal-diffusive (TD) instabilities are the main reason for the formation of tulip flames, and the DL instability played a dominant role”. However, no evidence has been provided that this is actually the case, while many experimental and numerical studies show that tulip flame is formed without turbulence. The fact that tulip flame formation occurs faster than the characteristic time of the DL instability was established in numerical simulations long time ago by Gonzalez et al. [51] and Dunn-Rankin and Sawyer [52]. Here we show that the tulip flame formation due to the rarefaction wave takes much shorter time than the characteristic times of the DL and TD instabilities. The time of the DL instability development can be estimated as , where
is the increment of the DL instability, is the laminar flame speed, is expansion coefficient, the ratio of unburned to burned gas densities, is the wave number. The time of establishing the reverse flow by a rarefaction wave can be estimated as
where is a speed of sound. Taking into account that the perturbation wavelength of the DL instability, which may be responsible for the flame front inversion, should be about the channel width, , we obtain
Since the laminar flame velocity is much less than the sound velocity, , the inequality (16) holds for all flammable gas mixtures. In the same way, assuming for simplicity a unity Lewis number, it can be shown that the ratio of the characteristic time of the rarefaction wave to the characteristic time of the thermal-diffusive instability for is
This means that Darrieus-Landau or thermal-diffusive flame front instabilities are not involved in flame front inversion and tulip flame formation, in agreement with experimental studies by Ponizy et al. [27].
Since the intensity of the rarefaction wave is characterized by the flame acceleration after the flame skirt touches the sidewall, the times of flame front inversion and tulip flame formation are determined by the flame acceleration, which in turn depends strongly on the laminar flame velocity. Therefore, another conclusion is that at sufficiently low laminar flame velocities, the intensity of the rarefaction wave can be reduced to such an extent that a tulip-shaped flame does not form. In this case, possible phenomena that may prevent tulip flame formation at low laminar flame velocities are the buoyancy effect resulting in faster development of the upper or lower lip, or sufficient time for flame instabilities to develop. This conclusion agrees well with the evolution of CH4/H2/air flames at different inhibitor percentages and hence different laminar flame velocities shown in Figure 3 of the experimental study of methane/hydrogen/air flames by Zhang et al. [53].
Author Contributions
C. Q.: software, validation, resources, visualization, writing review and editing, data curation. M. L.: Conceptualization, methodology, formal analysis, writing original draft, supervision, project administration, funding acquisition, writing review and editing. Both authors have read and agreed to the published version of the manuscript.
Acknowledgements
The authors benefitted from fruitful discussions with A. Brandenburg, P. Clavin and G. Sivashinsky. M. L. acknowledges the support for this work by the Olle Engkvists Stiftelse (Foundation) under grant No.232-0212, project No 31005258.
Conflicts of Interest
The authors declare that they have no known competing financial interests or personal relationships that could have appeared to influence the work reported in this paper.
References
- J.A. Schouten, J.P.J. Michels, R. Janssen-van Rosmalen, Effect of H2-injection on the thermodynamic and transportation properties of natural gas. Int J Hydrogen Energy 29 (2004) pp. 1173–1180. [CrossRef]
- E. Tzimas, P. Castello, S. Peteves, The evolution of size and cost of a hydrogen delivery infrastructure in Europe in the medium and long term. Int. J. Hydrogen Energy 32 (2007) pp. 1369-1380. [CrossRef]
- X. Meng, L. Liu, M. Zhang, X. Zhang, W. Long, M. Bi, Chemical kinetic and behavior study of the cracked gas of H2/N2 and DME addition on ammonia combustion in lean-burn condition. Int. J Hydrogen Energy 49 (2023) pp. 997–1008.
- B.C. Erdener, B. Sergi, O.J. Guerra, A.L. Chueca, K. Pambour, C. Brancucci, B.-M. Hodge, A review of technical and regulatory limits for hydrogen blending in natural gas pipelines. Int. J. Hydrogen Energy 48 (2023) pp. 5595–5617. [CrossRef]
- J. Wang, Z. Huang, C. Tang, J. Zheng, Effect of hydrogen addition on early flame growth of lean burn natural gas–air mixtures. Int. J. Hydrogen Energy 35 (2010) pp.7246–7252. [CrossRef]
- Z. Yuan, H. Cong, Y. Bi, L. Ye, M. Bi, Y. Zeng, Experimental and theoretical studies on the premixed H2/CH4/air mixture with different fuel compositions under narrow-space ignition condition. Int J Hydrogen Energy 78 (2024) pp. 1306–1315.
- Z. Yuan, H. Cong, X. Mu, Y. Bi, L. Ye, M. Bi, Y. Zeng, Deflagration evolution of premixed H2/CH4/air mixture undergoing a sudden expansion near the ignition source in a half-open duct. Int. J. Hydrogen Energy 50 (2024) pp. 1314–1324.
- W. Yang, X. Yang, K. Zhang, C. Liu, Y. Zhang, Experimental study on the explosion flame propagation behavior of premixed CH4/H2/air mixtures with inert gas injection. Int. J. Hydrogen Energy 84 (2024) pp. 106–117.
- H. Deng, Z. Yao, G. Chen, X. Wen, F. Wang, Q. Zhang, J. Dong, M. Huang, Numerical study of the effects of laminar flame speed on flame dynamics in the early stages of flame propagation in two-dimensional half open tubes. Int. J. Hydrogen Energy, 46 (2021) pp. 1288-1301. [CrossRef]
- B. Qi, H. Deng, M. Yu, H. Li, X. Yang, Numerical investigation on the effects of reaction orders on the flame propagation dynamic behaviours for premixed gas in a closed tube. Int. J. Hydrogen Energy 47 (2022) pp. 8037–8047.
- O. Ellis, Flame movement in gaseous explosive mixtures. Fuel Sci. 7 (1928) pp. 502–508.
- D. Dunn-Rankin, Combustion Phenomena: Selected Mechanisms of Flame Formation, Propagation and Extinction. Ed. J. Jarosinski and B. Veyssiere. CRC Press, Boca Raton, FL. 2009.
- G. Searby, Combustion Phenomena, CRC Press, Boca Raton, FL, 2009.
- X. Li, H. Xiao, Q. Duan, J. Sun, Numerical study of premixed flame dynamics in a closed tube: Effect of wall boundary condition. Proc. Combust. Inst. 38 (2021) pp. 2075–2082. [CrossRef]
- T. Shen, M. Li, H. Xiao, Propagation of premixed hydrogen-air flame initiated by a planar ignition in a closed tube. Int. J. Hydrogen Energy 47 (2022) pp. 4903-4915. [CrossRef]
- C. Qian, M. A. Liberman, On the mechanism of “tulip flame” formation: The effect of ignition sources. Phys. Fluids 35 (2023) pp. 116122 (1-13). [CrossRef]
- G. H. Markstein, A shock-tube study of flame front-pressure wave interaction. Symp. (Int.) Combust., Proc. Combust. Inst. 6 (1957) pp. 387–398. [CrossRef]
- M.A. Liberman, V.V. Bychkov, S.M. Golberg, L.E Eriksson, Numerical Study of Curved Flames under Confinement. Combust. Sci. Technol. 136 (1998) pp. 221-251.
- C. Clanet, G. Searby, On the ‘tulip flame’ phenomenon, Combust. Flame, 105 (1996) 225–238.
- R. Starke, P. Roth, An experimental investigation of flame behavior during cylindrical vessel explosions. Combust. Flame, 66 (1986) pp. 249-259. [CrossRef]
- M. Matalon, P. Metzener, The propagation of premixed flames in closed tubes. J. Fluid Mech., 336 (1997) pp. 331–350. [CrossRef]
- P. Metzener, M. Matalon, Premixed flames in closed cylindrical tubes. Combust. Theor. Model., 5 (2001) pp. 463–483. [CrossRef]
- V.N. Kurdyumov, M. Matalon, Self-accelerating flames in long narrow open channels Proc. Combust. Inst. 35 (2015) pp. 921–928.
- H. Xiao, D. Makarov, J. Sun, V. Molkov, Experimental and numerical investigation of premixed flame propagation with distorted tulip shape in a closed duct. Combust. Flame, 159 (2012) pp. 1523–1538. [CrossRef]
- H. Xiao, R.W. Houim, E.S. Oran, Formation and evolution of distorted tulip flames. Combust. Flame, 162 (2015) pp. 4084–4101. [CrossRef]
- M. A. Liberman, C. Qian, C. Wang, Dynamics of flames in tubes with no-slip walls and the mechanism of tulip flame formation. Combust. Sci. Technol. 195 (2023) 1637-1665. 1637–1665. [CrossRef]
- B. Ponizy, A. Claverie, B. Veyssière, Tulip flame—the mechanism of flame front inversion. Combust. Flame, 161 (2014) 3051–3062. [CrossRef]
- K. Zheng, Z. Song, C. Song, Q. Jia, J. Ren, X. Chen, Investigation on the explosion of ammonia/hydrogen/air in a closed duct by experiments and numerical simulations. Int. J. Hydrogen Energy 79 (2024) pp. 1267–1277. [CrossRef]
- K. Zheng, M. Yu, Y. Liang, L. Zheng, X. Wen, Large eddy simulation of premixed hydrogen/methane/air flame propagation in a closed duct. Int. J. Hydrogen Energy 43 (2018) pp 3871–84. [CrossRef]
- M. Yu, K. Zheng, L. Zheng, T. Chu, P. Guo, Scale effects on premixed flame propagation of hydrogen/methane deflagration. Int. J. Hydrogen Energy 40 (2015) pp. 13121–1333. [CrossRef]
- J. Li, Z. Zhao, A. Kazakov, F. L. Dryer, An updated comprehensive kinetic model of hydrogen combustion. Int. J. Chem. Kinetics, 36(10) (2004) pp. 566-575. [CrossRef]
- J. Liberatori, R. M. Galassi, D. Bianchi, F. Nasuti, M. Valorani, P. P. Ciottoli, Family of Skeletal Reaction Mechanisms for Methane–Oxygen Combustion in Rocket Propulsion. J. Propulsion and Power 40 920 (2024) pp. 303-319. [CrossRef]
- M. Goswami, S.C.R. Derks, K. Coumans, W.J. Slikker, M.H. de Andrade Oliveira, R.J.M. Bastiaans, C.C.M. Luijten, L.P.H. de Goey, and A.A. Konnov, The effect of elevated pressures on the laminar burning velocity of methane + air mixtures, Combust. Flame 160 (2013) pp. 1627–1635. [CrossRef]
- M. Goswami, K. Coumans, R.J.M. Bastiaans, A.A. Konnov, and L.P.H. de Goey, Numerical simulations of flat laminar premixed methane-air flames at elevated pressure, Combust. Sci. Technol. 186 (2014) pp. 1447–1459. [CrossRef]
- M. Frenklach, N.W. Moriarty, B. Eiteneer, M. Goldenberg, C.T. Bowman, R.K. Hanson, S. Song, W.C. Gardiner Jr., V.V. Lissianski, G.P. Smith, D.M. Golden, and Z. Qin, Gri mech 3.0. http://www.me.berkeley.edu/gri-mech/.
- M.A. Liberman, C. Wang, C. Qian, J.N. Liu, Influence of chemical kinetics on spontaneous waves and detonation initiation in highly reactive and low reactive mixtures, Combust. Theory and Modelling, 23 (2019) pp. 467–495. [CrossRef]
- A. Ern, V. Giovangigli, Fast and accurate multicomponent transport property evaluation J. Comput. Phys. 120(1) (1995) pp. 105-116.
- M.T. Henry de Frahan, J.S. Rood, M.S. Day, et al. PeleC: An adaptive mesh refinement solver for compressible reacting flows. Int. Journal of high-performance computing Applications, 37(2) (2023) pp. 115-131. [CrossRef]
- G.S. Jiang, C.W. Shu, Efficient implementation of weighted ENO schemes. J. Comput. Phys. 126(1) (1996) pp. 202-228. [CrossRef]
- R. Speck, D. Ruprecht, M. Emmett, et al. A multi-level spectral deferred correction method. BIT Numerical Mathematics, 55(3) (2015) pp. 843-867. [CrossRef]
- D.J. Gardner, D.R. Reynolds, C.S. Woodward, et al. Enabling new flexibility in the SUNDIALS suite of nonlinear and differential/algebraic equation solvers. ACM Transactions on Mathematical Software (TOMS). 48(3) (2022) pp. 1-24. [CrossRef]
- W. Zhang, A. Almgren, V. Beckner, et al. AMReX: a framework for block-structured adaptive mesh refinement. Journal of Open Source Software. 4(37) (2019) pp. 1370 (1-4). [CrossRef]
- T. Poinsot, D. Veynante, Theoretical and numerical combustion. RT Edwards, Inc., 2005.
- B. Zeldovich, G. I. Barenblatt, V. B. Librovich, G. M. Makhviladze, Mathematical theory of combustion and explosion. New York: Consultants Bureau; 1985.
- M. Matalon, B.J. Matkowsky, Flames as gasdynamic discontinuities. J. Fluid Mech. 124 (1982) pp. 239-259. [CrossRef]
- L.D. Landau, E.M. Lifshitz, Fluid Mechanics. Pergamon Press, Oxford, 1989.
- X. Shen, C. Zhang, G. Xiu, H. Zhu, Evolution of premixed stoichiometric hydrogen/air flame in a closed duct. Energy 176 (2019) pp. 265-271. [CrossRef]
- K. Zheng, M. Yu, L. Zheng, X. Wen, T. Chu, L. Wang, Experimental study on premixed flame propagation of hydrogen/methane/air deflagration in closed ducts. Int. J. Hydrogen Energy, 42 (2017) pp. 5426–5438. [CrossRef]
- M.F. Ivanov, A.D. Kiverin, I.S. Yakovenko, and M.A. Liberman, Hydrogen-Oxygen Flame Acceleration and Deflagration-to-Detonation Transition in Three-dimensional Rectangular Channels with no-slip Walls. Int, J, Hydrogen Energy, 38, 16427-16440 (2013). [CrossRef]
- B. Lei, Z. Wu. Z. Guo, Z. Zhao, Study of the influence of flame instability on tulip flame formation. J. Hydrogen Energy, 99 (2025) pp. 418–428. [CrossRef]
- M. Gonzalez, R. Borghi, A. Saouab, Interaction of a flame front with its self-generated flow in an enclosure: The “tulip flame” phenomenon. Combust. Flame, 88 (1992) pp. 201–220. [CrossRef]
- D. Dunn-Rankin and R.F. Sawyer, Tulip flames: Changes in shapes of premixed flames propagating in closed tubes, Experiments in Fluids 24 (1998), pp. 130–140. [CrossRef]
- C. Zhang, X. Shen, J.X. Wen, G. Xiu, The behaviour of methane/hydrogen/air premixed flame in a closed channel with inhibition. Fuel 265 (2020) pp.116810 (1-10).
Figure 1.
(a) Temporal evolution of the H2/air flame front velocities at and at ; and (b) CH4/air flame front velocities at and at .
Figure 1.
(a) Temporal evolution of the H2/air flame front velocities at and at ; and (b) CH4/air flame front velocities at and at .
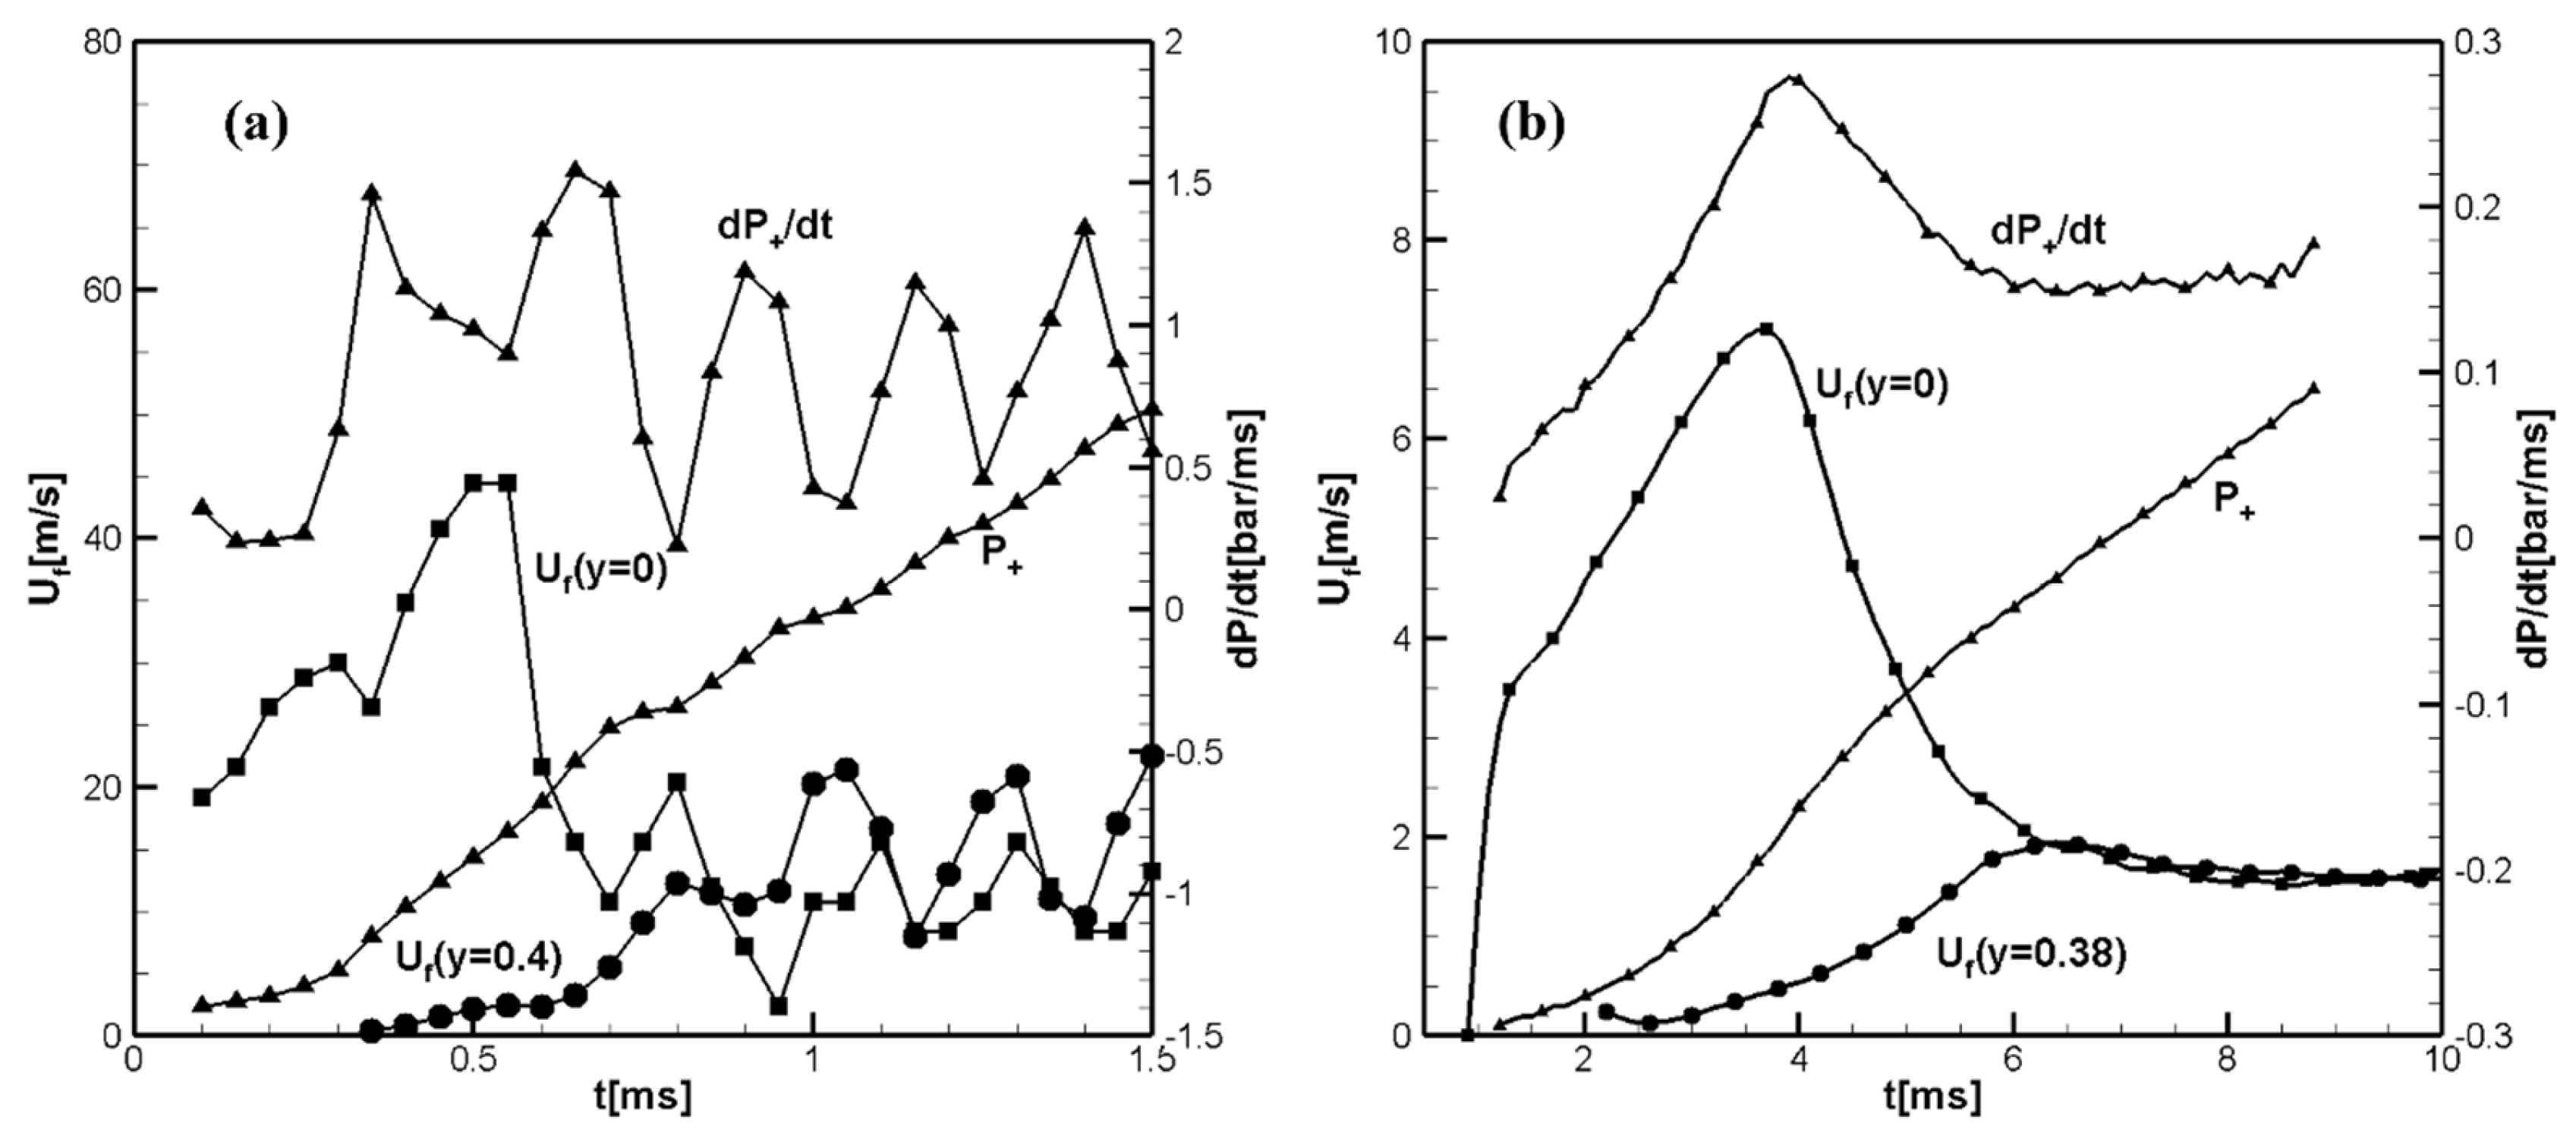
Figure 2.
(a) Temporal evolution of the unburned flow velocities and in H2/air; and (b) in CH4/air and .
Figure 2.
(a) Temporal evolution of the unburned flow velocities and in H2/air; and (b) in CH4/air and .
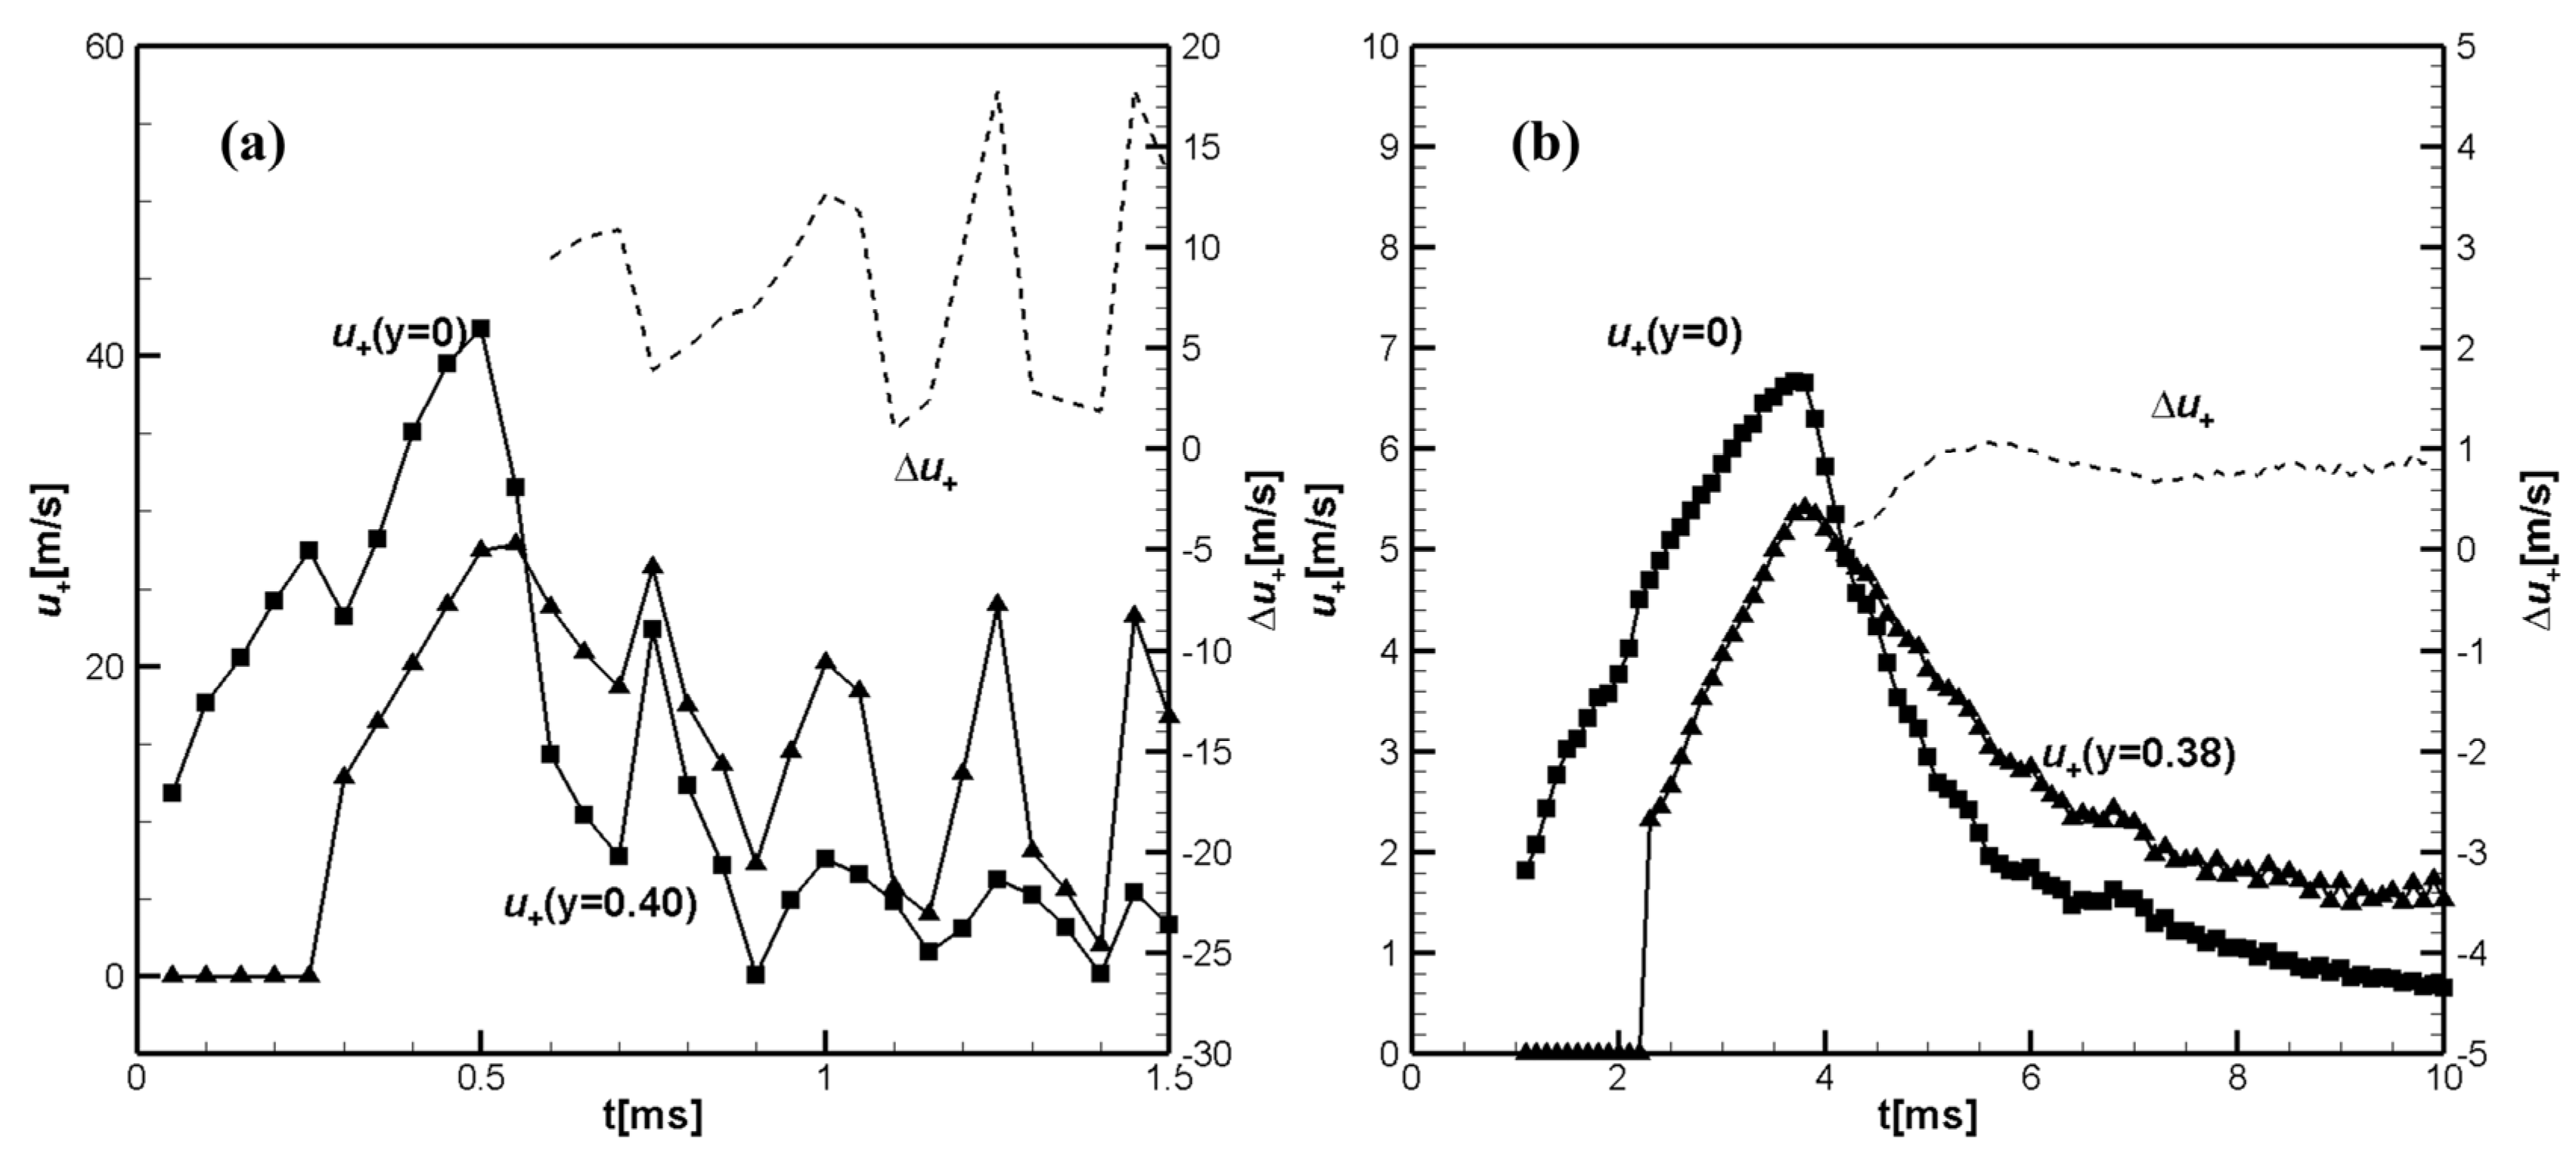
Figure 3.
(a) Time sequence of computed schlieren images and streamlines for H2/air; (b) for CH4/air flame.
Figure 3.
(a) Time sequence of computed schlieren images and streamlines for H2/air; (b) for CH4/air flame.
Figure 4.
(a) Temporal evolution of velocities on the flame front at and for H2/air; (b) the same for CH4/air for and .
Figure 4.
(a) Temporal evolution of velocities on the flame front at and for H2/air; (b) the same for CH4/air for and .
Figure 5.
(a) Temporal evolution of the unburned flow velocities and in H2/air; (b) the unburned flow velocities and in CH4/air.
Figure 5.
(a) Temporal evolution of the unburned flow velocities and in H2/air; (b) the unburned flow velocities and in CH4/air.
Figure 7.
(a) Temporal evolution of velocities on the flame front at and for H2/air; (b) the same for CH4/air for and .
Figure 7.
(a) Temporal evolution of velocities on the flame front at and for H2/air; (b) the same for CH4/air for and .
Figure 8.
(a) Temporal evolution of the unburned flow velocities and in H2/air mixture; (b) the unburned flow velocities and in CH4/air.
Figure 8.
(a) Temporal evolution of the unburned flow velocities and in H2/air mixture; (b) the unburned flow velocities and in CH4/air.
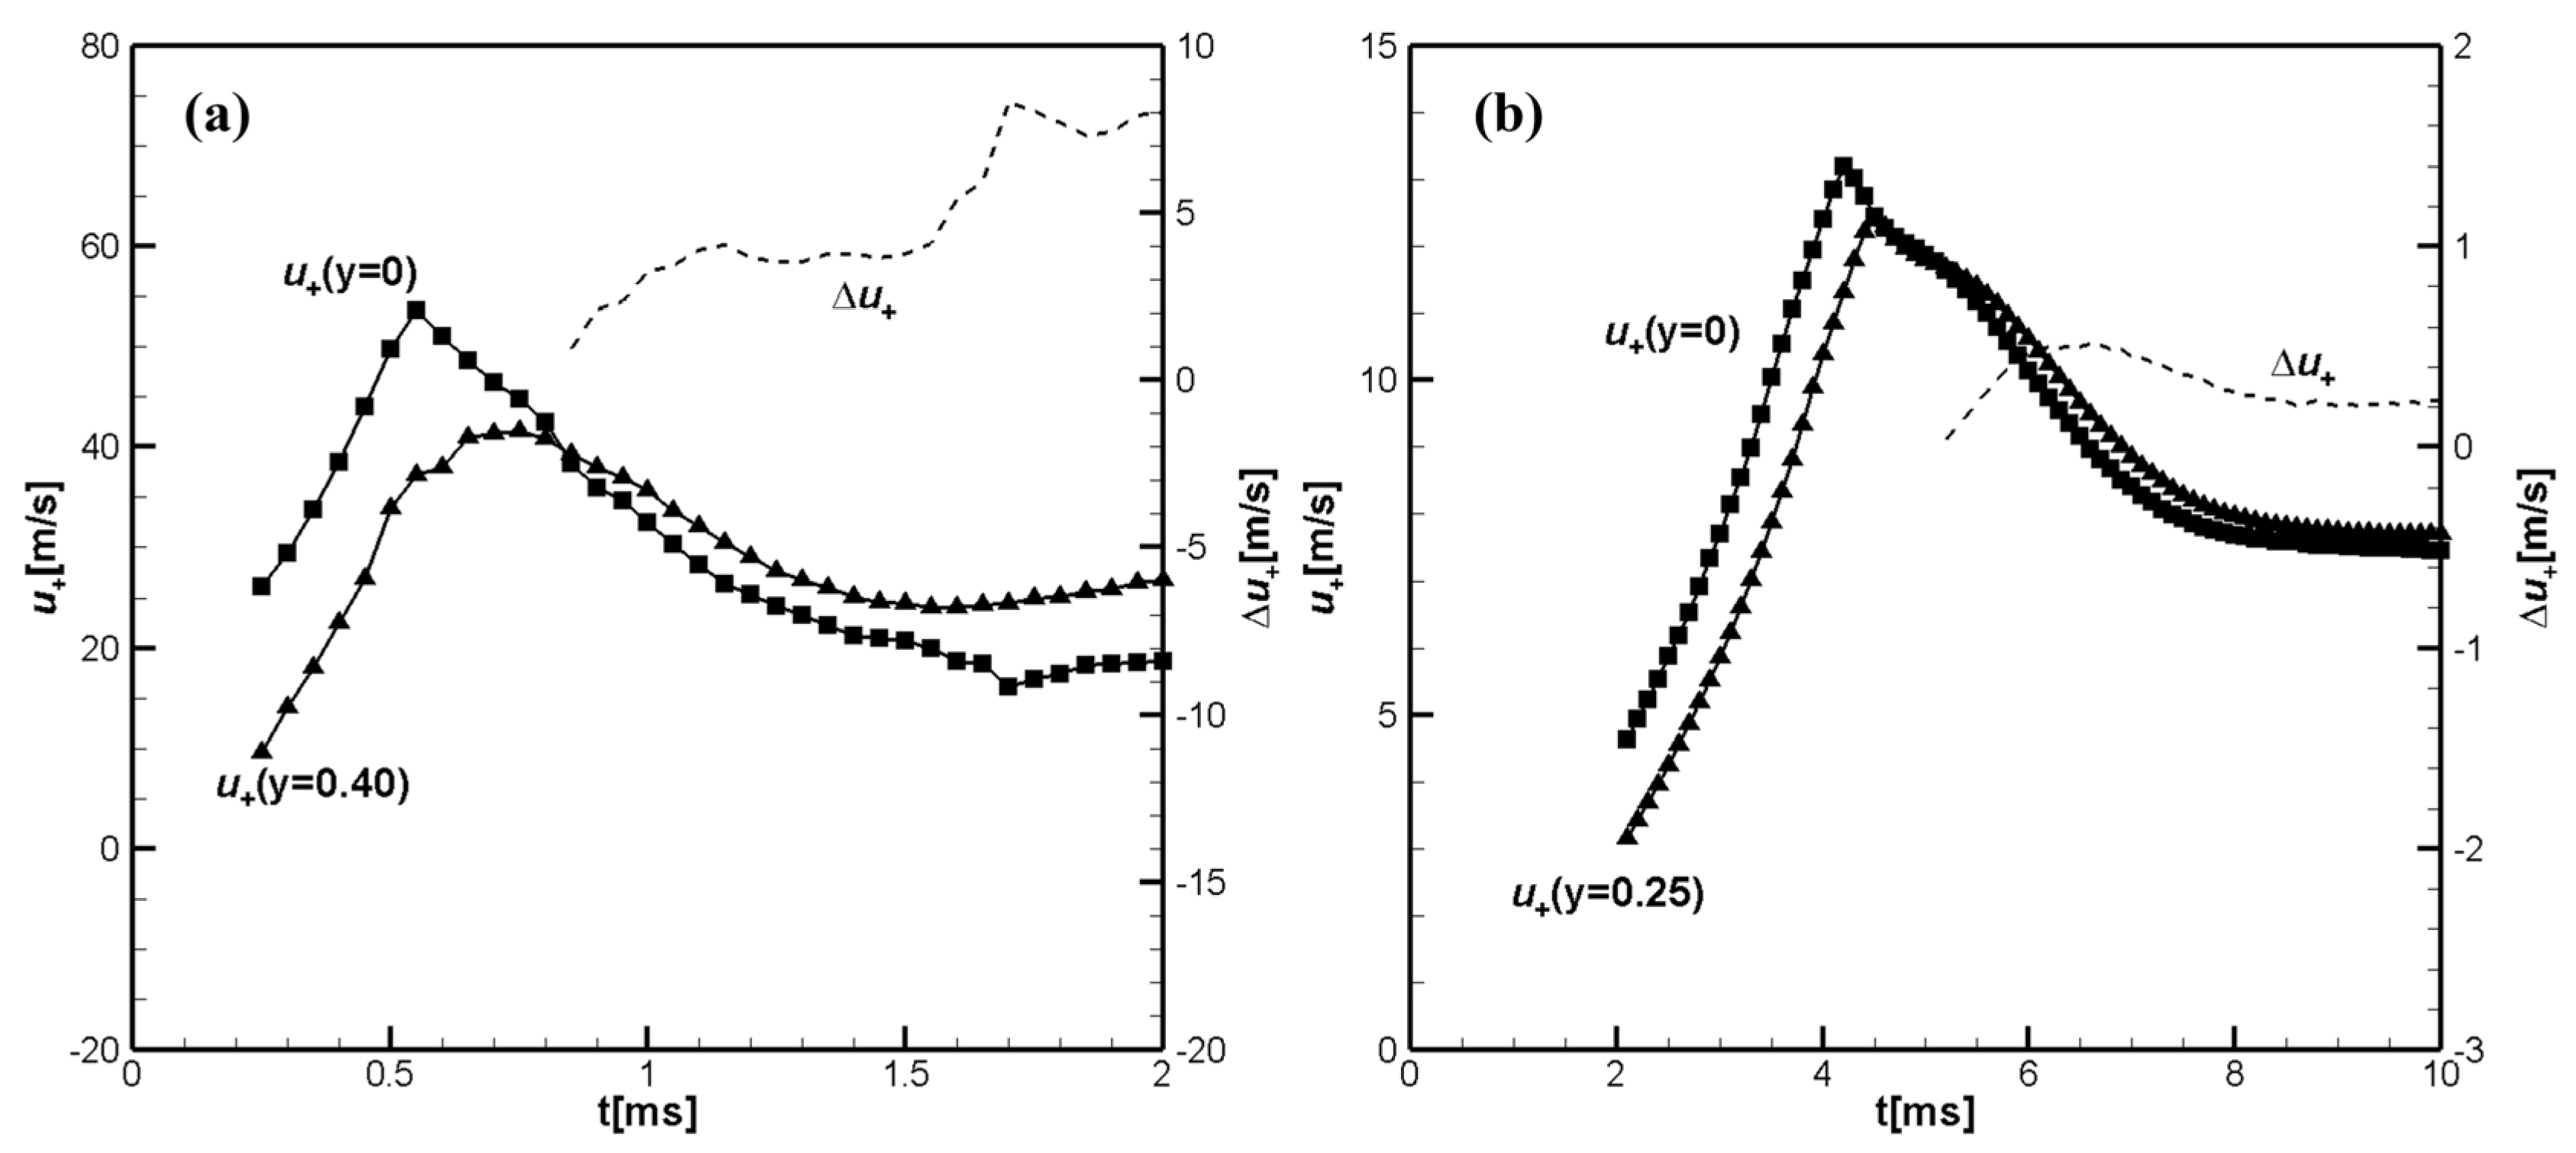

Table 1.
Model parameters for simulating a stoichiometric hydrogen–air flame.
| Initial pressure | 1.0 atm | |
| Initial temperature | 298 K | |
| Initial density | ||
| Laminar flame velocity | 2.43 m/s | |
| Laminar flame thickness | 0.0325 cm | |
| Adiabatic flame temperature | 2503K | |
| Expansion coefficient () | 8.34 | |
| Specific heat ratio | 1.399 | |
| Sound speed |
Table 2.
Model parameters for simulating a stoichiometric methane–air flame.
| Initial pressure | 1.0 atm | |
| Initial temperature | 298 K | |
| Initial density | 1.1× 10⁻³g/cm3 | |
| Laminar flame velocity | 0.3803m/s | |
| Laminar flame thickness | 451μm | |
| Adiabatic flame temperature | 2231K | |
| Expansion coefficient () | 7.2 | |
| Specific heat ratio | 1.38 | |
| Sound speed | 332 m/s |
Disclaimer/Publisher’s Note: The statements, opinions and data contained in all publications are solely those of the individual author(s) and contributor(s) and not of MDPI and/or the editor(s). MDPI and/or the editor(s) disclaim responsibility for any injury to people or property resulting from any ideas, methods, instructions or products referred to in the content. |
© 2025 by the authors. Licensee MDPI, Basel, Switzerland. This article is an open access article distributed under the terms and conditions of the Creative Commons Attribution (CC BY) license (http://creativecommons.org/licenses/by/4.0/).
Copyright: This open access article is published under a Creative Commons CC BY 4.0 license, which permit the free download, distribution, and reuse, provided that the author and preprint are cited in any reuse.


