
Submitted:
08 January 2025
Posted:
09 January 2025
You are already at the latest version
Abstract
The estimation of Peak Ground Acceleration (PGA) in areas affected by earthquakes is a fundamental task in seismic hazard assessment and emergency response. This paper presents an automated service capable of rapidly calculating the PGA values in regions impacted by seismic events, and publishing its results in an interactive website. The importance of such a service is discussed, focusing on its contribution to timely response efforts and infrastructure resilience. The necessity for automatic and real-time systems in earthquake-prone areas is emphasized, enabling decision-makers to assess damage potential and deploy resources efficiently. Thanks to a collaboration agreement with the Civil Protection Department, we are able to acquire accelerometric data from the Italian National Accelerometric Network (RAN) in real-time at the monitoring center of the Osservatorio Vesuviano. These data, in addition to those normally acquired by the INGV network, enables us to utilize all available accelerometric data in the Campi Flegrei area, enhancing our capacity to provide timely and accurate PGA estimates during seismic events in this highly active volcanic region.
Keywords:
urban shaking data
; seismic hazard assessment
; emergency response
; campi flegrei
; peak ground acceleration
; pseudo-spectral acceleration
; earthquake
1. Introduction
Earthquakes are among the most destructive natural hazards, capable of causing extensive damage to infrastructure, loss of life, and economic disruption. One of the key metrics in assessing earthquake-induced ground shaking is Peak Ground Acceleration (PGA), which quantifies the maximum acceleration of the ground during seismic events. PGA values are critical in estimating the intensity of ground motion, assessing structural damage, and informing emergency response [1].
Traditional methods of calculating PGA rely on seismic station networks and expert analysis, which may take valuable time during the crucial hours following a seismic event. The development of a fully automatic service capable of providing rapid and accurate PGA calculations, whose results can be viewed by using a common web browser can significantly improve emergency response times and enhance risk mitigation strategies [2].
This work is organized as follows: in Section 2 is introduced the importance of an automated and early calculated PGA, then in Section 3 a description of the Campi Flegrei real-time network is given. A description of the developed system is given in Section 4 while its operations are illustrated in Section 5. A comparison with a similar tool, but with a different approach is given in Section 6. The paper ends in Section 7 with conclusion and future works direction.
2. The Importance of Automation and Speed in PGA Calculations
In the immediate aftermath of an earthquake, time is a critical factor. Traditional seismic analysis often requires manual input from experts, which can result in delays of hours to days. During this time, ongoing seismic activity (aftershocks) and potential secondary disasters, such as landslides and tsunamis, can exacerbate the crisis [3,4]. Rapid estimation of Peak Ground Acceleration (PGA) is crucial to assess the intensity of ground shaking and predict potential damage to infrastructure, particularly in densely populated or vulnerable areas.
Automated systems that continuously monitor seismic activity have become essential in modern seismic hazard assessment frameworks. The integration of real-time data from accelerometers, GPS, and seismic sensors has transformed seismic monitoring into a dynamic and fast-responding process. Real-time processing allows decision-makers to deploy search and rescue operations more efficiently, minimizing the time required to assist affected populations [5]. Moreover, automated systems enhance infrastructure resilience by enabling rapid inspection of critical facilities, such as bridges, dams, and power plants, where structural failure could lead to cascading disasters [6].
The automation of PGA calculation significantly reduces the risk of human error and dramatically shortens the time between earthquake detection and PGA estimation. This real-time analysis enables emergency response teams to prioritize actions, such as allocating resources and personnel to areas experiencing the highest shaking intensities. Automation also helps in forecasting potential damage zones and in issuing timely warnings to the public [7,8].
Other than improving the efficiency of emergency operations, real-time PGA calculations contribute significantly to long-term disaster resilience by directly informing building codes and urban planning. By utilizing high-resolution seismic data, authorities can create more accurate risk maps, which in turn support the development and enforcement of updated building codes. These codes define stricter construction standards for high-risk areas, ensuring that new structures are designed to better withstand seismic events. Additionally, this data-driven approach emphasizes the retrofitting of older infrastructure to bring it in line with modern safety standards, thereby reducing vulnerability and enhancing the overall resilience of communities [9]..
3. Real-Time Data Access
The INGV - Osservatorio Vesuviano, as an institution dedicated to volcanic research and monitoring, has a dense network of multi-parameter stations in the Campi Flegrei area, a region of high seismic and volcanic activity, in southern Italy. Most of these stations are already equipped with an accelerometer, and the related data are acquired in real time at Monitoring Center.
Thanks to a collaboration agreement with the Civil Protection Department, we are also able to acquire accelerometric data from the Italian National Accelerometric Network (RAN) in real-time at the monitoring center of the Osservatorio Vesuviano. This collaboration provides us with the capability to leverage all available accelerometric data to the Campi Flegrei area. By integrating these data streams into our automated system, we can offer near-instantaneous calculations of PGA, enabling authorities to quickly assess the damage potential of ongoing seismic events.
In addition, we have been able to further enhance the monitoring network with installations at schools, businesses, and private buildings after installing a dedicated accelerometric network for urban monitoring [10]. This intensification has significantly expanded our ability to capture critical data, improving the responsiveness and accuracy of seismic assessments in the area. With such accelerometric network, an average interstation distance of 4.4 km is achieved in the most seismically active area, calculated using the Haversine formula.
Access to real-time accelerometric data is particularly beneficial in areas like the Campi Flegrei, where seismic events can have complex interactions with volcanic processes, potentially amplifying ground motion and increasing the risk of structural damage [11]. The ability to monitor such regions in real time enhances the safety and preparedness of both local authorities and the public.
In Figure 1 is shown the current map of all accelerometric stations in the Campi Flegrei area. The red triangles represent the INGV-OV seismic stations of the permanent seismic network, the blue triangles indicate the RAN accelerometers, and the yellow ones represent the accelerometers temporarily installed by INGV, which integrate the seismic network with proprietary dataloggers and high-quality MEMS accelerometers
4. Web-Based PGA and PSA Calculation System: Functionality and Impact
A web-based PGA calculation system provides a user-friendly interface for immediate access to seismic hazard information following an earthquake. Such a system typically integrates real-time seismic data from a network of accelerometers and ground motion sensors, combined with algorithms to calculate the PGA values for various affected locations [12].
Our analysis is important to evaluate seismic behavior as it enables a detailed understanding of how structures respond under earthquake-induced forces, particularly through the use of Peak Ground Acceleration (PGA) in Finite Element Method (FEM) models. By incorporating accurate PGA data, we can simulate real-world seismic conditions and predict how a structure will perform during an earthquake. This is crucial to design safer buildings, bridges, and infrastructure in seismic zones. The integration of web-based PGA calculation tools further enhances this process, allowing engineers to quickly adapt models to local seismic characteristics, thereby improving both the precision and accessibility of seismic evaluations. Such advancements are key in reducing risks and optimizing structural resilience.
The use of Peak Ground Acceleration (PGA) parameters in finite element method (FEM) structural models is becoming an effective approach to evaluate seismic behavior. PGA represents the most direct measure of ground motion intensity experienced by a structure and can be used to define realistic dynamic loads in FEM simulations, improving the accuracy in predicting structural stresses and displacements during seismic events [13]. The integration of web-based systems for PGA calculation within FEM modeling platforms offers significant advantages in terms of speed and precision, enabling the customization of seismic loads according to local conditions, thereby enhancing the reliability of structural forecasts [14]. Furthermore, the availability of such web-accessible tools allows for broader access by engineers and professionals, facilitating the integration of complex seismic analysis into routine design practice. This practice is already being implemented by Leonardo spa, a major company operating in the Campi Flegrei area, which uses the PGA value recorded at the nearest accelerometric station to evaluate the seismic behavior of structures.
4.1. Assessment of Pseudo-Acceleration Spectra (PSA) for Seismic Resilience in Densely Urbanized Areas
The calculation of Pseudo Spectral Acceleration (PSA), defined as the absolute maximum response of a single-degree-of-freedom oscillator (SDOF) to an input ground motion, after significant seismic events is a crucial tool in seismic risk management. It provides an in-depth understanding of ground motion characteristics and their effects on different types of structures, contributing to immediate risk assessment, the improvement of seismic hazard models, and the development of safer urban environments. The integration of PSA data into engineering and emergency response practices represents a vital step toward reducing the risks posed by future earthquakes.
The calculation of the pseudo-acceleration spectrum (PSA) for a seismic event in a densely urbanized area is crucial to assess the potential seismic demand on structures and guide the design of resilient buildings. PSA values provide a measure of the forces that structures would experience at different vibration periods, reflecting the dynamic interaction between ground motion and building response [15]. By focusing on pseudo-acceleration, engineers can estimate the equivalent static forces induced by an earthquake, which is essential to evaluate the demands on structural components, especially in mid- to high-rise buildings that dominate urban areas[16]. In high-density environments, accurate PSA spectra enable better risk assessments and facilitate the development of performance-based design frameworks that prioritize occupant safety and infrastructure resilience (FEMA, 2009). Additionally, PSA calculations are integral in updating seismic hazard maps and building codes, a process that involves revising and improving the standards and regulations governing the design, construction, and maintenance of buildings. These updates aim to incorporate the latest knowledge, technology, and practices to ensure structures are safe, durable, and resilient against hazards such as earthquakes, wind, and fire. By aligning urban planning and construction practices with the specific seismic risks of the area, this approach minimizes potential damage and reduces economic losses during seismic events. [17]
The function developed to compute the response spectrum of an acceleration time series utilizes the Duhamel integral 1, a classical technique to evaluate dynamic responses in linear systems. Given a time series of acceleration (data) sampled at a defined frequency (delta), the function calculates responses across a range of periods (T) in the presence of viscoelastic damping specified by the damping factor xi (in our application ). The response is evaluated for various spectrum types: acceleration (SA), pseudo-acceleration (PSA) as for our application, velocity (SV), pseudo-velocity (PSV), and displacement (SD). In each case, response coefficients are computed using matrix relations that incorporate the system’s dynamic response via damping, mass, and stiffness parameters, simulated through the AA and BB matrices. The system’s displacement and relative velocity evolution are computed iteratively, allowing for the derivation of the maximum response spectrum for each period. This approach enables accurate characterization of the system’s dynamic behavior, providing a comprehensive response spectrum for the selected response types [15]
The key Features of the Web-Based PGA System are:
- Real-time Data Operation:
- The system has access to continuous real-time seismic data from local and global networks. At the same time, by registering to the proper event detection message queue, the real computation is triggered only when a new earthquake with the proper attributes (area, magnitude threshold, level) has been detected.
- Automated PGA Calculation:
- The system uses pre-programmed models to quickly compute PGA values for any given earthquake, eliminating the need for manual calculations [1].
- Interactive Visualization:
- A web based user interface provides dynamic maps showing the spatial distribution of PGA values across the affected area [12], allowing the user to zoom and pan over his interest area.
- Availability:
- Being the system web-based, its results can be accessed by using any device with internet connectivity, making it a highly effective tool in both urban and remote areas.
- Rapid Emergency Response:
- By calculating PGA within minutes, the system allows disaster management teams to deploy resources to the most affected areas without delay [1].
- Risk Reduction for Secondary Hazards:
- Quick access to ground motion data can help in assessing risks of landslides, building collapses, and other secondary effects, enabling preemptive action [8].
- Infrastructure Damage Assessment:
- Engineers can use PGA data to assess the likely damage to critical infrastructure such as bridges, dams, and power plants, ensuring that preventive measures are taken to avoid further casualties [2].
5. How UrbanSM Works
UrbanSM is the tool developed at the Osservatorio Vesuviano (OV) to address the needs described earlier. It serves as a critical tool for real-time seismic monitoring and risk assessment, particularly in urban environments like the Campi Flegrei area. The tool allows the integration of seismic data from various monitoring stations to provide near real-time calculations of seismic parameters, such as Peak Ground Acceleration (PGA), facilitating rapid response in earthquake-affected areas. It is designed to enhance seismic risk management by delivering precise ground motion data for immediate analysis, complementing probabilistic seismic hazard assessments.
5.1. A Real-Time Platform for Seismic Data Analysis
To perform complex real-time analysis for Volcanic Monitoring and Surveillance, a scalable platform based on distributed message queues has been designed and developed at the Osservatorio Vesuviano [18]. The queue system is based on Apache Kafka [19] deployed on a three nodes cluster, which guarantees proper redundancy with low latency message delivery. Each message is labelled with a string named topic which classifies the content and permits proper delivery, and some metadata as additional attributes.
On this platform several worker modules cooperate, each of them by subscribing to one or more topic to consume messages from, and producing results as new messages published on other topics. Behind the scene the platform will create proper queues to ensure correct delivery and dispatching and to avoid message loss or duplication. In this way each worker is responsible only for its duty by implementing its own algorithm. All the complexities of interaction, communication and data format conversion between different workers are provided by the platform, and are completely hidden to the developer. As soon as a new message is published on a topic, all the workers that have subscribed on that topic are triggered and can consume it.
The workers are implemented as software containers2 independently developed by researchers and executed in a worker farm. The execution environment for the farm is based on Kubernetes [20] deployed on a eight nodes cluster that permits several workers to run concurrently by orchestrating them among the nodes, scaling them to fulfil requests and to guarantee low response times even for complex analyses.
All baseline code to interact with the message queue system and the farm has been developed in a library written in Python language, to hide all complexities to the workers’ developers.
In this direction UrbanSM has been developed as a worker hosted on the platform and in Figure 2 is shown its architecture and interactions.
5.2. UrbanSM Worker
The worker subscribes to a message queue on which seismic events are published. At each occurrence of an event with a magnitude duration exceeding a predefined threshold (currently set to 3.0 at the time of writing this document), the automated procedure of UrbanSM algorithm is triggered. This process initiates the analysis of the available accelerometric data, performing the following steps:
- Waveform download:
- The system retrieves the waveforms data of the accelerometric stations from the wave repository.
- Deconvolution:
- The waveforms are deconvolved using the parameters specified in their respective response files (metadata files containing station response details).
- Acceleration analysis:
- The deconvolved data are analyzed to extract the maximum acceleration values, computed both in terms of percentage of gravity () and meters per second squared ().
- Results production:
- All the results are produced as summary data, as table, graphs and and maps (by using a proper map service), and stored on a file system area synced with the web server. In addition, a new message with summary is produced and published on a queue, allowing its further processing as storing to time series databases or new and future cascading processing.
This automated analysis allows for real-time monitoring of seismic events, enabling faster assessment of ground motion and its potential impact.
The calculation procedure is initiated as soon as the event is declared and recorded in the GOSSIP database [21]. Typically less than five minutes are required to generate the shaking data tables, which contain detailed information about ground motion for further analysis and reporting. This process ensures a rapid and automated response, allowing timely availability of key seismic data for decision-making and risk assessment in the aftermath of a seismic event. The worker has been written in Python language and uses the ObsPy library [22].
5.3. Results
The final output of this tool is available in a web page, shown in Figure 3, summarizing the main information. On the left side, you can see a table with detailed information for each site, including the seismic station’s location, the epicentral distance and the corresponding PGA value, both in and .
Next to the seismic station code, for some stations, there is a link labeled PSA. This link is useful for viewing PSA spectra (Figure 4) for that specific seismic station. The link is not always available, depending on whether, at the time of analysis, the calculation could be performed or not or if the PGA value at that station is below .
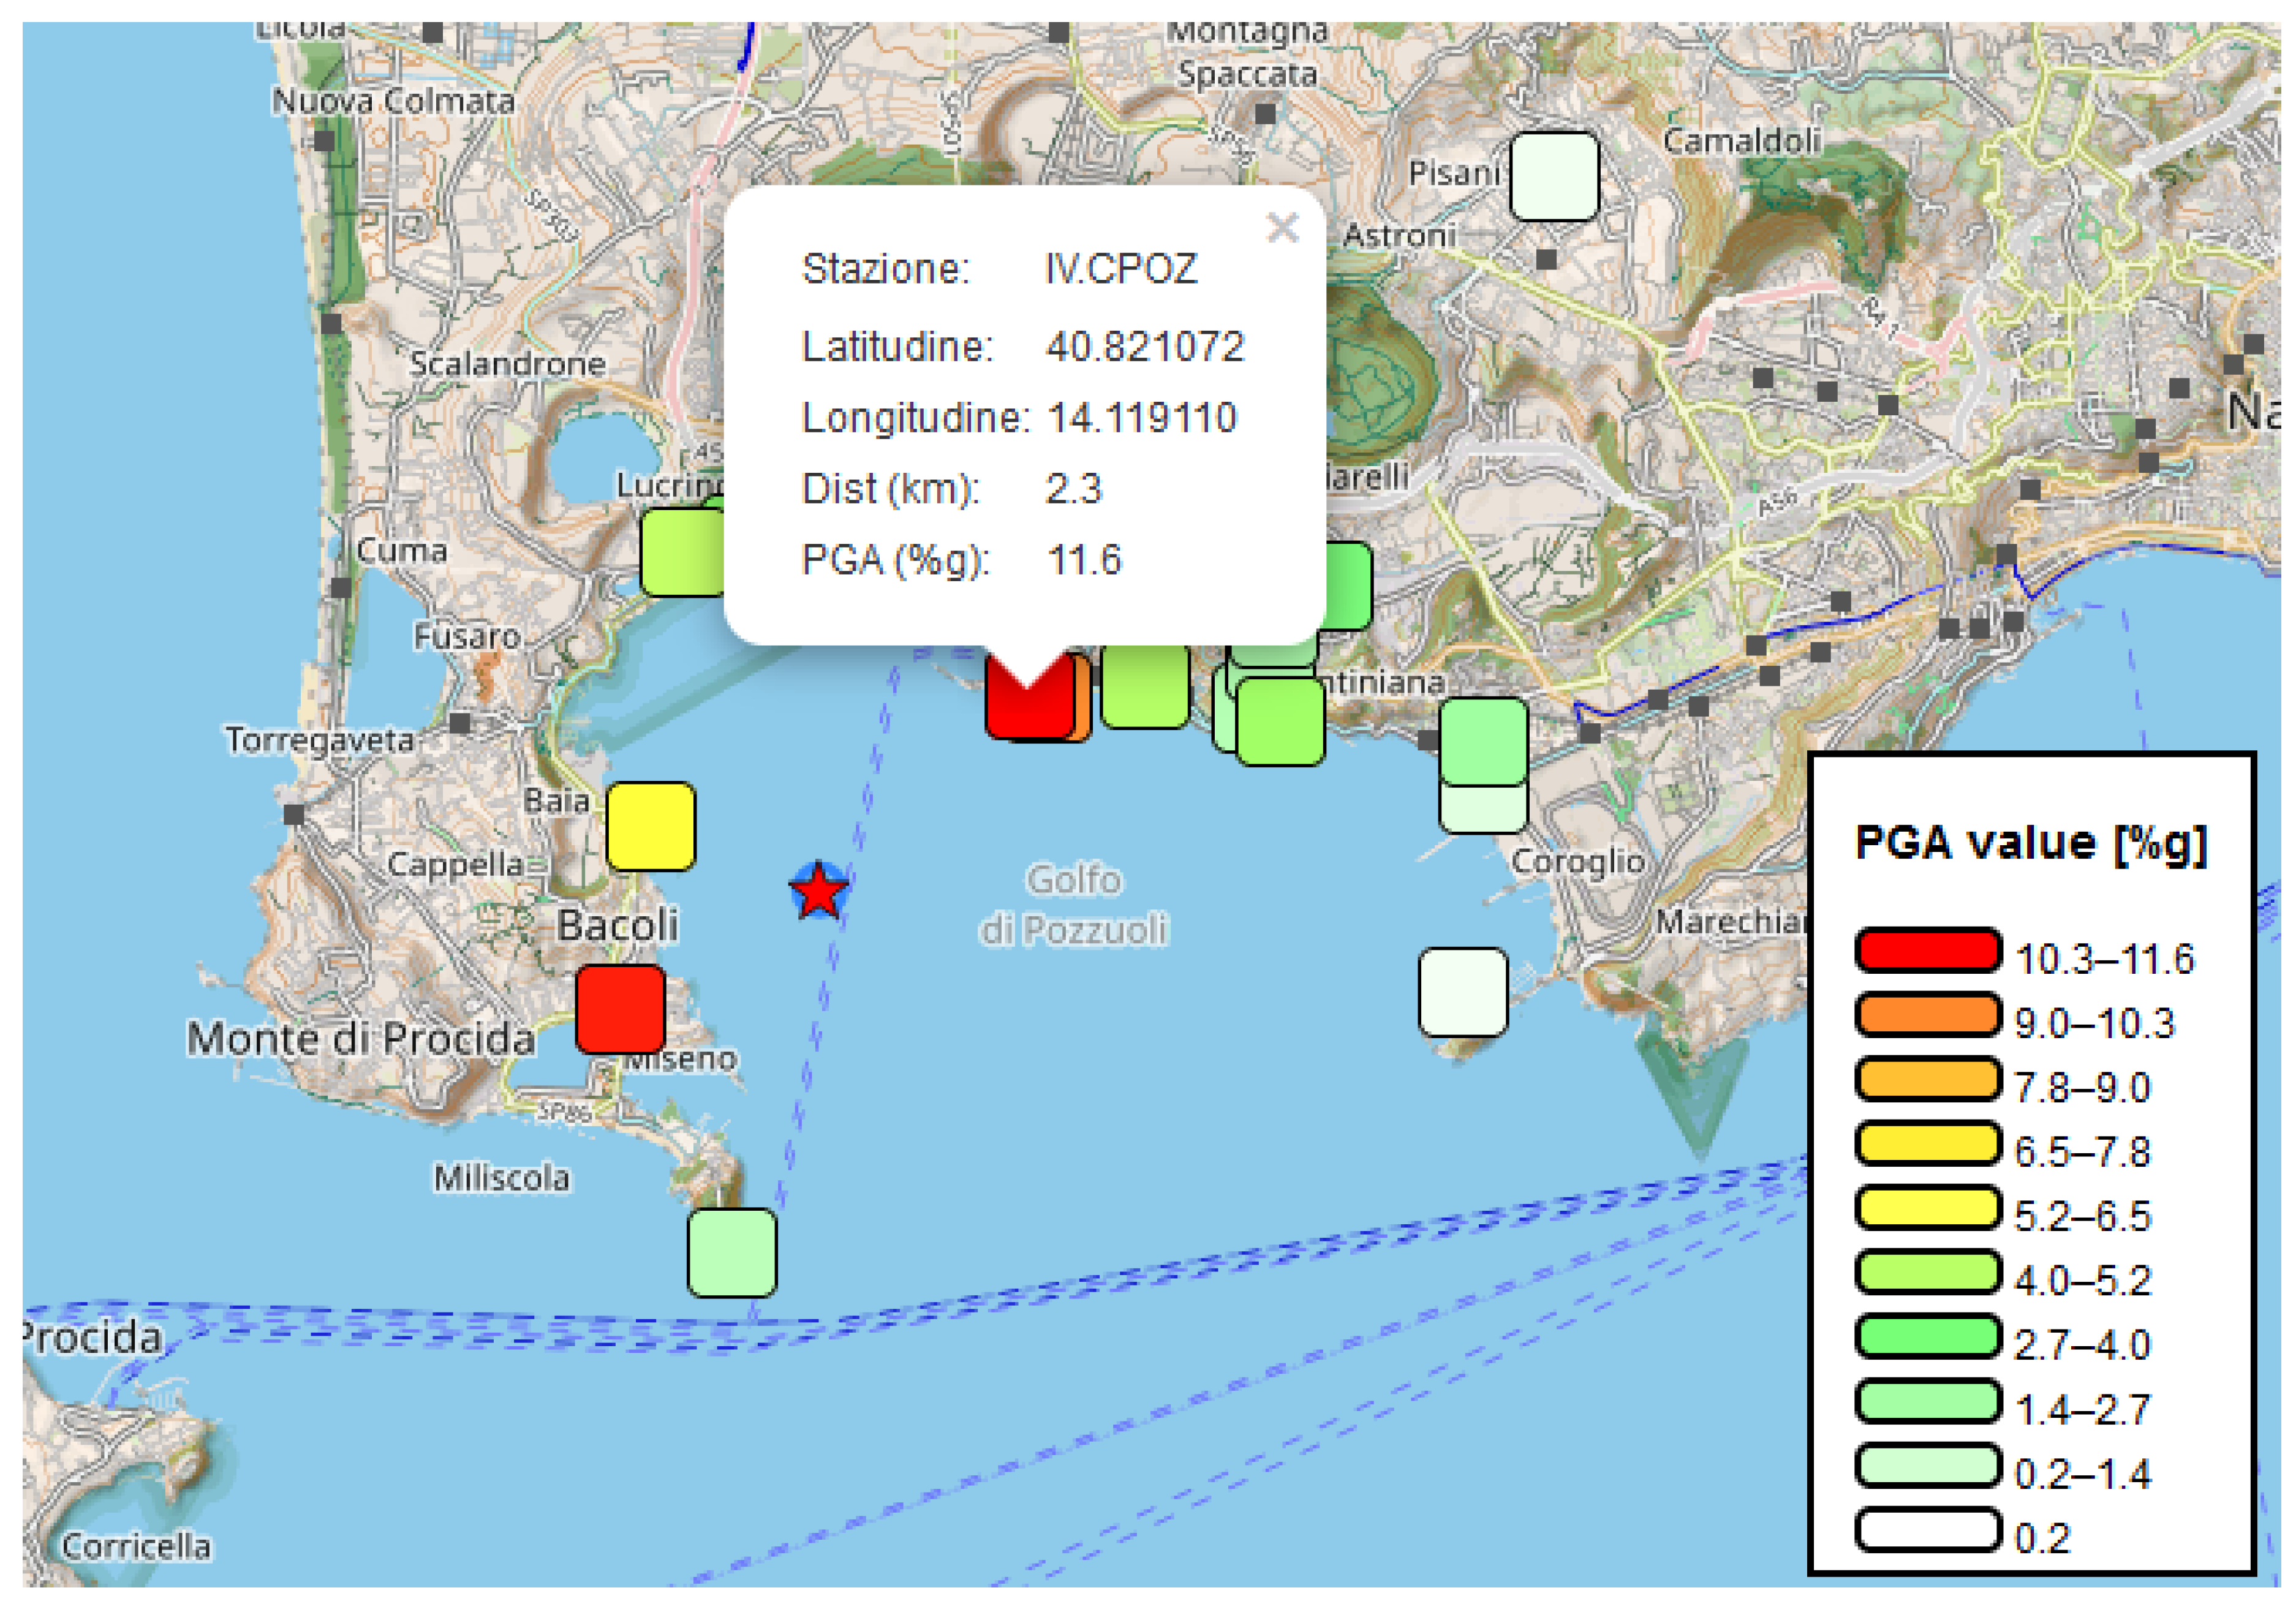
Above the table, the main information about the seismic event are summarized, along with a link to view the seismic traces (Z component only) analyzed in the study. On the right side of the page, a map of the area is displayed showing the locations of the available seismic stations, with markers colored according to PGA values and the corresponding legend.
The map displays seismic stations as markers across the region, with each marker providing detailed information about the station’s location, name, and recorded seismic data. A color-coded scale is used to represent the peak ground acceleration (PGA) measured at each station: colors transition from green for lower PGA values to yellow, orange, and red for higher intensities. This visual approach enables a quick assessment of ground motion severity, helping to identify areas most impacted by seismic activity. Users can click on individual markers to access specific station data and PGA values for detailed analysis.
Clicking on a station marker opens a popup with detailed information about that site.
6. UrbanSM vs ShakeMap©
Measuring PGA (Peak Ground Acceleration) values directly at target sites offers several advantages over deriving these values from Ground Motion Prediction Equations (GMPE).
- 1.
-
Direct Data and Accuracy
- Direct Measurements: PGA measurements provide real-time data on ground acceleration, capturing the actual seismic movement during an event. This approach is more accurate as it considers local conditions specific to the moment of the seismic event.
- Local Variability: GMPEs may provide estimates based on theoretical and historical models, but they cannot always capture the spatial and temporal variability of ground motion accurately. Direct measurements account for local factors such as geology, topography, and distance from the epicenter.
- 2.
-
Unique Environmental Conditions
- Geology and Topography: Target sites may have unique geological and topographical characteristics that significantly influence ground motion. Measuring PGA at specific locations provides data reflecting these unique conditions, whereas GMPEs rely on aggregated data from various sources and regions.
- Local Amplification: In some areas, soil response can amplify ground motion in unpredictable ways. Measuring PGA allows direct observation of these effects, while GMPEs may not adequately reflect such amplifications.
- 3.
-
Recognition of Event Specifics
- Rare Events: For rare or low-probability seismic events, GMPEs may not be well-calibrated for those levels of acceleration. Direct measurements provide critical data for better understanding how soils and structures behave in such scenarios.
- Dynamic Behavior: PGA measurements can also reveal the dynamic behavior of soil and structures during a seismic event, information that may not be included in GMPE models.
- 4.
-
Utility for Risk Assessment
- More Accurate Seismic Risk Assessment: Real PGA data can contribute to a more precise seismic risk assessment for buildings and infrastructure. This is crucial for planning and design, especially in highly vulnerable seismic areas.
- Real-Time Updates: In emergency situations, PGA measurements can provide real-time information that is essential for immediate decisions, such as evacuations or responses from rescue teams.
- 5.
-
Model Calibration
- Validation and Calibration of GMPEs: Direct measurements of PGA can be used to validate and calibrate GMPE models, thereby improving their accuracy for future seismic events.
- Database Updates: Measured data can be used to update seismic databases and improve predictive equations, making them more representative of local conditions.
7. Conclusions and Future Works direction
The development and implementation of web-based services to calculate PGA represent a significant advancement in earthquake risk management. Such systems offer a combination of speed, accuracy, and accessibility that is unmatched by traditional methods of seismic hazard assessment. By automating the process of PGA calculation and making it accessible through an intuitive interface, these services empower decision-makers to respond quickly and effectively in the aftermath of seismic events.
While GMPEs provide an important theoretical and historical basis for predicting PGA values, direct measurements at target sites offer a more accurate and contextual understanding of seismic impact. These direct data are essential for detailed comprehension and effective seismic risk management, particularly in vulnerable areas.
The system to analyse Peak Ground Acceleration (PGA) and Peak Spectral Acceleration (PSA), such as UrbanSM developed at the Osservatorio Vesuviano, plays a critical role in seismic monitoring and risk mitigation. It provides an integrated system for rapid analysis of seismic data, particularly following notable earthquake events. This system automates the entire process, significantly enhancing response times and accuracy.
When a seismic event occurs with a magnitude exceeding a predefined threshold (currently set at 3.0), the system automatically initiates the analysis of accelerometric data from various stations. This automation ensures that vital information is quickly available for emergency responses and decision-making processes.
One of the core strengths of the system lies in its ability to deconvolve raw seismic waveforms using station-specific parameters, derived from corresponding response files. This process enables accurate calibration of the data, making it reliable to assess ground motion. The system then analyses the maximum values of acceleration, providing results in terms of and meters per second squared . These measurements are crucial for understanding the impact of ground shaking on buildings and infrastructure.
Importantly, the results are not confined to just a basic evaluation of PGA but also include the calculation of Peak Spectral Acceleration (PSA). PSA is a vital metric to assess the dynamic response of structures, particularly under significant seismic events. By providing detailed information on how different frequencies of seismic waves affect structures, the system offers critical insights into potential structural vulnerabilities and performance during an earthquake. This data is particularly valuable for engineers and urban planners aiming to enhance seismic resilience.
In essence, the system offers a comprehensive tool that addresses the need for real-time data processing, reliable accelerometric analysis, and detailed seismic information. This ensures that after significant seismic events, the necessary information is rapidly made available to assess the shaking intensity and its potential impacts on the built environment, making it a vital component of seismic risk management.
AI algorithms can predict aftershock sequences, identify patterns in ground motion, and improve the accuracy of PGA estimations by analyzing vast datasets in real-time [23]. In our future works we will try to adopt AI techniques to extend and further improve urban shake map estimation.
Abbreviations
The following abbreviations are used in this manuscript:
| FEM | Finite Element Method |
| GMPE | Ground Motion Prediction Equations |
| PGA | Peak Ground Acceleration |
| PSA | Pseudo Spectral Acceleration |
| RAN | Italian National Accelorometric Network |
References
- Boore, D.M.; Joyner, W.B.; Fumal, T.E. Equations for Estimating Horizontal Response Spectra and Peak Acceleration from Western North American Earthquakes: A Summary of Recent Work. Seismological Research Letters 1997, 68, 128–153. [CrossRef]
- McGuire, R.K. Seismic hazard and risk analysis; Engineering monographs on miscellaneous earthquake engineering topics, Earthquake Engineering Research Institute, 2004.
- Giardini, D.; Grünthal, G.; Shedlock, K.; Zhang, P. The GSHAP global seismic hazard map. In International geophysics; Elsevier, 2003; Vol. 81, pp. 1233–1239.
- Keefer, D.K. Landslides caused by earthquakes. Geological Society of America Bulletin 1984, 95, 406–421.
- Kanamori, H.; Allen, R.M.; Dmowska, R. Earthquake early warning and rapid response. Bulletin of the Seismological Society of America, 93(4) 2003, pp. 1855–1865.
- Douglas, J. Earthquake ground motion estimation using strong-motion records: a review of equations for the estimation of peak ground acceleration and response spectral ordinates. Earth-Science Reviews 2003, 61, 43–104.
- Cornell, C.A. Engineering seismic risk analysis. Bulletin of the seismological society of America 1968, 58, 1583–1606.
- Wald, D.J.; Quitoriano, V.; Heaton, T.H.; Kanamori, H. Relationships between peak ground acceleration, peak ground velocity, and modified Mercalli intensity in California. Earthquake spectra 1999, 15, 557–564.
- Bommer, J.J.; Abrahamson, N.A. Why do modern probabilistic seismic-hazard analyses often lead to increased hazard estimates? Bulletin of the Seismological Society of America 2006, 96, 1967–1977.
- Patanè, D.; Tusa, G.; Yang, W.; Astuti, A.; Colino, A.; Costanza, A.; D’Anna, G.; Di Prima, S.; Fertitta, G.; Mangiagli, S.; et al. The urban seismic observatory of Catania (Italy): a real-time seismic monitoring at urban scale. Remote Sensing 2022, 14, 2583.
- Del Gaudio, C.; Fabbrocino, S.; Pollino, M. Influence of ground motion duration on the seismic performance of structures. Engineering Structures 2014, 72, 199–213.
- Worden, C.; Wald, D.; Allen, T.; Lin, K.; Garcia, D.; Cua, G. A revised ground-motion and intensity interpolation scheme for ShakeMap. Bulletin of the Seismological Society of America 2010, 100, 3083–3096.
- Bray, J.D.; Rodriguez-Marek, A. Characterization of forward-directivity ground motions in the near-fault region. Soil dynamics and earthquake engineering 2004, 24, 815–828.
- Kramer, S.L. Geotechnical Earthquake Engineering. Prentice-Hall, Inc, 1996.
- Chopra, A. Dynamics of Structures: Theory and Applications to Earthquake Engineering.; 4th Edition. Prentice Hall, 2012.
- Boore, D.; Joyner, W.; Fumal, T. Equations for Estimating Horizontal Response Spectra and Peak Acceleration from Western North American Earthquakes: A Summary of Recent Work. Earthquake Spectra, 22(4), 129–146 2006.
- Cornell, C.A. Engineering Seismic Risk Analysis. Bulletin of the Seismological Society of America, 58(5), 1583–1606 1997.
- Cantiello, P.; Peluso, R.; Di Filippo, A.; De Cesare, W. A scalable platform for real time multiparametric volcanoes monitoring. ESC2024-S11-815, 39th General Assembly of the European Seismological Commission, 2024.
- Apache Software Foundation. Apache Kafka project web page, 2013.
- The Kubernetes Authors. Kubernetes: an open source system for automating deployment, scaling, and management of containerized applications, 2014.
- Ricciolino, P.; Lo Bascio, D.; Esposito, R. GOSSIP - Database sismologico Pubblico INGV-Osservatorio Vesuviano. Istituto Nazionale di Geofisica e Vulcanologia (INGV), 2024. [CrossRef]
- Beyreuther, M.; Barsch, R.; Krischer, L.; Megies, T.; Behr, Y.; Wassermann, J. ObsPy: A Python Toolbox for Seismology. Seismological Research Letters 2010, 81, 530–533. [CrossRef]
- DeVries, P.M.; Viégas, F.; Wattenberg, M.; Meade, B.J. Deep learning of aftershock patterns following large earthquakes. Nature 2018, 560, 632–634.
| 1 | Duhamel’s integral for response of linear systems: https://en.wikipedia.org/wiki/Duhamel’s_integral
|
| 2 | Software containerization: https://en.wikipedia.org/wiki/Containerization_(computing)
|
Figure 1.
The red triangles represent the INGV-OV seismic stations of the permanent seismic network, the blue triangles indicate the RAN accelerometers, and the yellow ones represent the accelerometers temporarily installed by INGV, which integrate the seismic network with proprietary dataloggers and high-quality MEMS accelerometers.
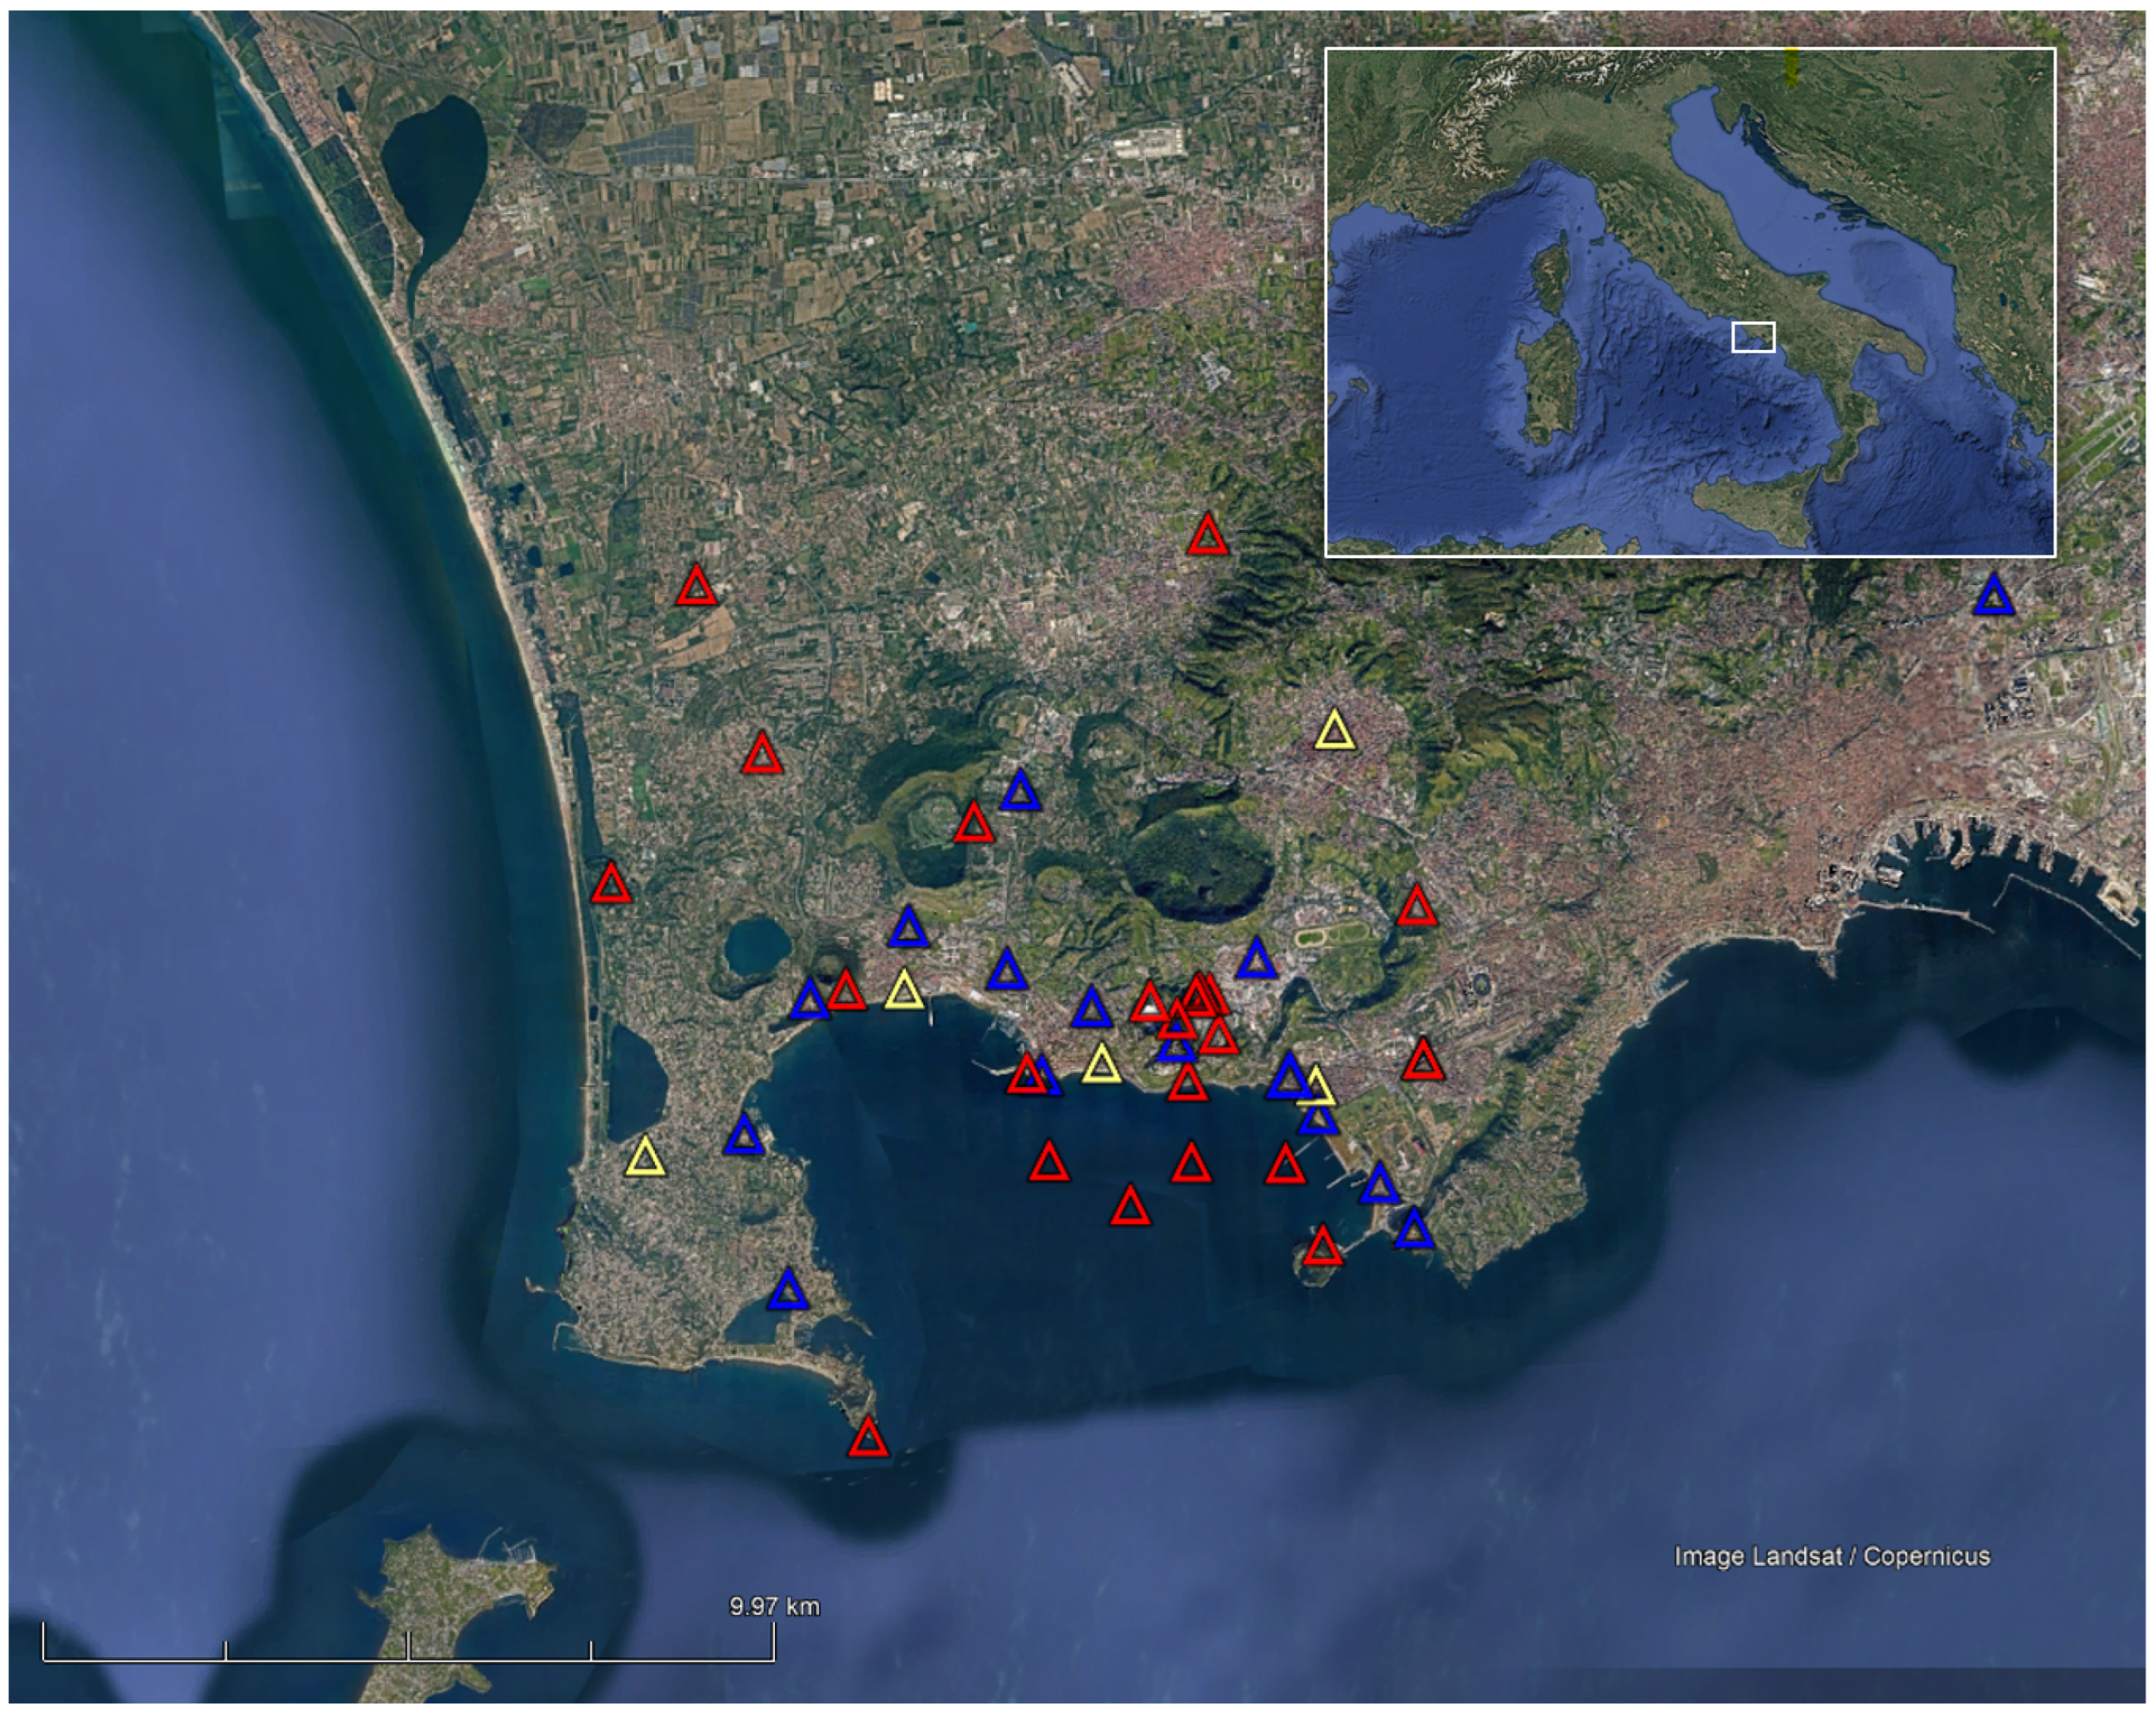
Figure 2.
Architecture of UrbanSM.
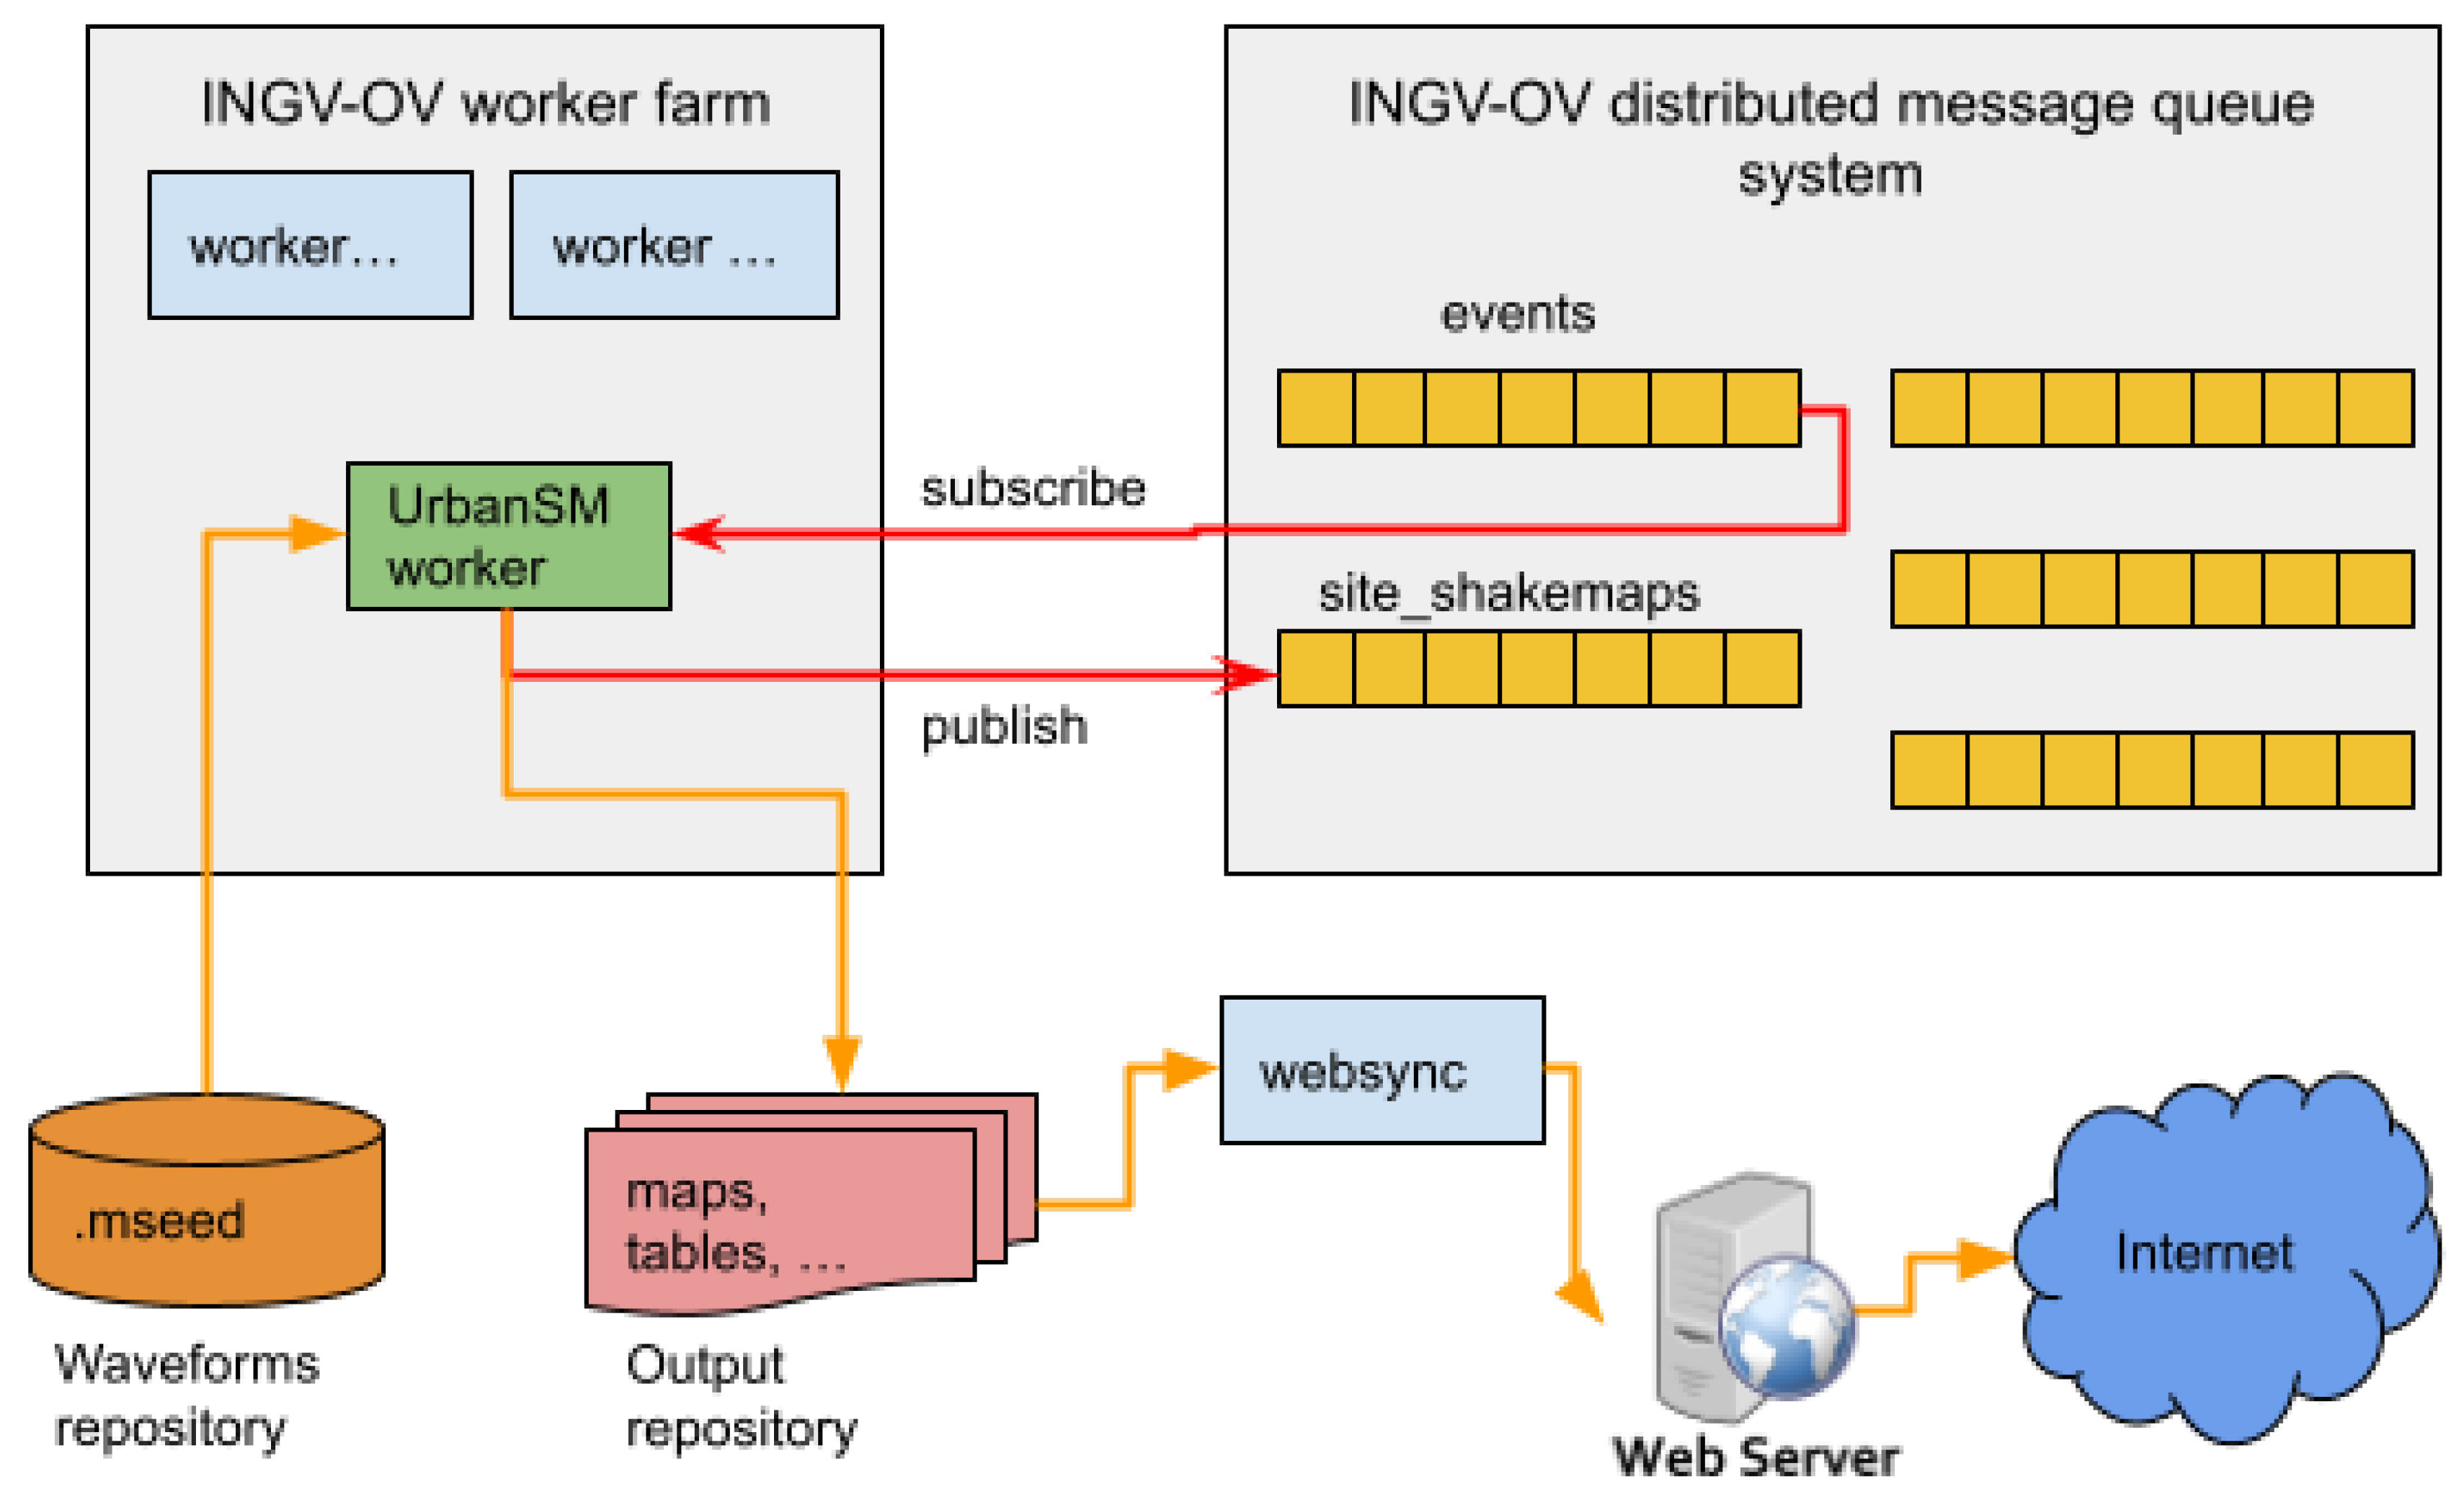
Figure 3.
Main page of UrbanSM. The page is also available on mobile devices with a smimpler interface
Figure 3.
Main page of UrbanSM. The page is also available on mobile devices with a smimpler interface
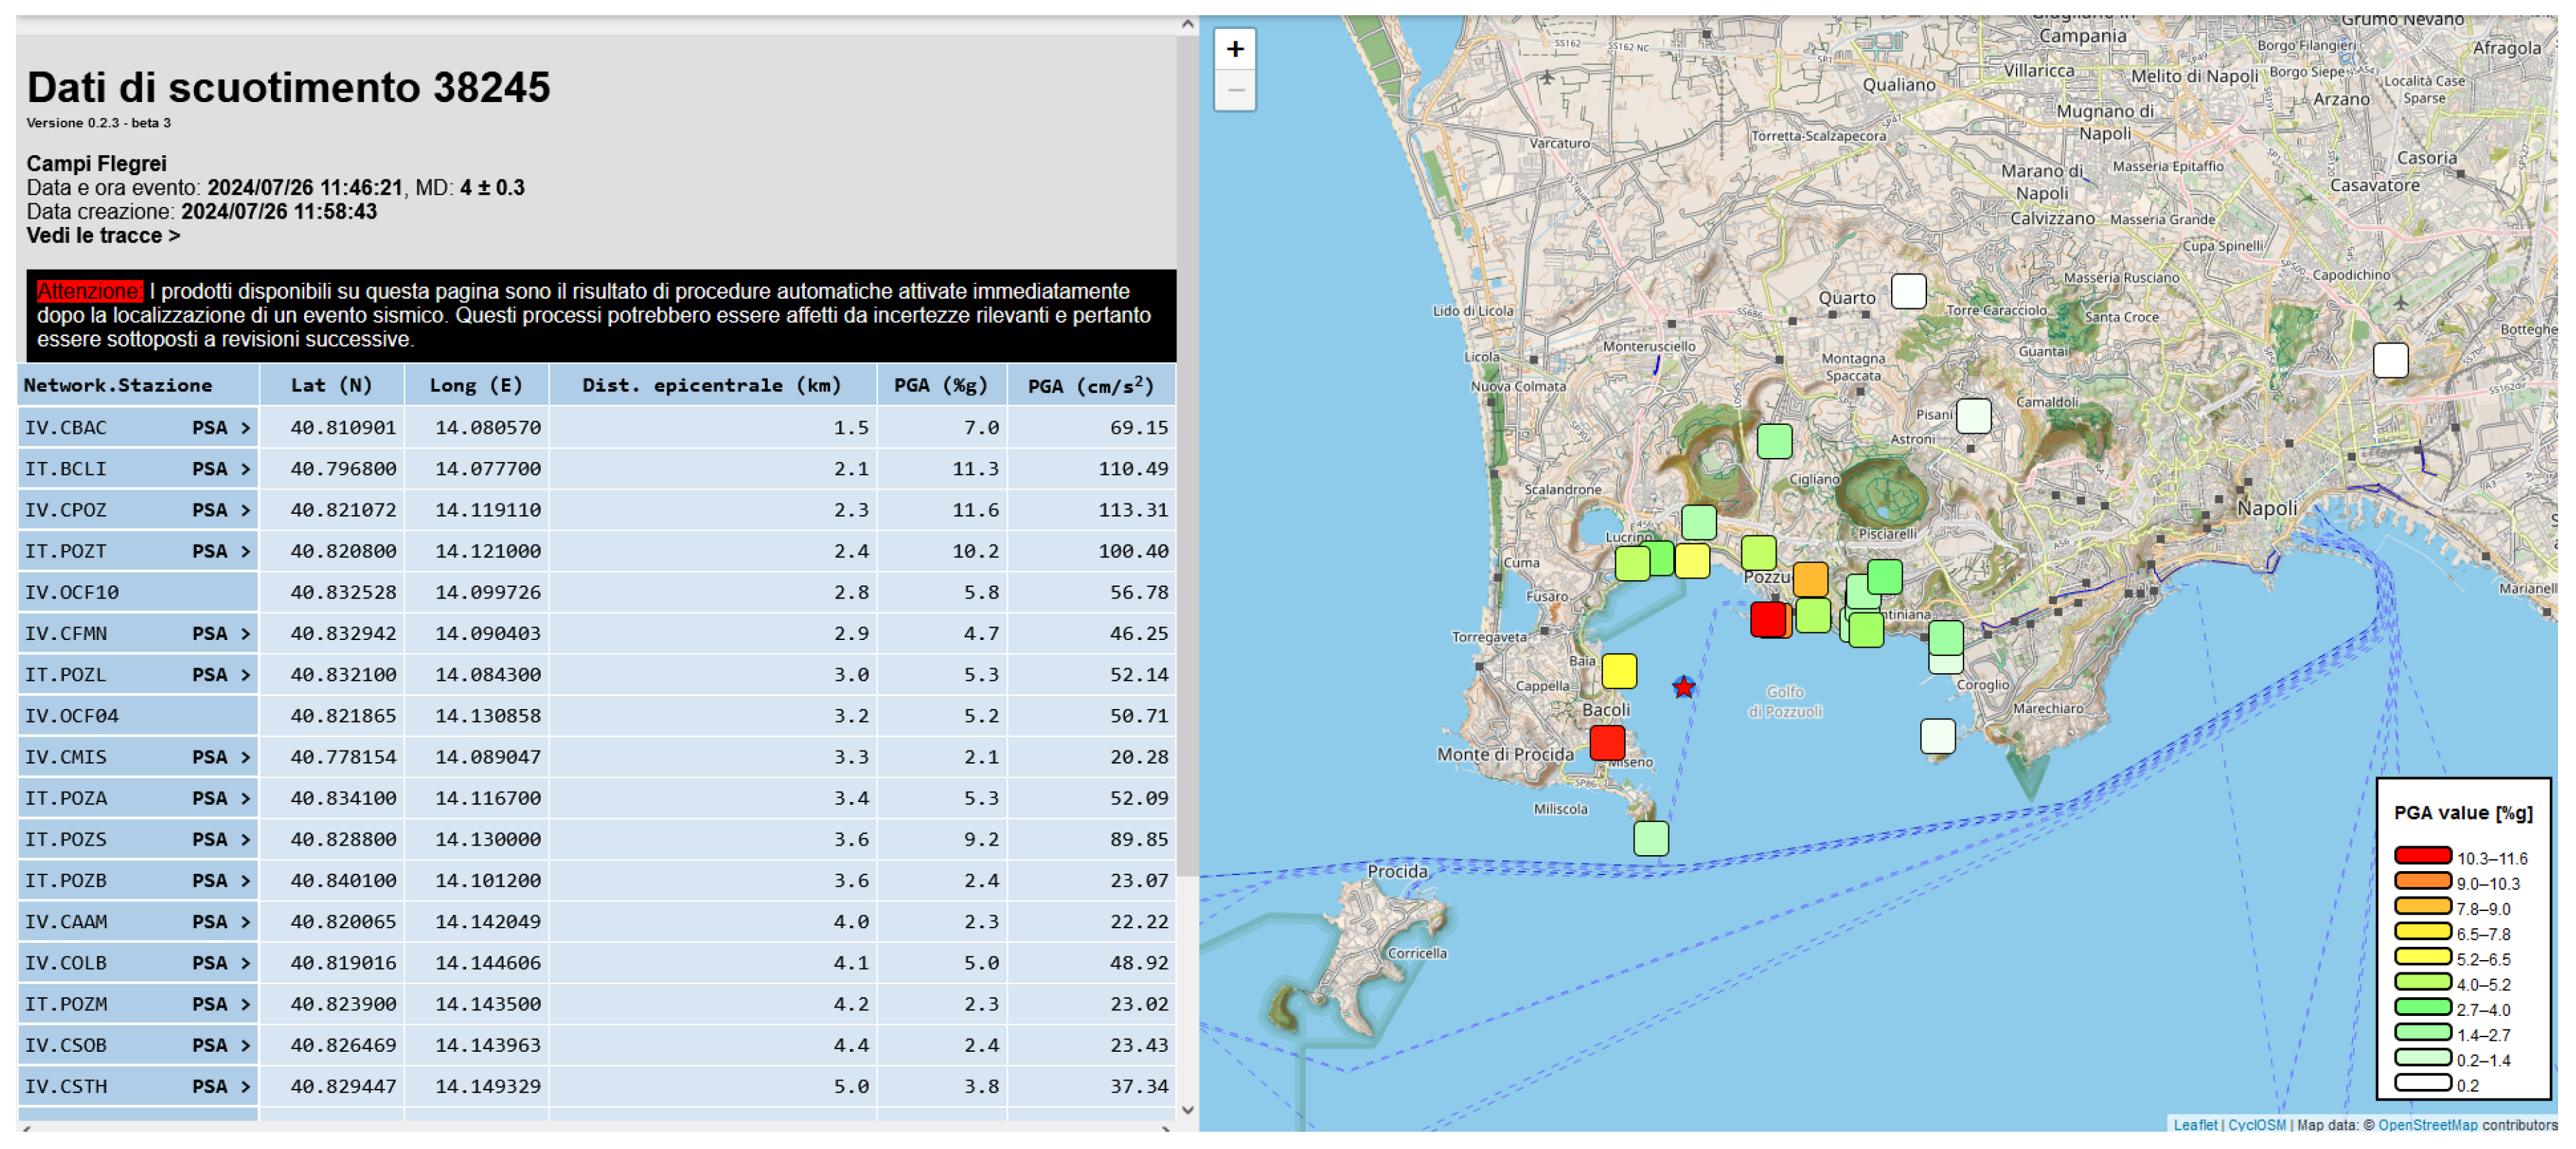
Figure 4.
Example of Pseudo Spectral Acceleration for POZA Site.
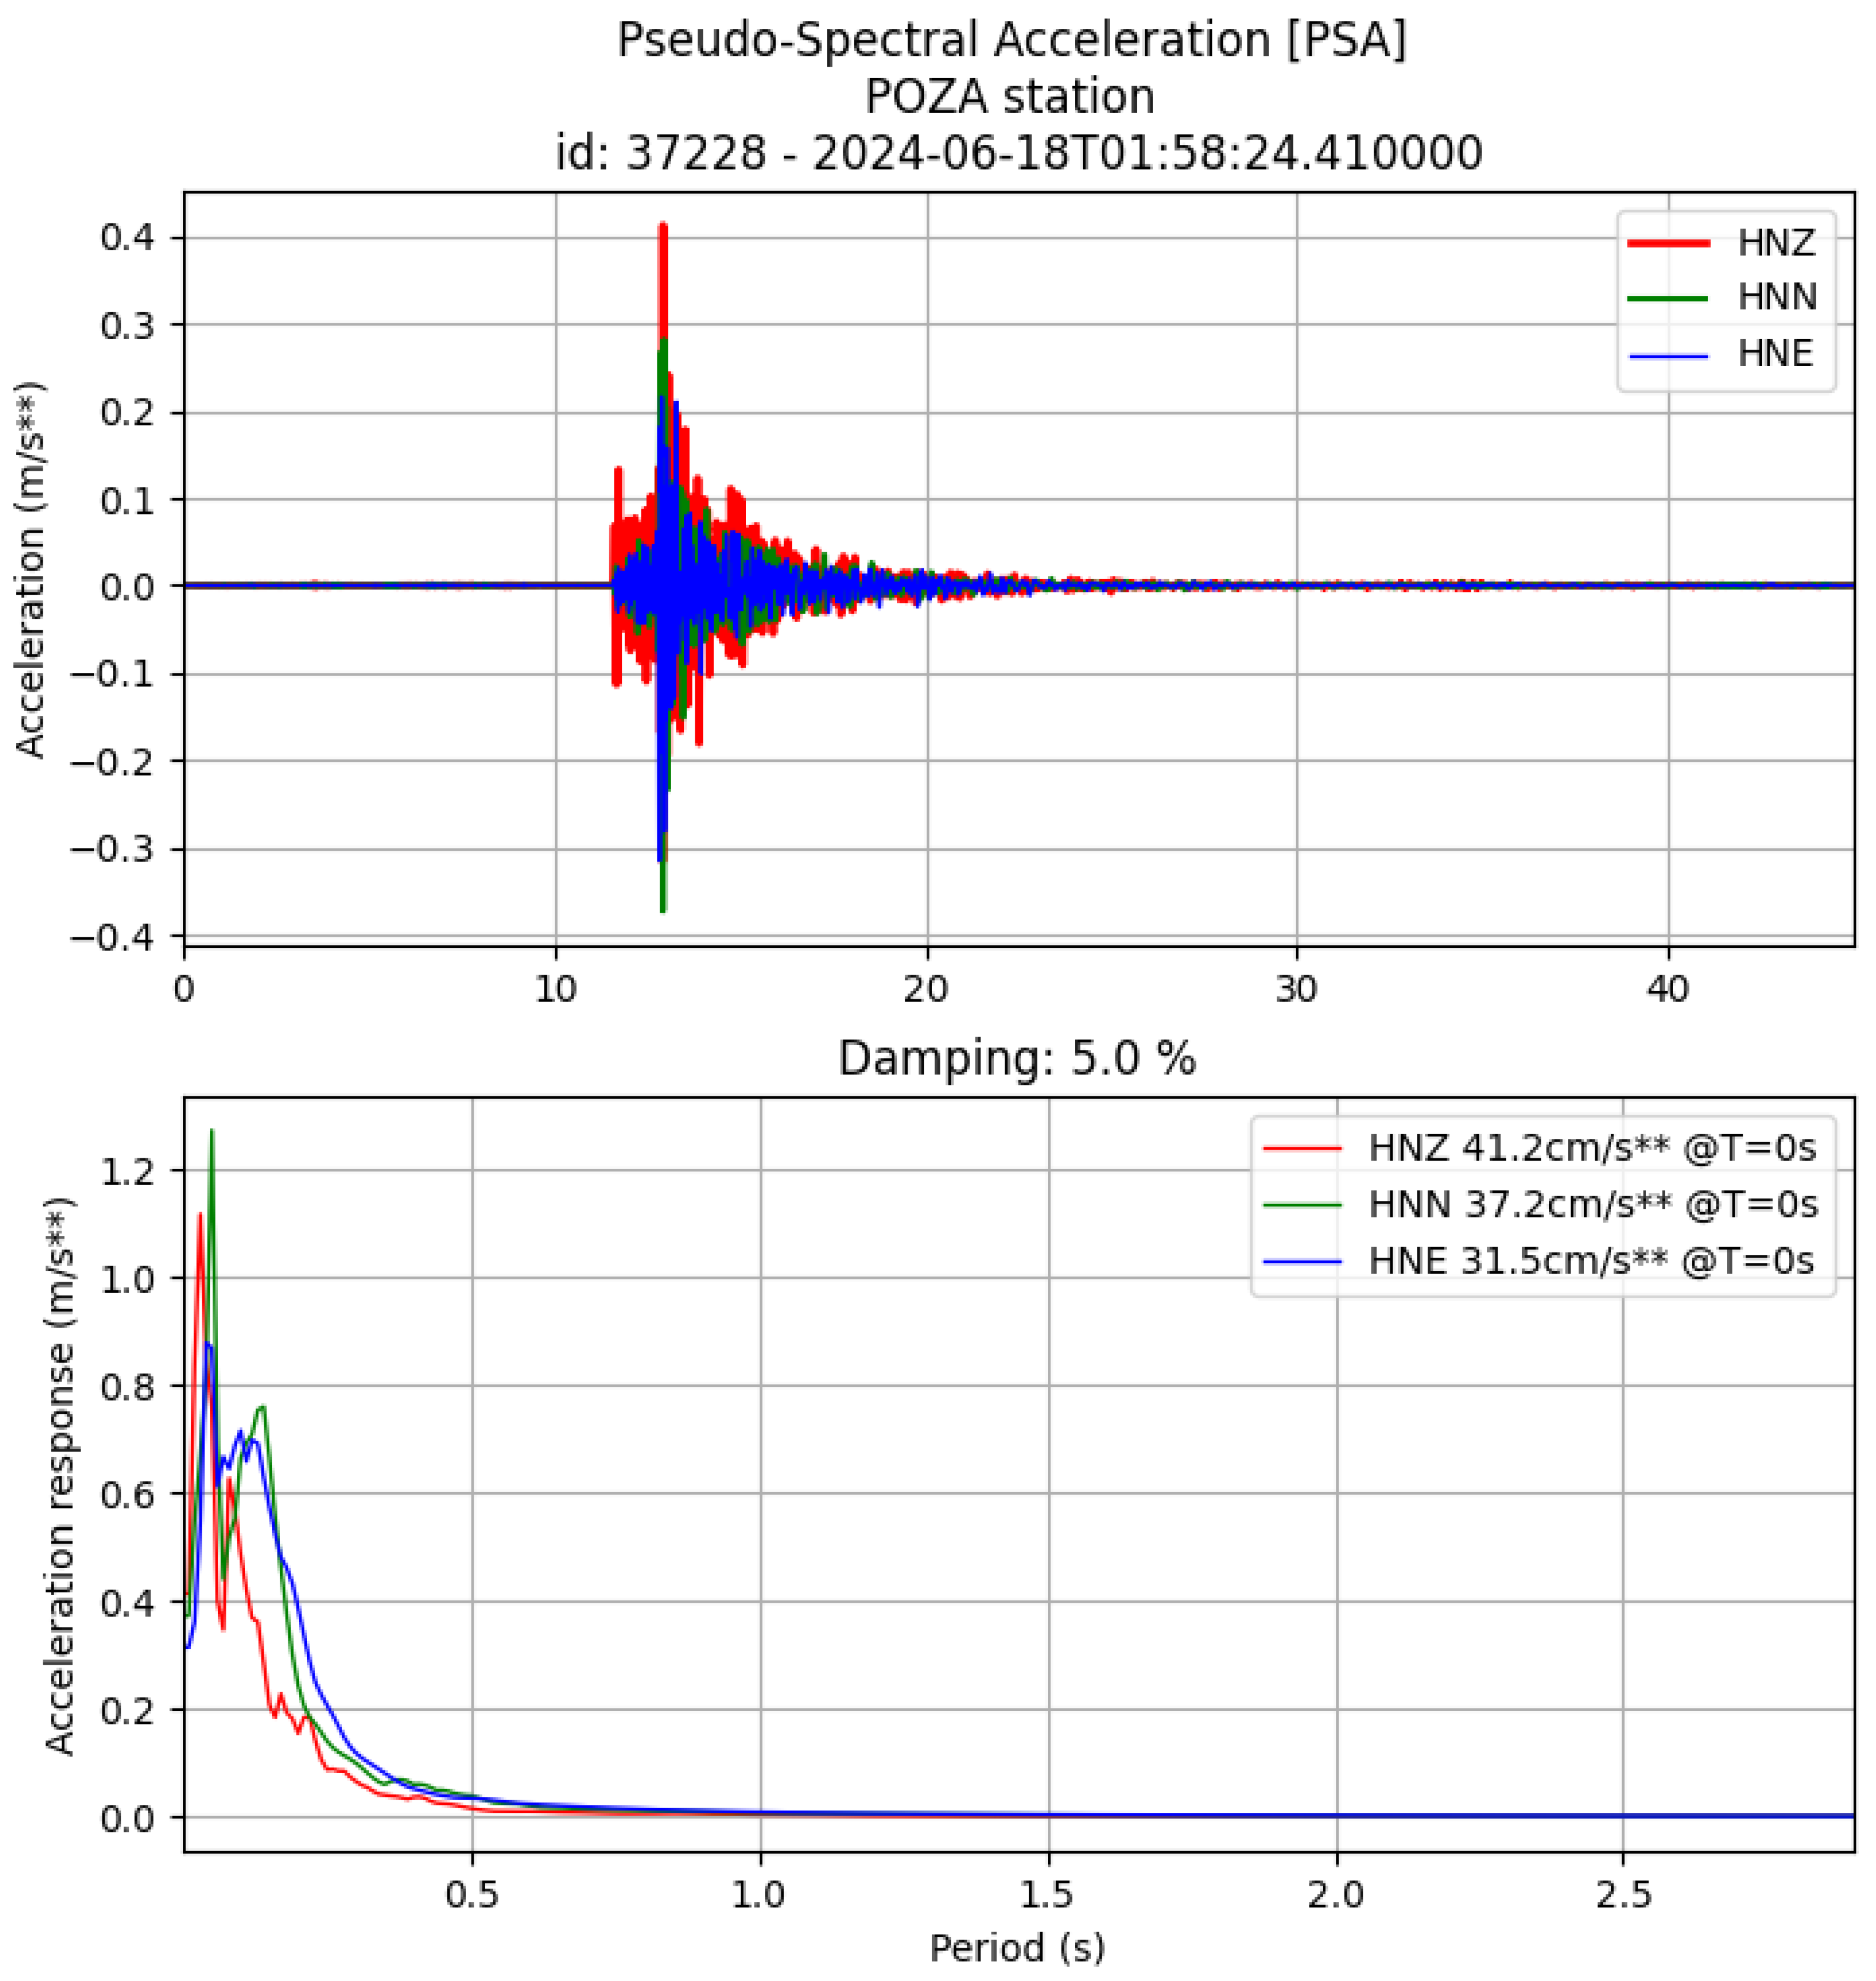
Figure 5.
Popup to show information about a single seismic station
Disclaimer/Publisher’s Note: The statements, opinions and data contained in all publications are solely those of the individual author(s) and contributor(s) and not of MDPI and/or the editor(s). MDPI and/or the editor(s) disclaim responsibility for any injury to people or property resulting from any ideas, methods, instructions or products referred to in the content. |
© 2024 by the authors. Licensee MDPI, Basel, Switzerland. This article is an open access article distributed under the terms and conditions of the Creative Commons Attribution (CC BY) license (https://creativecommons.org/licenses/by/4.0/).
Copyright: This open access article is published under a Creative Commons CC BY 4.0 license, which permit the free download, distribution, and reuse, provided that the author and preprint are cited in any reuse.


