
Submitted:
13 August 2025
Posted:
14 August 2025
You are already at the latest version
Abstract
The paper presents the main features of a Web-GIS platform able to compute real-time scenario-based seismic risk assessment at national level. The platform, based on the Italian experience, has been designed to enable DRM scientist and policy makers to readily produce seismic scenarios to support the entire DRM cycle, including training, emergency planning, calibrating emergency operations in the response phase, and providing seismic risk estimates for National Disaster Risk Assessment or Seismic Risk reduction programs. The platform is immediately operational, using preloaded freeware datasets on exposure and vulnerability, and requiring only basic earthquake parameters to perform real-time analysis. At a later stage, the preloaded datasets may be replaced with more detailed and accurate data at the national level. The platform generates earthquake impact assessments, including physical damage, economic and human losses to exposed assets, and key indicators for emergency response, such as estimated number of displaced people, required tent camps, EMT and USAR needs. The platform's key innovation lies in its ability to operate at the national scale, offering immediate usability and possibility of further customization. It is a web-based service and features a user-friendly graphical interface, making it especially effective for use by civil protection and DRM experts.
Keywords:
Web-GIS platform
; seismic risk
; scenario damage
; emergency response
1. Introduction
Real-time seismic scenario simulation refers to automated systems for a rapid estimation of the likely impacts of an earthquake based on earthquake source parameters. This process integrates ground motion predictions and shaking maps with geospatial information on exposure (e.g., buildings, population, infrastructure) and vulnerability, to produce estimates of potential damage and human losses [1,2,3]. The resulting scenario is not intended as a forecast of future events, but rather as a rapid approximation of the consequences of a specific earthquake that has just occurred or may occur.
These simulations are increasingly recognized as valuable tools in seismic disaster risk management (DRM). In the immediate aftermath of an earthquake, real-time scenarios provide civil protection authorities, emergency responders, and government institutions with timely information to guide rapid decision-making [4]. When information from ground is missing, they support initial situation assessments, help prioritize response efforts and facilitate the activation of emergency protocols and international assistance mechanisms. When integrated with early warning systems or national emergency management platforms, they can also assist in public communication and risk communication strategies [5].
Beyond the response phase, real-time seismic simulation contributes to preparedness and planning. By enabling the development and testing of plausible earthquake scenarios in advance, these tools allow authorities to assess vulnerabilities in critical systems, identify gaps in capacity, and design more effective contingency plans [6]. They can also inform mitigation investments by highlighting high-risk areas and estimating the benefits of land-use changes [7] or retrofitting and recovery planning [8]. Moreover, real-time simulations provide realistic scenarios that are valuable for training and exercising [9], helping stakeholders practice decision-making and coordination in conditions that closely mimic actual emergencies [10].
The effectiveness of real-time seismic simulation depends on several factors, including the robustness of the ground motion models [11], the quality and resolution of the exposure and vulnerability data [12], and the speed of data processing [13]
Recent advances, such as sensor networks integrated into data platforms [14], the incorporation of ShakeMaps [15] and remote sensing imagery [16], and the use of Bayesian approaches to update estimates [17], combined with open-source computational tools [18], have significantly improved the speed and accuracy of seismic impact simulations where real-time data are available. While integration enhances performance in data-rich contexts, the applicability of these simulations in data-scarce regions is increasingly supported by alternative data sources and modeling approaches [19].
Over the past two decades, numerous tools and platforms have been developed to support rapid or real-time seismic risk assessment. These vary widely in geographic coverage, methodological approach, required input data, and their interoperability or integration with DRM systems. For example, [20] selected five software packages and compared their results for the city of Istanbul, identifying key challenges such as model calibration and the alignment of building typologies across different packages.
A more systematic overview of key tools was presented in [21,22]. Specifically, [21] identified a list of 50 tools for rapid earthquake impact assessment and reviewed 15 of them in detail, while [22] offered a separate review of 13 tools.
In 2017, the European Commission’s Joint Research Centre (JRC) organized the Seismic Risk Assessment Tools Workshop [23], which provided a comparative analysis of multiple platforms and their operational applications. The workshop brought together developers, researchers, and national civil protection authorities, during which eight tools were discussed and compared.
In the following sections, only the five most relevant tools for the purposes of this paper are summarized.
Among the most recognized tools is Hazus [24], developed by FEMA in the United States which estimates physical damage, economic loss, and social impacts (functional losses and exposure to induced hazards) from earthquakes, as well as floods and hurricanes. The tool provides a wide range of information, including: costs for repair and replacement of assets (damaged buildings and transportation and utility system components), loss of business revenue, relocation costs, casualties, household displacements, quantity of debris, loss of function and restoration times for essential facilities, exposed population and building value due to potential fire following earthquake. Though primarily designed for the U.S. context, Hazus has been adapted for use in other countries.
CAPRA (Central America Probabilistic Risk Assessment) [25], is a modular, multi-hazard, open source, platform developed for Latin America that supports both deterministic and probabilistic risk assessments. It emphasizes flexibility, allowing users to select different taxonomies (e.g., GAR15 hazard, exposure, and vulnerability files), and transparency, as exposure, hazard, and vulnerability are represented within the same methodological framework, regardless of the hazard type. It can be used for high resolution (element by element) risk assessments at urban level as well as for coarse-grain national assessments. The output includes uncertainty estimates. It has been used by several governments and development agencies in DRM planning.
AFAD-RED [26] is the national operation tool developed by AFAD, the Turkish Disaster and Emergency Management Authority, for rapid damage estimation specifically tailored to the Turkish building stock and seismic hazard environment. It provides immediate estimates of building damage, casualties following an earthquake, impact on lifelines and economic losses. The assessment is done in three consecutive stages, with increasing level of accuracy as more data are received. The system integrates data from Turkey’s National Seismological Monitoring Network and National Strong-Motion Network.
OpenQuake [18], developed by the Global Earthquake Model (GEM) Foundation, is an open-source multi-purpose tool entirely written in Python. The software comprises a suite of calculators capable of computing human and economic losses for a portfolio of assets, either based on a specific scenario event or by considering the probability of all possible events occurring within a region over a defined time span. Logic trees are used to model epistemic uncertainty and spatial correlation of ground-motion is accounted for.
SELENA (SEismic Loss EstimatioN using a logic tree Approach) [27] is an open-source, self-contained MATLAB-based platform that estimates structural damage, economic losses, human loss, debris and shelter needs using the capacity-spectrum method. It supports deterministic, probabilistic, and near-real-time scenarios, employing a logic-tree framework to manage input uncertainties. SELENA provides high versatility, allowing users to select their ground-motion prediction equations, earthquake demand spectra, and to decide whether to account for site and/or topographic amplification effects.
The comparative analysis conducted during the Seismic Risk Assessment Tools Workshop [23] revealed some common patterns across these tools. Generally, human casualties tend to be overestimated, while the order of magnitude of economic costs is reliably predicted. The time required to generate outcome reports ranged from 5 to 15 minutes. However, ease of use and the level of necessary training or expert involvement varied considerably among tools, indicating that efforts to develop more intuitive input methods and user-friendly interfaces would be beneficial. The Workshop concluded that there is a strong demand for tools that are easier to use, more automated, and equipped with ready-to-use datasets and default options capable of producing results with minimal effort, even if those results are of low resolution and relatively high uncertainty. Ever-increasing accuracy and highly detailed loss categories are not necessarily a priority for national authorities, particularly in the context of real-time, early impact assessment. In such situations, a coarse estimate of predicted losses is often sufficient, as increasing model detail does not necessarily improve decision-making when the associated uncertainties are of the same order of magnitude as the outputs.
These findings are in line with the Authors’ assessment: few tools are designed to be user-friendly for a broad range of stakeholders, including Civil Protection, DRM authorities, planners, and decision-makers, thus limiting their usefulness beyond the research community. The Authors also noticed that most tools require extensive data preparation and system configuration, often spanning several years, before they become operational. Only a limited number is ready for immediate use following an event without the prolonged setup. And only a few are capable of operating at the national scale to rapidly assessing the impact of earthquakes occurring within or near a country’s borders.
This highlights a critical gap between current technological capabilities and the practical needs of emergency management. There is a clear demand for real-time simulation tools that are scalable, interoperable with response protocols, rapidly deployable, and intuitive for non-technical users.
2. Concept, Innovation, and Features of the SEIS-MEC Simulator
During 2018-21, the EU-funded the “Prevention, Preparedness and Response to natural and man-made Disasters South, Phase III” (PPRDSouth III) program as a Euro-Mediterranean initiative to increase resilience and reduce the social, economic and environmental costs of natural and man-made disasters in the EU Southern Neighborhoods. Component 1, led by the Italian Civil Protection Department, aimed to build national risk assessment capacity among Mediterranean Beneficiary Countries and develop a regional risk map to guide risk reduction strategies.
During the first PPRD South III Steering Committee Meeting and following discussions, Beneficiary Countries expressed a clear need and strong interest in a ready-to-use software tool to support the assessment of potential earthquake consequences, to be utilized by civil protection authorities, risk management planners and the scientific sector. In response, and as part of project sub-result 1.1: “Risk assessment and mapping capacities are enhanced at both national and regional levels”, a Web-GIS platform was designed and developed. This platform aims to enable real-time assessment of seismic scenarios and to address several of the critical limitations identified in existing tools.
Since the early 1990s, the Italian Civil Protection Department had already developed such a tool for the entire national territory [28]. The software, named SIGE (Sistema Informativo Geografico per l’Emergenza, which translate in Emergency Geographic Information System), integrates various data sources, including earthquake parameters from the National Institute of Geophysics and Volcanology, to produce damage scenarios and loss estimations (scenario-based risk assessment). The most recent evolution of this system is called ESPAS (Earthquake Scenario Probabilistic Assessment), which addresses two key challenges: (a) quantifying the uncertainty of the many parameters and variables involved in scenario analyses, and (b) progressively updating initial post-event loss estimates by incorporating observed earthquake effects (e.g., macroseismic intensities, peak ground accelerations, number of collapsed buildings), to improve accuracy as more data become available over time [29].
Since 2009, the EUCENTRE Foundation has developed numerous tools for the Italian Civil Protection Department within a Web-GIS platform designed for seismic risk assessment and the real-time generation of damage scenarios in the event of an earthquake [30]. Initially, the platform focused exclusively on residential buildings. Over time, it has been significantly expanded and now comprises five specialized modules within the Web-GIS platform, named EUCLIDE (EUCentre for Loss-Impact and Damage Evaluation). These modules address the following asset categories: residential buildings, schools, hospitals, transportation infrastructure (e.g., bridges, tunnels, retaining walls, ports, and airports), and industrial facilities. All databases integrated into the platform are developed at the national scale. Seismic hazard, exposure, and vulnerability data, along with outputs related to seismic risk and damage scenarios, are presented through both interactive maps and tabular formats. Time-based seismic risk assessments are pre-calculated and pre-loaded in the system, corresponding to events characterized by specified probabilities of occurrence (return periods) and fixed time windows. Additionally, users can perform near real-time scenario-based seismic risk assessment using two available methods. The first method uses the earthquake source parameters of a real or hypothetical event, together with Ground Motion Models (GMMs) to estimate seismic input at the asset level. The second enables users to directly input ground shaking maps (i.e., ShakeMaps) to conduct the analysis [31].
Building on such extensive experience, the EUCENTRE Foundation and the Italian Civil Protection Department, developed an innovative Web-GIS platform called SEIS-MEC (SEIsmic riSk in MEditerranean Countries) for real-time earthquake impact assessment.
SEIS-MEC embodies a new generation of seismic impact simulators by combining broad-scale analysis capability with user-centred design and operational flexibility. Unlike many existing tools that require complex geographic information system (GIS) desktop environments, SEIS-MEC operates as a stand-alone web-based service. This approach simplifies deployment and ensures immediate operability by any country, reducing technical barriers that often hampers seismic risk assessments at the territorial scale.
A key innovation of SEIS-MEC lies in its ability to integrate different data sources within a customizable framework. The simulator can ingest multiple input streams, including seismic hazard data, exposure databases, and vulnerability models, to generate impact scenarios covering various sectors such as infrastructure, population, and economic assets. This holistic perspective enables civil protection and DRM agents to understand and prioritize interventions efficiently.
Reflecting the strategic approach adopted during its development, the following features represent the core design objectives of the platform:
- National-Scale Applicability: SEIS-MEC is designed to perform comprehensive impact evaluations across entire countries, supporting strategic planning and rapid response.
- Multi-Sector Synthesis: The tool consolidates seismic effects on buildings, infrastructure, population, and other critical sectors, delivering a consolidated impact overview.
- Web-Based Service: As an online platform, SEIS-MEC avoids the need for complex installations and software licenses, promoting accessibility and ease of use.
- Standalone Operation with GIS Capabilities: Although fully operational independently of traditional GIS desktop environments, SEIS-MEC incorporates GIS mapping functionalities for spatial visualization and analysis.
- User-Friendly Interface: A graphical user interface tailored for civil protection and DRM agents enhances usability, empowering non-expert users to operate the simulator efficiently during emergencies or simulations.
- Immediate Operability: By leveraging freeware databases and minimizing data preparation requirements, SEIS-MEC is ready for deployment in any country without extensive setup or calibration.
- Customizable and Integrative: Users can customize scenarios and input parameters, and the platform is designed to integrate heterogeneous national data sources, ensuring adaptability to various national contexts and data availabilities.
- Multilingual Accessibility: SEIS-MEC supports multiple languages for both the user interface and documentation, enhancing usability and inclusiveness for a broad range of national and international stakeholders.
Within the PPRDSouth III program, the platform was delivered to Algeria, Egypt, Jordan, Lebanon, Morocco, Tunisia, and Palestine and was presented in [32].
3. The Platform: Data, Engine and Outputs
Accessing the SEIS-MEC platform is simple and requires only a computer, an internet connection, a web browser, and valid login credentials. Figure 1 displays the Homepage of the platform for one selected country. At the top, seven navigation tabs are available, as detailed in Table 1. On the right-hand side, a toolbar is provided, described in Table 2. The tabs allow users to add or remove map layers and to perform various analyses.
3.1. Freeware Data and Models Preloaded into the Platform
The SEIS-MEC platform is built upon publicly available datasets to ensure immediate use, even in contexts where national data on exposure, vulnerability, and soil might be limited or absent. The freeware data preloaded into the platform are described below.
- Exposure database of buildings: It is drawn from the GEM Foundation global dataset [33]. It includes the number of residential, industrial and commercial buildings aggregated at the level of the provided geographical entity (not building by building). For each building type, the available information includes number of buildings, number of occupants (only for residential buildings), cost of repair, taxonomy of the buildings. The taxonomy is expressed in terms of Material, Lateral Load Resisting System, Design code, Number of storeys, Lateral force coefficient.
- Primary and secondary roads, hospitals and schools, fire and police stations: These data are retrieved from https://mapcruzin.com. These assets can be visualized on maps, but they are not initially included in the calculation of damage scenarios. A map of primary roads is reported in Figure 2 as an example.
- Historical events: the catalogue of relevant historical events was compiled using data from the global ISC-GEM catalogue (http://www.isc.ac.uk/iscgem/). Specifically, for each country, the selection includes all events occurring within its national borders, as well as events outside the borders that could induce significant ground shaking within the country. The catalogue contains the following data for each event: Date, Magnitude, Depth, Longitude, Latitude. It is both visible and searchable on the map (Figure 4) and is used in the calculation of the “actual scenario” for historical events.
- Vs30 map: The platform integrates the USGS Vs30 map (average shear-wave velocity in the top 30 meters), freely available from [34] (Figure 5), to incorporate ground motion amplification effects. This map allows users to choose whether to elaborate scenarios solely on rock conditions or to account for ground motion amplification effects due to specific soil types.
- Fragility functions: These functions are also retrieved from the GEM Foundation database [33]. They are employed to calculate damage scenarios. Each building taxonomy is associated with a fragility curve, indicating the probability of reaching four distinct damage levels: slight (D1), moderate (D2), extensive (D3), and complete (D4) for a given intensity parameter.
The data described above are readily available for each country. Two models, sourced from the literature, complement these data. The first one is a Ground Motion Model (GMM) that estimates through empirical equations the acceleration at a location based on epicentral parameter, providing both a central value and its associated variability. The platform uses as GMM model the Ground Motion Prediction Equation (GMPE) developed by [35], selected to ensure consistency with the seismic hazard maps incorporated in the platform.
The second model uses the preloaded Vs30 map, which consists of a grid of points spaced at 0.0083 degrees. For each country, the Vs30 map was overlaid with the boundaries of the administrative units for which the platform provides exposure data. Within each unit, the percentage of soil class A, B, C, D was calculated based on the following correspondence between Vs30 value and soil class as reported in EC8 [36]:
- Class A: Vs30 ≥ 800 m/s;
- Class B: Vs30 ≥ 360 and < 800 m/s;
- Class C: Vs30 ≥ 180 and < 360 m/s;
- Class D: Vs30 < 180 m/s.
For each soil class, the average Vs30 in each region was also calculated. This average Vs30 value is used in the GMPE to calculate ground acceleration, thereby accounting for lithostratigraphic amplification.
A platform that relies on freely available open-source data and pre-loaded static models enables rapid deployment in any country, while ensuring data homogeneity across the territory. In a subsequent phase, to enable more accurate and detailed analyses, it is advisable to replace or complement the default datasets with customized data provided directly by the country. For instance, national census data on population and building stock could be integrated. For structural vulnerability assessment, country-specific fragility curves could be implemented to reflect local construction characteristics. Similarly, for the hazard component, a GMPE specifically developed for the country could be adopted, or users could be given the option to select from a range of GMPEs.
3.2. Earthquake Input Parameters Entered by the User
As previously mentioned, the platform includes two options for computing damage scenarios: “Single Scenario” (Figure 6) and “Actual Scenario of Historical Event” (Figure 7). In the “Single Scenario” option, the user must specify the earthquake’s magnitude, epicentral location (either inserting latitude and longitude, or by clicking a point on the map), and focal depth. On the other hand, the “Actual Scenario of Historical Event” option uses preloaded earthquake parameters from the ISC-GEM catalogue (http://www.isc.ac.uk/iscgem/). In this case, the user only needs to define the time window of interest to generate damage scenarios for all the events in the catalogue that occurred within that period, for instance, between 1950 and 1980. It is important to note that this is referred to as an “Actual” scenario because it simulates the impact of past earthquakes using present-day exposure and vulnerability data, not those from the time of the events occurrence. Obviously, the number and types of buildings, as well as the resident population, may have changed significantly over the years. The benefit of this option is that it allows users to assess the potential impact of past seismicity under current conditions, assuming that future seismicity follows the same patterns as those recorded in the catalogue. The catalogue itself may consist of real historical events or virtual ones. In this sense, the tool also supports the study of parameter variability: for example, by simulating a range of magnitudes (e.g., 4.9, 5.0, 5.1) or slightly different epicentral locations for the same general event, users can explore how changes in input affect the resulting impact.
3.3. Damage Scenario Calculation and Results
A computational engine developed by EUCENTRE is integrated within the platform to combine the three components of seismic risk, exposure, vulnerability, and hazard, and generate damage scenarios. When using the platform with the freeware datasets described in §3.1, damage scenarios are produced only for residential, industrial, and commercial buildings. This is because vulnerability models, represented by fragility curves, can be assigned only to these structures, for which sufficient information is available to define a taxonomy. Specifically, the basic information required to associate fragility curves with a building includes: 1) structural typology (e.g., masonry, reinforced concrete, precast, etc.), 2) number of storeys, and 3) year of construction. Other buildings such as schools, hospitals, railway stations, police stations, and fire stations are included in the platform only by geographic location, without damage assessment since the available freeware data do not provide such details. However, the platform is designed to include a second phase of development, where customization with national data will provide the necessary information to include these strategic assets in the impact assessment. The following section describes the step-by-step procedure used by the platform to compute damage scenarios for residential, industrial, and commercial buildings, along with the types of outputs provided.
Step 1: Hazard assessment.
The first step in the procedure is the calculation of the intensity measure at the centroid of each geographic unit (hereafter referred to as GU, which may be a municipality, census tract, or a larger area such as a province, depending on the resolution of the exposure data). Using the GMPE (Ground Motion Prediction Equation), the engine calculates the intensity measure at the geographic centroid of the GU. Given the epicentre’s location, the distance to each GU is computed. This distance, along with magnitude, focal depth, and Vs30 values, are the only inputs required for the GMPE, which has been implemented for all intensity measures corresponding to the available fragility curves. The user may choose whether to take lithostratigraphic amplification into account or not. If soil type is not considered, the intensity measure is computed once using only the Vs30 corresponding to soil type A (rock) in the GMPE. If soil amplification is considered, the intensity measure is calculated separately for each soil class (A, B, C, D), and the results are aggregated using a weighted average, where the weight corresponds to the percentage of each soil type present in the GU.
Step 2: Exposure and vulnerability assessment.
For each GU, the exposure is retrieved in terms of the number of buildings, disaggregated by taxonomy. An example of taxonomy is: CR/LDUAL+CDL+DUM/H6/RES, which represents Reinforced Concrete, Dual System (Lateral Load Resisting System), Low Code (Design Code), six storeys, Residential use. In addition, each taxonomy is associated with total floor area and replacement cost per square meter, and for residential buildings, the number of inhabitants as well. Each taxonomy or group of taxonomies is also associated to fragility curves. As mentioned, these provide the probability of exceeding each of four damage levels (D1 slight damage, D2 moderate damage, D3 extensive damage, and D4 complete damage) for a given intensity measure.
Step 3: Physical damage assessment.
Once the intensity measure at the centroid of the GU is estimated, the probability of reaching each damage level is retrieved from the corresponding fragility curve for each taxonomy. This probability is multiplied by the number of buildings in that taxonomy within the GU, yielding the expected number of buildings reaching damage levels D1, D2, D3, and D4.
Step 4: Impact assessment.
Based on the number of buildings reaching each of the four damage levels (computed in Step 3), the engine estimates both economic and human losses using pre-loaded consequence models. Economic losses are calculated separately for residential, industrial, and commercial buildings, as well as the total losses. Human losses are computed only for residential buildings (as the number of workers in industrial and commercial buildings is unknown) and are expressed in terms of fatalities, injuries, and homeless.
The consequence models are parameterized using the values reported in Table 3, which represent percentages of buildings at each damage level (from D1 to D4). Specifically, economic losses are calculated as follows: 5% of the total floor area of buildings at D1, 30% at D2, 60% at D3, and 100% at D4, each multiplied by the replacement cost per square meter. Human losses are estimated as percentages of the population living in buildings that have reached damage levels D3 and D4.
The parameters in Table 3 are default values that can be modified by each country to account for country-specific characteristics related to local structural typologies. An example output is provided in Figure 8, which shows the total economic losses per GU resulting from a hypothetical earthquake.
Within Step 1, the platform also produces shakemaps for the considered event. These shakemaps are produced in terms of PGA and spectral acceleration at periods of vibration of T=0.3 and T=1.0 seconds, using a 0.08 degree mesh and the GMPE implemented in the tool [35]. Figure 9 shows, as an example, a shakemap in terms of PGA for an event that took place in Algeria in 1967 with magnitude 5.23.
Step 5: SEIS-MEC also includes features aimed at supporting emergency management protocols. Scenario results are automatically linked to predefined thresholds to suggest the deployment of response resources, such as temporary shelters (tent camps), advanced medical posts or Emergency Medical Teams (EMT), or USAR teams. While these outputs are not predictive in a strict probabilistic sense, they provide decision-makers with plausible ranges of needs that can be incorporated into contingency plans. Below are reported the assumptions implemented into the platform for the need assessment of response teams:
- Shelters or tent camps are activated if the number of homeless reaches 20 or more.
- Advanced medical posts are activated if the number of injured is 10 or more.
- USAR teams are activated if there is 1 or more totally lost building.
Once more, it should be emphasised that these thresholds are default values that can easily be modified based on the country context
3.4. Visualization and Export Options
The SEIS-MEC platform provides a user-friendly and intuitive interface for data and results visualization. Specifically, the outputs of the analyses, in terms of damage scenarios, are displayed as color-coded maps, as shown in Figure 8, while aggregated results at the national level are available in tabular format. An example is presented in Figure 10, referring to an Actual Scenario based on a Historical Event that occurred in 1973 in Algeria (Mw = 5.54).
The platform also allows the export of a CSV file containing detailed results, as illustrated in Figure 11. For each GU and for each taxonomy, the CSV file includes economic losses, human losses, percentages of buildings (perc_1, etc.), and the number of buildings (num_1, etc.) at each of the four damage levels. It also includes information on whether response resources, such as tent camps, advanced medical posts, and USAR teams, are required (y = Yes) or not (n = No). The option to download this CSV file allows users to access and use the analysis results offline, which is particularly useful in contexts with limited internet connectivity.
To ensure the platform is inclusive and usable for stakeholders involved in emergency planning and management, SEIS-MEC is multilingual. Supported languages currently include English, Albanian, Bosnian, Croatian, French, Macedonian, and Serbian. The navigation manual is also available in all these languages, as well as in Arabic (Figure 12).
In line with this flexibility, the platform also allows users to modify the currency exchange rate used for cost-related outputs, which are shown in US dollars by default. Figure 13 shows the control panel where language, currency, and map selection mode can be customized.
4. Application and Use Cases
The SEIS-MEC platform offers a powerful tool to support Civil Protection agencies and DRM authorities in enhancing preparedness, planning, and emergency response. It is particularly valuable for:
- Capacity building through simulation-based training;
- Supporting scenario-based contingency planning;
- Informing emergency response actions in real time;
- Strengthening coordination across agencies and sectors.
This section illustrates the platform’s application through a case study from the PPRD South 3 regional project, which involved national authorities from several Mediterranean and Middle Eastern countries. The exercise showcased how the platform can support training, contingency planning, and structured response discussions within national teams.
On 13 and 14 July 2021, the PPRD South 3 program organised a regional online Tabletop Exercise (TTX) titled: “Online Workshop on the Utilisation of the Earthquake Simulator for Planning and Managing Earthquake Response”. The invited countries were Algeria, Egypt, Israel, Jordan, Lebanon, Morocco, Palestine, and Tunisia. Each national working group operated in parallel within dedicated online rooms and was provided with country-specific earthquake parameters, such as magnitude and epicentre, from which they were required to generate the impact scenario in real time using the SEIS-MEC platform. Table 4 and Figure 14 show the events considered during the TTX, selected from the catalogue of historical earthquakes integrated into the platform (ISC-GEM).
The exercise was structured as a two-days online scenario-based discussion workshop. Day 1 was dedicated to simulation, analysis, and planning, while Day 2 focused on reporting, feedback, and discussion on lessons learned. National working groups comprised representatives from civil protection authorities, DRM agencies, and scientific institutions.
The main objective of the TTX was to enhance participants’ understanding of the platform’s functionalities, assess the simulated impact and formulate elements of both an emergency operations plan and a communication plan based on the results. Specifically, the simulation aimed to:
- Test the national teams’ ability to operate the seismic simulator;
- Build capacity in scenario-based planning;
- Reinforce linkages between simulated impacts and operational planning;
- Promote good practices in earthquake response and public communication.
Participants used the Web-GIS platform to simulate the impact of a predefined seismic event in their territory. Key features included:
- Real-time generation of building damage and displaced population;
- Identification of priority response areas;
- Support for calculating shelter needs and logistical requirements;
- Output visualisation for emergency coordination and planning.
Based on the simulator’s output, each group developed key elements for:
- An Intervention Plan, focusing on the social system (e.g., displaced population, sheltering, healthcare logistics);
- A Communication Plan, addressing both affected and unaffected populations.
The workshop included predefined questions on institutional roles, shelter management, logistics (e.g., tents and camps), response timeframes, and health measures.
For instance, Figure 15 shows the questions about population sheltering discussed during the TTX.
An unexpected scenario involving a COVID-19 outbreak in a displaced camp was also introduced to test the adaptability of response and communication strategies.
During the plenary session on the second day of the workshop, participating countries presented their responses to the predefined questions. In general, national teams were able to retrieve the main impact information from the seismic simulator, demonstrating its user-friendly interface and accessibility. Participants were also able to elaborate on their answers, linking the simulated data to operational planning elements. This confirmed that the simulator is well aligned with the needs of civil protection authorities. Overall, the exercise proved useful, and the simulator effective in supporting scenario-based discussions and planning. The use of the SEIS-MEC platform in the PPRD South III TTX highlighted several benefits. They are summarized in Figure 16, but overall, the TTX demonstrated the potential of the SEIS-MEC platform to bridge the gap between scientific modelling and operational decision-making.
5. Conclusions
The SEIS-MEC platform, jointly developed by EUCENTRE Foundation and the Italian Civil Protection Department, is a web-based seismic impact simulator designed to support rapid post-earthquake assessments and DRM. Thanks to its intuitive interface, integration of open-source data, and ease of use, the platform serves as a practical and accessible solution for national civil protection authorities and institutions in charge of seismic DRM. By entering only basic earthquake parameters, magnitude, epicentre location, and depth, the platform can generate nearly real-time damage scenarios, including estimates of economic and human losses, as well as emergency response needs such as shelter and medical assistance posts. In addition, it allows the simulation of scenarios based on set of events selected from a catalogue, either historical or virtual.
Originally developed under the PPRD South III initiative and currently being enhanced within the context of the IPA-CARE program, the platform has been adopted by several countries across the Southern Mediterranean and Western Balkans. Its architecture, based on freeware data and modular design, ensures both immediate usability and broad adaptability to national contexts, according to the availability and granularity of national data.
The platform proved effective during the PPRD South III TTX, where participants used it to simulate real-time scenarios, assess likely consequences, and define operational responses. Its accessibility and user-friendliness allowed civil protection personnel to translate technical outputs into planning actions. The ongoing phase of the IPA-CARE program is focused on integrating country-specific datasets to improve scenario accuracy and tailor the platform to local needs.
Potential enhancements on the platform include the integration of:
- National census data on residential buildings and living population;
- Information on the location of faults;
- Soil-related data directly provided by the countries;
- More detailed data on critical facilities like schools, hospitals, police stations, airports;
- Information about the type of hospitals and their bed capability;
- The possibility to consult satellite cartography directly from the tool;
- Dynamic data functionalities, allowing to share real-time information with other instruments;
- Connection to monitoring systems installed on buildings.
Over the next months of the IPA-CARE program and in others future initiatives, the feasibility of such improvements will be explored, maintaining a continuous engagement of the stakeholders to assess actual needs and availability of national data.
The SEIS-MEC platform also contributes to strengthen seismic risk preparedness and prevention phases. By enabling the development of realistic earthquake scenarios and providing a shared operational tool, it supports contingency planning, inter-agency coordination, training exercises, and public risk communication. In this sense, it serves as both a response instrument and a preparedness enabler, fostering a more proactive and informed approach to disaster risk reduction.
Its scalability, multilingual interface, and low technical entry requirements further enhance its value, particularly in contexts where time, data, or technical expertise may be limited. Rather than prioritizing analytical complexity, SEIS-MEC emphasizes operational usefulness and rapid applicability, characteristics that align closely with the needs of civil protection agencies and decision-makers. As such, the platform stands out as a practical and adaptable solution for supporting seismic risk management across different institutional contexts.
Author Contributions
Conceptualization, Agostino Goretti and Marta Faravelli; methodology, Agostino Goretti, Marta Faravelli and Barbara Borzi; software development, Davide Quaroni; validation, Chiara Casarotti; writing—original draft preparation, Agostino Goretti and Marta Faravelli; writing—review and editing, Chiara Casarotti. All authors have read and agreed to the published version of the manuscript.
Funding
This research received external funding by the European Commission through the PPRD South III (Grant Agreement ENI/2017/392-714) and IPA-CARE (Grant Agreement ECHO/B1/2022/IPA/884155) programs.
Data Availability Statement
The freeware data and their sources are listed below: Baseline data: https://mapcruzin.com, https://openstreetmap.o.rg. Vs30 map: USGS https://earthquake.usgs.gov/data/vs30/. Exposure and fragility curves from GEM database: https://www.globalquakemodel.org. Historical events catalogue by ISC-GEM: http://www.isc.ac.uk/iscgem/.
Acknowledgments
The authors would like to acknowledge the DG-ECHO program for funding the IPA-CARE and PPRD South III projects, within which the SEIS-MEC platform was developed and further expanded. Special thanks are also extended to the GEM team for their support in accessing and utilizing the freeware data available through their databases. Finally, the authors wish to thank the countries that actively participated in the Tabletop Exercise (TTX) organized as part of the PPRD South III program, demonstrating strong engagement and interest. During the preparation of this manuscript, the authors used ChatGPT for English translation and language enhancement. The authors have reviewed and edited the output and take full responsibility for the content of this publication.
Conflicts of Interest
The authors declare no conflicts of interest.
Abbreviations
The following abbreviations are used in this manuscript:
| DRM | Disaster Risk Management |
| EMT | Emergency Medical Team |
| USAR | Urban Search and Rescue |
| JRC | Joint Research Centre |
| CAPRA | Central America Probabilistic Risk Assessment |
| GEM | Global Earthquake Model |
| SELENA | SEismic Loss EstimatioN using a logic tree Approach |
| PPRD | Prevention, Preparedness and Response to natural and man-made Disasters |
| EU | European Union |
| SIGE | Sistema Informativo Geografico per l’Emergenza |
| EUCLIDE | EUCentre for Loss-Impact and Damage Evaluation |
| GMMs | Ground Motion Models |
| SEIS-MEC | SEIsmic riSk in MEditerranean Countries |
| GIS | Geographic Information System |
| PGA | Peak Ground Acceleration |
| Vs30 | Average shear-wave velocity in the first 30 meters of depth |
| GMPE | Ground Motion Prediction Equation |
| USGS | United States Geological Survey |
| EC8 | Eurocode 8 |
| GU | Geographic Unit |
| D1 | Slight damage |
| D2 | Moderate damage |
| D3 | Extensive damage |
| D4 | Complete damage |
| TTX | Tabletop Exercise |
| FEMA | Federal Emergency Management Agency |
References
- Erdik, M.; Fahjan, Y. Local Earthquake Rapid Loss Assessment Systems. Rapid Earthquake Loss Assessment After Damaging Earthquakes 2006, Springer, 45–62.
- LESSLOSS. Earthquake Disaster Scenario Prediction and Loss Modelling for Urban Areas. Editor Robin Spence 2007, Pavia, Italy.
- So, E.; Spence, R. Estimating shaking-induced casualties and building damage for global earthquake events: a proposed modelling approach. Bull Earthquake Eng 2013, 11, 347–363. [Google Scholar] [CrossRef]
- Erdik, M.; Şeşetyan, K.; Demircioğlu, M.B.; Zülfikar, C.; Hancılar, U.; Tüzün, C.; Harmandar, E. Rapid earthquake loss assessment after damaging earthquakes. Perspectives on European Earthquake Engineering and Seismology. Geotechnical, Geological and Earthquake Engineering 2014, 34, Springer. [Google Scholar] [CrossRef]
- Faravelli, M.; Di Meo, A.; Borzi, B.; Cantoni, A.; Savadori, L. , Speranza, E.; Dolce, M. SICURO+: A web platform to raise awareness on seismic risk in Italy. International Journal of Disaster Risk Reduction 2024, 103. [Google Scholar] [CrossRef]
- Kazantzidou-Firtinidou, D.; Gountromichou, C.; Kyriakides, N.C.; Liassides, P.; Hadjigeorgiou, K. Seismic Risk Assessment as a Basic Tool for Emergency Planning: “PACES” EU Project. WIT Transactions on The Built Environment 2017, 173, C.A. [Google Scholar]
- Hung, H.; Chen, L. The application of seismic risk-benefit analysis to land use planning in Taipei City. Disasters 2007, 31, 256−276. [Google Scholar] [CrossRef]
- Roohi, M.; Ghasemi, S.; Sediek, O.; Jeond, H.; Van de Lindt, J.H.; Shields, M.; Hamideh, S.; Cutler, H. Multi-disciplinary seismic resilience modeling for developing mitigation policies and recovery planning. Resilient Cities and Structures 2024, 3, 66–84. [Google Scholar] [CrossRef]
- Masi, A.; Samela, C.; Santarsiero, G.; Vona, M. Scenari di danno sismico per l’esercitazione nazionale di Protezione civile “Terremoto Val d’Agri 2006”. XII Convegno ANIDIS L’Ingegneria Sismica in Italia 2007, Pisa, Italy.
- UNDRR. Design and Conduct Simulation Exercises – SIMEX. Words into Action Guideline Series 2012.
- Silva, V.; Crowley, H.; Bazzurro, P. Exploring risk-targeted hazard maps for Europe. Earthquake Spectra 2016, 32, 1165–1186. [Google Scholar] [CrossRef]
- Bal, I.E.; Bommer, J.J.; Stafford, P.J.; Crowley, H.; Pinho, R. The Influence of Geographical Resolution of Urban Exposure Data in an Earthquake Loss Model for Istanbul. Earthquake Spectra 2010, 26, 619–634. [Google Scholar] [CrossRef]
- Zuccolo, E.; Bolzon, G.; Pitari, F.; Rodríguez Muñoz, L.; Monsalvo Franco, I.E.; Scaini, C.; Poggi, V.; Smerzini, C.; Salon, S. UrgentShake: An HPC System for Near Real-Time Physics-Based Ground Shaking Simulations to Support Emergency Response Efforts. EGU General Assembly 2025, Austria, EGU25–9353. [Google Scholar] [CrossRef]
- Costanzo, A.; Falcone, S.; D’Alessandro, A.; Vitale, G.; Giovinazzi, G.; Morici, M.; Dall’Asta, A.; Buongiorno, M.F. A Technological System for Post-Earthquake Damage Scenarios Based on the Monitoring by Means of an Urban Seismic Network. Sensors 2021, 21, 7887. [Google Scholar] [CrossRef] [PubMed]
- Silva, V.; Horspool, N. Combining USGS ShakeMaps and the OpenQuake-engine for damage and loss assessment. Earthquake Engineering Structural Dynamic 2019, 48, 634–652. [Google Scholar] [CrossRef]
- Lu, X.; Zeng, X.; Xu, Z.; Guan, H. Improving the Accuracy of near Real-Time Seismic Loss Estimation using Post-Earthquake Remote Sensing Images. Earthquake Spectra 2018, 34. [Google Scholar] [CrossRef]
- Tubaldi, E.; Özer, E.; Douglas, J.; Gehl, P. Examining the contribution of near real-time data for rapid seismic loss assessment of structures. Structural Health Monitoring 2021, 21, 118–137. [Google Scholar] [CrossRef]
- Silva, V.; Crowley, H.; Pagani, M.; Monelli, D.; Pinho, R. Development of the OpenQuake engine, the Global Earthquake Model’s open-source software for seismic risk assessment. Natural Hazards 2014, 72, 1409–1427. [Google Scholar] [CrossRef]
- Rodríguez-Saiz, J.; González-Rodrigo, B.; Rejas-Ayuga, J.G.; Hidalgo-Leiva, D.A.; Marchamalo-Sacristán, M. Assessing Building Seismic Exposure Using Geospatial Technologies in Data-Scarce Environments: Case Study of San José, Costa Rica. Appl. Sci. 2025, 15. [Google Scholar] [CrossRef]
- Strasser, F.O.; Stafford, P.J.; Bommer, J.J.; Erdik, M. State of the Art of European Earthquake Loss Estimation Software. 14th World Conference on Earthquake Engineering 2008, Beijing, China. [Google Scholar]
- Makhoul, N.; Argyroudis, S. Loss estimation software: developments, limitations and future needs. 16th European Conference on Earthquake Engineering 2018, Thessaloniki, Greece. [Google Scholar]
- Guérin-Marthe, S.; Gehl, P.; Negulescu, C.; Auclair, S.; Fayjaloun, R. Rapid earthquake response: The state-of-the art and recommendations with a focus on European systems. International Journal of Disaster Risk Reduction 2021, 52, 101958. [Google Scholar] [CrossRef]
- JRC. Seismic Risk Assessment Tools Workshop: Overview and Comparative Analysis. Joint Research Centre 2017, European Commission.
- Federal Emergency Management Agency (FEMA). HAZUS Earthquake Model. Technical manual Hazus 6.1 2024, Washington DC.
- Cardona, O. D.; Ordaz, M.; Reinoso, E. CAPRA – Comprehensive Approach for Probabilistic Risk Assessment: international initiative for risk management effectiveness. Proceedings of the 15th World Conference on Earthquake Engineering 2012, Lisbon, Portugal. [Google Scholar]
- Yalçın, D.; Fahjan, Y.; Eravcı, B.; Yanık, K. AFAD-RED Rapid Earthquake Damage and Loss Estimation Software: Example of Adıyaman Samsat Earthquake. Proceedings of the 9th Congress of the Balkan Geophysical Society, European Association of Geoscientists & Engineers (EAGE) 2017, ISBN: 9781510857162, Antalya, Turkey.
- Molina, S.; Lang, D. H.; Lindholm, C. D. SELENA: An open-source tool for seismic risk and loss assessment using a logic tree computation procedure. Computers & Geosciences 2010, 36, 257–269. [Google Scholar] [CrossRef]
- Goretti, A.; Sabetta, F. Real Time Seismic Loss Estimation in Italy. Geophysical Research Abstracts 2009, 11, EGU2009-544. [Google Scholar]
- Di Pasquale, G.; Ferlito, R.; Orsini, G.; Papa, F.; Pizza, G.; Van Dyck, D. Seismic scenario tools for emergency planning and management. XXIX General Assembly of the European Seismological Commission 2004, Potsdam, Germany. [Google Scholar]
- Faravelli, M.; Borzi, B.; Onida, M.; Pagano, M. Tools for seismic risk assessment on different asset types. 18th World Conference on Earthquake Engineering 2024, Milan, Italy. [Google Scholar]
- Bozzoni, F.; Borzi, B.; Faravelli, M.; Onida, M.; Pagano, M.; Quaroni, D. A webgis tool to assess the seismic risk of health facilities for emergency management in Italy. 18th World Conference on Earthquake Engineering 2024, Milan, Italy. [Google Scholar]
- Dolce, M.; Goretti, A.; Germagnoli, F.; Borzi, B. The SeisMec WebGis Platform for Real-time Seismic Scenarios Supporting Disaster Risk Management. 5th Annual Seminar of Disaster Risk Managemen Center 2021.
- Global Earthquake Model. GEM Foundation. https://www.globalquakemodel.org/.
- USGS Database. https://earthquake.usgs.gov/data/vs30/.
- Akkar, S.; Sandıkkaya, M.A.; Bommer, J. J. Empirical Ground-Motion Models for Point- and Extended-Source Crustal Earthquake Scenarios in Europe and the Middle East. Bulletin of Earthquake Engineering 2014, 12, 359–87. [Google Scholar] [CrossRef]
- EN 1998-1 Eurocode 8: Design of structures for earthquake resistance – Part 1: General rules, seismic actions and rules for buildings 2004, The European Union Per Regulation 305/2011, Directive 98/34/EC, Directive 2004/18/EC.
Figure 1.
Homepage of the platform illustrating its application to Algeria.
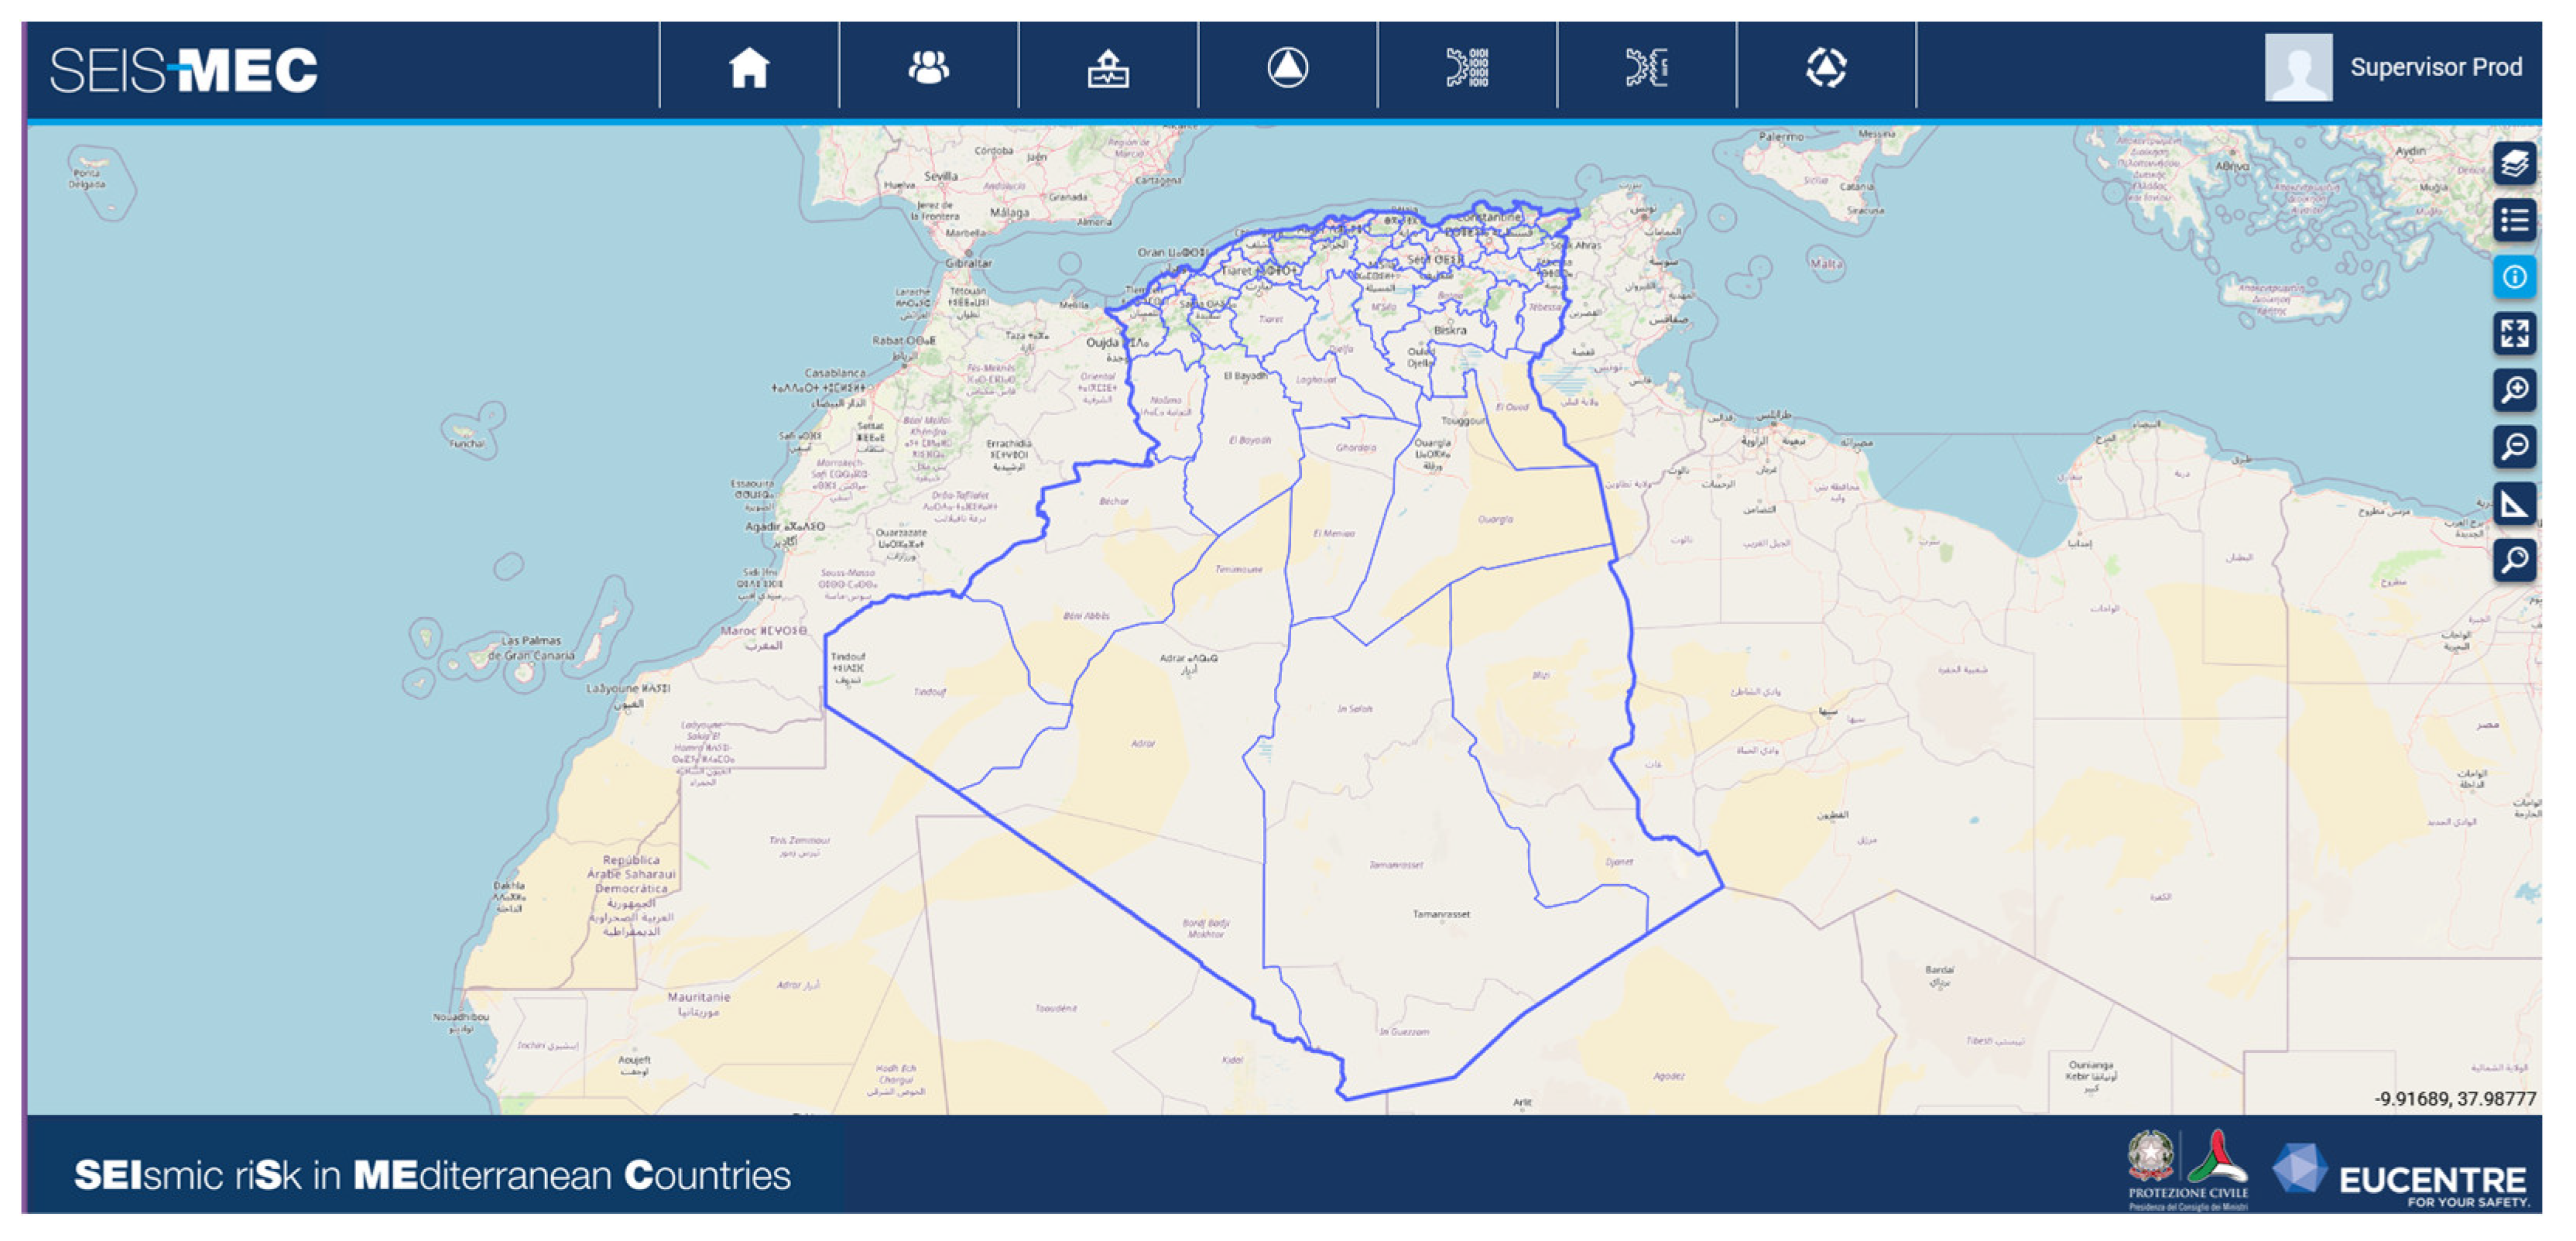
Figure 2.
Primary roads layer.
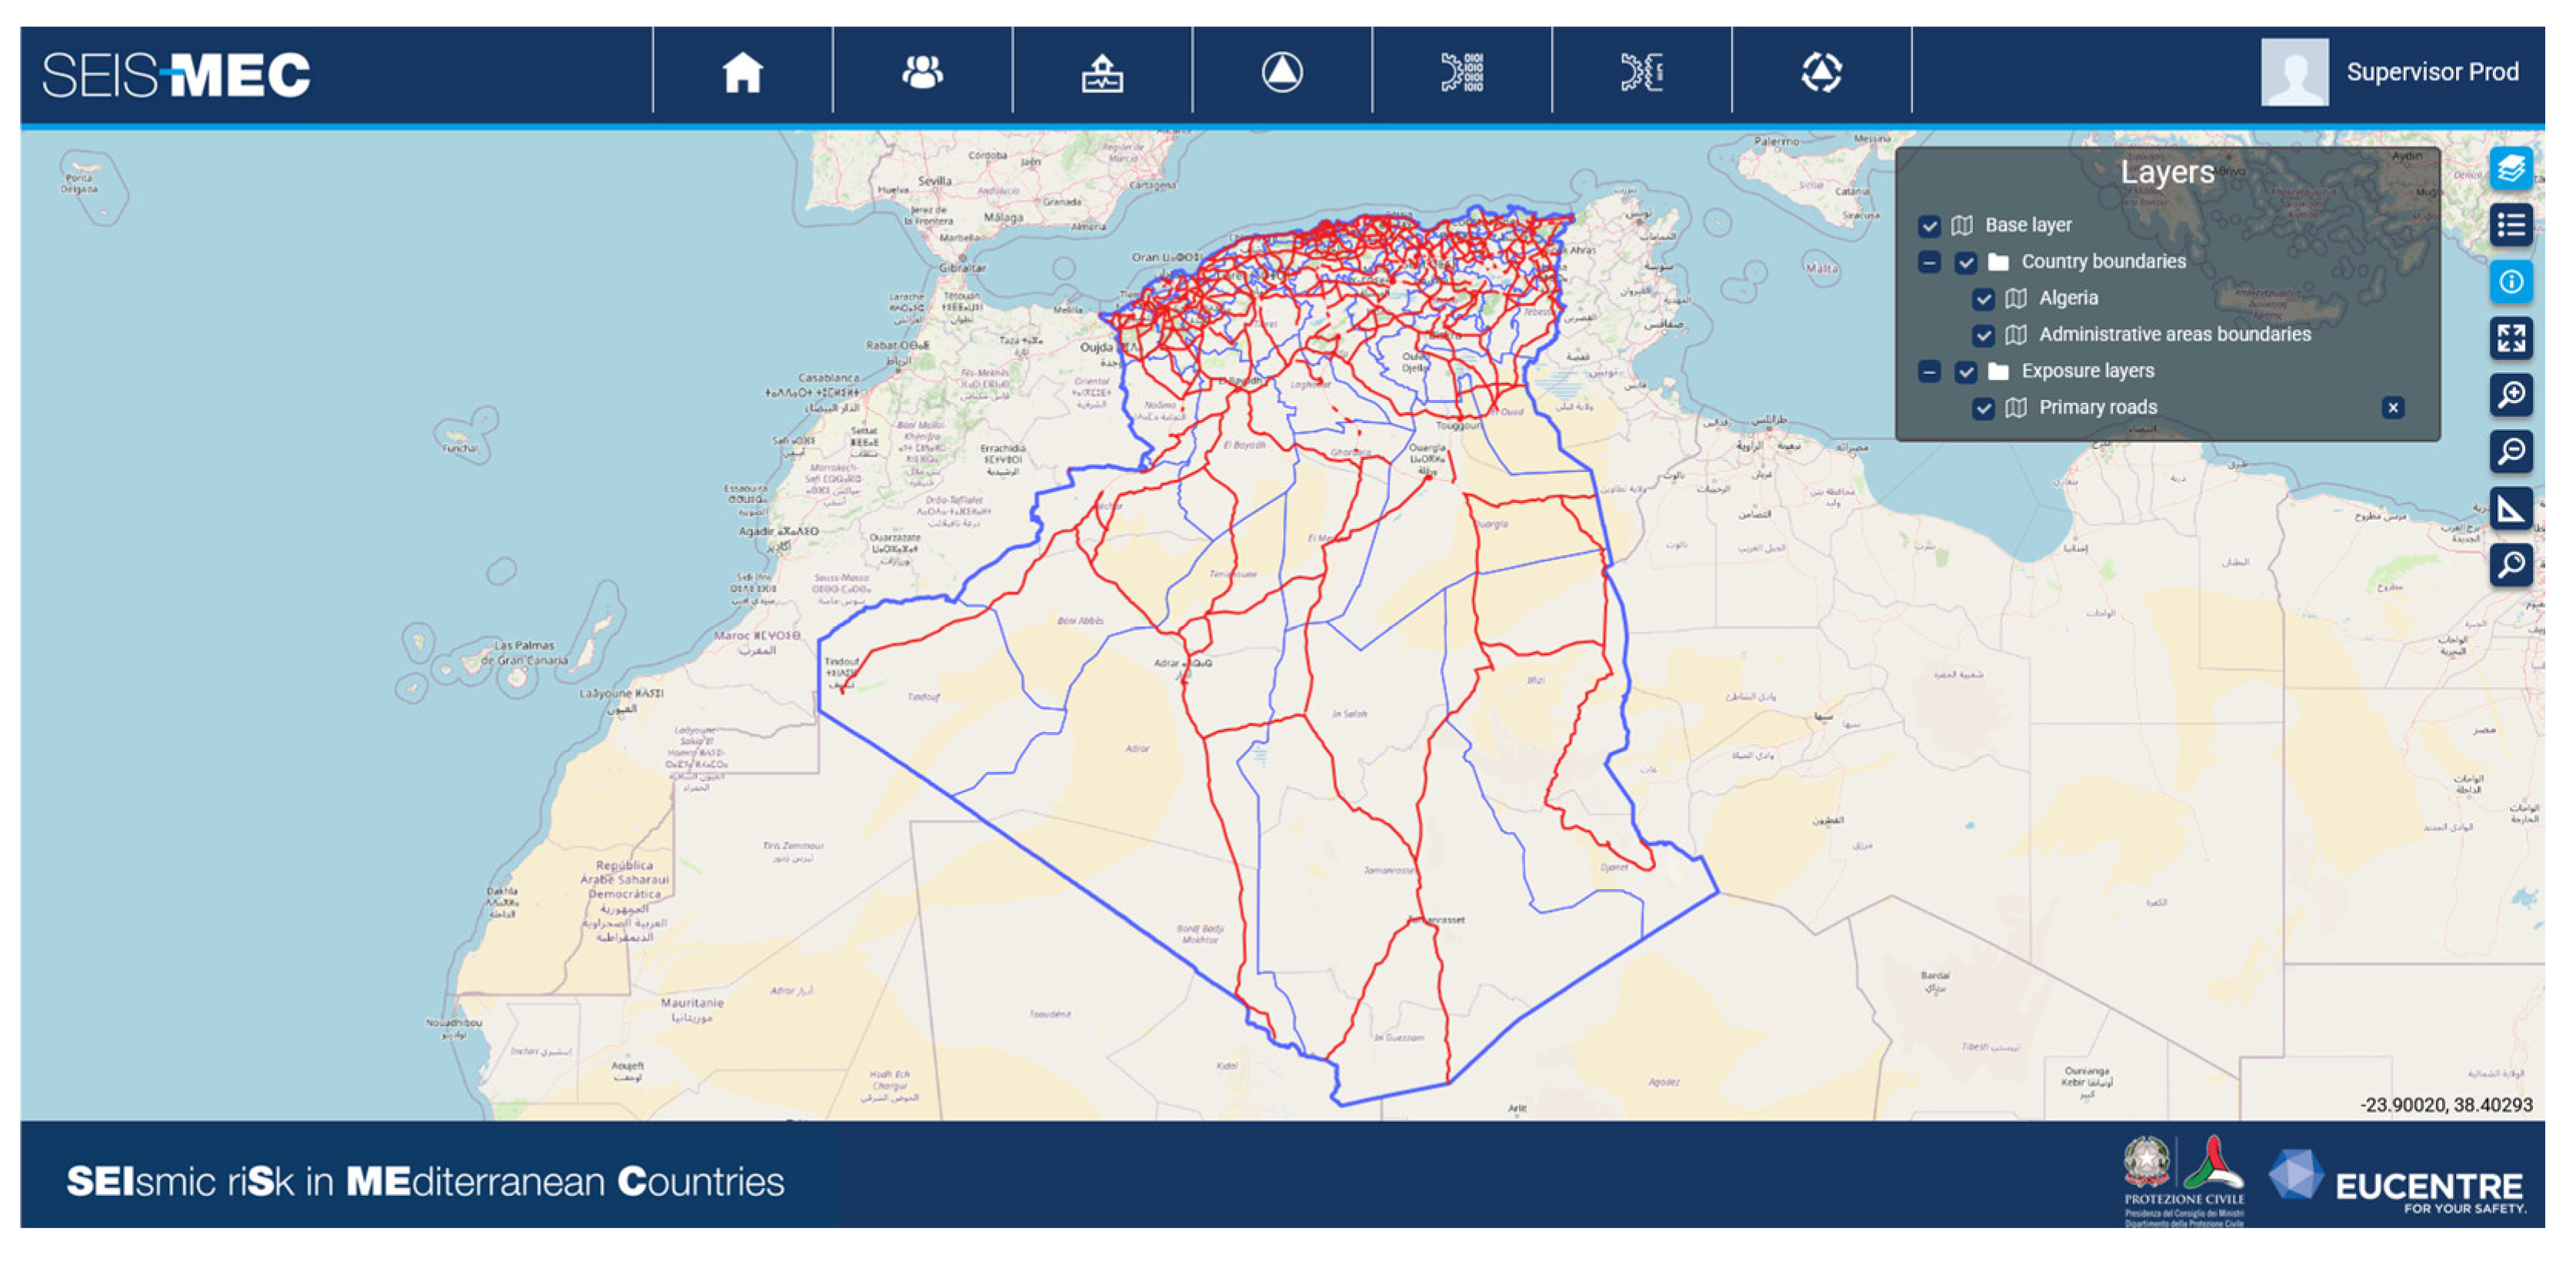
Figure 3.
Hazard map for a return period of 475 years.
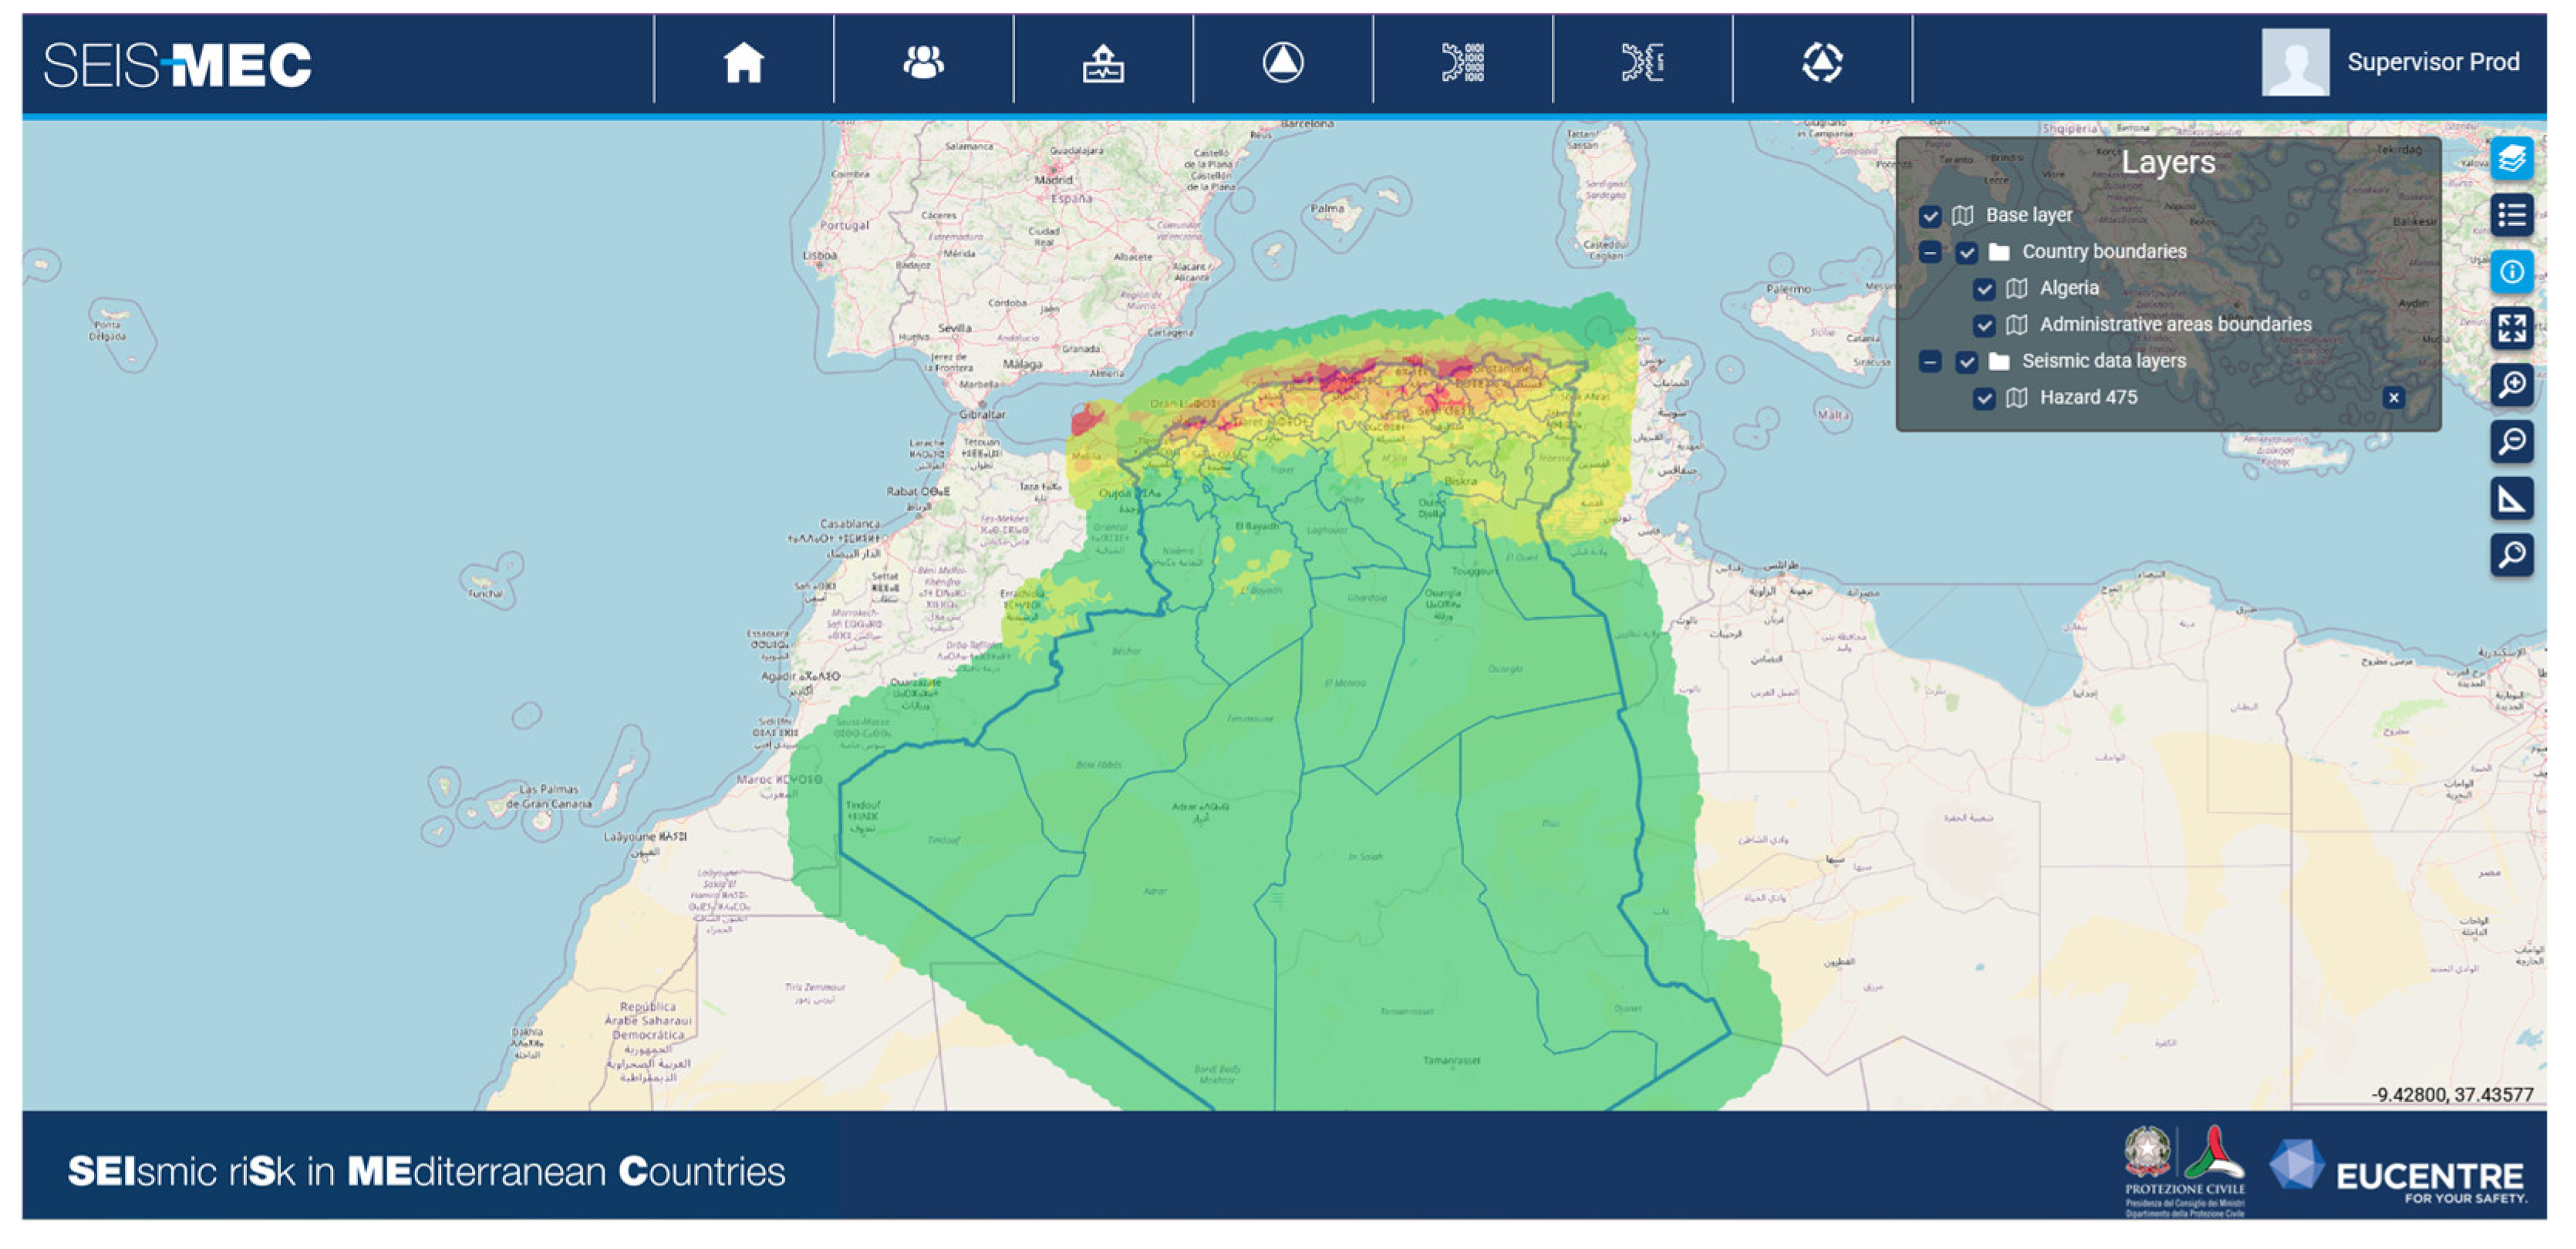
Figure 4.
Historical events from the global ISC-GEM catalogue.
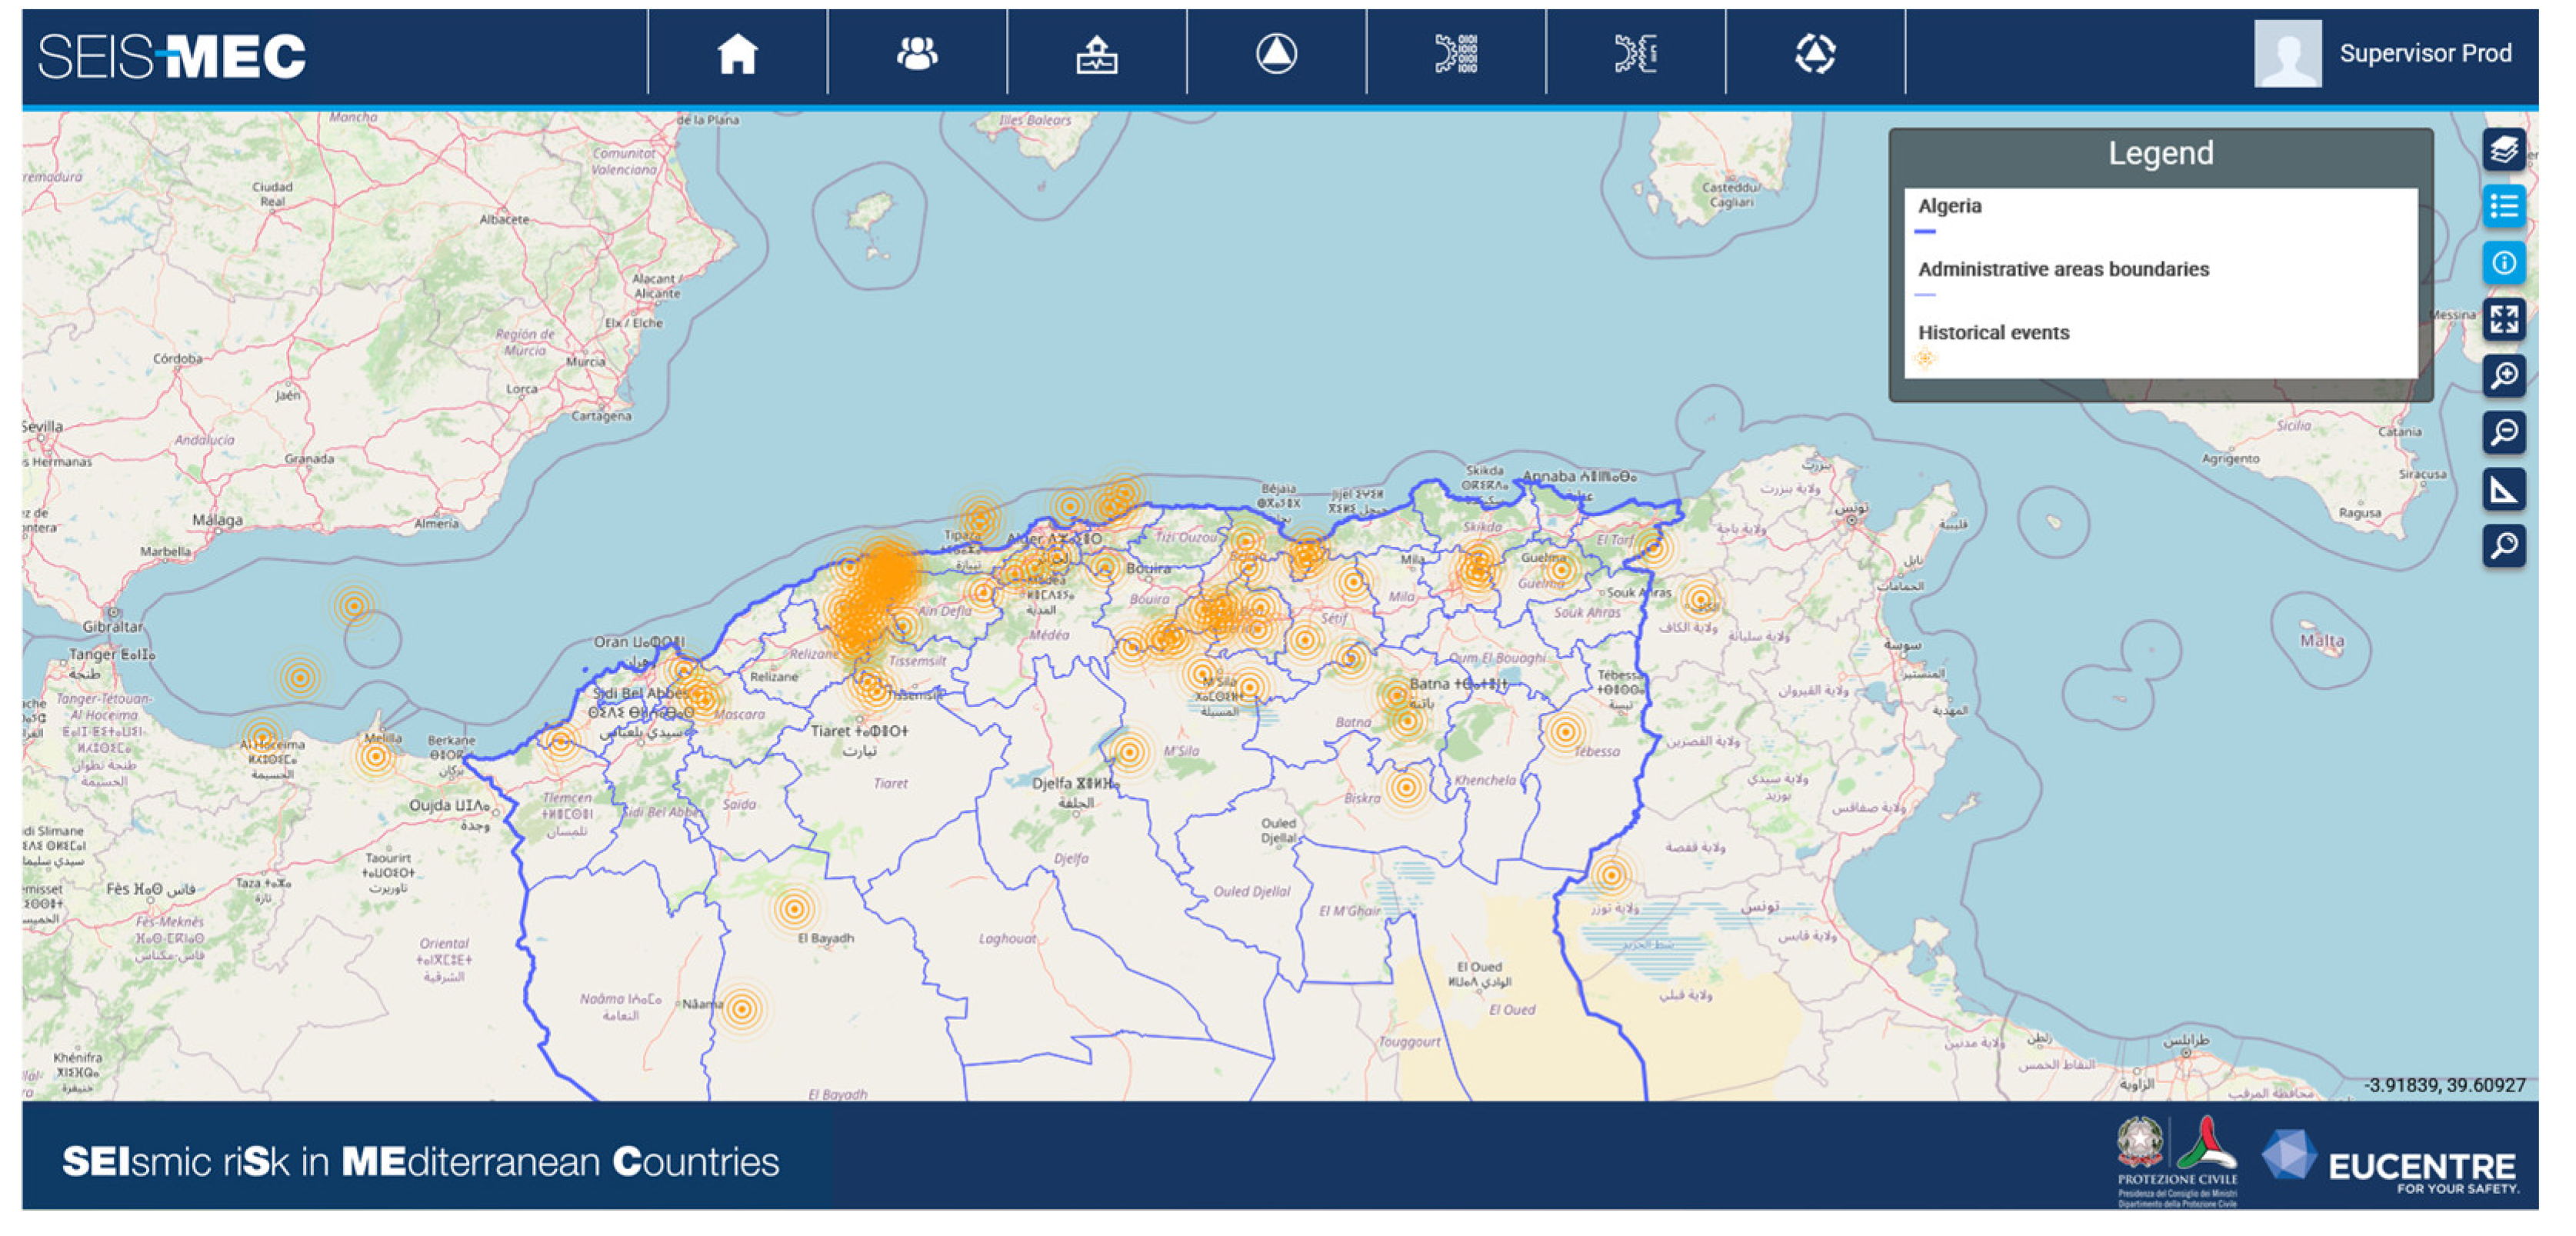
Figure 5.
Vs30 map (average shear-wave velocity in the first 30 meters of depth) from USGS [34].
Figure 5.
Vs30 map (average shear-wave velocity in the first 30 meters of depth) from USGS [34].
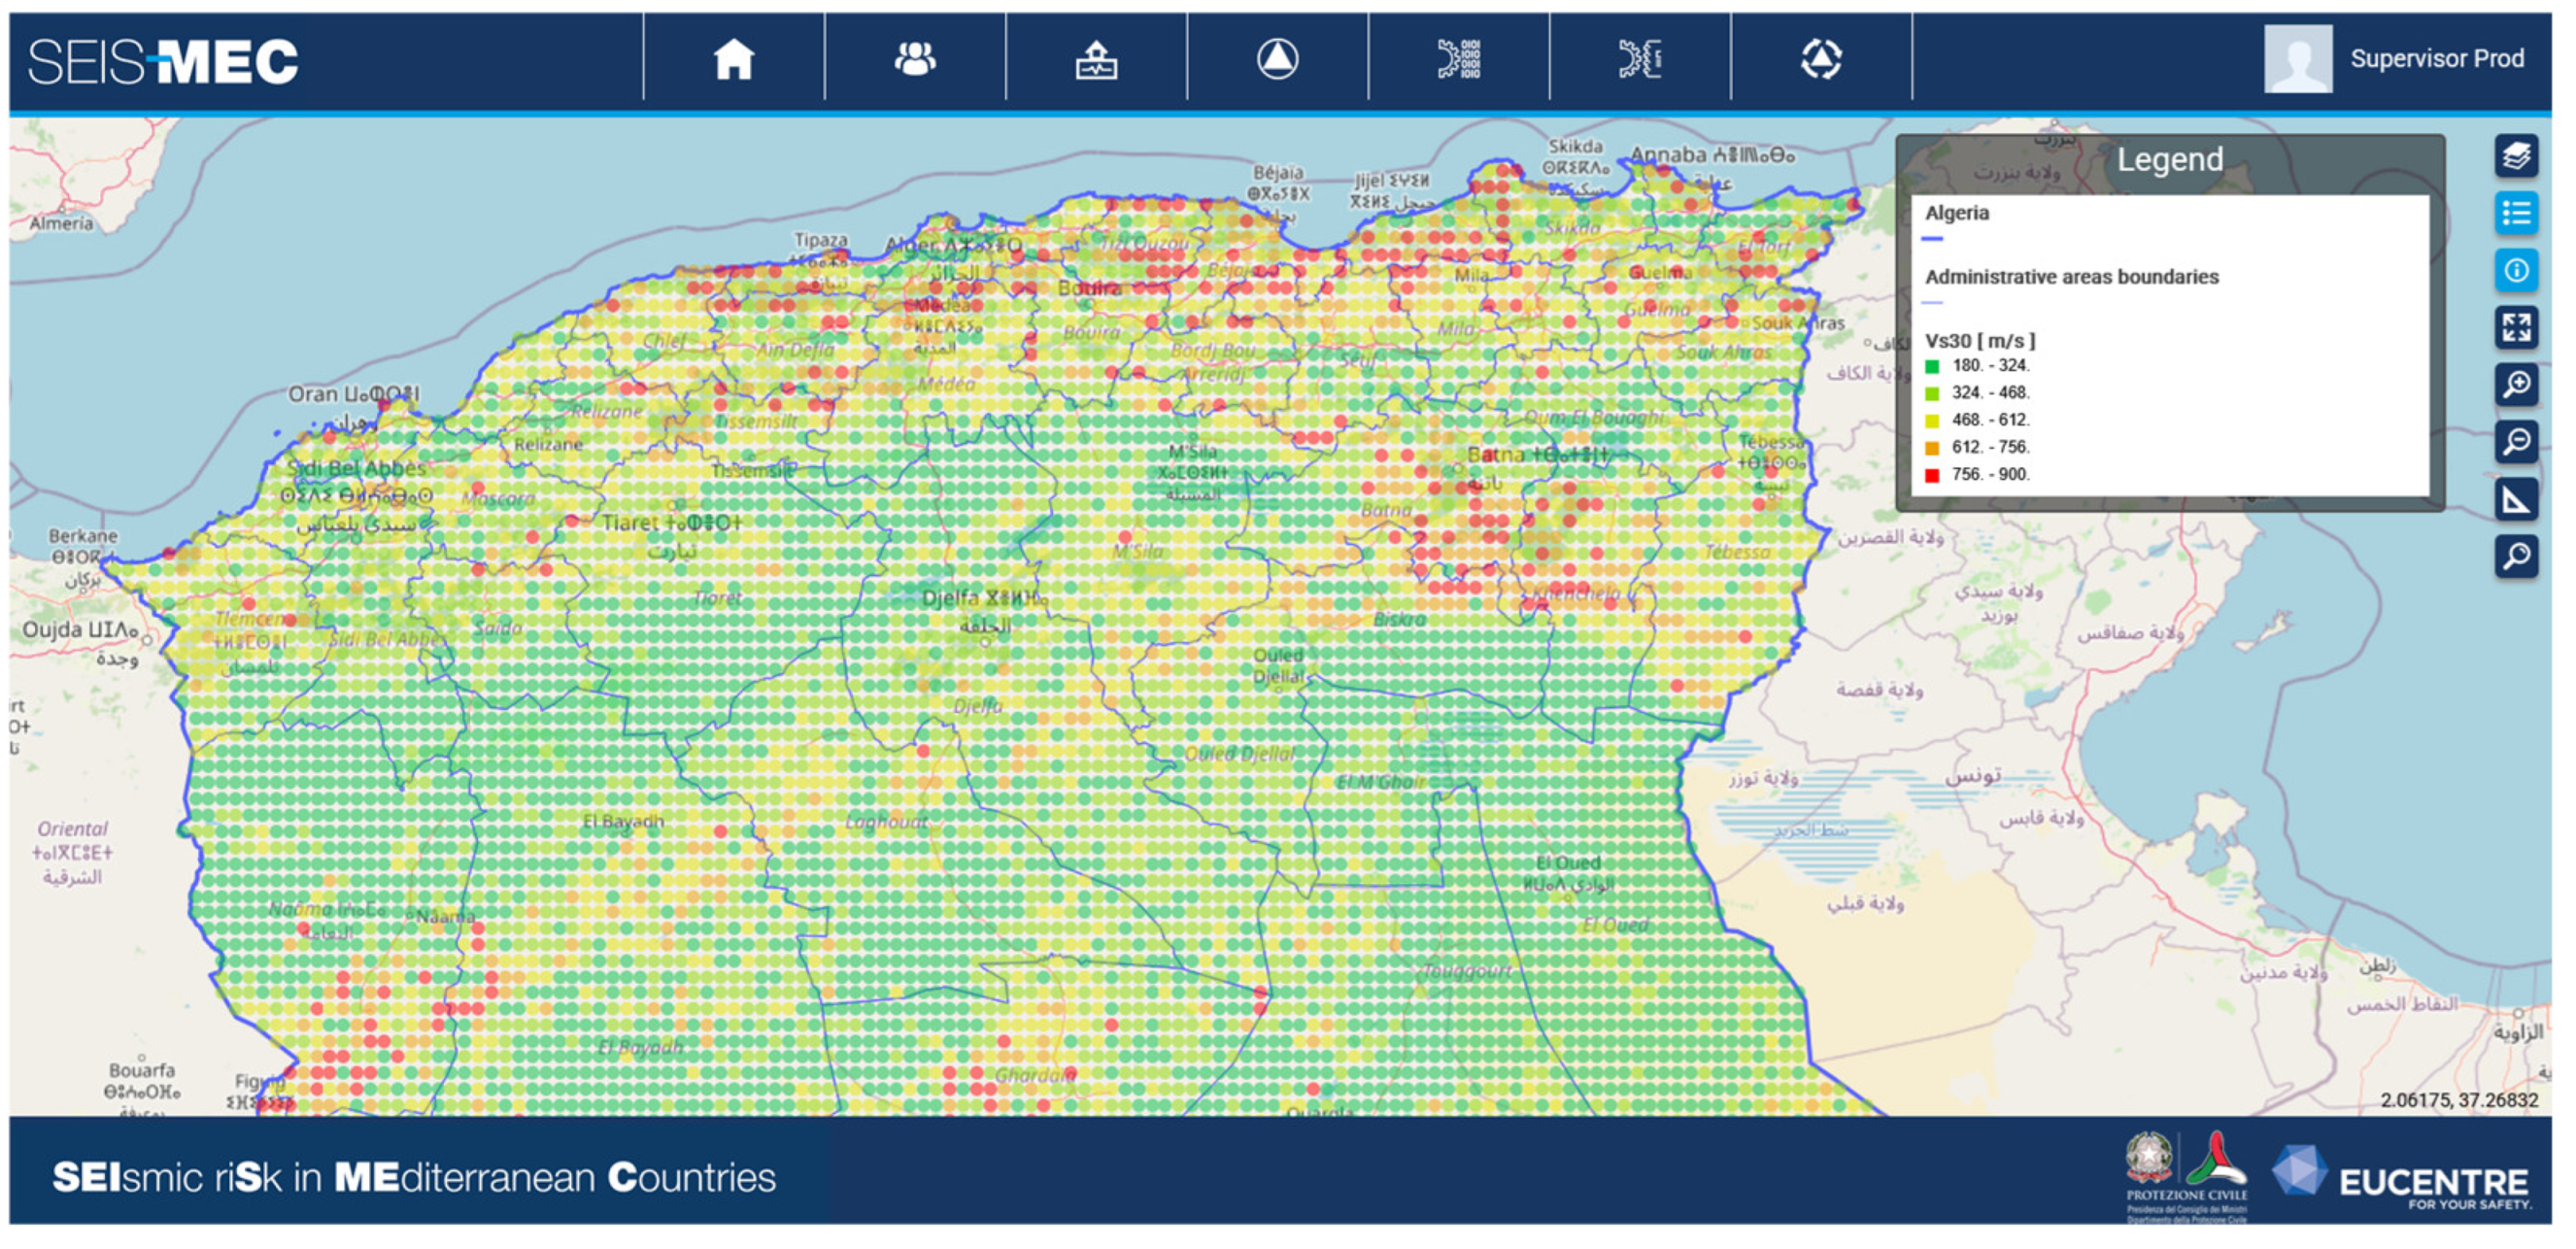
Figure 6.
Tool to elaborate Single scenario.
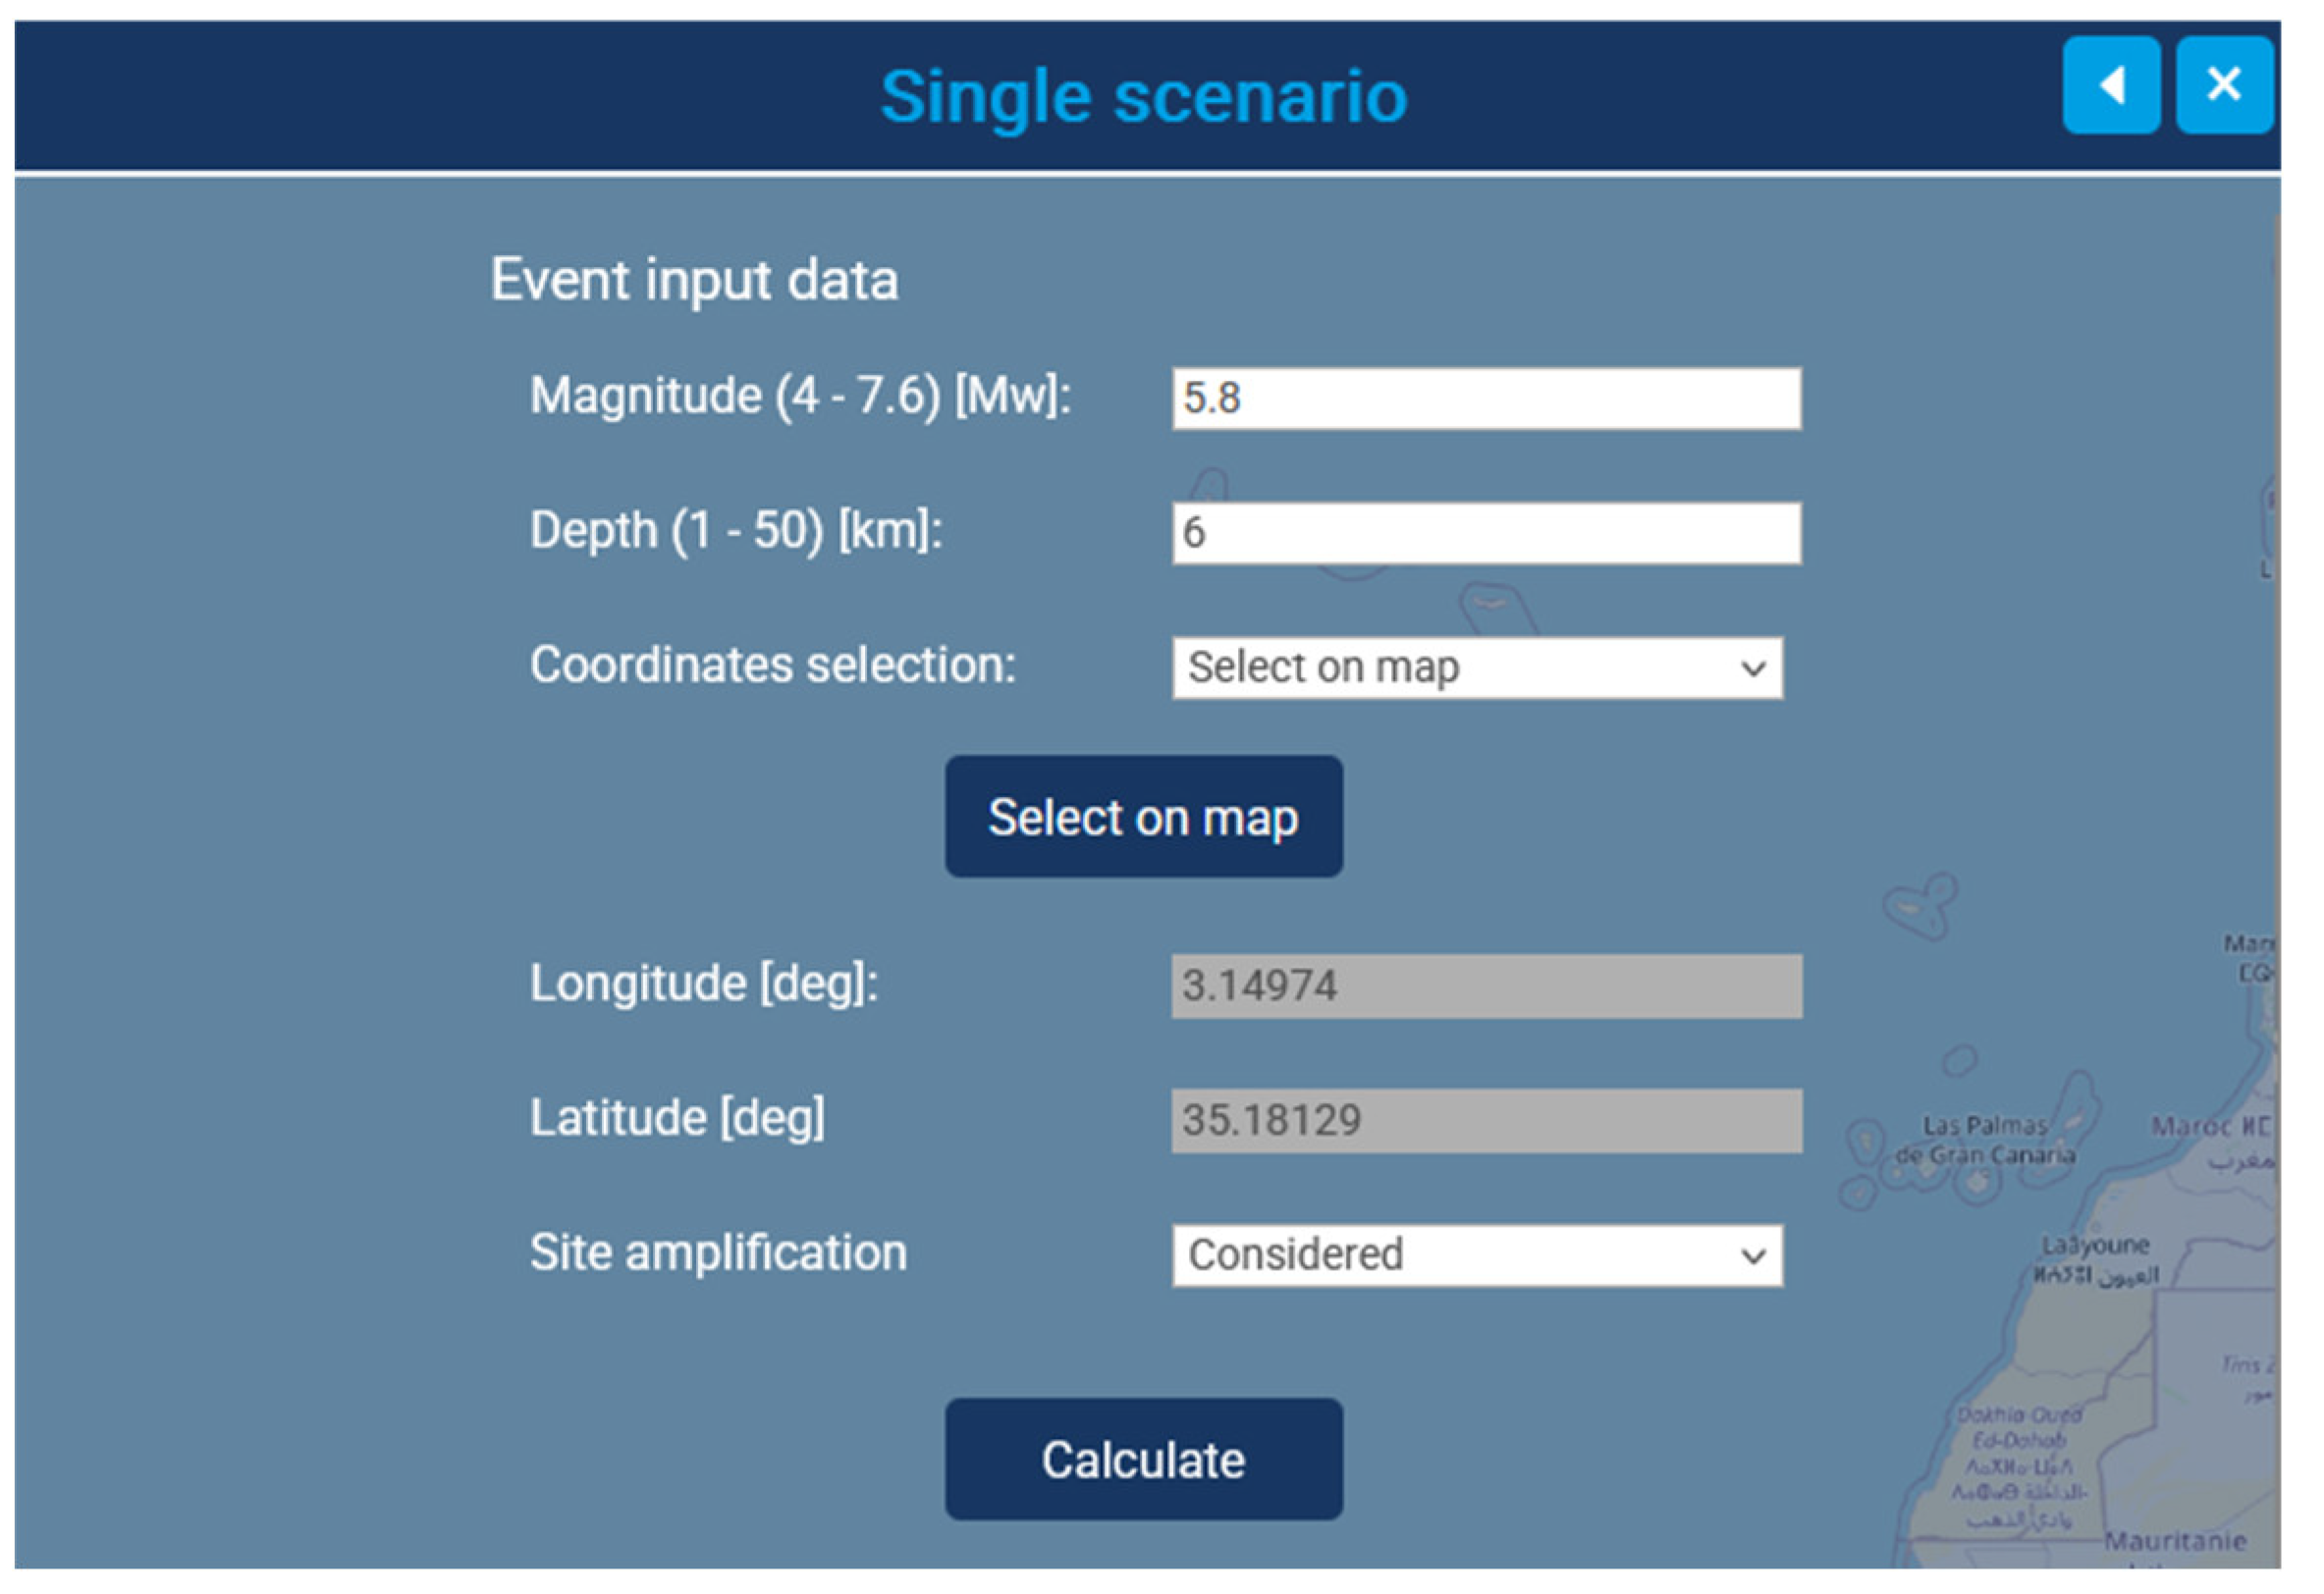
Figure 7.
Tool to elaborate Actual Scenario of Historical Event.
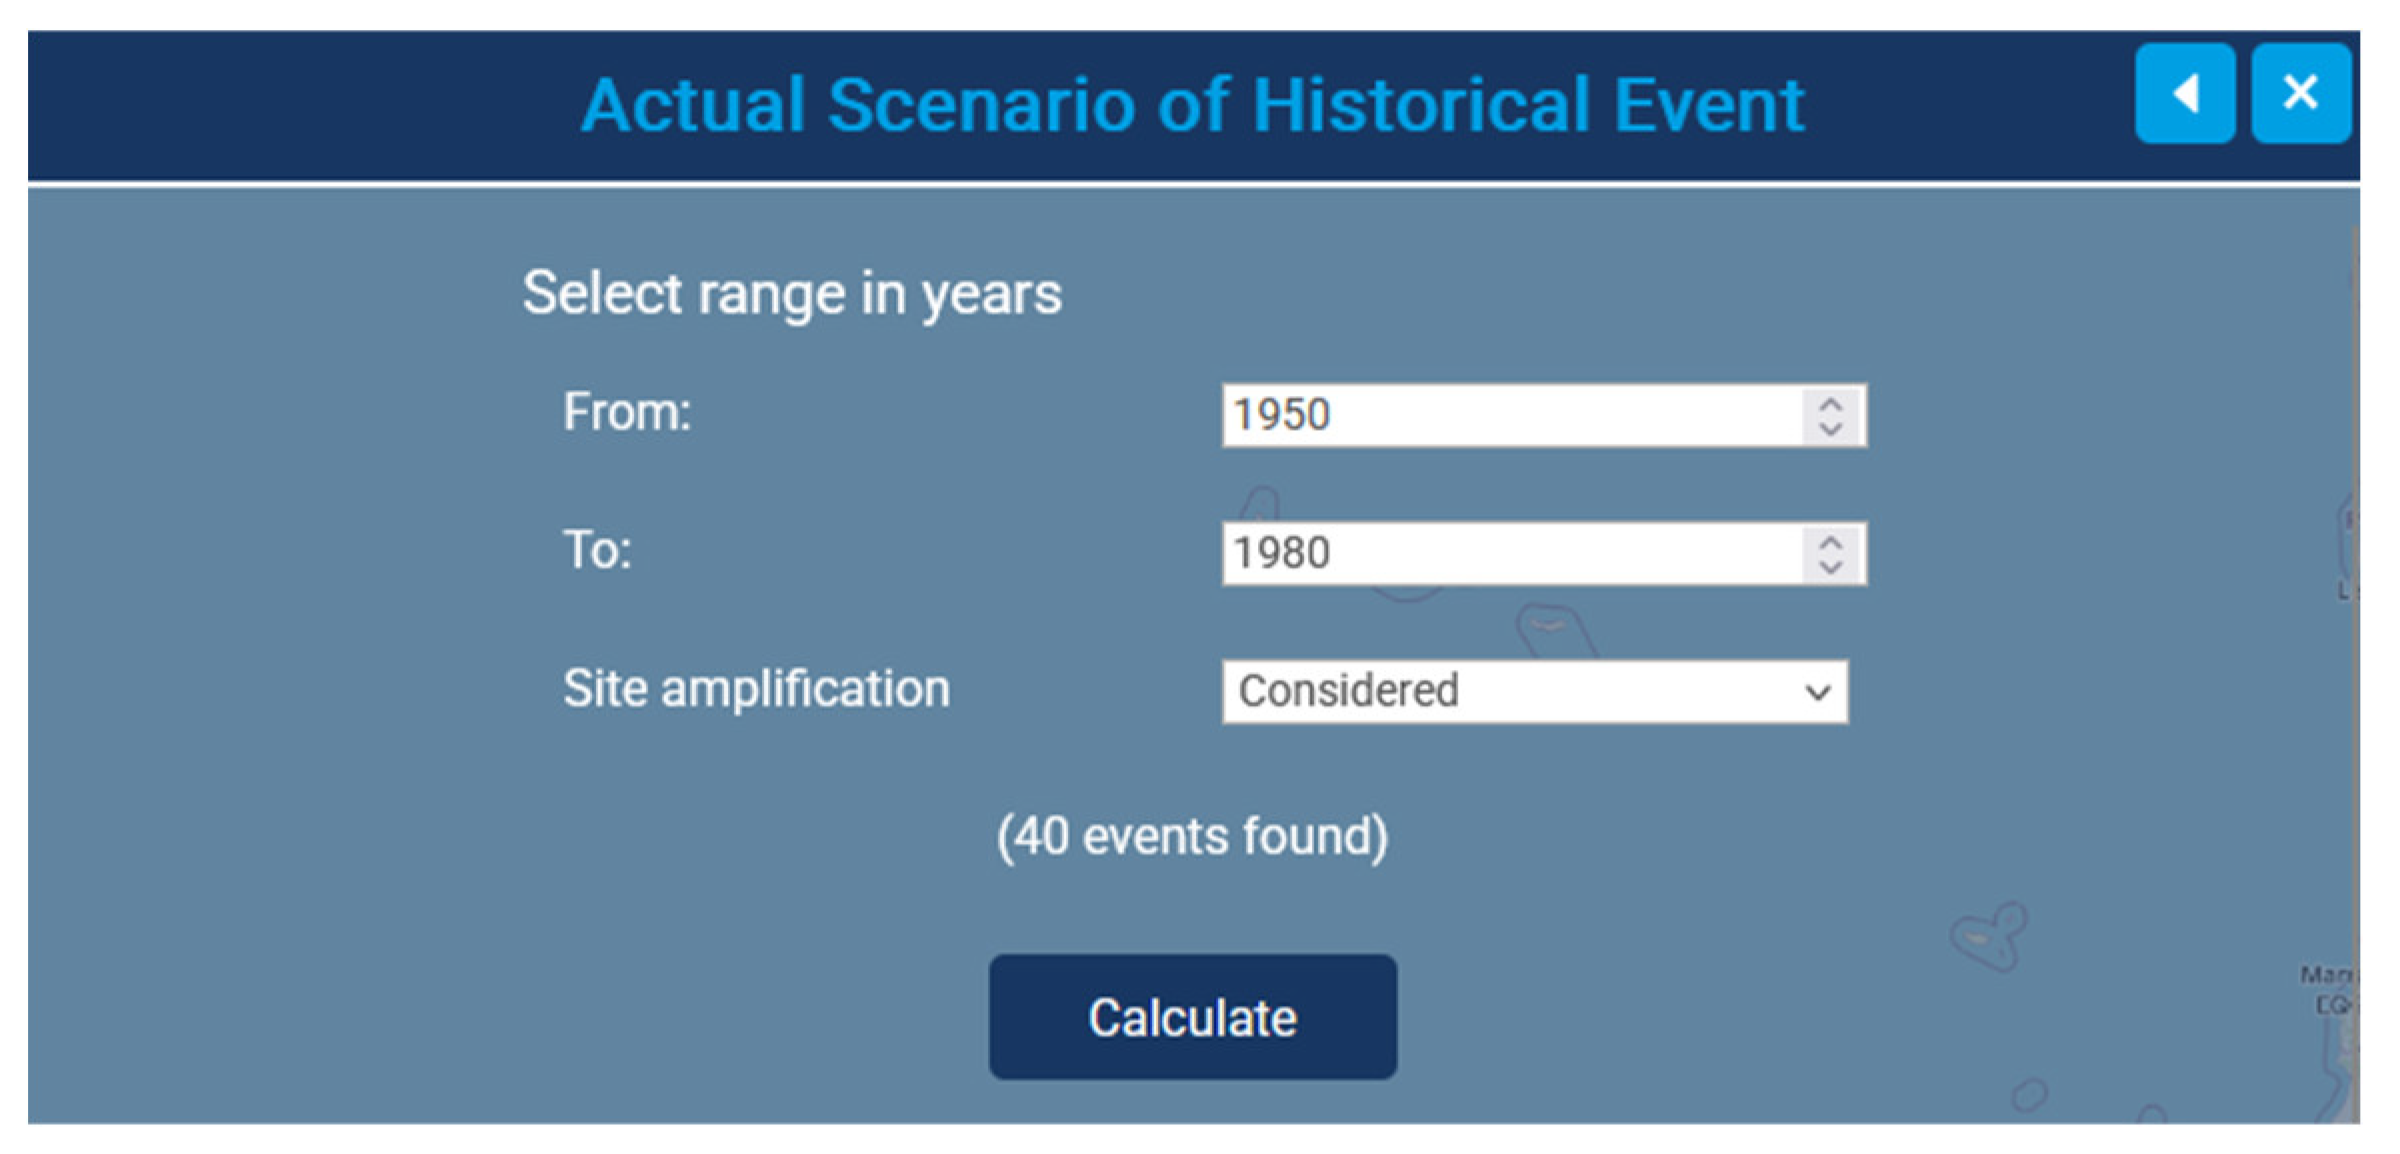
Figure 8.
Total economic losses for a given earthquake.
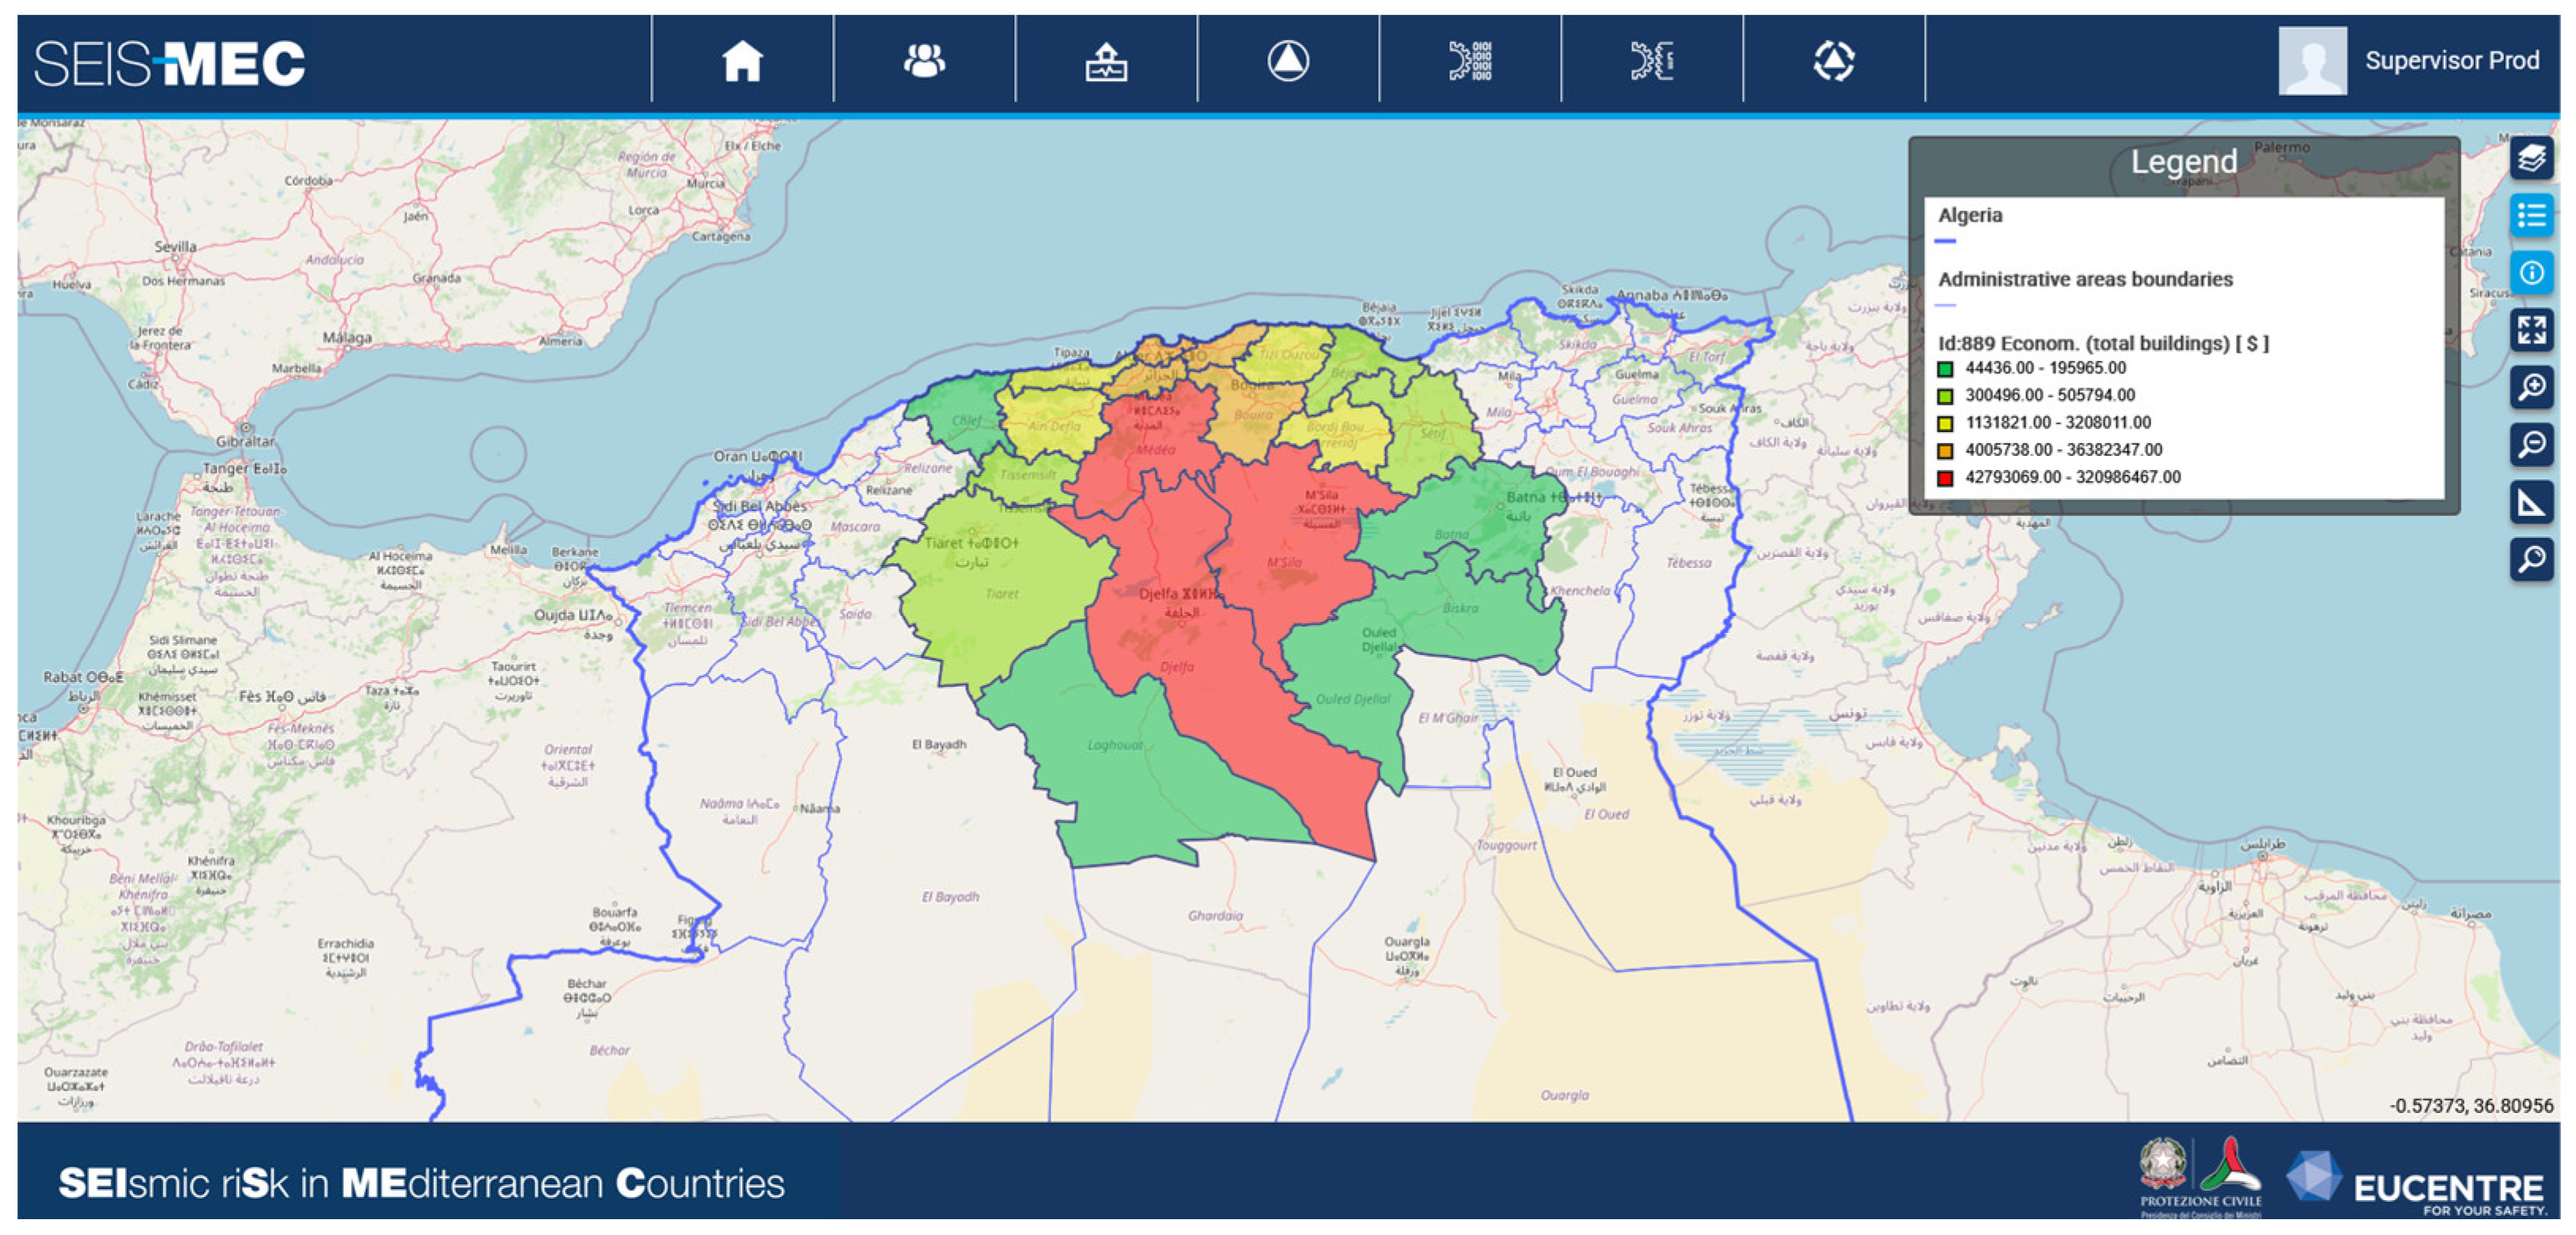
Figure 9.
Shakemap in terms of PGA for the 1967 event with magnitude 5.23.
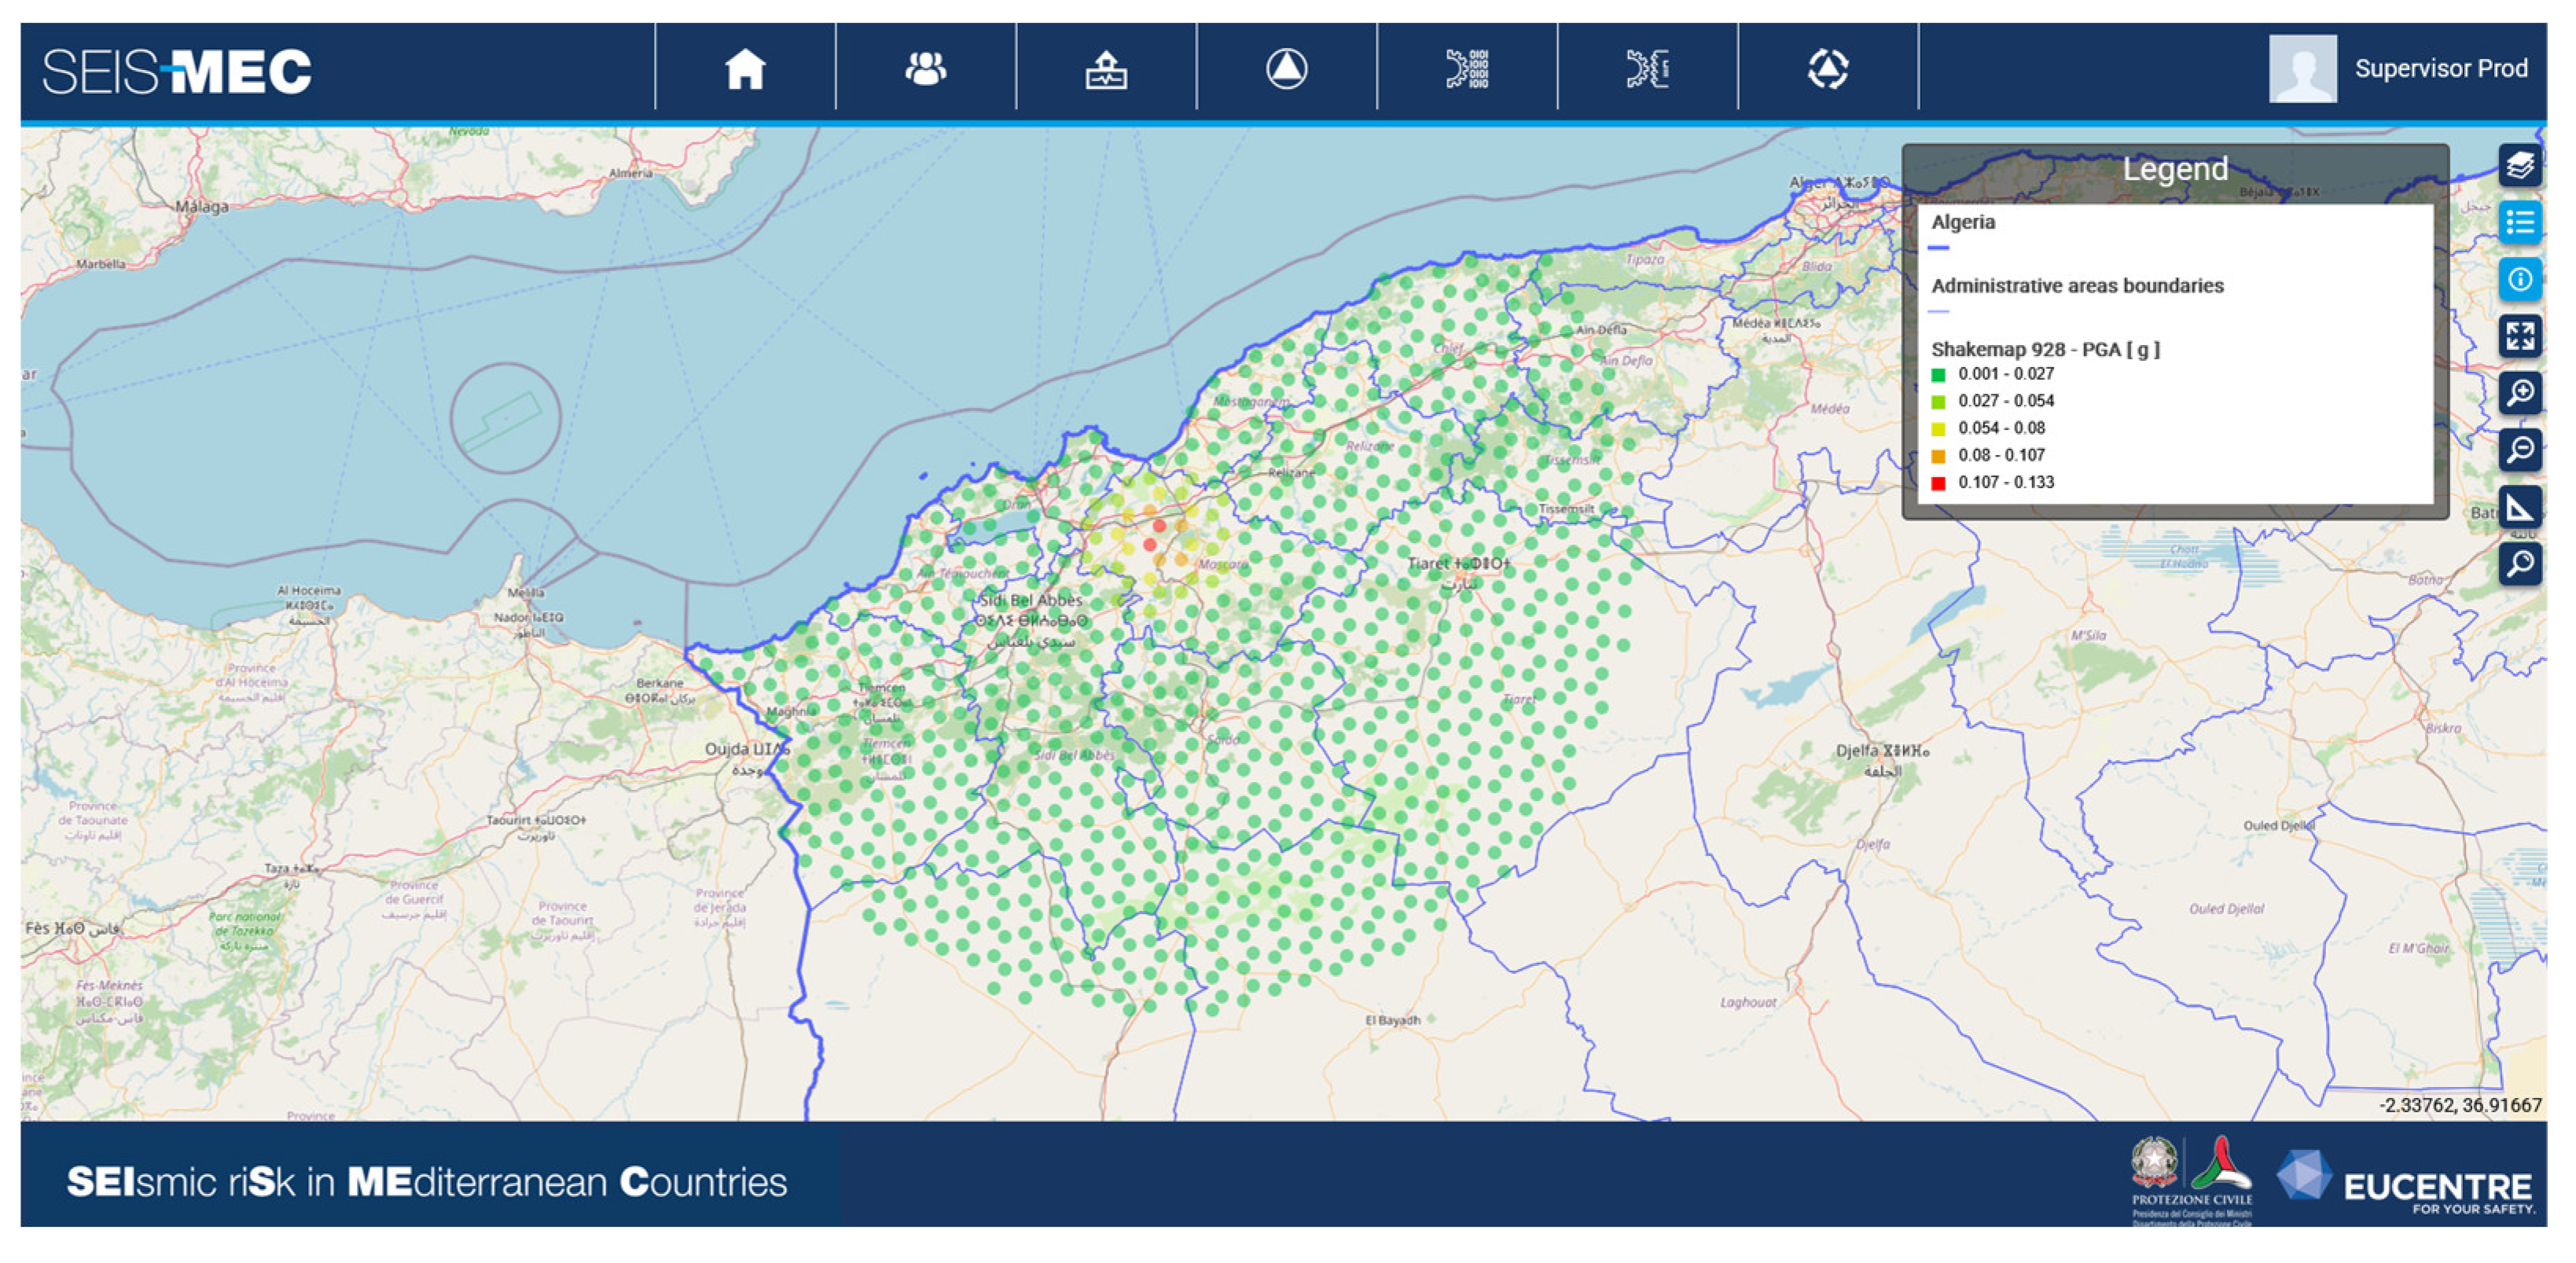
Figure 10.
Visualization of the scenario assessment in table.
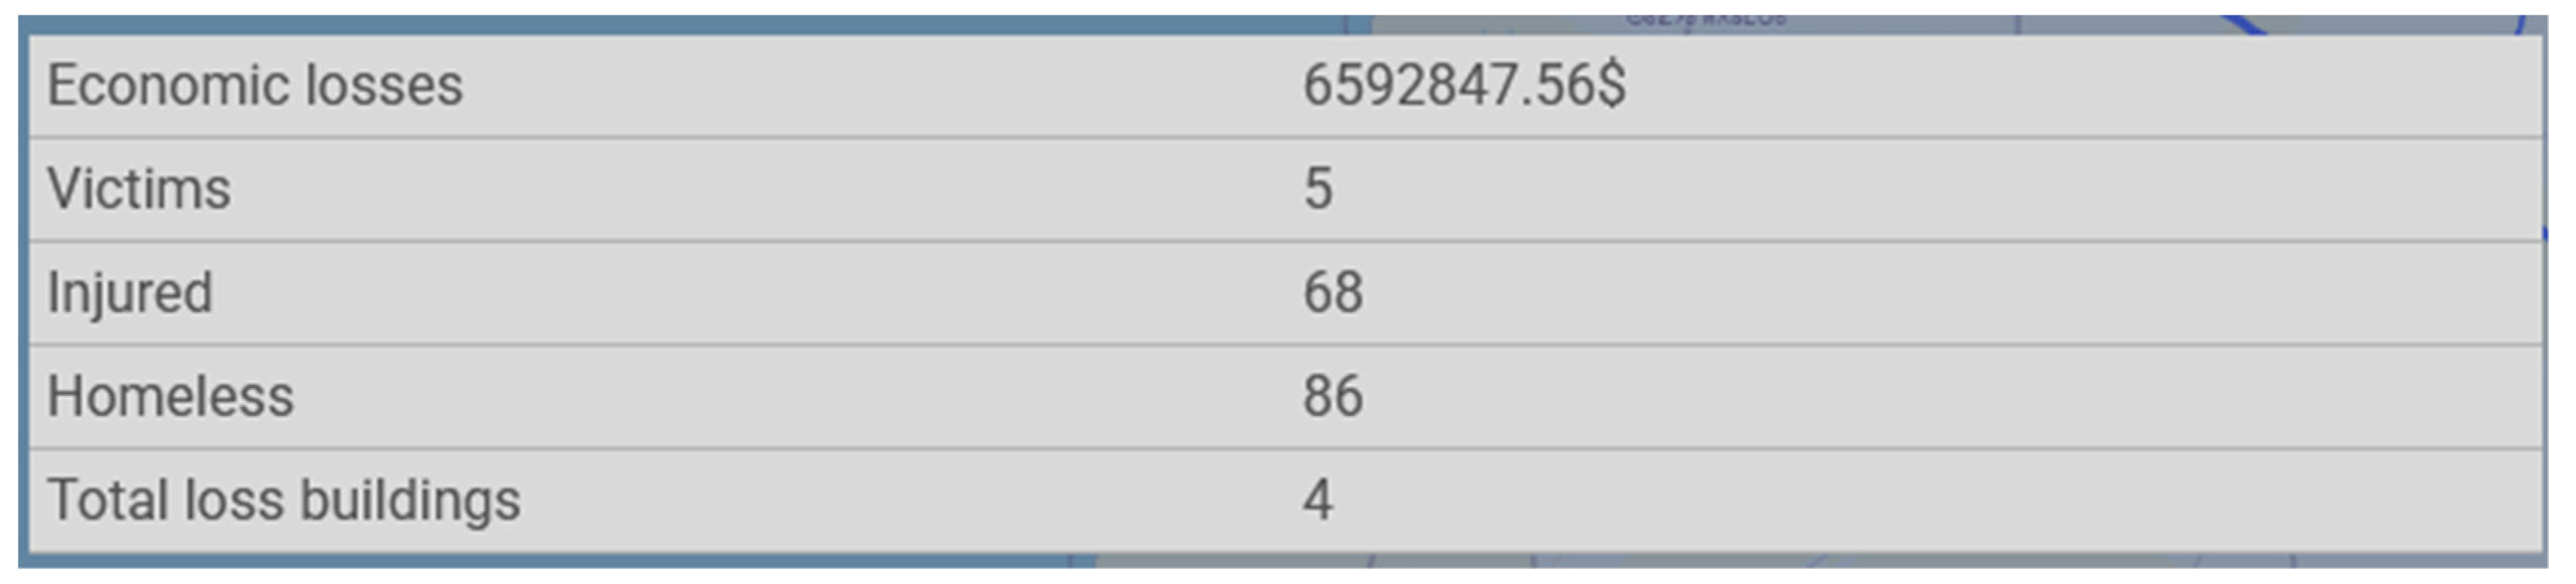
Figure 11.
Example of CSV output that can be downloaded from the platform.

Figure 12.
Download option for the navigation manual in 8 different languages.
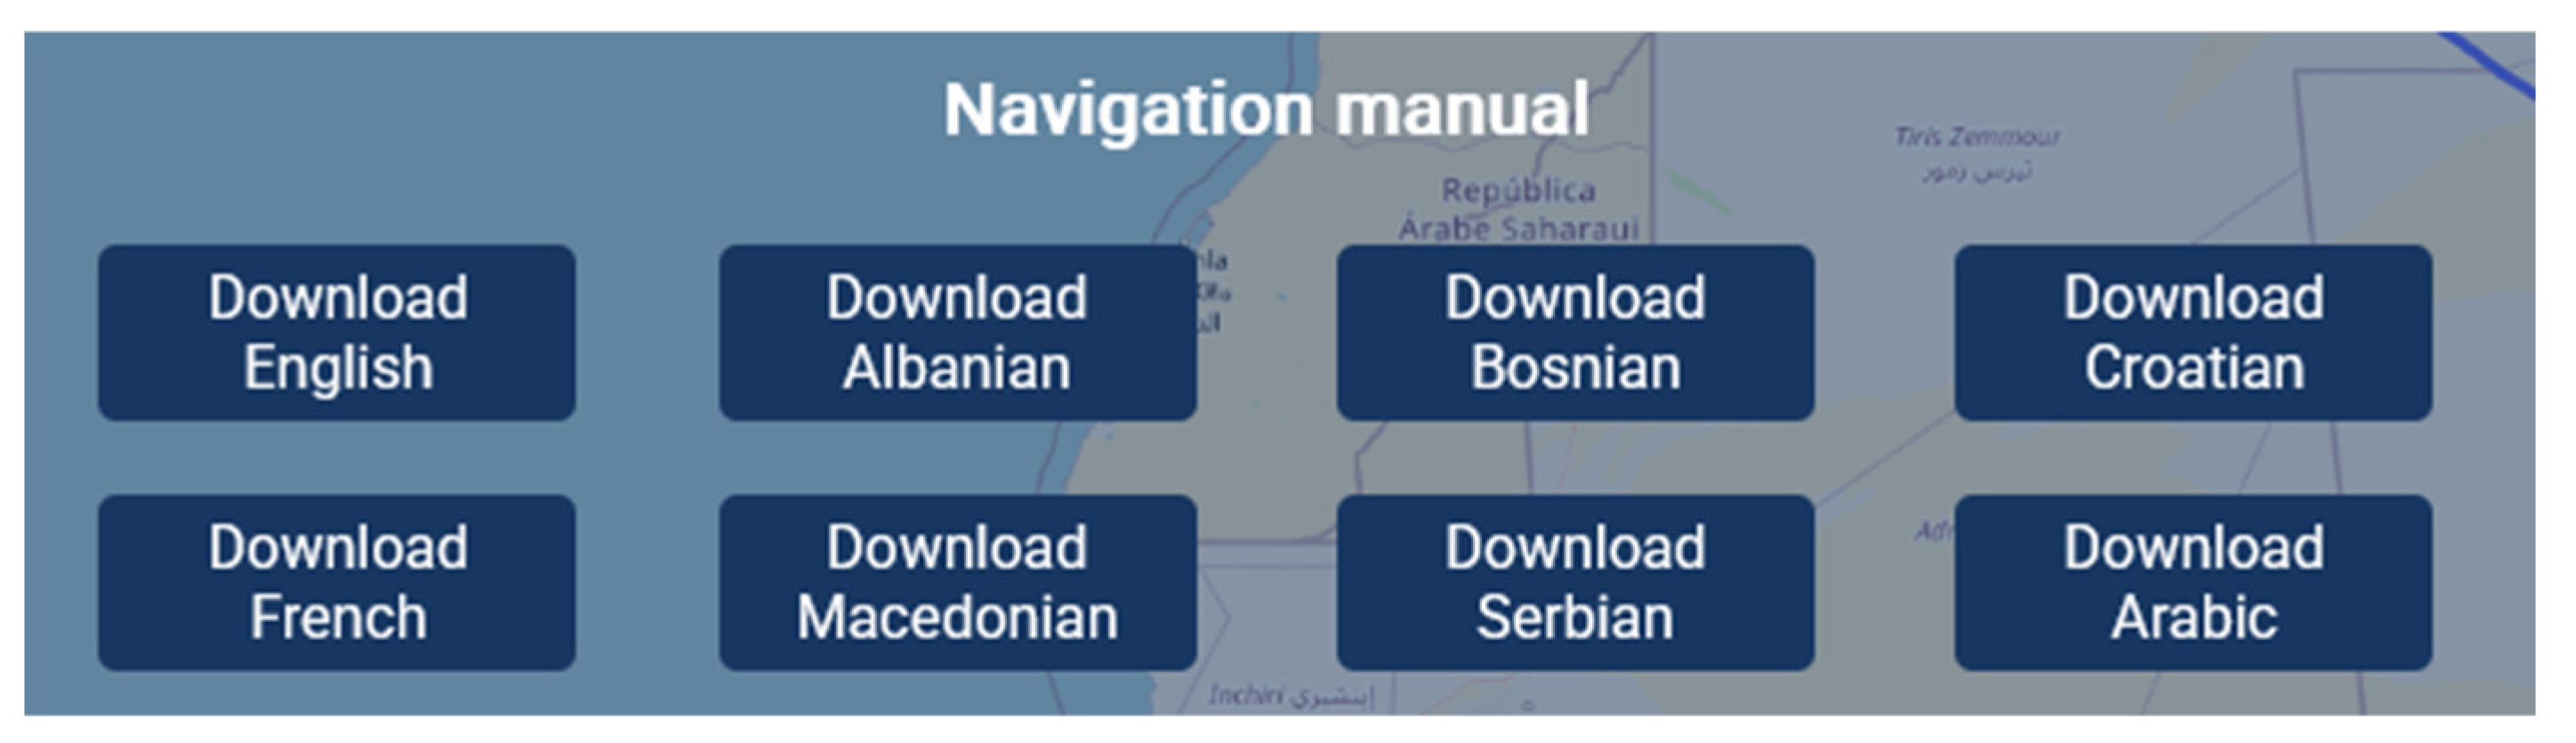
Figure 13.
Setting panel: language, map selection mode, and currency exchange rate.
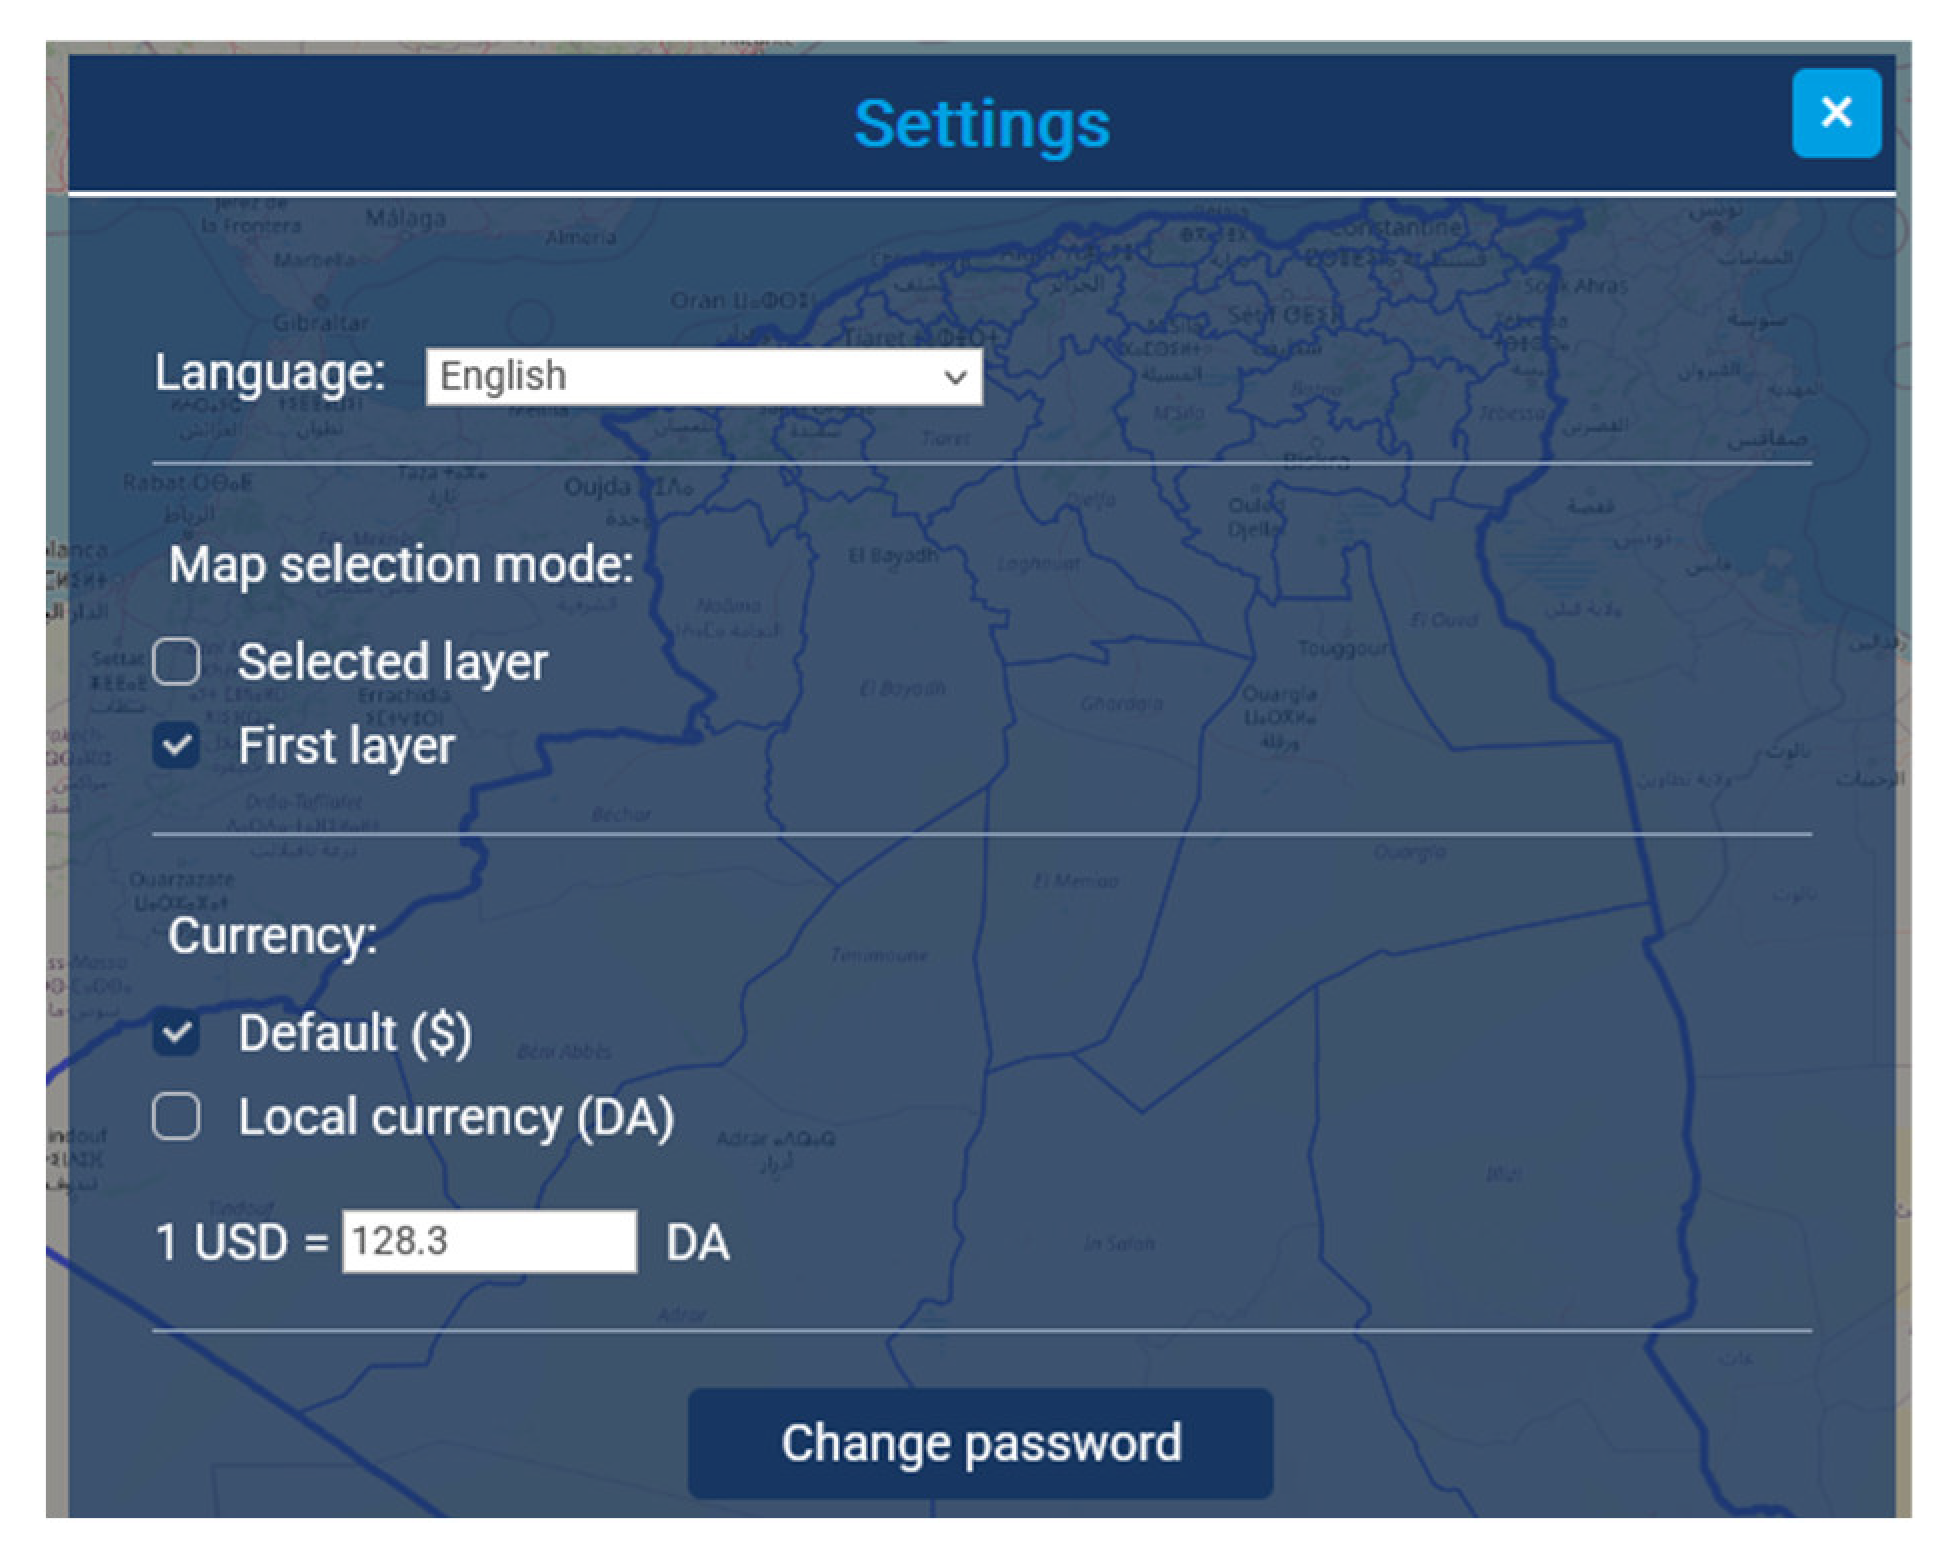
Figure 14.
Earthquake epicenters considered in the TTX.
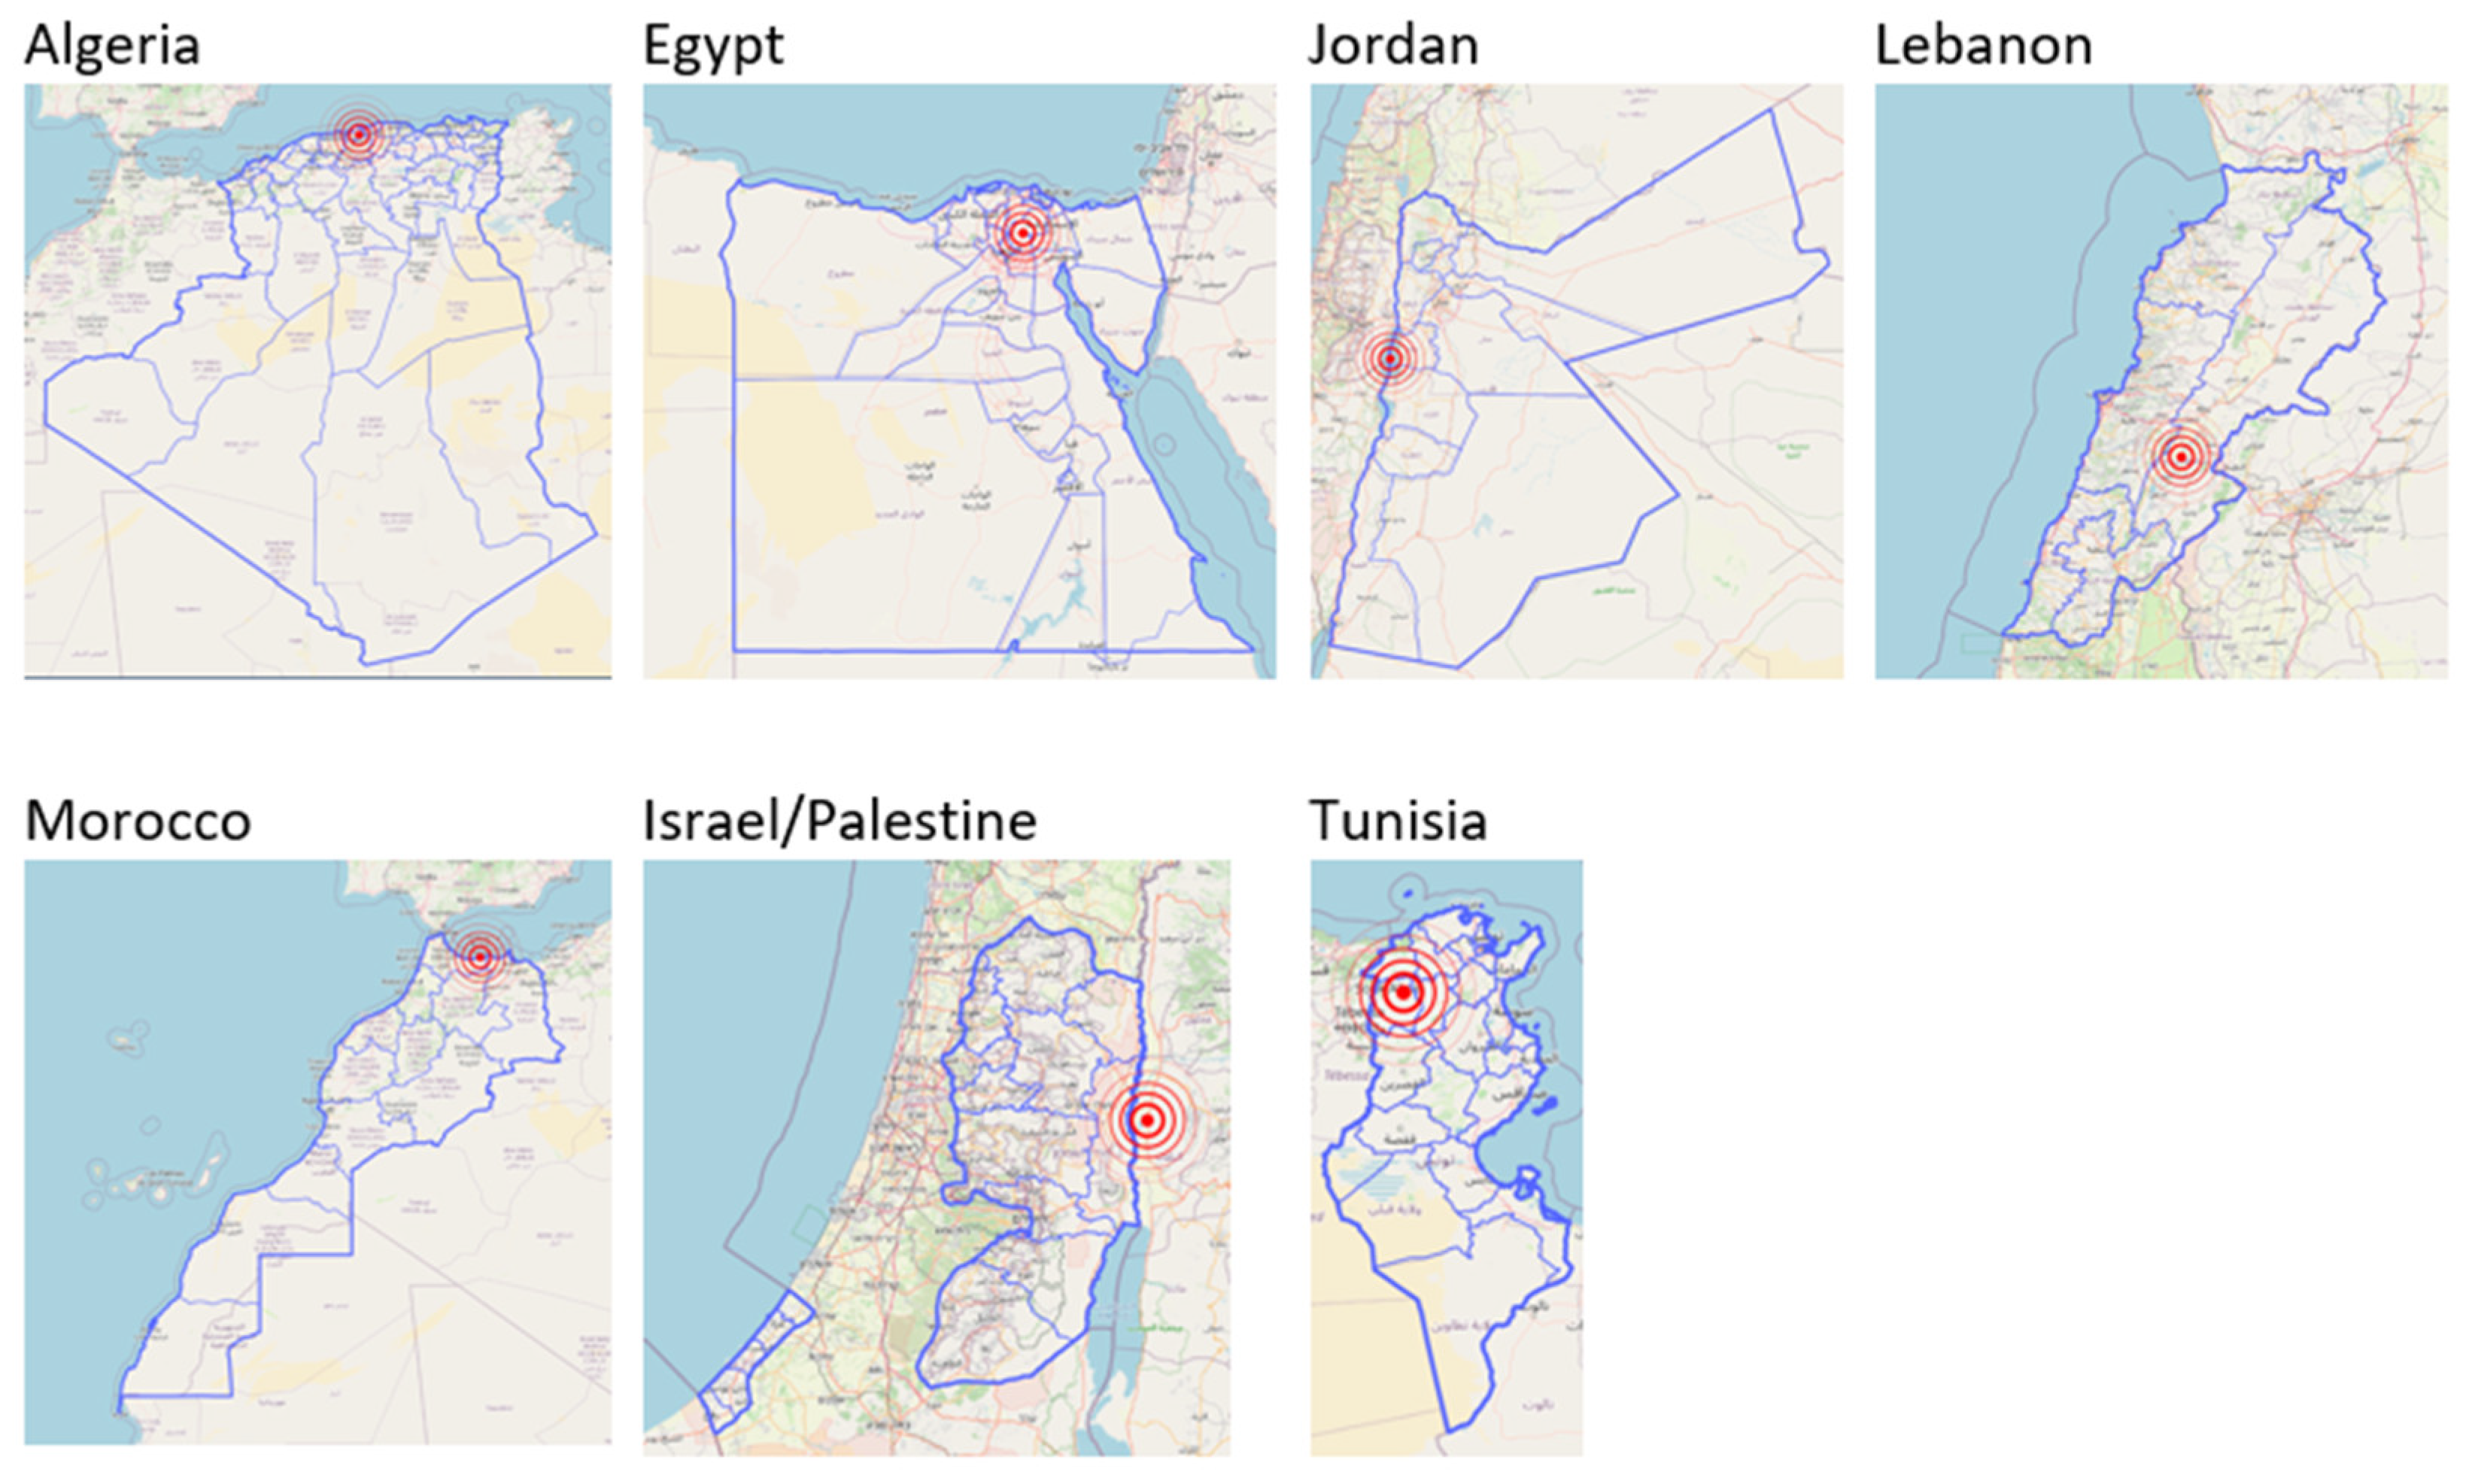
Figure 15.
Questions about population sheltering discussed during the TTX.
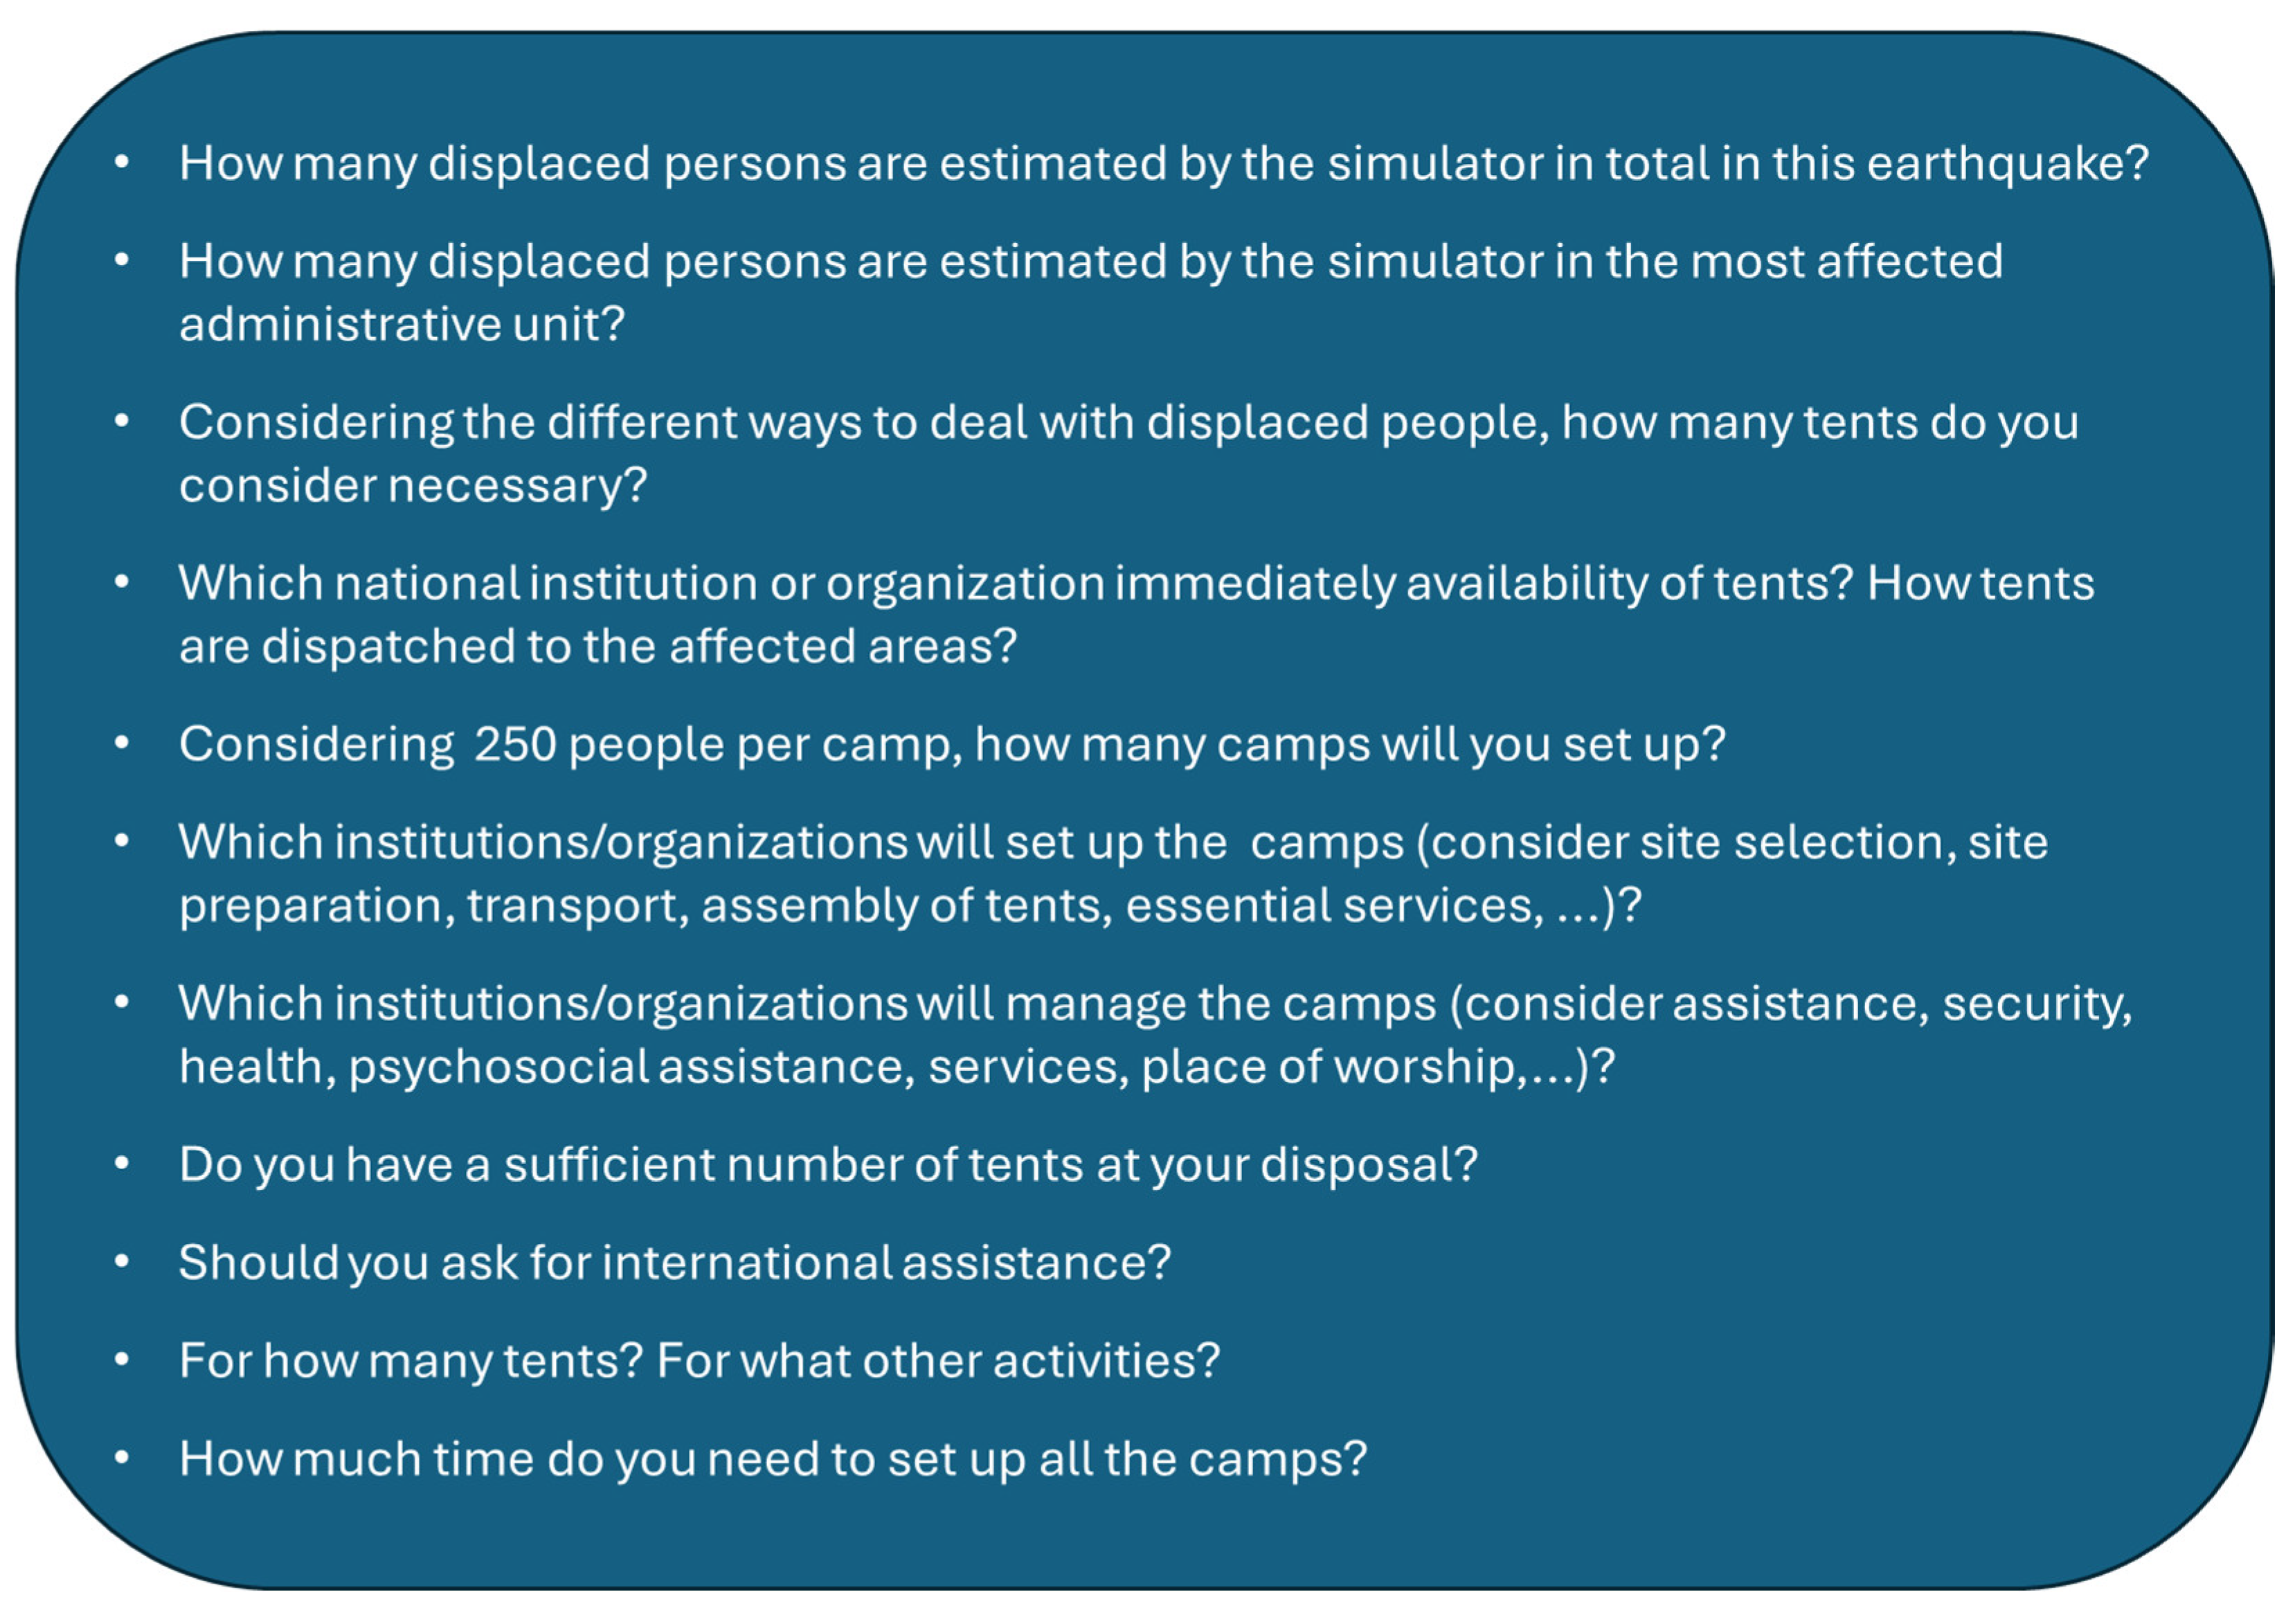
Figure 16.
Benefits of using real time seismic impact simulator for exercises.
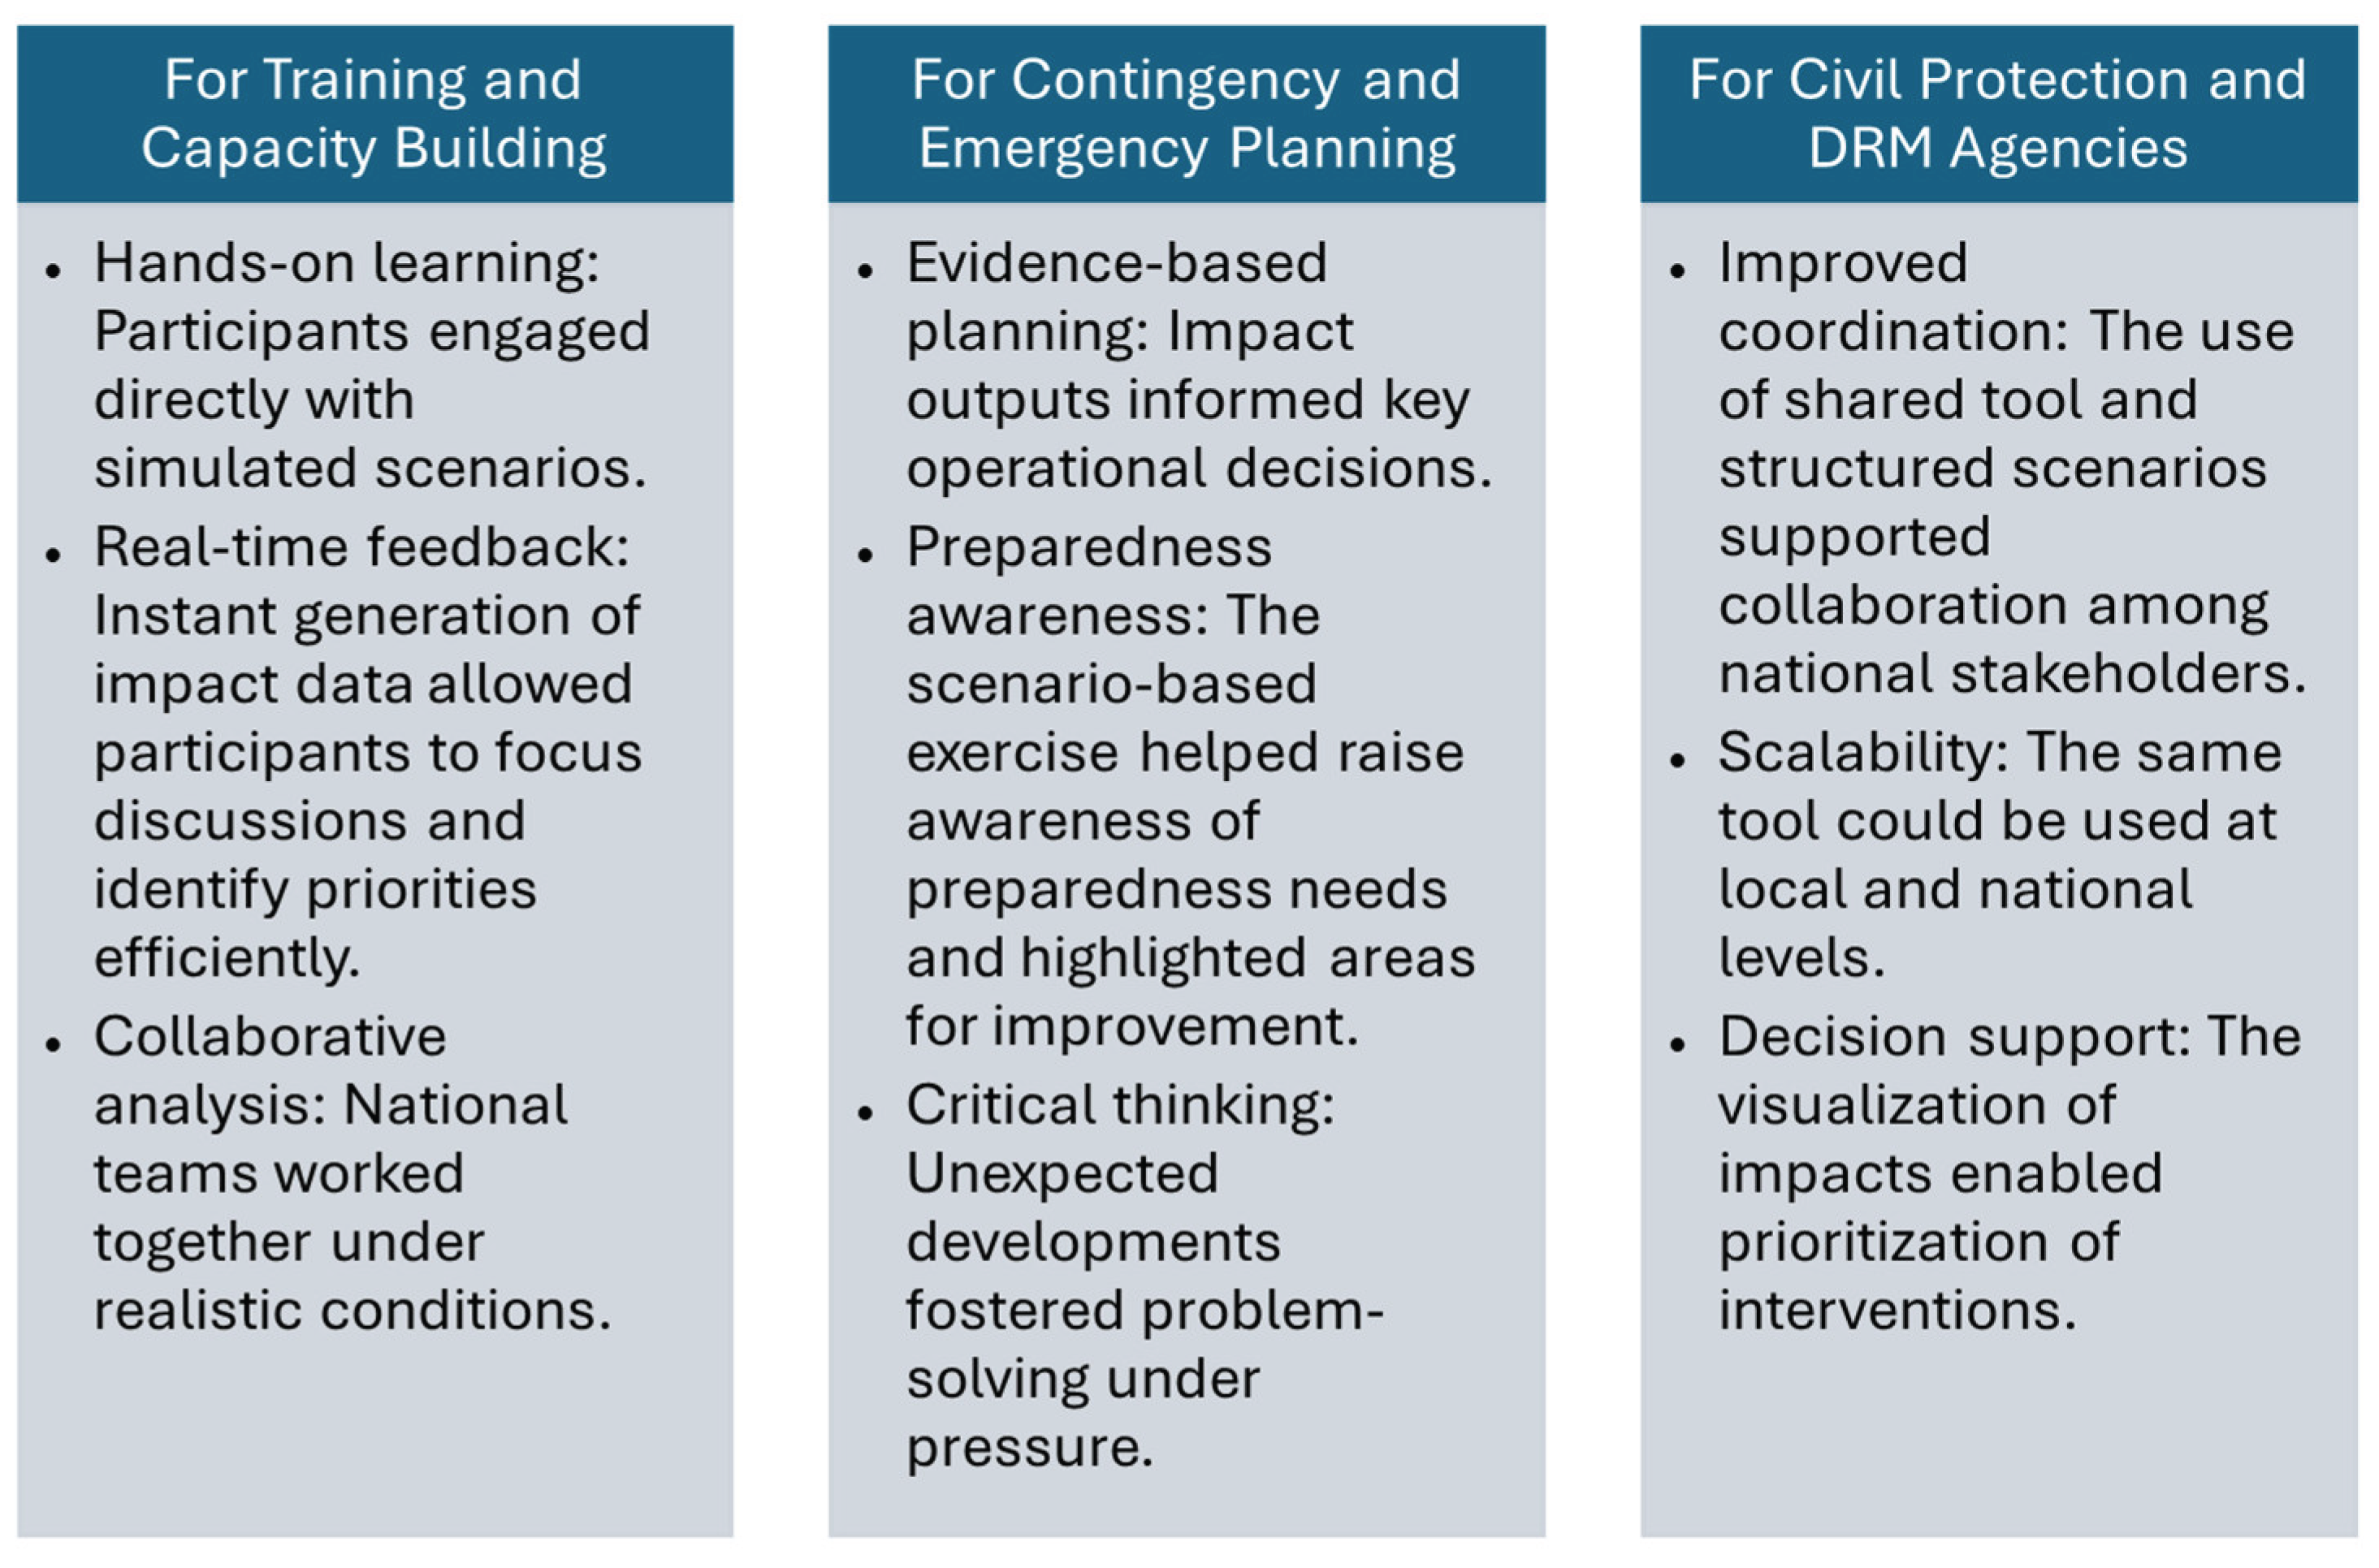

Table 1.
Description of the Tabs.
| Icon | Section | Description |
|---|---|---|
 |
Home | Provides general information, a disclaimer, and data sources. |
 |
Exposure layers | Allows users to add or remove layers representing elements exposed to risk, such as buildings, roads, and other assets. |
 |
Seismic data | Manages the visualization of seismic data layers, including hazard maps and historical seismic events. |
 |
Civil protection layers | Manages the visualization of the strategic buildings vital for emergency operations, like fire-fighting and police stations. |
 |
Single scenario | This tab is dedicated to the calculation and visualization of results for an earthquake scenario defined by the user through magnitude, epicenter, and focal depth. |
 |
Actual Scenario of Historical Event | Manages the selection of a set of historical seismic event from a specified time window (seismic catalogue), enabling the platform to calculate and visualize the impacts associated with all the selected event. |
 |
Emergency management | Manage the visualization of the response needs derived from previously calculated scenarios, such as the potential need for tent camps, advanced medical posts, or urban search & rescue (USAR) teams. |
Table 2.
Toolbar functionalities.
| Icon | Function | Description |
|---|---|---|
 |
Layers panel | Used to show/hide, select or delete layers. |
 |
Legend panel | The legends for the visible layers are displayed. |
 |
Info | Toggles the info function: when activated, clicking on a feature on the map selects it and displays a pop-up info window. When deactivated, clicking on the map has no effect. |
 |
Zoom extent | Display the full extent. |
 |
Zoom in | Zooms to a closer view. |
 |
Zoom out | Zooms to a wider view. |
 |
Measurement tool | Enables the measuring tool. Clicking on the map adds measurement points, and double-clicking displays a pop-up showing the distance in km. |
 |
Search | Opens the search panel. Two different search options are available: By municipality or by coordinates. |
Table 3.
Losses calculation default parameters.
| Type of losses | Parameters |
|---|---|
| Economic losses | 5% D1 + 30% D2 + 60% D3 + 100% D4 |
| Victims | 1% D3 + 10% D4 |
| Injured | 30% D3 + 85% D4 |
| Homeless | 40% D3 + 100% D4 |
Table 4.
Characteristics of the earthquakes considered in the TTX.
| Country | Magnitude (Mw) | Depth (km) | Longitude | Latitude | Event date |
|---|---|---|---|---|---|
| Algeria | 7.08 | 10 | 1.374 | 36.199 | 10th of October 1980 |
| Egypt | 5.77 | 23.3 | 31.138 | 29.746 | 12th of October 1992 |
| Jordan | 5.67 | 15 | 35.487 | 31.522 | 18th of December 1956 |
| Lebanon | 5.5 | 15 | 35.812 | 33.687 | 16th of March 1956 |
| Morocco | 6.34 | 12.2 | -4.016 | 35.232 | 24th of February 2004 |
| Israel/ Palestine | 6.13 | 15 | 35.579 | 32.031 | 11th of July 1927 |
| Tunisia | 5.51 | 15 | 8.836 | 36.232 | 20th of February 1957 |
Disclaimer/Publisher’s Note: The statements, opinions and data contained in all publications are solely those of the individual author(s) and contributor(s) and not of MDPI and/or the editor(s). MDPI and/or the editor(s) disclaim responsibility for any injury to people or property resulting from any ideas, methods, instructions or products referred to in the content. |
© 2025 by the authors. Licensee MDPI, Basel, Switzerland. This article is an open access article distributed under the terms and conditions of the Creative Commons Attribution (CC BY) license (http://creativecommons.org/licenses/by/4.0/).
Copyright: This open access article is published under a Creative Commons CC BY 4.0 license, which permit the free download, distribution, and reuse, provided that the author and preprint are cited in any reuse.


