Preprint
Article

This version is not peer-reviewed.

The Acute Effects of Fast Food Versus Mediterranean Meal on Autonomic Nervous System, Lung Function, and Airway Inflammation: A Randomized Crossover Trial

A peer-reviewed article of this preprint also exists.

Submitted:

07 January 2025

Posted:

08 January 2025

You are already at the latest version

Abstract

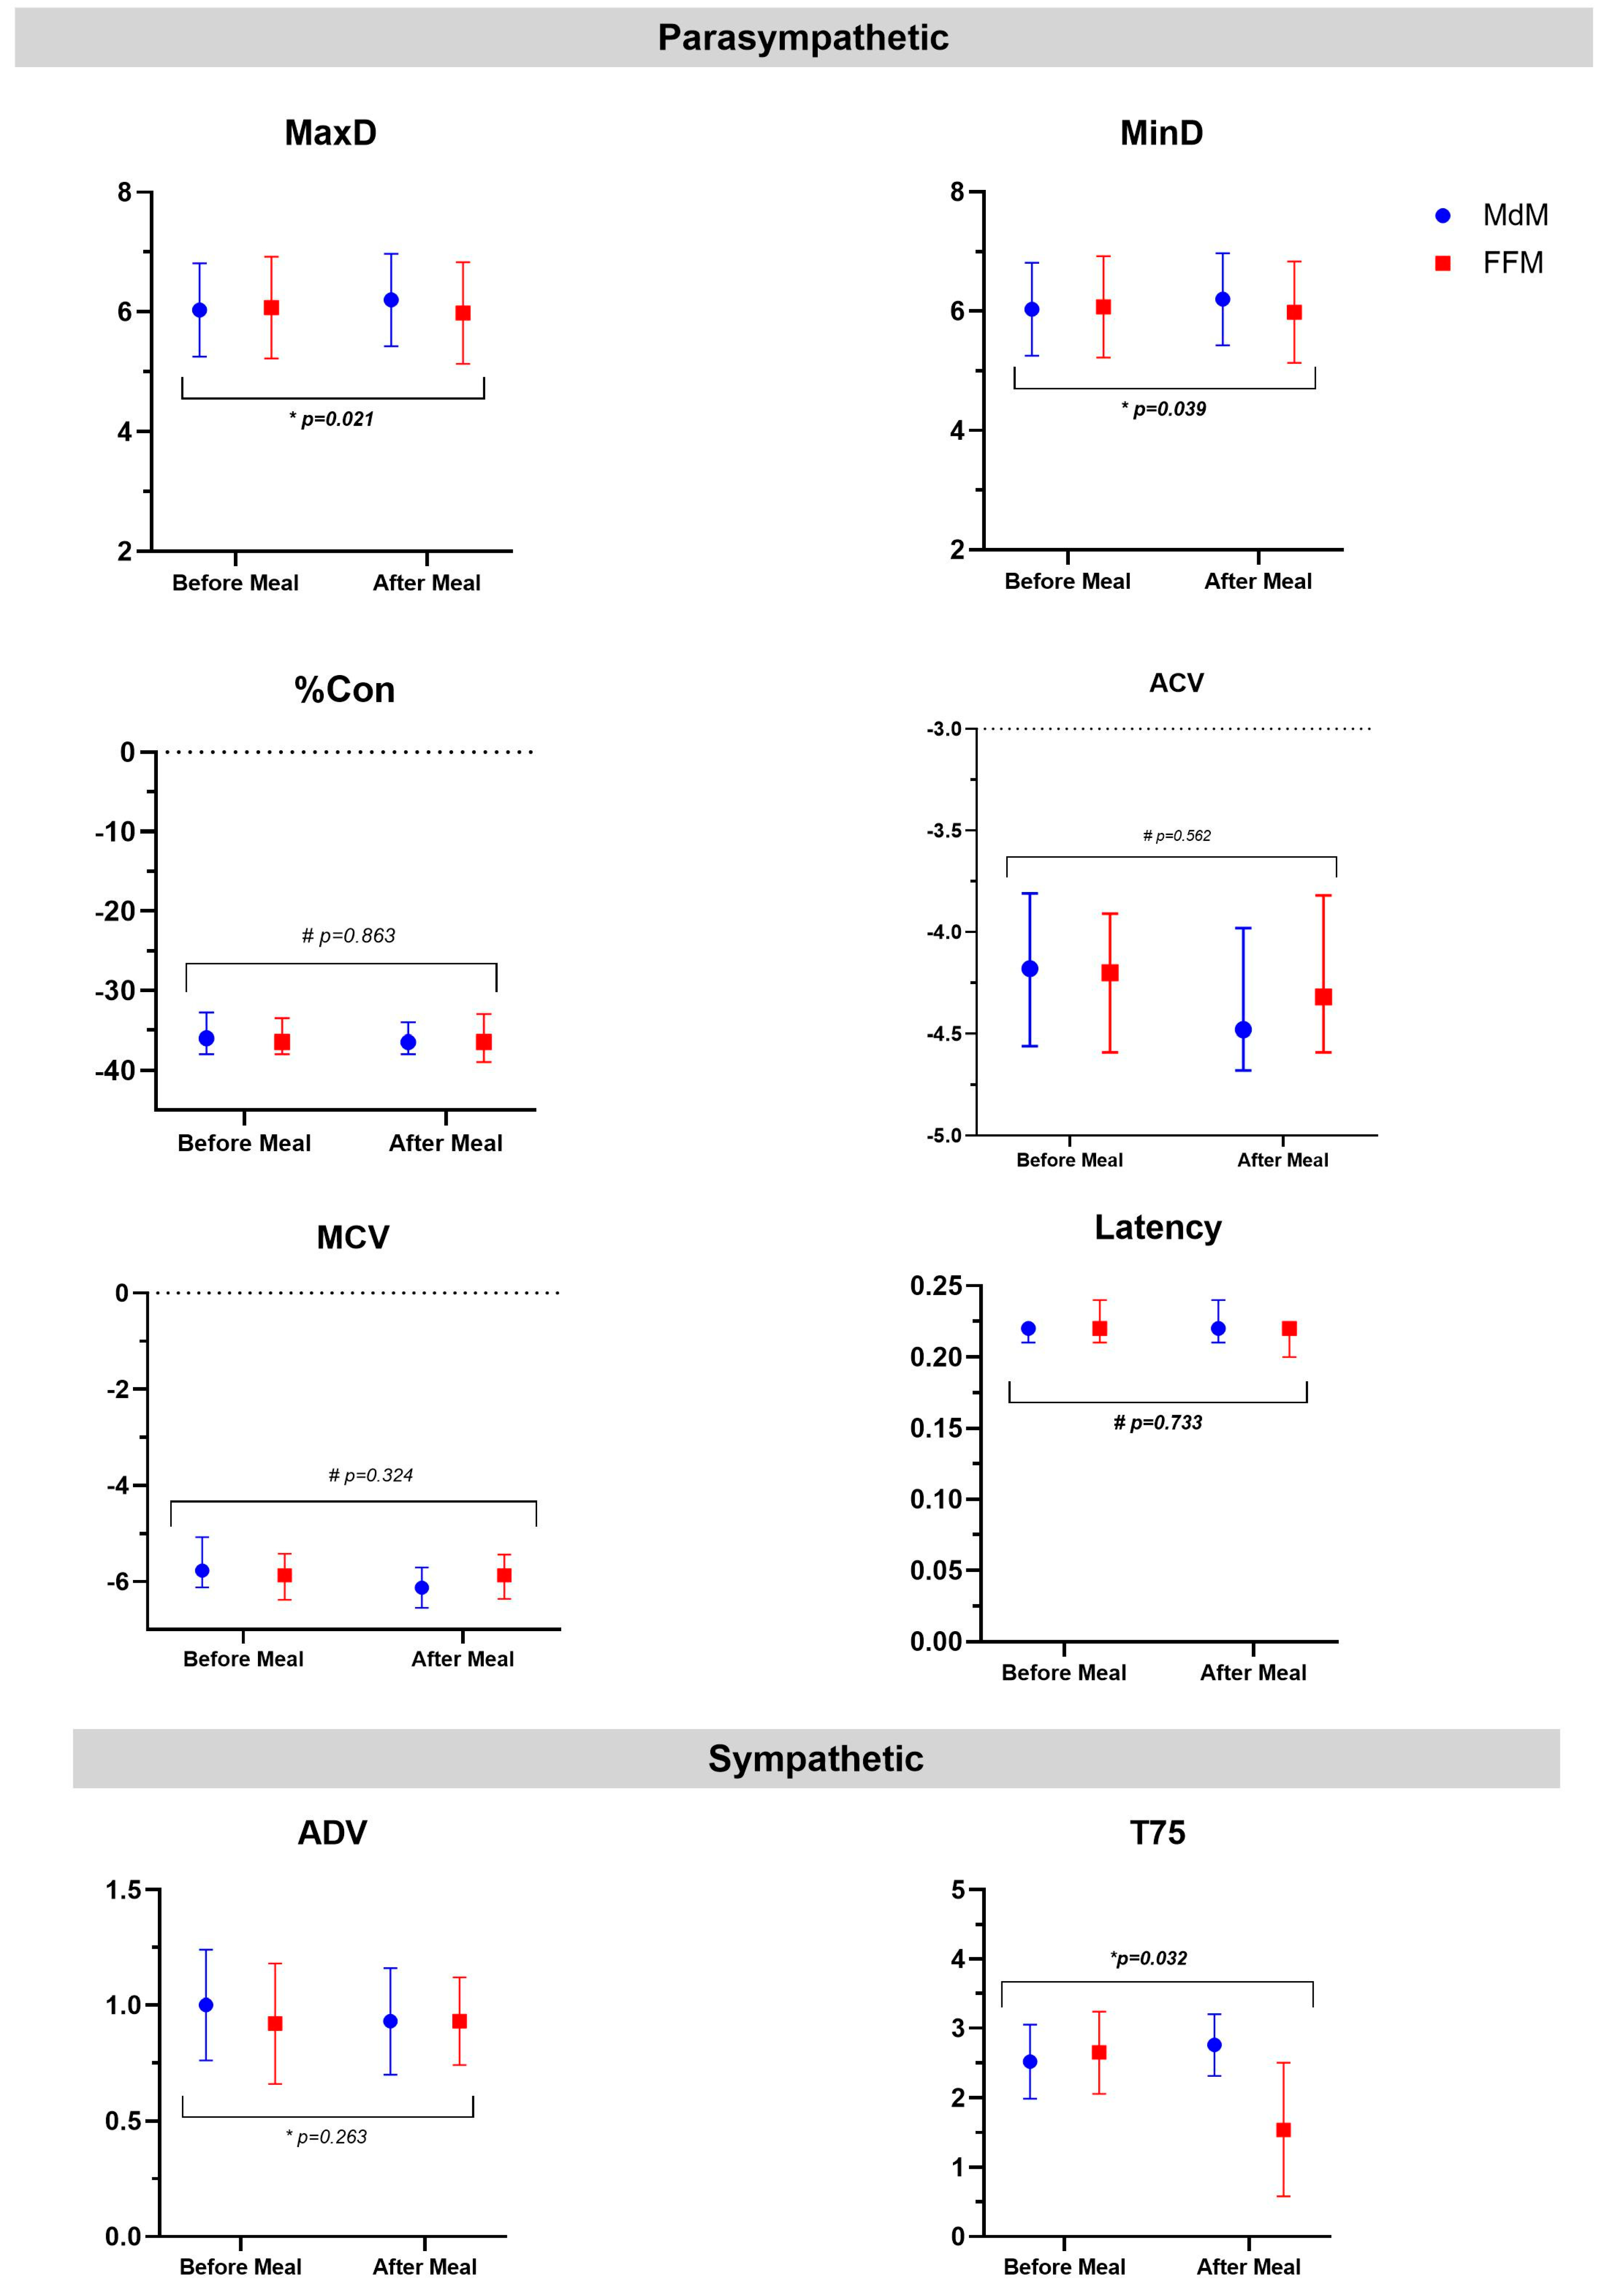
This study aimed to assess the acute effects of two isoenergetic but micronutrient-diverse meals—a Mediterranean-like meal (MdM) and a fast food-like meal (FFM)—on the autonomic nervous system (ANS), lung function, and airway inflammation response. Forty-six participants were enrolled in a randomized cross-over clinical trial, consuming two isoenergetic meals: FFM (burger, fries, and sugar-sweetened drink) and MdM (vegetable soup, whole wheat pasta, salad, olive oil, sardines, fruit, and water). Pupillometry assessed parasympathetic (MaxD, MinD, Con, ACV, MCV) and sympathetic (ADV, T75) nervous system outcomes. Lung function and airway inflammation were measured before and after each meal through spirometry and fractional exhaled nitric oxide (FeNO), respectively. Mixed-effects model analysis showed that MdM was associated with a hegemony of parasympathetic response, with a significant increase of MaxD associated with a faster constriction velocity (ACV and MCV); on the other side, the FFM associated with changes in the sympathetic response, showing a quicker redilation velocity (decreased of T75). After adjusting for confounders, mixed-effects models revealed that the FFM significantly decreased T75. Regarding lung function, a meal negatively impacted FVC (ae= -0.079, p<0.001) and FEV1 (ae= -0.04, p= 0.017); however, FeNO increased, although after adjusting, no difference between meals was seen. In conclusion, our study showed that FFM counteracted the parasympathetic activity of a meal, while a meal, irrespective of the type, decreased lung function and increased airway inflammation.

Keywords: 
;  ;  ;  ;  ;  ;  

1. Introduction

Diet plays a pivotal role in modulating airway inflammation [1], lung function [2, 3], and the autonomic nervous system [4]. In particular, the Western diet, high in saturated fatty acids (SFA) and low in antioxidants, has been associated with increased inflammation and poorer lung outcomes in individuals with asthma [1]. Conversely, the Mediterranean diet (MdM), which is rich in unsaturated fatty acids, fiber, and antioxidants, has been demonstrated to reduce the prevalence and persistency of asthma[5], and adherence to this type of diet was associated with improved lung function [6].
Beyond lung function, the autonomic nervous system (ANS) plays a crucial role in regulating the body's response to both internal and external stimuli [7], interacting with immune responses through the gut-brain axis [8], stress regulation, fatigue, anxiety [9], and neuroendocrine functions[10]. Obesity [11] and environmental exposures[12, 13] modulate ANS. Dietary habits [14] are also known to affect ANS function. Specifically, both ketogenic and vegetarian diets were shown to modulate ANS activity [15], and dietary patterns characterized by consuming sugar beverages modulated autonomic nervous system behavior [16].
Lung function and the ANS are closely interconnected, particularly in asthma [13, 17]. The ANS regulates airway smooth muscle tone, bronchoconstriction, and mucus secretion. In this context, studies have shown that dietary or lifestyle interventions can modulate ANS responses and may impact respiratory outcomes. Specifically, long-term response to diet and exercise-based weight loss increased parasympathetic and decreased sympathetic activity, while the opposing effects were observed with weight gain [11]. On the other hand, the ANS response to a meal may differ according to physical activity level [18] and obesity [19].
Meal content induces different inflammatory responses; an MdM was shown to reduce postprandial ox-LDL, inflammation expression, and oxidative stress-related genes [20, 21]. Also, the fat level in a meal was shown to increase airway inflammation [22], an effect that was counteracted by omega-3 supplementation. Nevertheless, the impact of a single meal has yet to be well studied, both in evaluating lung function, airway inflammation, and the ANS response. Therefore, we hypothesized that the content of a meal might induce different inflammatory responses that might be linked to lung function and the autonomic nervous system.
Given the potential of different diets to influence airway inflammation, lung function, and ANS, this study aimed to assess the acute effects of two isoenergetic but micronutrient-diverse meals—a Mediterranean-like meal (MdM) and a fast food-like meal (FFM)—on lung function and airway inflammation, but also on ANS response, as measured by pupillometry. Pupillometry, which is a simple and non-invasive method [23], has gained clinical relevance for assessing ANS function [24] and has been used alongside resting heart rate and heart rate variability to evaluate ANS response [24-26].

2. Materials and Methods

2.1. Participants and Study Design

In this randomized, double-blinded, cross-over clinical trial, individuals aged 18 to 35 years with or without asthma diagnosis who were either overweight/obese (BMI ≥25 kg/m²) or healthy with a normal BMI (18.5–24.9 kg/m²), were eligible to participate. Participants were recruited through trial posters on bulletin boards, newspapers, and internet advertisements and during hospital visits, as previously described [27]. Participants were excluded if they met any of the following criteria: having a respiratory disease other than asthma (except for severe asthma according to GINA guidelines), major systemic diseases (including diabetes, cardiac arrhythmia, angina, congestive heart failure, abnormal electrocardiogram, renal or hepatic failure, malabsorption disease, intestinal inflammatory disease, chronic infectious diseases), or if they were women who were breastfeeding, pregnant, or intending to become pregnant. Additional exclusion criteria included inability to comply with study and follow-up procedures, dietary restrictions (e.g., food allergies, vegetarianism), or being on a weight-loss diet within the three months preceding the study. Seven dropouts occurred during the trial: five due to unavailability to attend the visits before any interventions, two before the second meal—one due to unrelated adverse events unrelated to the intervention, and the other due to an inability to attend the study visits.
Ultimately, 46 individuals were enrolled and randomly assigned to two different micronutrient isoenergetic meals, separated by a 7-day washout period.

2.2. Intervention Protocol

All participants underwent a baseline visit and two interventions, separated by a 7-day washout period. Participants were asked to maintain their usual dietary and physical activity levels during the follow-up and study intervention. On the days of both interventions, participants were requested to have the same breakfast simultaneously to minimize residual effects from breakfast, avoiding coffee or caffeine-containing products. Smokers were asked to abstain from smoking for 12 hours before the meal. Additionally, participants were asked to abstain from alcohol consumption during the seven days preceding the intervention. After each meal, participants were not allowed to eat or drink and were instructed to refrain from physical activity. No significant differences were observed between allocation order in those participating in the protocol [27].
This study was approved by the Ethics Committee of the Faculty of Medicine Porto University, and participants provided written informed consent.

2.2.1. Fast Food and Mediterranean Meal

The fast food meal (FFM) was obtained from a typical restaurant, consisting of a burger with bread, fries, and a sugar-sweetened drink. Nutritional data provided by the food manufacturer indicated the meal contained [total energy (TE): 1026 kcal, carbohydrates: 126g, protein: 31g, and total fat: 43g (12% SFA)] [27].
The Mediterranean meal (MdM) was prepared in an experimental kitchen using a standardized recipe. It was isoenergetic and aligned with the Dietary Reference Intakes (DRI) for macronutrient distribution: carbohydrates 45-65% (added sugars <25%), protein 10-35%, and fat 20-35% of TE [polyunsaturated fatty acids (PUFA): 5-10%, monounsaturated fatty acids (MUFA): 0.6-1.2%, cholesterol and SFA “as low as possible”) [28]. The MdM included critical features of the Mediterranean diet, specifically a spinach and chickpea soup, whole wheat pasta and bread, fresh tomatoes with a green salad (arugula and lettuce), olive oil, herbs, sardines, fruit (apple, orange, and dried figs), walnuts, and 40 cL of water as a beverage. Nutritionally, this meal had a TE of 1019 kcal, with 40g of fat (10.3% SFA), 132g of carbohydrates, and 37g of protein. The nutritional data were estimated using the Portuguese Food Composition Table (National Health Institute Doutor Ricardo Jorge, IP).
Nutritional characterization of FFM and MdM has been previously described in detail[27].

2.3. Outcomes Assessment

Outcome measurements were obtained immediately before and 3 hours after each meal intake. These measurements included airway inflammation, assessed via fractional exhaled nitric oxide (FeNO), lung function through spirometry, and autonomic nervous system function, evaluated by pupillometry.

2.3.1. Airway Inflammation

Airway inflammation was assessed by measuring the FeNO using an electrochemical sensor, the NObreath® analyzer (Bedfont Scientific, Kent, England). The procedure involved participants exhaling at a rate of 50 ml/s for 10 seconds, ensuring a steady flow for at least the last 6 seconds of the maneuver. The average of three separate measurements was taken to determine the final concentration of exhaled nitric oxide, expressed in parts per billion (ppb), by the American Thoracic Society/European Respiratory Society (ATS/ERS) guidelines [29-31].

2.3.2. Lung Function

Lung function was assessed through spirometry using a portable Spirolab spirometer (MIR®, Italy; WINSPIROPRO® software) by ATS data collection standards [32]. Lung function values included forced expiratory volume in the first second (FEV1), forced vital capacity (FVC), forced expiratory flow between 25% and 75% of FVC (FEF25–75%), and peak expiratory flow (PEF). Measurements were considered valid if they met or exceeded the ATS acceptability and reproducibility criteria, specifically: having three acceptable curves present, with two reproducible curves and two observed values within 100 ml, or having three acceptable curves present and two reproducible curves with two observed values within 150 ml [33].

2.3.3. Autonomic nervous system

To evaluate the effect of the meals on the ANS, pupillometry was carried out with a portable infrared PLR-200 pupillometer (NeurOptics PLR-200™ Pupillometer, NeurOptics Inc., CA, USA) before and three hours after each meal [34]. Participants had to spend at least 15 minutes in a semi-dark and quiet room to allow their pupils to adjust to the low light level. After this period, instructions were given to focus on a small object located 3 meters away from the eye that was not being measured while keeping their head straight and both eyes open during the measurement. The pupillometer used a light-emitting diode with a single light stimulus at a peak wavelength of 180 nm. A pupillary light response for each eye was recorded, and the average measurement from both the left and right eye was used for statistical analyses. At the end of the measurement cycle, pupil light response curves were recorded, and seven pupillometry outcomes were assessed. These included the initial diameter of the pupil (baseline pupil diameter) and the diameter at the constriction peak (final pupil diameter) [millimeters (mm)], relative constriction amplitude (%), average constriction velocity (ACV, mm/s), average dilation velocity (ADV, mm/s), maximum constriction velocity (MCV, mm/s), and the total time taken by the pupil to recover to 75% of its initial resting size after reaching the peak of constriction (T75, seconds) [27]. ADV and T75 are associated with sympathetic nervous system activity, whereas the remaining measurements are related to the parasympathetic nervous system activity [27].

2.4. Other Procedures

During the baseline assessment, participants completed a sociodemographic and lifestyle habits questionnaire, which included smoking. Clinical asthma diagnoses were determined at baseline according to the Global Initiative for Asthma recommendations [35].
Weight and height were evaluated with participants who were lightly clothed and barefoot. Height (cm) was measured using a portable stadiometer (SECA® model 214). Weight (kg) and body composition were measured using a digital scale (Tanita® BC-418 Segmental Body Analyzer). Body mass index (BMI) was calculated as body weight divided by the square of height. Participants were classified according to World Health Organization (WHO) recommendations: underweight (<18.5 kg/m²), normal weight (18.5–24.9 kg/m²), overweight (25.0-29.9 kg/m²), and obesity (≥30 kg/m²) [36].

2.5. Statistical Analyses

The characteristics of the participants are presented for the whole sample as percentages for categorical and as median (25th–75th percentile) for continuous variables, except for age and height, which is expressed as mean ± standard deviations (SD). p-values <0.05 were considered statistically significant. Continuous results are expressed as mean (95% confidence interval, CI) or, if not normally distributed, as median 25th; 75th. Paired t-test was used to assess the dependent measures of individuals with normal distributions. Wilcox compared differences in any variables with nonnormal distributions. The relation between groups was performed using Wilcoxon and paired T-test, expressed in p-value.
We conducted a mixed-effects model analysis to evaluate the effects of meal type (FFM vs. MdM) and time of measurement (After vs. Before meal) on ANS parameters, lung function, and FeNO, accounting for individual variability through random intercepts. Significance levels were set at p-value < 0.05. Potential confounders were added, including sex, age, BMI, asthma diagnosis, and smoking status.
All analyses were performed using R software (version 4.0.2, R Foundation for Statistical Computing, Vienna, Austria).

3. Results

The baseline characteristics of the study participants are included in Table 1
Pupillometry changes after each meal and meal comparisons are summarized in Table 2 and Figure 1. After the MdM intake, there was a significant increase in maximal pupil diameter (MaxD), with a mean variation of 0.17 mm (SD± 0.50). The average and maximum velocity of constriction (measured by ACV and MCV) were also significantly quicker (absolute variation of velocity 0.12mm/sec [-0.12;0,32] and 0,25[-0,07;0.70], respectively). The MdM was additionally associated with a significant decrease in the median ADV by 0.07 mm/s. Following FFM, there was a decrease in T75 by 1.0 (±1,33) sec.
When comparing the two meals (Figure 1), in the parasympathic parameters, the MdM led to a more significant increase in both MaxD and MinD than the FFM. Furthermore, SNS parameters differed significantly between meals, with T75 being markedly lower after the FFM.
Lung function and FeNO before and after each meal results and comparisons between meals are summarized in Table 3. After the MdM intake, there was a reduction in FVC (median variation of -0.06[-0.17;0.04]). Following the FFM, there were significant differences in FVC [before, 4.13 (3.45; 5.52) vs. after, 4.19 (3.52; 5.44)]. No significant change in FEV1 or the FEF 25/75 parameter was seen. Regarding airway inflammation, FeNO increased significantly after MdM by 3.7[0.4;9.0] ppb and after FFM 2.2[-0.3;9.0] ppb.
When comparing the two meals, there was no significant difference between the MdM and FFM (data not shown).
Results from mixed-effects model analysis for pupillometry are presented in Table 4. Fully adjusted model for sex, age, BMI, asthma diagnosis and smoke status of MaxD, MinD, %Con, ACV, MCV, ADV, T75, and RHR showed significant baseline effect with an intercept estimated at 8.83 (SE, 0.83), 6.03 (SE, 0.71), -30.36 (SE, 5.03), -5.03 (SE, 0.58), -6.34 (SE, 1.03), 1.08 (SE, 0.23), 3.46 (SE, 0.63), and 79.15 (SE, 12.55), respectively. Both time (before/after meal) and FFM (model 2, estimate= -0.68, p=<0.001 and estimate= -0.52, p=0.002, respectively) significantly decreased T75.
Mixed-effects model analyses for lung function and airway inflammation are presented in Table 5. FEV1/FVC and FEF25/75 fully adjusted models also revealed significant baseline effects with an intercept estimated at 123.91 (SE, 7.59) and 4.61 (SE, 1.35), respectively.
After adjusting for sex, age, BMI, asthma diagnosis, and smoking status, having a meal, irrespective of the type of meal, had a significant and negative impact on FVC (model 2, estimate = -0.079, p<0.001), FVC predicted, % (model 2, estimate= -1.91, p= 0.019) and FEV1 (model 2, estimate = -0.04, p= 0.017). FeNO did not show a significant difference, but a tendency of a potential effect of the type of meal was seen (model 2, estimate= -4.21, p = 0.057).

4. Discussion

In this randomized crossover clinical trial, we found that different meals elicit distinct autonomic nervous system and airway inflammation responses, even when isoenergetic. A fast-food-like meals promoted sympathetic dominance, reflected by a decrease in T75, even after adjusting for relevant confounders. In contrast, the Mediterranean-like meal supported parasympathetic activity, demonstrated by an increase in MaxD and a reduction in ACV and MCV, indicative of a more regulated autonomic state. Both meal types induced a mild reduction in FEV1 and FVC, even after adjusting for confounders. Exhaled nitric oxide tended to differ between meals, suggesting a potential influence on airway inflammation. However, we could not establish an association between airway inflammation and the autonomic nervous system responses.
Eating a meal is associated with increased sympathetic activity[37], likely related to the increased heart rate and cardiac output required for digestion. The specific composition of the meal modulates this response. A high-fat meal impacts the autonomic nervous system and vascular responsiveness [38]; and carbohydrate content can also influence autonomic activity [38]. In our study, although the meals were isoenergetic, they differed in fiber and SFA content. The effects of fiber and fat type on the autonomic nervous system response unclear, although evidence suggests a potential impact on inflammation. Previous studies have shown that fiber-rich meals, particularly with probiotics, reduce exhaled nitric oxide (FeNO) [39], a marker of airway inflammation, while high-fat meals are linked to increased FeNO [40]. Diets high in SFA and low in antioxidants exacerbate inflammation [2, 41, 42] , reducing lung function and increasing airway inflammation [43]. Additionally, trans-fatty acids and ultra-processed meats have been associated with decreased lung function due to their role in promoting systemic inflammation [44]. It is not possible to say that the observed modulation of the autonomic nervous system and the tendency for increased airway inflammation by a meal are explained by the exact mechanisms underlying how dietary habits and lifestyles impact ANS regulation, lung function, and airway inflammation, as long-term effects have different impact on health-related outcomes.
Lifestyle factors like weight loss and dietary composition are key to modulating autonomic control [11, 45]. Studies on low-energy diets with varying levels of fiber, red meat, and coffee on autonomic function have not shown significant differences in heart rate variability, possibly due to the small sample sizes and the overshadowing effects of weight loss [46]. Regarding the acute effect of a meal, a small trial showed that high-energy meal intake before dinner promoted sympathetic and decreased parasympathetic activity during sleep[47]. Nutrient content of a diet, including vitamins, proteins, PUFA, bioflavonoids, carotenoids, and other antioxidant metabolites, contributes to a long-term anti-inflammatory effect [48]. Also, a typical MdM contributed to vagal activation, promoting a parasympathetic state, as evidenced by decreases in ACV and MCV [49]. Nevertheless, few studies have evaluated the effects of a meal. A trial comparing the acute effect of high-fat and high-carbohydrate isoenergetic meals promoted differential effects on autonomic response in lean versus obese women[50]. Acute effects may depend on factors such as fitness status, dietary habits, and dietary diversity. Our previous work suggested that a wider variety of vegetable intake was linked to sympathetic activity [14], possibly due to the synergistic effects of dietary components with anti-inflammatory and antioxidant properties. Conversely, Western diets, typically high in SFA and deficient in essential minerals and vitamins, including vitamin B12 and vitamin A, have been associated with autonomic dysfunction (AD) and inflammation [51, 52]. Although the exact mechanisms by which oxidative stress influences sympatho-excitatory effects remain unclear [53], our study supports that even a single meal might immediately impact autonomic balance. Previous studies have suggested that the components of these diets, including dietary fiber, micronutrients, and bioactive compounds, play critical roles in gut microbiota activity, reducing low-grade inflammation and protecting cells from oxidative stress [54]. Although the effect of meals on the microbiome has been contradictory, it has been shown that a meal and the timing of a meal might also influence the microbiota population[55]. Together, these processes may influence both inflammation and ANS function.
A diet rich in anti-inflammatory and antioxidant nutrients, such as those found in the Mediterranean diet, has been shown to positively influence lung function by reducing airway inflammation and oxidative stress [56, 57]. Key dietary components, such as polyphenols and omega-3 fatty acids, may protect lung function [41, 58]. Our mixed model analysis showed no significant differences between the MdM and FFM regarding FeNO levels. A previous study demonstrated that consuming a meal classified as 'anti-inflammatory' according to the Dietary Inflammatory Index® significantly enhanced the exercise-induced reduction in airway inflammation, particularly in reducing sputum eosinophils, in individuals with asthma[59]. A meal might likely lead to acute changes dependent on concomitant factors, stress, exercise, and individual fitness.
It is essential to interpret our results with caution due to several limitations. This study focused on young, healthy adults; although we included some participants with asthma and obesity, their numbers were insufficient for subgroup analysis. Nevertheless, we adjusted our models for these co-founders and found a significant difference between interventions. Our meals differed primarily in micronutrient composition, which aligns with typical dietary habits but may yield different results than meals with more significant macronutrient variations, especially in fat content. Nonetheless, as FFM was sourced from a commercial restaurant, its nutritional composition was derived from the manufacturer’s database. It is possible that the parasympathetic activity seen after the MdM, characterized by increased MaxD, ACV, and MCV, might be diluted by the low-impact bioactive compounds and antioxidant profile of the FFM in modulating autonomic responses. We observed minor differences in sex and smoking status across participants; adjustments were made to account for these factors, and even with these adjustments, meal type still significantly influenced autonomic responses. Future research should involve more extensive and more diverse populations. During the washout, participants were asked to maintain their regular dietary and physical activity habits, reducing potential confounding from lifestyle changes. However, future studies should assess how long the observed effects persist and how subsequent meals impact ANS function. The short intervention with a washout period reduced potential carryover effects. In addition, although important confounders have been considered, we cannot exclude the possible impact from other unmeasured covariates (i.e., environment) [13].
This study’s strengths include the rigorous randomized crossover design, which minimized confounding and balanced baseline differences. The meals were designed to be isoenergetic and aligned with dietary reference intakes for macronutrient distribution, which allowed us to compare the micronutrient content effectively. Pupillometry, which measures ANS responses under controlled lighting conditions, provides reliable data. Similar studies have demonstrated that pupillometry outcomes align with HRV measurements [60] and have been successfully used in dietary intervention research [51].

5. Conclusions

In conclusion, our study showed that a single meal, depending on its quality, can significantly impact autonomic nervous system responses: the Mediterranean meal had a protective effect, inducing a parasympathetic response in comparison to a Fast food meal sympathetic response. Although airway inflammation and lung function changes were not clinically significant, it is likely that in specific populations, namely in obese and asthmatic, this study might render different results. The predominance of sympathetic activity following meals, which we also observed here after an FFM, could play a role in the development of hypertension, cardiovascular disease, and other obesity-related complications, highlighting the need for interventions that focus on both dietary quality and ANS regulation. The study findings highlight the role of meal quality in autonomic regulation, with potential implications for cardiometabolic and respiratory health. Further research is needed to explore the cumulative effects of the subsequent meals, increasing the awareness of the health impact of our daily life dietary choices.

Author Contributions

Conceptualization, André Moreira and Pedro Moreira; Data curation, Francisca Mendes; Formal analysis, Diana Silva, Francisca Mendes and Vânia Stanzani; Funding acquisition, André Moreira and Pedro Moreira; Investigation, Diana Silva and Rita Moreira; Methodology, Diana Silva, Rita Moreira and Mariana Pinto; Project administration, André Moreira and Pedro Moreira; Resources, Marília Beltrão, Oksana Sokhatska and Luís Delgado; Software, Diana Silva, Rita Moreira and Mariana Pinto; Supervision, André Moreira and Pedro Moreira; Validation, Diana Silva, Francisca Mendes, Milton Severo and Vanessa Garcia-Larsen; Writing – original draft, Diana Silva and Francisca Mendes; Writing – review & editing, Vânia Stanzani, Patrícia Padrão, Luís Delgado, André Moreira and Pedro Moreira. All authors have read and agreed to the published version of the manuscript.

Funding

This work was supported by the Project NORTE-01-0145-FEDER-000010 – Health, Comfort and Energy in the Built Environment (HEBE), cofinanced by Programa Operacional Regional do Norte (NORTE2020), through Fundo Europeu de Desenvolvimento Regional (FEDER) (AM). The sponsors did not play any role in the study design, data collection, analysis, decision to publish or preparation of the manuscript.

Institutional Review Board Statement

The study was conducted by the Declaration of Helsinki and approved by the Ethics Committee of the Faculty of Medicine, University of Porto. This study was registered in clinicalTrials.gov ID NCT02027675.

Informed Consent Statement

Written informed consent was obtained from all the participants.

Data Availability Statement

We encourage all authors of articles published in MDPI journals to share their research data. This section provides details regarding where data supporting reported results can be found, including links to publicly archived datasets analyzed or generated during the study. Where no new data were created or where data is unavailable due to privacy or ethical restrictions, a statement is still required. Suggested Data Availability Statements are available in the section “MDPI Research Data Policies” at https://www.mdpi.com/ethics.

Conflicts of Interest

The authors declare no conflicts of interest.

References

  1. Rodrigues, M. , et al., Diet quality, asthma and airway inflammation in school-aged children. Eur Ann Allergy Clin Immunol, 2023.
  2. Wood, L.G. , Diet and lung disease-Are fruits and vegetables the ideal whole-food intervention? Respirology, 2021, 26, 527–528. [Google Scholar] [CrossRef]
  3. Wharton, R. , et al., Associations of a Plant-centered Diet and Lung Function Decline across Early to Mid-Adulthood: The CARDIA Lung Study. Res Sq, 2023.
  4. Struven, A. , et al., Obesity, Nutrition and Heart Rate Variability. Int J Mol Sci, 2021. 22(8).
  5. Barros, R. , et al., Dietary patterns and asthma prevalence, incidence and control. Clin Exp Allergy, 2015, 45, 1673–1680. [Google Scholar] [CrossRef]
  6. Amazouz, H. , et al., Mediterranean diet and lung function, sensitization, and asthma at school age: The PARIS cohort. Pediatr Allergy Immunol, 2021, 32, 1437–1444. [Google Scholar] [CrossRef] [PubMed]
  7. Pavlov, V.A., S. S. Chavan, and K.J. Tracey, Bioelectronic Medicine: From Preclinical Studies on the Inflammatory Reflex to New Approaches in Disease Diagnosis and Treatment. Cold Spring Harb Perspect Med, 2020. 10(3).
  8. Fried, S. , et al., Interactions between the microbiota and enteric nervous system during gut-brain disorders. Neuropharmacology, 2021, 197, 108721. [Google Scholar] [CrossRef] [PubMed]
  9. Agustí, A. , et al., Interplay Between the Gut-Brain Axis, Obesity and Cognitive Function. Front Neurosci, 2018, 12, 155. [Google Scholar] [CrossRef] [PubMed]
  10. Carnagarin, R. , et al., Autonomic Regulation of Glucose Homeostasis: a Specific Role for Sympathetic Nervous System Activation. Curr Diab Rep, 2018, 18, 107. [Google Scholar] [CrossRef]
  11. Costa, J. , et al., Effects of weight changes in the autonomic nervous system: A systematic review and meta-analysis. Clin Nutr, 2019, 38, 110–126. [Google Scholar] [CrossRef] [PubMed]
  12. George, K. , et al., Gender-Based Vegetarian and Nonvegetarian Dietary Impact on Cardiac Autonomic Function of Heart Rate Variability. J Am Coll Nutr, 2021, 40, 237–241. [Google Scholar] [CrossRef]
  13. Paciência, I. , et al., School environment associates with lung function and autonomic nervous system activity in children: a cross-sectional study. Sci Rep, 2019, 9, 15156. [Google Scholar] [CrossRef]
  14. de Castro Mendes, F. , et al., Increasing Vegetable Diversity Consumption Impacts the Sympathetic Nervous System Activity in School-Aged Children. Nutrients, 2021. 13(5).
  15. Maunder, E., D. K. Dulson, and D.M. Shaw, Autonomic and Perceptual Responses to Induction of a Ketogenic Diet in Free-Living Endurance Athletes: A Randomized, Crossover Trial. International journal of sports physiology and performance, 2021, 16, 1603–1609. [Google Scholar] [CrossRef] [PubMed]
  16. Laugero, K.D. and N.L. Keim, A Diet Pattern Characterized by Sugar-Sweetened Beverages Is Associated with Lower Decision-Making Performance in the Iowa Gambling Task, Elevated Stress Exposure, and Altered Autonomic Nervous System Reactivity in Men and Women. Nutrients, 2023. 15(18).
  17. Connett, G.J. , Asthma, classical conditioning, and the autonomic nervous system - a hypothesis for why children wheeze. Arch Dis Child, 2024, 109, 462–467. [Google Scholar] [CrossRef] [PubMed]
  18. Ennequin, G. , et al., Physically active men present a healthier cardiometabolic profile in response to a balanced meal compared to inactive men. Eur J Appl Physiol, 2023, 123, 283–297. [Google Scholar] [CrossRef] [PubMed]
  19. Cozzolino, D. , et al., Cardiac autonomic regulation in response to a mixed meal is impaired in obese children and adolescents: the role played by insulin resistance. J Clin Endocrinol Metab, 2014, 99, 3199–207. [Google Scholar] [CrossRef]
  20. De Lorenzo, A. , et al., Mediterranean meal versus Western meal effects on postprandial ox-LDL, oxidative and inflammatory gene expression in healthy subjects: a randomized controlled trial for nutrigenomic approach in cardiometabolic risk. Acta Diabetol, 2017, 54, 141–149. [Google Scholar] [CrossRef] [PubMed]
  21. Schönknecht, Y.B. , et al., APOE ɛ4 Is Associated with Postprandial Inflammation in Older Adults with Metabolic Syndrome Traits. Nutrients, 2021. 13(11).
  22. Ade, C.J., S. K. Rosenkranz, and C.A. Harms, The effects of short-term fish oil supplementation on pulmonary function and airway inflammation following a high-fat meal. Eur J Appl Physiol, 2014, 114, 675–82. [Google Scholar] [CrossRef]
  23. Steinhauer, S.R. , et al., Publication guidelines and recommendations for pupillary measurement in psychophysiological studies. Psychophysiology, 2022, 59, e14035. [Google Scholar] [CrossRef]
  24. Ferencová, N. , et al., Eye pupil - a window into central autonomic regulation via emotional/cognitive processing. Physiol Res, 2021. 70(Suppl4): p. S669-s682.
  25. Jenkins, Z.M. , et al., Autonomic Nervous System Function in Anorexia Nervosa: A Systematic Review. Front Neurosci, 2021, 15, 682208. [Google Scholar] [CrossRef]
  26. Stang, J. , et al., Parasympathetic Activity and Bronchial Hyperresponsiveness in Athletes. Med Sci Sports Exerc, 2016, 48, 2100–2107. [Google Scholar] [CrossRef] [PubMed]
  27. Silva, D. , et al., Meal-exercise challenge and physical activity reduction impact on immunity and inflammation (MERIIT trial). Contemp Clin Trials Commun, 2018, 10, 177–189. [Google Scholar] [CrossRef]
  28. Trumbo, P. , et al., Dietary reference intakes for energy, carbohydrate, fiber, fat, fatty acids, cholesterol, protein and amino acids. Journal of the American Dietetic Association, 2002, 102, 1621–1630. [Google Scholar] [CrossRef]
  29. Dweik, R.A. , et al., An official ATS clinical practice guideline: interpretation of exhaled nitric oxide levels (FENO) for clinical applications. Am J Respir Crit Care Med, 2011, 184, 602–15. [Google Scholar] [CrossRef] [PubMed]
  30. Thoracic, S. , ATS/ERS recommendations for standardized procedures for the online and offline measurement of exhaled lower respiratory nitric oxide and nasal nitric oxide, 2005. J Am J Respir Crit Care Med, 2005, 171, 912–930. [Google Scholar]
  31. Excellence, N.I.f.C. , Measuring fractional exhaled nitric oxide concentration in asthma: NIOX MINO, NIOX VERO and NObreath. 2014.
  32. Miller, M.R. , et al., Standardisation of spirometry. Eur Respir J, 2005, 26, 319–38. [Google Scholar] [CrossRef]
  33. Stanojevic, GLI-2012 Excel Sheet Calculator. J Global Lung Function Initiative, 2013.
  34. Couto, M. , et al., Exploratory study comparing dysautonomia between asthmatic and non-asthmatic elite swimmers. Rev Port Pneumol (2006), 2015, 21, 22–29. [Google Scholar] [PubMed]
  35. Committees, G.E.a.S. From the Global Strategy for Asthma Management and Prevention, Global Initiative for Asthma (GINA) 2015. 2015.
  36. Organization, W.H. Global Database on Body Mass Index: BMI Classification.. [cited 2015; Available from: http://apps.who.int/bmi/index.jsp.
  37. Lu, C.L. , et al., Postprandial changes of sympathovagal balance measured by heart rate variability. Dig Dis Sci, 1999, 44, 857–61. [Google Scholar] [CrossRef]
  38. Nagai, N. , et al., The effect of a high-carbohydrate meal on postprandial thermogenesis and sympathetic nervous system activity in boys with a recent onset of obesity. Metabolism, 2005, 54, 430–8. [Google Scholar] [CrossRef] [PubMed]
  39. Halnes, I. , et al., Soluble Fibre Meal Challenge Reduces Airway Inflammation and Expression of GPR43 and GPR41 in Asthma. Nutrients, 2017. 9(1).
  40. Kurti, S.P. , et al., Does moderate intensity exercise attenuate the postprandial lipemic and airway inflammatory response to a high-fat meal? Biomed Res Int, 2015, 2015, 647952. [Google Scholar] [CrossRef] [PubMed]
  41. Guilleminault, L. , et al., Diet and Asthma: Is It Time to Adapt Our Message? Nutrients, 2017. 9(11).
  42. Rodrigues, M. , et al., Diet and Asthma: A Narrative Review. Appl. Sci., 2023, 13, 6398. [Google Scholar] [CrossRef]
  43. Sorli-Aguilar, M. , et al., Dietary patterns are associated with lung function among Spanish smokers without respiratory disease. BMC Pulm Med, 2016, 16, 162. [Google Scholar] [CrossRef]
  44. Serra, H. , et al., Association between the Consumption of Ultra-Processed Foods and Asthma in Adults from Ribeirão Preto, São Paulo, Brazil. Nutrients, 2023. 15(14).
  45. Mattos, S. , et al., Effects of weight loss through lifestyle changes on heart rate variability in overweight and obese patients: A systematic review. Clin Nutr, 2022, 41, 2577–2586. [Google Scholar] [CrossRef]
  46. Ziegler, D. , et al., Effect of Low-Energy Diets Differing in Fiber, Red Meat, and Coffee Intake on Cardiac Autonomic Function in Obese Individuals With Type 2 Diabetes. Diabetes Care, 2015, 38, 1750–1757. [Google Scholar] [CrossRef]
  47. Tada, Y. , et al., Higher energy intake at dinner decreases parasympathetic activity during nighttime sleep in menstruating women: A randomized controlled trial. Physiol Behav, 2018, 194, 252–259. [Google Scholar] [CrossRef] [PubMed]
  48. Polutchko, S.K., G. N.E. Glime, and B. Demmig-Adams, Synergistic Action of Membrane-Bound and Water-Soluble Antioxidants in Neuroprotection. Molecules, 2021. 26(17).
  49. Dai, J. , et al., Mediterranean dietary pattern is associated with improved cardiac autonomic function among middle-aged men: a twin study. Circ Cardiovasc Qual Outcomes, 2010, 3, 366–73. [Google Scholar] [CrossRef] [PubMed]
  50. Tentolouris, N. , et al., Differential effects of high-fat and high-carbohydrate isoenergetic meals on cardiac autonomic nervous system activity in lean and obese women. Metabolism, 2003, 52, 1426–1432. [Google Scholar] [CrossRef] [PubMed]
  51. Palmer, A.C. , et al., Provitamin A Carotenoid-Biofortified Maize Consumption Increases Pupillary Responsiveness among Zambian Children in a Randomized Controlled Trial. J Nutr, 2016, 146, 2551–2558. [Google Scholar] [CrossRef]
  52. Healy, K. , et al., Nutritional Status Measures Are Correlated with Pupillary Responsiveness in Zambian Children. J Nutr, 2018, 148, 1160–1166. [Google Scholar] [CrossRef]
  53. Bruno, R.M. and L. Ghiadoni, Polyphenols, Antioxidants and the Sympathetic Nervous System. Curr Pharm Des, 2018, 24, 130–139. [Google Scholar] [CrossRef]
  54. Yalcin, H. and T.D. Çapar, Bioactive Compounds of Fruits and Vegetables, in Minimally Processed Refrigerated Fruits and Vegetables, F. Yildiz and R.C. Wiley, Editors. 2017, Springer US: Boston, MA. p. 723-745.
  55. Papadopoulou, R.T. , et al., The Acute Effect of Meal Timing on the Gut Microbiome and the Cardiometabolic Health of the Host: A Crossover Randomized Control Trial. Ann Nutr Metab, 2020, 76, 322–333. [Google Scholar] [CrossRef] [PubMed]
  56. Catalin, R.E. , et al., Mediterranean Diet and Lung Function in Adults Current Smokers: A Cross-Sectional Analysis in the MEDISTAR Project. Nutrients, 2023. 15(5).
  57. Bakolis, I. , et al., Dietary patterns and respiratory health in adults from nine European countries-Evidence from the GA(2) LEN study. Clin Exp Allergy, 2018, 48, 1474–1482. [Google Scholar] [CrossRef] [PubMed]
  58. Garcia-Larsen, V. , et al., Dietary antioxidants and 10-year lung function decline in adults from the ECRHS survey. Eur Respir J, 2017. 50(6).
  59. McDiarmid, K.P. , et al., The Impact of Meal Dietary Inflammatory Index on Exercise-Induced Changes in Airway Inflammation in Adults with Asthma. Nutrients, 2022. 14(20).
  60. Shi, L. , et al., Assessment of Combination of Automated Pupillometry and Heart Rate Variability to Detect Driving Fatigue. Front Public Health, 2022, 10, 828428. [Google Scholar] [CrossRef] [PubMed]
Figure 1. Pupillometry parameters change before and after each meal and comparison between meals. MdM – Mediterranean Meal; FFM- Fast Food Meal. MaxD, maximal diameter; MinD, minimum diameter; ADV, dilation velocity, T75, time at which pupil has re-dilated 75% of the reflex amplitude are presented as mean and standard deviation; for %Con, percent of the constriction; Latency, time of the onset of the constriction; ACV, average constriction velocities; MCV, maximum constriction velocity data is presented as median and interquartile ratio. *: Paired samples t-test; #: Related-Wilcoxon signed rank test.
Preprints 145522 g001
Table 1. Participants' characteristics.
Total
(n= 46)
Female, n (%) 26 (57)
Age, years (median, 25th-75th) 25, 22-30
Caucasian, n (%) 43 (94)
Height, cm (mean ±SD) 169 ±10.4
BMI, n (%)
 Average weight (18.5-24.9 kg/m2) 25 (54)
 Overweight (25-29.9 kg/m2) 17 (37)
 Obese (≥30 kg/m2) 4 (9)
Active smokers, n (%) 7 (15)
Asthma diagnosis, n (%) 13 (28.3)
Data are presented as n (%), except if otherwise specified, Based on the previous publication[27].
Table 2. Pupillometry parameters change before and after each meal.
MdM FFM
Measurements Before After p Before After p
Parasympathetic
MaxD, mm (mean ±SD) 6.03 ±0.78 6.20 ±0.77 0.043a 6.07 ±0.85 5.98 ±0.85 0.249a
MinD, mm (mean ±SD) 3.93 ±0.62 3.97 ±0.60 0.128a 3.92 ±0.66 3.87 ±0.72 0.352a
%Con (%) -36.0 (-38.0; -32.8) -36.5 (-38.0; -34.0) 0.072b -36.5 (-38.0; -33.5) -36.5 (-39.0; -33.0) 0.467b
Latency, sec 0.22 (0.21; 0.22) 0.22 (0.21; 0.24) 0.461b 0.22 (0.21; 0.24) 0.22 (0.20; 0.22) 0.876b
ACV, mm/sec -4.18 (-4.56; -3.81) -4.48 (-4.68; -3.98) 0.035b -4.20 (-4.59; -3.91) -4.32 (-4.59; -3.82) 0.483b
MCV, mm/sec -5.77 (-6.12; -5.08) -6.13 (-6.55; -5.71) 0.003b -5.87 (-6.38; -5.42) -5.87 (-6.36; -5.44) 0.324b
Sympathetic
ADV, mm/sec (mean ±SD) 1.00 ±0.24 0.93 ±0.23 0.030a 0.92 ±0.26 0.93 ±0.19 0,.412a
T75, sec (mean ±SD) 2.52 ±0.53 2.76 ±0.44 0.454a 2.65 ±0.59 1.54 ±0.96 0.012a
Data are presented as a median and 25th-75th, except if specified otherwise. a: Paired samples t-test; b: Related-Wilcoxon signed rank test. MaxD, maximal diameter; MinD, minimum diameter; %Con, percent of the constriction; Latency, time of the onset of the constriction; ACV, average constriction velocities; MCV, maximum constriction velocity; ADV, dilation velocity; T75, time at which pupil has re-dilated 75% of the reflex amplitude.
Table 3. Lung function and airway inflammation change before and after each meal and comparison between meals.
MdM FFM
Measurements Before After p Before After p
Lung function
FVC, median (25th; 75th) 4.08 (3.55; 5.40) 4.08 (3.44; 4.98) 0.023b 4.13 (3.45; 5.52) 4.19 (3.52; 5.44) 0.029b
FEV1, median (25th; 75th) 3.67(2.93;4.44) 3.58(2.94:4.41) 0.055 b 3.65(3.03;4.48) 3.73(3.00;4.45) 0.245 b
FEV1/FVC 85.7 ±5.43 86.2 ±5.20 0.311a 85.6 ±5.70 86.3 ±5.29 0.118a
FEF25/75 4.0 ±1.11 4.09 ±1.21 0.110a 4.11 ±1.10 4.09 ±1.13 0.817a
Airway inflammation
FeNO, ppb, median (25th; 75th) 25.7 (16.3; 49.3) 30.8 (25.6; 62.3) <0.001b 25.0 (14.3; 47.0) 29.3 (17.0; 51.7) 0.040b
Data are presented as mean ±SD, except if specified otherwise. a: Paired samples t-test; b: Related-Wilcoxon signed rank test. p: between the time of measure p*: the difference between meals. FVC forced vital capacity; FEV1 forced expiratory volume in 1 second; FEF25-75 forced expiratory flow middle portion of forced vital capacity; FeNO, the fraction of exhaled nitric oxide
Table 4. Mixed-effects model Analysis for Pupillometry and rest heart rate.
Fixed Effects Random Effects Model Fit
Intercept Meal
FFM vs. MdM
Time
After vs. Before
Intercept Residual Log-likelihood AIC BIC
MaxD
Model 1
 Estimate 6.09 -0.08 0.04 -- -- -138.56 287.13 302.50
 SE 0.12 0.07 0.06 -- -- -- -- --
 Variance -- -- -- 0.47 0.17 -- -- --
 SD -- -- -- 0.68 0.41 -- -- --
 DF 53.81 117.99 117.19 -- -- -- -- --
p <0.001 0.215 0.508 -- -- -- -- --
Model 2
 Estimate 8.83 -0.08 0.04 -- -- -140.15 300.30 331.05
 SE 0.83 0.07 0.06 -- -- -- -- --
 Variance -- -- -- 0.40 0.17 -- -- --
 SD -- -- -- 0.63 0.41 -- -- --
 DF 35.27 117.89 117.22 -- -- -- -- --
p <0.001 0.222 0.508 -- -- -- -- --
MinD
Model 1
 Estimate 3.96 -0.06 0.01 -- -- -98.90 207.79 223.04
 SE 0.09 0.05 0.05 -- -- -- -- --
 Variance -- -- -- 0.33 0.10 -- -- --
 SD -- -- -- 0.58 0.32 -- -- --
 DF 51.20 113.80 113.05 -- -- -- -- --
p <0.001 0.231 0.792 -- -- -- -- --
Model 2
 Estimate 6.03 -0.06 0.01 -- -- -102.11 224.22 254.72
 SE 0.71 0.05 0.05 -- -- -- -- --
 Variance -- -- -- 0.30 0.10 -- -- --
 SD -- -- -- 0.55 0.32 -- -- --
 DF 35.03 113.76 113.19 -- -- -- -- --
p <0.001 0.233 0.788 -- -- -- -- --
%Con
Model 1
 Estimate -35.20 -0.13 -0.21 -- -- -376.14 762.28 777.60
 SE 0.64 0.29 0.29 -- -- -- -- --
 Variance -- -- -- 14.53 3.81 -- -- --
 SD -- -- -- 3.29 1.82 -- -- --
 DF 48.58 115.53 114.96 -- -- -- -- --
p <0.001 0.651 0.470 -- -- -- -- --
Model 2
 Estimate -30.36 -0.13 -0.21 -- -- -372.72 765.43 796.06
 SE 5.03 0.29 0.29 -- -- -- -- --
 Variance -- -- -- 15.39 3.29 -- -- --
 SD -- -- -- 3.92 1.82 -- -- --
 DF 34.83 115.30 114.91 -- -- -- -- --
p <0.001 0.652 0.474 -- -- -- -- --
ACV
Model 1
 Estimate -4.21 0.13 -0.04 -- -- -144.81 299.62 314.62
 SE 0.09 0.08 0.08 -- -- -- -- --
 Variance -- -- -- 0.17 0.25 -- -- --
 SD -- -- -- 0.41 0.50 -- -- --
 DF 86.37 118.36 116.42 -- -- -- -- --
p <0.001 0.109 0.629 -- -- -- -- --
Model 2
 Estimate -5.03 0.12 -0.04 -- -- -150.01 320.01 350.01
 SE 0.58 0.08 0.08 -- -- -- -- --
 Variance -- -- -- 0.15 0.25 -- -- --
 SD -- -- -- 0.39 0.50 -- -- --
 DF 34.84 117.40 115.76 -- -- -- -- --
p <0.001 0.127 0.624 -- -- -- -- --
MCV
Model 1
 Estimate -5.78 -0.003 -0.28 -- -- -245.37 500.73 516.08
 SE 0.16 0.16 0.16 -- -- -- -- --
 Variance -- -- -- 0.35 1.01 -- -- --
 SD -- -- -- 0.59 1.01 -- -- --
 DF 107.93 119.07 116.67 -- -- -- -- --
p <0.001 0.984 0.079 -- -- -- -- --
Model 2
 Estimate -6.34 -2.61x10⁻³ -0.28 -- -- -250.77 521.54 552.23
 SE 1.03 0.16 0.16 -- -- -- -- --
 Variance -- -- -- 0.41 0.64 -- -- --
 SD -- -- -- 1.01 1.01 -- -- --
 DF 35.55 118.34 116.43 -- -- -- -- --
p <0.001 0.987 0.079 -- -- -- -- --
ADV
Model 1
 Estimate 0.97 -0.02 -0.03 -- -- 167.48 -22.95 -7.93
 SE 0.03 0.03 0.03 -- -- -- -- --
 Variance -- -- -- 0.03 0.03 -- -- --
 SD -- -- -- 0.16 0.17 -- -- --
 DF 74.79 108.15 107.24 -- -- -- -- --
p <0.001 0.440 0.229 -- -- -- -- --
Model 2
 Estimate 1.08 -0.02 -0.03 -- -- 5.35 9.29 39.33
 SE 0.23 0.03 0.03 -- -- -- -- --
 Variance -- -- -- 0.03 0.03 -- -- --
 SD -- -- -- 0.16 0.17 -- -- --
 DF 33.54 107.01 106.35 -- -- -- -- --
p <0.001 0.482 0.233 -- -- -- -- --
T75
Model 1
 Estimate 2.98 -0.67 -0.54 -- -- -97.76 205.52 217.56
 SE 0.17 0.18 0.18 -- -- -- -- --
 Variance -- -- -- 0.16 0.61 -- -- --
 SD -- -- -- 0.17 0.78 -- -- --
 DF 79.0 79.0 79.0 -- -- -- -- --
p <0.001 <0.001 <0.001 -- -- -- -- --
Model 2
 Estimate 3.46 -0.68 -0.52 -- -- -97.63 215.27 239.34
 SE 0.63 0.16 0.17 -- -- -- -- --
 Variance -- -- -- 0.10 0.53 -- -- --
 SD -- -- -- 0.07 0.73 -- -- --
 DF 74.0 74.0 74.0 -- -- -- -- --
p <0.001 <0.001 0.002 -- -- -- -- --
Data are presented: β- coefficients, p significance<0.05. Non-adjusted Model (Model 1): Fixed effects with intercept: (Meal + Time of measure) & Random effects with intercept: factor (ID); Adjusted Model (Model 2): Fixed effects with intercept: (Meal + Time of measure + gender + age + BMI + Asthma diagnosis + smoke status) & Random effects with intercept: factor (ID). MaxD, maximal diameter; MinD, minimum diameter; %Con, percent of the constriction; ACV, average constriction velocities; MCV, maximum constriction velocity; ADV, dilation velocity; T75, time at which pupil has re-dilated 75% of the reflex amplitude; RHR, rest heart rate; MdM- Mediterranean Meal; FFM- Fast Food Meal.
Table 5. Mixed-Effects Model Analysis for lung function and airway inflammation.
Fixed Effects Random Effects Model Fit
Intercept Meal
FFM vs. MdM
Time
After vs. Before
Intercept Residual Log-likelihood AIC BIC
FVC
Model 1
 Estimate 4.33 0.039 -0.079 -- -- -629.08 1302.15 1369.67
 SE 0.16 0.023 0.023 -- .-- -- -- --
 Variance -- -- -- 1.027 0.021 -- -- --
 SD -- -- -- 1.013 0.146 -- -- --
 DF 40.82 117.07 117.01 -- -- -- -- --
p <0.001 0.097 <0.001 -- -- -- -- --
Model 2
 Estimate 1.63 0.039 -0.079 -- -- -14.72 75.44 146.17
 SE 1.35 0.023 0.023 -- .-- -- -- --
 Variance -- -- -- 0.963 0.021 -- -- --
 SD -- -- -- 0.981 0.146 -- -- --
 DF 21.98 117.01 116.98 -- -- -- -- --
p 0.238 0.096 <0.001 -- .-- -- -- --
FEV1
Model 1
 Estimate 3.70 0.02 -0.04 -- -- -75.21 160.42 170.53
 SE 0.13 0.02 0.02 -- .-- -- -- --
 Variance -- -- -- 0.66 0.01 -- -- --
 SD -- -- -- 0.81 0.11 -- -- --
 DF 40.76 117.06 117.0 -- -- -- -- --
p <0.001 0.186 0.017 -- .-- -- -- --
Model 2
 Estimate 2.18 0.02 -0.04 -- -- -14.72 75.44 146.17
 SE 1.15 0.017 0.018 -- .-- -- -- --
 Variance -- -- -- 0.71 0.84 -- -- --
 SD -- -- -- 0.013 0.11 -- -- --
 DF 21.99 117.02 116.99 -- -- -- -- --
p 0.072 0.186 0.017 -- .-- -- -- --
FEV1/FVC
Model 1
 Estimate 102.52 0.32 0.83 -- -- -430.14 870.28 885.63
 SE 1.0 0.39 0.39 -- .-- -- -- --
 Variance -- -- -- 36.38 5.90 -- -- --
 SD -- -- -- 6.03 2.43 -- -- --
 DF 18.76 113.45 114.32 -- -- -- -- --
p <0.001 0.411 0.033 -- .-- -- -- --
Model 2
 Estimate 123.91 0.31 -2.31 -- -- -379.58 805.17 875.75
 SE 7.59 0.39 1.21 -- .-- -- -- --
 Variance -- -- -- 29.13 5.90 -- -- --
 SD -- -- -- 5.40 2.43 -- -- --
 DF 22.12 116.39 22.0 -- -- -- -- --
p <0.001 0.433 0.06 -- .-- -- -- --
FEF25/75
Model 1
 Estimate 4.03 0.005 0.04 -- -- -204.30 418.59 434.38
 SE 0.18 0.04 0.04 -- .-- -- -- --
 Variance -- -- -- 1.22 0.07 -- -- --
 SD -- -- -- 1.11 0.26 -- -- --
 DF 42.27 117.17 117.01 -- -- -- -- --
p <0.001 0.905 0.349 -- .-- -- -- --
Model 2
 Estimate 4.61 0.004 0.830 -- -- -104.90 219.80 235.18
 SE 1.35 0.04 0.39 -- .-- -- -- --
 Variance -- -- -- 1.26 1.12 -- -- --
 SD -- -- -- 0.07 0.26 -- -- --
 DF 22.03 117.13 116.1 -- -- -- -- --
p 0.002 0.922 0.349 -- .-- -- -- --
FeNO
Model 1
 Estimate 44.08 -4,15 3.79 -- -- -705.05 1422.09 1440.51
 SE 6.81 2.19 2.16 -- -- -- -- --
 Variance -- -- -- 1758.83 185.82 -- -- --
 SD -- -- -- 41.94 13.63 -- -- --
 DF 44.19 116.37 116.08 -- -- -- -- --
p <0.001 0.058 0.083 -- -- -- -- --
Model 2
 Estimate -7.01 -4.22 3.80 -- -- -629.08 1302.15 1369.67
 SE 56.95 2.19 2.16 -- -- -- -- --
 Variance -- -- -- 1776.84 42.15 -- -- --
 SD -- -- -- 185.82 13.63 -- -- --
 DF 23.08 116.07 116.07 -- -- -- -- --
p 0.903 0.057 0.082 -- -- -- -- --
Data are presented: β- coefficients, p significance<0.05. Non-adjusted Model (Model 1): Fixed effects with intercept: (Meal + Time of measure) & Random effects with intercept: factor (ID) Adjusted Model(Model 2): Fixed effects with intercept: (Meal + Time of measure + gender + age + BMI + Asthma diagnosis + smoke status) & Random effects with intercept: factor (ID). FVC forced vital capacity; FEV1 forced expiratory volume in 1 second; FEF25-75 forced expiratory flow middle portion of forced vital capacity; FeNO, a fraction of exhaled nitric oxide; MdM- Mediterranean Meal; FFM- Fast Food Meal.
Disclaimer/Publisher’s Note: The statements, opinions and data contained in all publications are solely those of the individual author(s) and contributor(s) and not of MDPI and/or the editor(s). MDPI and/or the editor(s) disclaim responsibility for any injury to people or property resulting from any ideas, methods, instructions or products referred to in the content.
Copyright: This open access article is published under a Creative Commons CC BY 4.0 license, which permit the free download, distribution, and reuse, provided that the author and preprint are cited in any reuse.
Prerpints.org logo

Preprints.org is a free preprint server supported by MDPI in Basel, Switzerland.

Subscribe

Disclaimer

Terms of Use

Privacy Policy

Privacy Settings

© 2025 MDPI (Basel, Switzerland) unless otherwise stated