
Submitted:
17 June 2025
Posted:
20 June 2025
You are already at the latest version
Abstract
The impacts of Burdock tea (BT) made from Burdock (Arctium lappa) roots on normal individuals and animal models is largely unknown, particularly on lung protection. This study examined responses of oxidative stress, inflammation, and the microbiota within the cecum and lung to BT treatment in healthy Wistar rats. A middle-dose BT reduced the Chao1 and Shannon indices, and both low and middle doses induced structural alterations in the cecal microbiota. Low dose increased Phascolarctobacterium, Alloprevotella, Desulfovibrio, and the NK4A214 group. In the lung, middle and high doses raised Corynebacterium, with high dose also boosting Megasphaera and Lactobacillus. Functionally, low dose downregulated antibiotics biosynthesis in the cecal microbiota, while middle dose reduced Epstein-Barr virus and Escherichia coli pathogenic infection pathways; additionally, middle and high doses modulated chromosomal proteins and bile acid biosynthesis in the pulmonary microbiota. BT increased short-chain fatty acids content, upregulated GPR43, and reduced NLRP3 expression in both colon and lung while enhancing ZO-1 and occludin. Serum IL-1β and IL-6 and tissue MDA levels also decreased, with propionate inversely correlated with MDA, IL-6, NLRP3 and positively with ZO-1. Overall, BT exhibits a nontoxic profile and may protect lung tissue through its antioxidant nature and gut-lung axis mediated by SCFAs.
Keywords:
Burdock tea
; SCFAs
; gut–lung axis
; antioxidant
; microbiota
; rat
1. Introduction
Burdock (Arctium lappa), a biennial Asteraceae species, is a pharmacologically significant plant with dual applications in traditional medicine and global cuisine [1]. While East Asian cultures predominantly utilize its roots, European traditions favor consumption of tender shoots and leaves. In China, burdock tea (BT) is an herbal beverage made from burdock roots through slicing and drying processes. This beverage is rich in dietary fiber, exhibiting significant anti-inflammatory and antibacterial effects [2]. Additionally, its high polyphenol content demonstrates considerable antioxidant activity [3]. However, most of them are carried out in inflammatory or injury animals, BT’s exact effects on normal individuals and animal models remain unknown. Although there is increasing interest in pulmonary health after the COVID-19 era, the impact of BT on lung protection and improvement, as well as the underlying mechanisms by which BT exerts its lung-protective effects, remain unclear. This uncertainty partially restricts the promotion and application of BT as a healthy food.
The gastrointestinal microbiome, the densest microbial community within the body, plays an essential role in maintaining mucosal balance and regulating systemic inflammation through complex host-microbe interactions [4,5]. When dysbiosis occurs, it can compromise the integrity of the intestinal barrier, allowing microbial translocation that triggers inflammatory responses in far-off organs [6]. Tight junction (TJ) complexes, composed of interacting proteins such as claudins, zonula occludens, and MARVEL-domain proteins, are vital for mucosal defense by controlling paracellular permeability and preventing pathogen infiltration [7,8]. Among these, Zonula occludens-1 (ZO-1) and occludin are key to maintaining the TJ barrier and supporting various epithelial functions, including cell proliferation, repair, and survival [8,9]. Moreover, gut-derived metabolites—especially short-chain fatty acids (SCFAs)—enhance epithelial barrier integrity by reorganizing TJ proteins and activating mitochondrial antioxidant pathways [10,11]. SCFAs exert their effects by binding to G protein-coupled receptors (GPCRs) such as GPR109A, GPR41, and GPR43, which are variably expressed in different cells and tissues [12,13]. In particular, SCFAs can increase colonic levels of GPR43; their binding to this receptor promotes potassium ion flux, leading to the hyperpolarization of intestinal epithelial membranes, suppression of NLRP3 inflammasome activity, reduction in reactive oxygen species, and enhanced expression of ZO-1 and occludin proteins in the colon—thereby mitigating oxidative stress and fortifying the intestinal barrier [14].
Clinically, gut microbiota perturbations correlate with heightened susceptibility to pulmonary pathologies, exemplified by early-life depletion of Bifidobacterium, Faecalibacterium, and Akkermansia increasing asthma risk [15]. This gut-lung crosstalk is mediated through microbial metabolites acting as immunometabolic regulators. SCFAs, for instance, modulate dendritic cell maturation and Treg differentiation, thereby ameliorating airway hyperreactivity [16]. Compromised intestinal barriers permit bacterial translocation to pulmonary tissues via pathogen-associated molecular patterns (PAMPs), triggering TNF-α/IL-1β/IL-6-dominated cytokine storms—a mechanistic basis of the gut-lung axis [17].
Building on its established microbiota-modulating properties and the gut–lung axis paradigm, we hypothesize that BT may confer respiratory benefits by remodeling the enteric microbiome. In this study, male normal Wistar rats were administered varying doses of BT via gastric gavage over an 8-week period. We systematically evaluated changes in serum inflammatory cytokines, oxidative status, and microbial composition in both the gut and lungs, as well as cecal short-chain fatty acid content and the expression levels of genes related to TJ proteins and SCFA-associated pathways in intestinal and pulmonary tissues. This comprehensive study aimed to elucidate the effects of BT on the regulation of the gut-lung axis by examining its influence on microbiota modulation, immune response, barrier protection, and antioxidant activity, as well as investigating the underlying gut microbial mechanisms mediating pulmonary effects. Our findings provide critical insights that advance the evidence-based development and practical application of BT as a daily functional health care beverage.
2. Materials and Methods
2.1. Animals and Treatments
Male Wistar rats were procured from Bengbu Yinnojia Biotechnology Co., Ltd. and housed in the experimental animal facility at Yangzhou University under controlled environmental conditions (22 ± 1°C; 12-hour light/dark cycle) with ad libitum access to water and daily feeding of standard rodent chow. Following a 7-day acclimatization period in individual cages, forty male rats were randomly assigned to four groups. The control group received distilled water by gavage, whereas the low-, middle-, and high-dose groups were administered BT suspensions at doses of 3, 6, and 12 g/kg, respectively. Treatments were administered daily at 09:00 for 8 consecutive weeks. Body weights were recorded on a weekly basis. Food intake was evaluated every 7 days by providing 200 g of standard chow daily and measuring the remaining amount to calculate the daily consumption. After a 12-hour fast following the final gavage, the rats were anesthetized via tail vein injection. Blood was collected by cardiac puncture and centrifuged (4°C, 3000 × g for 30 minutes) to isolate serum, which was then stored at −70°C. Visceral organs, including the lungs, liver, kidneys, and spleen, were excised, rinsed with physiological saline, blotted dry, and weighed to determine organ indices (organ weight/final body weight × 100%). Colon, lung, and liver tissues were snap-frozen in sterile cryotubes at −70°C for subsequent analyses, and cecal contents were aseptically collected and stored at −70°C for short-chain fatty acid quantification and 16S rRNA gene sequencing. All procedures were performed in accordance with the guidelines approved by the Animal Care and Use Committee of the Faculty of Veterinary Medicine at Yangzhou University (No. NSFC2020-SKXY-6).
2.2. Preparation and Component Detection of BT
2.2.1. Preparation of BT
BT was prepared with modifications to the method described by Feng et al. [18]. Briefly, 18 g of dry burdock root was soaked in 180 mL of ultrapure water at 80–90°C for 30 minutes and extracted twice by a 100-mesh sieve under atmospheric pressure. The combined extracts were concentrated to 15 mL using a rotary evaporator (DSB-2100, Tokyo Rikakikai Co., Ltd., Japan) at a reduced pressure of −0.08 MPa and a temperature of 68 ± 1°C, yielding a stock solution with a mass-to-volume equivalence of 1.2 g of raw material per mL. Serial dilutions with distilled water produced solutions for gavage at concentrations of 0.3 g/mL (low-dose group), 0.6 g/mL (middle-dose group), and 1.2 g/mL (high-dose group). These solutions were administered via oral gavage at a dosage of 1 mL per 100 g of body weight, while the control group received an equivalent volume of distilled water.
2.2.2. Component Detection of BT
A measured portion of BT extract was added to a 2 mL tube with 600 μL methanol containing 4 μg/mL 2-chloro-L-phenylalanine and vortexed for 30 s. The sample was homogenized with steel beads (55 Hz, 60 s), ultrasonicated at room temperature for 15 min, then centrifuged at 12,000 rpm, 4°C for 10 min. The supernatant was filtered through a 0.22 μm membrane and transferred to a vial for LC-MS. Chromatography was carried out on a Vanquish UHPLC system (Thermo Fisher Scientific, USA) with an ACQUITY UPLC HSS T3 column (2.1 × 100 mm, 1.8 μm; Waters, Milford, MA, USA) at 40°C. For positive ion mode, mobile phases were 0.1% formic acid in water (A2) and acetonitrile (B2) with a gradient: 8% B2 (0–1 min), 8% to 98% B2 (1–8 min), 98% B2 (8–10 min), 98% to 8% B2 (10–10.1 min), and 8% B2 (10.1–12 min). For negative mode, acetonitrile (B3) and 5 mM ammonium formate in water (A3) followed the same schedule. The flow rate was 0.3 mL/min with a 2 μL injection volume. Mass spectrometric detection was performed on a Thermo Q Exactive Focus (Thermo Fisher Scientific, USA) with electrospray ionization in polarity-switching mode. Key parameter settings included spray voltages of +3.50 kV and –2.50 kV, sheath gas at 40 units, auxiliary gas at 10 units, a capillary temperature of 325°C, and full MS scans at 70,000 FWHM (m/z 100–1000). Data-dependent MS/MS selected the top three precursor ions for HCD fragmentation at 30 eV and 17,500 FWHM with dynamic exclusion to avoid redundant spectra.
2.3. Determination of Immunoglobulin
Serum concentrations of interleukin-1 beta (IL-1β) and interleukin-6 (IL-6) were quantified using commercially available enzyme-linked immunosorbent assay (ELISA) kits from Jianglai Bioengineering Institute (Shanghai, China) according to the manufacturer’s protocols and established methodologies. The intra- and inter-assay coefficients of variation for both biomarkers were maintained below 10%.
2.4. Detection of Oxidative Stress Levels
Lung, liver, and colon tissue samples were homogenized in ice-cold phosphate-buffered saline and subsequently centrifuged at 3000 × g for 10 minutes at 4°C. The resulting supernatants were collected for biochemical analyses. Superoxide dismutase (SOD) activity, catalase (CAT) activity, and malondialdehyde (MDA) concentration were quantified using commercially available assay kits (Yfxbio Biotech, Nanjing, China) according to the manufacturer’s protocols. Absorbance measurements were performed in triplicate using a microplate reader with the following wavelength settings: 450 nm for SOD, 240 nm for CAT, and 532 nm for MDA.
2.5. Quantitative Real-Time PCR Analysis
Total RNA was extracted from colon and lung samples using a previously established protocol [19]. An aliquot of 1 μg was subsequently reverse-transcribed into cDNA using the PrimeScript™ 1st Strand cDNA Synthesis Kit (Vazyme Biotech, R323) in accordance with the manufacturer's guidelines. Quantitative PCR amplification was carried out on a Real-Time PCR System (Applied Biosystems, USA) employing SYBR Premix EX Taq™ II (TaKaRa). Gene-specific primers for ZO-1, Occludin, GPR43, and NLRP3 were designed via NCBI Primer-BLAST by targeting the respective rat coding DNA sequences (Table S1). Thermal cycling conditions were as follows: an initial denaturation at 95 °C for 30 s, followed by 40 cycles of 95 °C for 10 s and 60 °C for 30 s. Gene expression levels were normalized to β-actin [20] and quantified using the 2^(-ΔΔCt) method [21], with no amplification observed in either no-template or non-reverse transcription controls.
2.6. SCFAs Content Measurement
SCFAs concentrations—including acetate, propionate, butyrate, isobutyrate, valerate, and isovalerate—in cecal contents were quantified using gas chromatography-mass spectrometry (GC-MS). The methodology was based on the protocol described by Shen et al. [22]. Samples and standards were analyzed on an Agilent 7080A GC system (Santa Clara, CA, USA), equipped with a flame ionization detector (FID) and a Supelco Nukol fused silica capillary column (30 m × 0.25 mm, with a film thickness of 0.25 μm). Peak areas were quantified using Agilent ChemStation, and SCFA concentrations were determined by comparing sample peak areas against standard calibration curves.
2.7. 16S rRNA Gene Sequencing and Bioinformatic Analysis of Cecal and Pulmonary Microbiota
To minimize sequencing costs, cecal content and lung tissue samples from 6 rats randomly selected were subjected to 16S rRNA high-throughput sequencing in a company (Novogene Co., Ltd., Beijing, China). Sequencing was performed on an Illumina NovaSeq 6000 platform (San Diego, CA, USA), generating raw sequencing data that underwent quality control processing: raw reads were spliced and filtered to produce clean data, which were then clustered into amplicon sequence variants (ASVs) using DADA2 in the QIIME2 software. Taxonomic annotation of ASVs was performed against the SILVA reference database (v138) to determine species composition and abundance profiles. The sequence data are available at the NIH Sequence Read Archive with the Bioproject ID: PRJNA1261695 (https://submit.ncbi.nlm.nih.gov/subs/bioproject/). Microbial diversity analyses included calculation of α-diversity indices (Chao1, Goods coverage, Observed features, Shannon, Simpson, and Pielou) at the ASV level by QIIME2. Linear discriminant analysis effect size (LEfSe) with an LDA score threshold ≥3 identified statistically significant biomarkers across the four groups using the Huttenhower Lab server platform. Biological functional prediction of ASV was predicted and annotated using Kyoto Encyclopedia of Genes and Genomes (KEGG) pathway database by Tax4Fun program.
2.8. Statistical Analysis
Body weight changes in Wistar rats were analyzed using repeated-measures ANOVA. Daily food intake, organ indices, cecal short-chain fatty acids (SCFAs), gene expression, and markers of antioxidant and inflammatory status were assessed via one-way ANOVA with Tukey’s post hoc test after verification of normality and homogeneity of variance. Intergroup differences in α-diversity indices, amplicon sequence variant (ASV) biomarker abundances, and predicted microbiota pathway enrichment profiles were evaluated using nonparametric Kruskal–Wallis tests. β-Diversity analysis of the cecal microbiota was performed with permutational multivariate ANOVA (PERMANOVA) based on Bray–Curtis dissimilarity matrices computed via the nested adonis function in the vegan R package (v4.4.3). Principal coordinates analysis (PCoA), implemented using the ape package, was applied to visualize microbial community structures at the ASV level, with analysis of similarities (ANOSIM) (using 999 permutations) quantifying group separations. PCoA and ANOSIM visualizations were generated using the ggplot2 R package. Spearman correlation analysis, with false discovery rate (FDR) adjustment, was performed using the psych R package, and the results were plotted via the corrplot package. Statistical significance was defined as P < 0.05. All nonparametric and ANOVA analyses were conducted using IBM SPSS Statistics 26 (Armonk, NY, USA).
3. Results
3.1. The Components of BT
Using LC–MS analysis, 649 components were identified in BT samples (see Figure S1 for substance peak diagrams in both the positive and negative ion modes). These components primarily consisted of amino acids, alkaloids, flavonoids, lipids, carbohydrates, phenylpropanoids, phenolics, vitamins, steroids, terpenoids, organic acids, and short peptides. The ten most prevalent constituents were L-phenylalanine (8.34%), L-proline (7.88%), S-carboxymethyl-L-cysteine (5.46%), 5-aminolevulinate (5.23%), 4-guanidinobutanal (4.11%), chlorogenic acid (3.80%), tryptophan (3.72%), galactinol dihydrate (3.35%), (S)-2-methylbutanal (3.23%), and D-mannose (2.75%) (Figure 1). Additional bioactive phenolic compounds identified included caffeic acid (0.023%), ferulate (0.02%), and quercetin (0.02%).
3.2. Effect of BT on Growth and Organ Indices
There were no significant differences in body weight (F3,32 = 1.456, P= 0.245) or daily food consumption (F3,36 = 0.267, P= 0.849) among the four groups (Table S2 and Figure S2). Similarly, the liver, kidney, lung, and spleen indices did not differ significantly (F3,36 = 2.411, P= 0.083; F3,36 = 2.056, P= 0.123; F3,36 = 1.847, P= 0.156; and F3,36 = 0.755, P= 0.527, respectively; Table S2).
3.3. Effect of BT on Immunoglobulin Levels
Serum IL-1β levels in both middle- and high-dose BT groups were significantly lower than that in control group (F3,36 = 29.068, P< 0.001; P = 0.042 and P < 0.001, respectively; Figure 2A). Serum IL-6 levels in low-, middle- and high-dose BT groups were all significantly lower than that in control group (F3,36 = 9.214, P< 0.001; P = 0.030, 0.021 and P < 0.001, respectively; Figure 2B).
3.4. Effect of BT on Levels of MDA, SOD and CAT Activity
In the colon, MDA levels in the middle- and high-dose BT groups were significantly lower than that in the control group (F3,36 = 4.412, P= 0.010; P = 0.018 and 0.020, respectively; Figure 3A). Similarly, in the lung, MDA levels in these groups were reduced relative to the control group and lung (F3,36 = 3.279, P= 0.032; P = 0.042 and 0.019, respectively; Figure 3B). In the liver, both the low- and middle-dose BT groups exhibited significantly lower MDA levels compared to the control group (F3,36 = 5.049, P= 0.005; P < 0.001 and P = 0.045, respectively; Figure 3C). Additionally, liver CAT activity in the middle- and high-dose BT groups was lower than that in the control group (F3,36 = 14.193, P < 0.001; P = 0.002 and P < 0.001, respectively; Figure 3D). No significant differences were observed in liver SOD activity, or lung SOD and CAT activity across the four groups (F3,36 = 0.446, P = 0.722; F3,36 = 0.830, P = 0.486; and F3,36 = 1.188, P = 0.328, respectively; Figure 3E–G).
3.5. Effect of BT on Cecal Microbiota
3.5.1. ASVs Analysis of Cecal Microbiota
A total of 17 phyla, 23 classes, 58 orders, 113 families, 241 genera, and 1,992 ASVs were identified in the cecum samples of the four experimental groups, with goods coverage reaching 1. The dominant phyla were Firmicutes (73.32 ± 2.97%), followed by Bacteroidota (11.63 ± 2.04%), Verrucomicrobiota (6.56 ± 2.37%), Actinobacteriota (6.16 ± 0.93%), and Proteobacteria (1.64 ± 0.61%) (Figure 4A). At the genus level, Blautia was predominant (12.66 ± 1.54%), followed by Staphylococcus (6.96 ± 1.51%), Akkermansia (6.56 ± 2.37%), Lactobacillus (5.49 ± 1.09%), and Subdoligranulum (5.12 ± 1.27%) (Figure 4B).
3.5.2. Differences in Diversities of Cecal Microbial Community
In the middle-dose BT group, the observed features (H = 10.651, P = 0.014; P = 0.020), Chao1 index (H = 10.420, P = 0.015; P = 0.022), and Shannon index (H = 8.896, P = 0.031; P = 0.026) were lower than those in the control group (Table 1). In contrast, no significant differences were observed among the four groups regarding the Simpson index (H = 5.563, P = 0.135) or the Pielou index (H = 7.309, P = 0.063) (Table 1).
There was a significant difference between groups marked with the different letter (P < 0.05).
PERMANOVA analysis showed that eight weeks of BT administration significantly altered the beta diversity of the cecal microbial community (F = 1.8992, P = 0.001), with the low- and middle-dose BT groups differing significantly from the control group (P = 0.021 and P = 0.028, respectively). Furthermore, principal coordinate analysis (PCoA) based on Bray–Curtis dissimilarity revealed that the first and second principal axes (PCoA1 and PCoA2) accounted for 21.88% and 12.63% of the variation in the cecal microbiome structure after eight weeks of BT administration (Figure 5A). Although the ordination plot did not completely segregate the control, low-, middle-, and high-dose BT groups, ANOSIM demonstrated that the intergroup differences exceeded the intragroup differences observed in the control, middle-, and high-dose BT cohorts (R = 0.22, P = 0.001) (Figure 5B).
3.5.3. Differences in Abundances of Cecal Microbiota
In the low-dose BT group, the relative abundance of the class Negativicutes (H = 10.702, P = 0.013; P = 0.017), the order Acidaminococcales (H = 14.470, P = 0.002; P < 0.001), and the family Acidaminococcaceae (H = 14.470, P = 0.002; P < 0.001) were significantly higher than those in the control group (Figure 6A,B and Figure 7). Additionally, the relative abundances of the orders Rhizobiales, Burkholderiales and Pseudomonatales, along with the families Moraxellaceae, Aerococcaceae, Oscillospiraceae, Alcaligenaceae, Enterococcaceae, and Butyricicoccaceae, differed significantly from the control group following BT treatment (P < 0.05) (Table S3).
In the low-dose BT group, the relative abundances of the genera Phascolarctobacterium (H = 14.470, P = 0.002; P < 0.001), Alloprevotella (H = 8.708, P = 0.033; P = 0.007), Desulfovibrio (H = 13.658, P = 0.003; P = 0.003), and NK4A214 group (H = 13.649, P = 0.003; P = 0.004) were higher than those in the control group. Conversely, the relative abundance of genus Ruminococcus (H = 10.096, P = 0.018; P = 0.002 and 0.043, respectively) in the middle- and high-dose BT groups and that of Christensenellaceae-R7 group (H = 7.867, P = 0.049; P = 0.022 and 0.011, respectively) in the low- and middle- dose BT groups were lower than those in the control group (Figure 6A,B and Figure 7). Additionally, the abundances of the genera Psychrobacter, Prevotella 9, Colidextribacter and [Eubacterium] siraeum group, unidentified Oscillospiraceae, Oligella, Enterococcus, Anaerostipes, and Ligilactobacillus differed significantly from those of the control group after BT treatment (P < 0.05; Table S3).
3.5.4. Differences in Abundances of Cecal Predicted Microbial Function
The abundances of 35 KEGG level-3 pathways within the cecal bacterial communities were altered following eight weeks of BT administration (Figure 8). Specifically, the benzoate degradation (H = 9.347, P = 0.025; P = 0.004), phenylalanine metabolism (H = 8.447, P = 0.038; P = 0.037) and pyruvate metabolism (H = 8.620, P = 0.035; P = 0.030) pathways were more dominant in the low-dose BT group compared to the control group. In contrast, the neomycin, kanamycin and gentamicin biosynthesis (H = 10.847, P = 0.013; P = 0.025) and streptomycin biosynthesis (H = 7.847, P = 0.049; P = 0.009) pathways were less dominant in the low-dose BT group relative to the control group. Moreover, the Epstein-Barr virus infection pathway was less abundant in the middle- and high-dose BT groups than in the control group (H = 12.671, P = 0.005; P = 0.010 and 0.032, respectively). Additionally, the staurosporine biosynthesis (H = 8.613, P = 0.035; P = 0.009 and 0.018, respectively) and tetracycline biosynthesis (H = 8.387, P = 0.039; P=0.011 and 0.018, respectively) pathways were more prevalent in the low- and high-dose BT groups compared to the control group. The pathogenic Escherichia coli infection pathway (H = 12.120, P= 0.007; P = 0.014) was less abundant in the middle-dose BT group relative to the control group (Table S4). Furthermore, the abundances of pathway related to biofilm formation-Pseudomonas aeruginosa, G protein-coupled receptors, pertussis, protein folding and associated processing, styrene degradation, lipid metabolism, photosynthesis proteins, transport, zeatin biosynthesis, oxytocin signaling pathway, and Shigellosis exhibited significant differences compared to the control group following BT treatment (P < 0.05) (Table S4).
3.5.5. Relationship Between Abundances of Cecal Microbiota and Predicted Microbial Function
Neomycin, kanamycin and gentamicin biosynthesis pathway was negatively correlated with the abundances of Desulfovibrio (r = –0.56, P = 0.004) and NK4A214 group (r = –0.78, P < 0.001) (Figure 9). Streptomycin biosynthesis displayed significant negative correlations with Phascolarctobacterium (r = –0.65, P = 0.001), Desulfovibrio (r = –0.49, P = 0.014), and the NK4A214 group (r = –0.67, P < 0.001). In contrast, staurosporine biosynthesis was positively correlated with Alloprevotella (r =0.45, P =0.029). Benzoate degradation exhibited positive correlations with Phascolarctobacterium (r = 0.46, P = 0.025), Alloprevotella (r = 0.43, P = 0.034), Desulfovibrio (r = 0.41, P = 0.048), and the NK4A214 group (r = 0.71, P < 0.001). Additionally, both the pathogenic Escherichia coli infection and Epstein-Barr virus infection pathways were positively correlated with Ruminococcus (r = 0.67, P < 0.001; r = 0.65, P = 0.001, respectively) and Christensenellaceae-R7 group (r = 0.43, P = 0.037; r = 0.46, P = 0.023, respectively).
3.6. Effect of BT on Pulmonary Microbiota
3.6.1. ASVs Analysis of Pulmonary Microbiota
In total, 44 phyla, 94 classes, 190 orders, 294 families, 500 genera, and 4,669 ASVs were identified in the lung samples across the four experimental groups. The Goods coverage index reached 1, suggesting complete sampling coverage. At the phylum level, Proteobacteria (41.01 ± 4.89%) was the most predominant, followed by Firmicutes (23.46 ± 4.08%), Actinobacteria (21.60 ± 4.14%), and Bacteroidota (1.07 ± 0.20%) (Figure 10A). At the genus level, the dominant taxa were Pseudoalteromonas (10.45 ± 2.09%), followed by Streptomyces (8.93 ± 2.00%), Vibrio (8.20 ± 1.52%), Bacillus (7.73 ± 1.72%), and Mycoplasma (7.67 ± 4.64%) (Figure 10B).
3.6.2. Differences in Diversities of Pulmonary Microbial Community
No significant differences were observed in the observed features (H = 0.647, P = 0.886), Chao1(H = 0.647, P = 0.886), Shannon (H = 0.780, P = 0.854), Simpson (H = 0.741, P = 0.864) and Pielou indices (H = 0.087, P = 0.993) among the four groups (Table S5). The PERMANOVA analysis showed that BT administration for eight weeks did not significantly altered the beta diversity of the lung microbial community (F = 0.6418, P = 0.758).
3.6.3. Differences in Abundances of Pulmonary Microbiota
The relative abundance of the order Bifidobacteriales (H = 8.644, P = 0.034; P = 0.008), the family Bifidobacteriaceae (H = 8.644, P = 0.034; P = 0.008), and the genera Lactobacillus (H = 8.672, P = 0.034; P = 0.004) and Megasphaera (H = 13.658, P = 0.003; P = 0.003) in the high-dose BT group were significantly higher than those in control group (Figure 11A,B and Figure 12). Moreover, the relative abundance of genus Corynebacterium (H = 8.595, P = 0.035; P = 0.007 and 0.021, respectively) in both the middle- and high-dose BT groups were elevated compared to the control group (Figure 11A,B and Figure 12). In addition, significant differences were detected in the order Veillonellales-Selenomonadales and the genus Gardnerella between the BT-treated and control groups (P < 0.05; Table S3).
3.6.4. Differences in Abundances of Pulmonary Microbial Predicted Functions
The abundances of 19 KEGG level-3 pathways in the lung bacterial communities altered following the administration of BT for eight weeks (Figure 13). Specifically, the chromosome and associated proteins (H = 9.740, P = 0.021; P = 0.014) and the D-Alanine metabolism (H = 11.420, P = 0.010; P = 0.027) pathways were more dominant in the middle-dose BT group compared to the control group, whereas histidine metabolism pathway was less abundant in the middle-dose BT group (H = 8.587, P = 0.035; P = 0.034). The primary bile acid biosynthesis (H = 9.980, P = 0.019; P = 0.009) and secondary bile acid biosynthesis (H = 9.273, P = 0.026; P = 0.013) pathways were more prevalent in the high-dose BT group than those in the control group. Conversely, the phenylalanine tyrosine and tryptophan biosynthesis (H = 9.927, P = 0.019; P = 0.025), riboflavin metabolism (H = 14.447, P = 0.002; P < 0.001) and vitamin B6 metabolism (H = 8.740, P = 0.033; P = 0.016) pathways exhibited lower abundance relative to controls (Table S6). Additionally, the pathways involved in neuroactive ligand-receptor interaction, viral proteins, nucleotide metabolism, vasopressin-regulated water reabsorption and synaptic vesicle cycle pathways differed significantly from the control group following BT treatment (P < 0.05 for all; Table S6).
3.6.5. Relationship Between Abundances of Pulmonary Microbiota and Predicted Microbial Functions
The abundances of Bifidobacteriales (r = 0.49, P = 0.015; r = 0.47, P = 0.021, respectively), Bifidobacteriaceae (r = 0.49, P = 0.015; r = 0.47, P = 0.021, respectively), Lactobacillus (r = 0.63, P = 0.001; r = 0.60, P = 0.002, respectively), Corynebacterium (r = 0.46, P = 0.022; r = 0.44, P = 0.032, respectively), Megasphaera (r = 0.55, P = 0.005; r = 0.54, P = 0.007, respectively) and Gardnerella (r = 0.44, P = 0.031; r = 0.41, P = 0.046, respectively) were all positively correlated with both primary and secondary bile acid biosynthesis (Figure 14).
3.7. Relationship Between Abundances of Cecal and Pulmonary Microbiota
The abundances of Oligella and Psychrobacter were positively correlated with those of Bifidobacteriales (r = 0.55, P = 0.005; r = 0.44, P = 0.033, respectively), Bifidobacteriaceae (r = 0.55, P = 0.005; r = 0.44, P = 0.033, respectively), and Lactobacillus (r = 0.61, P = 0.002; r = 0.41, P = 0.048, respectively). Additionally, Megasphaera showed a positive correlation with both Oligella and the Christensenellaceae-R7 group (r = 0.45, P = 0.028; r = 0.43, P = 0.038, respectively). Furthermore, the Christensenellaceae-R7 group was positively correlated with Gardnerella and Negativicutes (r = 0.55, P = 0.005; r = 0.43, P = 0.035, respectively) (Figure 15).
3.8. Effect of BT on Cecal SCFAs
The acetate content in the middle-dose BT group was significantly higher than that in the control group (F3,36 = 3.036, P = 0.042; P = 0.026; Figure 16A). Similarly, the propionate content in the low-, middle- and high-dose BT groups was significantly higher than that in the control group (F3,36 = 9.825, P< 0.001; P = 0.004, P < 0.001 and P = 0.022; respectively; Figure 16B). In addition, the contents of isobutyrate (F3,36 = 6.313, P = 0.001; P = 0.010, 0.002 and 0.027; respectively; Figure 16C) and isovalerate (F3,36 = 5.487, P = 0.003; P = 0.007, 0.008 and 0.034, respectively; Figure 16D) in the low-dose BT group were higher than those in control, middle- and high-dose BT groups. In contrast, the contents of butyrate and valerate did not differ significantly among the four groups (P > 0.05; Figure 16E-F).
3.9. Expression of SCFAs Receptor and Inflammasome Genes in Colon and Lung
Relative mRNA expression level of GPR43 in the colon of low-dose BT group was significantly higher than in both control and high-dose groups (F3,36 = 7.096, P < 0.001; P = 0.010 and P < 0.001, respectively; Figure 17A). In the lung, the relative mRNA expression of GPR43 in the middle-dose BT group was significantly elevated compared to that in the control group (F3,36 = 3.498, P = 0.025; P = 0.013; Figure 17B). Moreover, the relative mRNA levels of NLRP3 in the middle-dose BT group were significantly lower than those in the control group in both the colon (F3,36 = 3.835, P = 0.018; P = 0.013; Figure 17C) and the lung (F3,36 = 2.926, P = 0.047; P = 0.028; Figure 17D).
3.10. Effects of BT on Expressions of ZO-1 and Occludin
The mRNA expression of ZO-1 was significantly higher in both the low-dose and middle-dose BT groups compared with the control group in the colon (F3,36 = 5.715, P = 0.003; P = 0.027 and 0.002, respectively; Figure 18 A) and lung (F3,36 = 6.194, P = 0.002; P = 0.016 and 0.001, respectively; Figure 18B). Additionally, the relative mRNA expression of Occludin in middle-dose BT group was significantly elevated compared to the control group in the colon (F3,36 = 2.985, P = 0.044; P = 0.029; Figure 18 C), whereas in the lung, the low-dose BT group exhibited a significantly higher expression level than the control group (F3,36 = 7.318, P < 0.001; P = 0.008; Figure 18 D).
3.11. Relationship Between SCFAs Content, and Genes Expression, Antioxidant and Inflammatory Levels
Propionate content was positively correlated with colonic ZO-1 expression (r = 0.46, P = 0.003) and negatively correlated with colonic NLRP3 expression (r = − 0.39, P = 0.012) and MDA level (r = −0.51, P = 0.001), as well as with MDA levels in both the liver (r = −0.32, P = 0.048) and lung (r = −0.34, P = 0.034) and with IL-6 level (r = −0.33, P = 0.04) (Figure 19). Acetate content exhibited significant negative correlations with colonic NLRP3 expression (r = −0.38, P = 0.016) and MDA levels (r = −0.32, P = 0.045) in colon (Figure 19). Additionally, both isobutyrate (r = 0.36, P = 0.024) and isovalerate (r = 0.38, P = 0.016) contents were positively correlated with occludin expression in the lung (Figure 19).
4. Discussion
This study firstly investigated the effect of Burdock root tea on microbial community, oxidative stress level, SCFAs pathway gene expression of lung and gut in normal rats. Our current results demonstrate that oral gavage of BT for 8 weeks did not obviously change the rat weight. This might be due to the unchanged daily food intake. Similarly, the body weight gain of rat treated by burdock root ethanolic extract for 2 weeks did not vary significantly [23], inulin extracted from edible burdock treated for 2 weeks did not bring obvious change of body weight in mice [24], and polyphenols from A. lappa treated for 4 weeks did not significantly change the body weight in mice [25]. In accordance to the body weight, the organs (lung, spleen and liver) weight in rat also did not change largely. Similarly, spleen weight did not change after polyphenols from A. lappa treatment [25]. Those indicate that BT has no obvious effect on the growth of animal. Index of liver were not reduced, which indicates BT is not toxic to body.
Present study found that the compounds present in BT differed from those isolated using 70% ethanol from A. lappa as described by Wu et al. [25], likely due to the variations in extraction methods and solvents. Nonetheless, some components such as chlorogenic acid, caffeic acid, and ferulate were common to both studies. L-phenylalanine, an essential amino acid, is converted into tyrosine, which then facilitates the formation of DOPA (3,4-dihydroxyphenylalanine) and dopamine, subsequently influencing blood pressure regulation [26]. Additionally, L-phenylalanine can trigger the secretion of GLP-1, thereby aiding in glucose regulation [27]. Given that L-phenylalanine was the most abundant compound detected in present study, regular consumption of BT may help maintain stable blood glucose and blood pressure levels. Furthermore, S-Carboxymethyl-L-cysteine (CMC), a potent antioxidant used in the treatment of chronic obstructive pulmonary disease [28], was found in relatively high amounts, suggesting that BT might also support pulmonary health. In addition, D-mannose, often employed as a dietary supplement for urinary tract support, tumor growth inhibition, and regulatory T cell differentiation [29,30], further indicates that BT may confer multiple health benefits.
CAT and SOD in the antioxidant enzyme system play important roles in responding to oxidative stress [31,32]. SOD can convert superoxide radicals into hydrogen peroxide (H2O2) and molecular oxygen, while CAT transforms the harmful H2O2 into harmless water, thereby achieving antioxidant effects. MDA, a product of lipid peroxidation, reflects the extent of oxidative damage to cell membranes and is associated with the level of oxidative stress in the body [33]. In present study, MDA levels decreased in the lung, colon, and liver, indicating that BT can reduce oxidative stress. However, CAT and SOD levels did not increase in the lung and liver; in fact, CAT levels decreased in the liver after BT treatment. We speculate that the reduction in oxidative stress prevents the activation of the antioxidant enzyme system, resulting in no obvious enhancement in both CAT and SOD levels. Polyphenolic compounds, such as flavonoids, flavanols, and phenolic acids, and polysaccharides can directly act as antioxidant to scavenging the free radicals to restrain the oxidative stress [34,35]. Plenty of polyphenols, flavonoids and polysaccharides were presented in BT in present study. CMC, Quercetin and Chlorogenic acid with antioxidant nature [28,36,37], were detected in BT in present study. Therefore, BT has the capacity of antioxidant to directly act on free radicals to reduce the oxidative stress. Similarly, polysaccharides derived from A. lappa could not change the CAT and SOD level in lung compared to the control group in mice [38], and low dose of polyphenols from A. lappa did not change the serum CAT and SOD level in mice [25]. Negative correlations between propionate and MDA level in lung, colon and liver, and between acetate and MDA level in colon, indicate that SCFAs might contribute to decrease the oxidative stress.
The ASV numbers identified in lung was more than that in cecum in present study. It might be due to the different sampling method, content used in cecum while tissue used in lung, because homogenized lung tissue method can get greater microbiota signal in lung [39]. Similarly, the numbers of OTUs in lung was greater than that in the intestine of Wistar rats [40]. The two bacterial phyla with the highest abundance in the gut microbiota of rats are Firmicutes and Bacteroidetes [41]. Consistently, Firmicutes and Bacteroidetes are of the highest abundance in the cecum of rats in present study. The Chao1 and Shannon index were both decreased in middle-dose group, and the microbiota community structure of both low and middle dose group differed from the control group, indicating BT gavage could influence the diversity of cecal microbiota community with a dose-dependent effect. Consistently, polyphenols and polysaccharide from A. lappa treatment produced a decrease trend in gut microbiota community diversity in mice [25,42]. The pulmonary microbiota plays a crucial role in the immune responses of both humans and animals [43]. The two most abundant bacterial phyla in the pulmonary microbiota of rats are Proteobacteria and Firmicutes [40,44]. Consistent with this, the two most abundant bacterial phyla in the pulmonary microbiota of rats in present study were also Proteobacteria and Firmicutes. The alpha and beta diversities of the lung microbiota exhibited minimal changes, with only seven taxonomic abundances differing from those in the control group. These findings suggest that burdock root tea exerts a less pronounced effect on the diversity and structure of the lung microbiota than on the cecal microbiota community. We infer it is BT gavage directly acting on gut microbiota, while indirectly acting on lung microbiota, that brings this difference. Either positive or negative correlation between cecal and lung microbiota abundance observed indicates the regulation of cecal microbiota on lung microbiota community when BT treatment.
In present study, the gavage of low-dose BT enriched the relative abundance of the class Negativicutes, order Acidaminococcales, family Acidaminococcaceae, and the genera Phascolarctobacterium, NK4A214-group, Desulfovibrio, and Alloprevotella in the cecal microbiota of rats. The class Negativicutes has been confirmed to ferment carbohydrates into acetate [45]. The genus Phascolarctobacterium, belonging to family Acidaminococcaceae, order Acidaminococcales and class Negativicutes, is an important producer of acetate and propionate [46]. The relative abundance of intestinal Phascolarctobacterium increased with elevated concentrations of propionate, isobutyrate, butyrate, isovalerate, and valerate in feces [47]. The gut microbiota, such as Alloprevotella, contributes to intestinal development and the maturation of mucosal immunity by producing various short-chain fatty acids (SCFAs), thereby defending against pathogenic invasion [48]. Desulfovibrio metabolizes choline, ethanol, and furfural to produce acetate [49,50,51], attenuating hepatic steatosis in high-fat diet-fed mice by regulating hepatic lipid metabolism [52]. In present study, after the intragastric administration of BT, the levels of acetate, propionate, isobutyrate, and isovalerate in the cecum increased, especially in low-dose group. Therefore, the increments of SCFAs are due to the increased abundance of SCFAs-producing bacteria. Consistently, polyphenols from A. lappa treatment increases the level of propionate [25]. Additionally, the NK4A214 group is considered to possess cellulose-degrading capabilities [53]. Therefore, BT can enrich gut beneficial bacteria to exert benefits in the SCFAs-production and cellulose-degrading. Research has demonstrated that the relative abundance of Ruminococcus in the gut increases in individuals suffering from various conditions including Crohn's disease, intestinal stress syndrome, and diabetes [54]. Furthermore, children with a history of Kawasaki disease have been found to exhibit an increased presence of Ruminococcus, which is capable of producing pro-inflammatory polysaccharides that disrupt intestinal immune function [55]. Similarly, the Christensenellaceae-R7 group is found in higher quantities in patients with intestinal ailments such as rectal cancer [56]. In present study, BT administration resulted in a decreased relative abundance of both cecal Ruminococcus and Christensenellaceae-R7 group in rats. Additionally, a reduction was observed in the activity of the Epstein-Barr virus infection and pathogenic Escherichia coli infection pathways within the middle-dose group. Given their positive correlation with both Ruminococcus and Christensenellaceae-R7 group, these results imply that BT may help curb the proliferation of these bacteria, thereby reducing susceptibility to related viral and bacterial infections and alleviate the host's adverse responses associated with the overgrowth of these microbial groups.
Neomycin, kanamycin and gentamicin biosynthesis and Streptomycin biosynthesis pathways in rat cecal microbiota were both downregulated by low-dose BT in present study. Overexpression of multiple antibiotics biosynthesis (streptomycin, validamycin, vancomycin, and tetracycline) pathway in gut microbiota was observed in more exposure to antibiotics group [57]. Antibiotic exposure has been linked to the selection and survival of gut bacteria with corresponding antibiotic biosynthesis genes [57]. While these antibiotics can help fight infections, they can also locally induce dysbiosis and alter gut microbiota diversity by favoring the survival of bacteria with antibiotic resistance genes[57]. The microbiome of infants born to obese mothers was significantly enriched in streptomycin biosynthesis [58]. Thus, we infer that some-dose BT intake could restrain the production of antibiotics and the bacteria with antibiotic resistance genes, which is beneficial to gut microbiota community and host body. In present study, the Staurosporine biosynthesis pathway was enriched by low- and high-dose BT. Staurosporine, an indolocarbazole compound, is considered a promising lead compound for synthesizing potent antitumor agents due to its ability to inhibit various protein kinases [59]. Phascolarctobacterium, Desulfovibrio, and NK4A214 group negatively correlated with Neomycin, kanamycin and gentamicin biosynthesis and Streptomycin biosynthesis pathways, whereas positively correlated with Staurosporine biosynthesis in present study. Therefore, BT might enhance those bacteria abundance to restrain the antibiotics biosynthesis and stimulate the production of potent antitumor agents. When consuming BT the rat gut is exposed to a variety of microorganisms, which have extensive metabolic capabilities that the rat lacks. These microorganisms can biotransform compounds in BT, which may be relevant to xenobiotic metabolism. This process can convert many classes of compounds, including flavonoids, isoflavonoids, lignans, phenolic acids, fiber, and tannins [60,61]. In present study, the enrichment of Benzoate degradation and Styrene degradation, pathways within xenobiotic degradation and metabolism, was observed in the low dose group. Consistently, Benzoate compounds and Styrene were detected in burdock root tea by LC–MC in present study. Benzoate degradation positively correlating with Alloprevotella, Desulfovibrio, and NK4A214 group indicate that those bacteria might help xenobiotic degradation and metabolism. Phenylalanine metabolism pathway, within amino acid metabolism, and pyruvate metabolism, within carbohydrate metabolism, was enriched in the low dose group, indicating that BT can influence amino acid and carbohydrate metabolism of gut microbiota. Consistently, L- phenylalanine was the richest ingredient in BT in this study. However, over high level of phenylalanine in serum is harmful [62], therefore enrichment of phenylalanine metabolism pathway might help to maintain the normal level of phenylalanine in rats.
Megasphaera is recognized as a constituent of the human lung microbiome [63] and plays a beneficial role for the host by producing SCFAs [64]. Moreover, its presence correlates with a diminished activation of host inflammatory pathways, potentially contributing to the reversal of airway inflammation [65]. The presence of Corynebacterium is associated with reduced colonization and infection risk levels of pneumococcus in both adults and children [66]. In in vitro experiments, media containing Corynebacterium inhibited the growth of Streptococcus pneumoniae [67]. Furthermore, the abundance of Corynebacterium was found to be negatively correlated with the abundance of Staphylococcus aureus [68]. Lactobacillus colonizes various organs in the human body, metabolizing carbohydrates to produce lactic acid and protecting the host from pathogen invasion [69]. Lactobacillus can prevent the colonization of Streptococcus pneumoniae at the respiratory mucosal barrier [70]. Furthermore, Lactobacillus can induce Th17 and T cells, thereby reducing lung infections in tuberculosis [71]. In present study, the administration of middle- and high-dose BT increased the relative abundance of Corynebacterium, and high-dose BT increased the relative abundance of Lactobacillus and Megasphaera in the lungs of rats. Therefore, BT may help prevent lung from the invasion of pathogens and inflammation by increasing the abundance of Corynebacterium, Lactobacillus and Megasphaera in the lungs. While, inulin extracted from edible burdock could increase the growth of cecal Lactobacilli in mice[24], and polysaccharide from A. lappa treatment increases gut Lactobacillus abundance in LPS-treated mice [42,72]. Some bacteria in the Bifidobacteriaceae family within the human body are capable of producing SCFAs, which promote mucosal immunity, barrier function, and antioxidant activity[73]. Interesting, in present study high-dose BT gavage increased the relative abundance of Bifidobacteriaceae in lung, hinting that BT may aid to benefit lung health in the organism by enhancement of Bifidobacteriaceae abundance.
Chromosome and associated proteins pathway, within replication and repair, was enriched in middle-dose group of lung microbiota, which might indicate burdock root tea has the protective effect to prevent bacteria gene from mutation. Phenylalanine, tyrosine and tryptophan biosynthesis pathway, riboflavin metabolism pathway, and vitamin B6 metabolism pathway were all reduced in high-dose group, and histidine metabolism pathway was reduced in the middle-dose group. D-Alanine metabolism, within metabolism of other amino acids, was enriched in middle dose group of lung microbiota. Primary and secondary bile acid biosynthesis, within lipid metabolism, were both enriched in high dose group of lung microbiota. Those indicate that BT may influence metabolism of amino acids, vitamin and lipid in lung microbiota. Lipids are closely linked to early source of caseation and are essential in the generation of caseous necrosis in pulmonary tuberculosis [74,75]. Therefore, BT might enhance the lipid metabolism of microbiota to prevent the occurrence of pulmonary tuberculosis. Reduced phenylalanine biosynthesis pathway is due to the abundance of L- phenylalanine in BT. Bifidobacteriales, Bifidobacteriaceae, Lactobacillus, Corynebacterium, and Megasphaera positively correlating with primary bile acid biosynthesis or secondary bile acid biosynthesis indicate that those bacteria might help the lipid metabolism in the lung.
In present study, low-dose BT gavage upregulated the relative expression of GPR43, while middle-dose BT gavage downregulated the relative expression of NLRP3 in the colons of rats. Middle-dose BT gavage upregulated the relative expression of GPR43 and downregulated the NLRP3 expression in the lungs of rats. SCFAs mainly exert their signaling effects and participate in immune regulation by activating GPR41 and GPR43 [76]. NLRP3, an inflammasome, is significantly upregulated in chronic obstructive pulmonary disease (COPD) models [77]. SCFAs (acetate, propionate, and butyrate) can enhance the expression of GPR43 while downregulating the expression of NLRP3, IL-18, and IL-1β, thereby strengthening the mucosal immune function of the gut and lungs in rats with chronic obstructive pulmonary disease [78]. The levels of acetate, propionate, isobutyrate, and isovalerate in the cecum were enhanced in present study, so the variation of GPR43 and NLRP3 expression should be possibly mediated by the elevation of SCFAs in cecum after BT gavage. In accordance with the downregulation of NLRP3 expression, the reduction of IL-1β and IL-6 level in rat serum were observed. Consistently, negative correlations between propionate and expression of NLRP3 in colon and IL-6 level, and between acetate and NLRP3 expression were observed in present study.
Both IL-1β and IL-6 are pro-inflammatory factors and serve as key indicators for assessing the inflammation level in the body [79,80]. In present study, both middle- and high-dose BT gavage significantly reduced the level of IL-1β and IL-6. Similarly, long-term intake of burdock oligofructose can reduce the overexpression and excessive secretion of inflammatory factors (IL-1β, IL-6, TNF-α, and MCP-1) induced by dextran sulfate sodium, alleviating intestinal inflammation [81]. An alkali-soluble polysaccharide and water-soluble polysaccharide from A. lappa treatment both reduced the serum IL-1β and IL-6 level in inflammatory mice [42,72]. This indicates that BT may contain bioactive components involved in immune modulation, which can enhance the immune response and antiviral capacity in rats. Furthermore, the water-soluble polysaccharides in burdock may also influence the bidirectional communication between the gut and the immune system[65]. While metabolites from the gut microbiota, such as SCFAs, can affect the secretion of immune cells[82]. In present study, BT components also contain polysaccharides; therefore, the immune effects of BT on rats may be attributed to the presence of active components (such as polysaccharides) that regulate the gut microbiota, and the impact of gut microbiota on host immune function may be mediated by gut metabolic products such as SCFAs. Additionally, Phascolarctobacterium exhibited a negative correlation with hepatic IL-1β levels [47]. So enriched Phascolarctobacterium might contribute to the decrease of IL-1β level by enhancing SCFAs in the rats in the present study.
The gastrointestinal and respiratory barriers are important components of the epithelial barriers in the human body [83]. They serve as selective barriers that regulate the transport of gases and nutrients while maintaining a healthy microbiota and preventing pathogen invasion[84,85]. The tight junctions (TJs) between epithelial cells uphold the integrity of the mucosal barrier [86]. TJs play a crucial role in maintaining the integrity and impermeability of the intestinal barrier [87], preventing the translocation of commensal and pathogenic bacteria [88,89]. In present study, both middle-dose BT gavage significantly increased the expression of TJs protein, ZO-1, and low-dose BT increased expression of Occludin in colon, and low- and middle-dose BT enhanced the expression of ZO-1 and low-dose BT enhanced the expression of Occludin in lung, which indicates BT could enhance the gastrointestinal and respiratory barriers and elevate the protection on gut and lung. Enhancement of SCFAs in mouse feces can upregulate the mRNA levels of intestinal TJs (ZO-1 and Occludin) and reducing the levels of inflammatory cytokines (IL-1β, IL-6, and TNF-α) [90]. Therefore, upregulation of ZO-1 and Occludin expression in both colon and lung in present study should be due to the elevation of SCFAs in the gut. Consistently, significantly positive correlation between SCFAs and ZO-1 and Occludin expression were observed in present study. Additionally, Phascolarctobacterium exhibited a positive correlation with the expression of the hepatic Occludin [47]. So enriched Phascolarctobacterium might contribute to the elevation of Occludin expression by enhancing SCFAs in the rats in present study. Enhancement of lung weight/ body weight ratio together with TNF-α and IL-1β produced in lung reflexed the permeability of the air-blood barrier and lung histopathological scores increase [91]. Therefore, the reduced trend of lung index together with reduced IL-1β level might indicate that the lung barrier has been enhanced.
5. Conclusions
The present study demonstrates that BT is nontoxic and comprises numerous ingredients with beneficial bioactive properties that promote overall health. Notably, BT can alter the diversity and structure of the cecal microbiota, increase the abundance of beneficial bacteria, and enrich predicted microbial functions in both the cecum and lung of normal rats. Furthermore, BT can elevate the production of SCFAs in the cecum, upregulate the expression of SCFA receptors in the colon and lung, enhance colon and lung barrier function, and downregulate the expression of the inflammatory pathway gene NLRP3, thereby reducing inflammation in both tissues. Consequently, SCFAs may play a crucial mediating role in regulating immune levels in rats treated with BT. Additionally, BT can mitigate oxidative stress levels in normal rats. We infer that BT might exert protective effect on lung through gut-lung axis mediating by SCFAs and through downregulation of oxidative stress by its components with antioxidant nature. Present study implies that BT, as a daily beverage, can confer certain healthy benefits for the gut and lungs in normal body, providing a theoretical and experimental basis for the further development and application of BT in daily life.
Supplementary Materials
The following supporting information can be downloaded at the website of this paper posted on Preprints.org.
Author Contributions
Conceptualization, X.D.; Methodology, X.D.; Software, X.D.; Validation, S.M.Y.; Formal Analysis, X.F.P. and X.D.; Investigation, X.F.P., J.Y.Z., and L.Z.C.; Resources, X.D., S.M.Y. and W.H.W.; Data Curation, X.F.P., J.Y.Z. and X.D.; Writing – Original Draft Preparation, X.F.P. and X.D.; Writing – Review & Editing, S.M.Y. and W.H.W.; Visualization, X.D. and X.F.P.; Supervision, S.M.Y. and W.H.W.; Project Administration, S.M.Y. and X.D.; Funding Acquisition, X.D., S.M.Y. and W.H.W.
Data Availability
The sequence data are available at the NIH Sequence Read Archive with Bioproject ID PRJNA1261695.
Ethic Statement
All protocol and procedures were approved by the Animal Care and Use Committee of the Faculty of Veterinary Medicine at the Yangzhou University (No. NSFC2020-SKXY-6).
Acknowledgments
This work was supported by the National Natural Science Foundation of China (Grant number: 32370438) and the Priority Academic Program Development of Jiangsu Higher Education Institutions.
Conflicts of Interest
The authors declare no conflict of interest.
References
- Song, Y.; Yang, Y.; Xu, L.; Bian, C.; Xing, Y.; Xue, H.; Hou, W.; Men, W.; Dou, D.; Kang, T. The burdock database: a multi-omic database for Arctium lappa, a food and medicinal plant. BMC Plant Biol. 2023, 23, 86. [Google Scholar] [CrossRef] [PubMed]
- Mizuki, A.; Tatemichi, M.; Nakazawa, A.; Tsukada, N.; Nagata, H.; Kinoshita, Y. Effects of Burdock tea on recurrence of colonic diverticulitis and diverticular bleeding: An open-labelled randomized clinical trial. Sci. Rep. 2019, 9, 6793. [Google Scholar] [CrossRef]
- Lee, D.; Kim, C.Y. Influence of Roasting Treatment on the Antioxidant Activities and Color of Burdock Root Tea. Prev. Nutr. Food Sci. 2017, 22, 21–29. [Google Scholar] [CrossRef] [PubMed]
- Adak, A.; Khan, M.R. An insight into gut microbiota and its functionalities. Cell. Mol. Life Sci. 2018, 76, 473–493. [Google Scholar] [CrossRef]
- Burrows, K.; Ngai, L.; Chiaranunt, P.; Watt, J.; Popple, S.; Forde, B.; Denha, S.; Olyntho, V.M.; Tai, S.L.; Cao, E.Y.; et al. A gut commensal protozoan determines respiratory disease outcomes by shaping pulmonary immunity. Cell 2025, 188, 316–330. [Google Scholar] [CrossRef]
- Haran, J.P.; McCormick, B.A. Aging, Frailty, and the Microbiome—How Dysbiosis Influences Human Aging and Disease. Gastroenterology 2021, 160, 507–523. [Google Scholar] [CrossRef] [PubMed]
- Groschwitz, K.R.; Hogan, S.P. Intestinal barrier function: Molecular regulation and disease pathogenesis. Journal of Allergy and Clinical Immunology 2009, 124, 3–20. [Google Scholar] [CrossRef]
- Kuo, W.T.; Odenwald, M.A.; Turner, J.R.; Zuo, L. Tight junction proteins occludin and ZO-1 as regulators of epithelial proliferation and survival. Ann. N. Y. Acad. Sci. 2022, 1514, 21–33. [Google Scholar] [CrossRef]
- Hisada, M.; Hiranuma, M.; Nakashima, M.; Goda, N.; Tenno, T.; Hiroaki, H. High dose of baicalin or baicalein can reduce tight junction integrity by partly targeting the first PDZ domain of zonula occludens-1 (ZO-1). Eur. J. Pharmacol. 2020, 887, 173436. [Google Scholar] [CrossRef]
- Miao, W.; Wu, X.; Wang, K.; Wang, W.; Wang, Y.; Li, Z.; Liu, J.; Li, L.; Peng, L. Sodium Butyrate Promotes Reassembly of Tight Junctions in Caco-2 Monolayers Involving Inhibition of MLCK/MLC2 Pathway and Phosphorylation of PKCβ2. Int. J. Mol. Sci. 2016, 17, 1696. [Google Scholar] [CrossRef]
- Ballard, J.W.O.; Towarnicki, S.G. Mitochondria, the gut microbiome and ROS. Cell. Signalling 2020, 75, 109737. [Google Scholar] [CrossRef] [PubMed]
- Sun, M.; Wu, W.; Liu, Z.; Cong, Y. Microbiota metabolite short chain fatty acids, GPCR, and inflammatory bowel diseases. J. Gastroenterol. 2016, 52, 1–8. [Google Scholar] [CrossRef]
- Rastogi, S.; Mohanty, S.; Sharma, S.; Tripathi, P. Possible role of gut microbes and host’s immune response in gut–lung homeostasis. Front. Immunol. 2022, 13, 954339. [Google Scholar] [CrossRef]
- Zhou, Y.; Chen, Z.; Zhou, H.; Niu, B.; Liu, J.; Li, Y.; Mi, Y.; Li, P. ACT001 Alleviates chronic kidney injury induced by a high-fat diet in mice through the GPR43/AMPK pathway. Lipids Health Dis. 2023, 22, 198. [Google Scholar] [CrossRef] [PubMed]
- Fujimura, K.E.; Sitarik, A.R.; Havstad, S.; Lin, D.L.; Levan, S.; Fadrosh, D.; Panzer, A.R.; LaMere, B.; Rackaityte, E.; Lukacs, N.W.; et al. Neonatal gut microbiota associates with childhood multisensitized atopy and T cell differentiation. Nat. Med. 2016, 22, 1187–1191. [Google Scholar] [CrossRef]
- Cait, A.; Hughes, M.R.; Antignano, F.; Cait, J.; Dimitriu, P.A.; Maas, K.R.; Reynolds, L.A.; Hacker, L.; Mohr, J.; Finlay, B.B.; et al. Microbiome-driven allergic lung inflammation is ameliorated by short-chain fatty acids. Mucosal Immunol. 2018, 11, 785–795. [Google Scholar] [CrossRef] [PubMed]
- Wang, Z.; Liu, J.; Li, F.; Ma, S.; Zhao, L.; Ge, P.; Wen, H.; Zhang, Y.; Liu, X.; Luo, Y.; et al. Mechanisms of Qingyi Decoction in Severe Acute PancreatitisAssociated Acute Lung Injury via Gut Microbiota: Targeting the Short-Chain Fatty Acids-Mediated AMPK/NF-kB/NLRP3 Pathway. Microbiol. Spectrum 2023, 11, e0366422. [Google Scholar] [CrossRef]
- Feng, Q.; Lu, L.; Yu, H.; Feng, Q.; Xu, M. Study on Function of Burdock Tea in Reducing Lipemia Auxiliarily. Food and Drug 2012, 14, 399–400. [Google Scholar]
- Dai, X.; Jiang, L.Y.; Han, M.; Ye, M.H.; Wang, A.Q.; Wei, W.H.; Yang, S.M. Reproductive responses of male Brandt’s voles (Lasiopodomys brandtii) to 6-methoxybenzoxazolinone (6-MBOA) under short photoperiod. Sci. Nat. 2016, 103, 29. [Google Scholar] [CrossRef]
- Lin, X.; Luo, Z.; Pang, S.; Wang, C.C.; Ge, L.; Dai, Y.; Zhou, J.; Chen, F.; Hong, X.; Zhang, J. The effects of yam gruel on lowering fasted blood glucose in T2DM rats. Open Life Sci. 2020, 15, 763–773. [Google Scholar] [CrossRef]
- Livak, K.J.; Schmittgen, T.D. Analysis of relative gene expression data using real-time quantitative PCR and the 2(-Delta Delta C(T)) Method. Methods 2001, 25, 402–408. [Google Scholar] [CrossRef] [PubMed]
- Shen, Q.; Shi, J.; Gu, K.; Wei, W.; Yang, S.; Dai, X. Relationship between food grinding and gut microbiota in Brandt's voles. Can. J. Zool. 2023, 101, 623–634. [Google Scholar] [CrossRef]
- Romualdo, G.R.; Silva, E.d.A.; Da Silva, T.C.; Aloia, T.P.A.; Nogueira, M.S.; De Castro, I.A.; Vinken, M.; Barbisan, L.F.; Cogliati, B. Burdock (Arctium lappa L.) root attenuates preneoplastic lesion development in a diet and thioacetamide-induced model of steatohepatitis-associated hepatocarcinogenesis. Environ. Toxicol. 2019, 35, 518–527. [Google Scholar] [CrossRef]
- Li, D.; Kim, J.M.; Jin, Z.; Zhou, J. Prebiotic effectiveness of inulin extracted from edible burdock. Anaerobe 2008, 14, 29–34. [Google Scholar] [CrossRef] [PubMed]
- Wu, X.; Zhang, N.; Kan, J.; Tang, S.; Sun, R.; Wang, Z.; Chen, M.; Liu, J.; Jin, C. Polyphenols from Arctium lappa L ameliorate doxorubicin-induced heart failure and improve gut microbiota composition in mice. J. Food Biochem. 2022, 46, e13731. [Google Scholar] [CrossRef]
- Soares-da-Silva, P.; Pestana, M.; Vieira-Coelho, M.A.; Fernandes, M.H.; Albino-Teixeira, A. Assessment of renal dopaminergic system activity in the nitric oxide-deprived hypertensive rat model. Br. J. Pharmacol. 1995, 114, 1403–1413. [Google Scholar] [CrossRef]
- Osuga, Y.; Harada, K.; Tsuboi, T. Identification of a regulatory pathway of L-phenylalanine-induced GLP-1 secretion in the enteroendocrine L cells. Biochem. Biophys. Res. Commun. 2022, 588, 118–124. [Google Scholar] [CrossRef] [PubMed]
- Waters, J.K.; Kelley, S.P.; Mossine, V.V.; Mawhinney, T.P. Structure, Antioxidant and Anti-inflammatory Activities of the (4R)- and (4S)-epimers of S-Carboxymethyl-L-cysteine Sulfoxide. Pharmaceuticals 2020, 13, 270. [Google Scholar] [CrossRef]
- Torretta, S.; Scagliola, A.; Ricci, L.; Mainini, F.; Di Marco, S.; Cuccovillo, I.; Kajaste-Rudnitski, A.; Sumpton, D.; Ryan, K.M.; Cardaci, S. D-mannose suppresses macrophage IL-1β production. Nat. Commun. 2020, 11, 6343. [Google Scholar] [CrossRef]
- Ala-Jaakkola, R.; Laitila, A.; Ouwehand, A.C.; Lehtoranta, L. Role of D-mannose in urinary tract infections – a narrative review. Nutr. J. 2022, 21. [Google Scholar] [CrossRef]
- Imre, S.; Tóth, F.; Fachet, J. Superoxide dismutase, catalase and lipid peroxidation in liver of young mice of different ages. Mech. Ageing Dev. 1984, 28, 297–304. [Google Scholar] [CrossRef] [PubMed]
- Hazelton, G.A.; Lang, C.A. Glutathione peroxidase and reductase activities in the aging mouse. Mech. Ageing Dev. 1985, 29, 71–81. [Google Scholar] [CrossRef] [PubMed]
- Nna, V.U.; Ujah, G.A.; Suleiman, J.B.; Mohamed, M.; Nwokocha, C.; Akpan, T.J.; Ekuma, H.C.; Fubara, V.V.; Kekung-Asu, C.B.; Osim, E.E. Tert-butylhydroquinone preserve testicular steroidogenesis and spermatogenesis in cisplatin-intoxicated rats by targeting oxidative stress, inflammation and apoptosis. Toxicology 2020, 441, 152528. [Google Scholar] [CrossRef]
- Yan, Z.; Zhong, Y.; Duan, Y.; Chen, Q.; Li, F. Antioxidant mechanism of tea polyphenols and its impact on health benefits. Anim. Nutr. 2020, 6, 115–123. [Google Scholar] [CrossRef]
- González-Aguilar, G.A.; Blancas-Benítez, F.J.; Sáyago-Ayerdi, S.G. Polyphenols associated with dietary fibers in plant foods: molecular interactions and bioaccessibility. Curr. Opin. Food Sci. 2017, 13, 84–88. [Google Scholar] [CrossRef]
- Moro, T.M.A.; M, T.P.S.C. Burdock (Arctium lappa L) roots as a source of inulin-type fructans and other bioactive compounds: Current knowledge and future perspectives for food and non-food applications. Food Res. Int. 2021, 141, 109889. [Google Scholar] [CrossRef] [PubMed]
- Miao, M.; Xiang, L. Pharmacological action and potential targets of chlorogenic acid. Adv. Pharmacol. 2020, 87, 71–88. [Google Scholar] [CrossRef]
- Lu, N.; Wei, J.; Gong, X.; Tang, X.; Zhang, X.; Xiang, W.; Liu, S.; Luo, C.; Wang, X. Preventive Effect of Arctium lappa Polysaccharides on Acute Lung Injury through Anti-Inflammatory and Antioxidant Activities. Nutrients 2023, 15, 4946. [Google Scholar] [CrossRef]
- Baker, J.M.; Hinkle, K.J.; McDonald, R.A.; Brown, C.A.; Falkowski, N.R.; Huffnagle, G.B.; Dickson, R.P. Whole lung tissue is the preferred sampling method for amplicon-based characterization of murine lung microbiota. Microbiome 2021, 9, 99. [Google Scholar] [CrossRef]
- Liu, T.H.; Zhang, C.Y.; Din, A.U.; Li, N.; Wang, Q.; Yu, J.Z.; Xu, Z.Y.; Li, C.X.; Zhang, X.M.; Yuan, J.L.; et al. Bacterial association and comparison between lung and intestine in rats. Biosci. Rep. 2020, 40, BSR20191570. [Google Scholar] [CrossRef]
- Li, Z.; Song, Y.; Xu, W.; Chen, J.; Zhou, R.; Yang, M.; Zhu, G.; Luo, X.; Ai, Z.; Liu, Y.; et al. Pulsatilla chinensis saponins improve SCFAs regulating GPR43-NLRP3 signaling pathway in the treatment of ulcerative colitis. J. Ethnopharmacol. 2023, 308, 116215. [Google Scholar] [CrossRef] [PubMed]
- Zhang, X.; Zhang, N.; Kan, J.; Sun, R.; Tang, S.; Wang, Z.; Chen, M.; Liu, J.; Jin, C. Anti-inflammatory activity of alkali-soluble polysaccharides from Arctium lappa L. and its effect on gut microbiota of mice with inflammation. Int. J. Biol. Macromol. 2020, 154, 773–787. [Google Scholar] [CrossRef]
- O'Dwyer, D.N.; Ashley, S.L.; Gurczynski, S.J.; Xia, M.; Wilke, C.; Falkowski, N.R.; Norman, K.C.; Arnold, K.B.; Huffnagle, G.B.; Salisbury, M.L.; et al. Lung Microbiota Contribute to Pulmonary Inflammation and Disease Progression in Pulmonary Fibrosis. Am. J. Respir. Crit. Care Med. 2019, 199, 1127–1138. [Google Scholar] [CrossRef] [PubMed]
- Laiman, V.; Lo, Y.C.; Chen, H.C.; Yuan, T.H.; Hsiao, T.C.; Chen, J.K.; Chang, C.W.; Lin, T.C.; Li, S.J.; Chen, Y.Y.; et al. Effects of antibiotics and metals on lung and intestinal microbiome dysbiosis after sub-chronic lower-level exposure of air pollution in ageing rats. Ecotoxicol. Environ. Saf. 2022, 246, 114164. [Google Scholar] [CrossRef]
- Vargas, J.E.; Andrés, S.; Snelling, T.J.; López-Ferreras, L.; Yáñez-Ruíz, D.R.; García-Estrada, C.; López, S. Effect of Sunflower and Marine Oils on Ruminal Microbiota, In vitro Fermentation and Digesta Fatty Acid Profile. Front microbiol 2017, 8, 1124. [Google Scholar] [CrossRef]
- Wu, F.; Guo, X.; Zhang, J.; Zhang, M.; Ou, Z.; Peng, Y. Phascolarctobacterium faecium abundant colonization in human gastrointestinal tract. Exp. Ther. Med. 2017, 14, 3122–3126. [Google Scholar] [CrossRef] [PubMed]
- Yang, Z.; Su, H.; Lv, Y.; Tao, H.; Jiang, Y.; Ni, Z.; Peng, L.; Chen, X. Inulin intervention attenuates hepatic steatosis in rats via modulating gut microbiota and maintaining intestinal barrier function. Food Res. Int. 2023, 163, 112309. [Google Scholar] [CrossRef]
- Amat, S.; Lantz, H.; Munyaka, P.M.; Willing, B.P. Prevotella in Pigs: The Positive and Negative Associations with Production and Health. Microorganisms 2020, 8, 1584. [Google Scholar] [CrossRef]
- Fiebig, K.; Gottschalk, G. Methanogenesis from Choline by a Coculture of Desulfovibrio sp. and Methanosarcina barkeri. Appl. Environ. Microbiol. 1983, 45, 161–168. [Google Scholar] [CrossRef]
- Xing, L.; Li, L.; Yin, Q.; Wu, G. Solids Retention Times Shift Methanogenic Ethanol Oxidation: Novel Insights into Metabolic Pathways, Microbial Community Dynamics, and Energy Metabolisms. ACS Sustainable Chem. Eng. 2021, 9, 15861–15874. [Google Scholar] [CrossRef]
- Boopathy, R. Methanogenesis from furfural by defined mixed cultures. Curr. Microbiol. 2002, 44, 406–410. [Google Scholar] [CrossRef] [PubMed]
- Hong, Y.; Sheng, L.; Zhong, J.; Tao, X.; Zhu, W.; Ma, J.; Yan, J.; Zhao, A.; Zheng, X.; Wu, G.; et al. Desulfovibrio vulgaris, a potent acetic acid-producing bacterium, attenuates nonalcoholic fatty liver disease in mice. Gut Microbes 2021, 13, 1–20. [Google Scholar] [CrossRef] [PubMed]
- Li, Y.; Gao, J.; Xue, Y.; Sun, R.; Sun, X.; Sun, Z.; Liu, S.; Tan, Z.; Zhu, W.; Cheng, Y. Nutrient availability of roughages in isocaloric and isonitrogenous diets alters the bacterial networks in the whole gastrointestinal tract of Hu sheep. BMC Microbiol. 2023, 23, 70. [Google Scholar] [CrossRef]
- Crost, E.H.; Coletto, E.; Bell, A.; Juge, N. Ruminococcus gnavus: friend or foe for human health. FEMS Microbiol. Rev. 2023, 47, 1–23. [Google Scholar] [CrossRef]
- Teramoto, Y.; Akagawa, S.; Hori, S.I.; Tsuji, S.; Higasa, K.; Kaneko, K. Dysbiosis of the gut microbiota as a susceptibility factor for Kawasaki disease. Front. Immunol. 2023, 14, 1268453. [Google Scholar] [CrossRef] [PubMed]
- Mancabelli, L.; Milani, C.; Lugli, G.A.; Turroni, F.; Cocconi, D.; van Sinderen, D.; Ventura, M. Identification of universal gut microbial biomarkers of common human intestinal diseases by meta-analysis. FEMS Microbiol. Ecol. 2017, 93, fix153. [Google Scholar] [CrossRef]
- Xi, Y.; Liu, F.; Qiu, B.; Li, Y.; Xie, X.; Guo, J.; Wu, L.; Liang, T.; Wang, D.; Wang, J.; et al. Analysis of Gut Microbiota Signature and Microbe-Disease Progression Associations in Locally Advanced Non-Small Cell Lung Cancer Patients Treated With Concurrent Chemoradiotherapy. Front. Cell. Infect. Microbiol. 2022, 12, 892401. [Google Scholar] [CrossRef]
- Cerdó, T.; Ruiz, A.; Jáuregui, R.; Azaryah, H.; Torres-Espínola, F.J.; García-Valdés, L.; Teresa Segura, M.; Suárez, A.; Campoy, C. Maternal obesity is associated with gut microbial metabolic potential in offspring during infancy. J. Physiol. Biochem. 2018, 74, 159–169. [Google Scholar] [CrossRef]
- Guan, H.; Li, Y.; Zheng, J.; Liu, N.; Zhang, J.; Tan, H. Important role of a LAL regulator StaR in the staurosporine biosynthesis and high-production of Streptomyces fradiae CGMCC 4.576. Sci. China:Life Sci. 2019, 62, 1638–1654. [Google Scholar] [CrossRef]
- Laparra, J.M.; Sanz, Y. Interactions of gut microbiota with functional food components and nutraceuticals. Pharmacol. Res. 2010, 61, 219–225. [Google Scholar] [CrossRef]
- Milbury, P.E.; Kalt, W. Xenobiotic metabolism and berry flavonoid transport across the blood-brain barrier. J. Agric. Food Chem. 2010, 58, 3950–3956. [Google Scholar] [CrossRef] [PubMed]
- Burdock, G.A.; Cowley, A.B.; Li, Q.S. Repeat-dose animal toxicity studies and genotoxicity study with deactivated alkaline serine protease (DASP), a protein low in phenylalanine (PHE). Food Chem. Toxicol. 2020, 146, 111839. [Google Scholar] [CrossRef] [PubMed]
- Zakharkina, T.; Heinzel, E.; Koczulla, R.A.; Greulich, T.; Rentz, K.; Pauling, J.K.; Baumbach, J.; Herrmann, M.; Grünewald, C.; Dienemann, H.; et al. Analysis of the airway microbiota of healthy individuals and patients with chronic obstructive pulmonary disease by T-RFLP and clone sequencing. PLoS One 2013, 8, e68302. [Google Scholar] [CrossRef] [PubMed]
- Shetty, S.A.; Marathe, N.P.; Lanjekar, V.; Ranade, D.; Shouche, Y.S. Comparative genome analysis of Megasphaera sp. reveals niche specialization and its potential role in the human gut. PLoS One 2013, 8, e79353. [Google Scholar] [CrossRef]
- Wang, Z.; Maschera, B.; Lea, S.; Kolsum, U.; Michalovich, D.; Van Horn, S.; Traini, C.; Brown, J.R.; Hessel, E.M.; Singh, D. Airway host-microbiome interactions in chronic obstructive pulmonary disease. Respir. Res. 2019, 20, 113. [Google Scholar] [CrossRef]
- De Boeck, I.; Wittouck, S.; Martens, K.; Spacova, I.; Cauwenberghs, E.; Allonsius, C.N.; Jörissen, J.; Wuyts, S.; Van Beeck, W.; Dillen, J.; et al. The nasal mutualist Dolosigranulum pigrum AMBR11 supports homeostasis via multiple mechanisms. iScience 2021, 24, 102978. [Google Scholar] [CrossRef]
- Bomar, L.; Brugger, S.D.; Yost, B.H.; Davies, S.S.; Lemon, K.P. Corynebacterium accolens Releases Antipneumococcal Free Fatty Acids from Human Nostril and Skin Surface Triacylglycerols. mBio 2016, 7, e01725. [Google Scholar] [CrossRef]
- Khamash, D.F.; Mongodin, E.F.; White, J.R.; Voskertchian, A.; Hittle, L.; Colantuoni, E.; Milstone, A.M. The Association Between the Developing Nasal Microbiota of Hospitalized Neonates and Staphylococcus aureus Colonization. Open Forum Infect. Dis. 2019, 6, ofz062. [Google Scholar] [CrossRef]
- Dempsey, E.; Corr, S.C. Lactobacillus spp. for Gastrointestinal Health: Current and Future Perspectives. Front. Immunol. 2022, 13, 840245. [Google Scholar] [CrossRef]
- Yildiz, S.; Mazel-Sanchez, B.; Kandasamy, M.; Manicassamy, B.; Schmolke, M. Influenza A virus infection impacts systemic microbiota dynamics and causes quantitative enteric dysbiosis. Microbiome 2018, 6, 9. [Google Scholar] [CrossRef]
- Bernard-Raichon, L.; Colom, A.; Monard, S.C.; Namouchi, A.; Cescato, M.; Garnier, H.; Leon-Icaza, S.A.; Métais, A.; Dumas, A.; Corral, D.; et al. A Pulmonary Lactobacillus murinus Strain Induces Th17 and RORγt(+) Regulatory T Cells and Reduces Lung Inflammation in Tuberculosis. Journal of Immunology 2021, 207, 1857–1870. [Google Scholar] [CrossRef] [PubMed]
- Zhang, N.; Wang, Y.; Kan, J.; Wu, X.; Zhang, X.; Tang, S.; Sun, R.; Liu, J.; Qian, C.; Jin, C. In vivo and in vitro anti-inflammatory effects of water-soluble polysaccharide from Arctium lappa. Int. J. Biol. Macromol. 2019, 135, 717–724. [Google Scholar] [CrossRef]
- Ding, X.; Zhou, J.; Chai, Y.; Yan, Z.; Liu, X.; Dong, Y.; Mei, X.; Jiang, Y.; Lei, H. A metagenomic study of the gut microbiome in PTB'S disease. Microbes and infection 2022, 24, 104893. [Google Scholar] [CrossRef]
- Moussa, O.M.; Eraky, I.; El-Far, M.A.; Osman, H.G.; Ghoneim, M.A. Rapid diagnosis of genitourinary tuberculosis by polymerase chain reaction and non-radioactive DNA hybridization. J. Urol. 2000, 164, 584–588. [Google Scholar] [CrossRef] [PubMed]
- Guerrini, V.; Gennaro, M.L. Foam Cells: One Size Doesn't Fit All. Trends Immunol. 2019, 40, 1163–1179. [Google Scholar] [CrossRef] [PubMed]
- Mirzaei, R.; Afaghi, A.; Babakhani, S.; Sohrabi, M.R.; Hosseini-Fard, S.R.; Babolhavaeji, K.; Khani Ali Akbari, S.; Yousefimashouf, R.; Karampoor, S. Role of microbiota-derived short-chain fatty acids in cancer development and prevention. Biomed. Pharmacother. 2021, 139, 111619. [Google Scholar] [CrossRef]
- Nachmias, N.; Langier, S.; Brzezinski, R.Y.; Siterman, M.; Stark, M.; Etkin, S.; Avriel, A.; Schwarz, Y.; Shenhar-Tsarfaty, S.; Bar-Shai, A. NLRP3 inflammasome activity is upregulated in an in-vitro model of COPD exacerbation. PLoS One 2019, 14, e0214622. [Google Scholar] [CrossRef]
- Mao, J.; Li, Y.; Bian, Q.; Xuan, Y.; Li, J.; Wang, Z.; Feng, S.; Liu, X.; Tian, Y.; Li, S. The Bufei Jianpi Formula Improves Mucosal Immune Function by Remodeling Gut Microbiota Through the SCFAs/GPR43/NLRP3 Pathway in Chronic Obstructive Pulmonary Disease Rats. Int. J. Chronic Obstruct. Pulm. Dis. 2022, 17, 1285–1298. [Google Scholar] [CrossRef]
- Kaur, S.; Bansal, Y.; Kumar, R.; Bansal, G. A panoramic review of IL-6: Structure, pathophysiological roles and inhibitors. Bioorg. Med. Chem. 2020, 28, 115327. [Google Scholar] [CrossRef]
- Yaseen, M.M.; Abuharfeil, N.M.; Darmani, H. The role of IL-1β during human immunodeficiency virus type 1 infection. Rev. Med. Virol. 2023, 33, e2400. [Google Scholar] [CrossRef]
- Perler, B.K.; Friedman, E.S.; Wu, G.D. The Role of the Gut Microbiota in the Relationship Between Diet and Human Health. Annu. Rev. Physiol. 2023, 85, 449–468. [Google Scholar] [CrossRef]
- Wastyk, H.C.; Fragiadakis, G.K.; Perelman, D.; Dahan, D.; Merrill, B.D.; Yu, F.B.; Topf, M.; Gonzalez, C.G.; Van Treuren, W.; Han, S.; et al. Gut-microbiota-targeted diets modulate human immune status. Cell 2021, 184, 4137–4153. [Google Scholar] [CrossRef] [PubMed]
- Celebi Sözener, Z.; Cevhertas, L.; Nadeau, K.; Akdis, M.; Akdis, C.A. Environmental factors in epithelial barrier dysfunction. J. Allergy Clin. Immunol. 2020, 145, 1517–1528. [Google Scholar] [CrossRef]
- Adil, M.S.; Narayanan, S.P.; Somanath, P.R. Cell-cell junctions: structure and regulation in physiology and pathology. Tissue Barriers 2021, 9, 1848212. [Google Scholar] [CrossRef] [PubMed]
- Fukuoka, A.; Yoshimoto, T. Barrier dysfunction in the nasal allergy. Allergology International 2018, 67, 18–23. [Google Scholar] [CrossRef] [PubMed]
- Pat, Y.; Ogulur, I.; Yazici, D.; Mitamura, Y.; Cevhertas, L.; Küçükkase, O.C.; Mesisser, S.S.; Akdis, M.; Nadeau, K.; Akdis, C.A. Effect of altered human exposome on the skin and mucosal epithelial barrier integrity. Tissue Barriers 2023, 11, 2133877. [Google Scholar] [CrossRef]
- Paradis, T.; Bègue, H.; Basmaciyan, L.; Dalle, F.; Bon, F. Tight Junctions as a Key for Pathogens Invasion in Intestinal Epithelial Cells. Int. J. Mol. Sci. 2021, 22, 2506. [Google Scholar] [CrossRef]
- Cordeiro, F.; da Silva, R.I.K.; Vargas-Stampe, T.L.Z.; Cerqueira, A.M.F.; Andrade, J.R.C. Cell invasion and survival of Shiga toxin-producing Escherichia coli within cultured human intestinal epithelial cells. Microbiology 2013, 159, 1683–1694. [Google Scholar] [CrossRef]
- Goyer, M.; Loiselet, A.; Bon, F.; L'Ollivier, C.; Laue, M.; Holland, G.; Bonnin, A.; Dalle, F. Intestinal Cell Tight Junctions Limit Invasion of Candida albicans through Active Penetration and Endocytosis in the Early Stages of the Interaction of the Fungus with the Intestinal Barrier. PLOS One 2016, 11, e0149159. [Google Scholar] [CrossRef]
- Guo, Y.; Yu, Y.; Li, H.; Ding, X.; Li, X.; Jing, X.; Chen, J.; Liu, G.; Lin, Y.; Jiang, C.; et al. Inulin supplementation ameliorates hyperuricemia and modulates gut microbiota in Uox-knockout mice. Eur. J. Nutr. 2021, 60, 2217–2230. [Google Scholar] [CrossRef]
- Jiang, A.; Liu, C.; Liu, F.; Song, Y.L.; Li, Q.Y.; Yu, L.; Lv, Y. Liver cold preservation induce lung surfactant changes and acute lung injury in rat liver transplantation. World J. Gastroenterol. 2012, 18, 323–330. [Google Scholar] [CrossRef] [PubMed]
Figure 1.
Top 10 ingredients and additional phenolic compounds in BT detected by LC–MS.
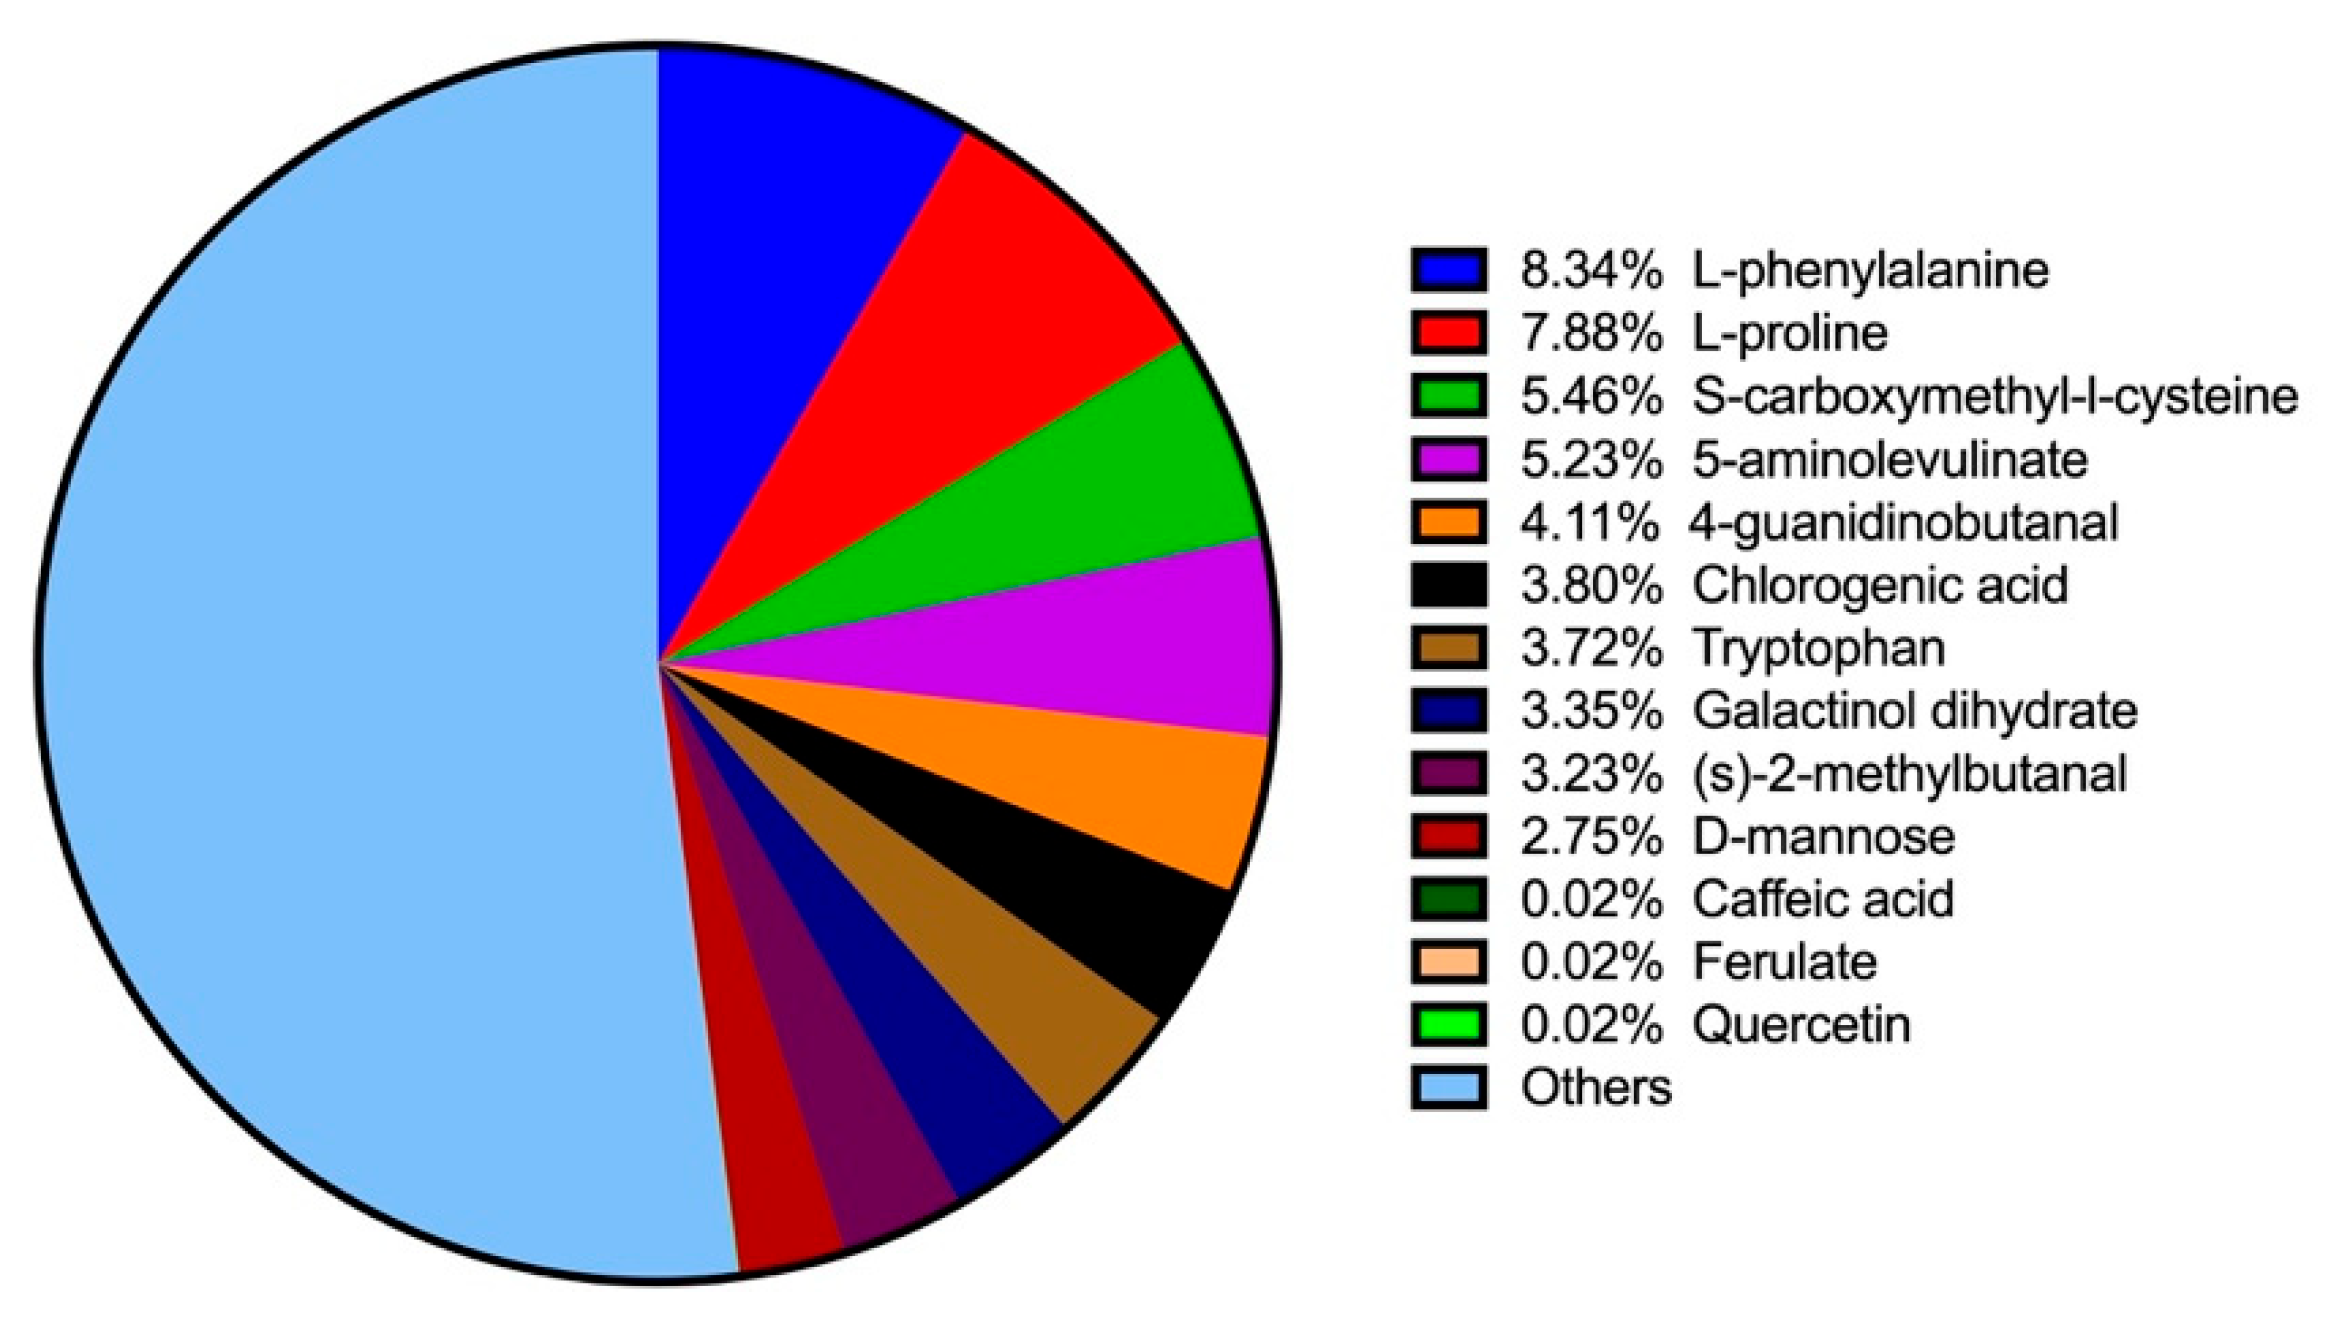
Figure 2.
Effects of BT on serum IL-1β (A) and IL-6 (B) levels in Wistar rats (n = 10). CON: Control; LBT: Low-dose BT; MBT: Middle-dose BT; HBT: High-dose BT. Error bars indicate standard errors. There was a significant difference between groups marked with the different letter (P < 0.05).
Figure 2.
Effects of BT on serum IL-1β (A) and IL-6 (B) levels in Wistar rats (n = 10). CON: Control; LBT: Low-dose BT; MBT: Middle-dose BT; HBT: High-dose BT. Error bars indicate standard errors. There was a significant difference between groups marked with the different letter (P < 0.05).
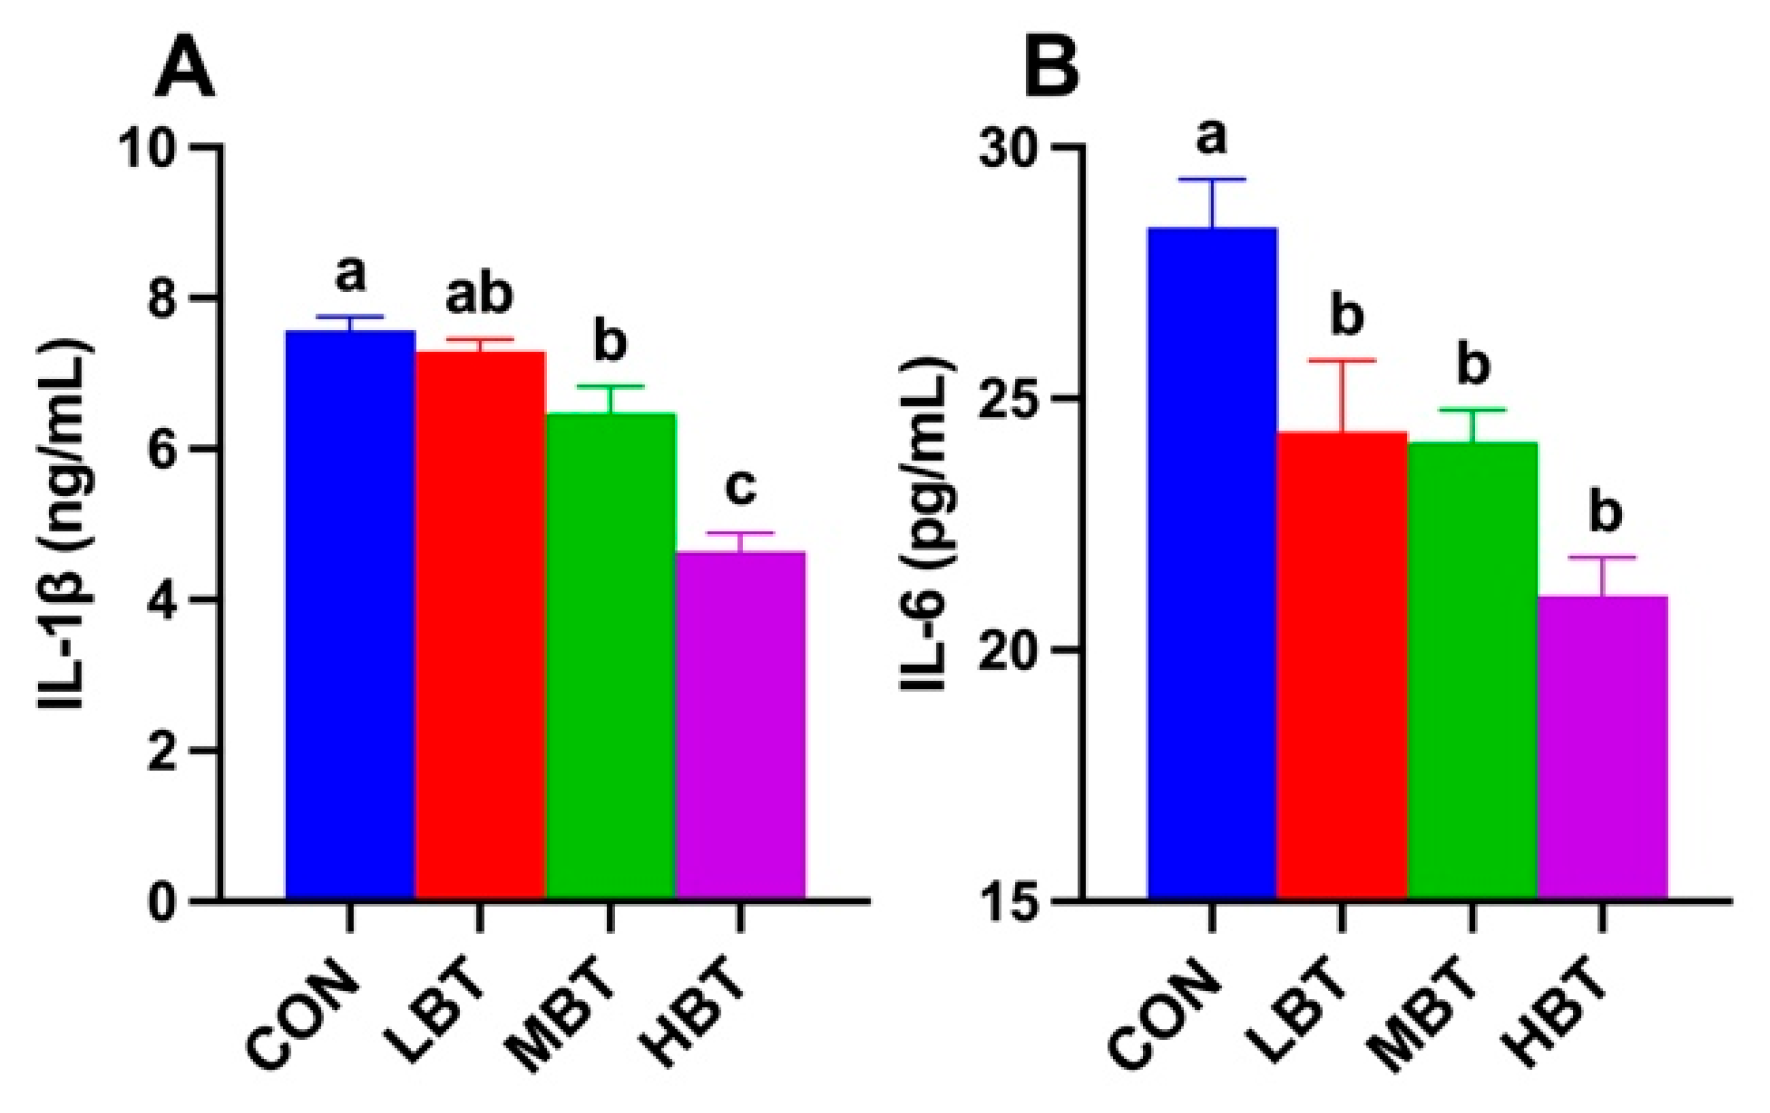
Figure 3.
Effect of BT on the MDA (A) level in the colon, and MDA (B-C), CAT (D-E) and SOD (F-G) activity in the liver and lung of Wistar rats (n = 10). CON: Control; LBT: Low-dose BT; MBT: Middle-dose BT; HBT: High-dose BT. Error bars indicate standard errors. There was a significant difference between groups marked with the different letter (P < 0.05).
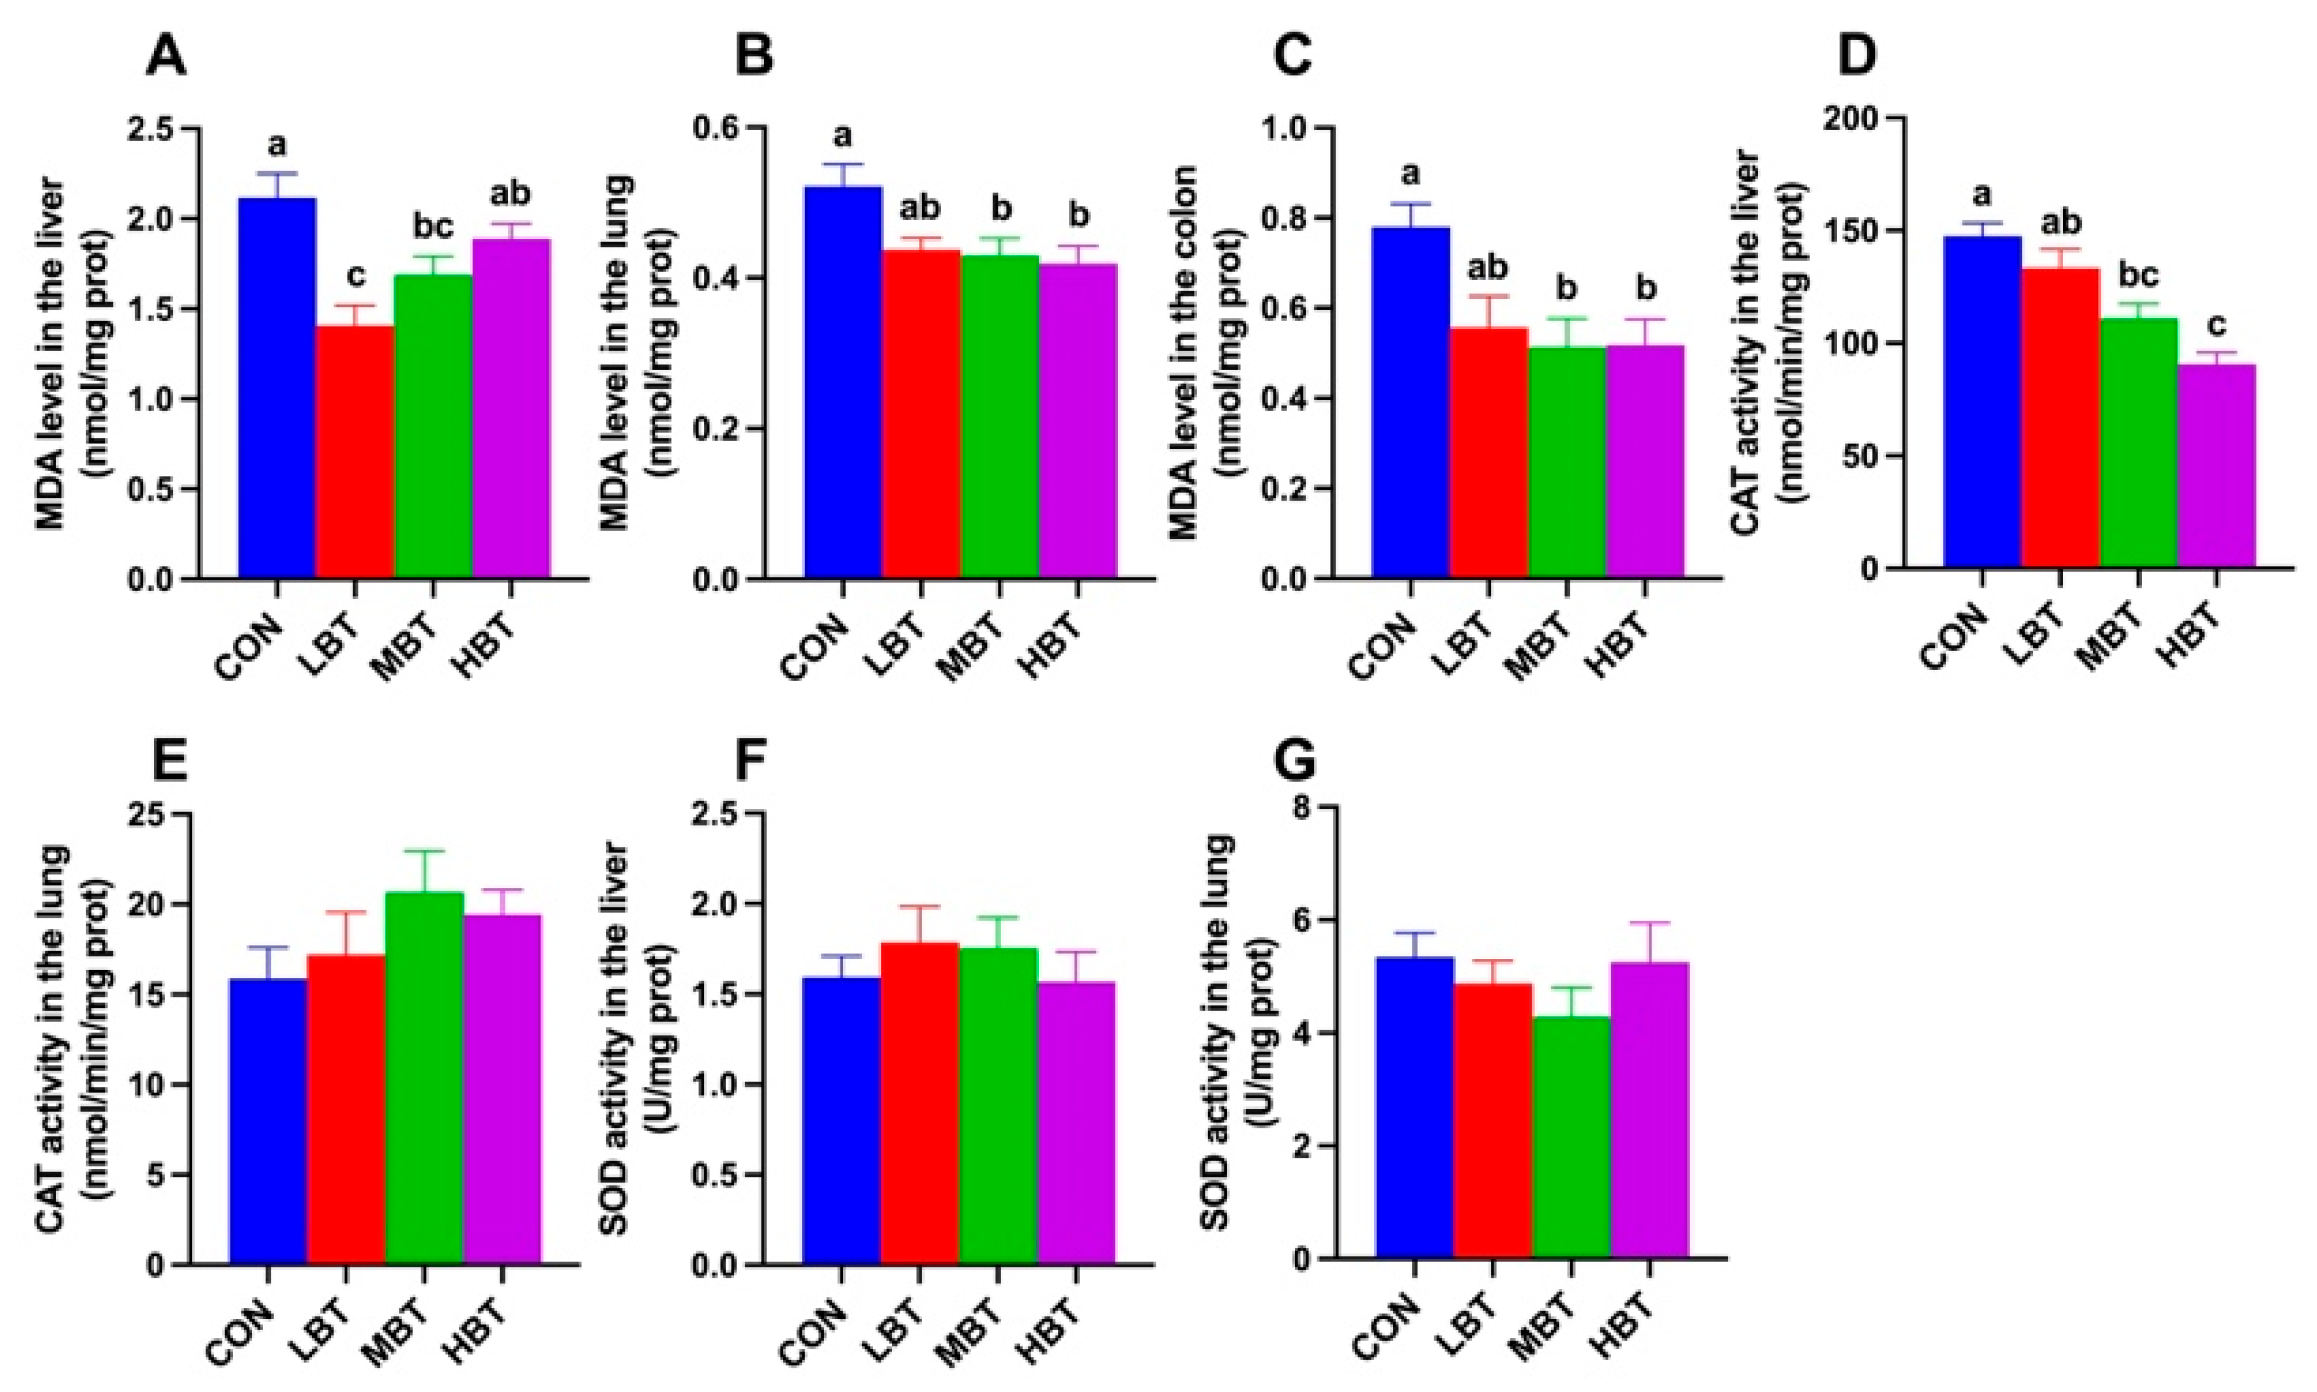
Figure 4.
The top 10 taxonomic units at the levels of phylum (A) and genus (B) in the cecum microbial community of Wistar rats (n = 6). CON: Control; LBT: Low-dose BT; MBT: Middle-dose BT; HBT: High-dose BT.
Figure 4.
The top 10 taxonomic units at the levels of phylum (A) and genus (B) in the cecum microbial community of Wistar rats (n = 6). CON: Control; LBT: Low-dose BT; MBT: Middle-dose BT; HBT: High-dose BT.
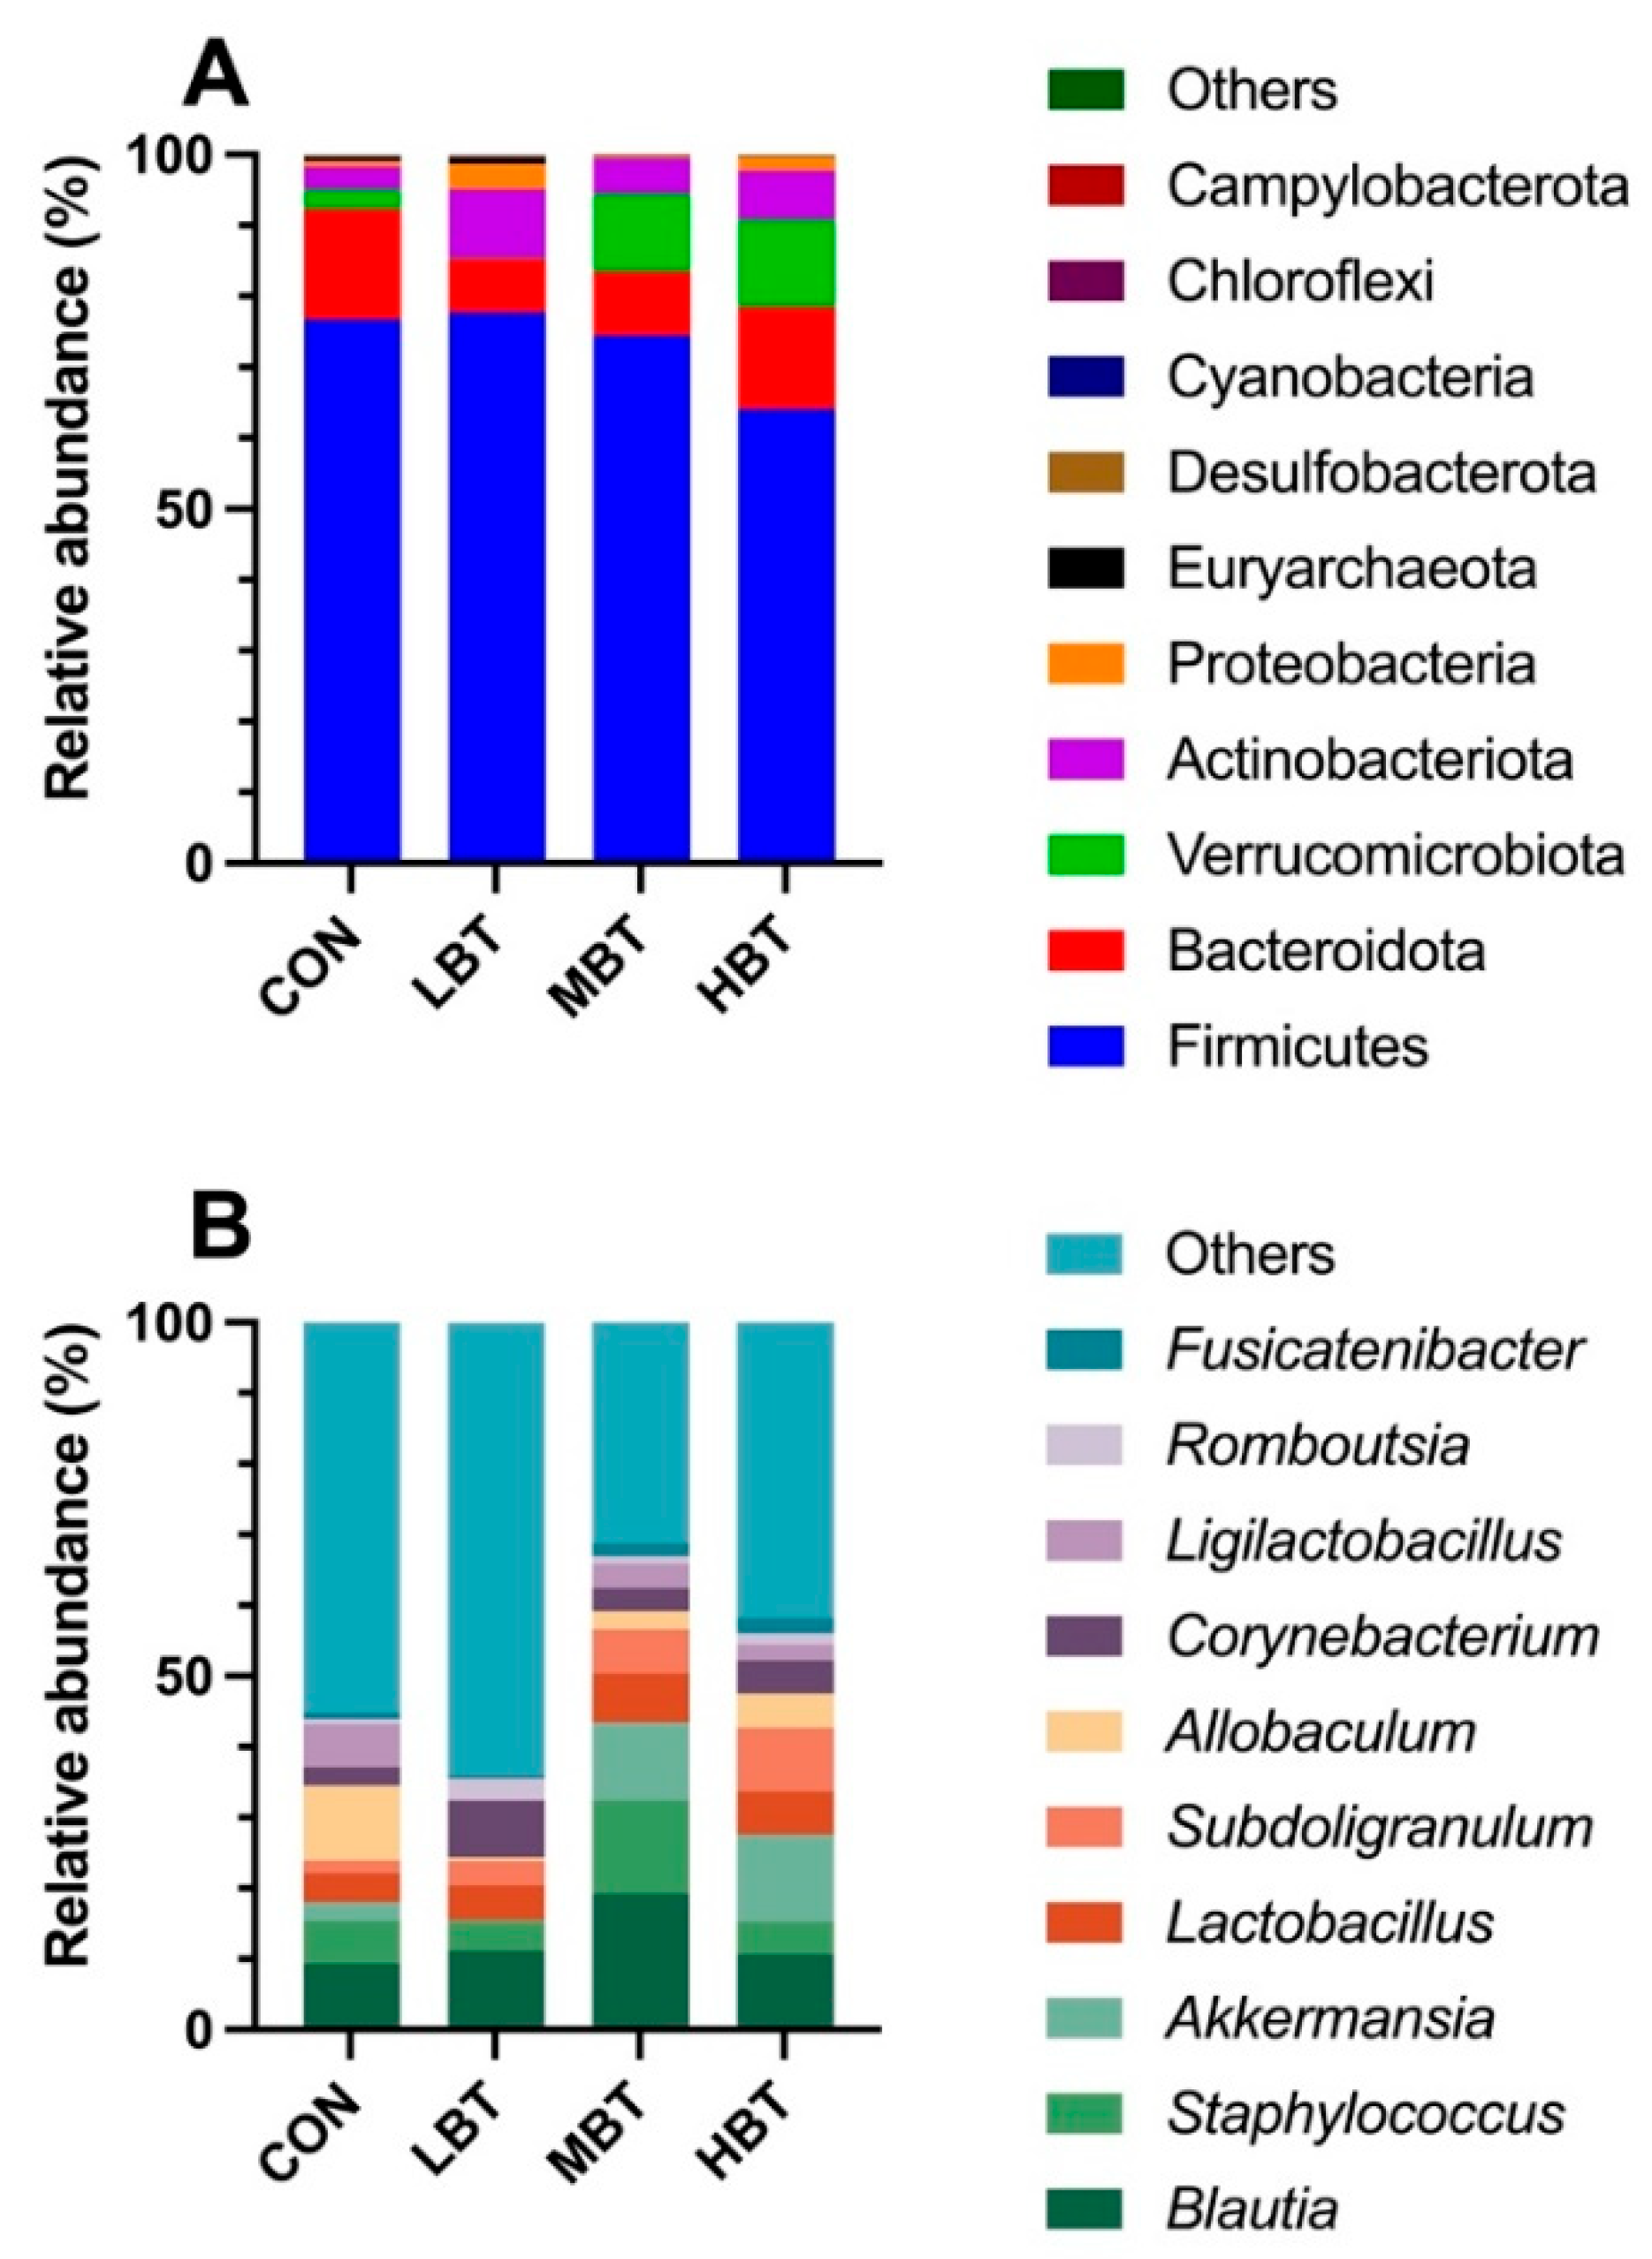
Figure 5.
Effect of BT on the cecum microbial community structure of Wistar rats (n = 6). (A) Principal coordinates analysis (PCoA) plot; (B) ANOSIM analysis plot. CON: Control; LBT: Low-dose BT; MBT: Middle-dose BT; HBT: High-dose BT.
Figure 5.
Effect of BT on the cecum microbial community structure of Wistar rats (n = 6). (A) Principal coordinates analysis (PCoA) plot; (B) ANOSIM analysis plot. CON: Control; LBT: Low-dose BT; MBT: Middle-dose BT; HBT: High-dose BT.
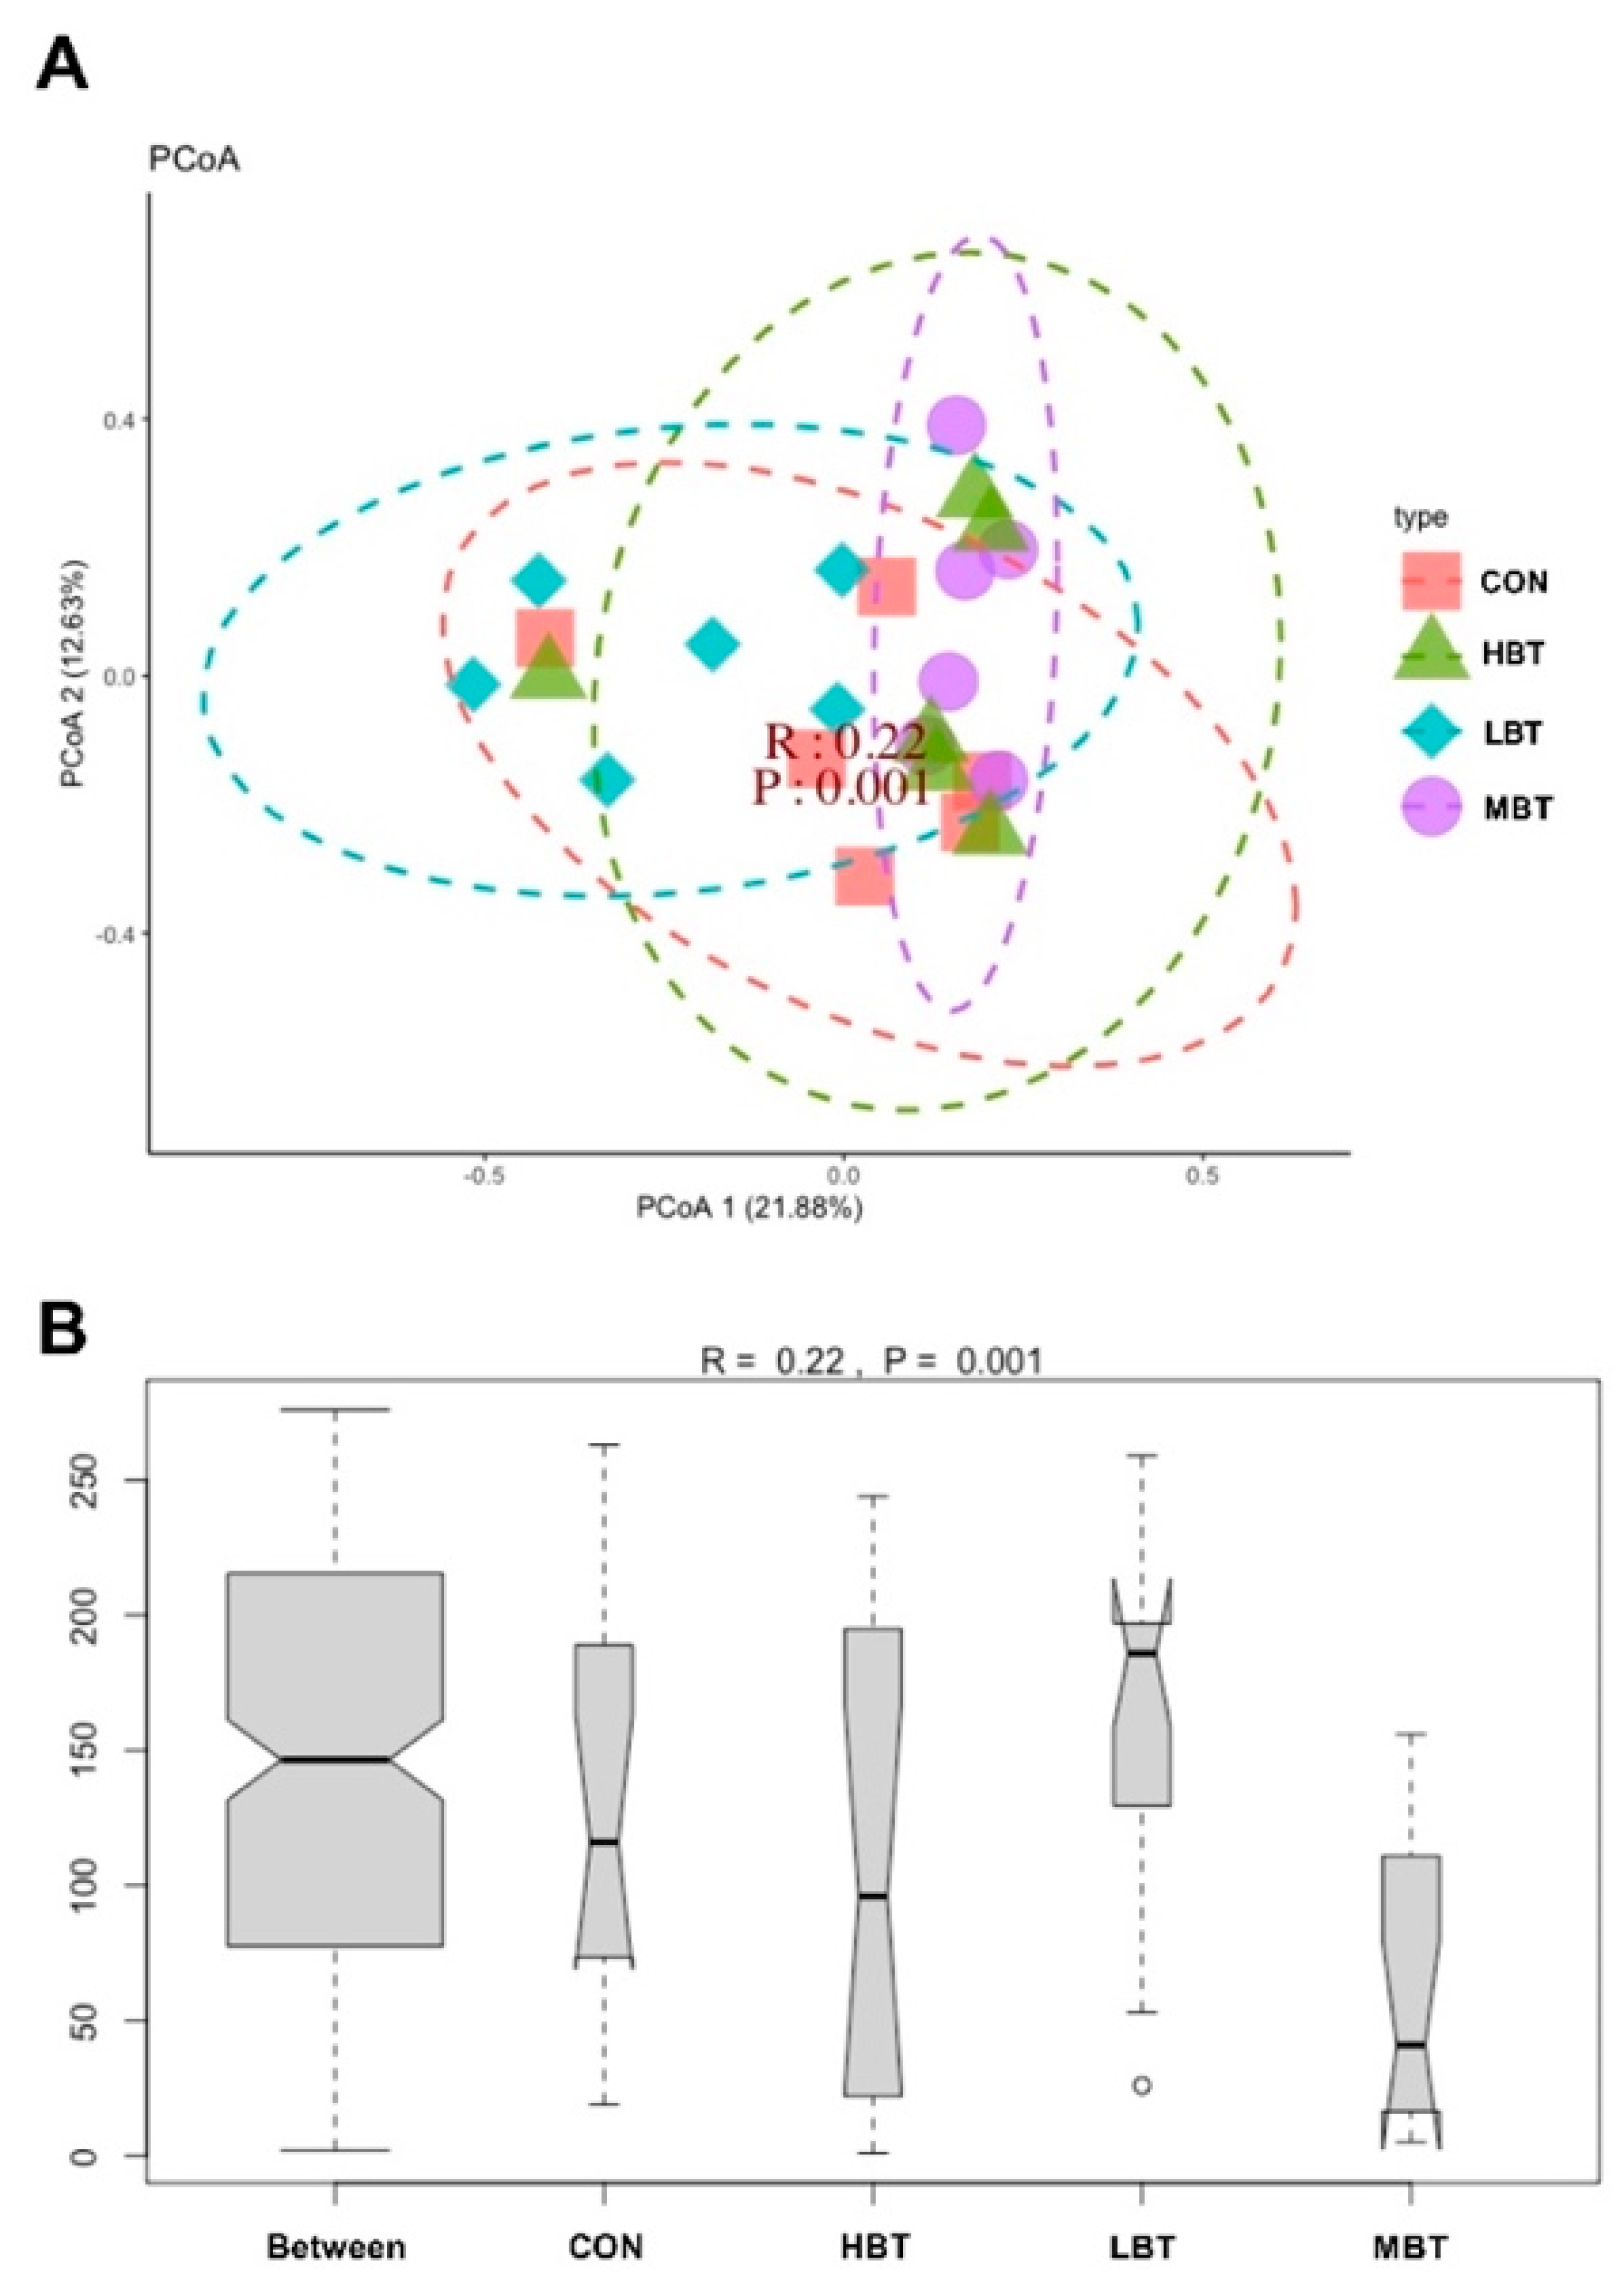
Figure 6.
Taxa identified as biomarkers in the cecal microbial community of Wistar rats (n = 6). (A) Bar plot displaying taxa with significant LDA scores (LDA > 3); (B) Cladogram of phylogenetically enriched taxa across three groups. CON: Control; LBT: Low-dose BT; MBT: Middle-dose BT; HBT: High-dose BT.
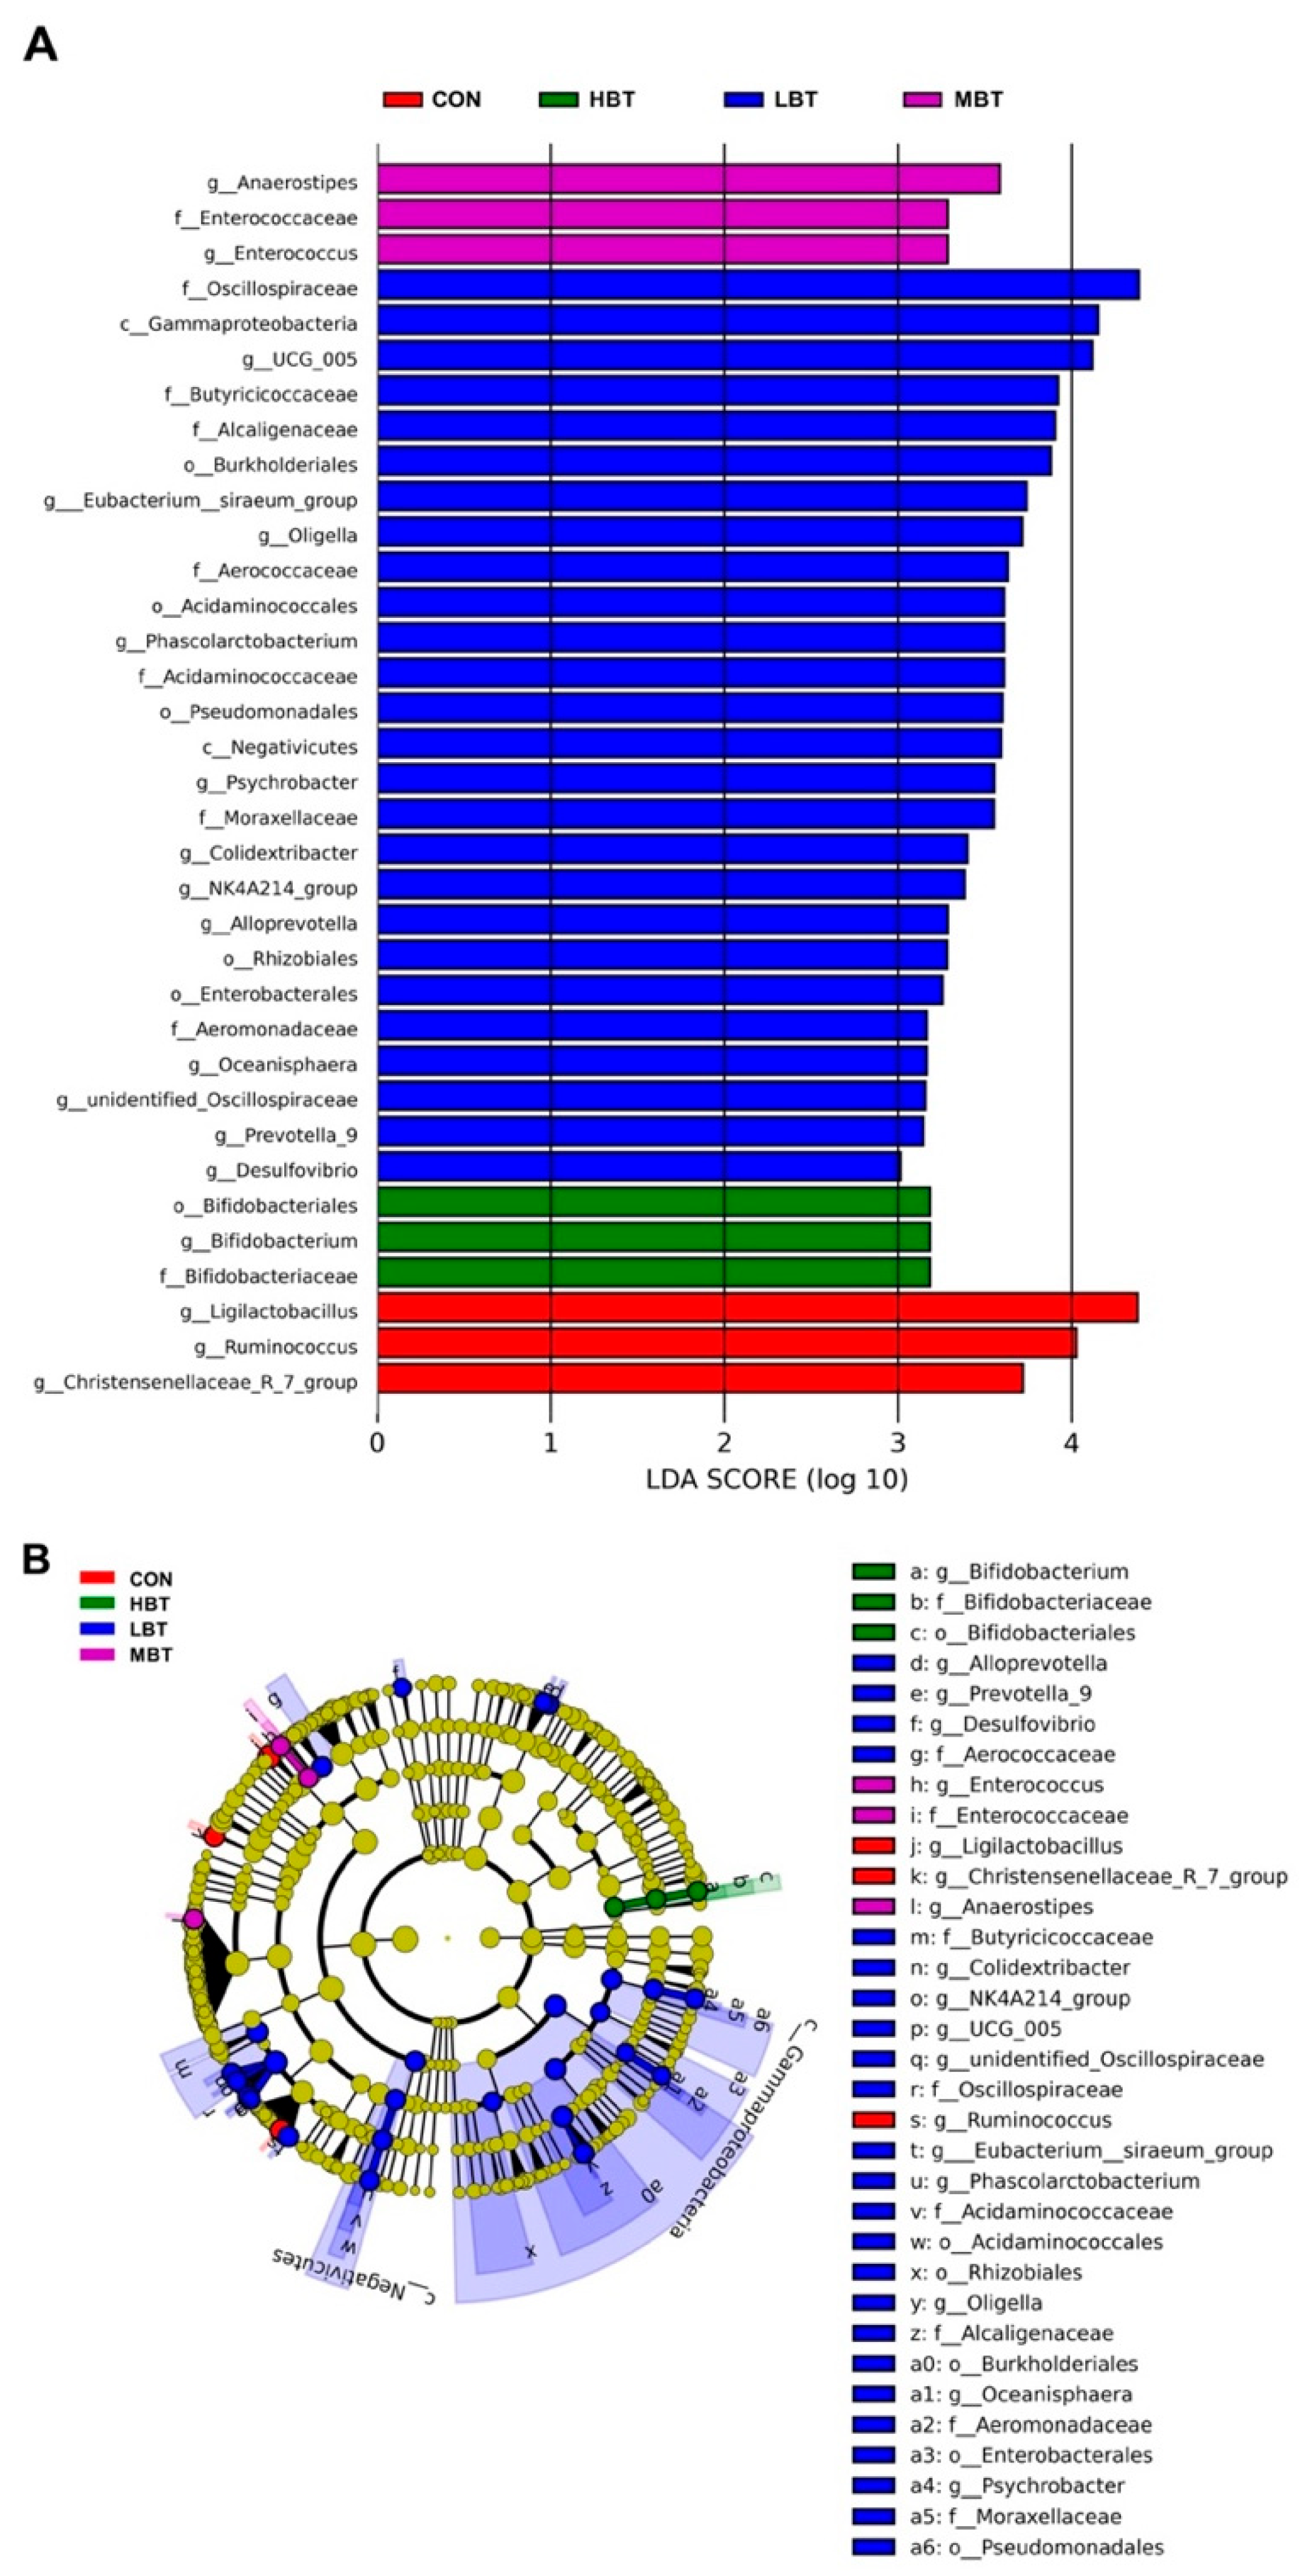
Figure 7.
Differences in the cecal microbial abundances at the class, order, family, and genus levels in response to BT treatment in Wistar rats (n = 6). CON: Control; LBT: Low-dose BT; MBT: Middle-dose BT; HBT: High-dose BT. Error bars indicate standard errors. There was a significant difference between groups marked with the different letter (P < 0.05).
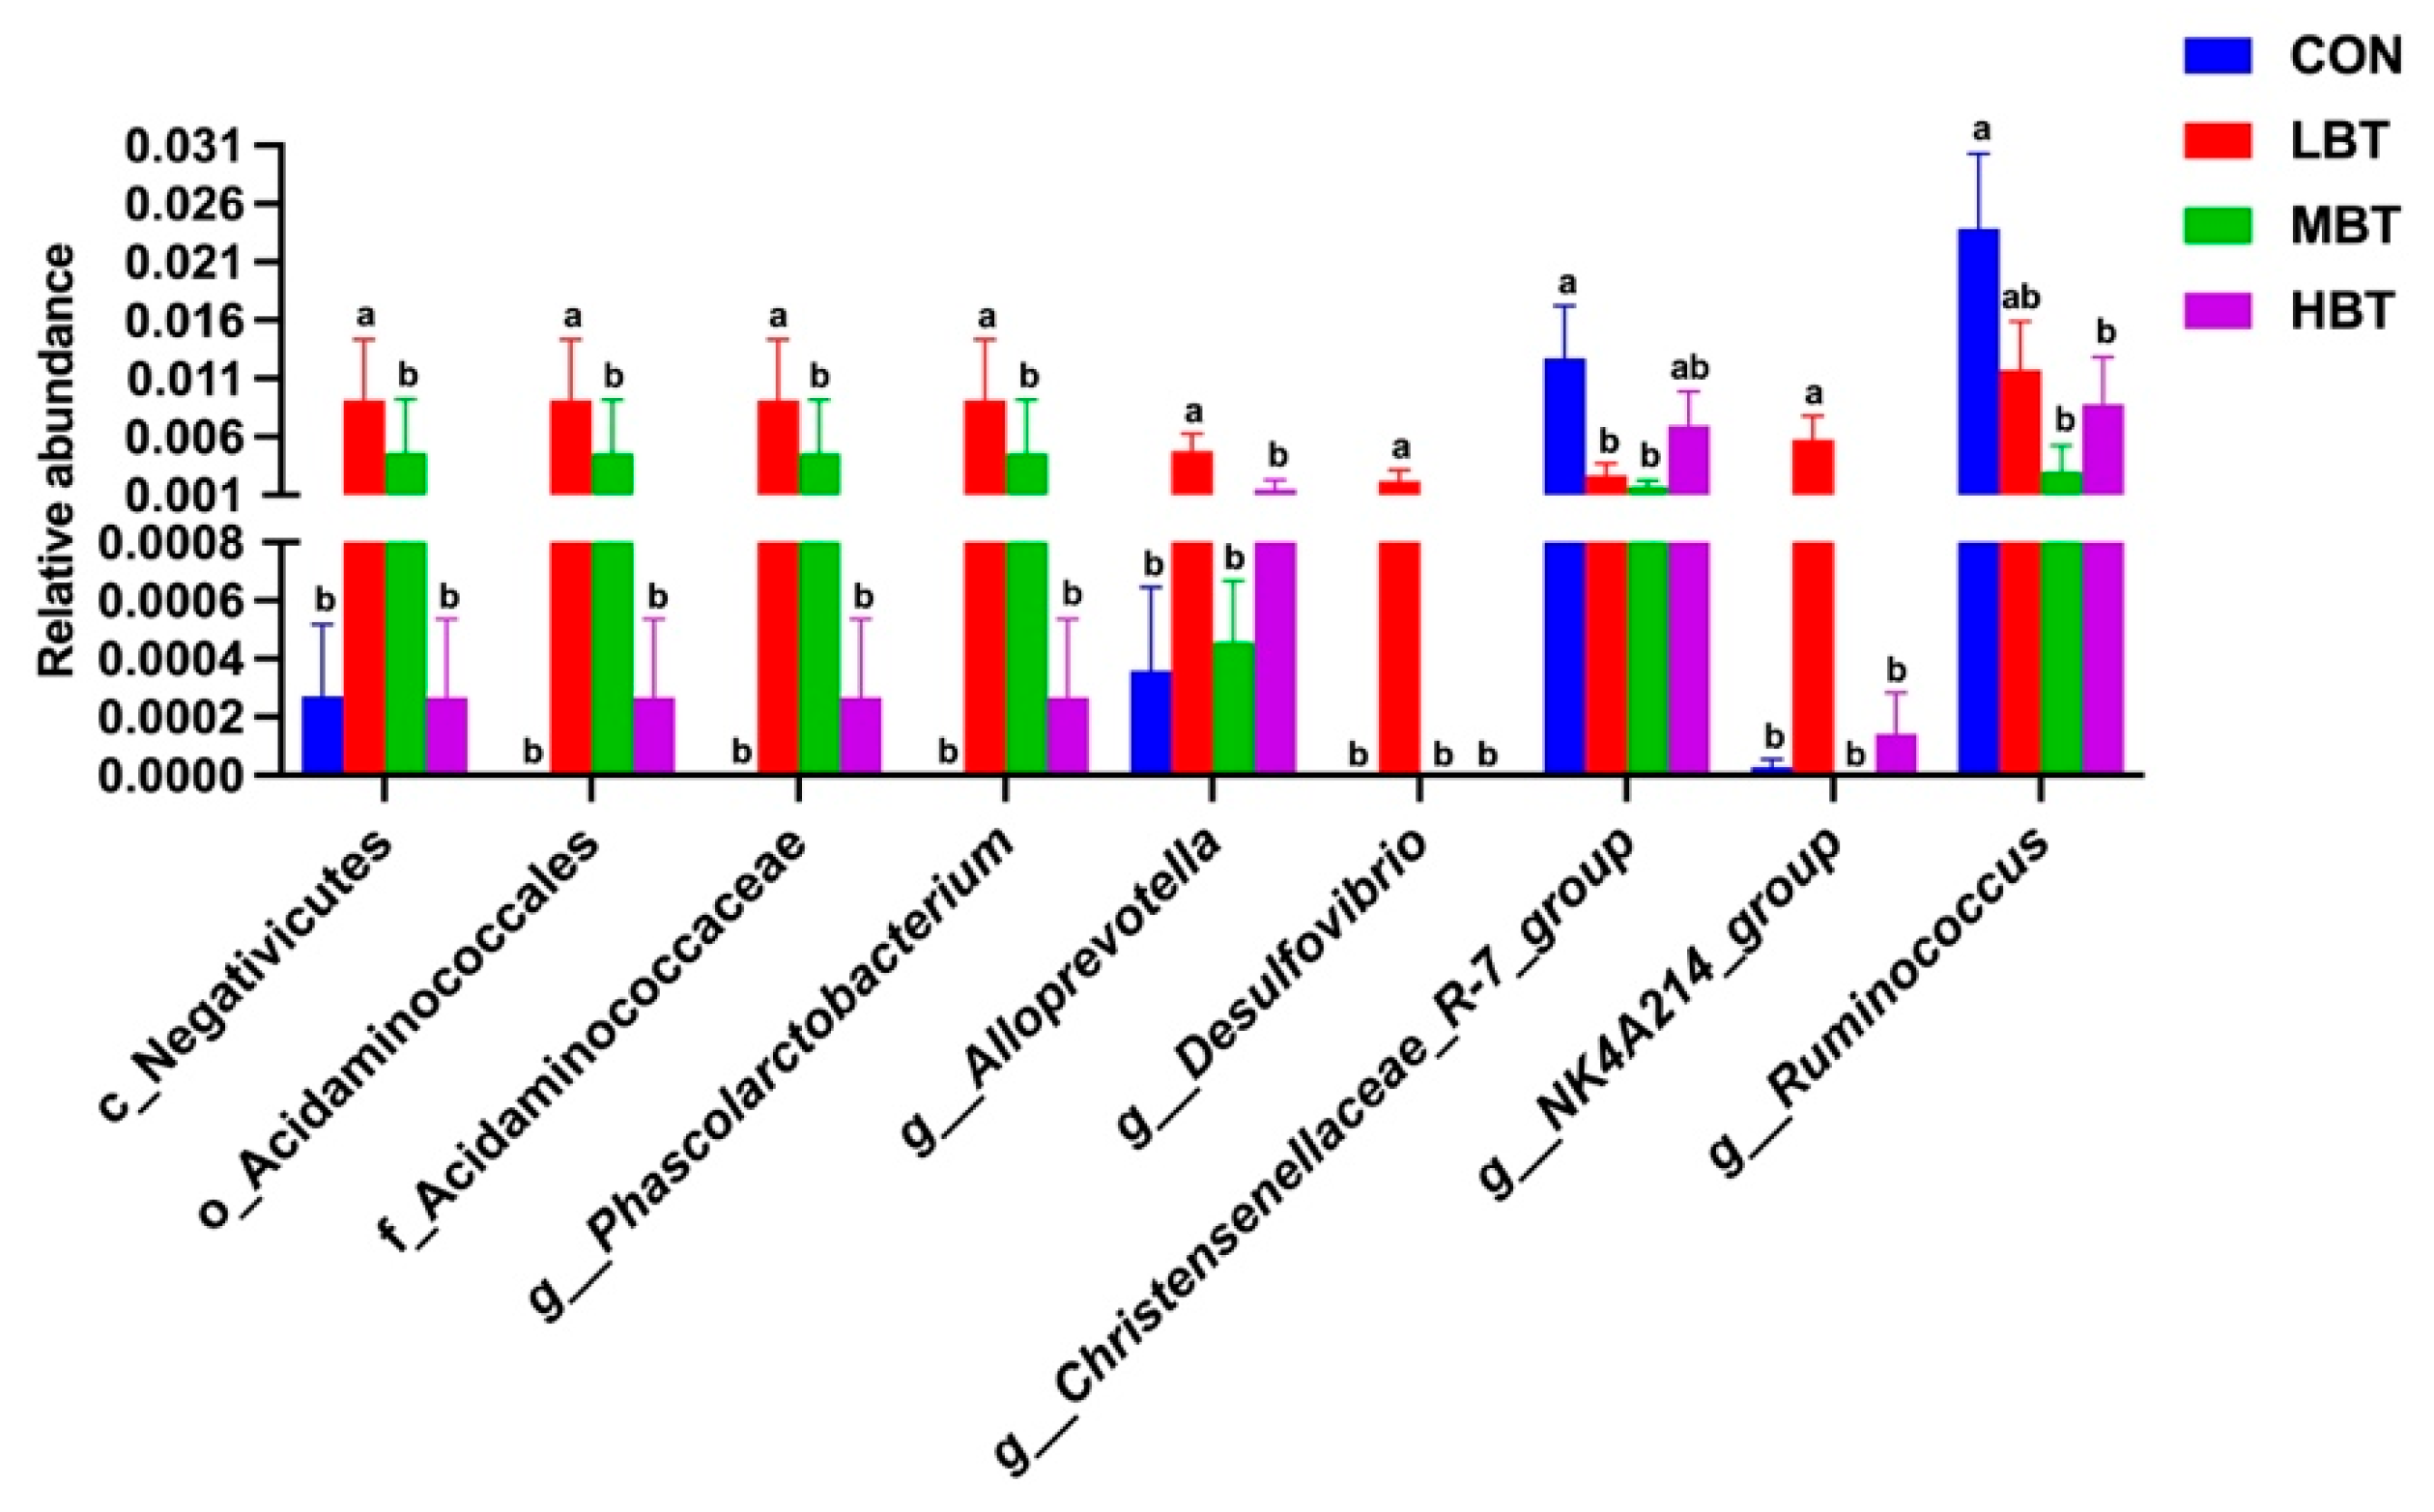
Figure 8.
KEGG pathways with the significantly varied enrichment in the cecal microbiota in response to the administration of BT in Wistar rats (n = 6). CON: Control; LBT: Low-dose BT; MBT: Middle-dose BT; HBT: High-dose BT.
Figure 8.
KEGG pathways with the significantly varied enrichment in the cecal microbiota in response to the administration of BT in Wistar rats (n = 6). CON: Control; LBT: Low-dose BT; MBT: Middle-dose BT; HBT: High-dose BT.
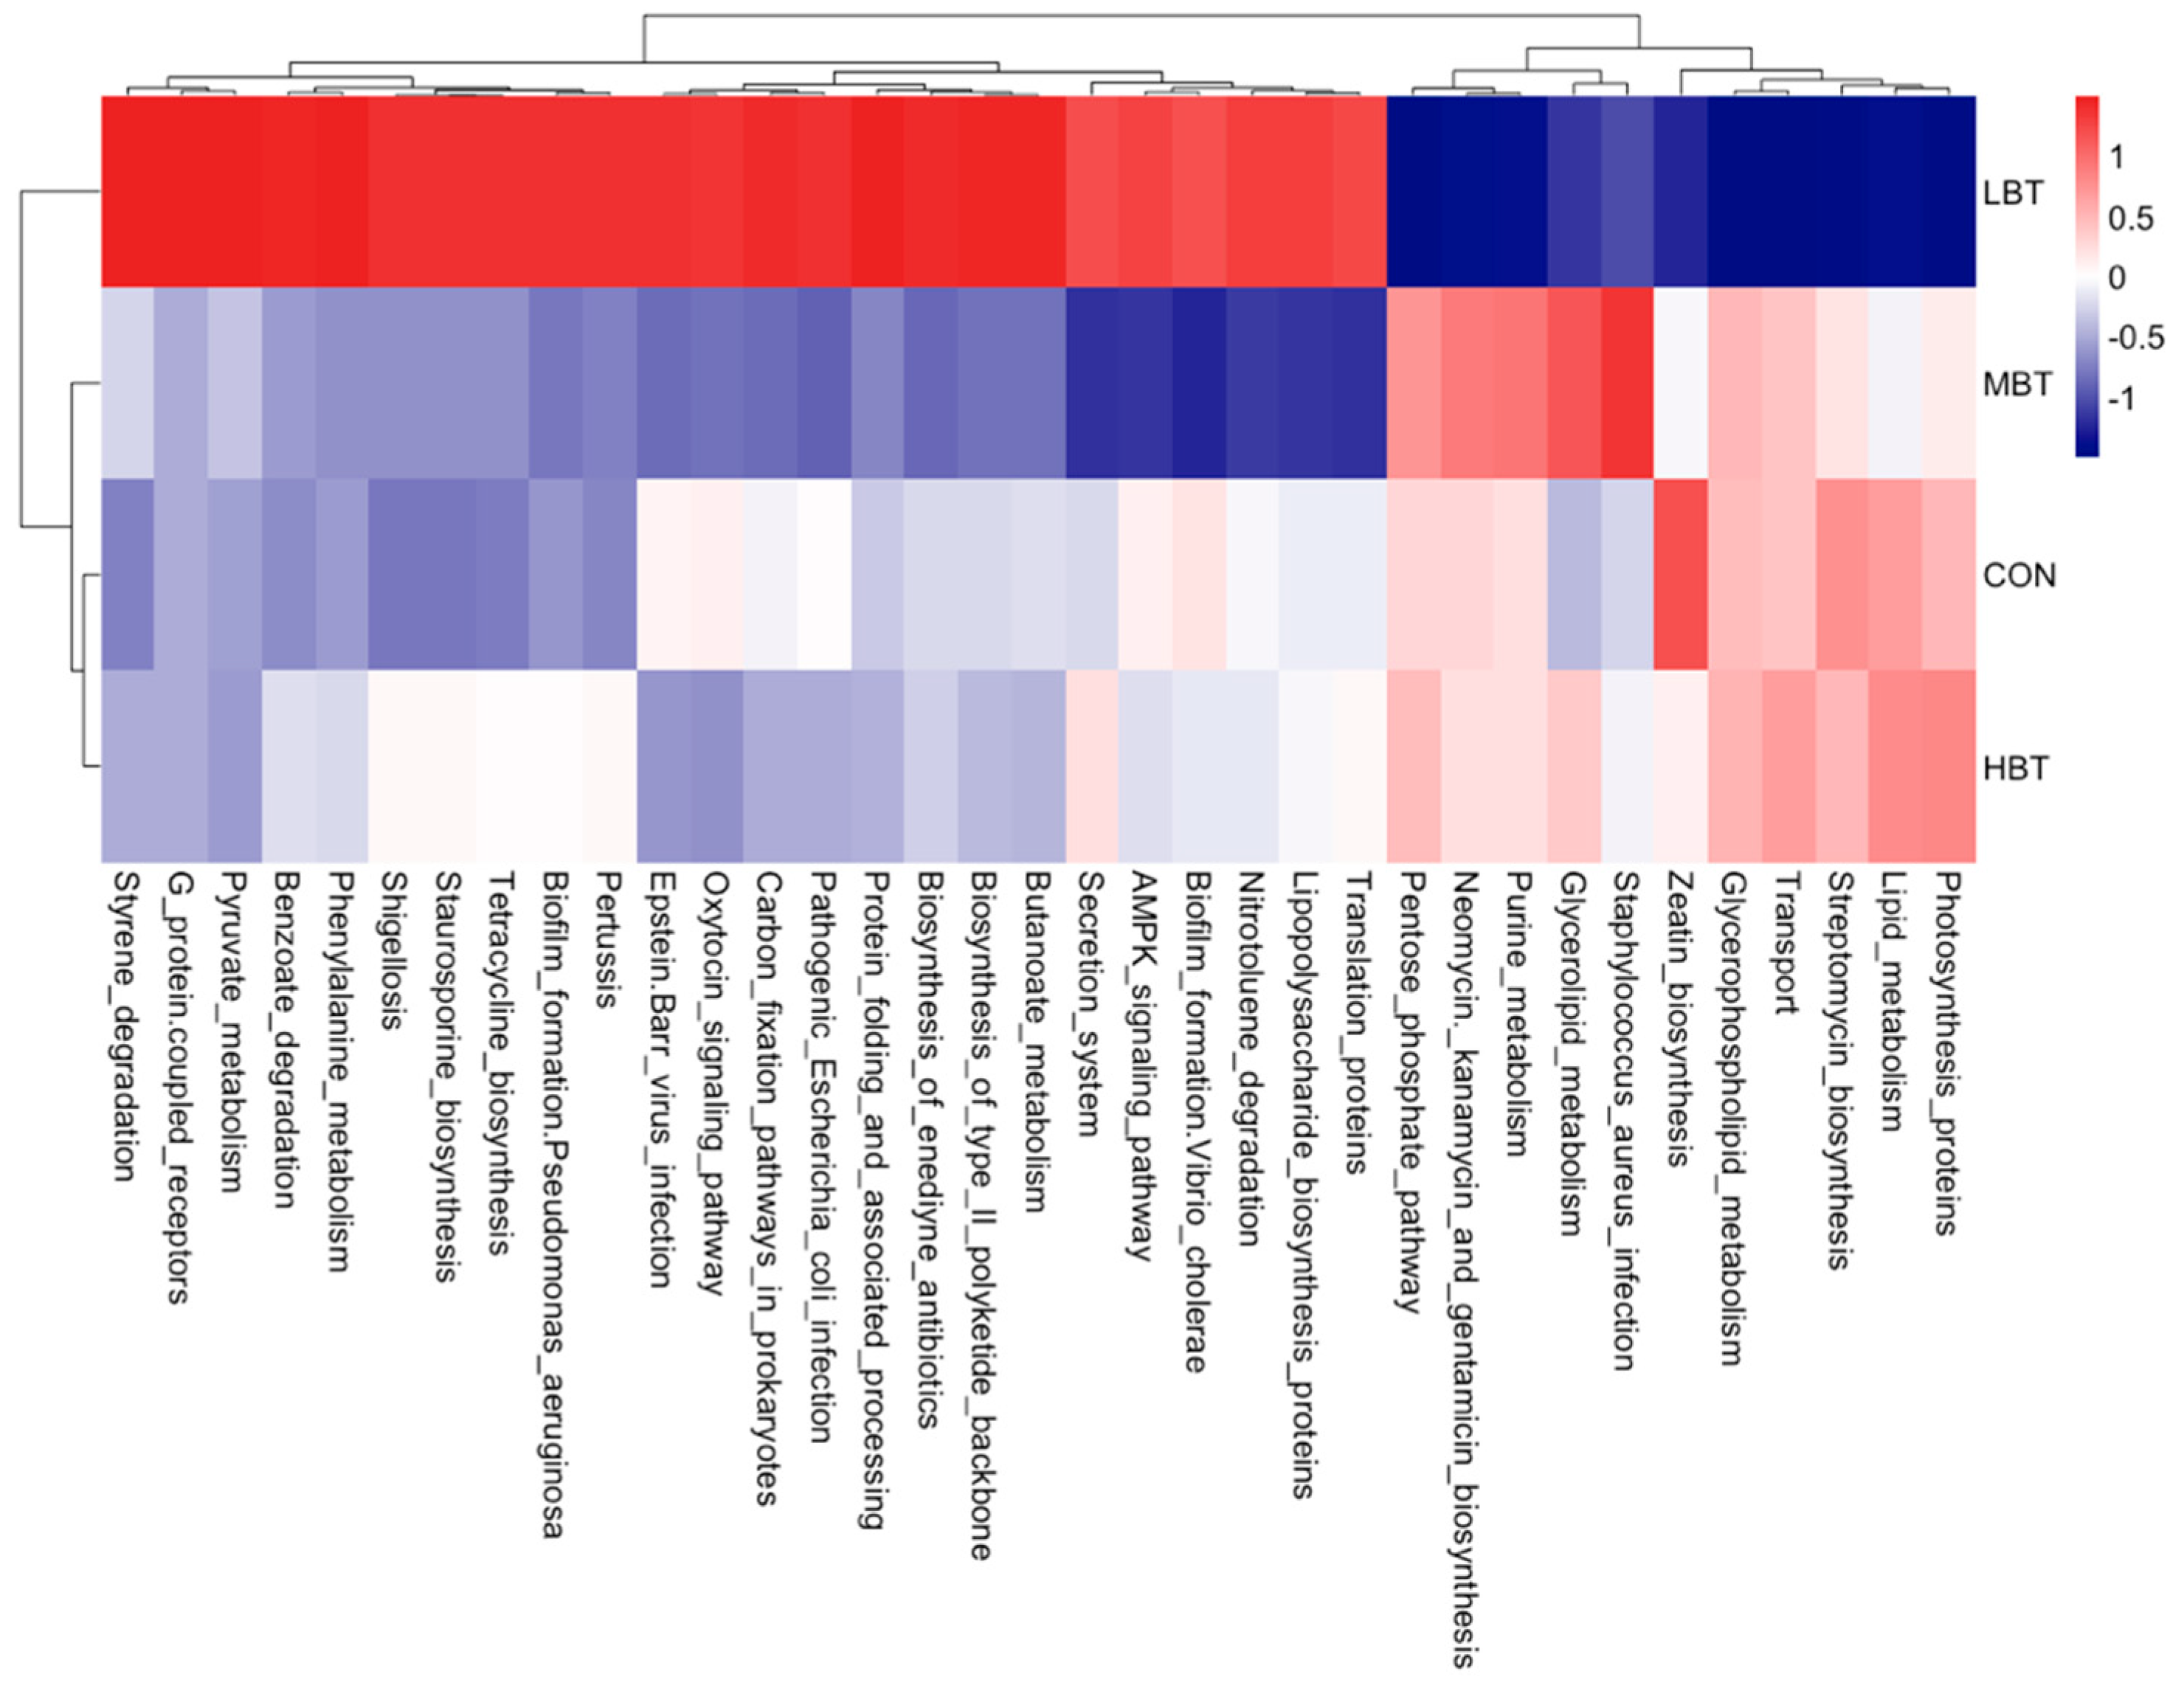
Figure 9.
Correlations between the abundances of varied genera and the enrichment of predicted functions in the cecal microbial community of Wistar rats (n = 6). * means P < 0.05, ** means P < 0.01, and *** means P < 0.001.
Figure 9.
Correlations between the abundances of varied genera and the enrichment of predicted functions in the cecal microbial community of Wistar rats (n = 6). * means P < 0.05, ** means P < 0.01, and *** means P < 0.001.
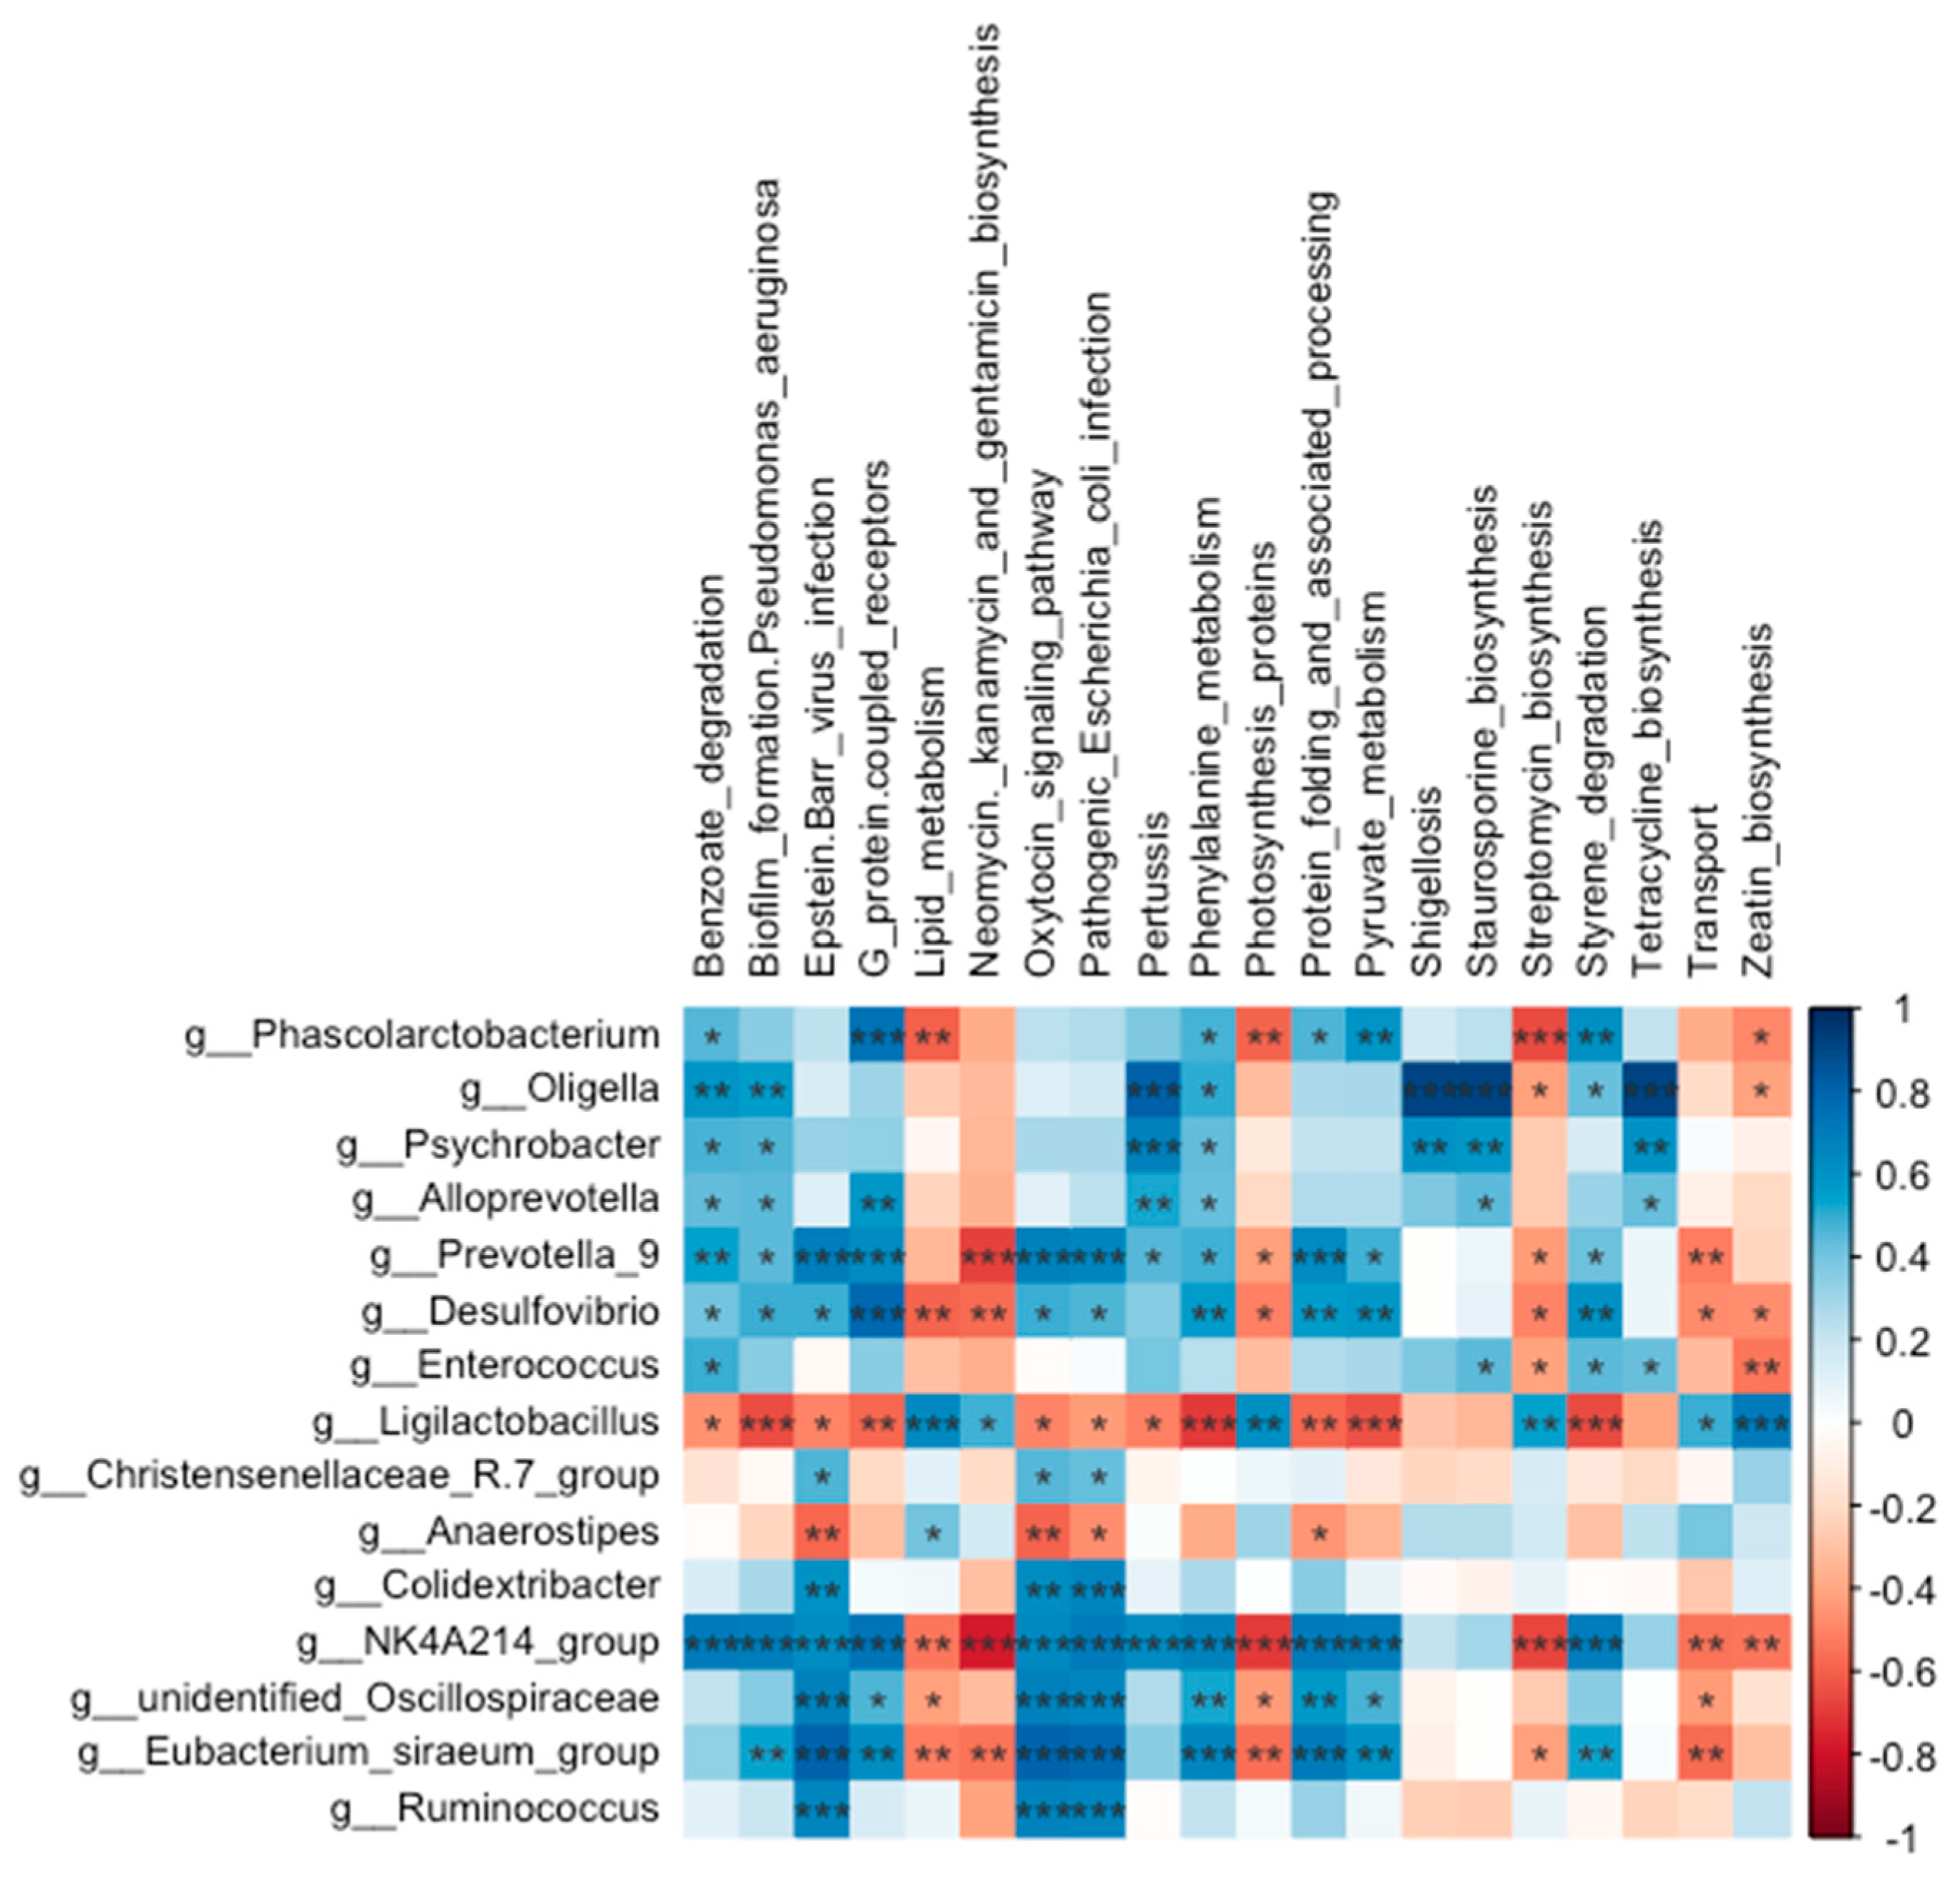
Figure 10.
The top 10 taxonomic units at the levels of phylum (A) and genus (B) in the pulmonary microbial community of Wistar rats (n = 6). CON: Control; LBT: Low-dose BT; MBT: Middle-dose BT; HBT: High-dose BT.
Figure 10.
The top 10 taxonomic units at the levels of phylum (A) and genus (B) in the pulmonary microbial community of Wistar rats (n = 6). CON: Control; LBT: Low-dose BT; MBT: Middle-dose BT; HBT: High-dose BT.
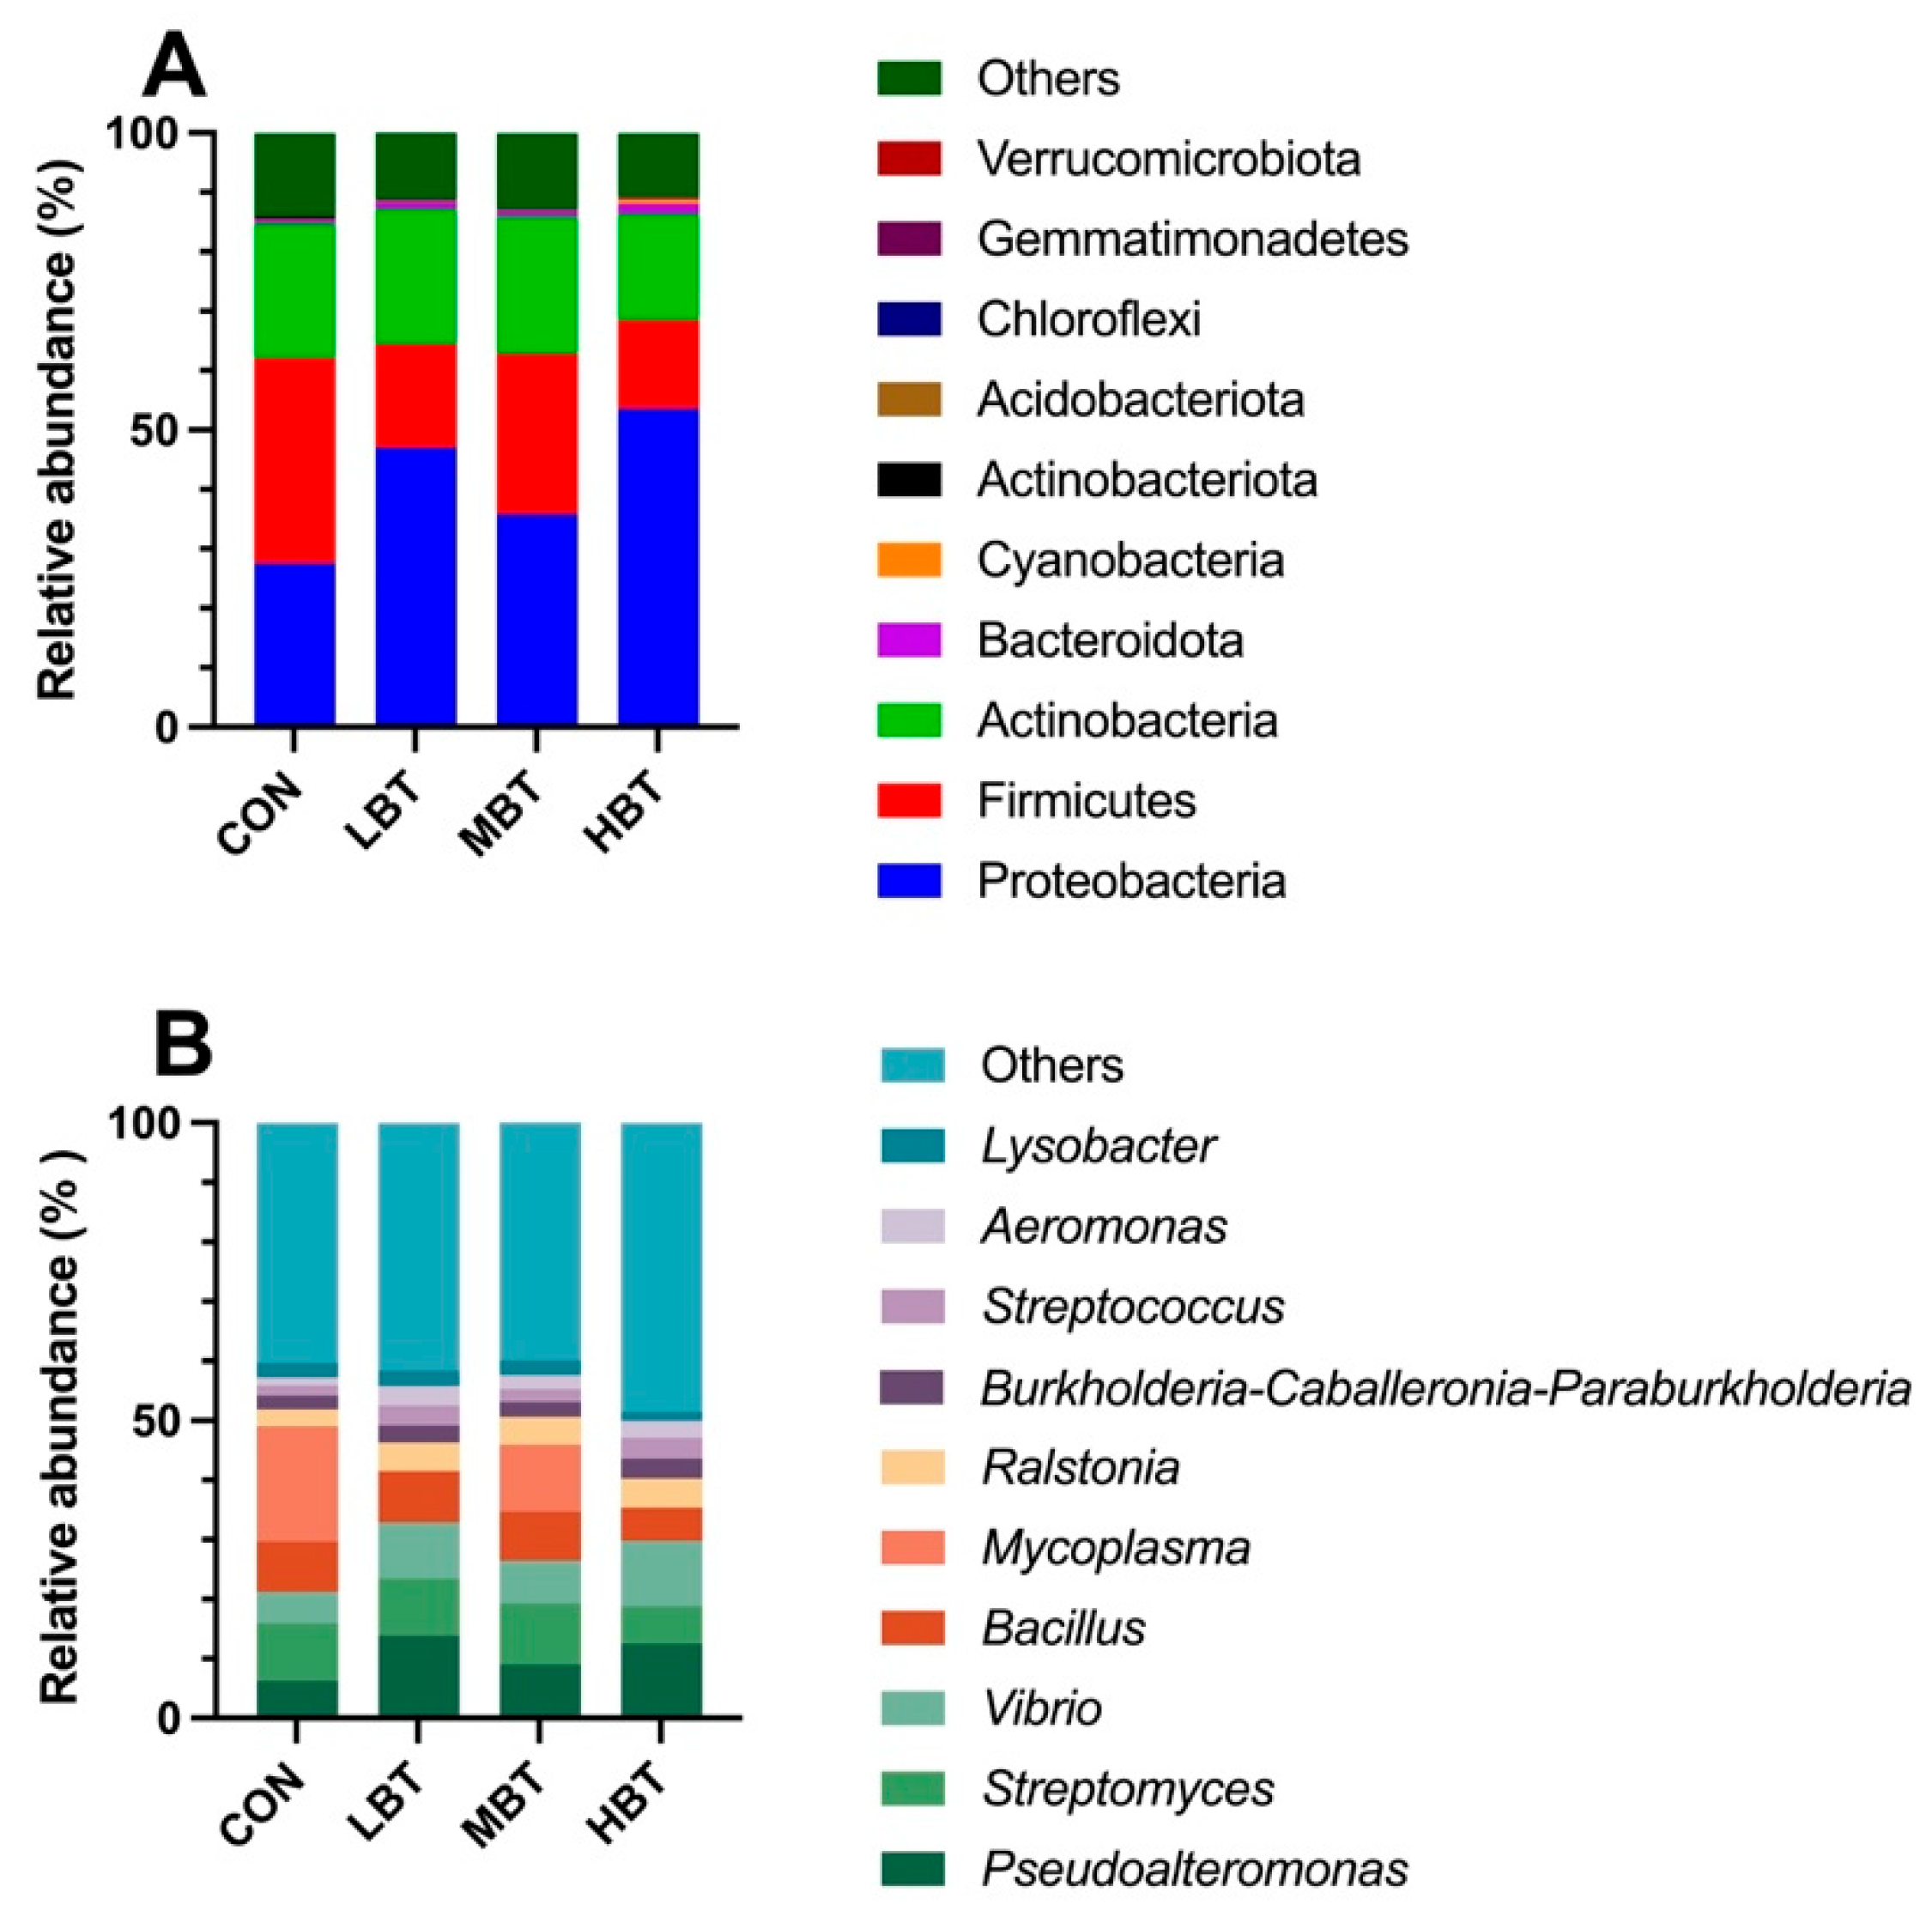
Figure 11.
Taxa identified as biomarkers in the pulmonary microbial community of Wistar rats (n = 6). (A) Bar plot displaying taxa with significant LDA scores (LDA > 3); (B) Cladogram of phylogenetically enriched taxa across three groups. CON: Control; MBT: Middle-dose BT; HBT: High-dose BT.
Figure 11.
Taxa identified as biomarkers in the pulmonary microbial community of Wistar rats (n = 6). (A) Bar plot displaying taxa with significant LDA scores (LDA > 3); (B) Cladogram of phylogenetically enriched taxa across three groups. CON: Control; MBT: Middle-dose BT; HBT: High-dose BT.
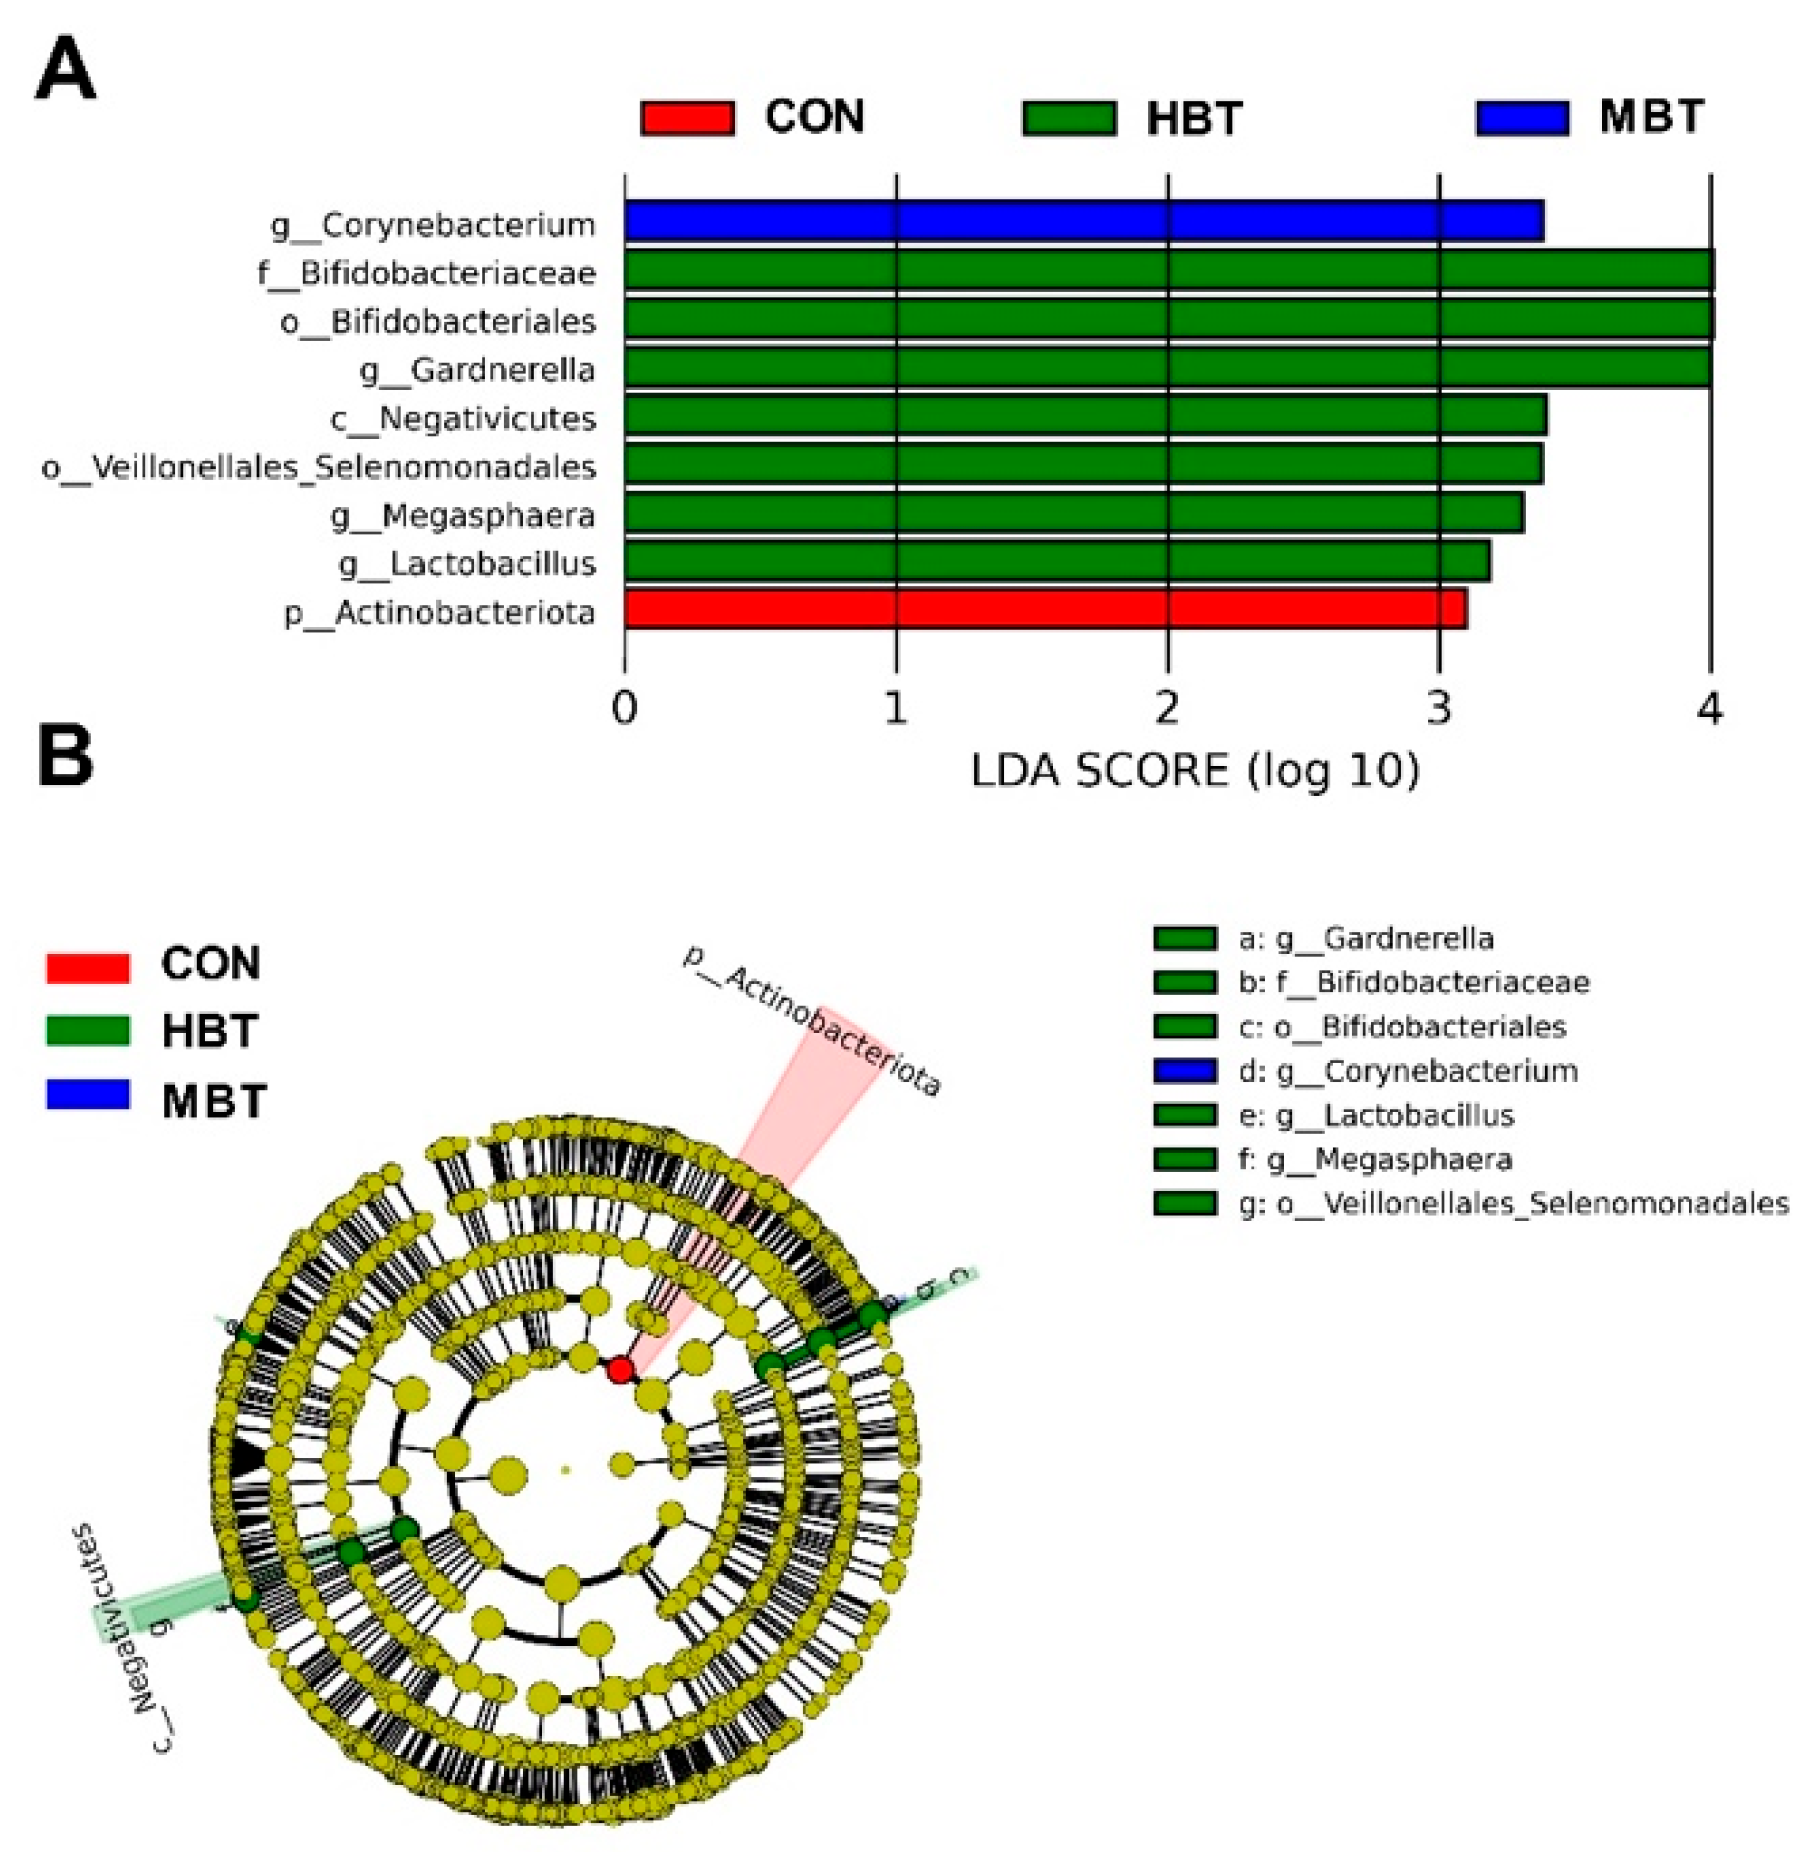
Figure 12.
Differences in the pulmonary microbial abundances at the order, family and genus levels in Wistar rats (n = 6). CON: Control; LBT: Low-dose BT; MBT: Middle-dose BT; HBT: High-dose BT. Error bars indicate standard errors. There was a significant difference between groups marked with the different letter (P < 0.05).
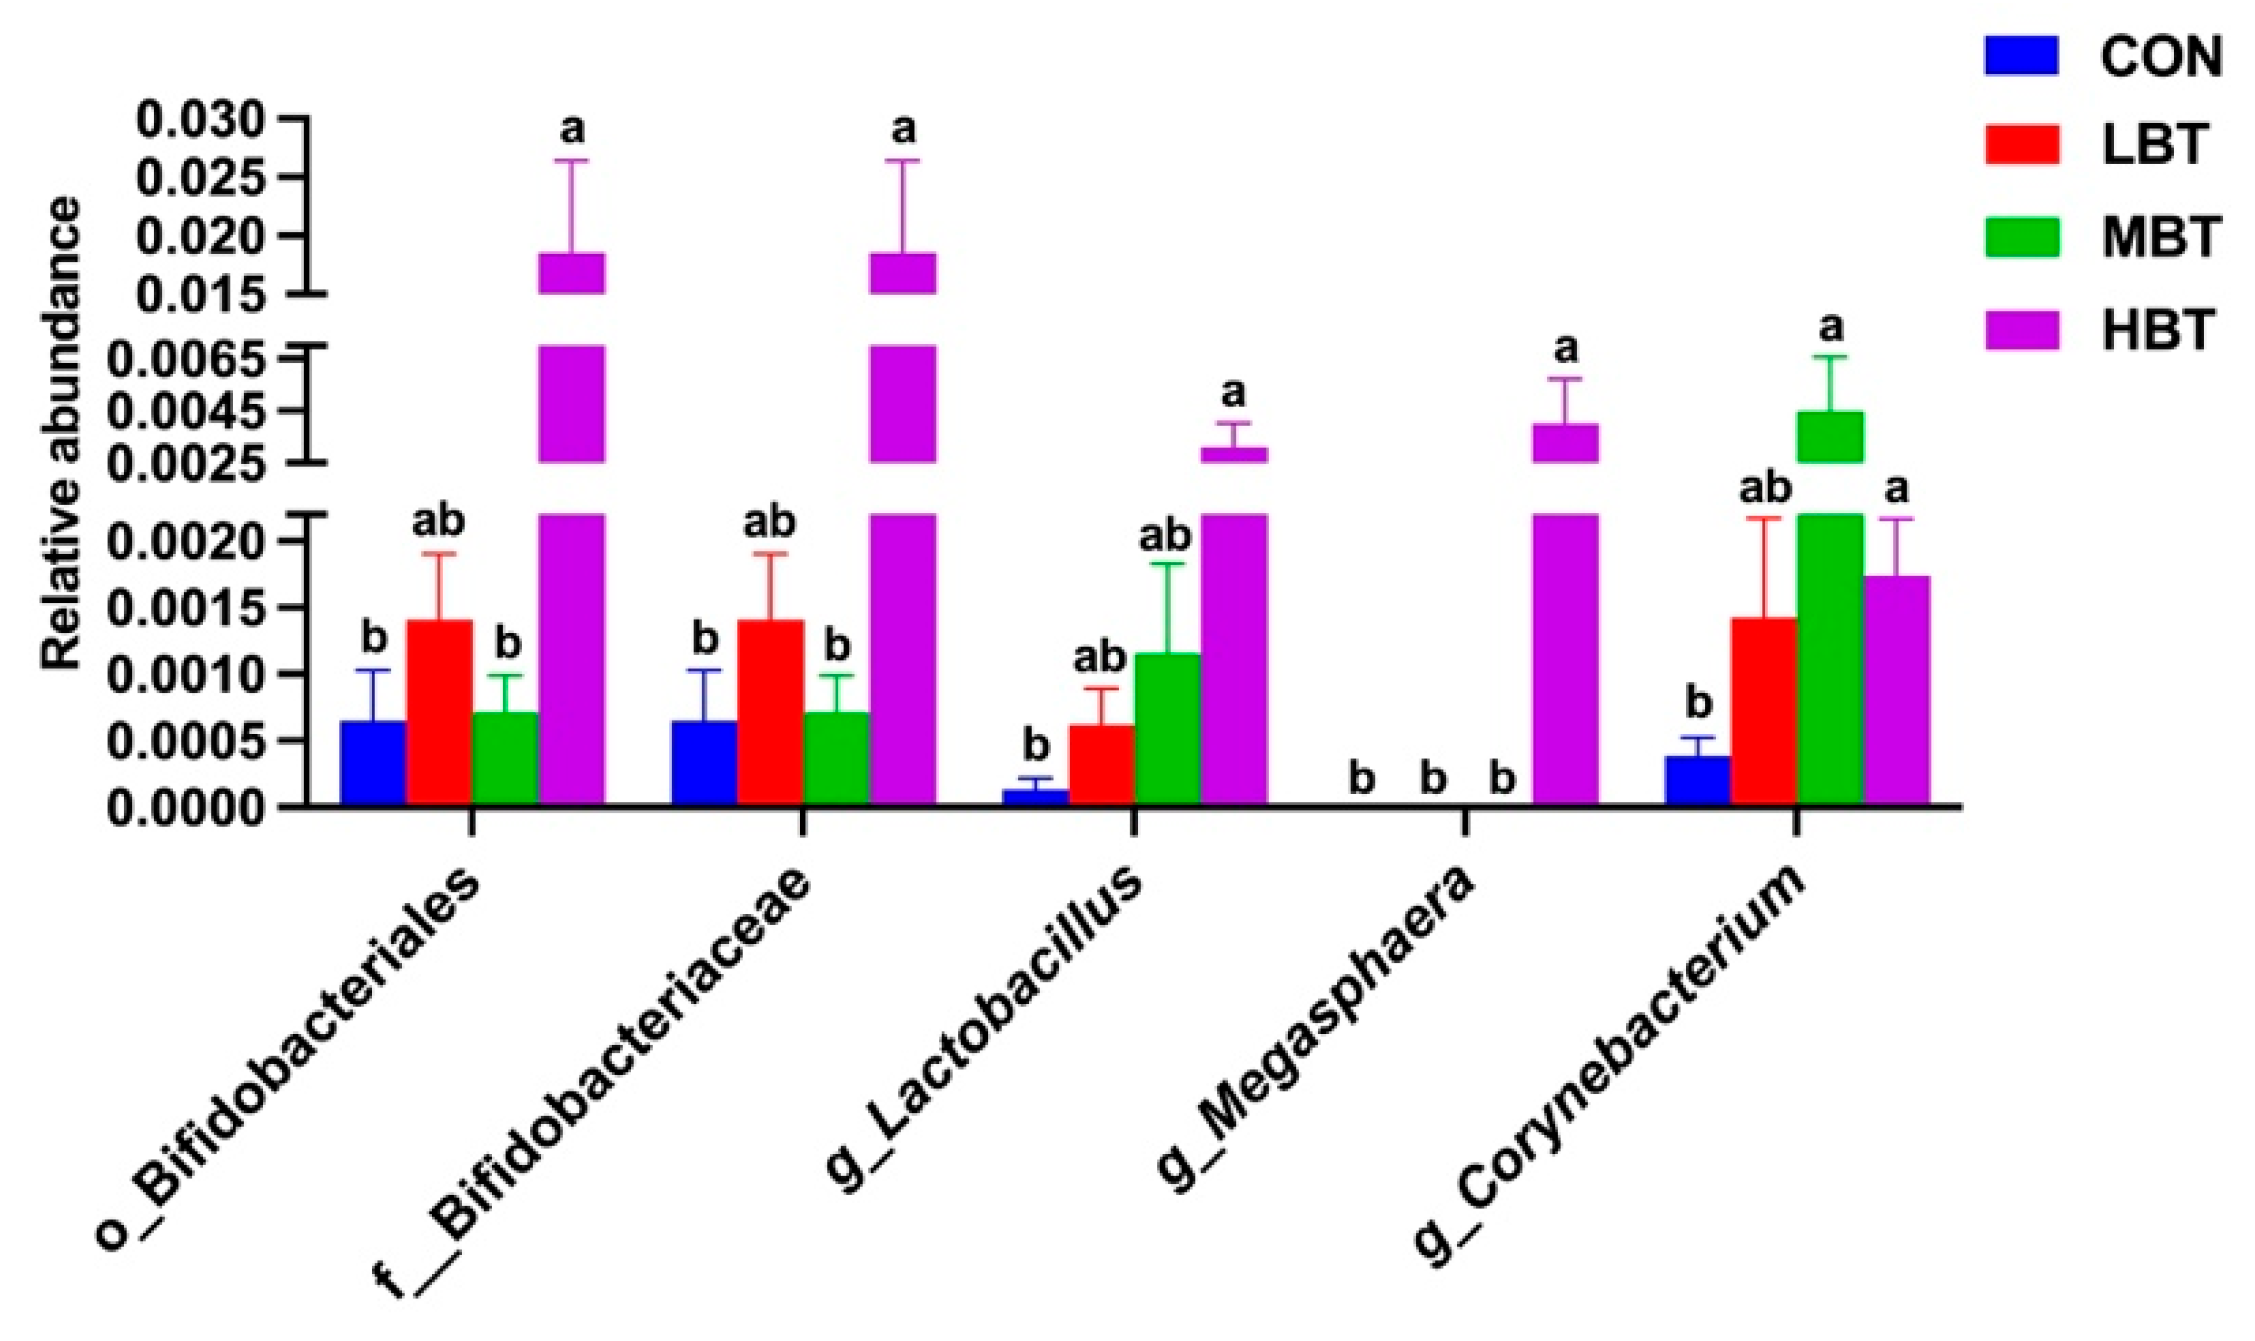
Figure 13.
KEGG pathways with the significantly varied enrichment in the lung microbial community in response to the administration of BT in Wistar rats (n = 6). CON: Control; LBT: Low-dose BT; MBT: Middle-dose BT; HBT: High-dose BT.
Figure 13.
KEGG pathways with the significantly varied enrichment in the lung microbial community in response to the administration of BT in Wistar rats (n = 6). CON: Control; LBT: Low-dose BT; MBT: Middle-dose BT; HBT: High-dose BT.
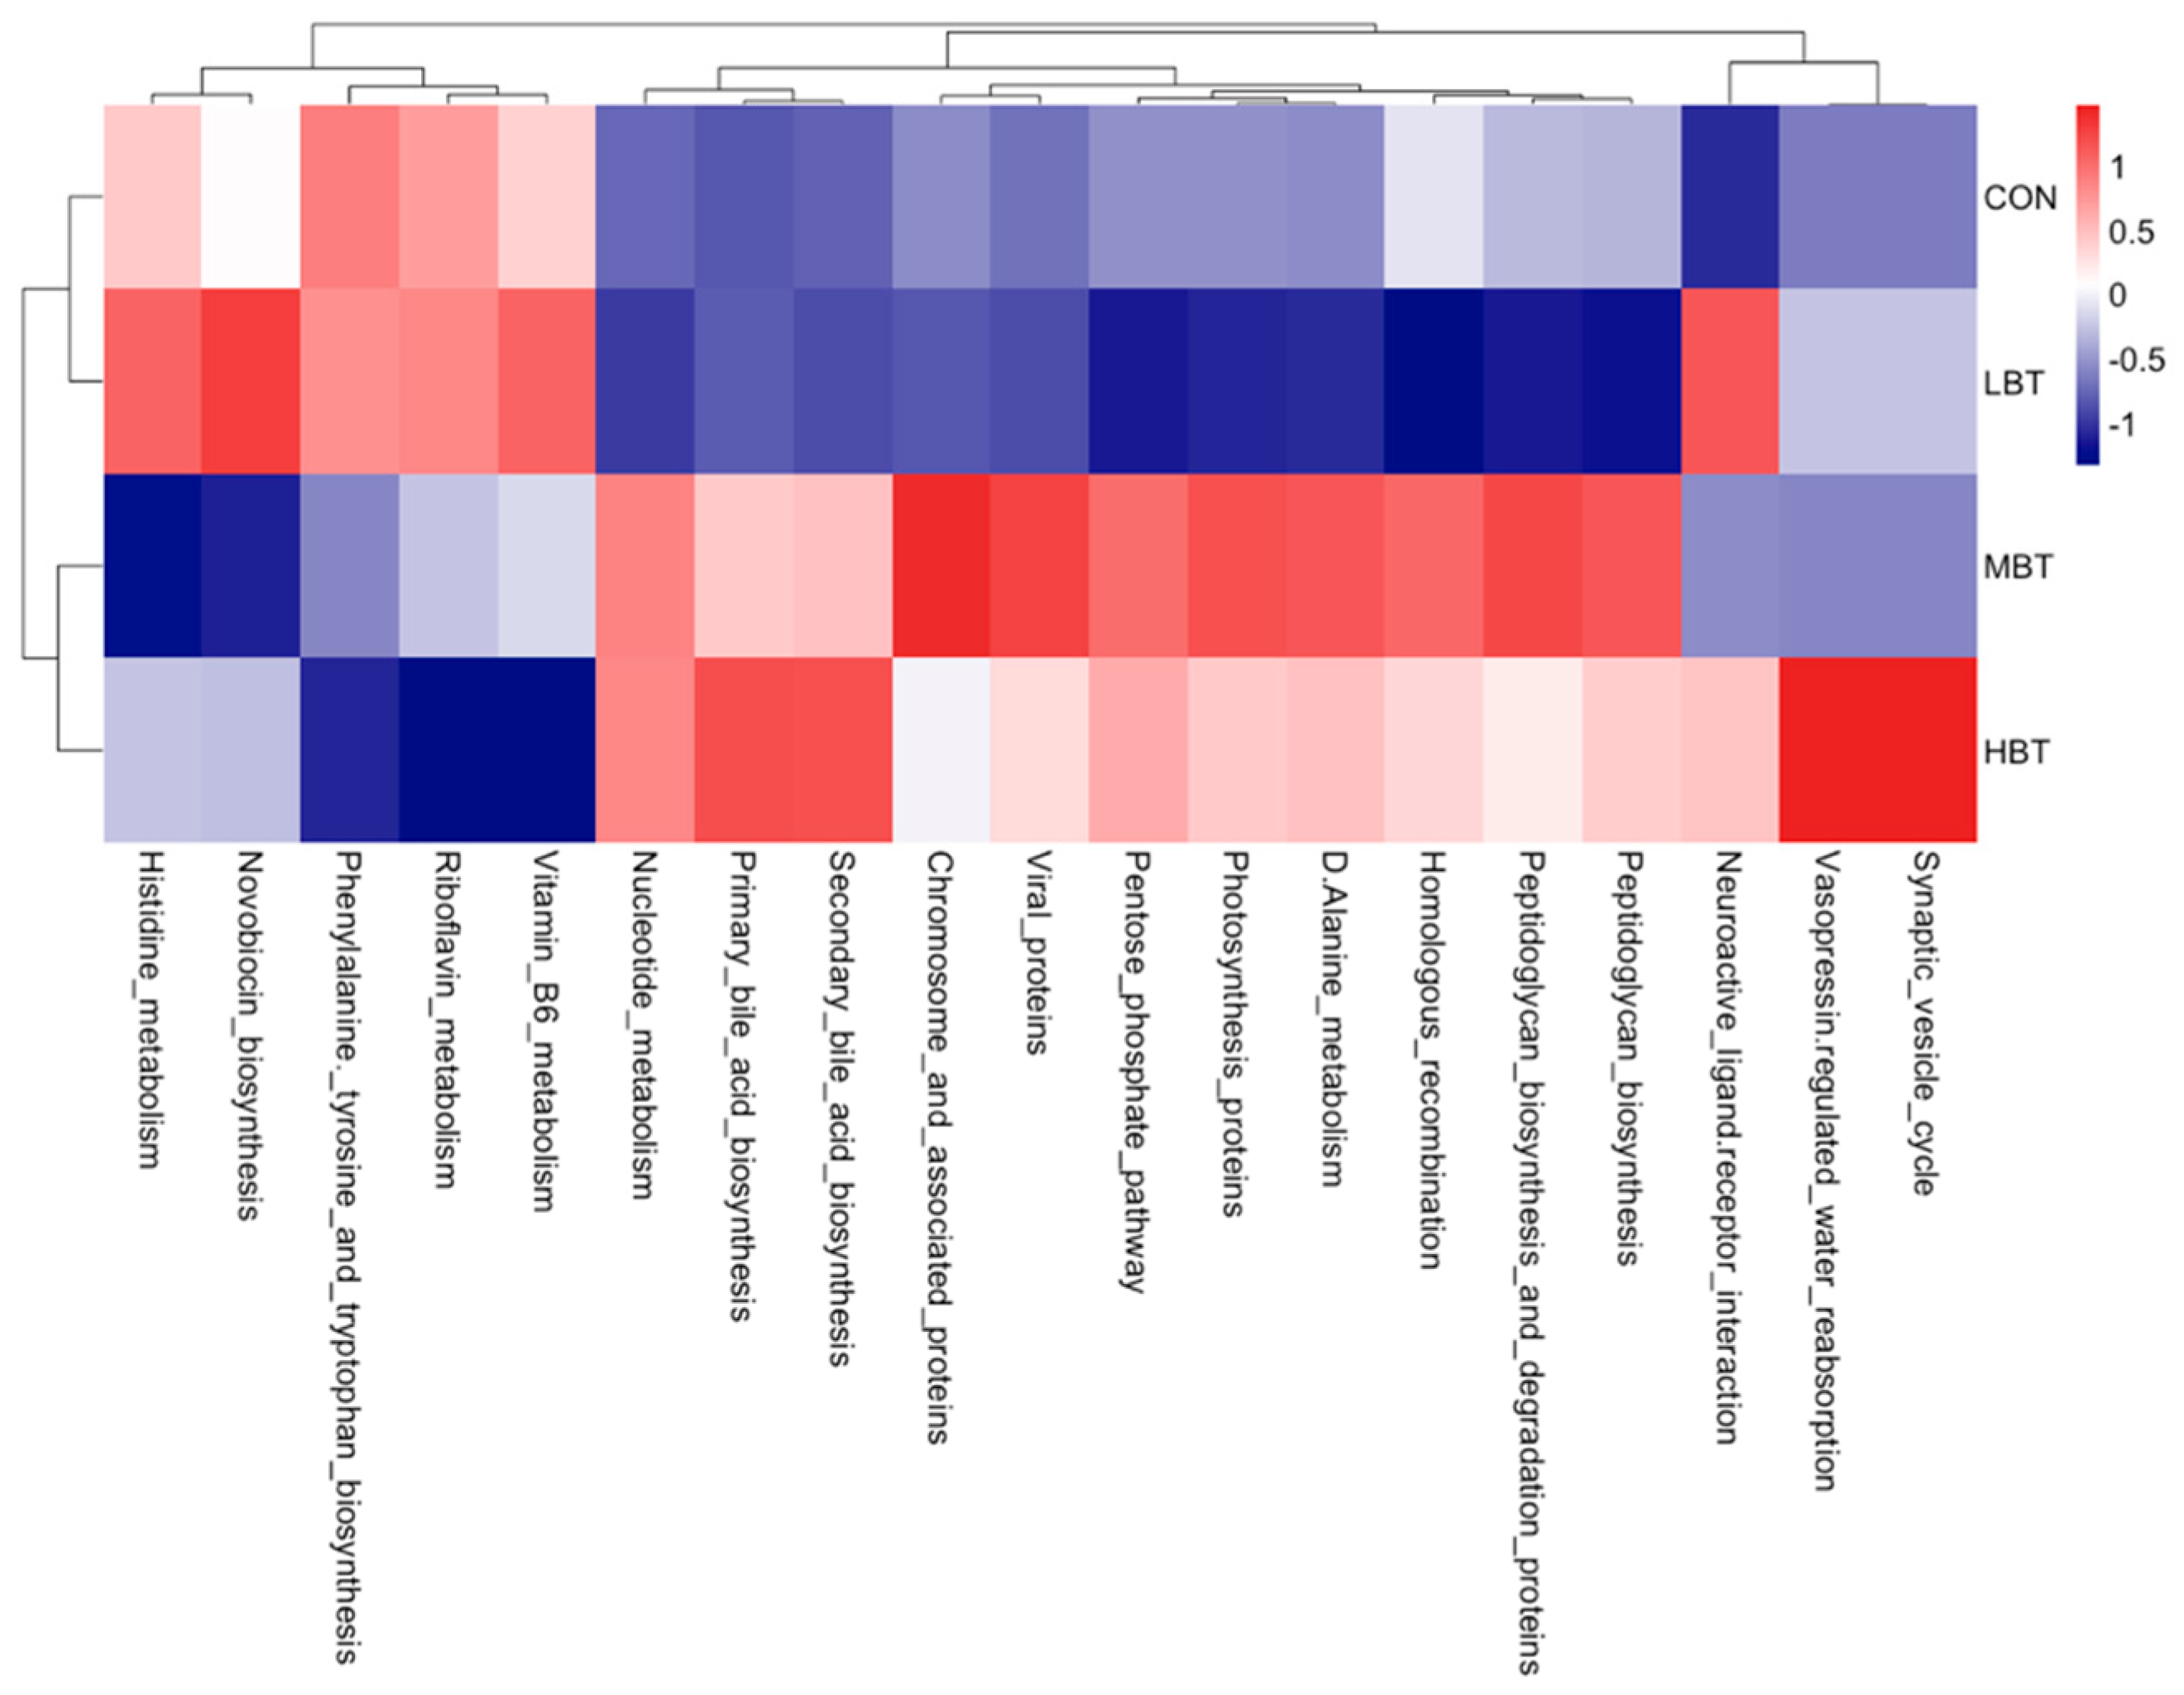
Figure 14.
Correlations between the abundances of varied genera and the enrichment of predicted functions in the pulmonary microbial community of Wistar rats (n = 6). * means P < 0.05, ** means P < 0.01, and *** means P < 0.001.
Figure 14.
Correlations between the abundances of varied genera and the enrichment of predicted functions in the pulmonary microbial community of Wistar rats (n = 6). * means P < 0.05, ** means P < 0.01, and *** means P < 0.001.
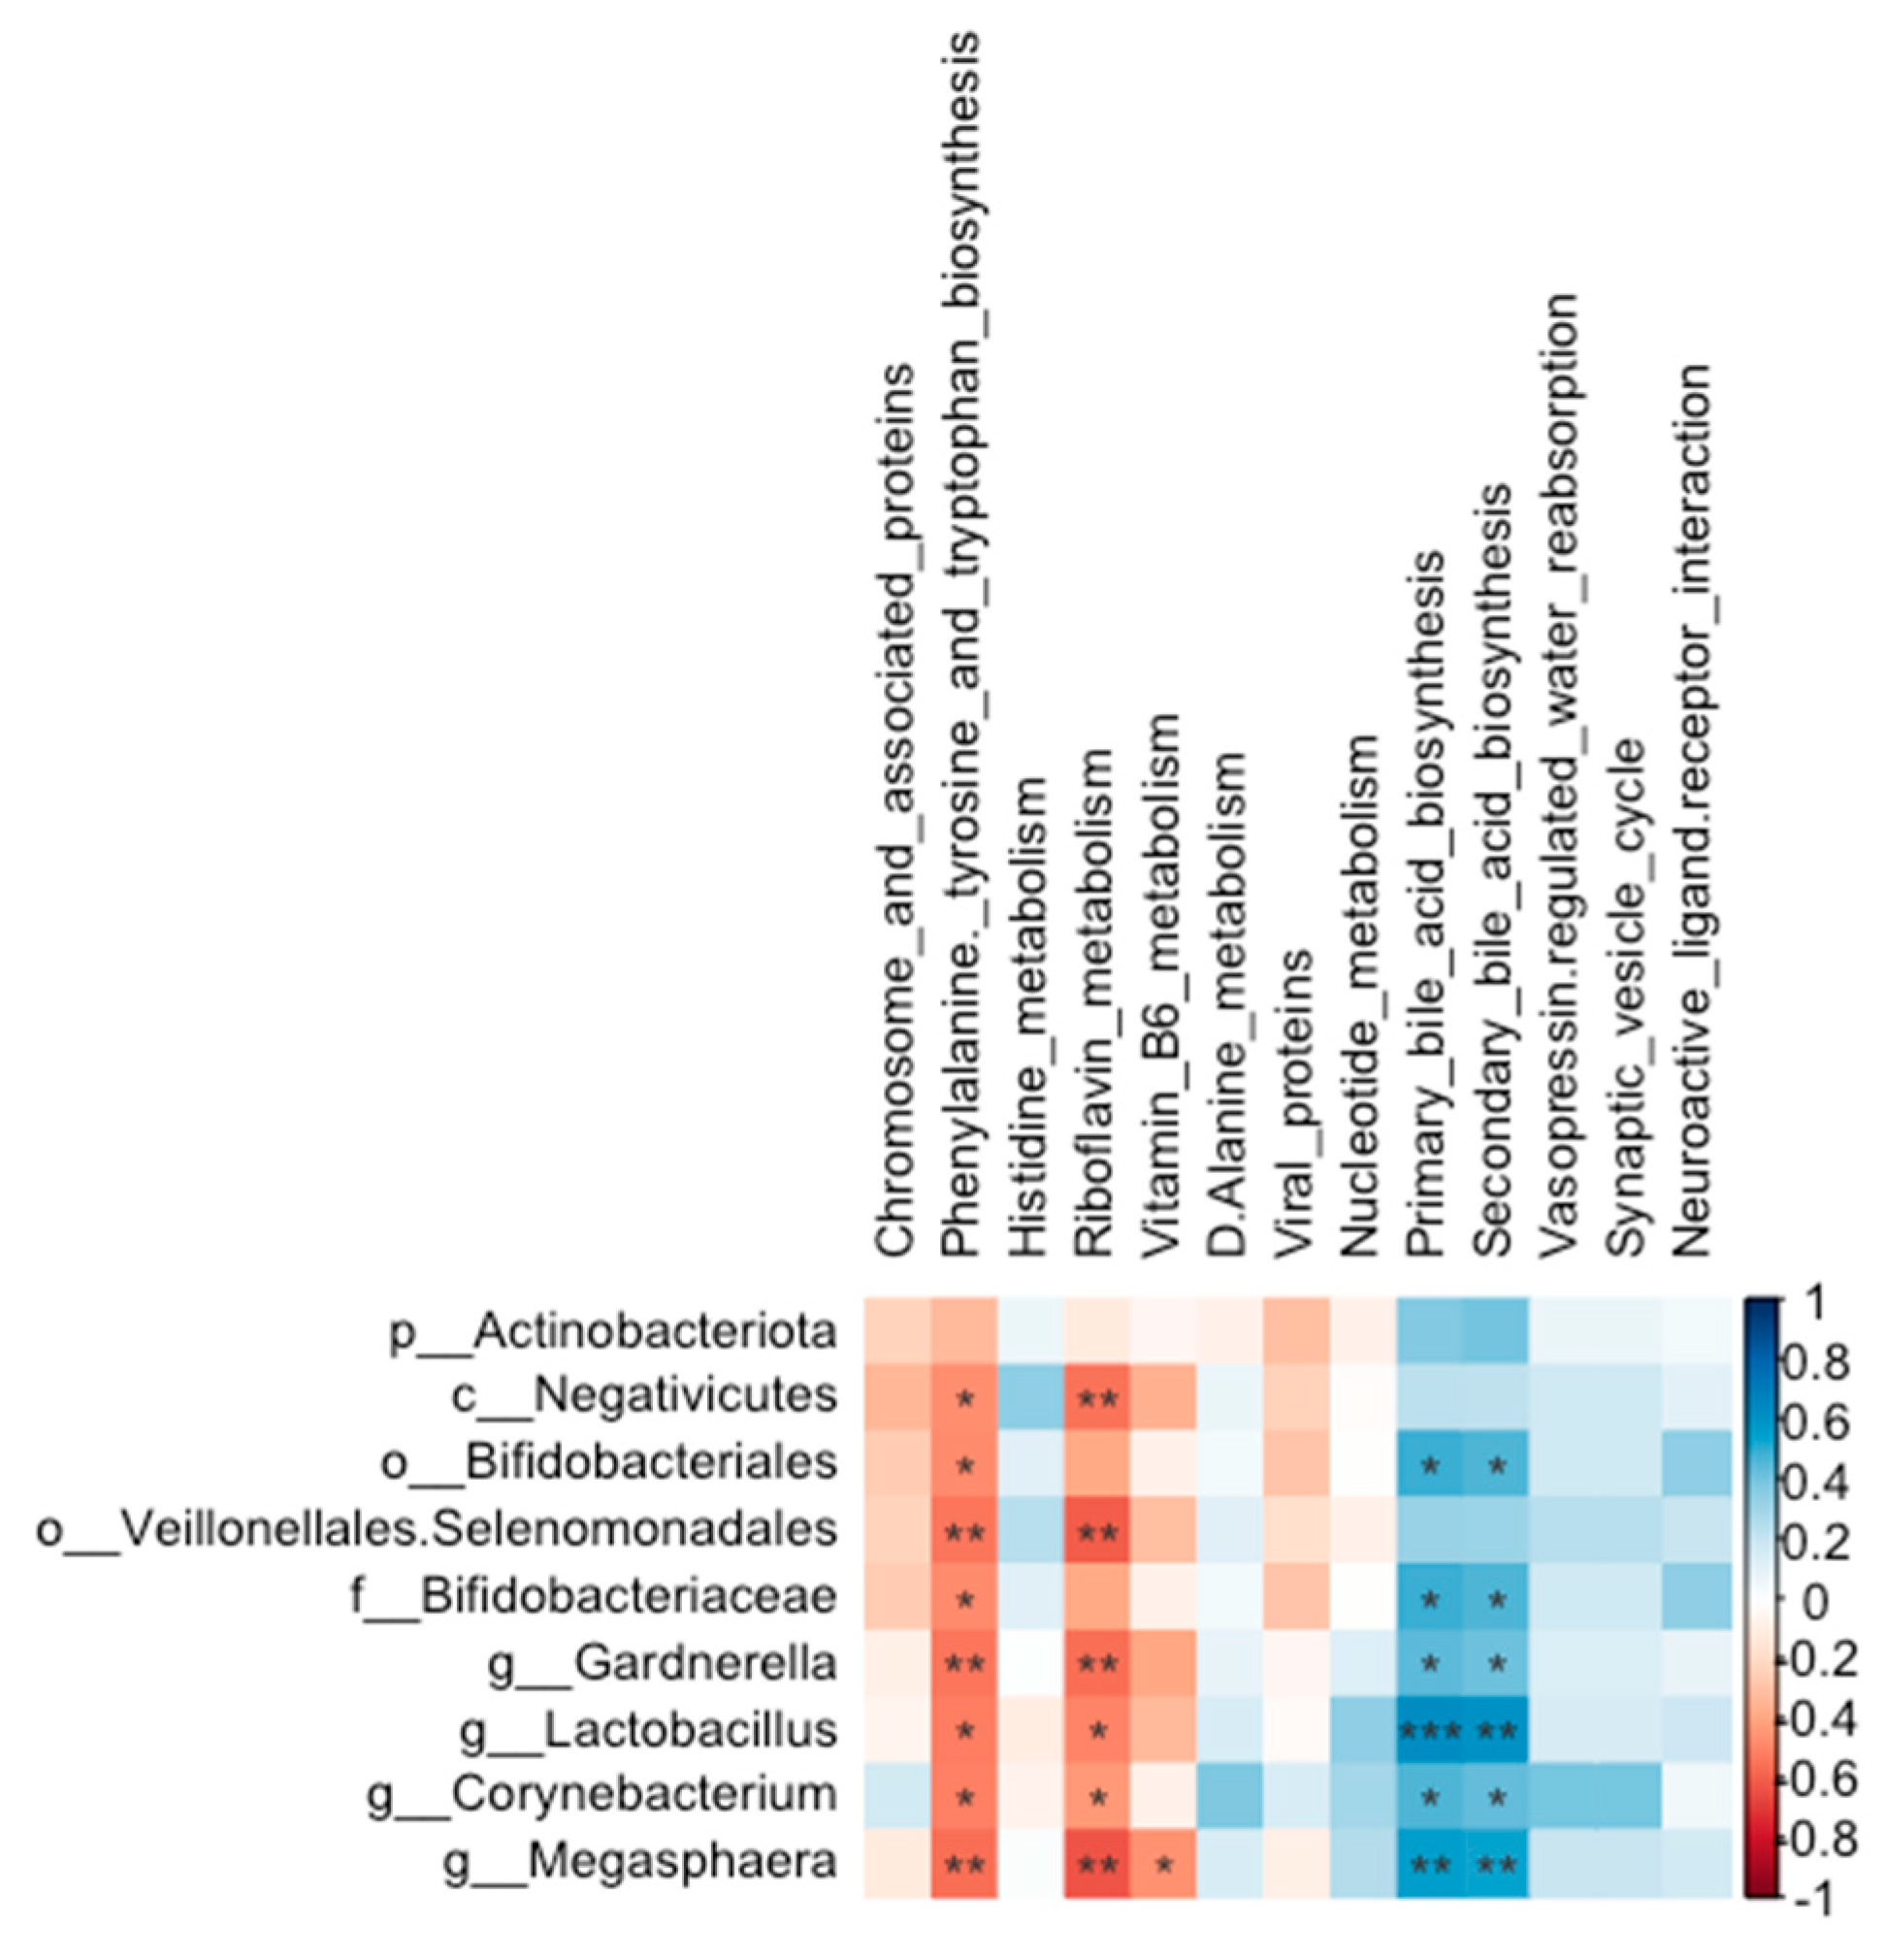
Figure 15.
Correlations between the abundances of the varied microbial taxa in the cecum and lung of Wistar rats (n = 6). * means P < 0.05 and ** means P < 0.01.
Figure 15.
Correlations between the abundances of the varied microbial taxa in the cecum and lung of Wistar rats (n = 6). * means P < 0.05 and ** means P < 0.01.
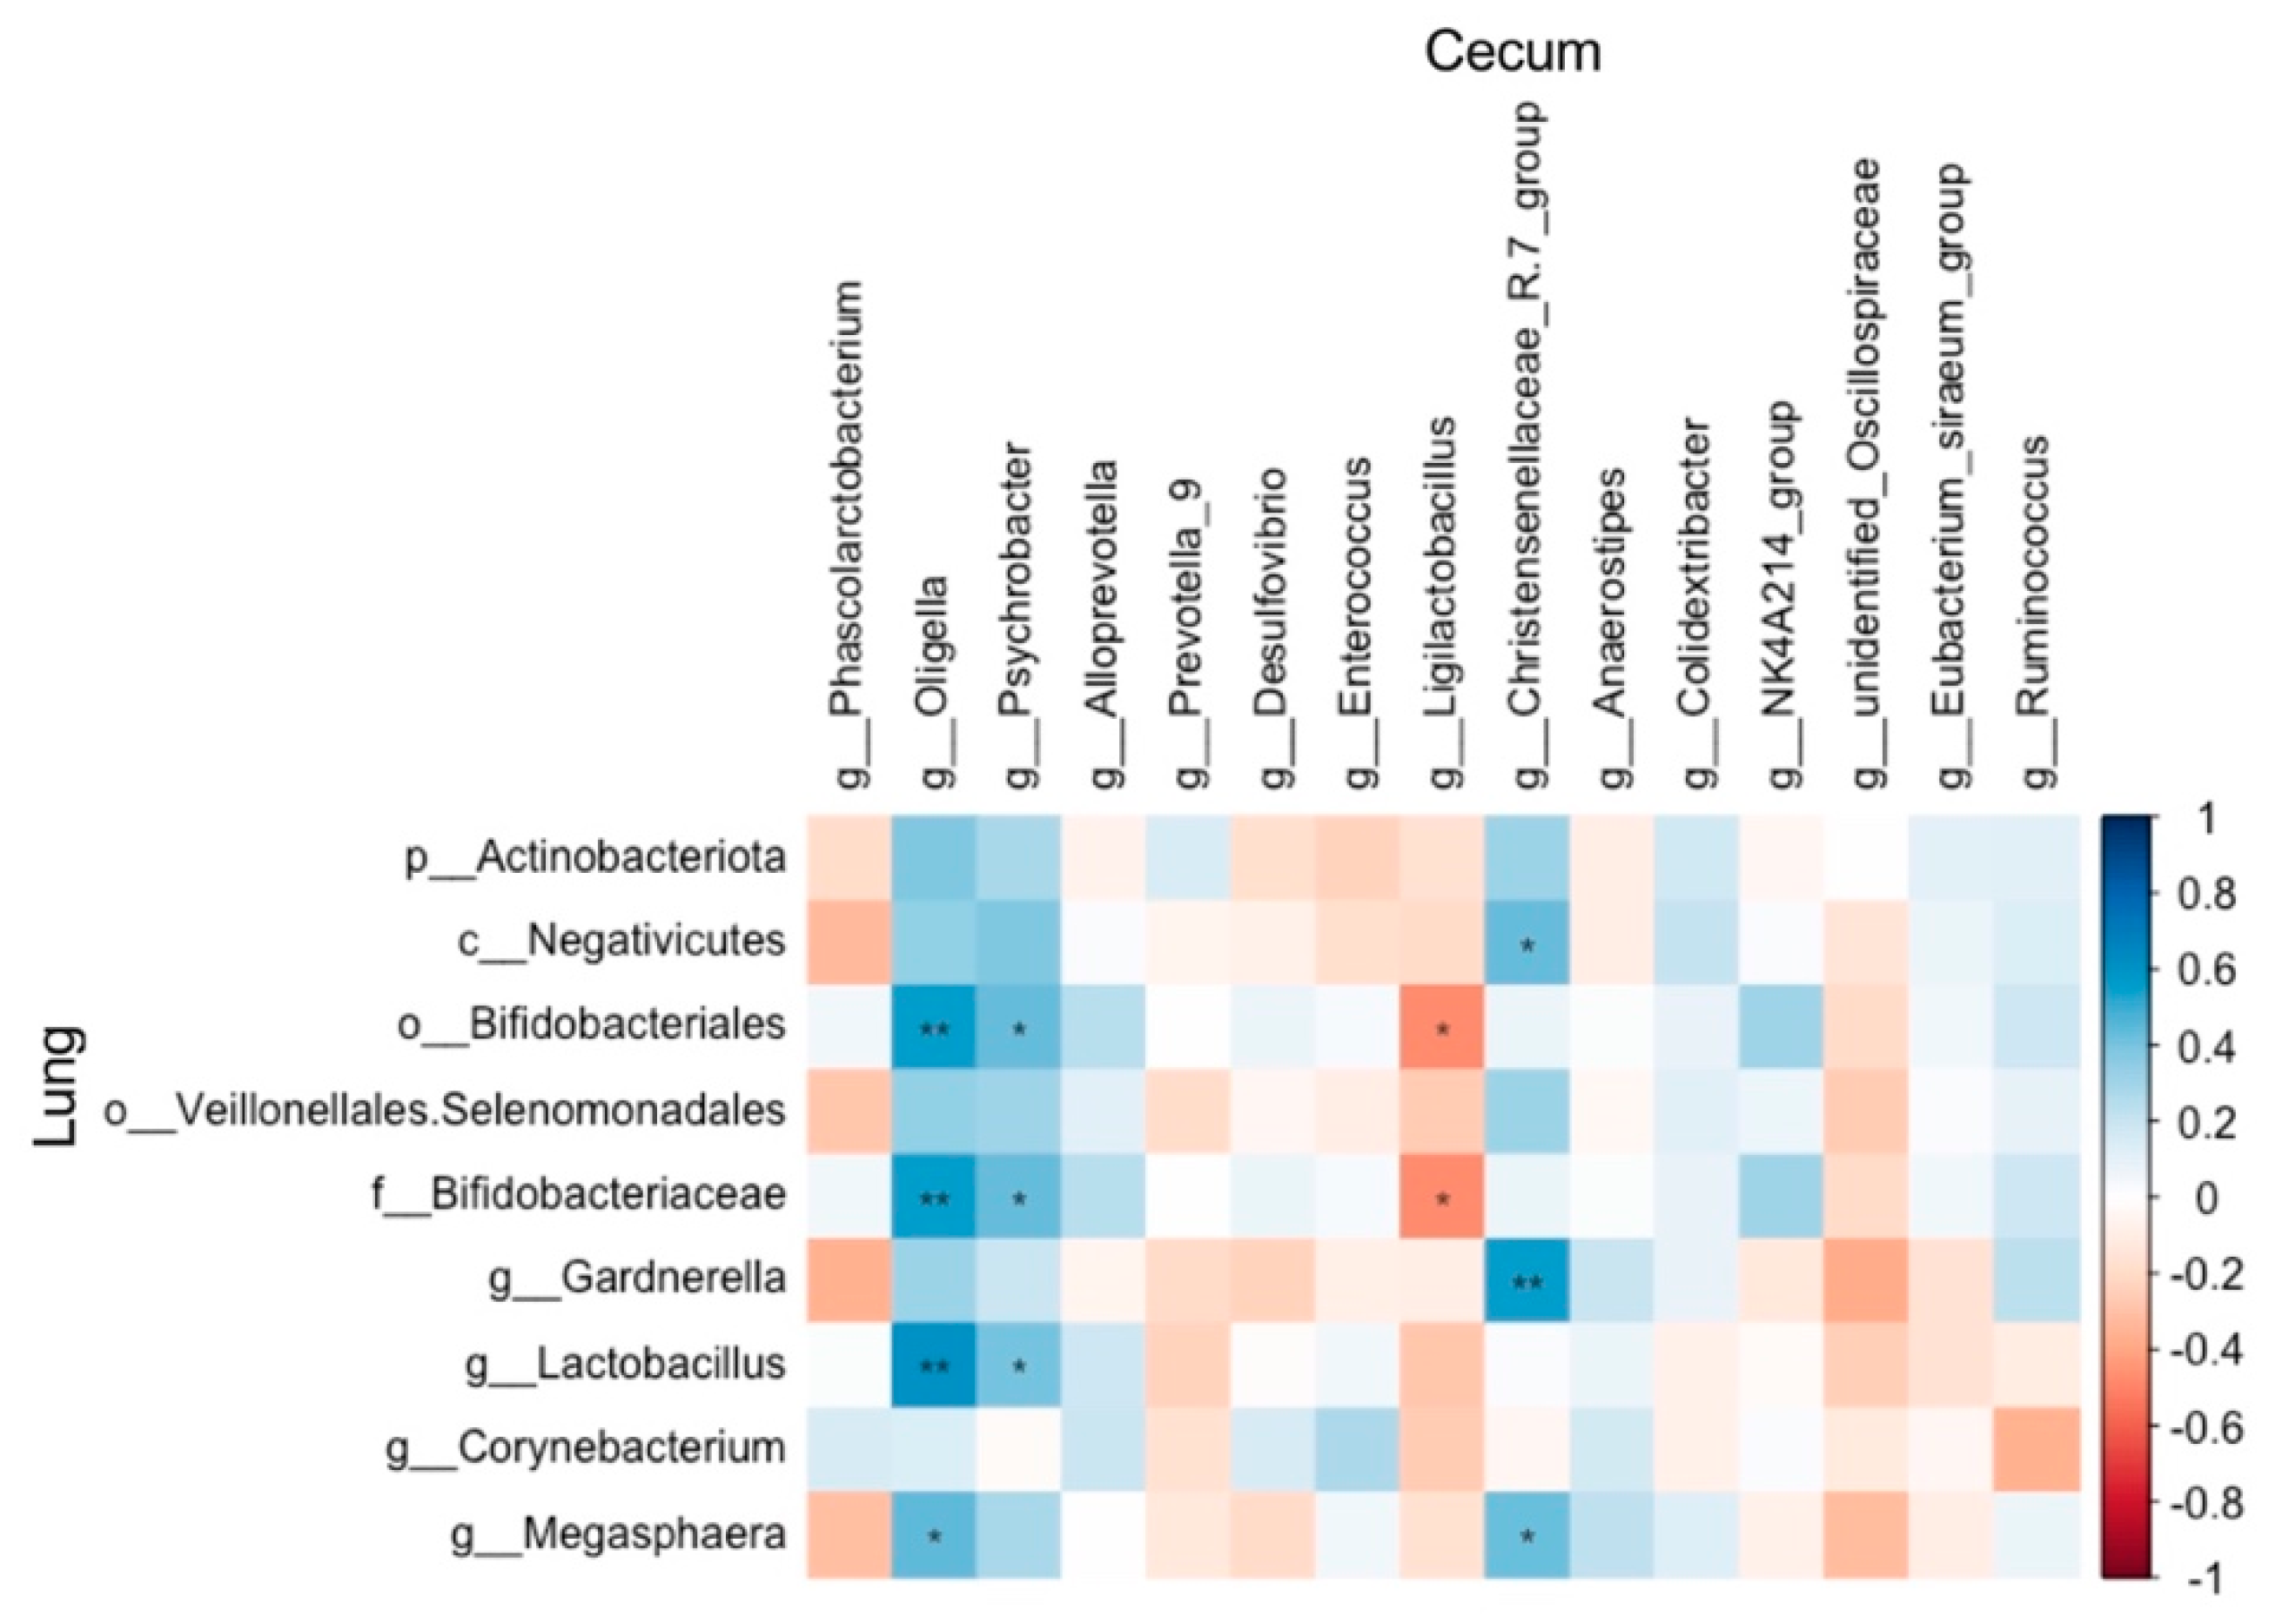
Figure 16.
Effect of BT on contents of cecal short-chain fatty acids in Wistar rats (n = 10). Acetate (A); Propionate (B); Isobutyrate (C); Isovalerate (D); Butyrate (E); Valerate (F). CON: Control; LBT: Low-dose BT; MBT: Middle-dose BT; HBT: High-dose BT. Error bars indicate standard errors. There was a significant difference between groups marked with the different letter (P < 0.05).
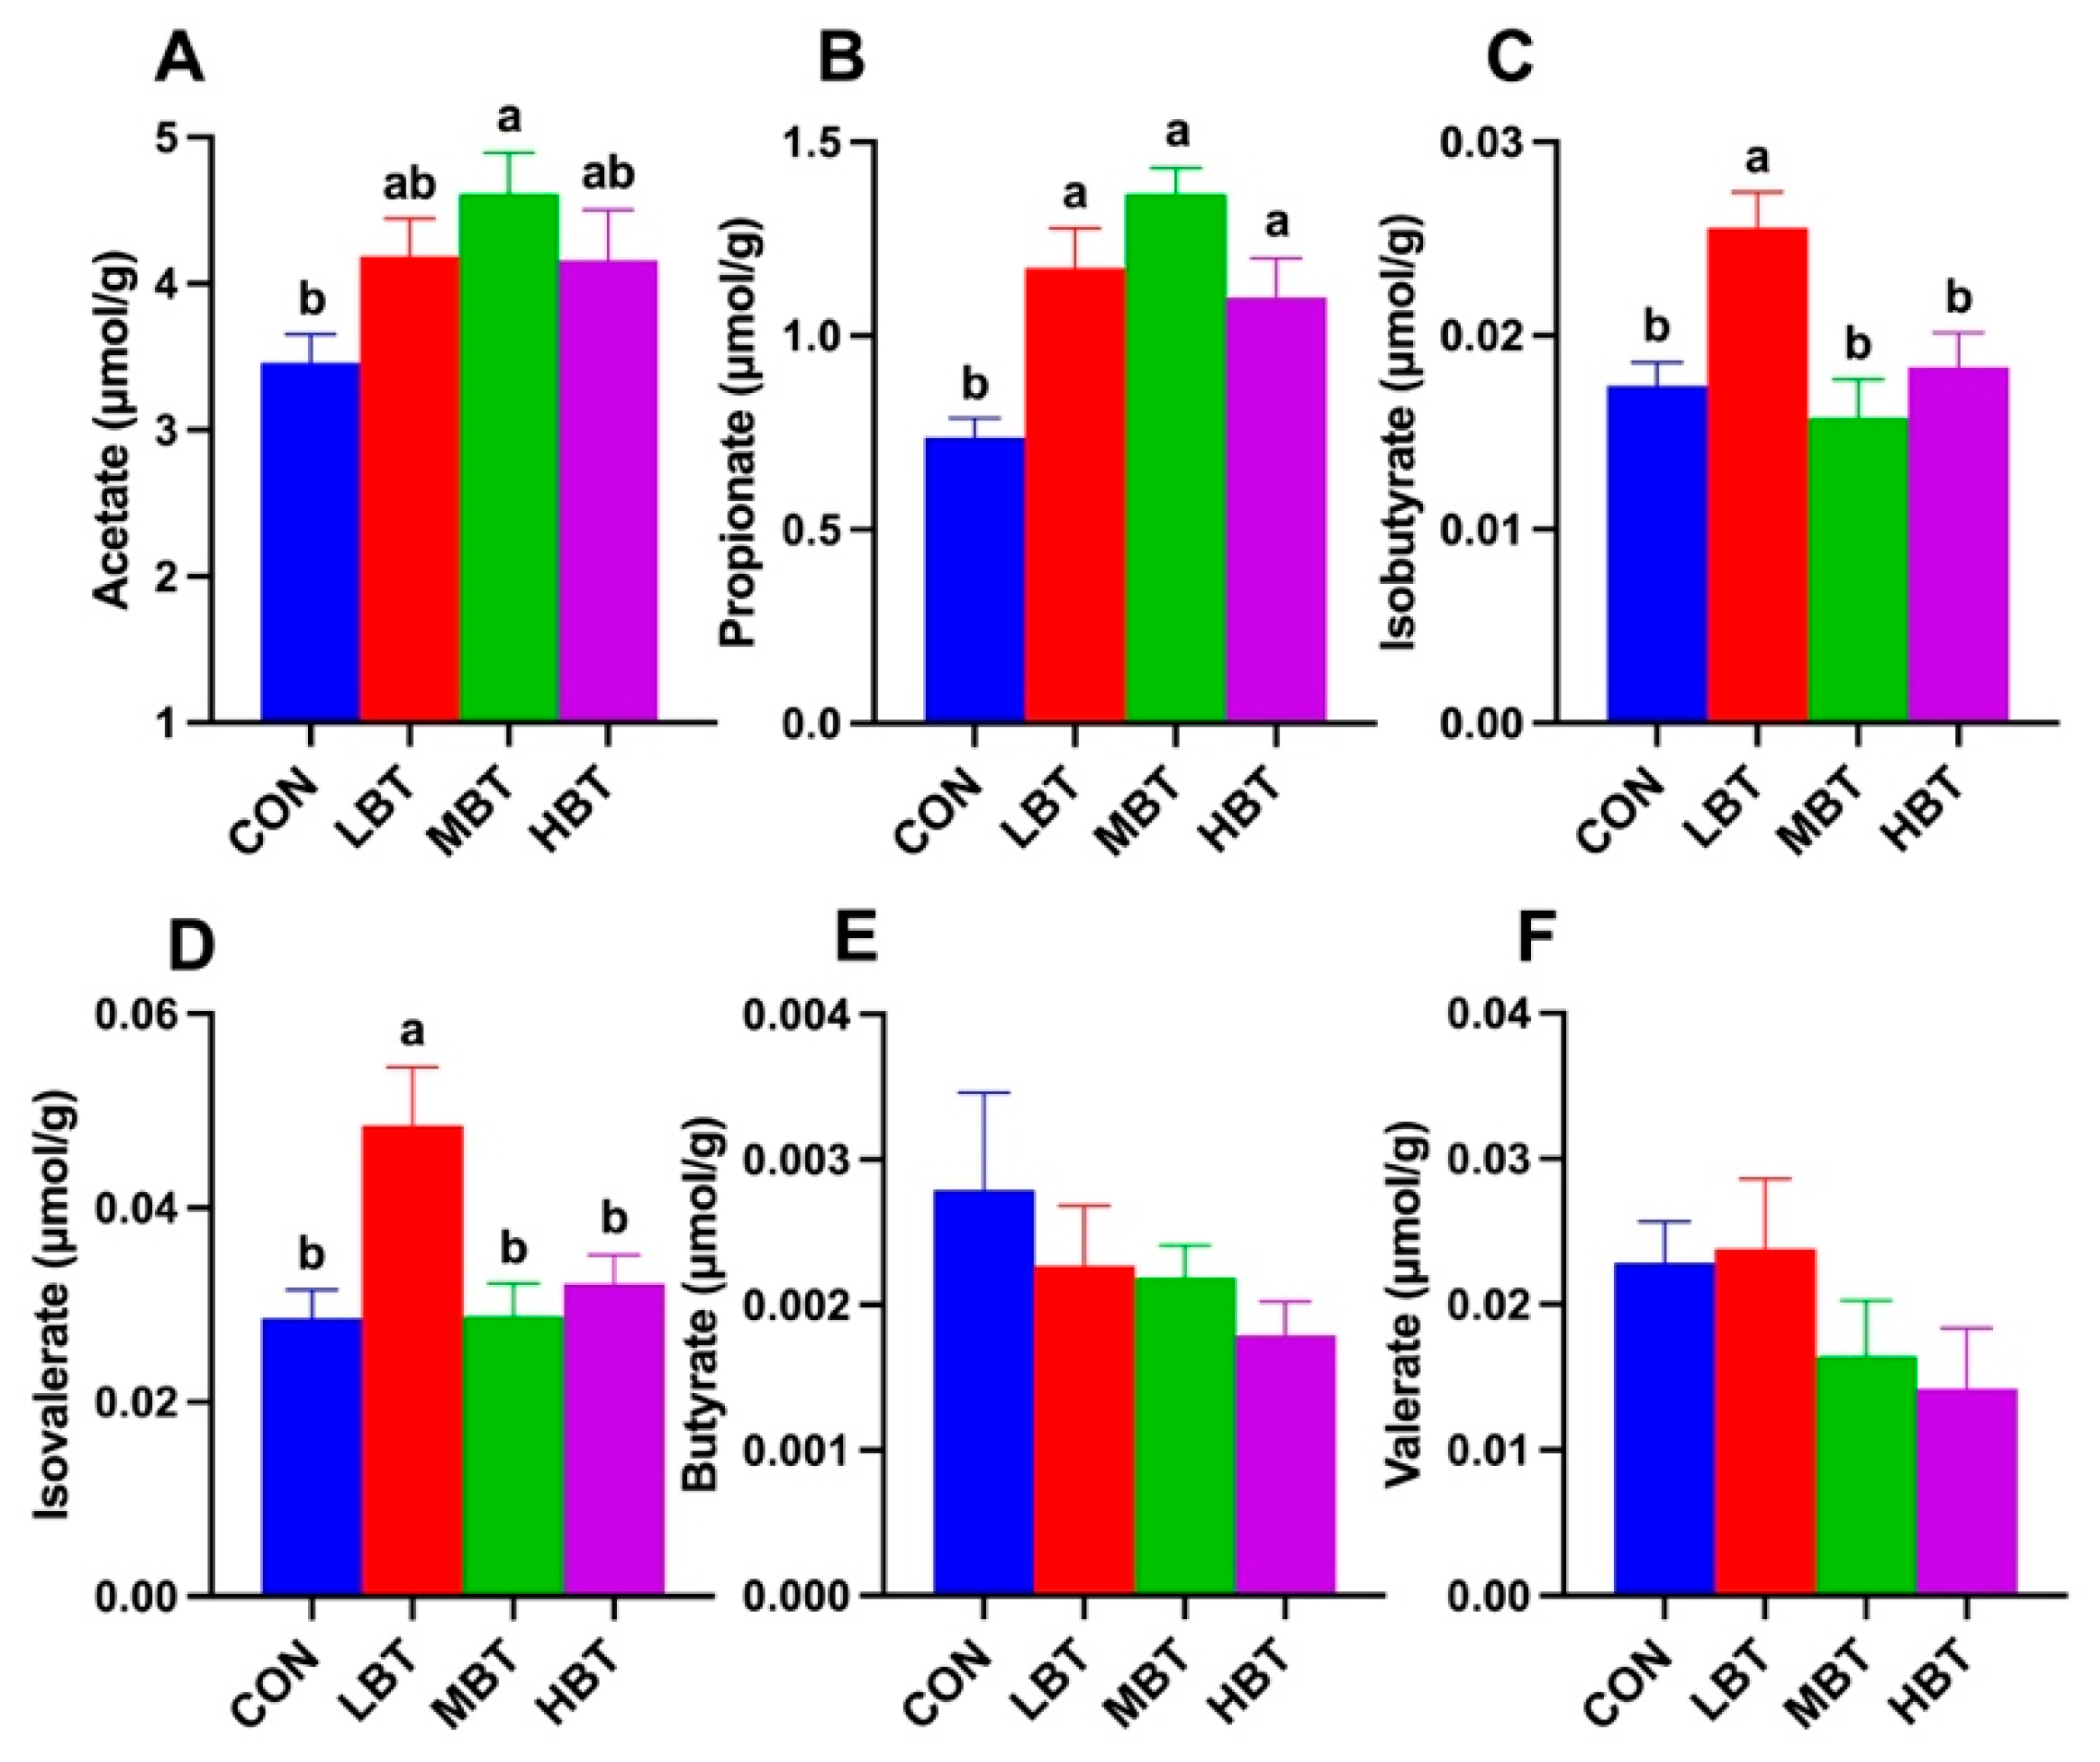
Figure 17.
Relative mRNA expression levels of GPR43 (A-B) and NLRP3 (C-D) in the colon and lung of Wistar rats (n = 10). CON: Control; LBT: Low-dose BT; MBT: Middle-dose BT; HBT: High-dose BT. Error bars indicate standard errors. There was a significant difference between groups marked with the different letter (P < 0.05).
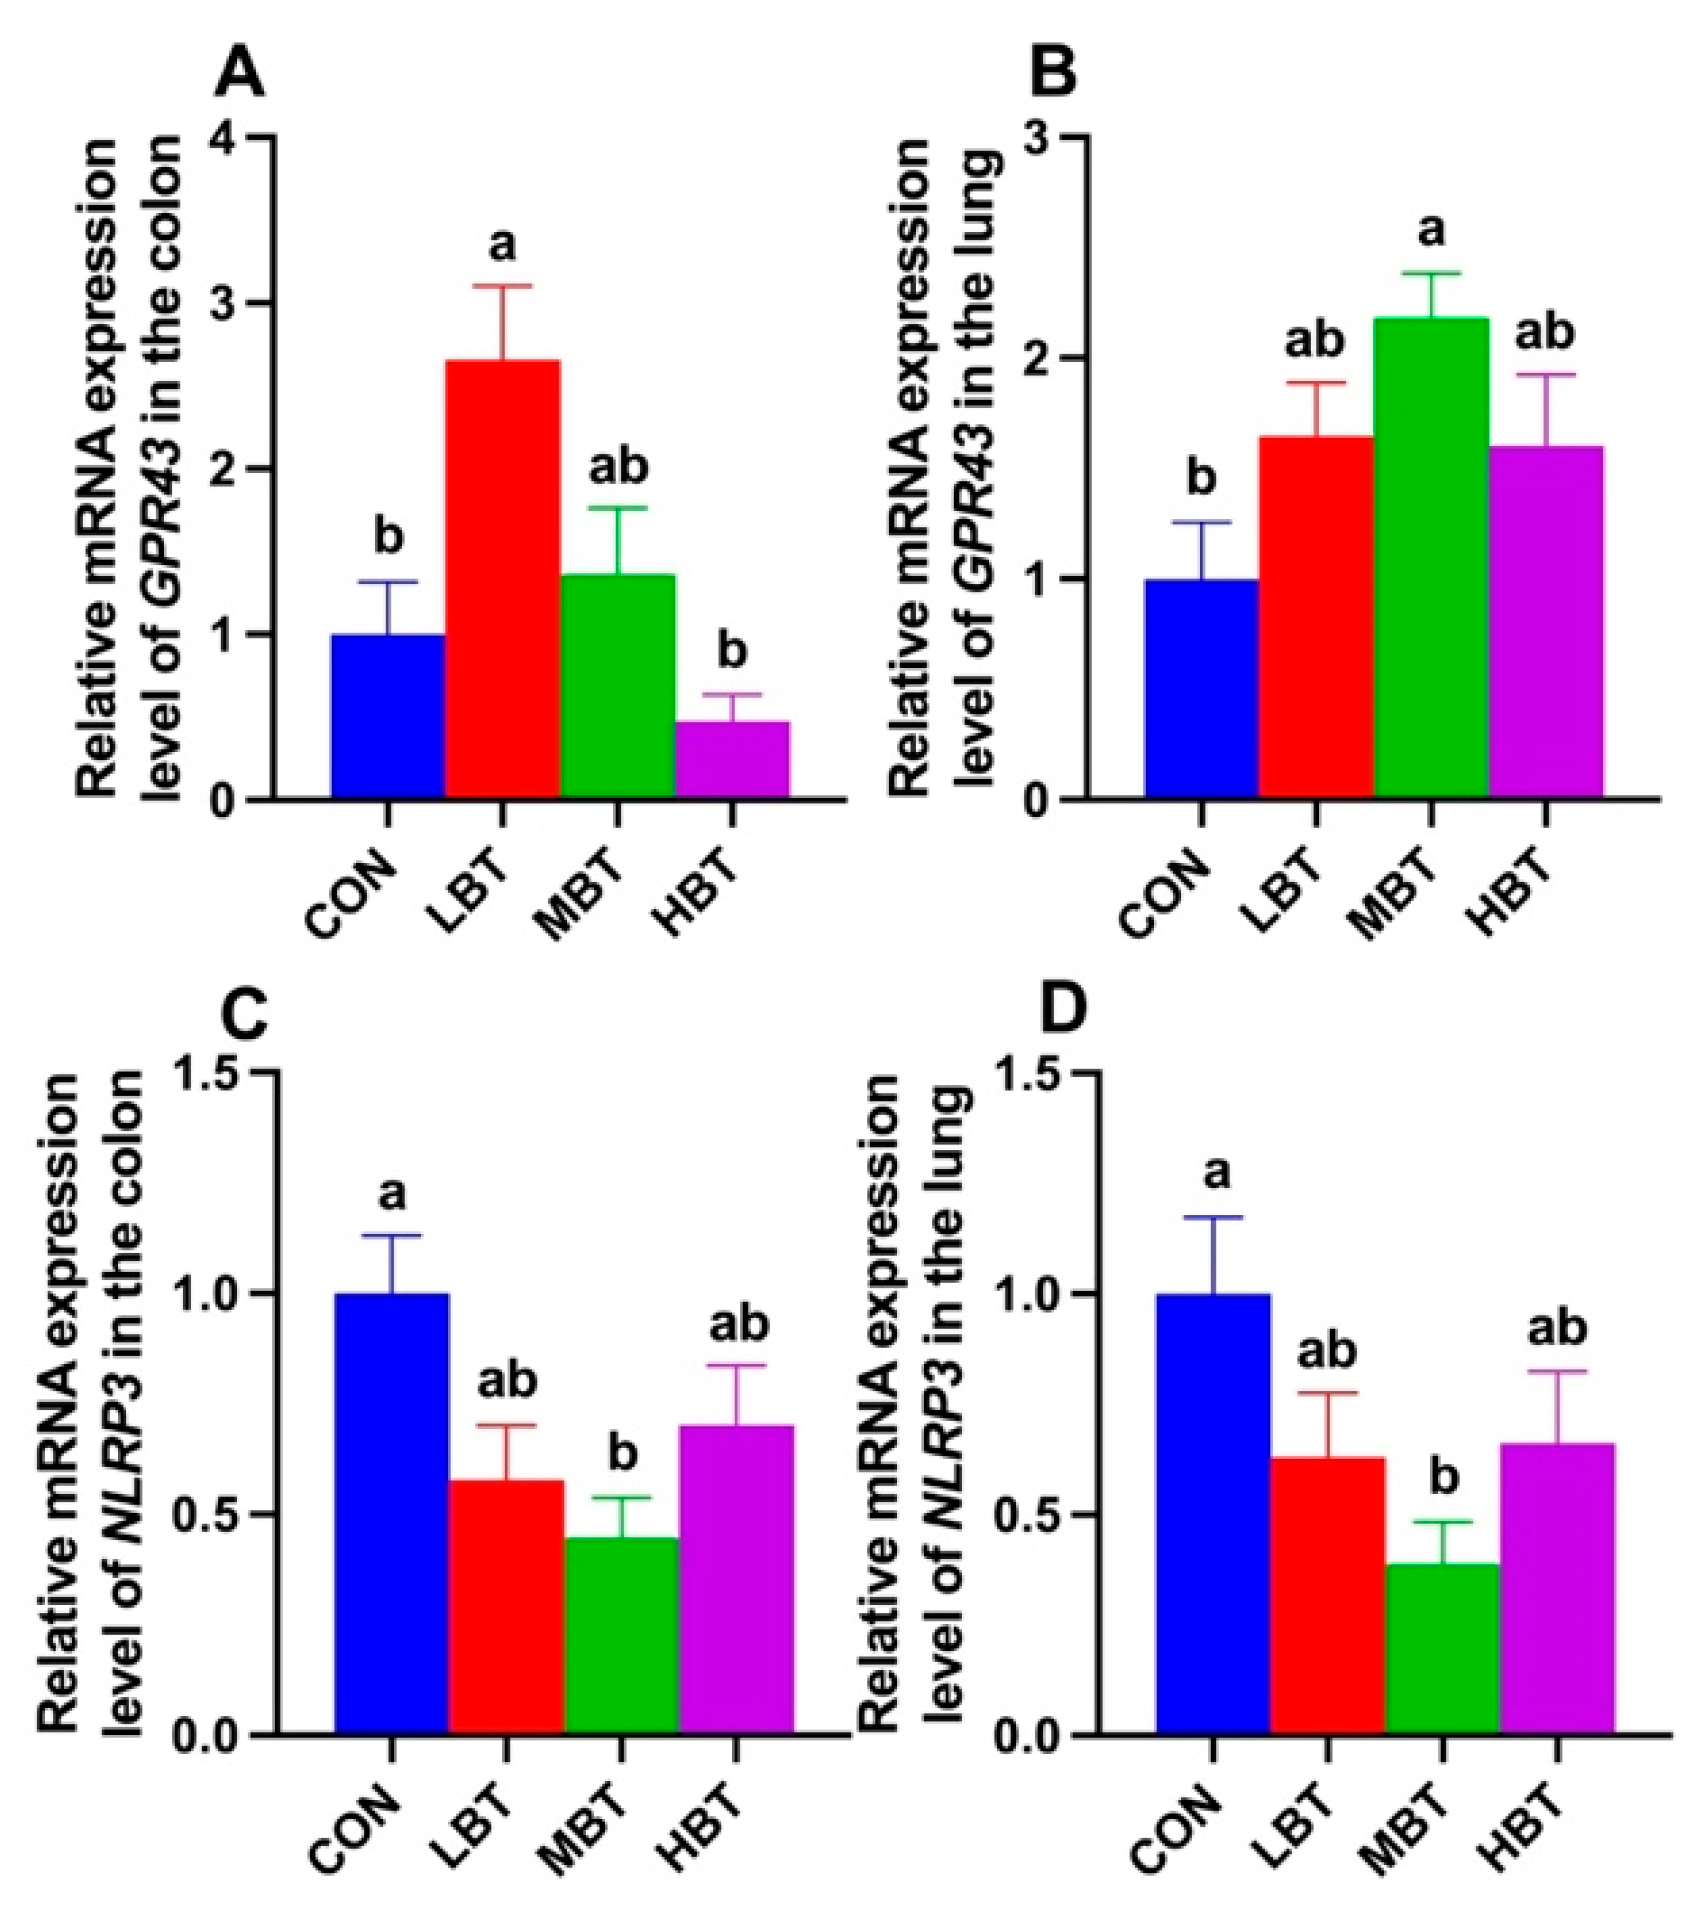
Figure 18.
Relative mRNA expression levels of ZO-1 (A-B) and Occludin (C-D) in the colon and lung of Wistar rats (n = 10). CON: Control; LBT: Low-dose BT; MBT: Middle-dose BT; HBT: High-dose BT. Error bars indicate standard errors. There was a significant difference between groups marked with the different letter (P < 0.05).
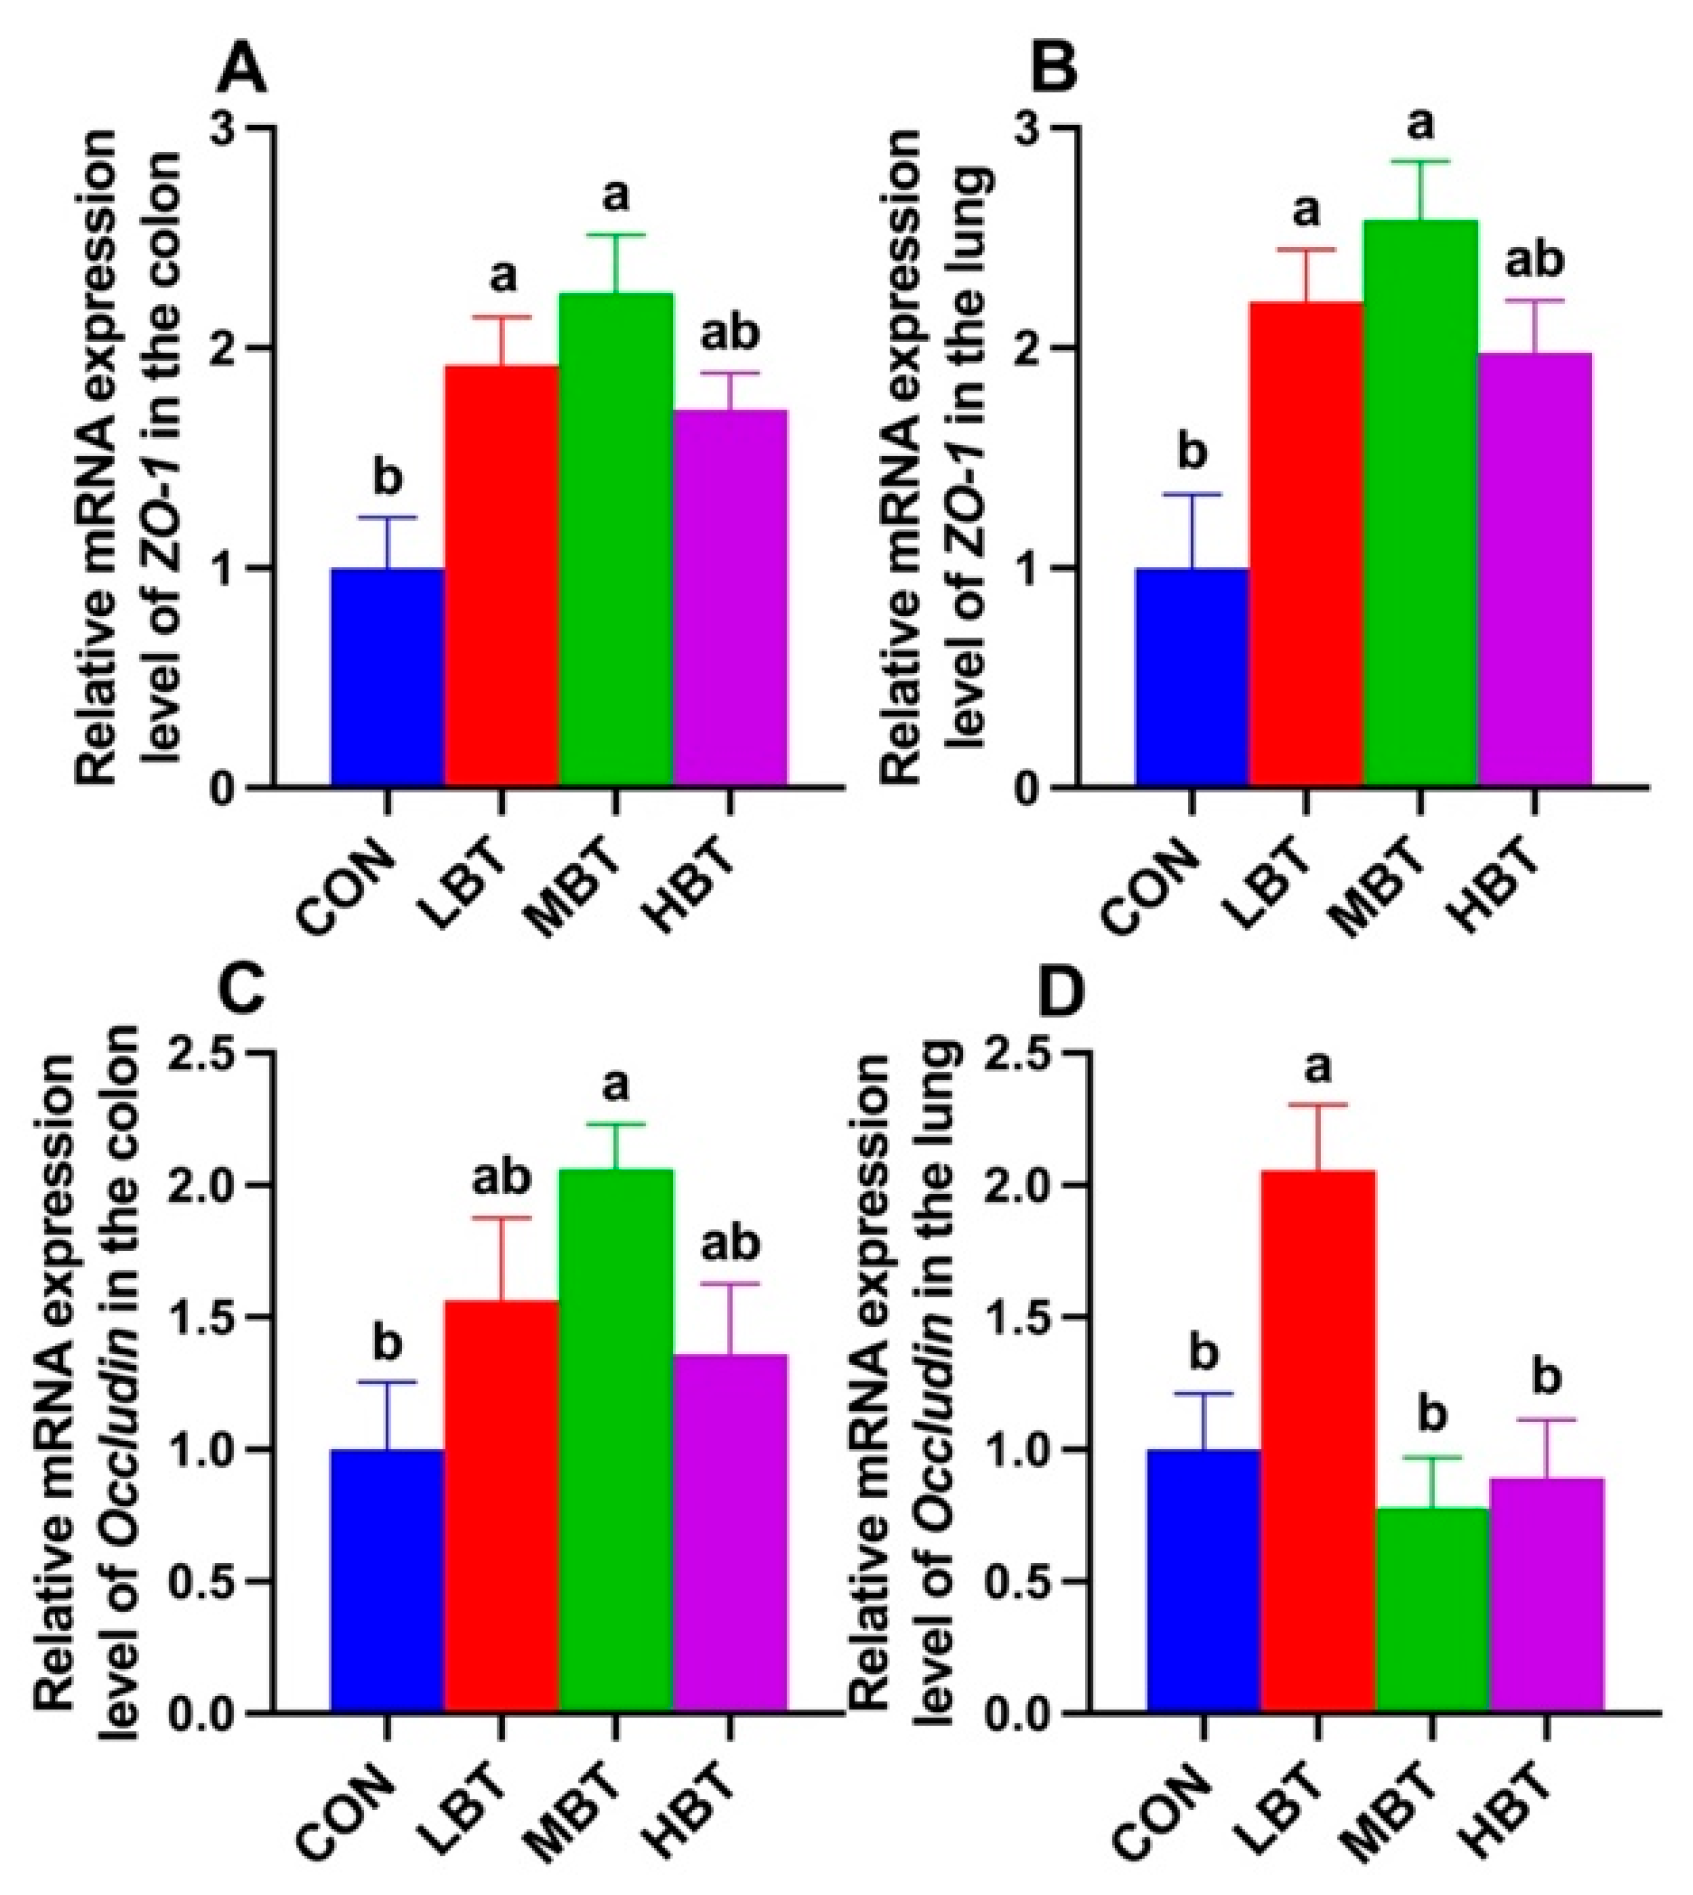
Figure 19.
Correlations between the cecal short-chain fatty acid (SCFA) content and antioxidant levels, expression of genes in SCFA receptor pathway, tight junction-associated genes expression, and inflammatory levels in Wistar rats (n = 10). * means P < 0.05, ** means P < 0.01, and *** means P < 0.001.
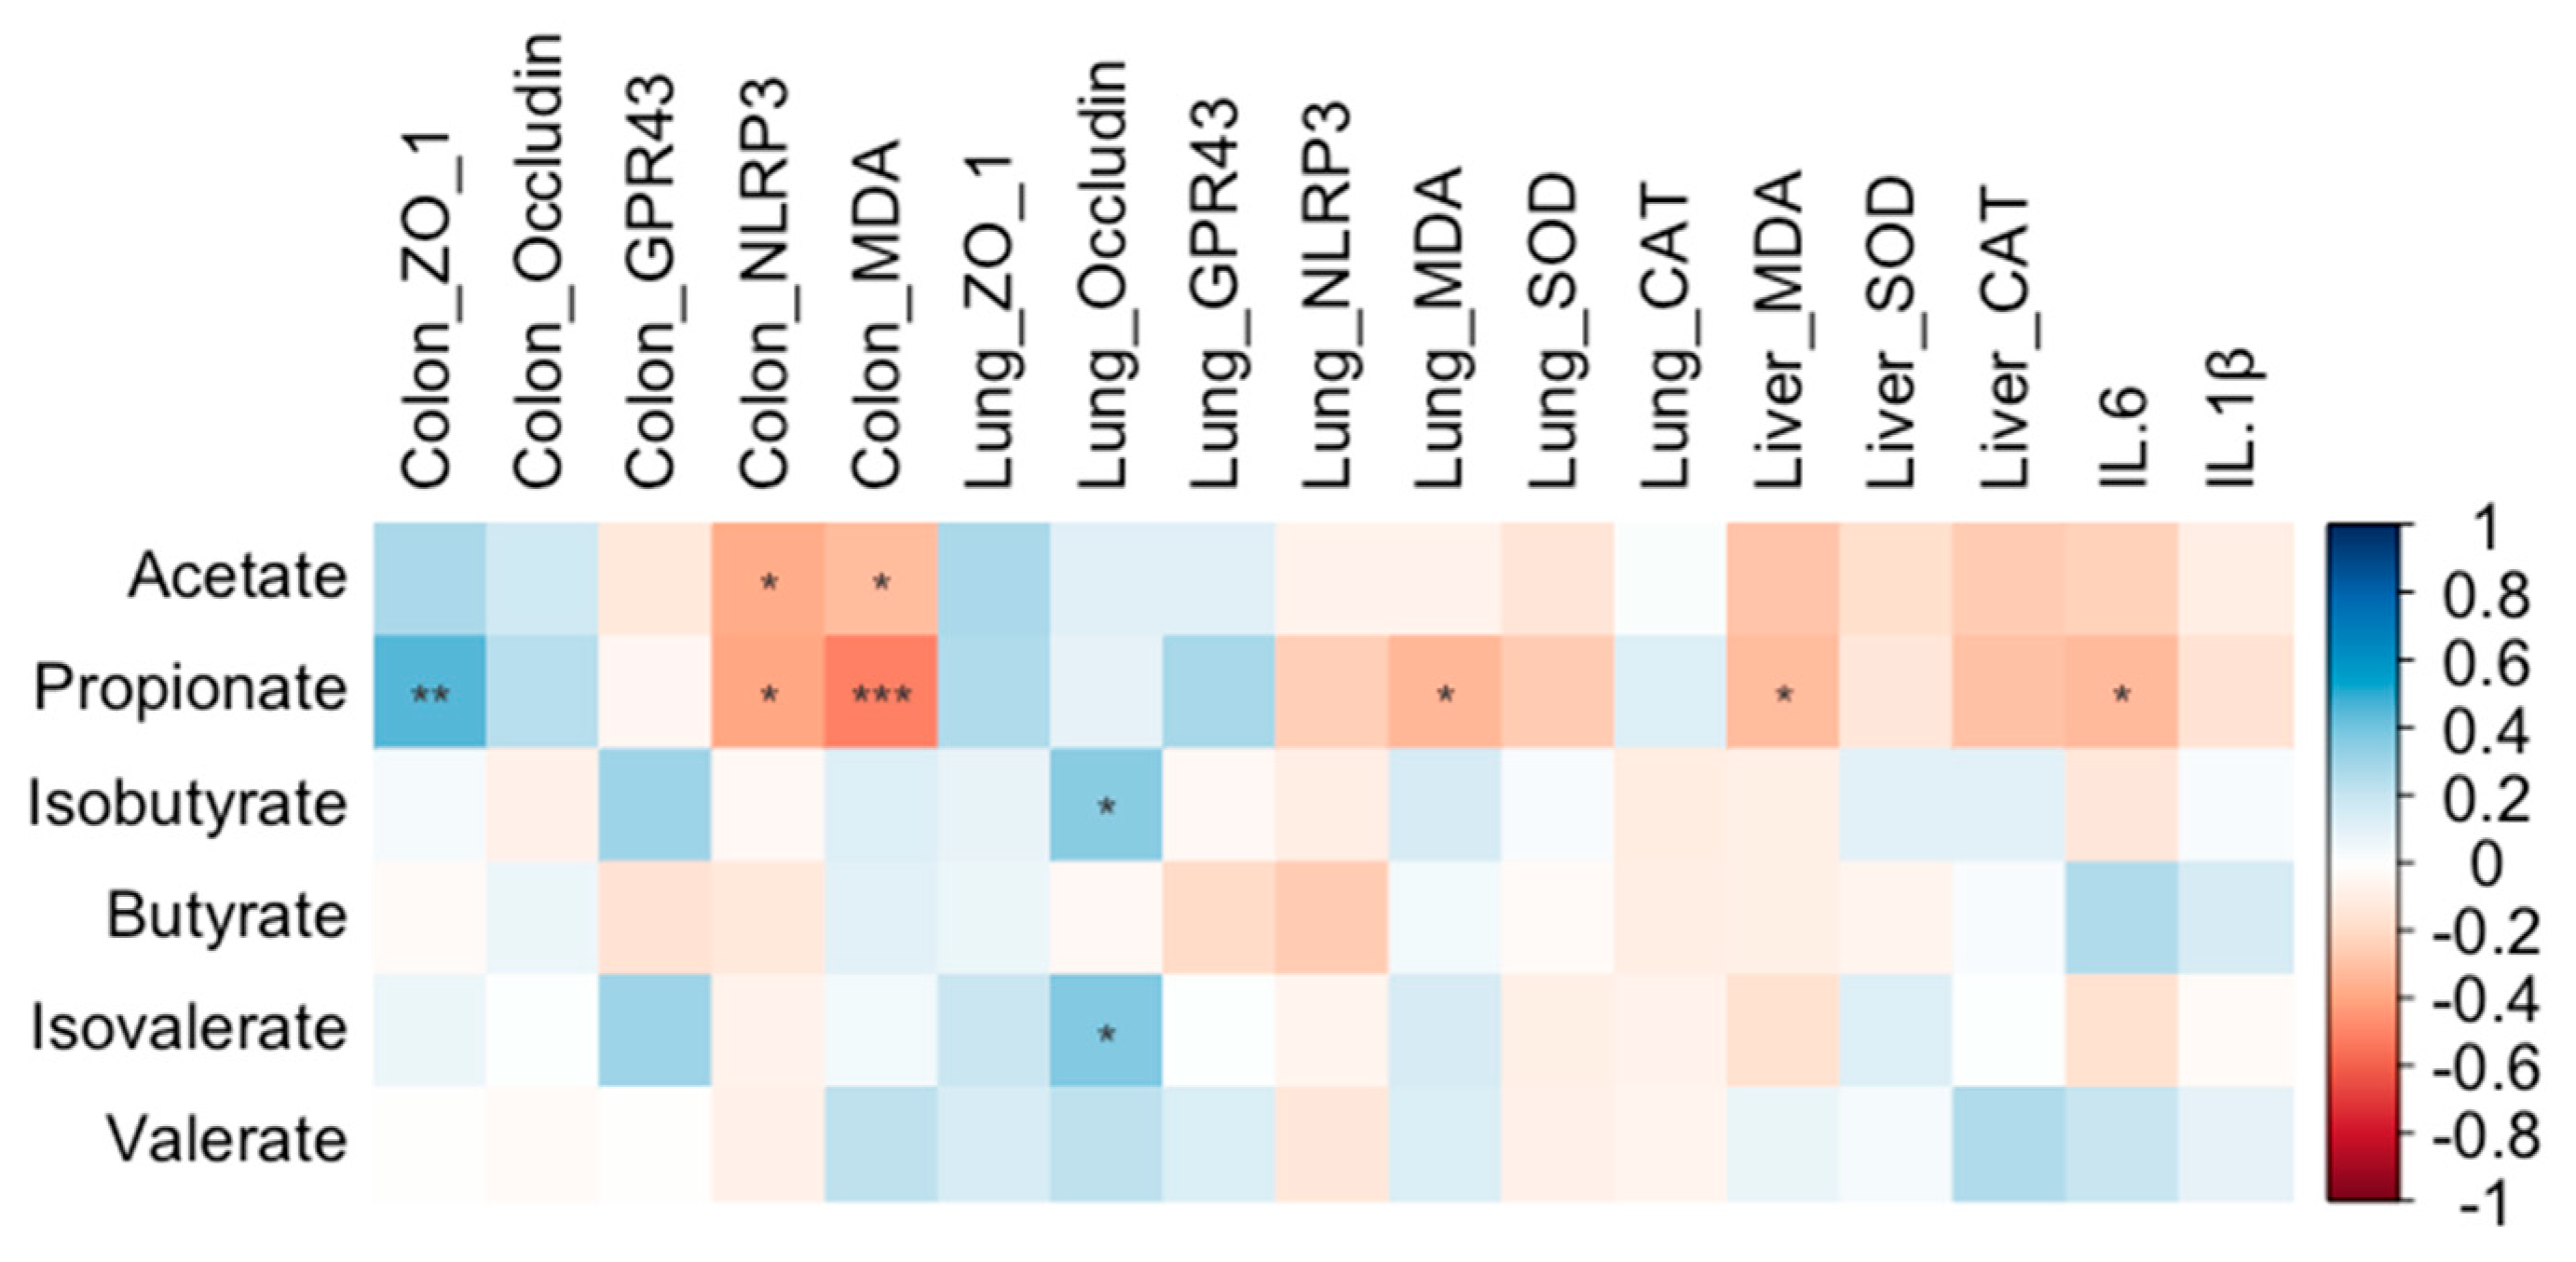

Table 1.
Effect of BT on alpha diversities of cecal microbial community in Wistar rats (Data are presented as the mean ± SEM; n = 6).
Table 1.
Effect of BT on alpha diversities of cecal microbial community in Wistar rats (Data are presented as the mean ± SEM; n = 6).
| Index of alpha diversity | Control | Low-dose BT | Middle-dose BT | High-dose BT |
|---|---|---|---|---|
| Observed features | 309 ± 31a | 390 ± 60a | 208 ± 11b | 281 ± 43ab |
| Chao1 | 309.83 ± 31.53a | 390.89 ± 59.48a | 209.54 ± 11.63b | 282.06 ± 43.11ab |
| Shannon | 5.53 ± 0.30a | 6.03 ± 0.36a | 4.53 ± 0.26b | 5.07 ± 0.36ab |
| Simpson | 0.94 ± 0.01 | 0.96 ± 0.01 | 0.90 ± 0.02 | 0.91 ± 0.02 |
| Pielou | 0.67 ± 0.03 | 0.70 ± 0.03 | 0.59 ± 0.03 | 0.63 ± 0.03 |
Disclaimer/Publisher’s Note: The statements, opinions and data contained in all publications are solely those of the individual author(s) and contributor(s) and not of MDPI and/or the editor(s). MDPI and/or the editor(s) disclaim responsibility for any injury to people or property resulting from any ideas, methods, instructions or products referred to in the content. |
© 2025 by the authors. Licensee MDPI, Basel, Switzerland. This article is an open access article distributed under the terms and conditions of the Creative Commons Attribution (CC BY) license (http://creativecommons.org/licenses/by/4.0/).
Copyright: This open access article is published under a Creative Commons CC BY 4.0 license, which permit the free download, distribution, and reuse, provided that the author and preprint are cited in any reuse.


