Preprint
Article

This version is not peer-reviewed.

The Hidden Mathematics to Treat Cancer

Submitted:

07 January 2025

Posted:

08 January 2025

You are already at the latest version

Abstract

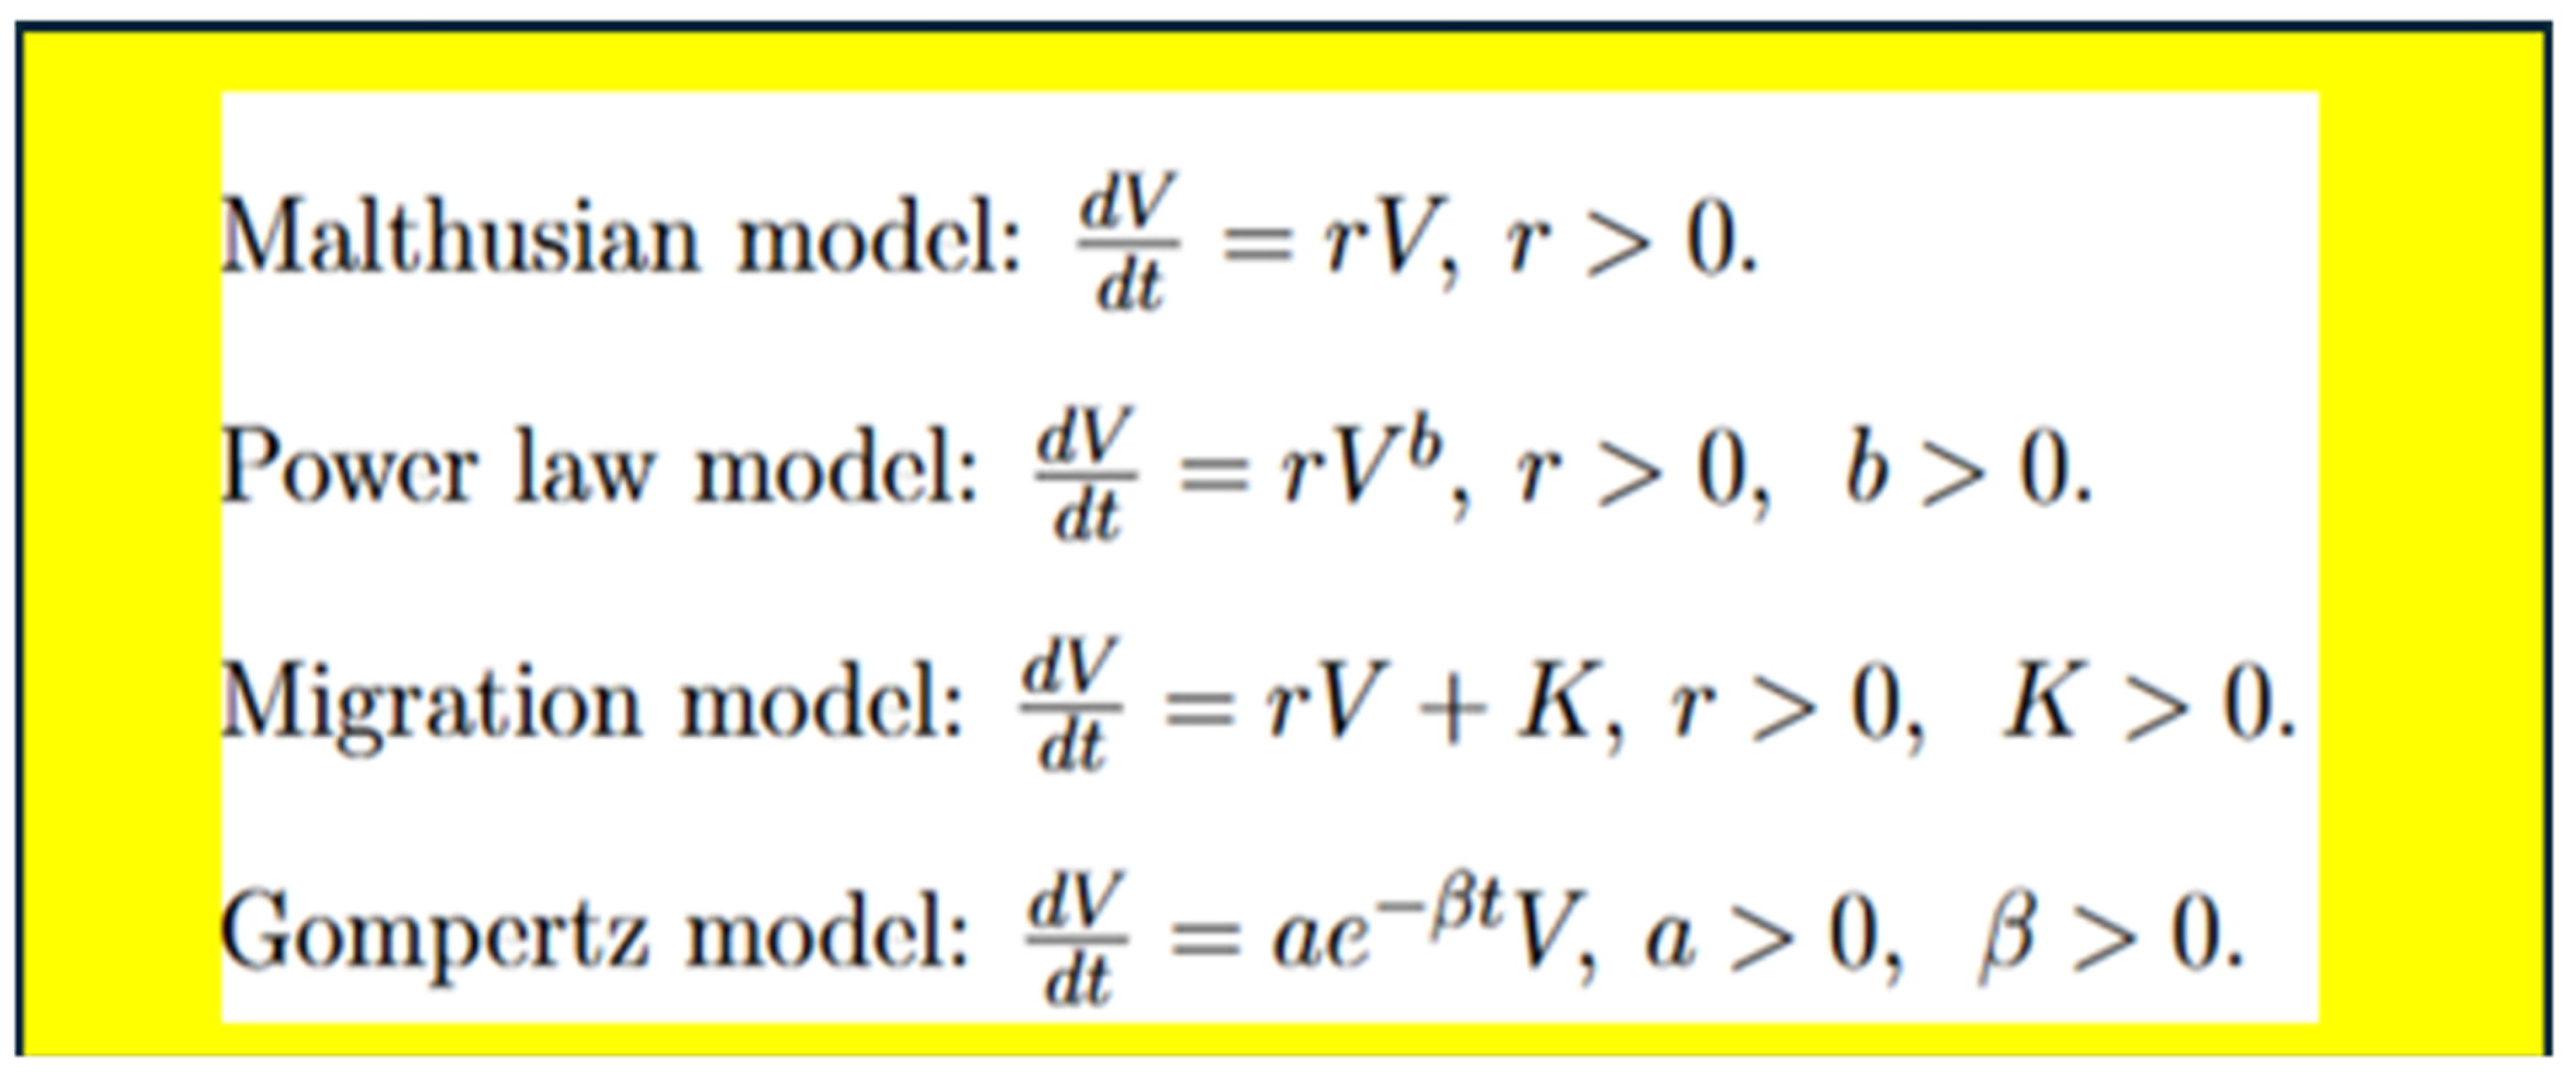
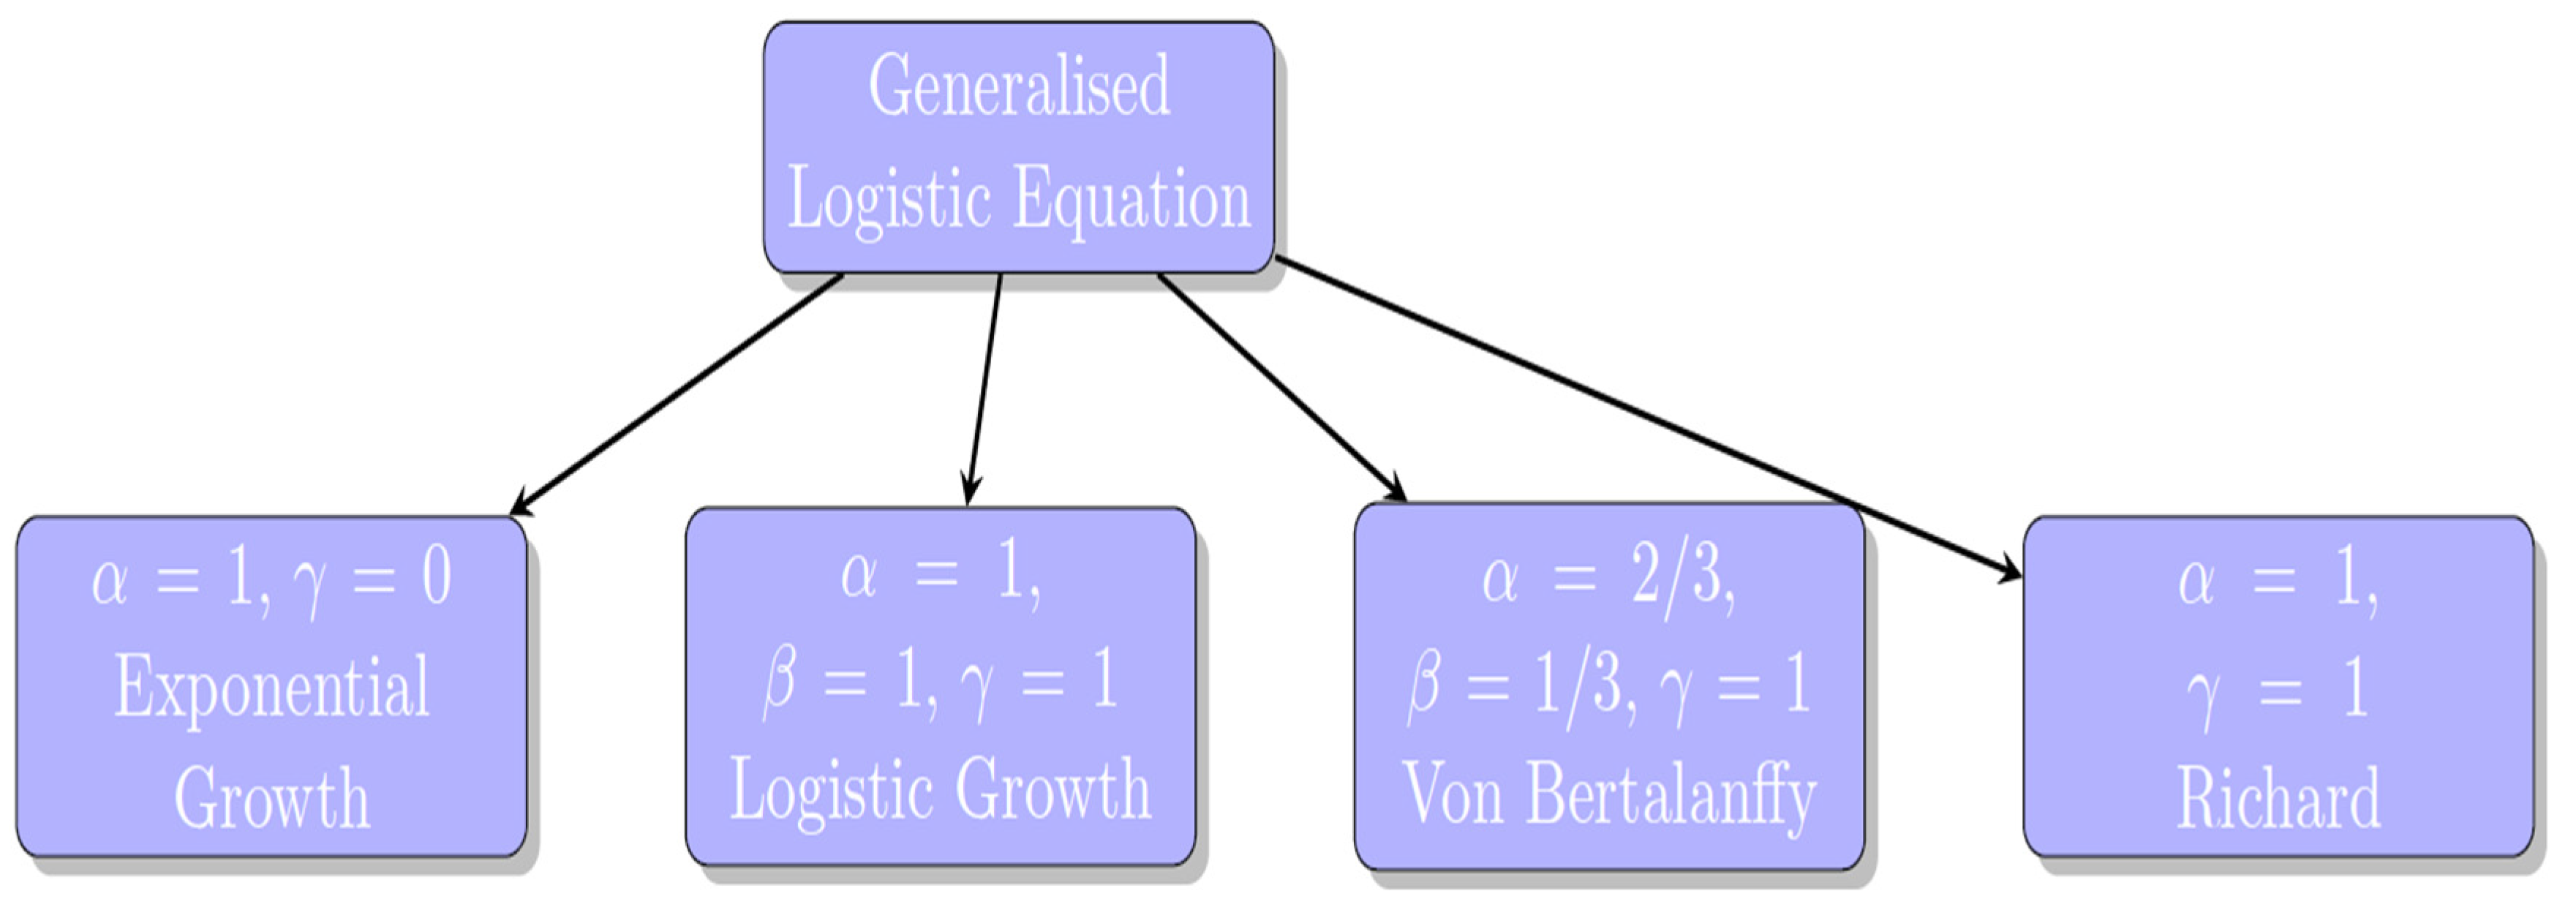
Mathematics is essential in cancer research and treatment because it helps scientists analyze complex data, such as genetic mutations in tumors, to understand cancer progression and estimate how long it has been developing. Mathematical models are used to improve treatment strategies, like determining the best combination of drugs to combat resistant cancer cells and optimizing immunotherapy approaches, such as CAR-T cell therapy. By applying these mathematical concepts, researchers can enhance the effectiveness of cancer treatments and tailor them to individual patients’ needs. Mathematical models, such as differential equations, are essential tools in cancer research for understanding and predicting how tumors grow over time. Models like the Gompertz and logistic growth models describe the dynamics of tumor growth, helping researchers simulate how cancer cells multiply, interact, and respond to various treatments. By using these models, scientists can gain insights into cancer progression and improve treatment strategies, ultimately enhancing patient outcomes. Dosimetry is a crucial aspect of radiation therapy that uses mathematical calculations to determine the right amount of radiation needed to effectively target tumors while protecting healthy tissues from damage. Advanced treatment planning software employs algorithms and simulations to figure out the best angles and intensities for delivering radiation, ensuring that the treatment is both effective and safe for the patient. This mathematical approach helps optimize cancer treatment by maximizing tumor destruction and minimizing side effects. Pharmacokinetics and pharmacodynamics are important concepts in understanding how drugs work in the body. Pharmacokinetics focuses on how a drug is absorbed, distributed, metabolized, and eliminated, which helps determine the best dosage and timing for chemotherapy. On the other hand, response models use statistical methods to predict how tumors will react to specific chemotherapy drugs, allowing doctors to create personalized treatment plans that are more effective for individual patients. Mathematics plays a crucial role in designing clinical trials for cancer treatments by helping researchers determine how many patients to include (sample size), how to randomly assign them to different treatment groups (randomization methods), and how to analyze the results statistically to see if the treatments are effective. Additionally, survival analysis techniques, like Kaplan-Meier estimation and Cox proportional hazards modeling, are used to study patient survival data, allowing researchers to identify which factors influence how long patients live after treatment. These mathematical tools are essential for ensuring that clinical trials are well-structured and that the findings are reliable. Bioinformatics is a field that uses mathematical and statistical techniques to analyze genomic data, which includes information about a person’s DNA. In cancer research, bioinformatics helps identify genetic mutations and biological pathways that contribute to the disease, allowing scientists to understand how cancer develops and progresses. This information is crucial for developing targeted therapies, which are treatments designed to specifically attack the mutations found in cancer cells, improving treatment effectiveness. The current exposition offers new insights into the cancer research community, as well as providing open problems which offer bridging the gaps to gain more knowledge about the influential role of mathematics to advance next generation cancer treatment.

Keywords: 
;  ;  ;  ;  ;  ;  

1. Introduction

Recent advancements [1] in technology have significantly improved our understanding of epitranscriptomics, which studies the chemical modifications of RNA, particularly messenger RNA (mRNA). Over the last ten years [1], researchers have focused on how these mRNA modifications, especially N6-methyladenosine (m6A), play important roles in cancer development by influencing key processes like tumor growth, invasion, and the tumor environment.
Schematic 1 (c.f., [1]) shows different modifications of messenger RNA (mRNA) and the proteins involved in these processes, which are important in cancer. The m6A modification, highlighted in red, has specific “writers” like METTL3, METTL14, and METTL16 that add this modification, “erasers” like FTO that remove it, and “readers” that interpret its effects. Other modifications, such as m1A and m5C, also have their own sets of writers, and the diagram indicates which types of cancer are associated with each modification.
Figure 2 (c.f., [1]) provides a visual summary of how different components related to m6A influence cancer growth, showing which are considered oncogenes (cancer-promoting) in red and tumor suppressors (cancer-fighting) in green, along with their specific cancer targets. This highlights the complexity of understanding how these modifications affect cancer development and treatment.
The “m6A epitranscriptome” [1] refers to a specific chemical modification of messenger RNA (mRNA) that plays a crucial role in regulating gene expression and has implications for cancer research. The timeline of major discoveries highlights how scientists have progressively understood this modification and its effects on cancer, as depicted in Figure 3 (c.f., [1]).
By 2010, obesity was projected to affect 150 million adults and 15 million children in Europe [2], leading to various health issues like diabetes, heart disease, and cancer. A study published in the New England Journal of Medicine compared the long-term survival of nearly 10,000 patients who underwent gastric bypass surgery to a similar number of severely obese individuals who did not have the surgery. The results [2]showed that the surgery significantly reduced overall mortality by 46%, especially for conditions like coronary artery disease and diabetes, although it also led to an increase in non-disease-related deaths, such as suicides and accidents.
Hereditary diffuse gastric cancer (HDGC) is a rare type of stomach cancer that is passed down through families due to mutations in the CDH1 gene [3], which is important for cell adhesion and tumor suppression. Because HDGC is often diagnosed at a late stage [3], it can lead to poor outcomes and is also linked to an increased risk of breast cancer. Guidelines recommend genetic testing for CDH1 mutations and may suggest preventive surgery [3], while ongoing research is exploring new treatment options, including immunotherapy and advanced endoscopic techniques.
Figure 4 (c.f., [3]) visualizes the treatments available for hereditary diffuse gastric cancer (HDGC), which are categorized into current and potential options. The current treatments [3], highlighted in blue, include established therapies that are already being used to manage HDGC, while the potential treatments, highlighted in yellow, represent newer or experimental therapies that may be developed in the future. Additionally [3], it mentions specific biological terms like microRNA (miRNA) and transforming growth factor-beta (TGF-β), which are important in understanding the cancer’s biology and treatment strategies.
In a visual nutshell, Figure 5 (c.f.,[4]) summarizes some potentail treatments, the gut microbiota, which consists of the various microorganisms living in our intestines, can influence the development of cancer through several mechanisms. These include causing inflammation [4], damaging DNA, and altering gene expression, which can lead to tumor growth. Additionally [4], certain bacteria can produce substances that promote cancer or change the environment in the gut to support tumor development, highlighting the complex relationship between our gut health and cancer risk.
Observing Figure 6 (c.f., [4]), the “gut-organ axis” refers to the complex interactions between the gut microbiota and various organs in the body, which can influence each other’s functions and overall health. Research suggests that disruptions in this axis may play a role in the development of certain diseases, including cancers and conditions related to radiation damage. Understanding these interrelationships can help scientists explore new ways to improve health and treat diseases by focusing on the gut microbiome’s impact on other organs.
The relationship between gut microbiota [4], cancer, and radiotherapy is complex and multifaceted. Gut microbiota, which are the beneficial bacteria in our intestines, can influence cancer development and treatment outcomes, including how effective radiotherapy is. While some studies [4] show that a healthy gut microbiota can improve the effectiveness of radiotherapy, as depicted in Figure 7(c.f., [4]).
Areca nut [5], the fruit of the Areca catechu palm, is commonly chewed by around 600 million people, especially in South Asia, as part of cultural traditions. However [5], it has been linked to serious health issues, including oral cancer, and is classified as a Group I carcinogen by the International Agency for Research on Cancer. While there are regulations for tobacco products in India [5], there are currently no similar laws for areca nut, despite its harmful effects on health, including potential oral diseases and other systemic issues.
The lack of awareness about the dangers of areca nut has led to its widespread consumption in India [5], where it is commonly served at social events and available in restaurants. To protect the health of the over 100 million users [5], there is a pressing need for strict regulations, including banning its sale and advertising, as well as implementing awareness programs to inform the public about its harmful effects. Policymakers [5] must recognize areca nut as a dangerous substance to help reduce its use and prevent related health issues.
Prostate cancer is the second most common cancer in men [6], and its risk increases with age, certain ethnic backgrounds, and family history. Early detection is important [6], but overtreatment is a concern, so active surveillance is recommended for patients with a longer life expectancy who have localized disease. Guidelines suggest various management strategies [6], including surgery and radiotherapy, while emphasizing the need for careful monitoring of prostate-specific antigen (PSA) levels after treatment to detect any potential recurrence.
The authors [7] investigated the protective effects of a methanol extract from Anacardium occidentale nut shells against skin damage caused by ultraviolet (UV) radiation. Chronic UV [7] exposure can lead to serious skin issues, including aging and cancer. The results showed that the extract helped prevent skin damage and promoted recovery in treated animals [7], suggesting it may have potential as a natural remedy for UV-induced skin problems.
A representative photomicrograph (X 100 magnifications) [7] refers to a detailed image taken under a microscope that shows the skin and liver tissues of the experimental animals in the study. Figure 8 (c.f., [7]) helps researchers visually compare the effects of different treatments on these tissues, allowing them to observe changes such as normal tissue structure or signs of damage, like severe wrinkling or congestion. The findings from these images contribute to understanding how the treatments impact the health of the skin and liver in the experimental groups.
Cashew nutshell liquid (CNSL) [8] is an inexpensive source of natural compounds called phenols, which have various uses, including in sunscreens. The study [8] looked at how different solvents affect the amount of these compounds extracted from CNSL, as well as their ability to protect against UV radiation (measured as sun protection factor, or SPF).
The results showed that solvents like acetone [8], chloroform, and methanol were the most effective for extracting CNSL with high levels of phenols and good SPF values, while hexane was the least effective.
In [9], the authors aimed to advance the field of “intellectology,” which studies different types of minds and their interactions. They used set theory to explore how minds can combine or interact, such as when two minds with different intelligence levels unite, and what that means for their overall intelligence. The paper [9] also discussed various concepts of grouped minds, like collective intelligence, and how these ideas can help us understand the potential for minds to work together or merge.
Minds [9] can be defined using four key parameters: a unique identifier, intelligence, age, and time of embodiment, which refers to when a mind is actively demonstrating intelligence. It discussed how combining minds could potentially create a new mind with higher intelligence [9], a concept known as emergentism, while also exploring the idea that a mind in a smaller subset could be more intelligent than a larger superset if it discovers better algorithms for processing information. This raises questions about the motivations for simulating minds, suggesting that a simulating mind might aim to enhance its own intelligence by creating and observing other minds.
This explains two types of complements in set theory [9]: absolute and relative. The absolute complement consists of all elements not in a given set, while the relative complement includes elements in one set that are not in another. In the context of intelligence [9], the discussion focuses on how the loss of a highly intelligent individual, like Einstein, affects the overall intelligence of a group, considering whether the group can absorb and retain that individual’s knowledge after their departure.
Mathematics employs a higher level of intellectualties to answer questions, as reasoned by [10]. NIOAs [11], or Nature-Inspired Optimization Algorithms, are techniques used to solve real-world problems effectively, and they have shown promising results. NIOAs [11] can be classified into different categories based on their inspirations, such as Evolutionary Algorithms (which mimic natural selection), Bio-inspired algorithms (based on biological processes), and others that draw from physics, chemistry, mathematics, and human behavior, as depicted in Figure 9 (c.f., [11]).
Figure 10.
Figure 10.
Preprints 145474 g010
The flowchart depicting the mechanism of AOA (Additive Operator Algorithm) visually represents the steps involved in the algorithm’s process, is portrayed by Figure 11 (c.f., [11]). It shows how the algorithm explores and exploits solutions to find the best outcome by using specific mathematical operations, like addition and subtraction, based on the defined rules. This helps users understand how the algorithm works and the sequence of actions taken during its execution.
Figure 12 (c.f., [11]) showcases the “utilization proportion of different strategies for the enhancement of the AOA” refers to how much each strategy is used to improve the AOA (which stands for a specific optimization algorithm). In the context provided [11], various strategies like hybridization, opposition-based learning, and chaotic random number methods are employed to make the AOA more effective [11], and the percentages indicate how frequently each strategy is applied in the optimization process. This helps researchers understand which methods are most beneficial for enhancing the algorithm’s performance.
Viral outbreaks like COVID-19 create an urgent need for evidence to guide quick responses [12], and mathematical models are crucial in predicting how the virus spreads and the effects of interventions. These models help policymakers make informed decisions and have become widely discussed in the media [12], leading to a greater public understanding of concepts like the basic reproduction number (R0) and the idea of “flattening the curve.” As a result [12], citizens are not just passive recipients of information; they actively engage with these models, contributing to a new form of citizen science that empowers them to understand and respond to the pandemic.
Collective behavior models [13] are used to study how individuals interact and change, which can explain various phenomena in nature and society, like chemical reactions, animal decision-making, and human social behavior. One important framework for these models is reaction kinetics [13], which provides a way to describe these interactions mathematically. While simpler models can give general insights, more complex models that account for real-world factors like population size and spatial effects are necessary for a deeper understanding of these systems.
Interactive manipulation of a model view via a controller allows users to engage with a graphical representation of their model analysis. When users change certain parameters [13], they can see how these changes affect the model in real-time, making it easier to understand complex concepts. This hands-on approach helps researchers and educators visualize the impact of different variables and enhances the exploration of the model’s behavior, as depicted in Figure 13 (c.f., [13]).
Phase portraits are graphical representations that show how a system behaves over time, particularly in terms of its fixed points, as illustrated by Figure 14 (c.f.,[13]), which are specific states where the system remains unchanged. In the context provided, the upper-left shows oscillations in predator-prey dynamics (Lotka-Volterra equations), while the upper-right illustrates a repeating cycle in a model called the Brusellator. The lower sections depict different behaviors [13], such as stable states and noise effects, with various parameters affecting how the system evolves, indicated by the shading that represents the speed of flow and the stability of the fixed points.
Bifurcation analysis is a mathematical method used to study how small changes in a system’s parameters can lead to significant changes in its behavior [13]. In the context of the honeybee swarming model, this analysis shows how the decision-making of bees can shift from one stable state to another [13], such as when they choose a new location to swarm. The different types of bifurcations, like pitchfork and saddle-node bifurcations [13], illustrate how these decision-making processes can become unstable or change dramatically based on factors like signaling strength and option quality differences(See Figure 15 (c.f., [13])).
Figure 16 (c.f., [13]) visualizes numerical simulations of a honeybee swarming model, which is a type of nonlinear decision-making model that examines how honeybees make collective decisions. It highlights how different types of noise, such as finite-population noise and spatial noise, affect the behavior of the model. The simulations show how these noise factors influence the swarming dynamics, with visual representations indicating the paths of individual bees and their interactions within the group.
The educational revolution is creating significant challenges for schools [14], requiring them to prepare students to adapt to rapid changes in society. This means that education must focus on improving both hard skills [14], like mathematical knowledge, and soft skills, such as critical thinking and problem-solving. The research [14] aimed to develop a new teaching framework called the humanist ethno-metaphorical mathematics learning model, which combines cultural perspectives and metaphorical thinking to enhance students’ mathematical abilities and better equip them for future challenges.
The relationship between teacher and student competence is crucial for effective learning in the classroom, is illustrated by Figure 17 (c.f., [14]). Teachers need to facilitate a student-centered environment where they encourage students to express their ideas, ask questions [14], and develop skills like critical thinking and self-confidence. This interaction helps build both the hard skills (like mathematical knowledge) and soft skills (like resilience and creativity) that students need to succeed in a rapidly changing world.
Ethnomathematics is the study of how different cultural groups develop and use mathematical ideas, techniques [14], and practices in their daily lives. It recognizes that there are various ways to understand and do mathematics based on cultural backgrounds [14], making it more relatable and accessible, especially for indigenous populations. By integrating cultural perspectives into mathematics [14], ethnomathematics aims to create a more inclusive and ethical approach to mathematical knowledge that respects diverse traditions and values.
The Humanist ethno-metaphorical mathematics learning model, as in Figure 18 (c.f., [14]), combines cultural understanding and metaphorical thinking to enhance how students learn mathematics. This approach [14] recognizes that traditional mathematical teaching can feel rigid and disconnected from real-life experiences, especially for indigenous populations. By using metaphors that relate to students’ cultural backgrounds and everyday lives, this model aims to make abstract mathematical concepts more relatable and easier to understand, ultimately improving both their mathematical skills and self-confidence.
The metaphorical thinking concept refers to the ability to understand and express ideas by using metaphors(See Figure 19 (c.f., [14])), which are comparisons that help explain complex concepts in simpler terms. In the context of innovative mathematics learning, this type of thinking allows students to connect mathematical ideas to their everyday experiences, making learning more relatable and meaningful. By using metaphorical thinking, teachers can design activities that engage students and encourage them to explore mathematical concepts creatively.
Microbial model systems are widely used in research areas like evolution and ecology because they help scientists study how different species interact [15], particularly in terms of competition and coexistence. The authors [15] explored how these microbial models relate to mathematical models, examining how they can sometimes produce different results when studying the same phenomena. They [15] suggested that using these models together can provide valuable insights and improve our understanding of complex biological systems.
Figure 20 (c.f., [15]) shows how different models interact with each other in scientific research, particularly in the context of studying ecological and evolutionary dynamics. It emphasizes “comparative modeling,” where one model is used to evaluate and improve another, rather than just focusing on how models represent real-world systems. This approach helps researchers understand complex biological interactions, such as competition and coexistence among species, by comparing mathematical models with experimental data from simpler systems, like microorganisms.
The current exposition contributs to:
  • Offering a plethora of mathathematical applications to advance cancer treatment.
  • The provision of several emerging open problem to enrich the existing knowledge within the research community to a next generation cancer treatment.
The path map for this study isPreprints 145474 i001

2. The Influential Mathematics to Revolutionize Oncology

The current section is delving into a panoramic view of the impactful mathematical role to advance oncology.

2.1. Modeling Tumor Growth

A key feature of cancer is the uncontrolled growth of cells [16,17,18,19,20,21,22,23,24,25,26,27,28], known as aberrant cell proliferation. Researchers study various factors that contribute to this growth, including genetic changes, metabolic alterations, and the impact of treatments and the immune system. Recently [16,17,18,19,20,21,22,23,24,25,26,27,28], mathematical and computational models have been used to simulate and predict how tumors grow over time and space, which helps in understanding their development and response to treatments by using real biological data for validation.
Most importantly [16], various mathematical modeling strategies used to understand and predict how tumors respond to treatments like chemotherapy and radiation therapy. These models consider factors such as the mechanical properties of tissues [16], nutrient availability, and the tumor’s microenvironment, which can all affect tumor growth and treatment effectiveness. By integrating patient-specific data [16], these models aim to improve personalized treatment plans for cancer patients.
Mathematical modeling [17] is an important tool used in both physical sciences and life sciences, including cancer research. Researchers, like Misra and his team, have developed various mathematical models to study different aspects of biology, such as how tumors grow and respond to treatments. These models help health care professionals as well as researchers understand tumor dynamics and optimize cancer therapies, ultimately improving treatment outcomes for patients.
In scientific research [17], different mathematical functions are created to understand how things grow, which is important in fields like ecology and epidemiology. When studying tumor growth [17], researchers use first-order ordinary differential equations to model how the volume of a tumor changes over time, starting from an initial size. The growth of tumors is typically described using either exponential growth models [17], which assume unlimited growth, or logistic growth models, which account for limitations in resources that eventually stabilize the tumor size.
The commonly used exponential growth differential equations are mathematical models that describe how a tumor’s volume changes over time. These equations(See Figure 21), such as the Malthusian model and the Gompertz model, help researchers understand tumor growth patterns by relating the rate of change of tumor volume (dV/dt) to factors like the current volume (V) and growth parameters (r, a, b). While these models can accurately describe growth for a period, they eventually become unrealistic because they suggest that tumor volume can increase indefinitely, which is not possible due to limited resources.
Exponential models can effectively describe tumor growth for a limited period, but they have a flaw: if the growth rate remains positive, the tumor volume would theoretically keep increasing without limit, which isn’t realistic. Tumors can only grow to a certain size because they depend on limited resources for cell growth. Once these resources are exhausted, the tumor volume stabilizes, a situation better represented by logistic models that account for these constraints.
The Von Bertalanffy model describes tumor growth by assuming that the growth rate is related to the surface area of the tumor, which is where nutrients enter, while the death rate is related to the tumor’s overall size. The associated first order differential equation
d V d t = a V 2 3 b V
In the context of the Von Bertalanffy model for tumor growth, the parameter “a” represents the growth rate of the tumor, indicating how quickly the tumor can grow when resources are available. The parameter “b” signifies the growth deceleration rate, which accounts for factors that slow down the tumor’s growth as it increases in size, such as limited nutrients or space. Together, these parameters help describe how a tumor’s volume changes over time, balancing growth and limitations. The model predicts that the tumor volume will stabilize at a certain level, V = ( a b ) 2 3 , depending on the initial volume; if the initial volume is too high, it will decrease over time until it reaches this stable point.
The graph of the Von Bertalanffy model, as depicted in Figure 22(c.f., [17]) illustrates how a population or volume (V) changes over time (t), starting from zero days. In this model, the parameters a and b represent specific growth rates, with a set at 1.6 × 10⁻⁷ m3/day and b at 0.2×10⁻⁷ m³/day. The constant K, calculated as a b , indicates the carrying capacity or maximum volume that the population can reach, showing how the growth stabilizes over time.
The generalized form of the logistic equation describes how a population or quantity (V) changes over time (t) based on its growth rate (a) and certain parameters (α, β, γ) that influence the growth behavior. By adjusting the values of these parameters, we can derive different models, including exponential growth and the standard logistic model. This flexibility allows researchers to represent various growth patterns in real-world scenarios, such as population dynamics or resource consumption, as characterized by the differential equation:
d V d t = a V α 1 V K β γ
The generalized logistic model is depicted in Figure 23 (c.f., [17]), as a mathematical framework used to study the growth of a quantity, such as tumor volume, over time. In Figure 23 (c.f., [17]), with a = 3 cm3 day−1, K = 100, V = 50 cm3, for the analysis over a period of 10 days. By adjusting these parameters, the model can show different growth behaviors, helping researchers understand how changes in growth factors affect the volume over time.
Schematic 24 (c.f., [17]) of the generalized logistic model visually represents how different parameters (α, β, γ) affect the growth of a population or tumor over time. It shows various growth patterns, such as logistic growth, exponential growth, and other models like Von Bertalanffy and Richard, depending on the values of these parameters. By analyzing this diagram, one can understand how changes in parameters influence the behavior of the model and the volume of the population or tumor as it approaches its carrying capacity (K).
On another different note, [17] focused on controlling tumor growth by modeling the interactions between different types of immune cells (like natural killer cells and CD8+ T cells) and tumor cells, using mathematical equations. These equations describe how tumor cells grow and how they are affected by treatments like chemotherapy and immunotherapy. By analyzing these models, researchers can explore different treatment strategies to effectively reduce tumor volume while minimizing side effects.
In a nutshell, the designed mathematical model to optimize chemotherapy treatment for cancer by reducing tumor volume while minimizing side effects, is based on the log-kill hypothesis, which suggests that the effectiveness of chemotherapy is proportional to the tumor size at a given time. The model uses differential equations to describe how the tumor volume changes over time, factoring in the growth rate of the tumor and the effects of the drug, allowing researchers to analyze different treatment strategies and their outcomes.
Cancer is a major health issue [18], but we still don’t fully understand how it grows and spreads. To help predict how cancer cells behave, researchers use mathematical models that can simulate cancer growth, which can be based on fixed rules (deterministic models) or random factors (stochastic models). These different types of models were reviewed [18], focusing on how they explain the initiation and growth of tumors, and summarizes key findings and ongoing research challenges in this area.
A mathematical model that analyzes how tumors grow when treated with both chemotherapy and immunotherapy, was introduced [19]. This particular model introduced the concept of a “threshold” for tumor cell populations: if a tumor starts with fewer cells than this threshold, the immune system can keep it small and asymptomatic, referred to as “cancer without disease.” The analysis [19] revealed that chemotherapy can sometimes cause small tumors to grow larger, that high doses are needed for chemotherapy to work effectively, and that combining chemotherapy with immunotherapy can enhance treatment outcomes.

2.2. Radiation Therapy Planning

Radiation therapy planning [29,30,31,32,33,34,35,36,37,38,39] is a crucial process in cancer treatment that ensures radiation is delivered effectively while protecting healthy tissues. It involves several steps [29,30,31,32,33,34,35,36,37,38,39], including simulating the patient’s position using imaging techniques, outlining the tumor and surrounding organs, calculating the appropriate radiation dose [29,30,31,32,33,34,35,36,37,38,39], and optimizing the treatment plan. Quality assurance measures are taken to verify the accuracy of the plans and equipment before treatment begins [29,30,31,32,33,34,35,36,37,38,39], and regular follow-ups are conducted to monitor the patient’s response and manage any side effects.
Contouring target volumes [29] and surrounding organs-at-risk (OARs) is an essential part of planning radiation treatment for cancer patients. This process [29], often done manually by trained professionals, can be time-consuming and varies between providers, which can affect the quality of treatment and patient outcomes. Auto-segmentation [29], where computer algorithms automatically create these contours, has the potential to improve consistency and effectiveness in treatment planning, especially with the recent advancements in artificial intelligence.
Figure 25 (c.f., [29]) visualizes the “Overview of metrics used for contour evaluation”, referring to different methods used to assess the quality of outlines (or contours) created in medical imaging, particularly for treatments like radiotherapy. These metrics [29] help determine how well automated systems can replicate the contours that doctors would manually create, which is important for ensuring effective treatment. Common metrics include the Dice Similarity Coefficient and Jaccard Similarity Coefficient, which measure how much two sets of contours overlap, but they may not fully reflect how clinically acceptable those contours are.
Geometric-dosimetric discordance [29] refers to situations where the shapes of two medical contours (like those of organs) do not match, but they still receive similar radiation doses, as in Figure 26 (c.f., [29]). For example, in the left image, the contours of the left anterior descending artery overlap very little, yet both receive almost the same amount of radiation. In contrast, the right image shows two small bowel contours that look similar in shape, but one contour is in a region where the radiation dose changes quickly, leading to a higher maximum dose for that contour.
The undertaken exposition of [30] summarized research on stereotactic body radiation therapy, focusing on how different medical centers compare their treatment planning methods. It includes 30 studies categorized into three areas: differences in dose measurements, standardizing plans before clinical trials, and examining technical methods. The review emphasized [30] the importance of clear guidelines, independent data analysis, and collaboration tools to improve treatment consistency and quality across different healthcare facilities.
Figure 27 (c.f., [31]) describes different visual representations used in a study about medical imaging and treatment planning. It includes two-dimensional and three-dimensional views showing the locations of important structures, like the submandibular glands and the brain stem, in relation to the planning target volume (PTV) [31], which is the area that needs treatment. The colors represent different types of contouring methods: manual delineation (MD) in red, deep learning-based delineation (DLD) in blue, and the distance between structures in green, highlighting how accurately these methods can outline critical areas.
The limits [32] of how much radiation healthy tissues can tolerate have made it difficult to treat large tumors effectively. A new technique called spatially fractionated radiation therapy (SFRT), which includes methods like GRID radiation therapy [32], delivers uneven doses of radiation to the tumor, potentially improving treatment outcomes for bulky cancers. However [32], because this technique is complex and not widely used, researchers are working to standardize its application and understand how it achieves better tumor responses with less damage to surrounding healthy tissue.
Figure 28 (c.f., [32]) offers a visualization of the GRID block, a specialized tool used in radiation therapy to create a specific pattern of high-dose radiation on a patient’s tumor while minimizing exposure to surrounding healthy tissue. This tool helps in targeting deep-seated tumors effectively by shaping the radiation field, which is crucial for treatments like GRID therapy. The design of the GRID block allows for precise control over the radiation dose delivered to different areas, enhancing treatment outcomes for patients with bulky or hard-to-treat tumors.
Figure 29 (c.f., [32]) portrays the dose distribution at the dmax depth refers to how radiation doses are spread out at the maximum depth where the radiation beam delivers the highest dose to the tissue. Film dosimetry is a technique used to measure this dose distribution by placing special film in the path of the radiation beam [32], which records the amount of radiation it receives. Understanding this distribution is important for ensuring that the right amount of radiation is delivered to the tumor while minimizing exposure to surrounding healthy tissue.

2.3. Chemotherapy Optimization

Chemotherapy optimization [40,41,42,43,44,45,46,47,48,49,50,51,52] is the process of improving cancer treatment by making it more effective and safer for patients. This involves personalized medicine, where doctors analyze a patient’s tumor genetics to choose the best drugs, and pharmacogenomics, which looks at how a person’s genes affect how they respond to medications. Other strategies include using combinations of drugs, adjusting doses based on individual patient needs, and integrating supportive care to manage side effects, all aimed at enhancing treatment outcomes while minimizing harm.
Outpatient chemotherapy centers are facing challenges due to high demand and limited resources [40], which has led researchers in operations management to focus on optimizing the outpatient chemotherapy process (OCP). This review analyzes existing research on OCP optimization by examining various studies and using tools to gather and categorize the information. The findings indicate that while there are many studies, they often focus on specific problems rather than providing comprehensive solutions to the broader challenges faced by outpatient chemotherapy centers.
A word tree map is a visual tool that shows the most common keywords used by authors [40] in their publications about outpatient chemotherapy (OCP). In Figure 30 (c.f., [40]), the size of each rectangle represents how often a keyword appears, helping to highlight the main topics of focus, such as “outpatient chemotherapy” and “optimization.” This visualization helps researchers quickly understand the key themes and areas of interest in the literature related to OCP.
Social network analysis of quantitative OCP (Operations and Care Planning) optimization models involves examining how different elements within these models interact and relate to one another(See Figure 41 (c.f., [40]) , much like studying connections in a social network. This analysis helps researchers understand the relationships between various factors, such as patient scheduling, treatment planning, and resource allocation, which can improve the efficiency and effectiveness of healthcare operations. By visualizing these connections, it becomes easier to identify areas for improvement and optimize processes in outpatient chemotherapy settings.
Figure 31.
Figure 31.
Preprints 145474 g031
The OCP optimization-oriented research framework refers to a structured approach used in operations research to solve complex decision-making problems, as depicted in Figure 32 (c.f., [40]). It includes various mathematical programming techniques, such as mixed-integer programming (MIP) and linear programming (LP), which help optimize outcomes under certain constraints. Other methods like stochastic mixed-integer programming (SMIP) and Markov decision processes (MDP) are also part of this framework, allowing researchers to handle uncertainty and dynamic decision-making scenarios effectively.
Cancer remains one of the leading causes of premature death worldwide [41], with projections indicating a significant increase in new cases by 2050. Chemotherapy is a common treatment that uses drugs to target and disrupt tumor cells, but it can also cause severe side effects and lead to drug resistance. To improve chemotherapy effectiveness, researchers are exploring personalized treatment plans using mathematical models to optimize drug doses, particularly through a method called metronomic treatment, which involves administering smaller doses more frequently.
A schematic figure of the multi-objective problem-solving procedure visually represents the steps involved in optimizing a problem with multiple goals. It typically includes stages like modeling the problem, defining objectives, conducting the optimization process, and making decisions based on the results. Figure 33 (c.f., [41]) helps researchers understand how to approach complex problems, such as optimizing chemotherapy treatments, by showing the relationships between different steps in the process.
A schematic representation of the Pareto front visually shows the trade-offs between multiple objectives in an optimization problem. In Figure 34 (c.f., [41]) , each axis represents a different objective function, and the points (or circles) indicate potential solutions. The Pareto front itself includes the non-dominated solutions, meaning these are the best options were improving one objective would worsen another, helping decision-makers find the best balance between conflicting goals.

2.4. Clinical Trials and Biostatistics

Clinical trials are structured research studies that test the safety and effectiveness of new medical treatments [53,54,55,56,57,58,59,60,61,62,63,64], such as drugs or devices, before they can be approved for public use. They go through several phases [53,54,55,56,57,58,59,60,61,62,63,64], starting with small safety tests and progressing to larger studies that compare the new treatment with existing options. Biostatistics is crucial in these trials [53,54,55,56,57,58,59,60,61,62,63,64], as it helps determine how many participants are needed, ensures unbiased group assignments, manages data, and analyzes results to make informed decisions about the treatments being tested.
The authors [53] discussed how modern oncology clinical trials are evolving to better evaluate targeted cancer therapies through designs like basket and umbrella trials. Basket trials group patients with different types of cancer but share a specific molecular alteration [53], while umbrella trials focus on one type of cancer but test multiple therapies based on different molecular changes. These trial designs require careful planning and coordination, including the use of biomarker testing to identify which patients are eligible for specific treatments, ultimately aiming to improve the effectiveness of cancer therapies in a more efficient way.
Common problems in biostatistics that researchers should avoid ensuring accurate results were deeply explored by [54], through emphasizing the importance of using the correct metrics to describe data, understanding P-values and confidence intervals, and recognizing the difference between correlation and causation. By avoiding these mistakes [54], researchers can improve the reliability of their studies and contribute to better medical outcomes.
Effective treatments [55] for metastatic triple-negative breast cancer (mTNBC) are urgently needed due to the poor outcomes associated with this type of cancer. Pembrolizumab, an immune therapy that targets the PD-1 protein [55], has shown low response rates when used alone, indicating that combining it with other treatments, like radiotherapy (RT), may enhance its effectiveness. The authors [55] investigated the safety and efficacy of using pembrolizumab alongside RT in patients with mTNBC, aiming to improve treatment responses and overall patient outcomes.
The Consolidated Standards of Reporting Trials (CONSORT) flow diagram (See Figure 35 (c.f., [55]) is a visual tool used in clinical research to show the process of how participants are selected and treated in a study. This helps to clearly outline the number of patients assessed for eligibility, those who were enrolled [55], and any dropouts or exclusions during the trial. In this context, it also references RECIST v1.1, which is a set of criteria used to evaluate how tumors respond to treatment, and RT, which stands for radiotherapy.
Figure 36 (c.f., [55]) displays tracks changes in tumor size for cancer patients undergoing treatment. It explains how researchers used a specific evaluation method called RECIST v1.1 to measure whether tumors grew, shrank, or remained stable after treatment. The figures mentioned show the results for different groups of patients, highlighting those who had new lesions, tumor growth, or complete responses to the treatment over time.

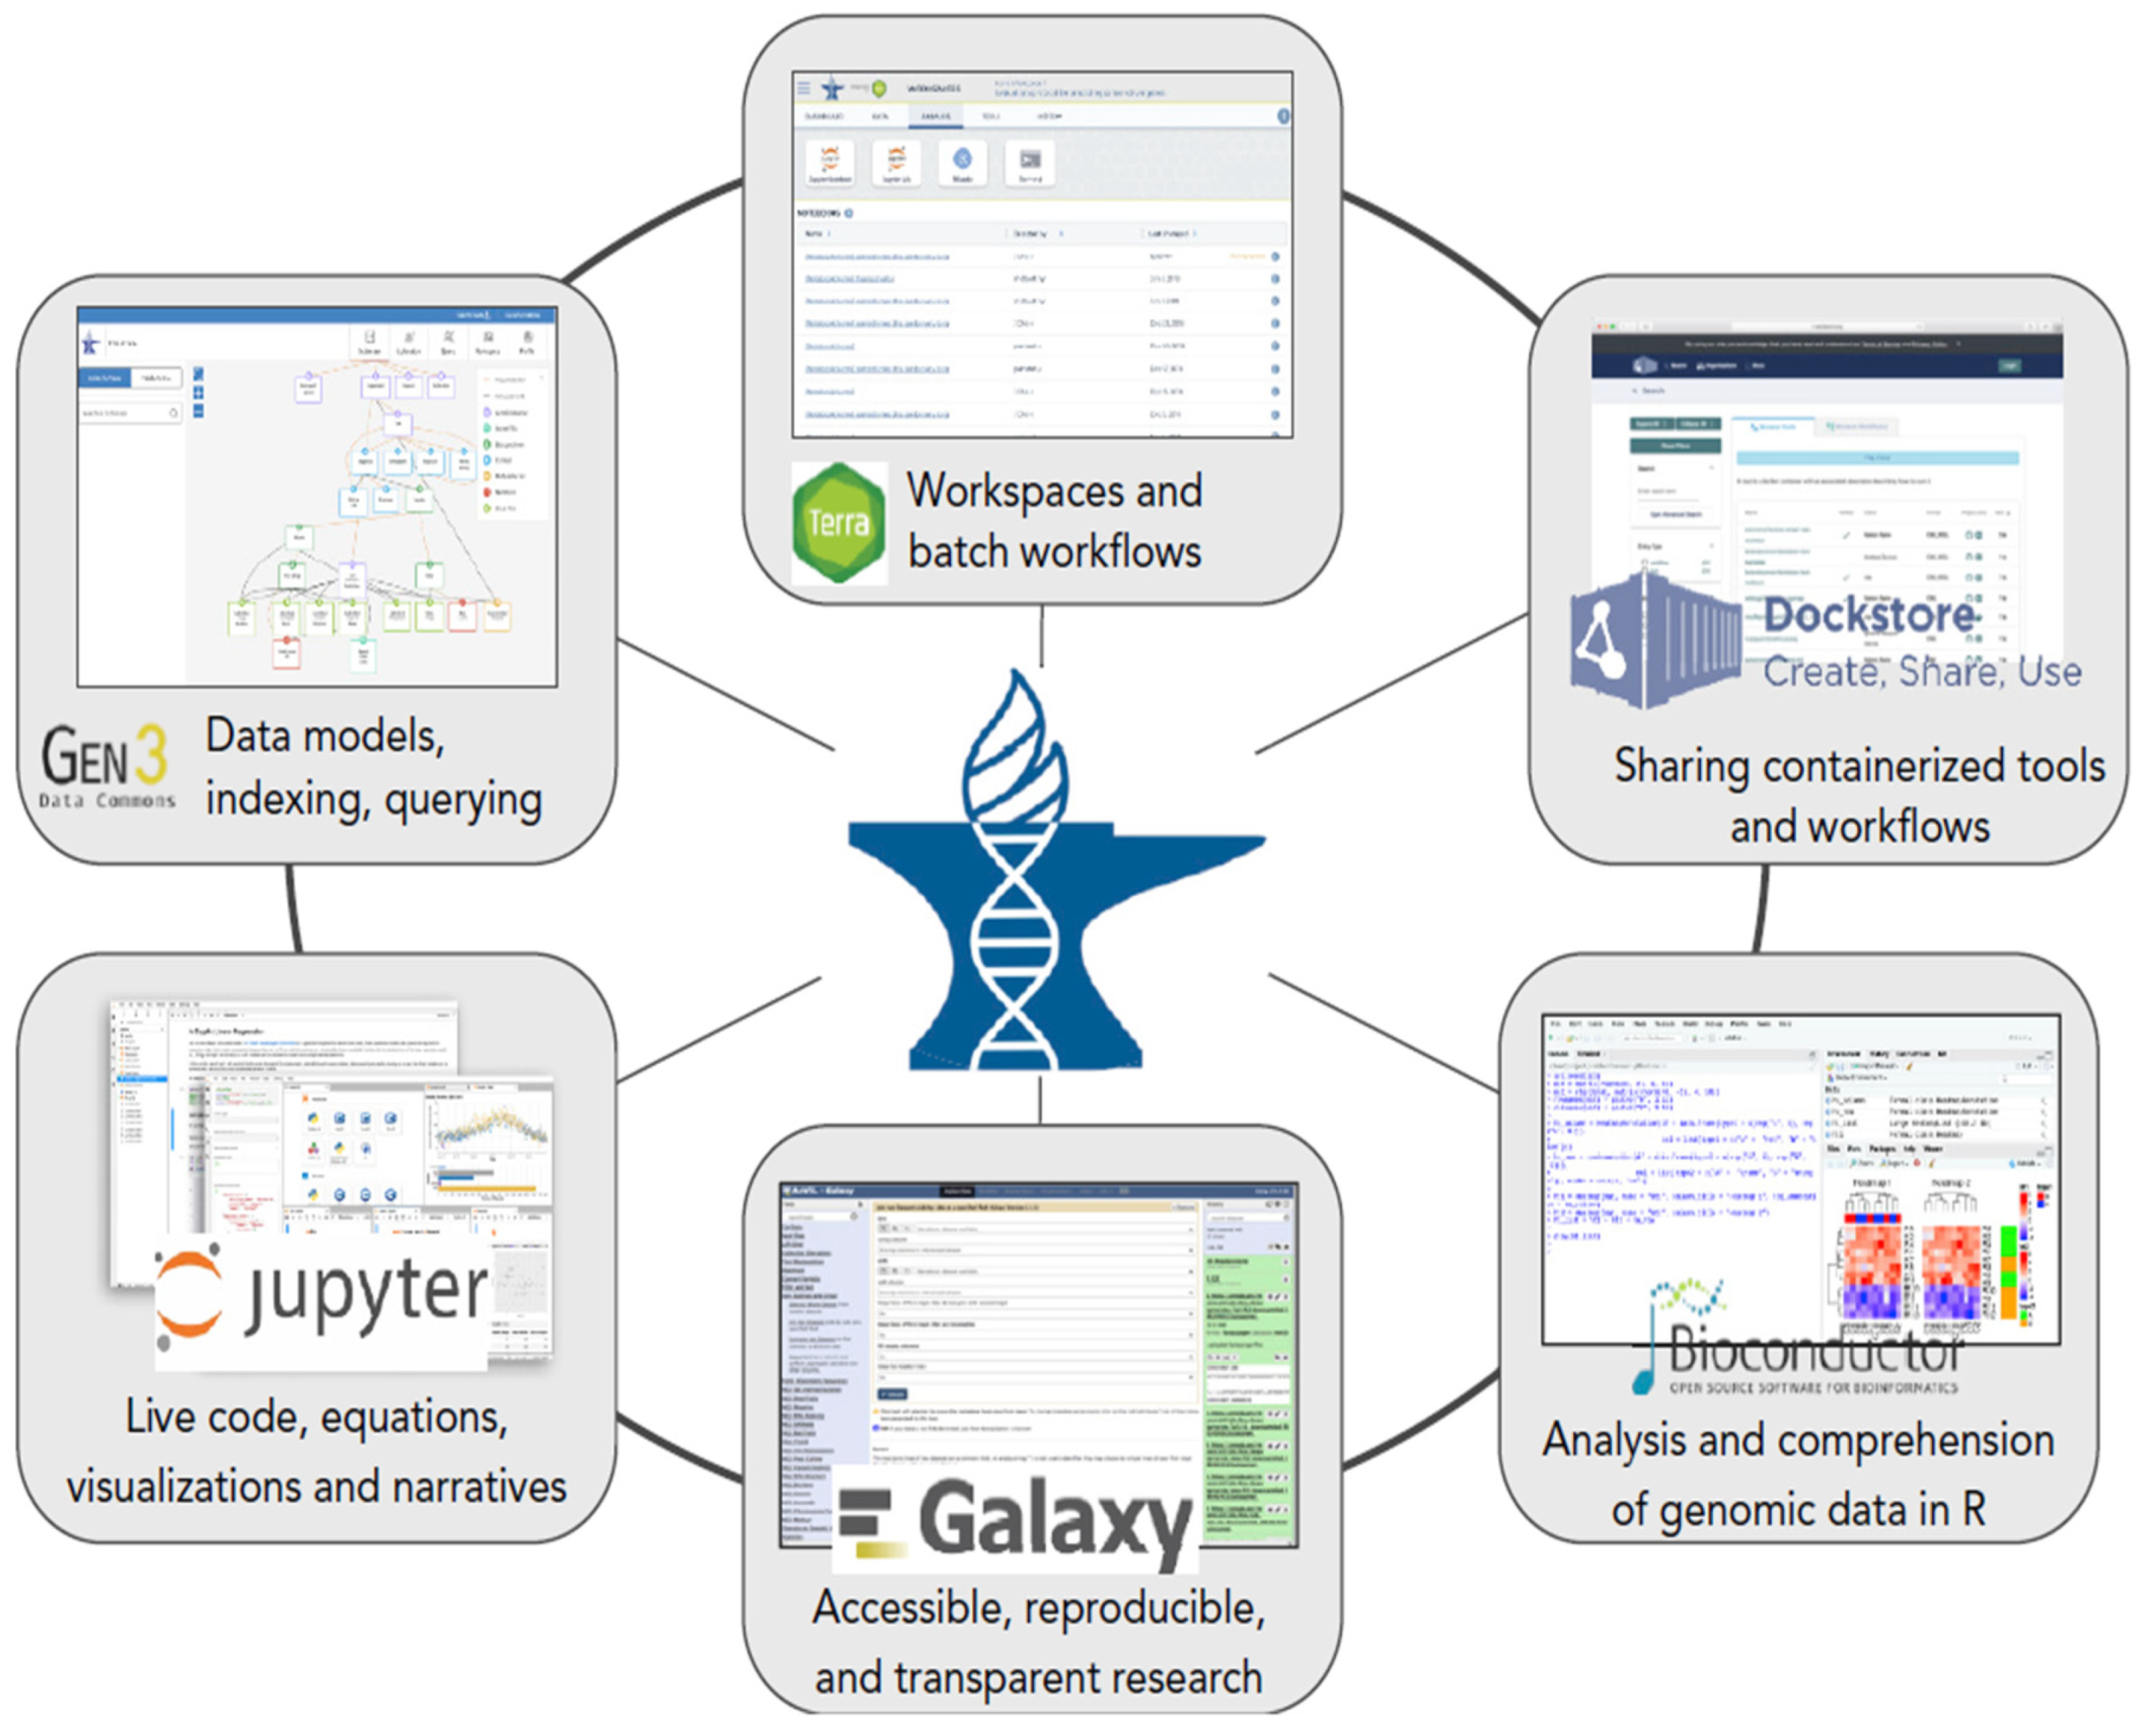
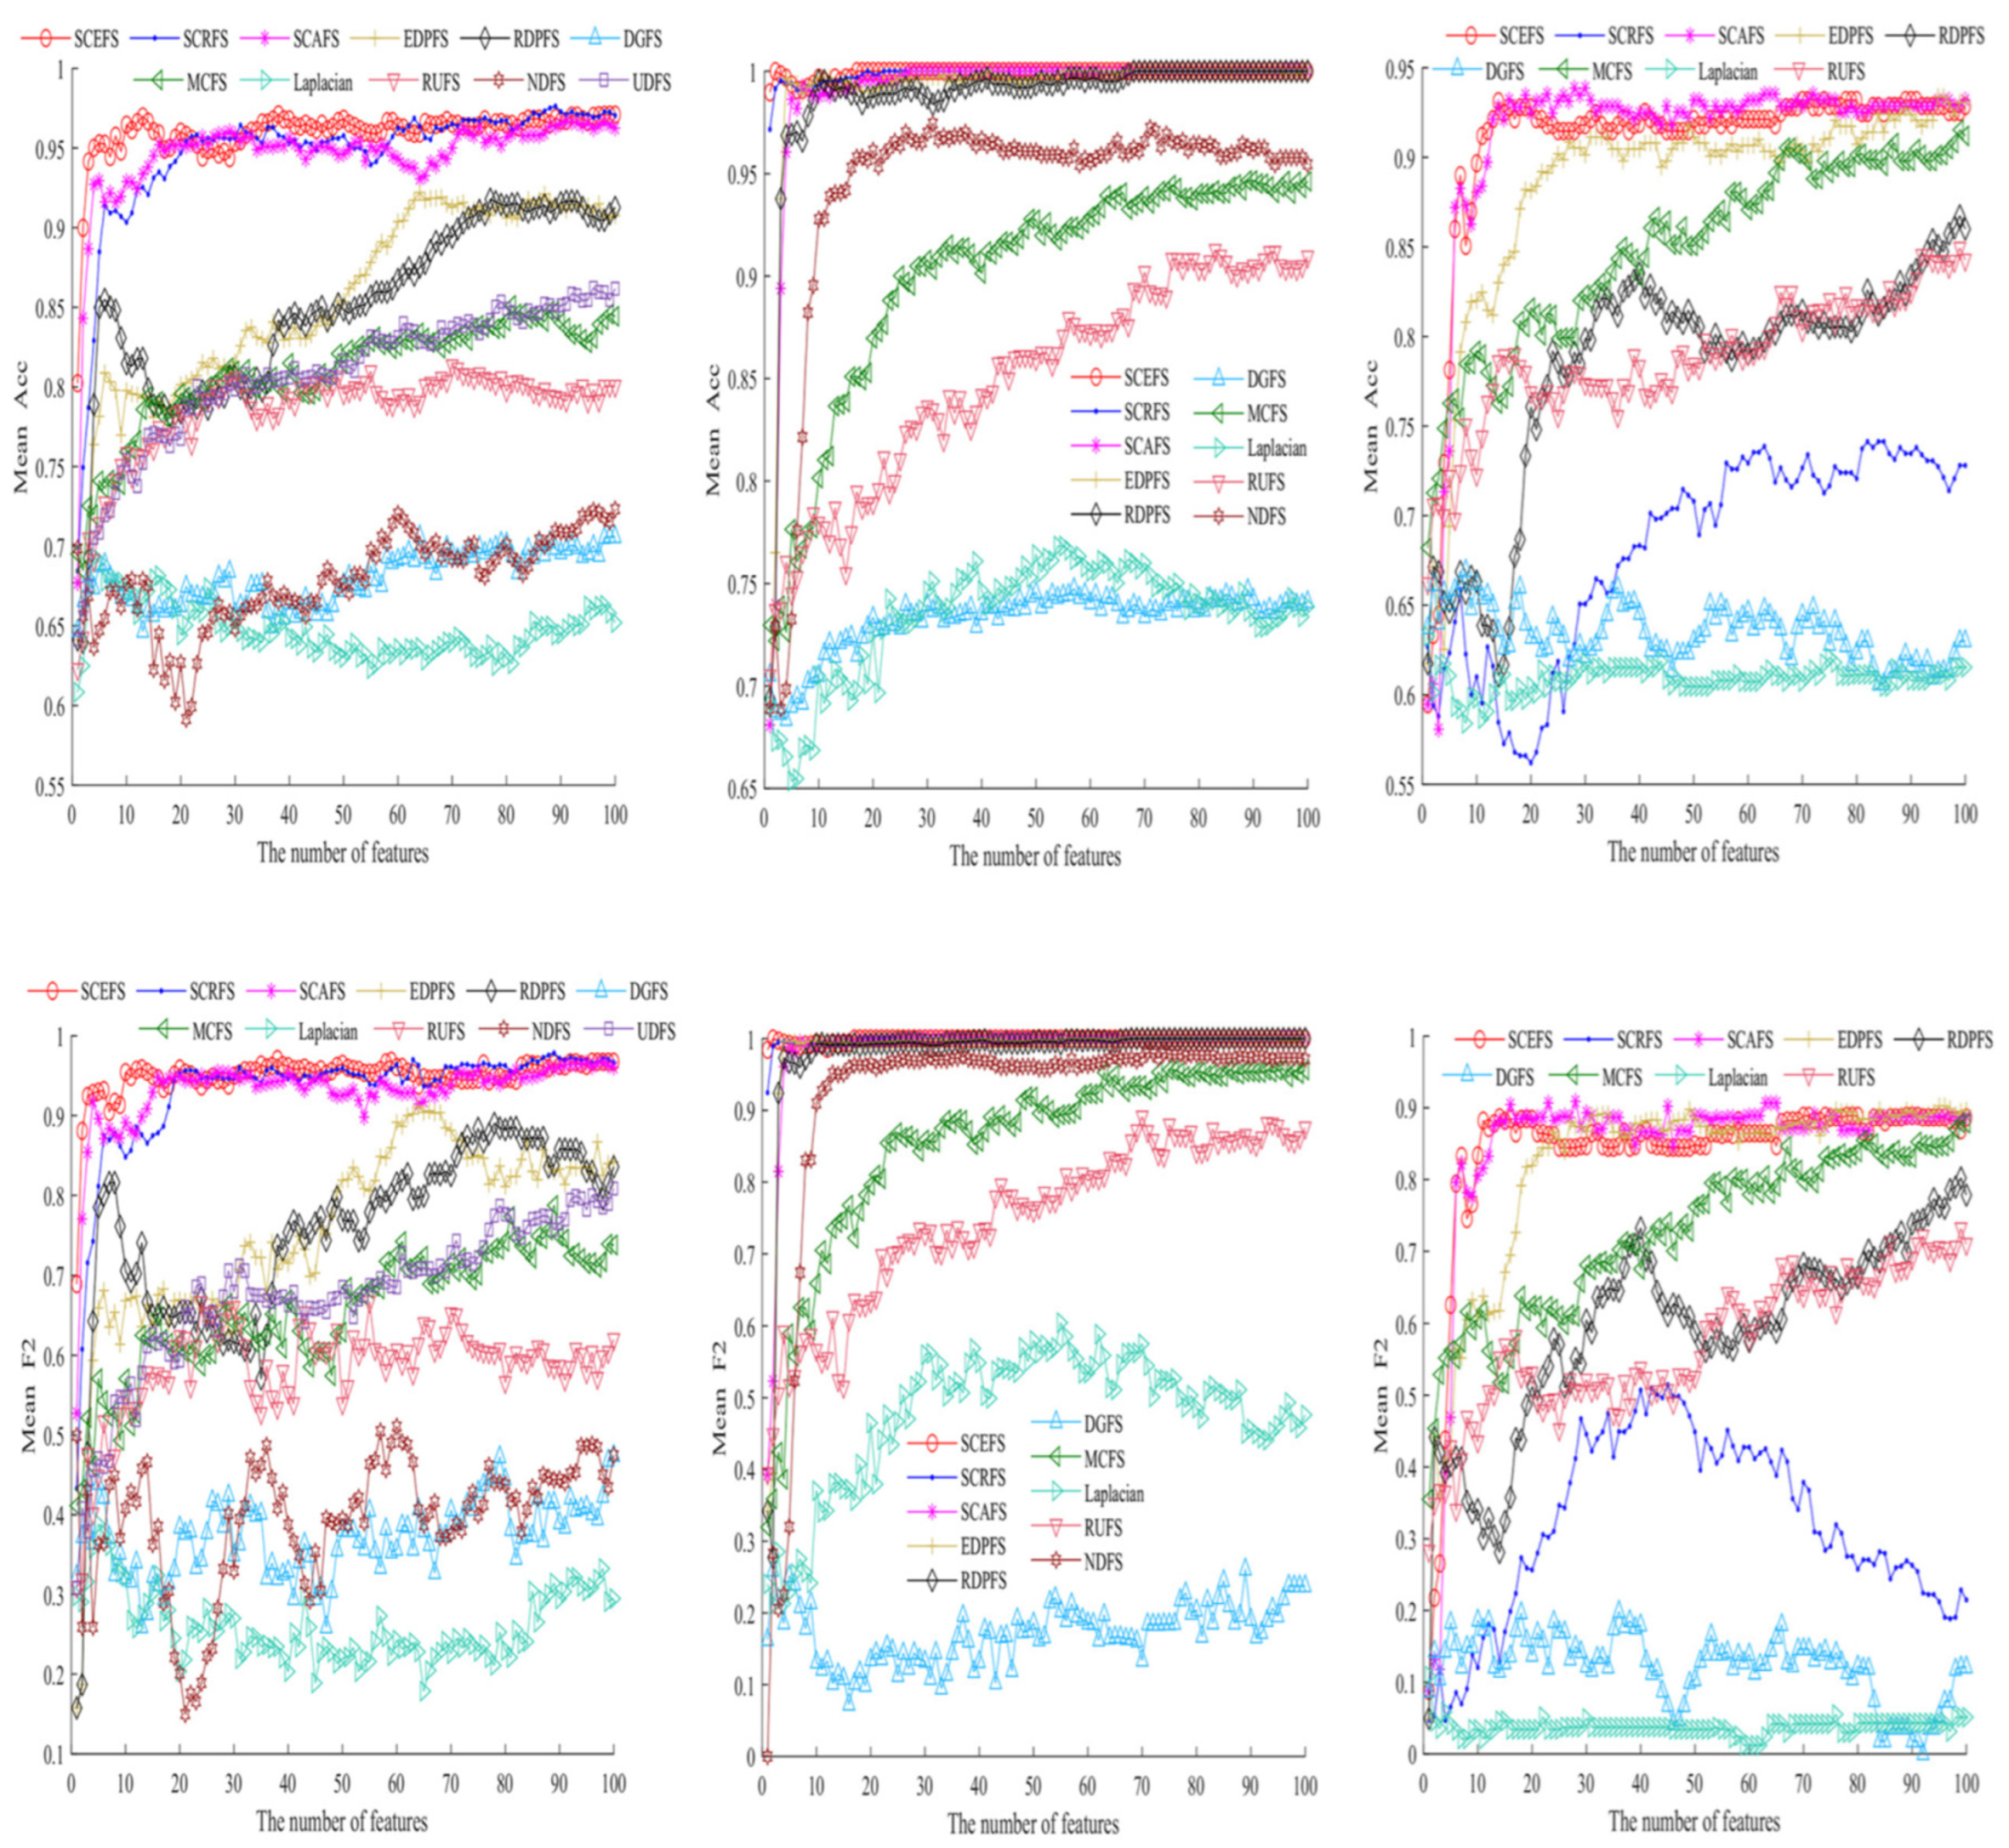
2.5. Genomic Data Analysis

Genomic data analysis [65,66,67,68,69,70,71,72,73,74] is the process of examining and interpreting genetic information obtained from sequencing technologies, like next-generation sequencing (NGS). This involves several key steps [65,66,67,68,69,70,71,72,73,74], including generating data through sequencing, aligning the sequences to a reference genome, identifying genetic variants, and analyzing gene expression. The findings from this analysis can lead to personalized medicine and better understanding of genetic conditions [65,66,67,68,69,70,71,72,73,74], ultimately transforming healthcare.
The National Cancer Institute’s Genomic Data Commons (GDC) collects and shares large amounts of cancer-related genomic data [65], including information from major projects like The Cancer Genome Atlas. To ensure that this data is comparable and reliable, the GDC uses a process called harmonization [65], which aligns data from different sources to a single reference genome and generates summary results. This allows researchers to analyze cancer data more effectively and discover important insights that could improve healthcare and our understanding of genetics.
Figure 37 (c.f., [65]) describes how the GDC (Genomic Data Commons) identifies genetic changes, called somatic variants, in cancer samples using different analysis methods, referred to as pipelines. Each pipeline’s results are organized in rows [65], while the different cancer projects are shown in columns. The data [65] includes counts of two types of mutations: single nucleotide polymorphisms (SNPs) and insertions/deletions (INDELs), which are represented in different colors to distinguish between public and protected mutation annotation format (MAF) data.
Observing Figure 38 (c.f., [65]) , the Venn Diagram on the left illustrates how four different GDC (Genomic Data Commons) tools, called somatic callers, identify genetic variants in tumor samples. It shows that 56% of the variants were found by all four tools, while 15.1% were identified by three, 14% by two, and 14.9% by just one tool. The right Venn Diagram highlights the recall rates for validated variants from the TCGA (The Cancer Genome Atlas), revealing that 3.2% of these variants were not detected by any of the GDC tools, while the majority (71.6%) were detected by all four.
Maintaining software across many data centers is a significant challenge because each center needs to install and update its own tools [66], which can lead to inefficiencies and inconsistencies. This traditional model requires researchers to copy large datasets, like the 1000 Genomes Project, which can take days or even months, making collaboration difficult. A more efficient approach is to use cloud computing, where researchers can access a single copy of the data remotely, reducing redundancy and costs while improving collaboration and data security, (See Figure 39(c.f., [66]).
The AnVIL [66] ecosystem is a cloud-based platform designed for analyzing large genomic datasets. It combines various established tools and environments, such as the Terra platform for secure data sharing, Dockstore for sharing analysis tools [66], and R/Bioconductor, Jupyter, and Galaxy for users with different skill levels to perform analyses. The AnVIL supports numerous genomics projects and provides access to a wide range of genomic datasets [66] , including whole-genome and whole-exome sequencing data, as depicted in Figure 40 (c.f., [66]).
The AnVIL (Analysis, Visualization, and Informatics Lab-space) has made significant progress since its launch over three years ago [66], focusing on improving tools for human genetics and clinical genomics. Key initiatives [66] include integrating diverse genomic data and enhancing capabilities for analyzing complex genetic variations and risk scores. The AnVIL aims to democratize access to powerful computing resources [66], allowing more researchers to utilize cloud computing for their genomic studies, while also addressing cost concerns and providing support for effective budgeting and resource management.
The undertaken research in [67] focused on unsupervised feature selection algorithms for analyzing genomic data, which often has many features but few samples. The authors [67] proposed three algorithms (SCEFS, SCRFS, and SCAFS) that evaluate features based on their discernibility (how well they can distinguish between categories) and independence (how much they overlap with other features). By plotting these features in a two-dimensional space [67], they can automatically select the most important features that contribute to better classification of cancer-related data.
Figure 41 (c.f., [67]) displays the performance of three new unsupervised feature selection algorithms (SCEFS, SCRFS, and SCAFS) when used with a KNN classifier on different cancer datasets, including leukemia and non-small lung cancer. These algorithms [67] effectively identify a small set of important features that can distinguish between different classes of data while minimizing redundancy. The results confirmed that using these selected features leads to better classification accuracy, demonstrating their effectiveness in reducing the complexity of high-dimensional genomic data.

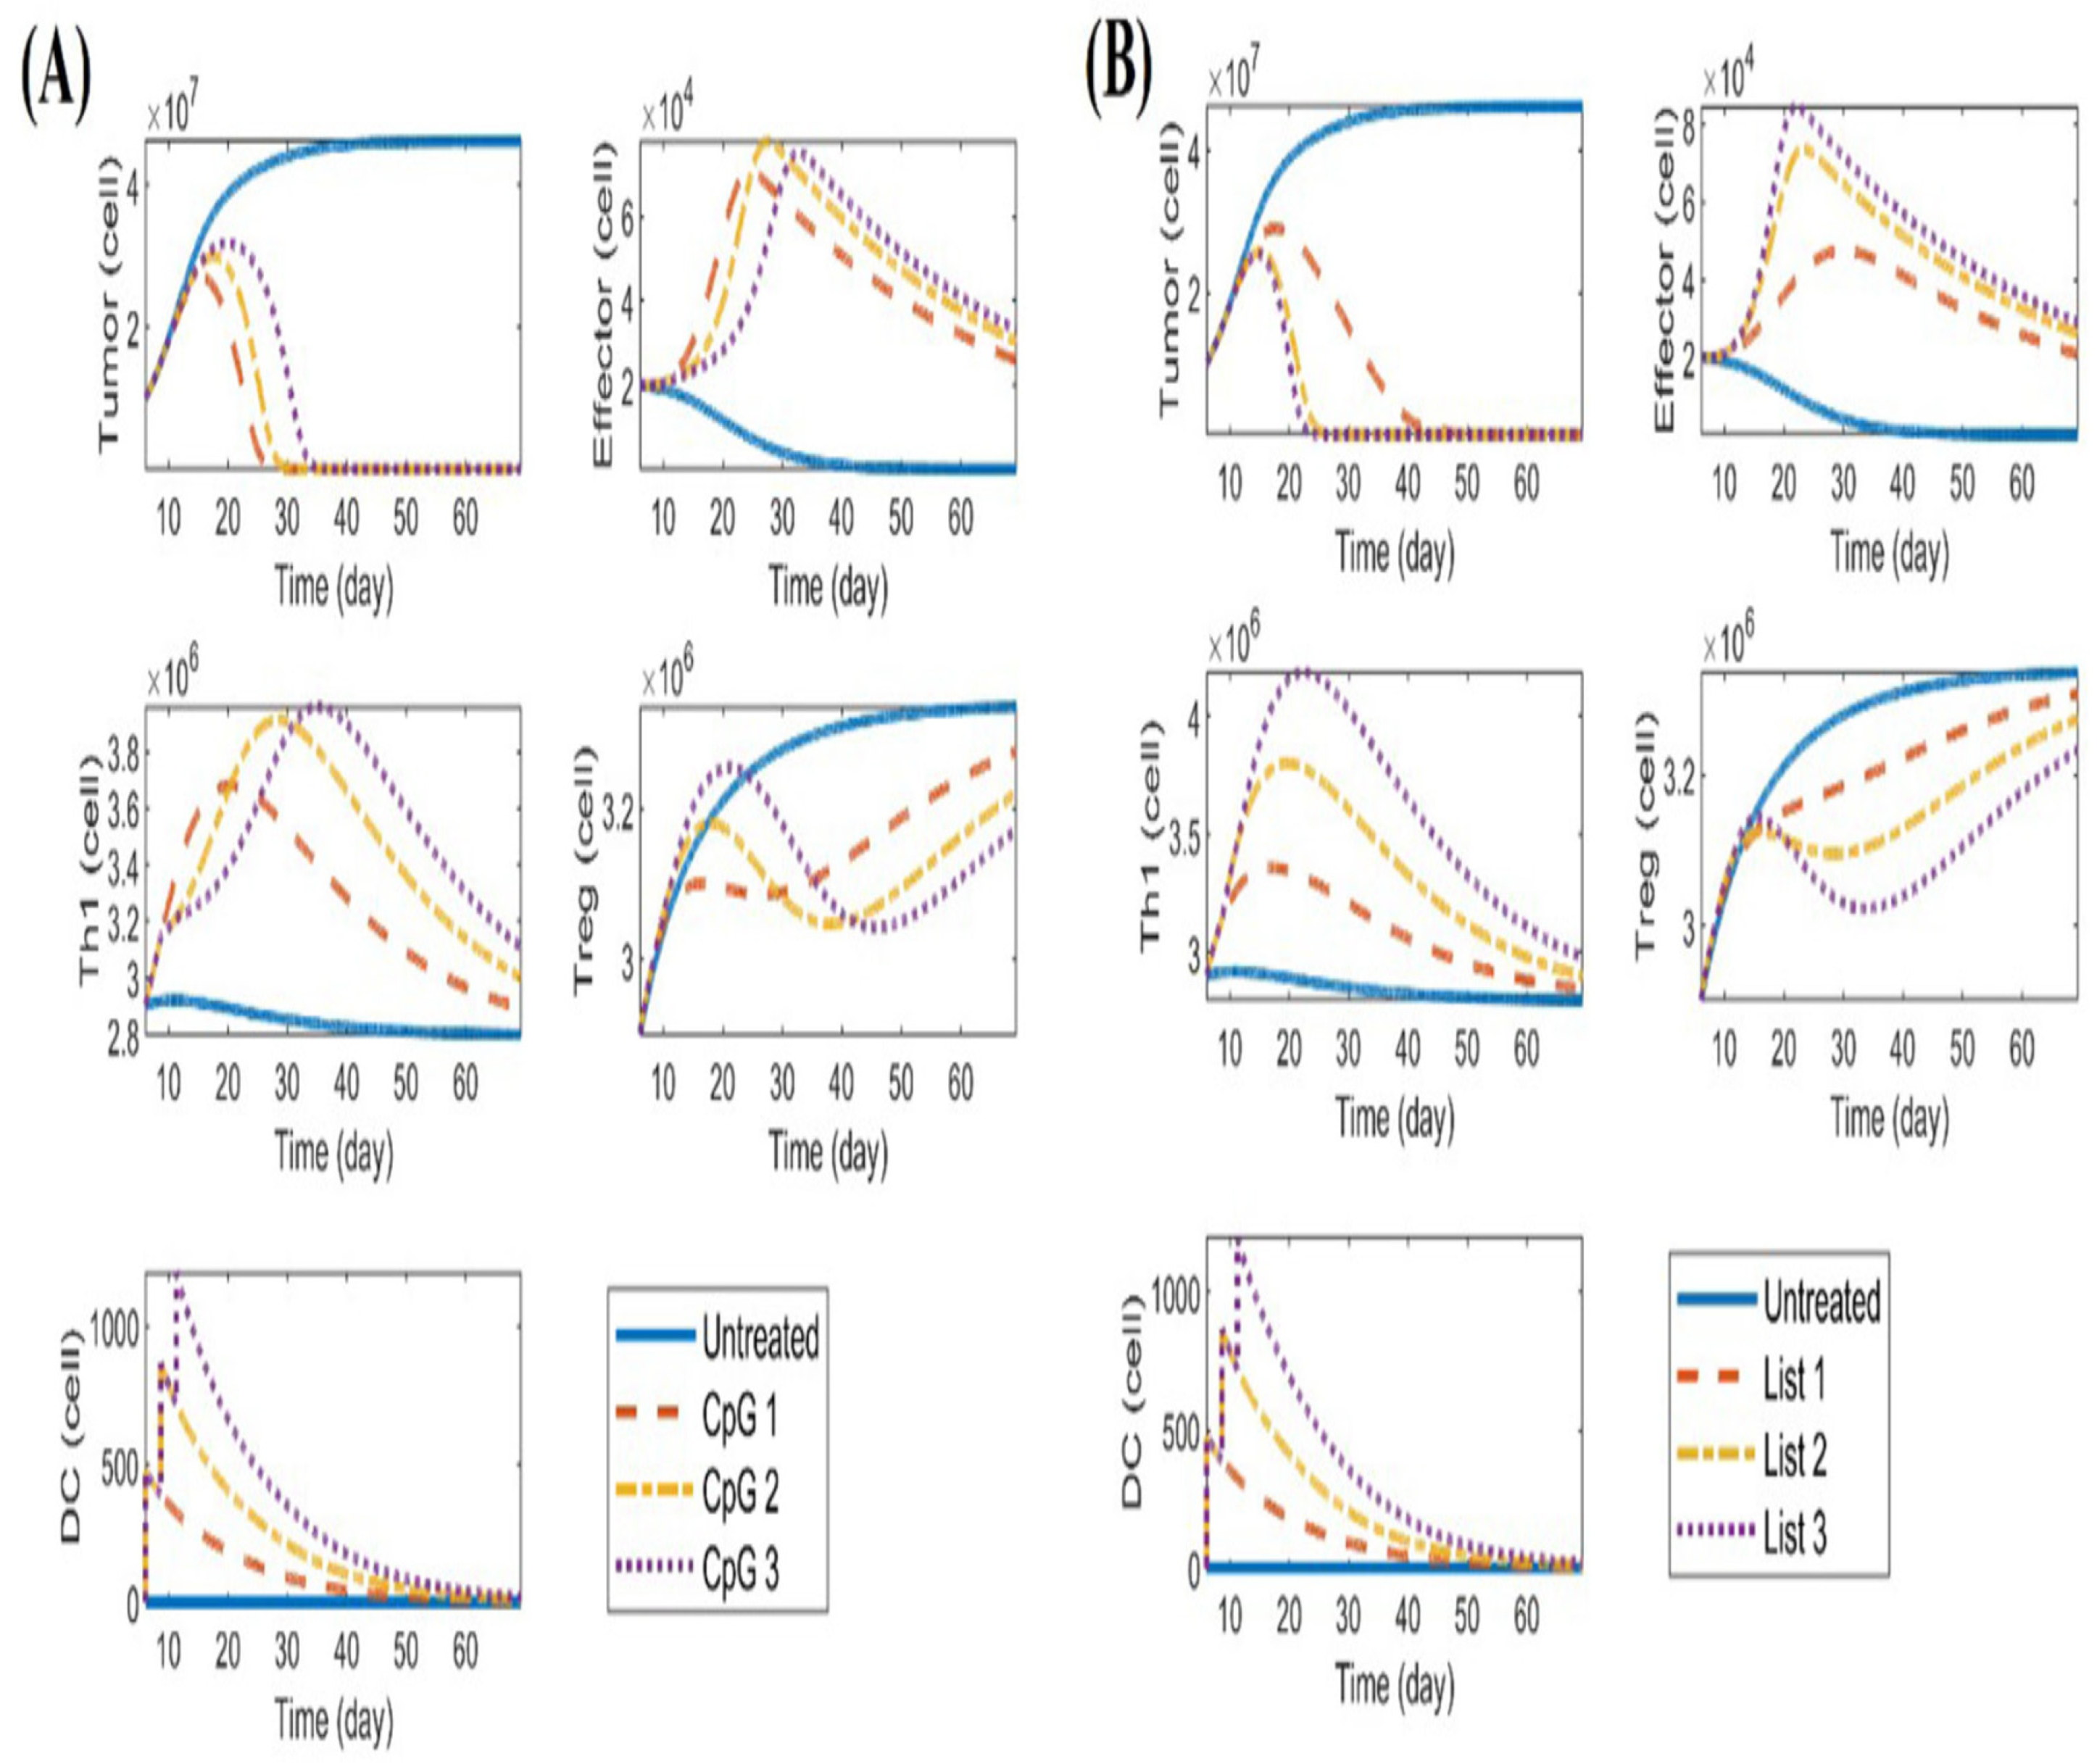
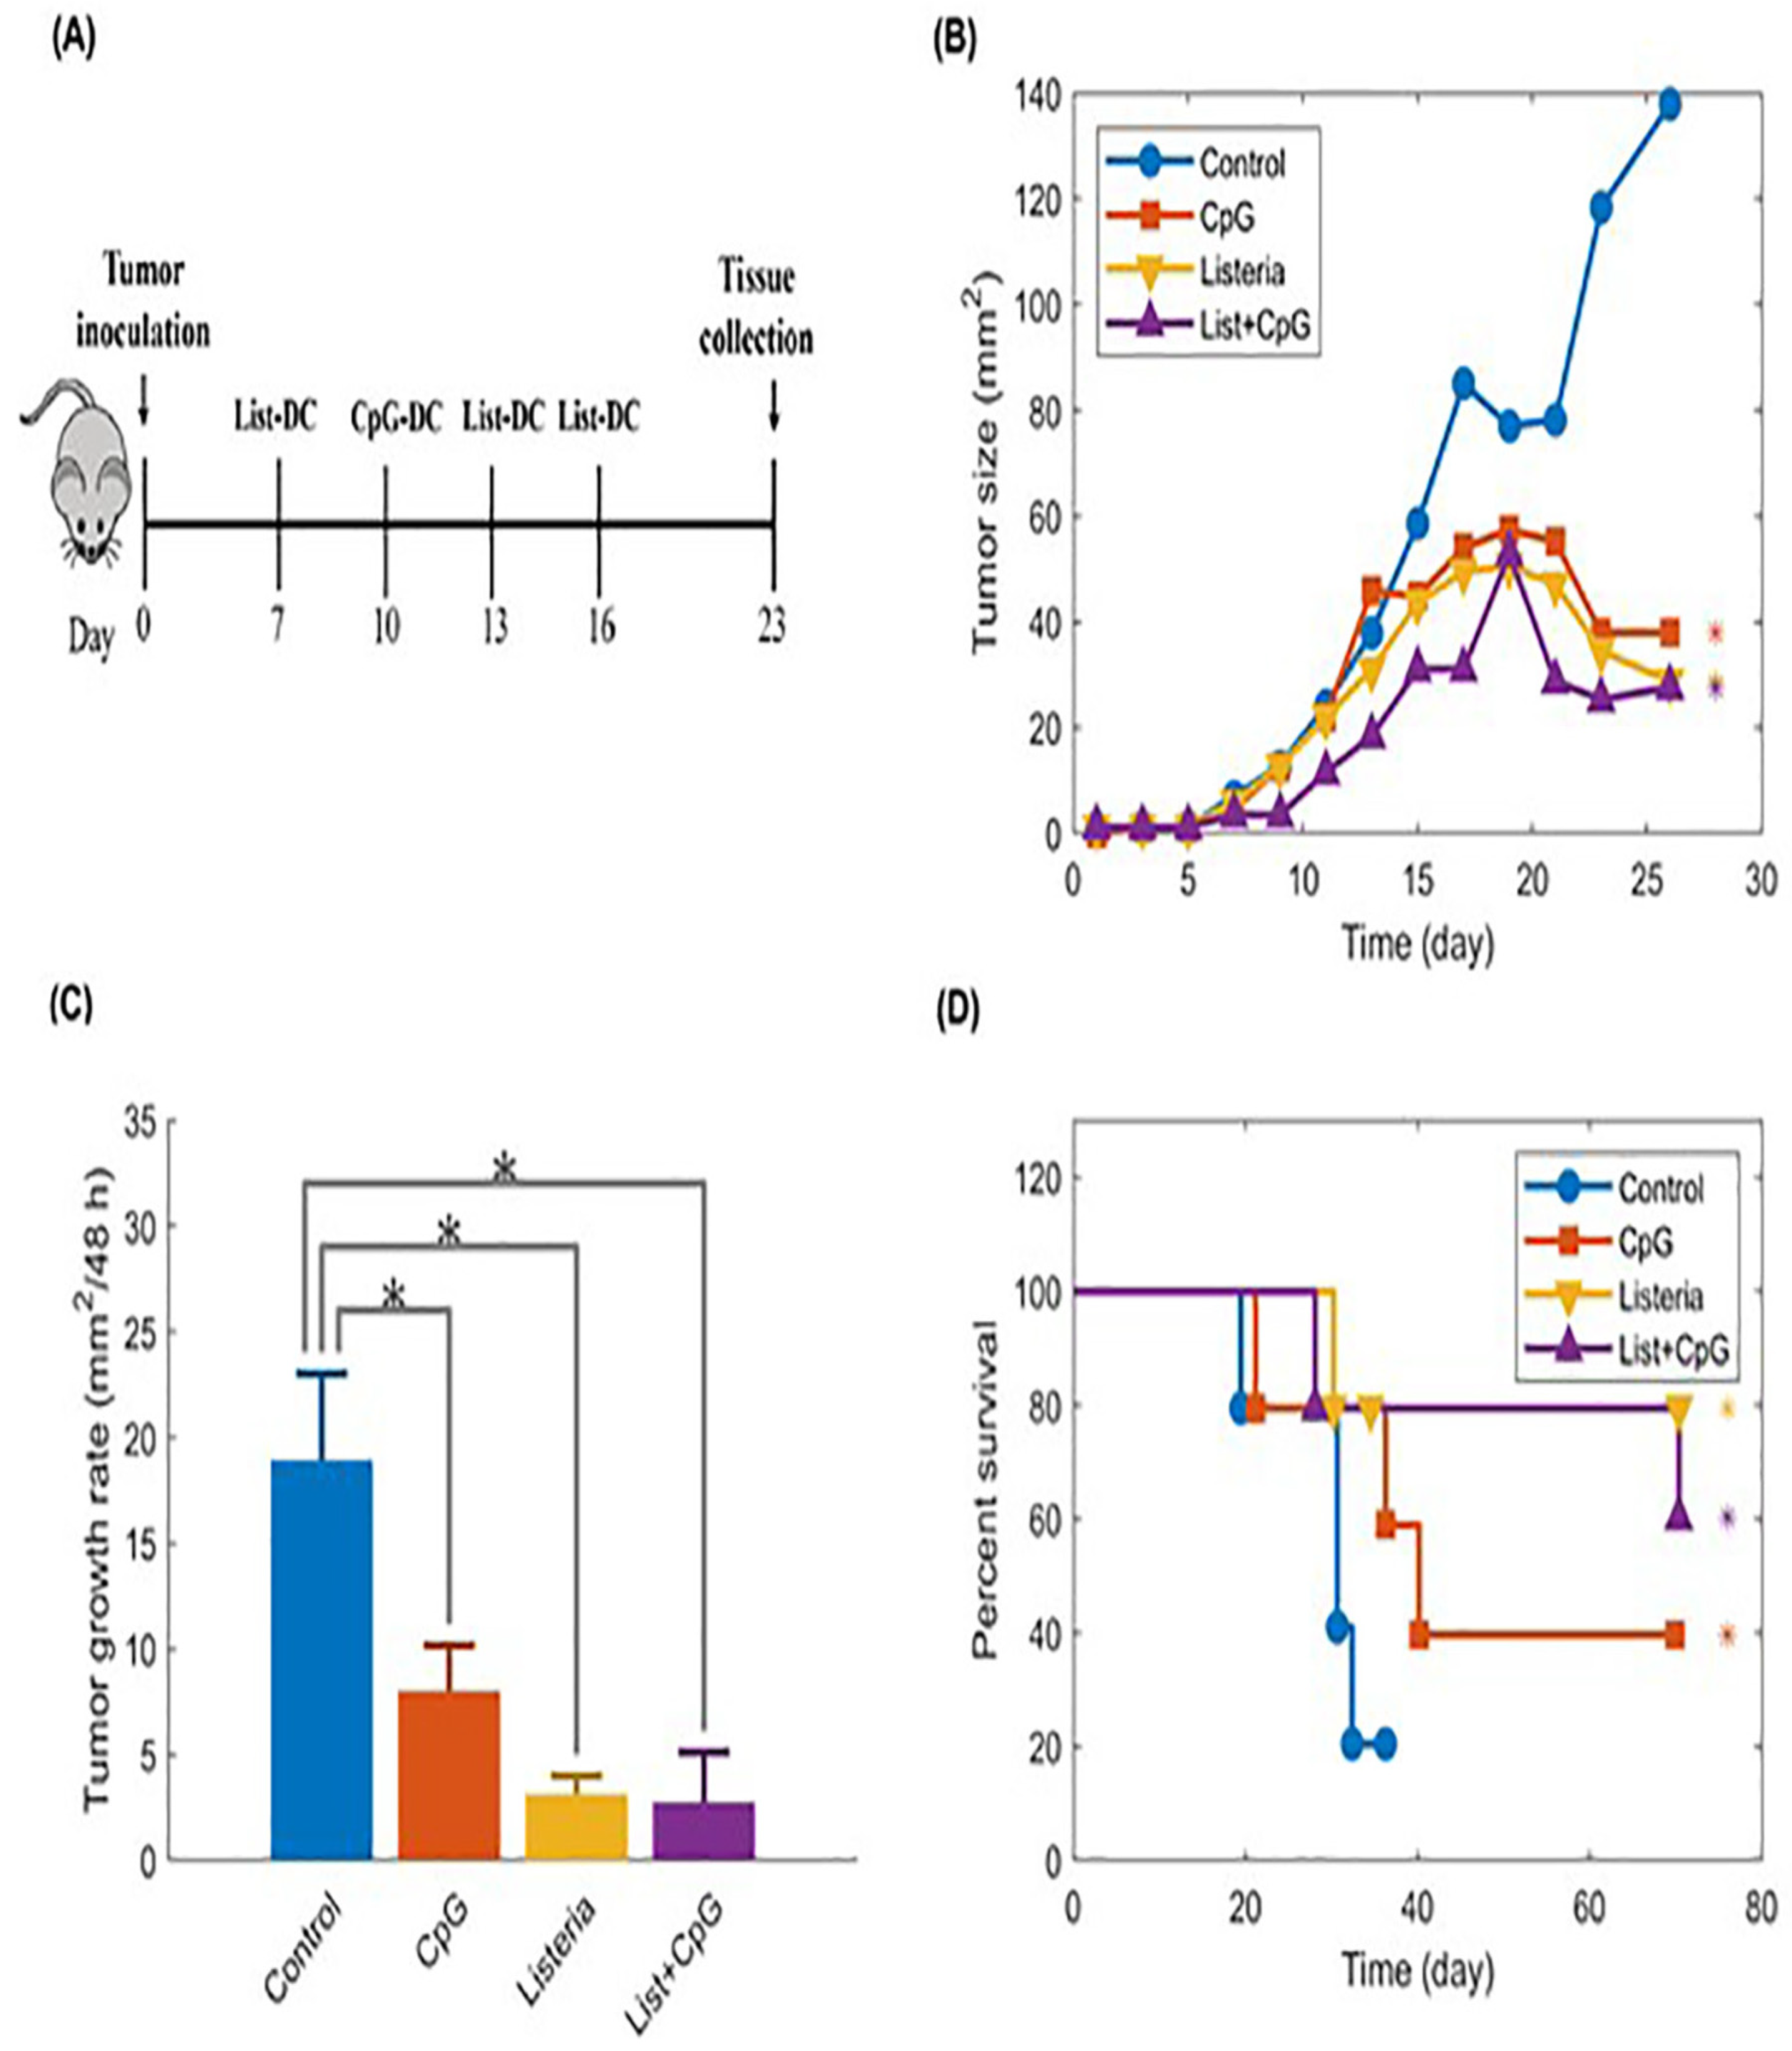
2.6. Immunotherapy and Systems Biology

Immunotherapy is a cancer treatment that boosts the body’s immune system to fight cancer cells, using methods like monoclonal antibodies [75,76,77,78,79,80,81,82,83,84,85,86,87], checkpoint inhibitors, and CAR-T cell therapy. Systems biology studies the complex interactions within biological systems [75,76,77,78,79,80,81,82,83,84,85,86,87], helping to identify biomarkers and personalize treatments based on individual patient data. By combining these two fields, researchers can improve cancer treatment outcomes [75,76,77,78,79,80,81,82,83,84,85,86,87], understand how tumors resist therapies, and develop more effective, tailored immunotherapy strategies.
Xenograft tumors [75] in untreated experiments grow rapidly and can become very large, leading to the death of mice before the tumors reach their maximum size. The growth of these tumors is modeled using a mathematical equation that describes how the total tumor volume changes over time [75], factoring in the tumor growth rate. To better understand how tumors grow and respond to treatments [75], researchers extend this model to include the effects of blood vessel growth and the immune response, creating a more complex model that captures the dynamics of tumor growth and its interaction with the body’s immune system.
To investigate why immunotherapy might fail [75], researchers used a specific set of parameters from the MC38 cancer cell line that responds to treatment. They adjusted three key parameters—representing immune response, immune proliferation [75], and functional immune response—to see how these changes affected the outcomes compared to non-responding MC38 cells. The simulations showed that increasing the immune response parameter led to more aggressive cancer behavior [75], while decreasing the other parameters helped identify conditions under which the immune response could still be elevated after treatment, highlighting important factors in immunotherapy effectiveness.
There are several ways [75] to improve research on tumor behavior during immunotherapy by gathering more data on tumor hypoxia and immune cell changes. It suggests using advanced imaging techniques, like FMISO-PET, to track these changes over time [75], although this can be costly and may expose animals to radiation. Additionally, the authors plan to refine their mathematical model to better understand how different treatments and timing can affect tumor responses, while also considering the uncertainties and interactions between various factors in their analysis.
Cancer [76] is a significant health issue worldwide and is the second leading cause of death in many countries. Traditional treatments like surgery, chemotherapy, and radiation can have side effects, which has led to increased interest in immunotherapy [76], a method that uses the body’s immune system to fight cancer. One promising approach in immunotherapy is using dendritic cells (DCs) to activate T cells [76], which can help induce a stronger immune response against tumors, and researchers are developing mathematical models to better understand and optimize these treatments.
Figure 42 (c.f., [76]) discusses how a mathematical model was used to evaluate the effectiveness of different types of dendritic cell (DC) vaccines in treating tumors. It shows that using multiple doses of the CpG-DC vaccine led to increased tumor growth and a higher number of regulatory T cells (Treg), which can suppress the immune response. In contrast [76], multiple doses of the Listeria monocytogenes-DC vaccine resulted in reduced tumor growth and increased activation of T helper 1 (Th1) cells, which are important for fighting tumors, while also decreasing Treg cells.
Figure 43 (c.f., [76]) shows how dendritic cell (DC) vaccination affects tumor growth and survival rates in mice with cancer. In this experiment, BALB/c mice were injected with a specific type of cancer cells (WEHI 164 fibrosarcoma) and then monitored for tumor size and survival over 30 days. The results [76] showed that the DC vaccination influenced tumor growth and improved survival compared to control groups, with statistical analysis confirming the significance of these findings.
Figure 44 (c.f., [76]) displays how to compare tumor sizes between mathematical simulations and actual experimental results across four different treatment groups. Part (A) describes how the researchers used mathematical models to predict tumor sizes based on different treatments. Parts (B) and (C-F) detail how the average tumor sizes from the simulations were compared to the real data for each treatment group, showing that the predictions and experimental results were generally consistent.
Following [77], a study on breast cancer that focuses on how certain immune cells called macrophages can change their behavior in response to the tumor environment. Researchers used a CRISPR system to manipulate these macrophages, encouraging them to adopt a more aggressive, anti-tumor (M1) state instead of a supportive (M2) state. This approach [77] aimed to improve the effectiveness of cancer treatments by enhancing the immune response against tumors, particularly in challenging areas like the liver where cancer often spreads.
Figure 45 (c.f., [77]) describes a simulation that models how different types of macrophages (immune cells) affect the growth of a specific type of cancer lesion (BCLM) over 24 hours. It compares [77] two scenarios: one with M1 macrophages, which help shrink the tumor, and another with M2 macrophages, which promote tumor growth. The simulation also shows how treatment with a drug (MSV-nab-PTX) influences these effects [77], with the tumor tissue being represented in different colors to indicate healthy and hypoxic (low oxygen) areas.
Figure 46 (c.f., [77]) visualizes a simulation that measures the average size of a tumor over time when treated with macrophages loaded with a drug called MSV-nab-PTX. It compares different treatment scenarios: one where both types of macrophages (M1 and M2) are active, one where only M1 macrophages are active, and two different treatment schedules (every 2 days and every 3 days) while keeping a specific ratio of M1 to M2 macrophages. The results help researchers understand how the presence and activity of these macrophage types affect tumor growth and treatment effectiveness.

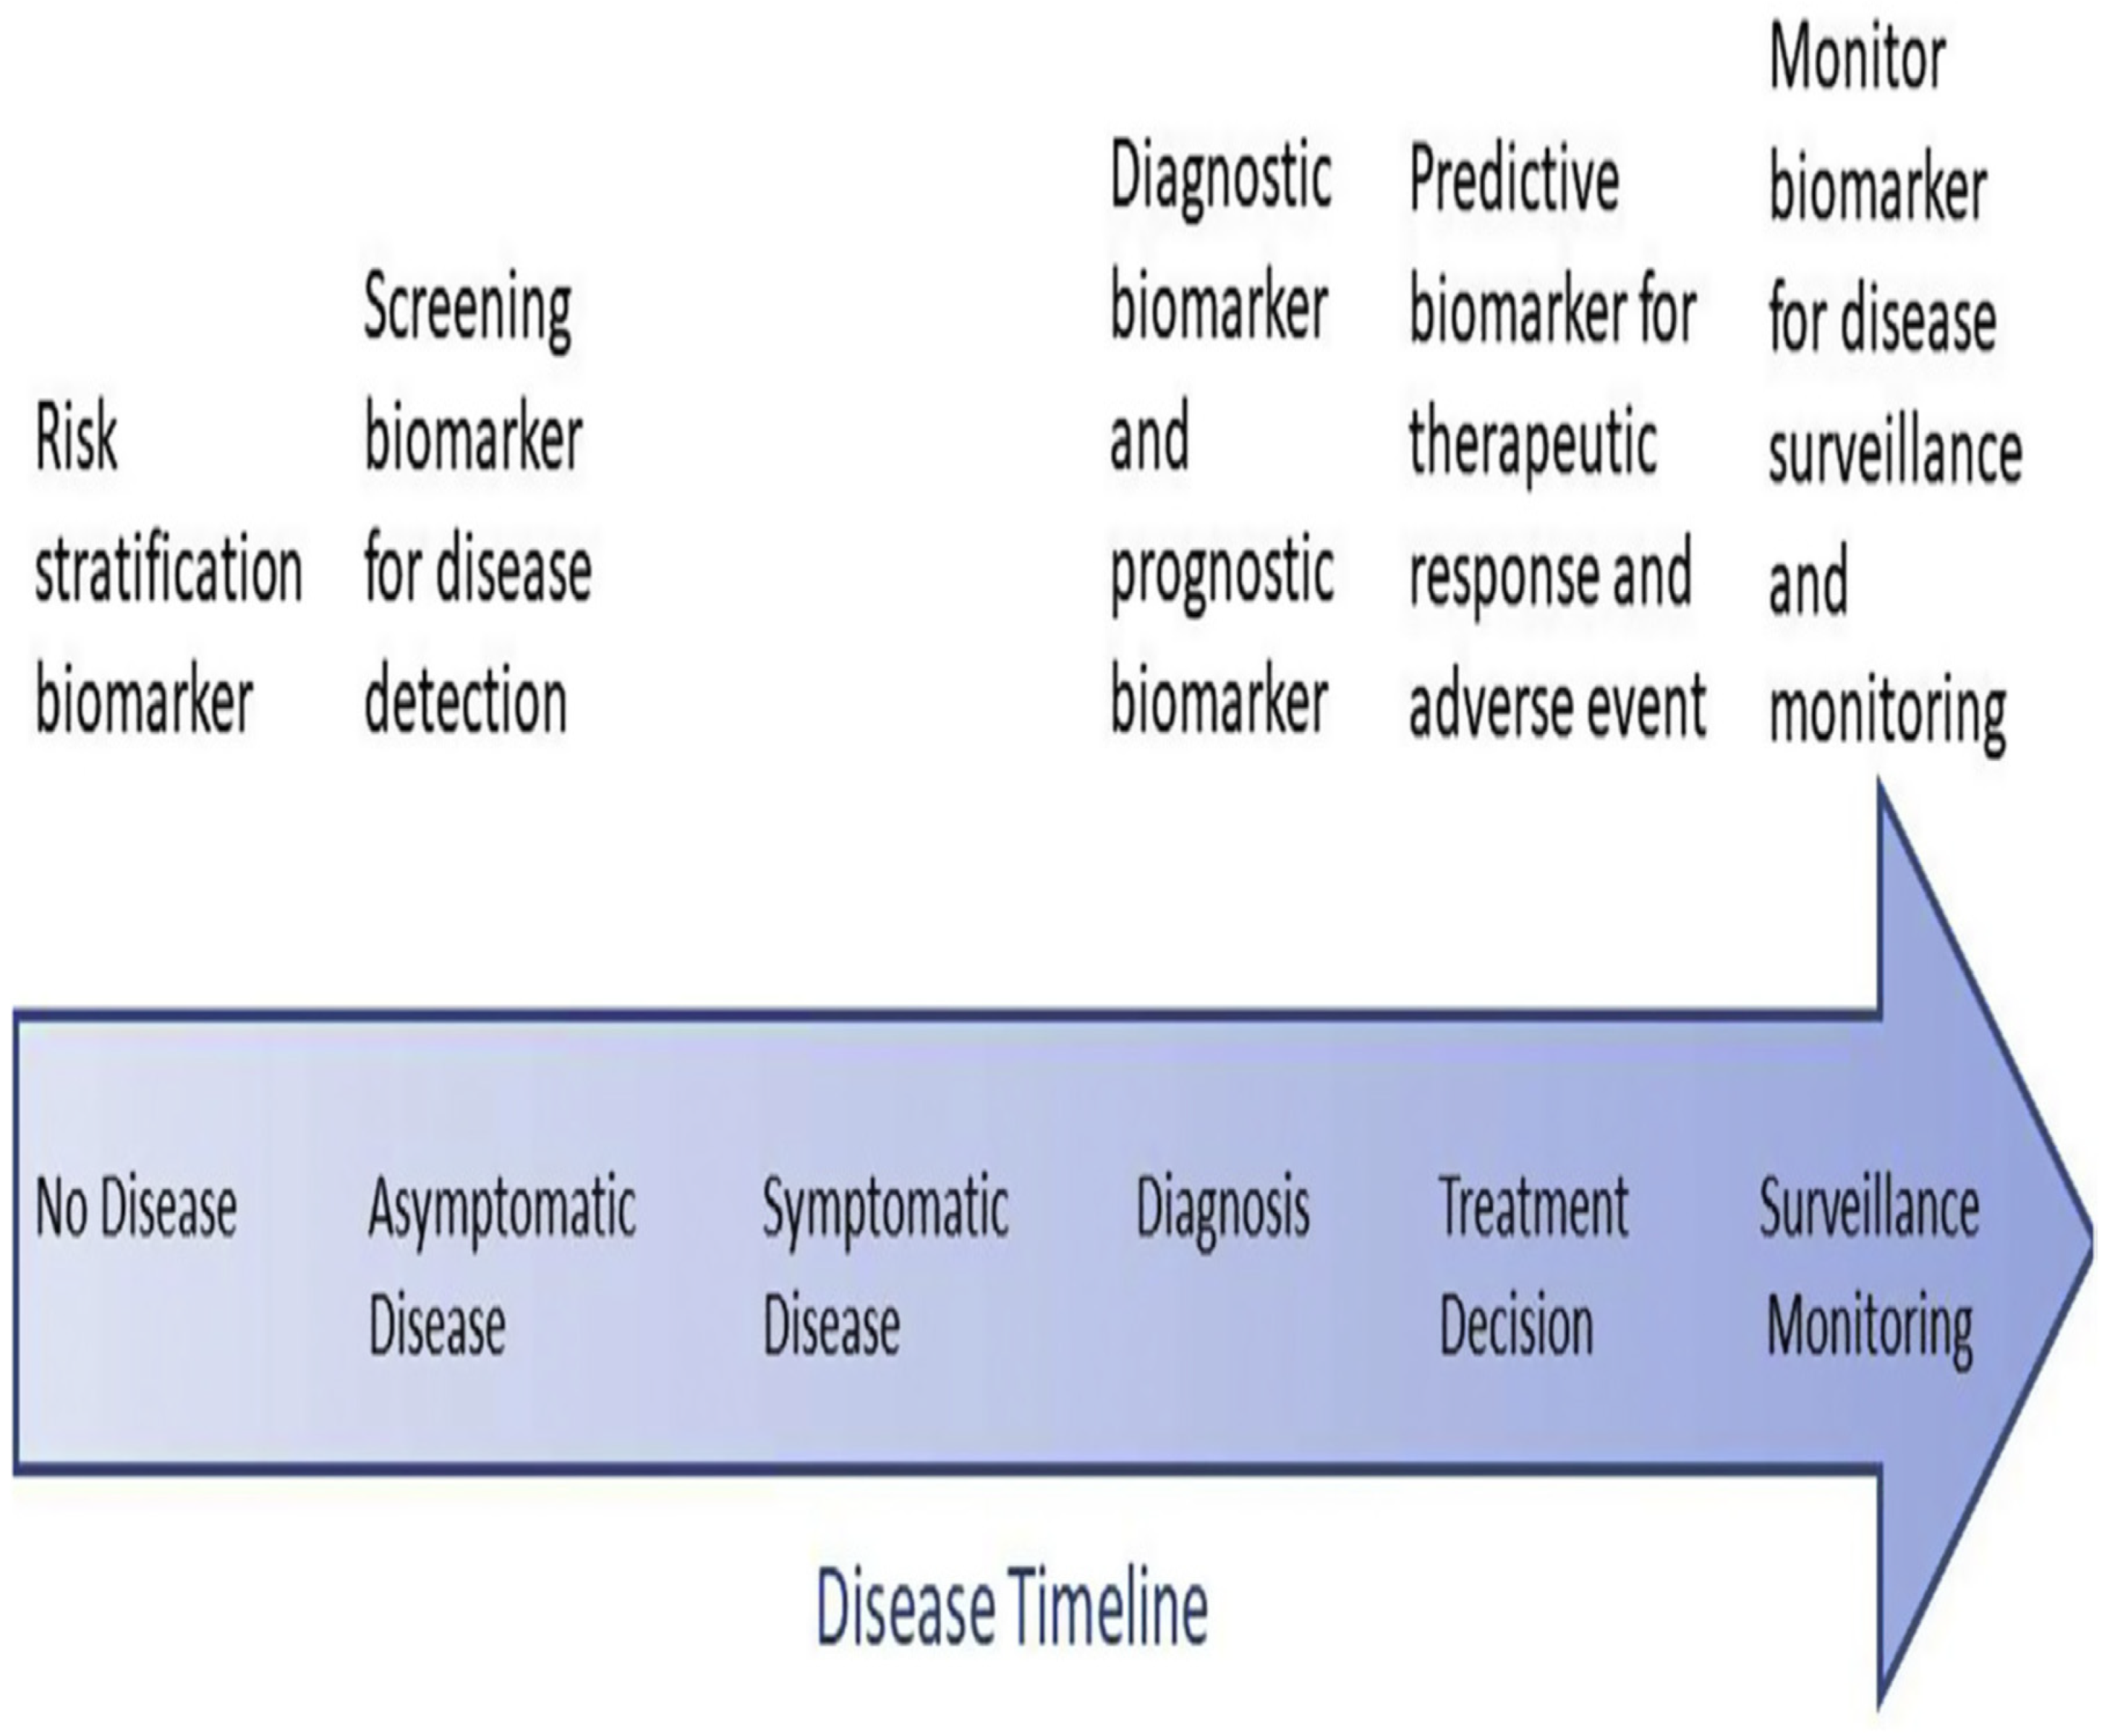
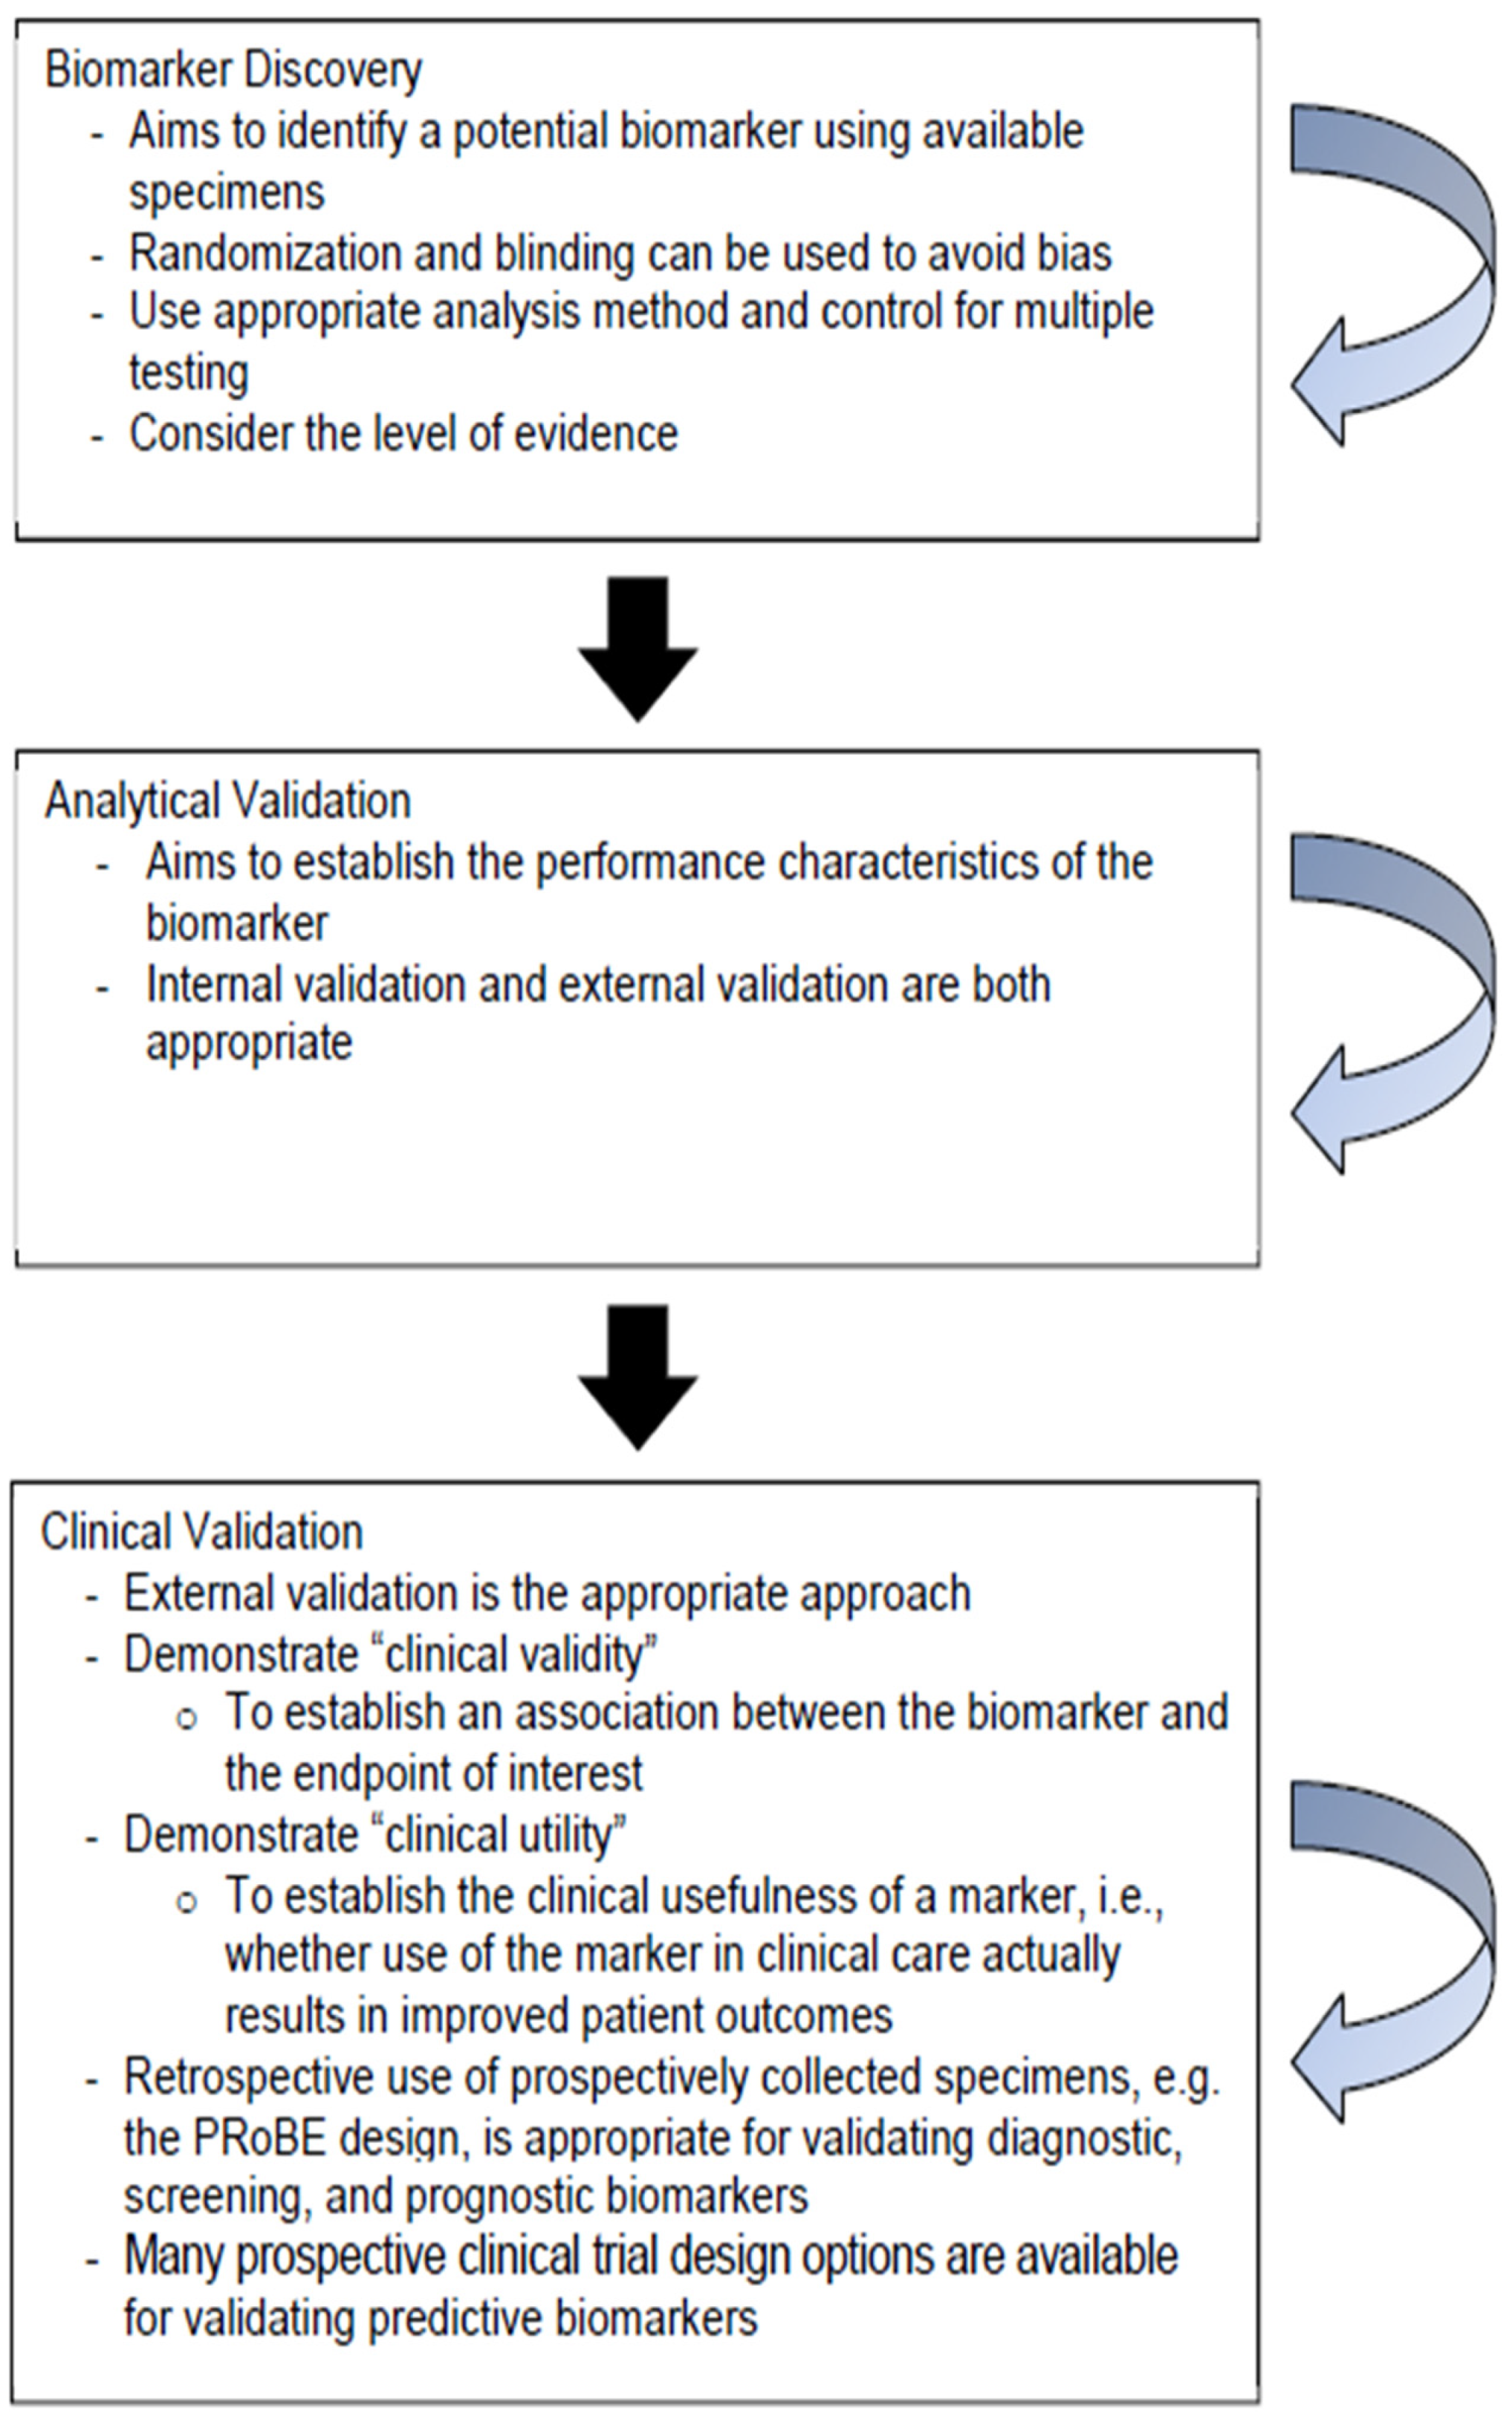
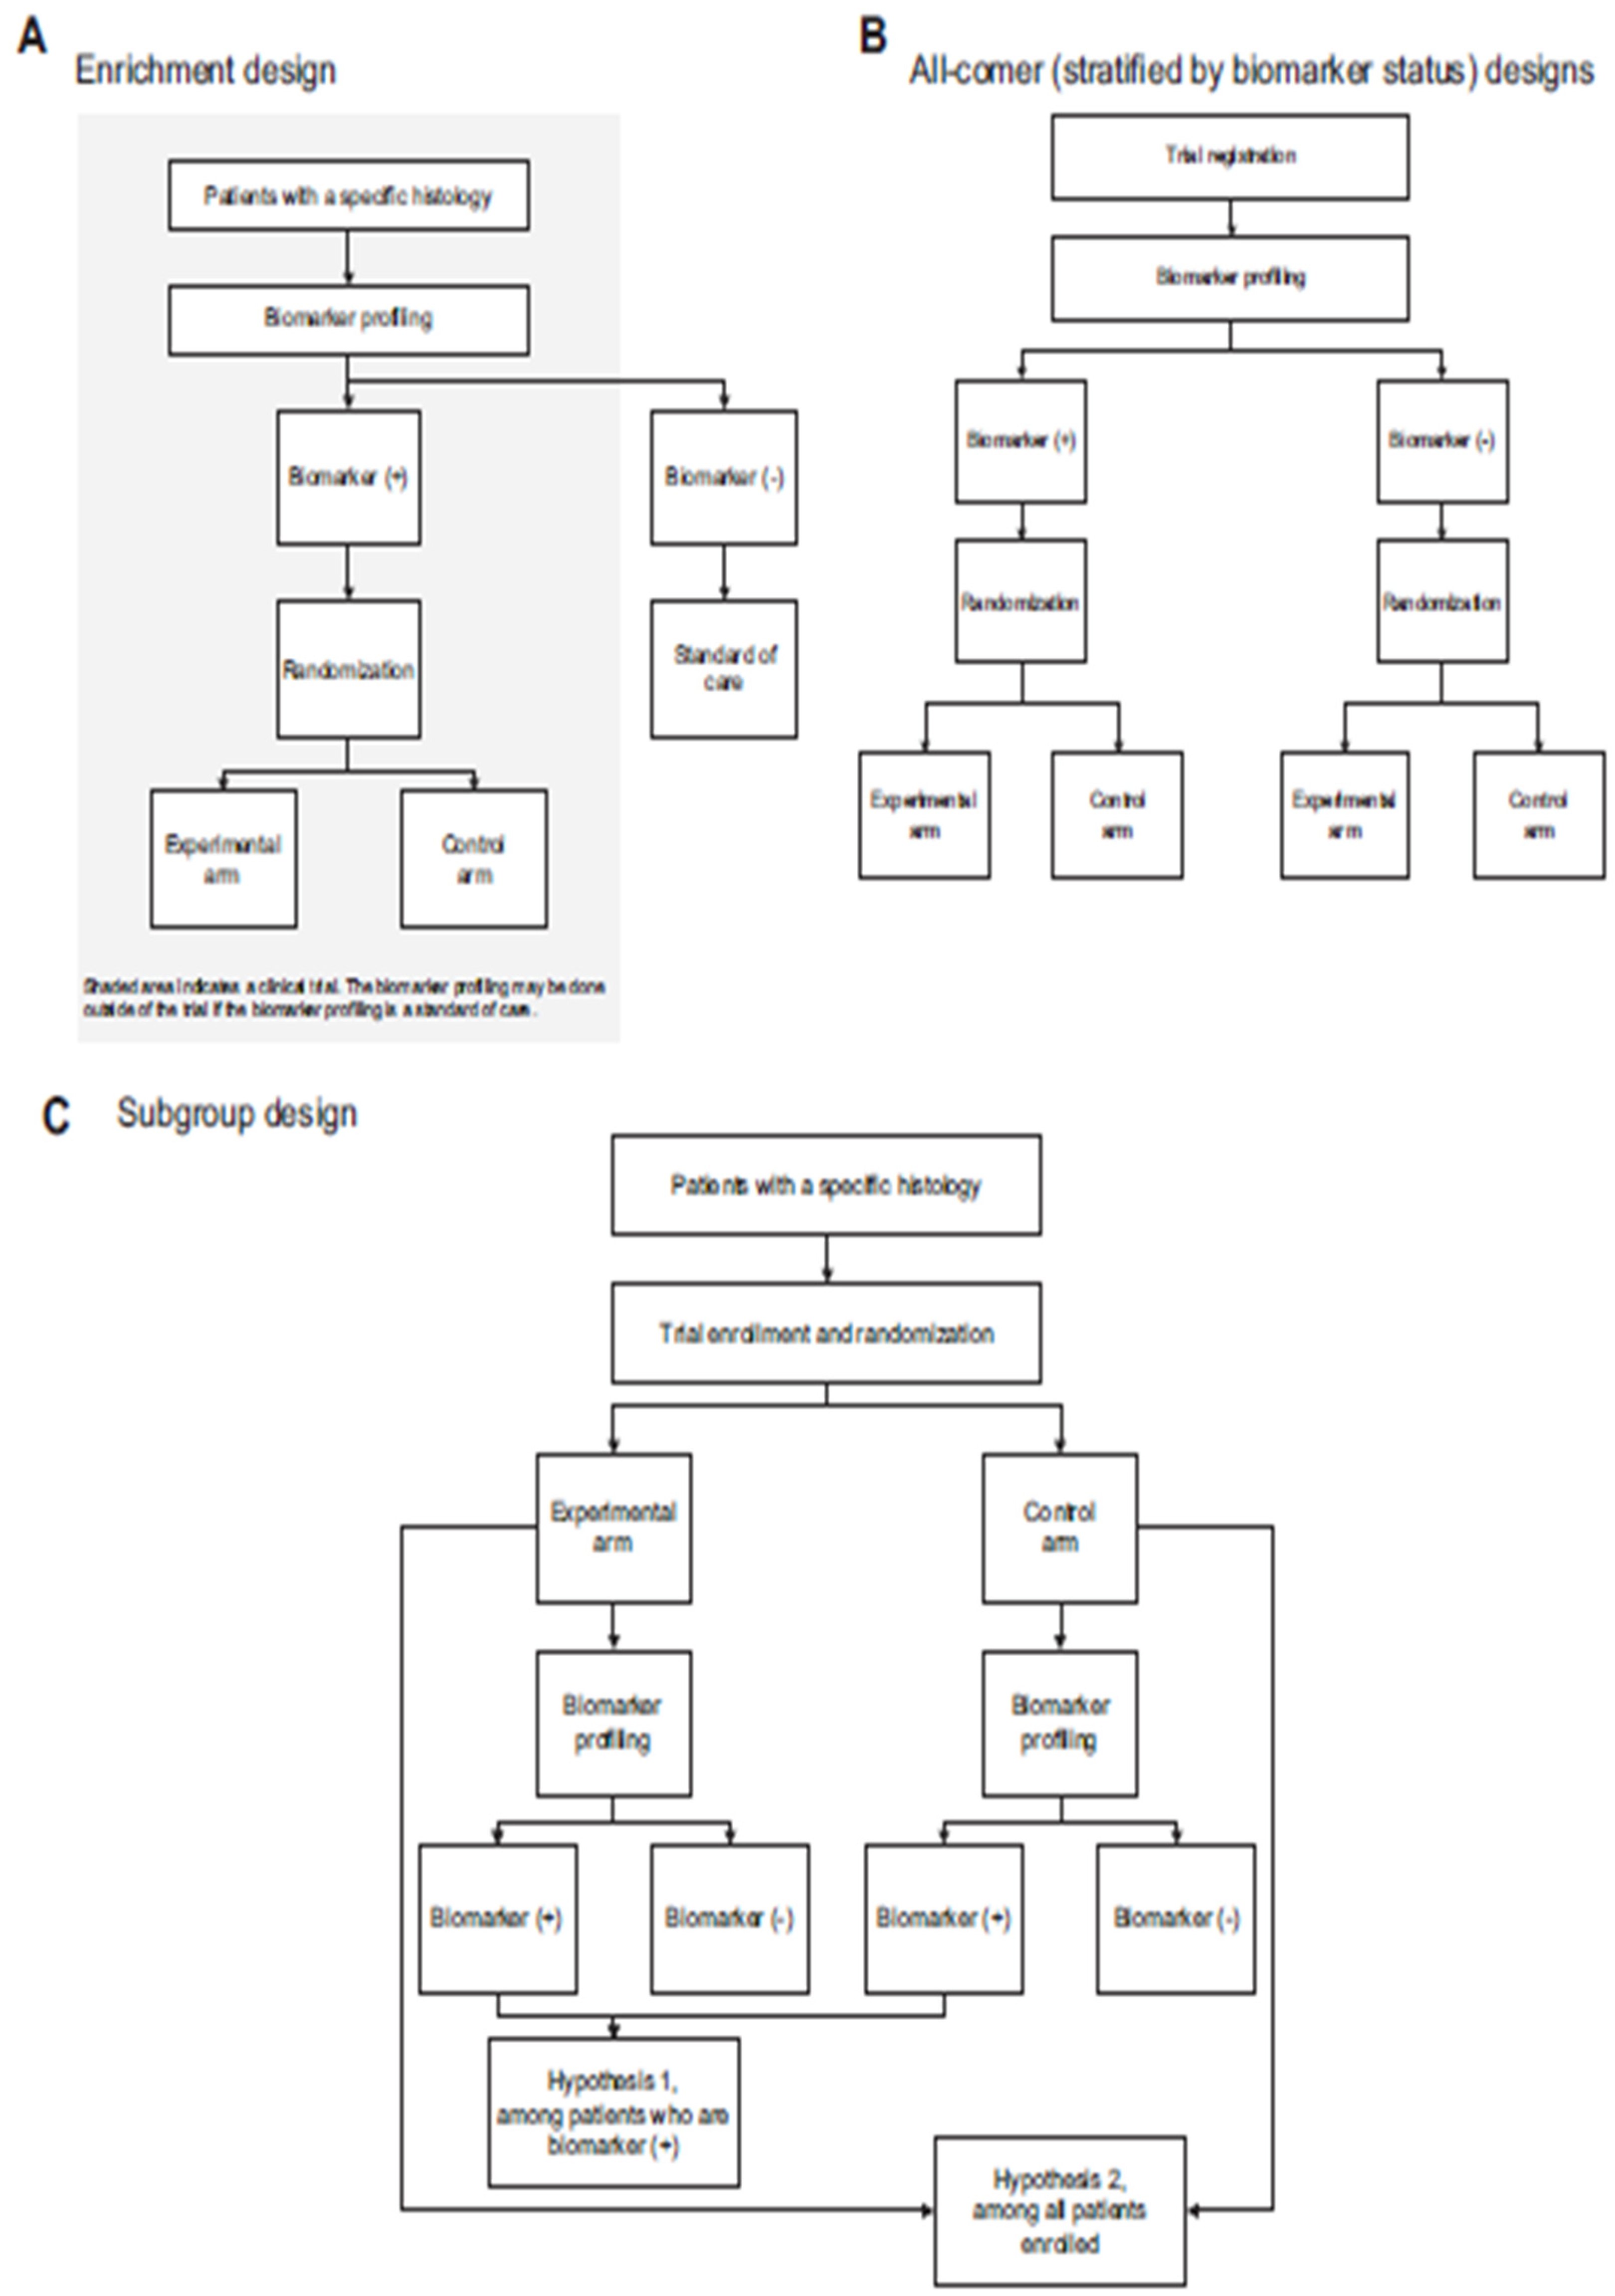
2.7. Tumor Biomarker Research

Tumor biomarker research [88,89,90,91,92,93,94,95,96,97,98,99,100,101,102,103,104,105,106,107,108] is an important field in cancer studies that focuses on finding specific biological markers related to tumors, which can help in diagnosing cancer, predicting its progression, and determining how well treatments will work. These biomarkers can be proteins [88,89,90,91,92,93,94,95,96,97,98,99,100,101,102,103,104,105,106,107,108], DNA fragments, or small RNA molecules found in blood or tumor tissues. The research aims to improve personalized cancer care by using advanced techniques and technologies, including AI, to better understand and treat different types of cancer.
Pooling biomarker data [88] from different studies means combining information to better understand health risks, like the relationship between vitamin D levels and stroke risk. This approach increases the sample size [88], leading to more accurate estimates and the ability to analyze different groups or conditions. In principle, the authors [88] have explored methods for analyzing this pooled data, focusing on how to adjust for differences in measurements across studies to ensure reliable results.
A visualization on how different methods for analyzing data perform as more participants are included in a calibration study, was offered by Figure 47 (c.f., [88]), which is a process used to improve the accuracy of measurements. In this case, the total number of participants in each study is kept constant at 1,000, but the proportion of those participants who take part in the calibration study varies at 5%, 15%, or 25%. The results are organized into panels [88], with some panels using a “controls-only” design and others using a “random sample” design, allowing for a comparison of how these different approaches affect the outcomes.
Biomarkers are measurable indicators used in medicine to help with various tasks [89], such as detecting diseases, diagnosing conditions, predicting how patients will respond to treatments, and monitoring disease progression. In the context of precision medicine [89], validated biomarkers are crucial for making informed clinical decisions tailored to individual patients. The authors [89] discussed best practices for discovering and validating these biomarkers and emphasizes the importance of collaborative research to improve patient care and outcomes.
Figure 48 (c.f., [89]), the use of biomarkers in relation to the course of disease refers to how specific biological indicators can help track the progression of a disease and inform treatment decisions. Biomarkers can indicate the presence of a disease [89], predict outcomes, and guide therapy choices based on a patient’s unique characteristics. Understanding how these biomarkers relate to different stages of a disease is crucial for developing effective diagnostic and treatment strategies.
Figure 49 (c.f., [89]) visually explores the simplified schematic of biomarker development illustrates the process of identifying and validating biomarkers, which are biological indicators used to predict disease outcomes or responses to treatment. The PRoBE design stands for “prospective-specimen-collection, retrospective-blinded-evaluation,” meaning that samples are collected in advance from patients, but the evaluation of these samples is done later without knowing the outcomes to avoid bias. This approach helps ensure that the biomarkers identified are reliable and clinically useful in improving patient care.
The trial design schema refers to different methods used in clinical trials to evaluate treatments based on the presence of specific biomarkers in patients, as depicted in Figure 50(c.f., [89]). In (A) the enrichment design, only patients with the desired biomarker are included in the trial, which is useful when the biomarker is rare. In (B) the all-comer design, all patients are enrolled but are analyzed based on their biomarker status, while (C) the subgroup design focuses on specific groups of patients based on their biomarker results, allowing researchers to assess treatment effects in those populations.
All-comer designs [89] in clinical trials involve screening all patients for specific biomarkers and then enrolling those with valid results to study how different treatments affect them. This approach [89] helps researchers understand the effectiveness of treatments for both patients who test positive and those who test negative for the biomarker. An example is the MARVEL trial, which aimed to compare two cancer treatments based on patients’ EGFR expression status [89], allowing for a more comprehensive analysis of treatment benefits.

3. Conclusion, Open Problems and Futuristic Research Avenues

To substantiate the impact of mathematics on the advancement of cancer treatment, an explanation is provided. This triggers the following open problems:
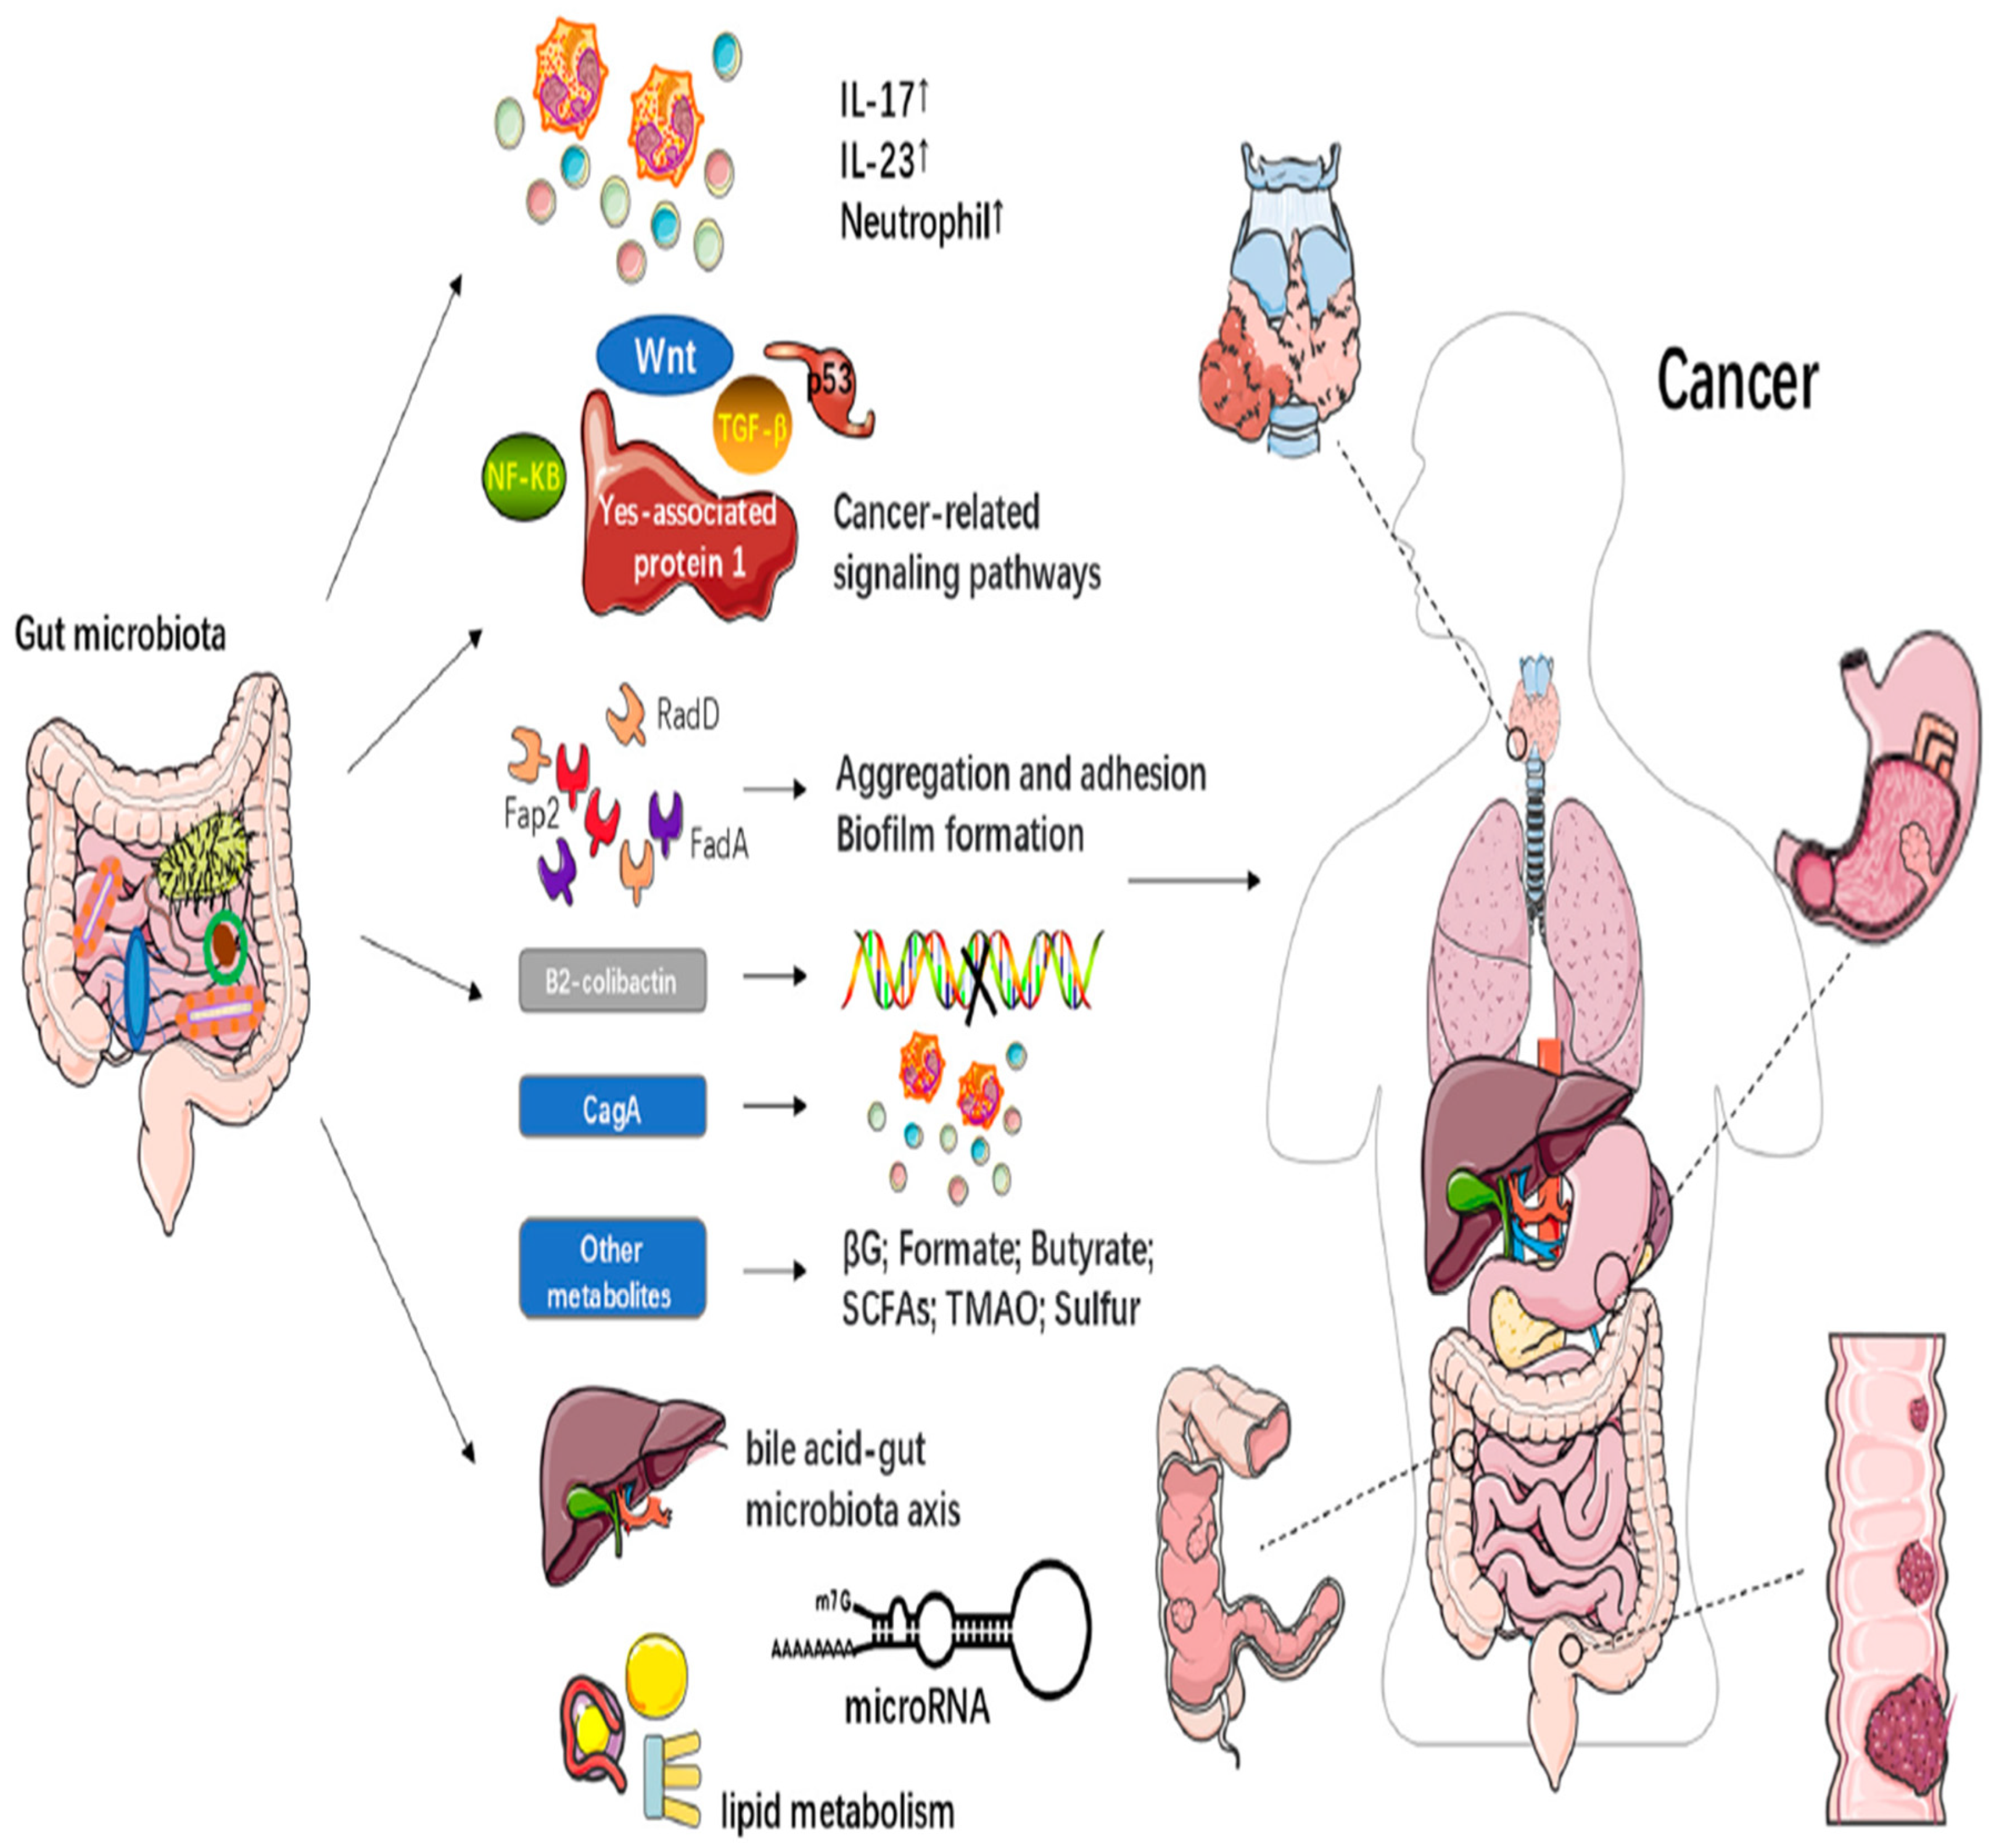
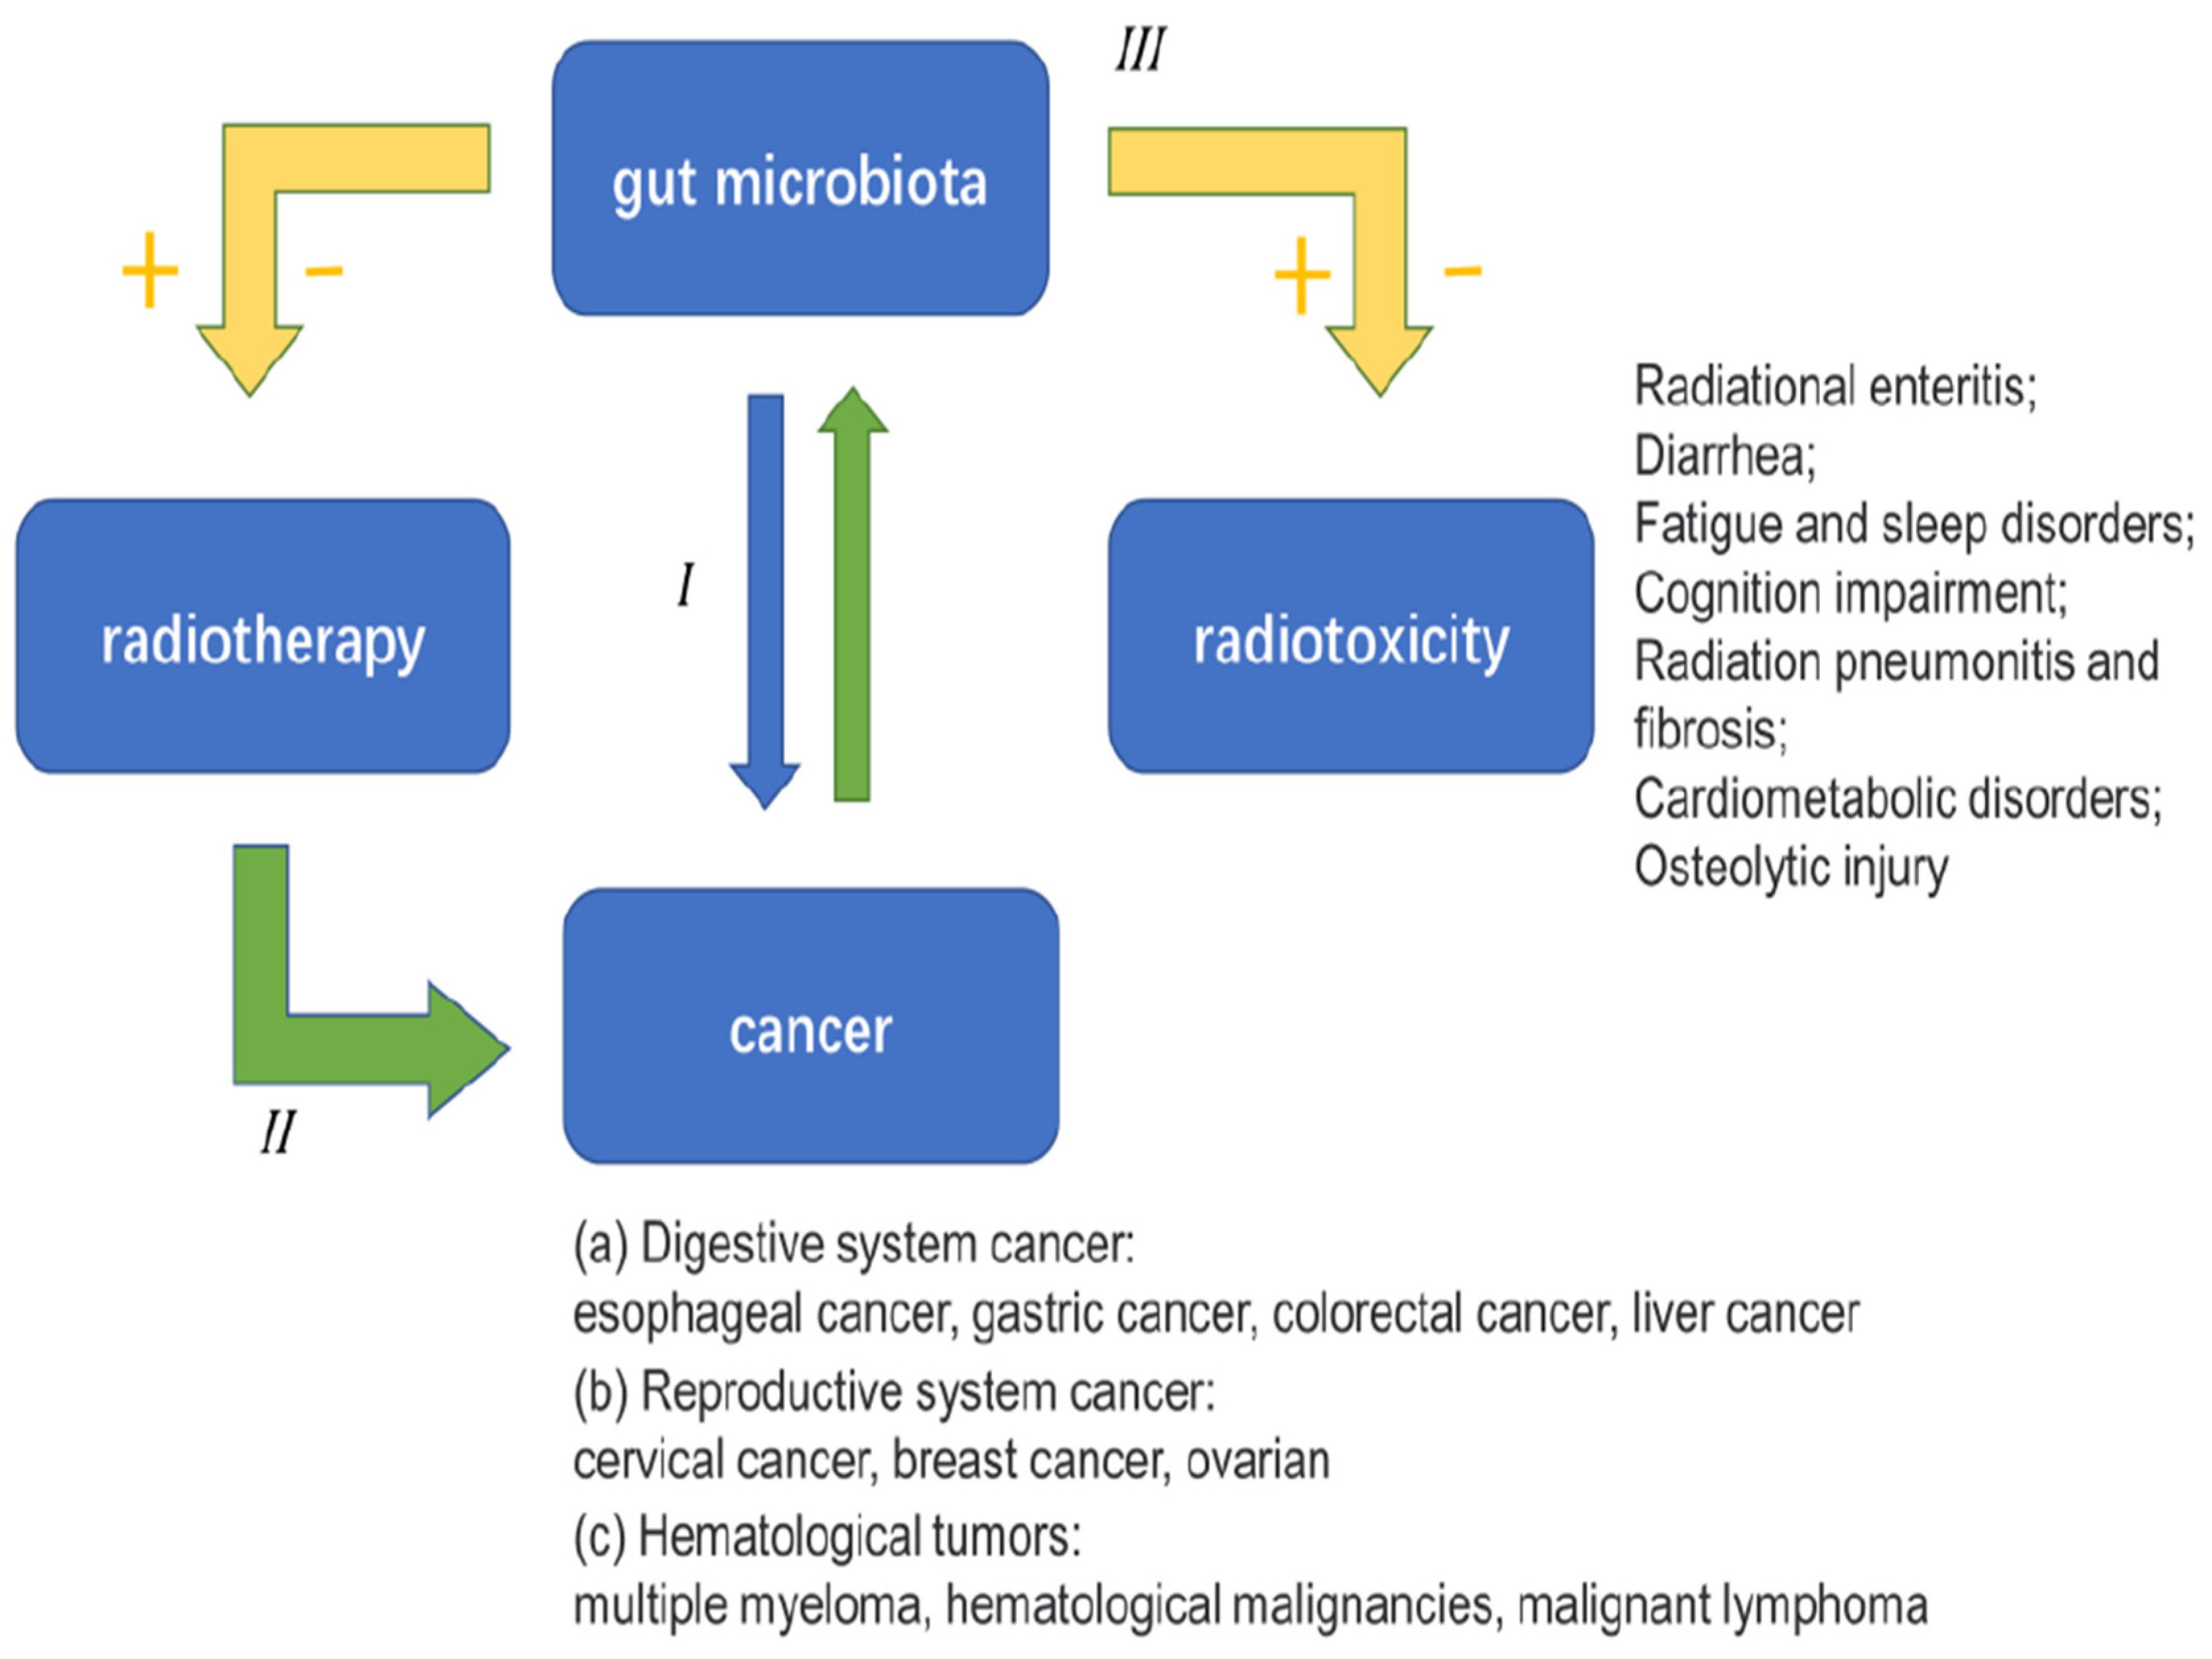
  • Current research [4]does not fully explain how gut microbiota influences the effectiveness of radiotherapy and the serious side effects that can occur. Some scientists suggest that gut microbiota might play a role in the immune responses related to radiotherapy, but there is no direct evidence to support this. Understanding the connections between gut health and radiotherapy side effects could be a promising area for future research, potentially leading to new ways to reduce these side effects and enhance cancer treatment.
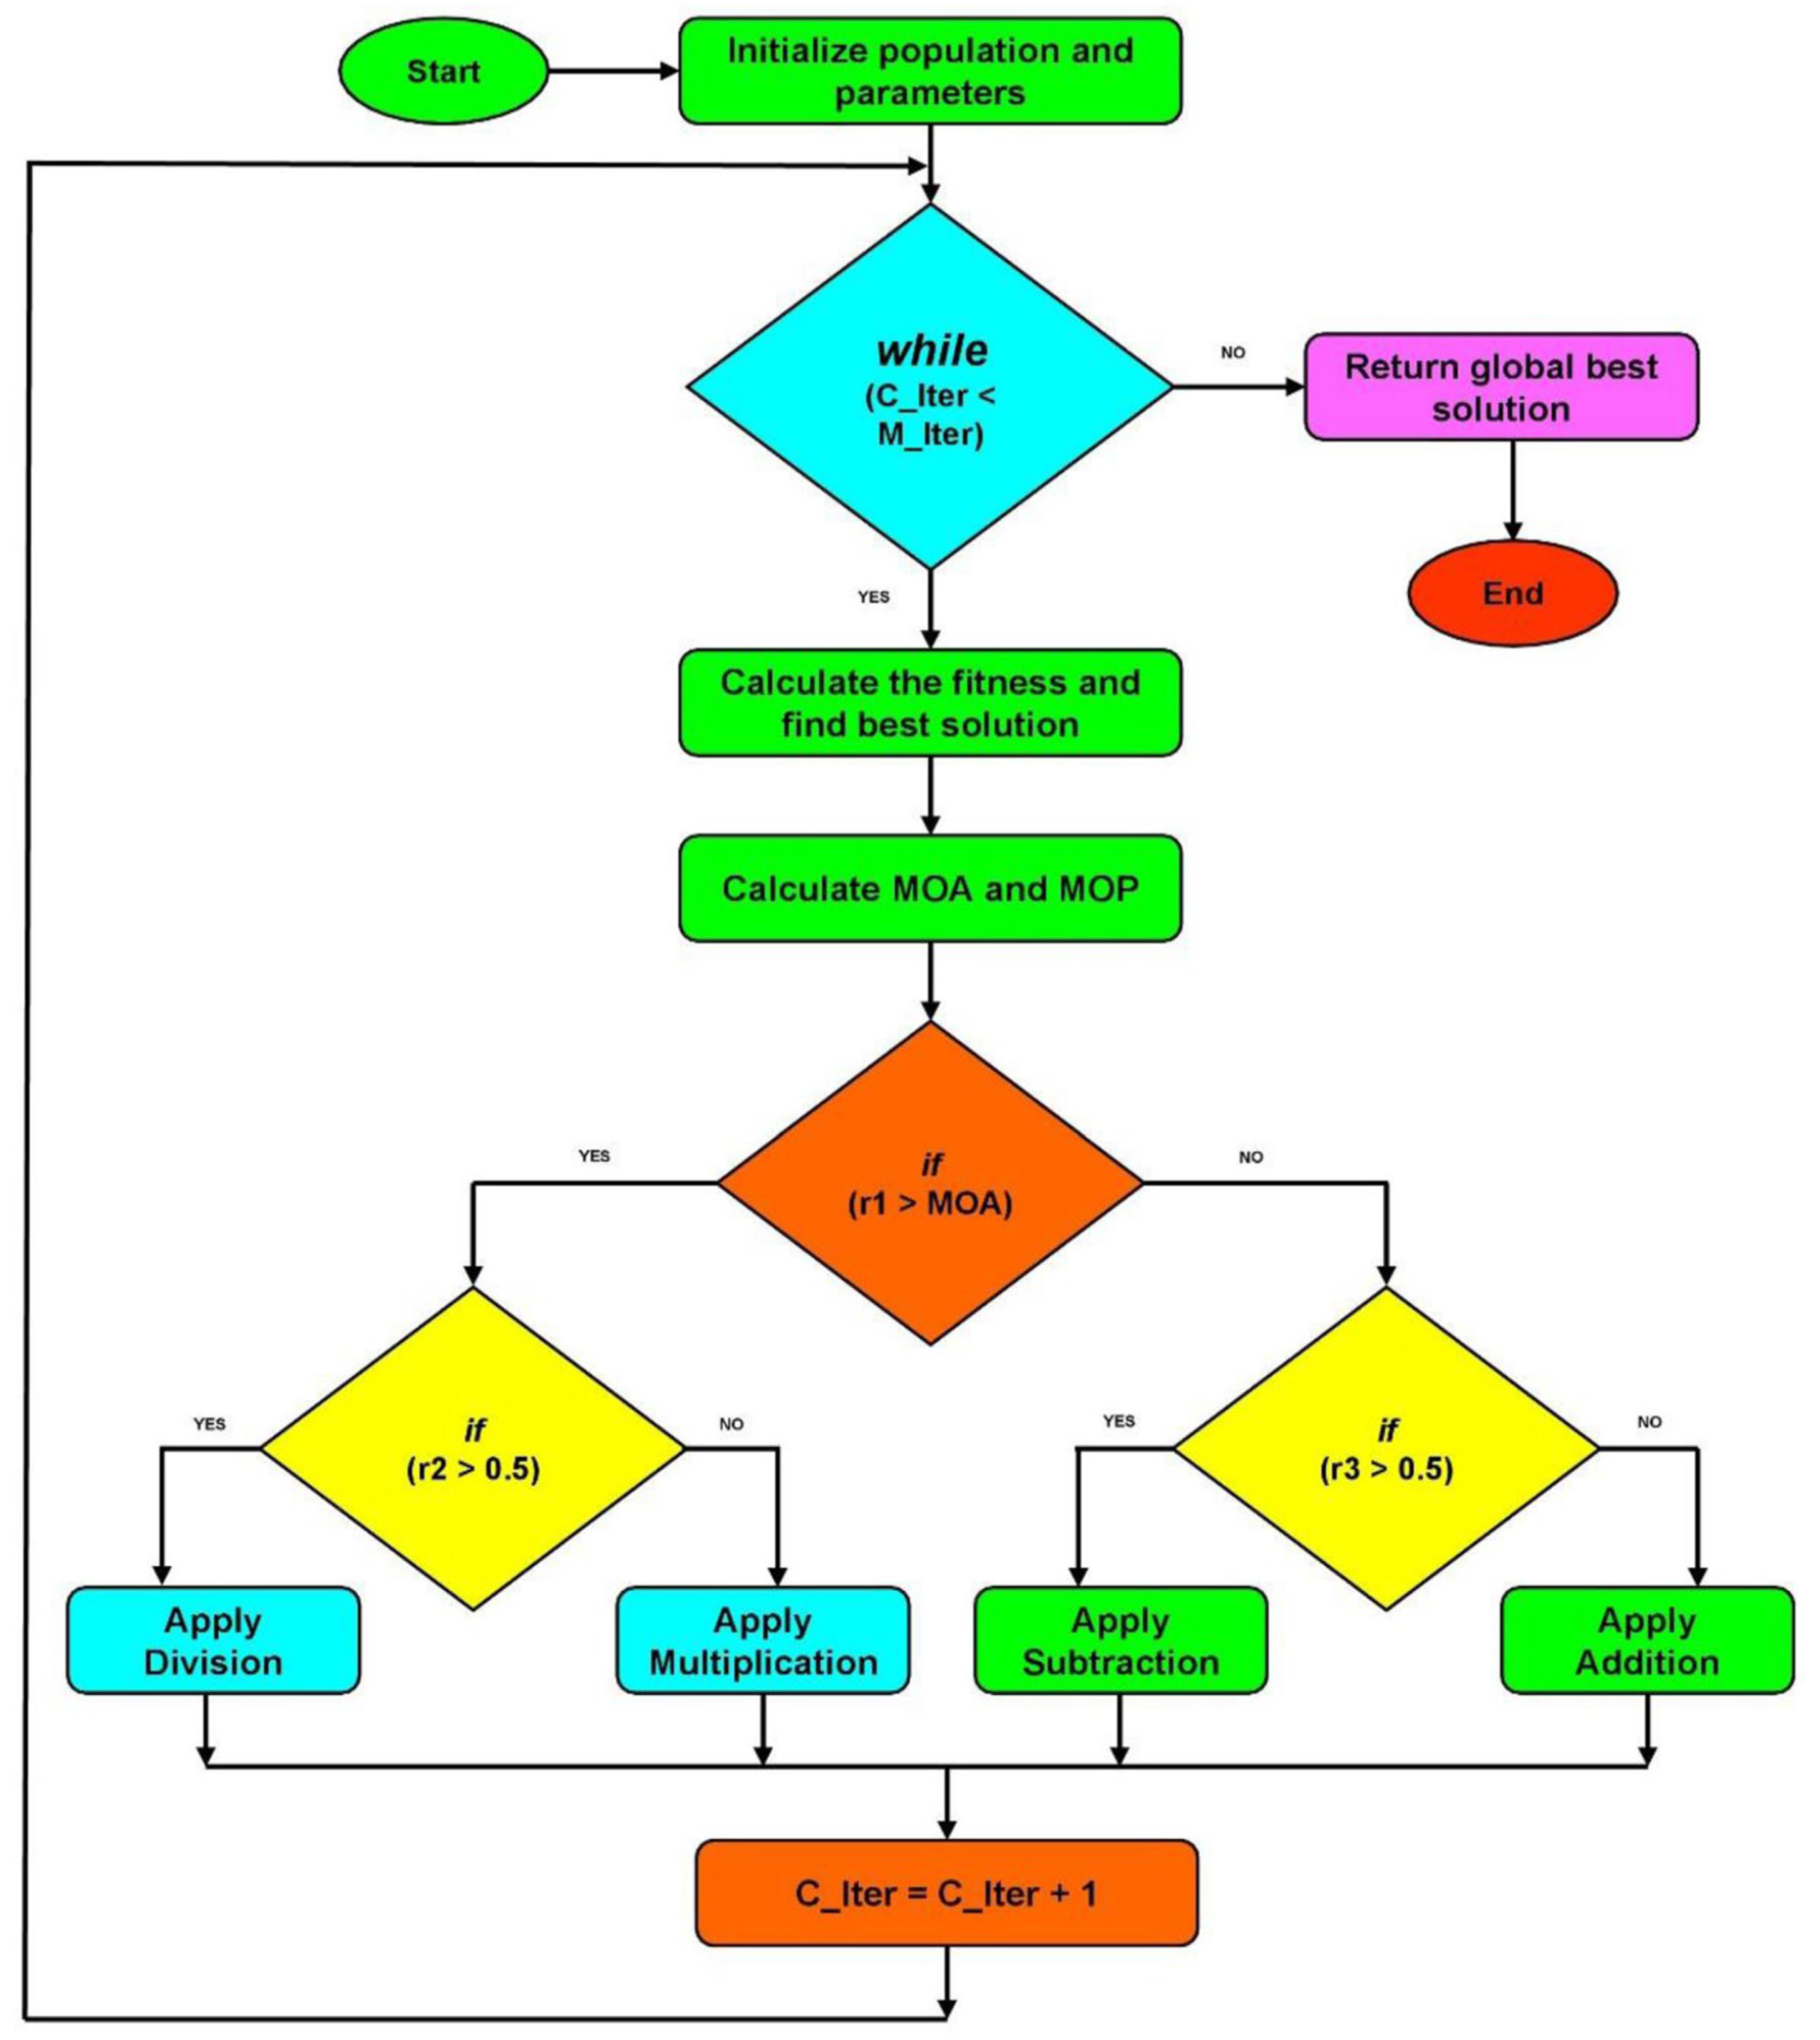
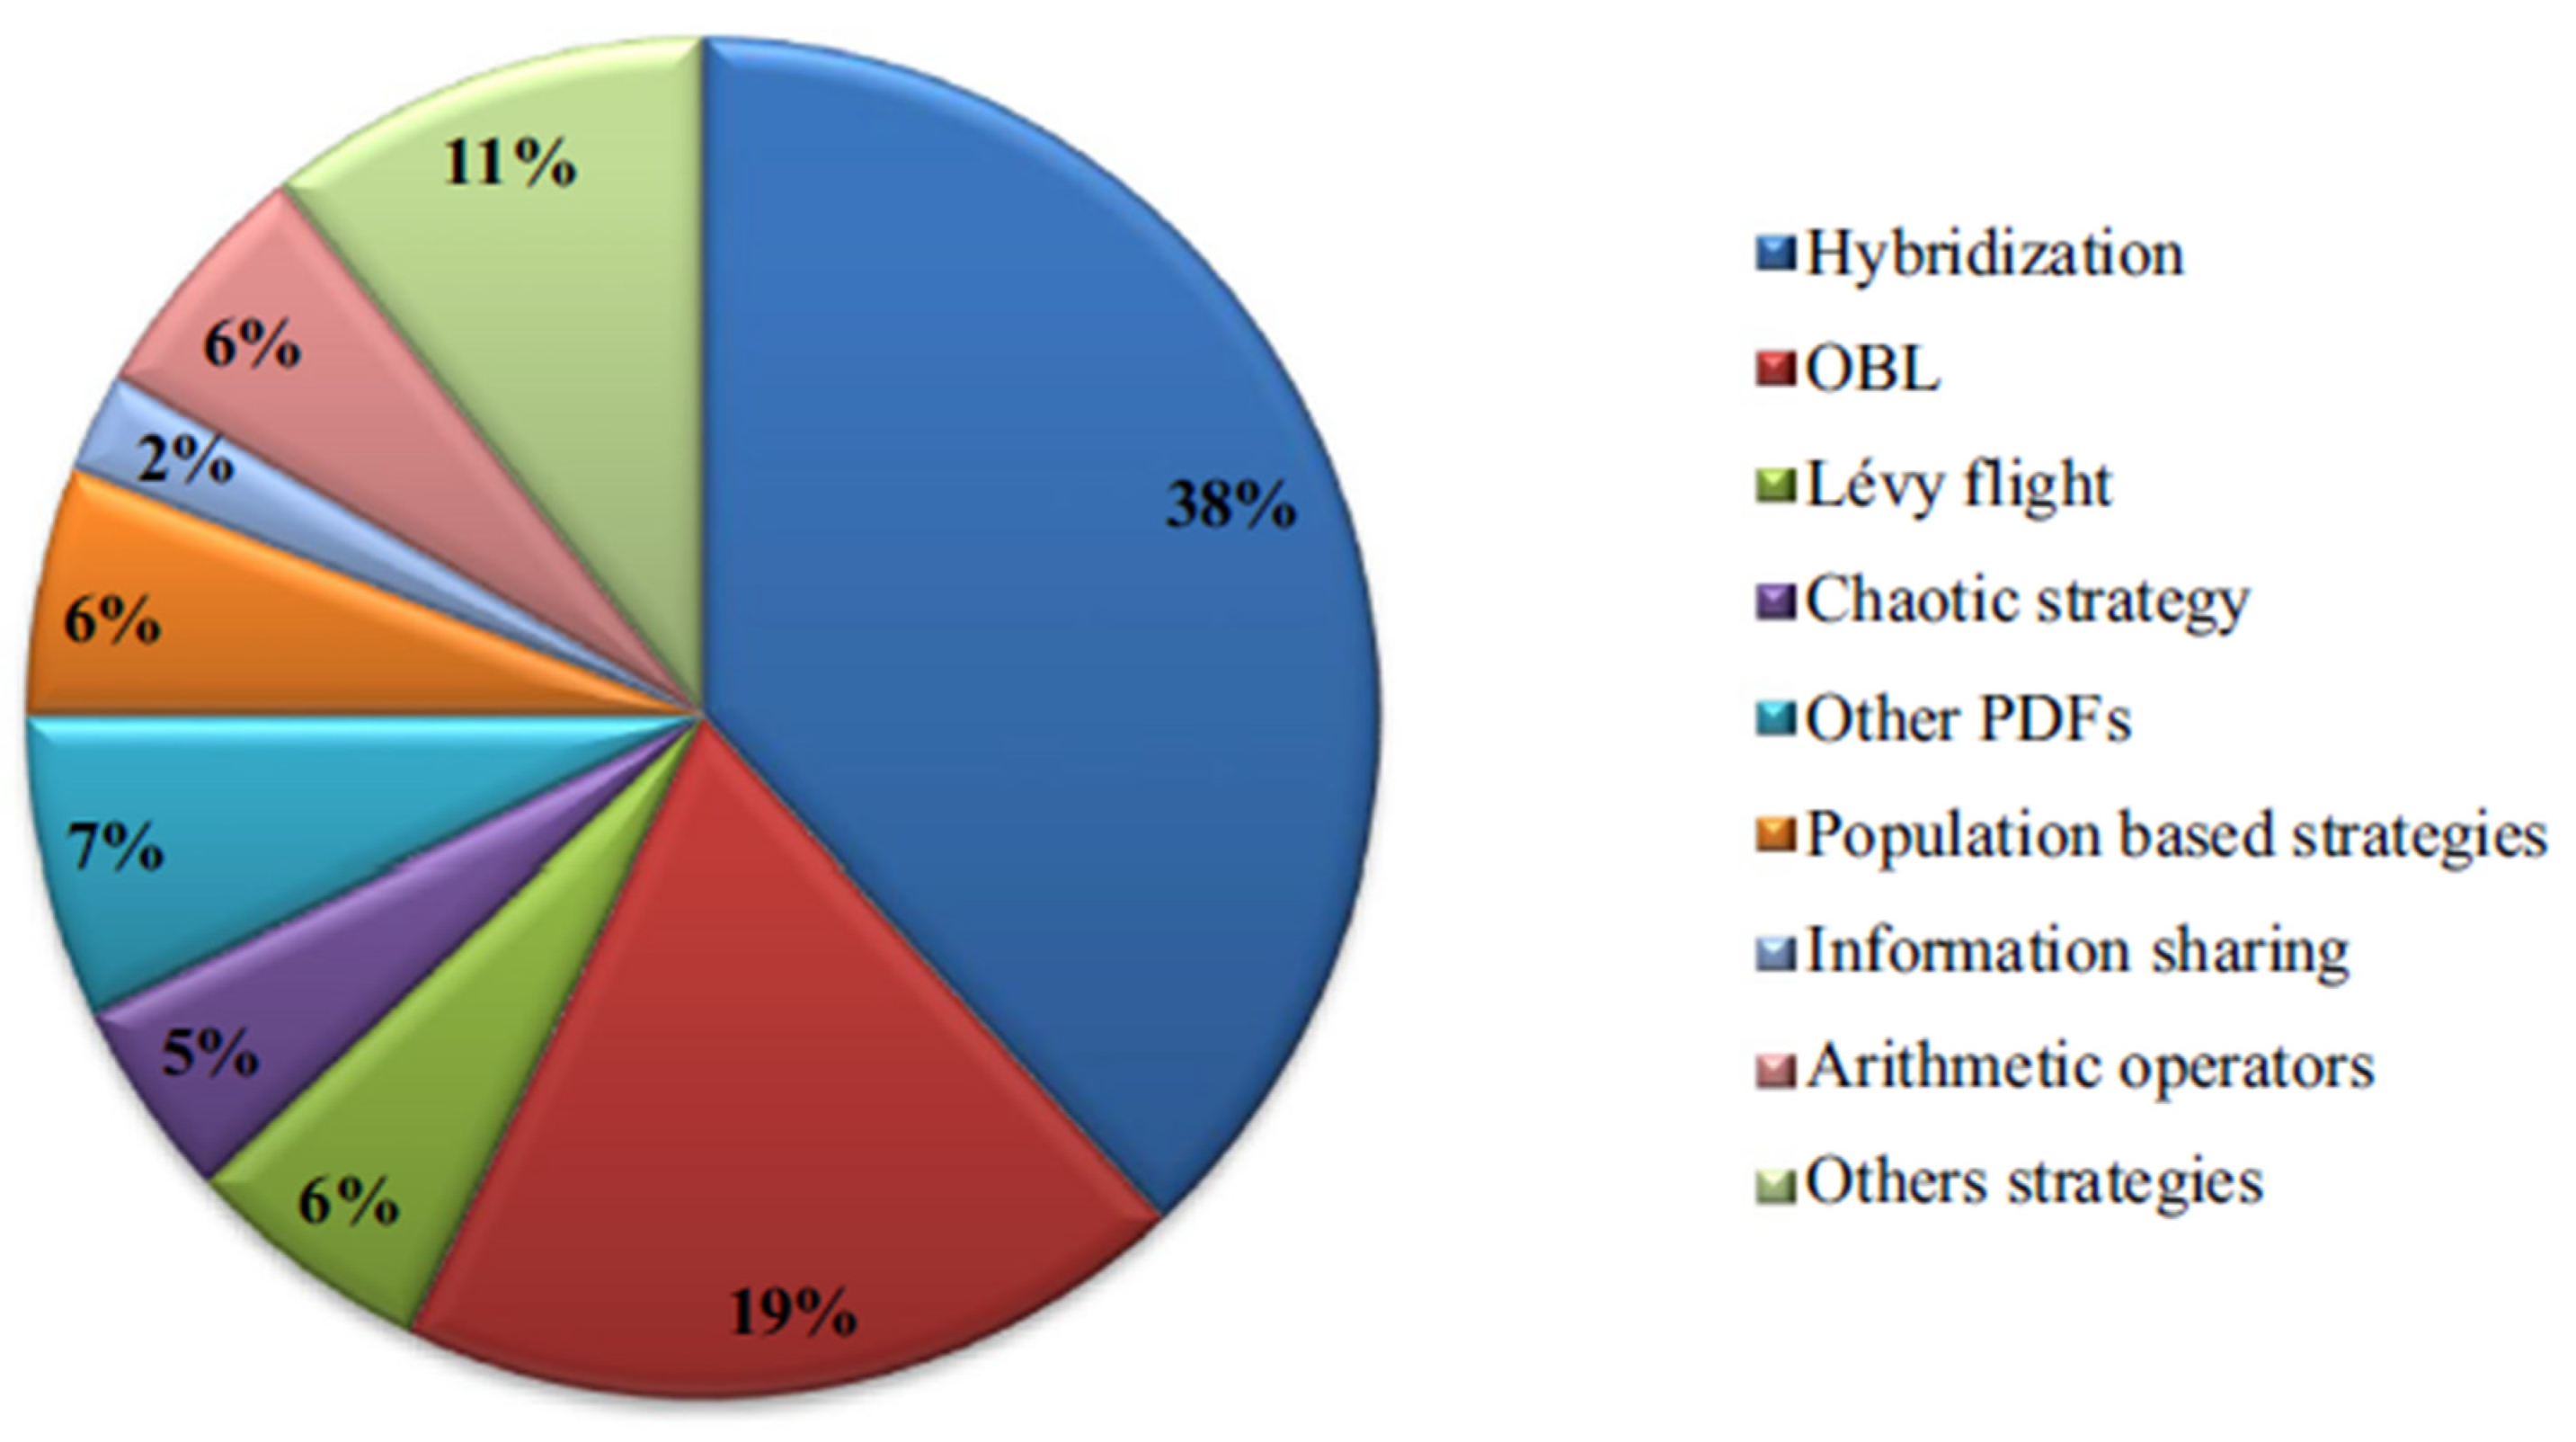
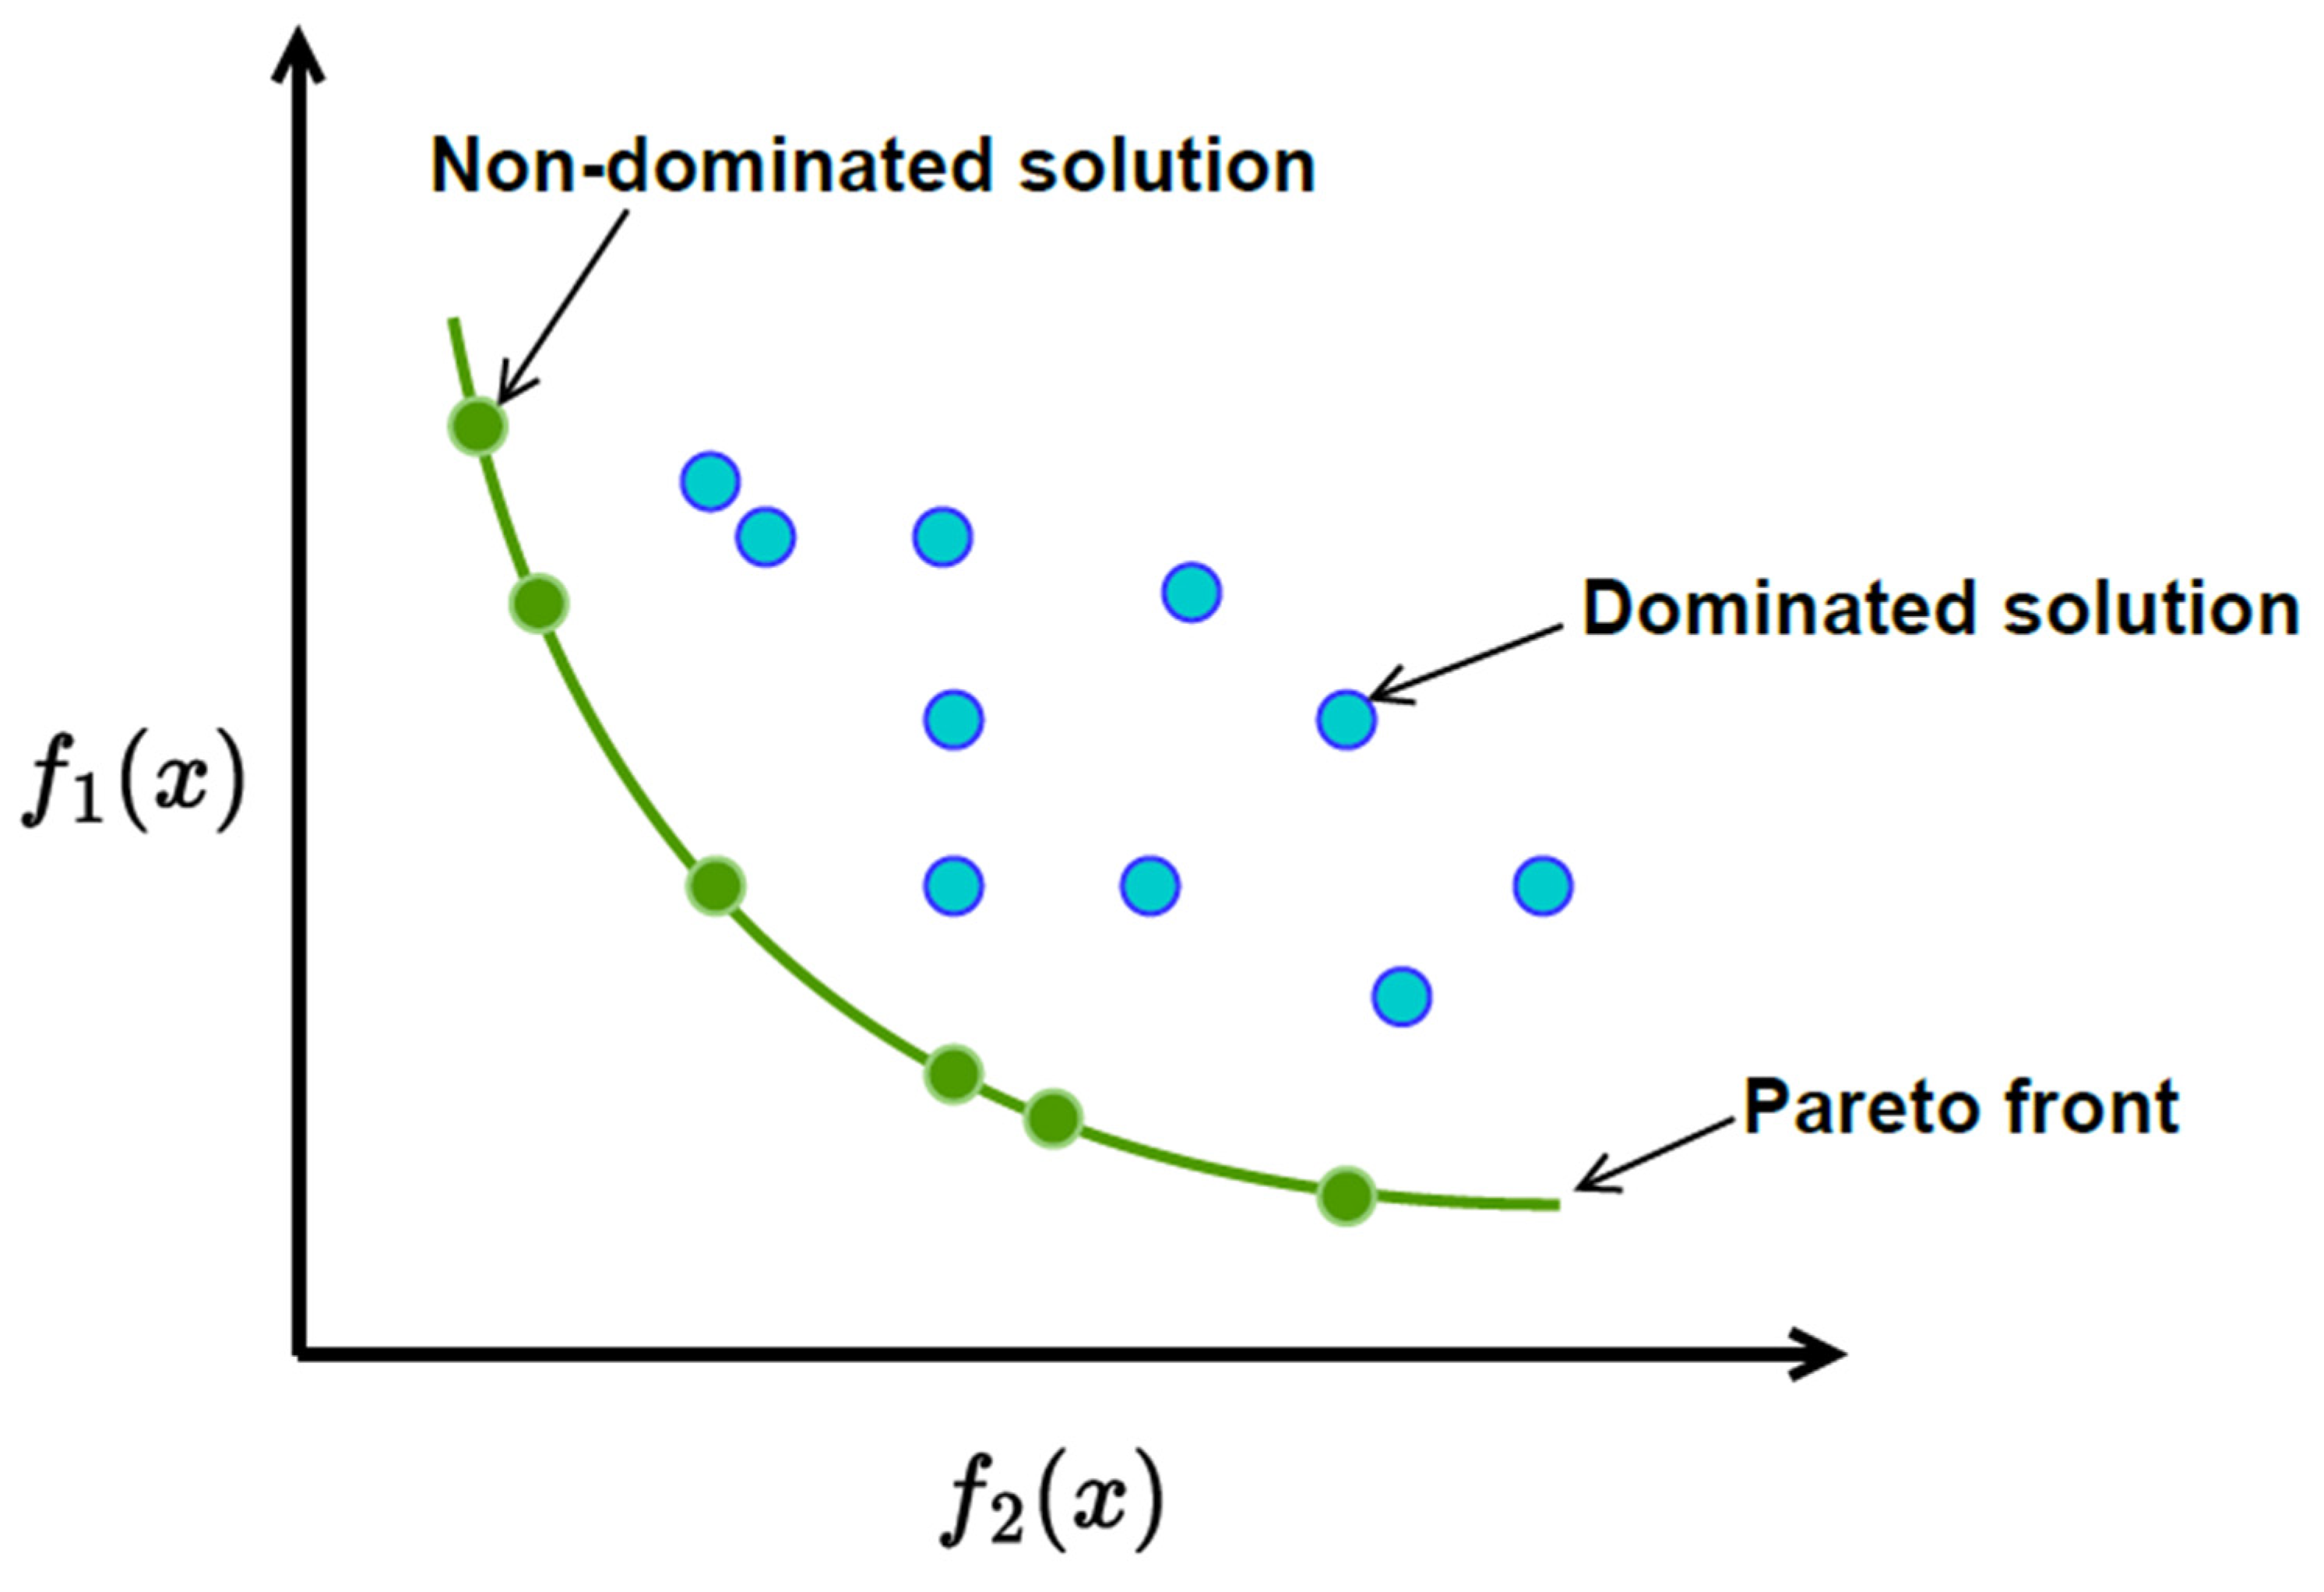
  • The undertaken exposition in [11] has emerged some open problems, for example, improving the AOA (Arithmetic Optimization Algorithm). It suggests that more research should focus on adapting parameters like population size to make AOA more flexible for different problems. Additionally [11], it emphasizes the need for better communication and information sharing among solutions, exploring its applications in areas like machine learning and computer vision, and developing a mathematical framework to enhance understanding and effectiveness.
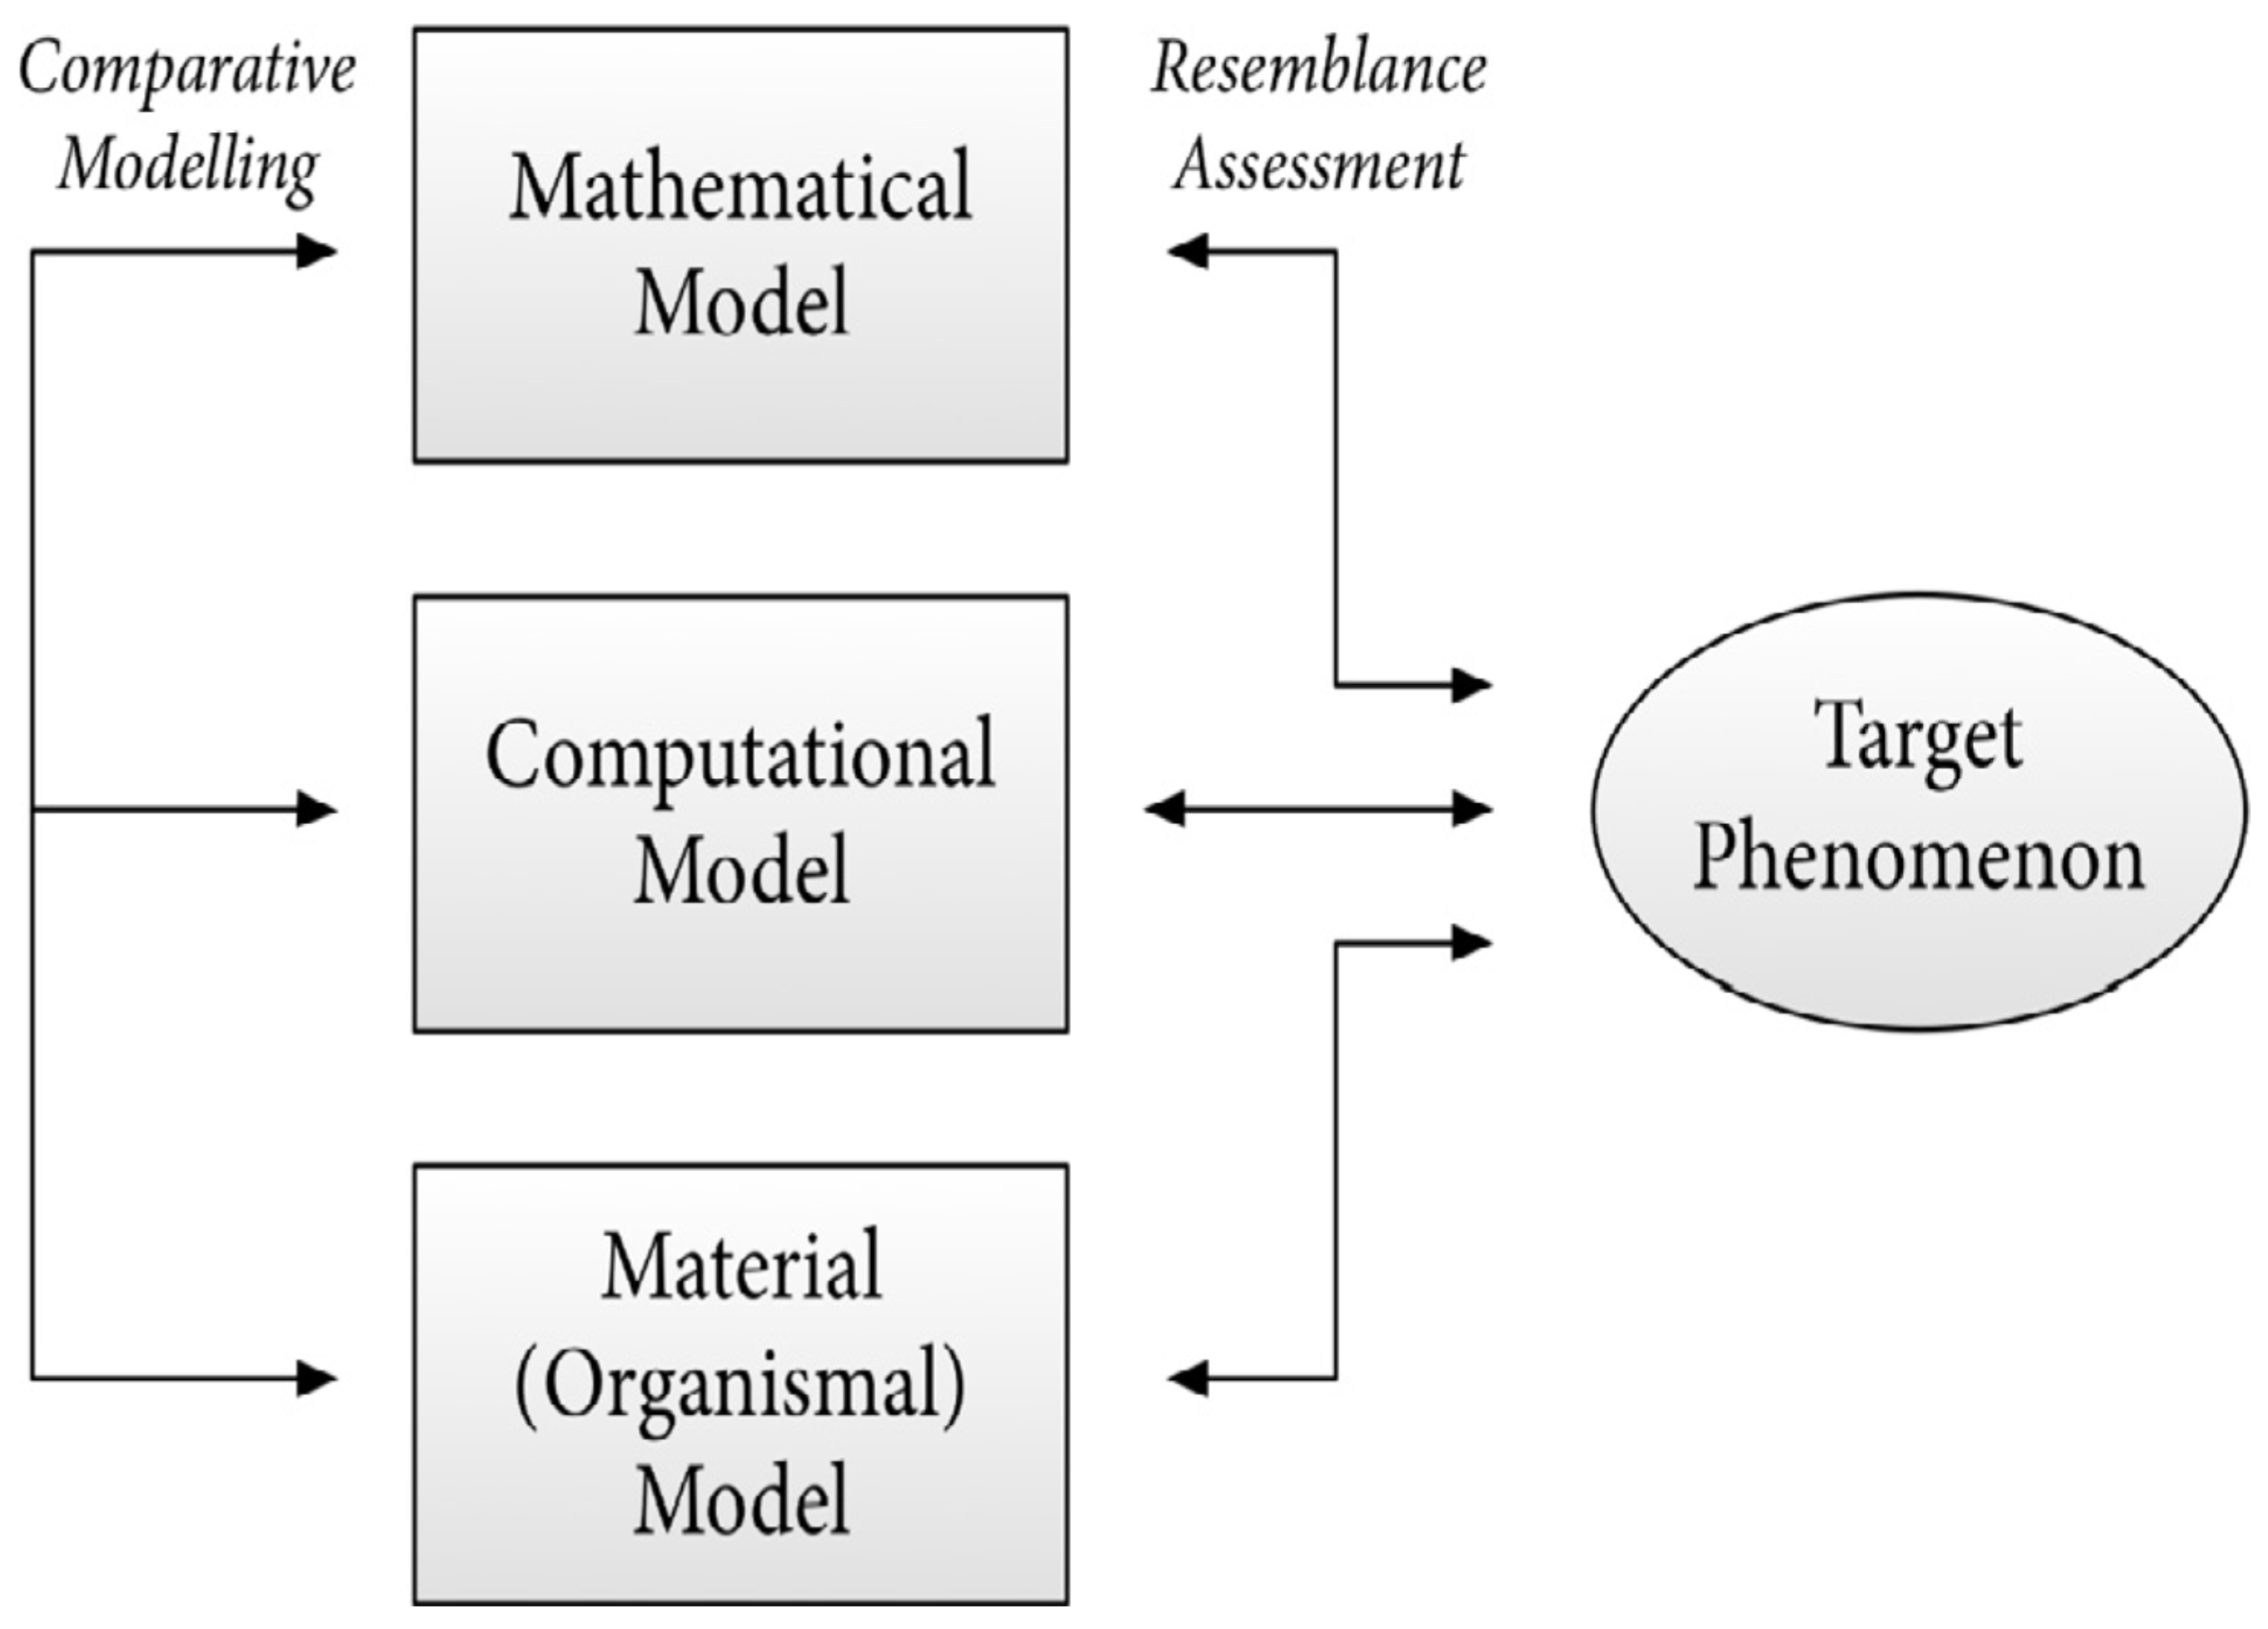
  • It is acknowledged that while microbial and bacterial models offer many practical benefits for research, these advantages are not unique to microorganisms alone; other types of organisms can also provide useful insights. This triggers an open problem, yet unsolved till current, namely, exploring the history of microbial models to help researchers better understand the philosophical aspects of using multiple models in scientific research. This deeper understanding could enhance the undertaken scientific approach and interpret findings across different biological systems.
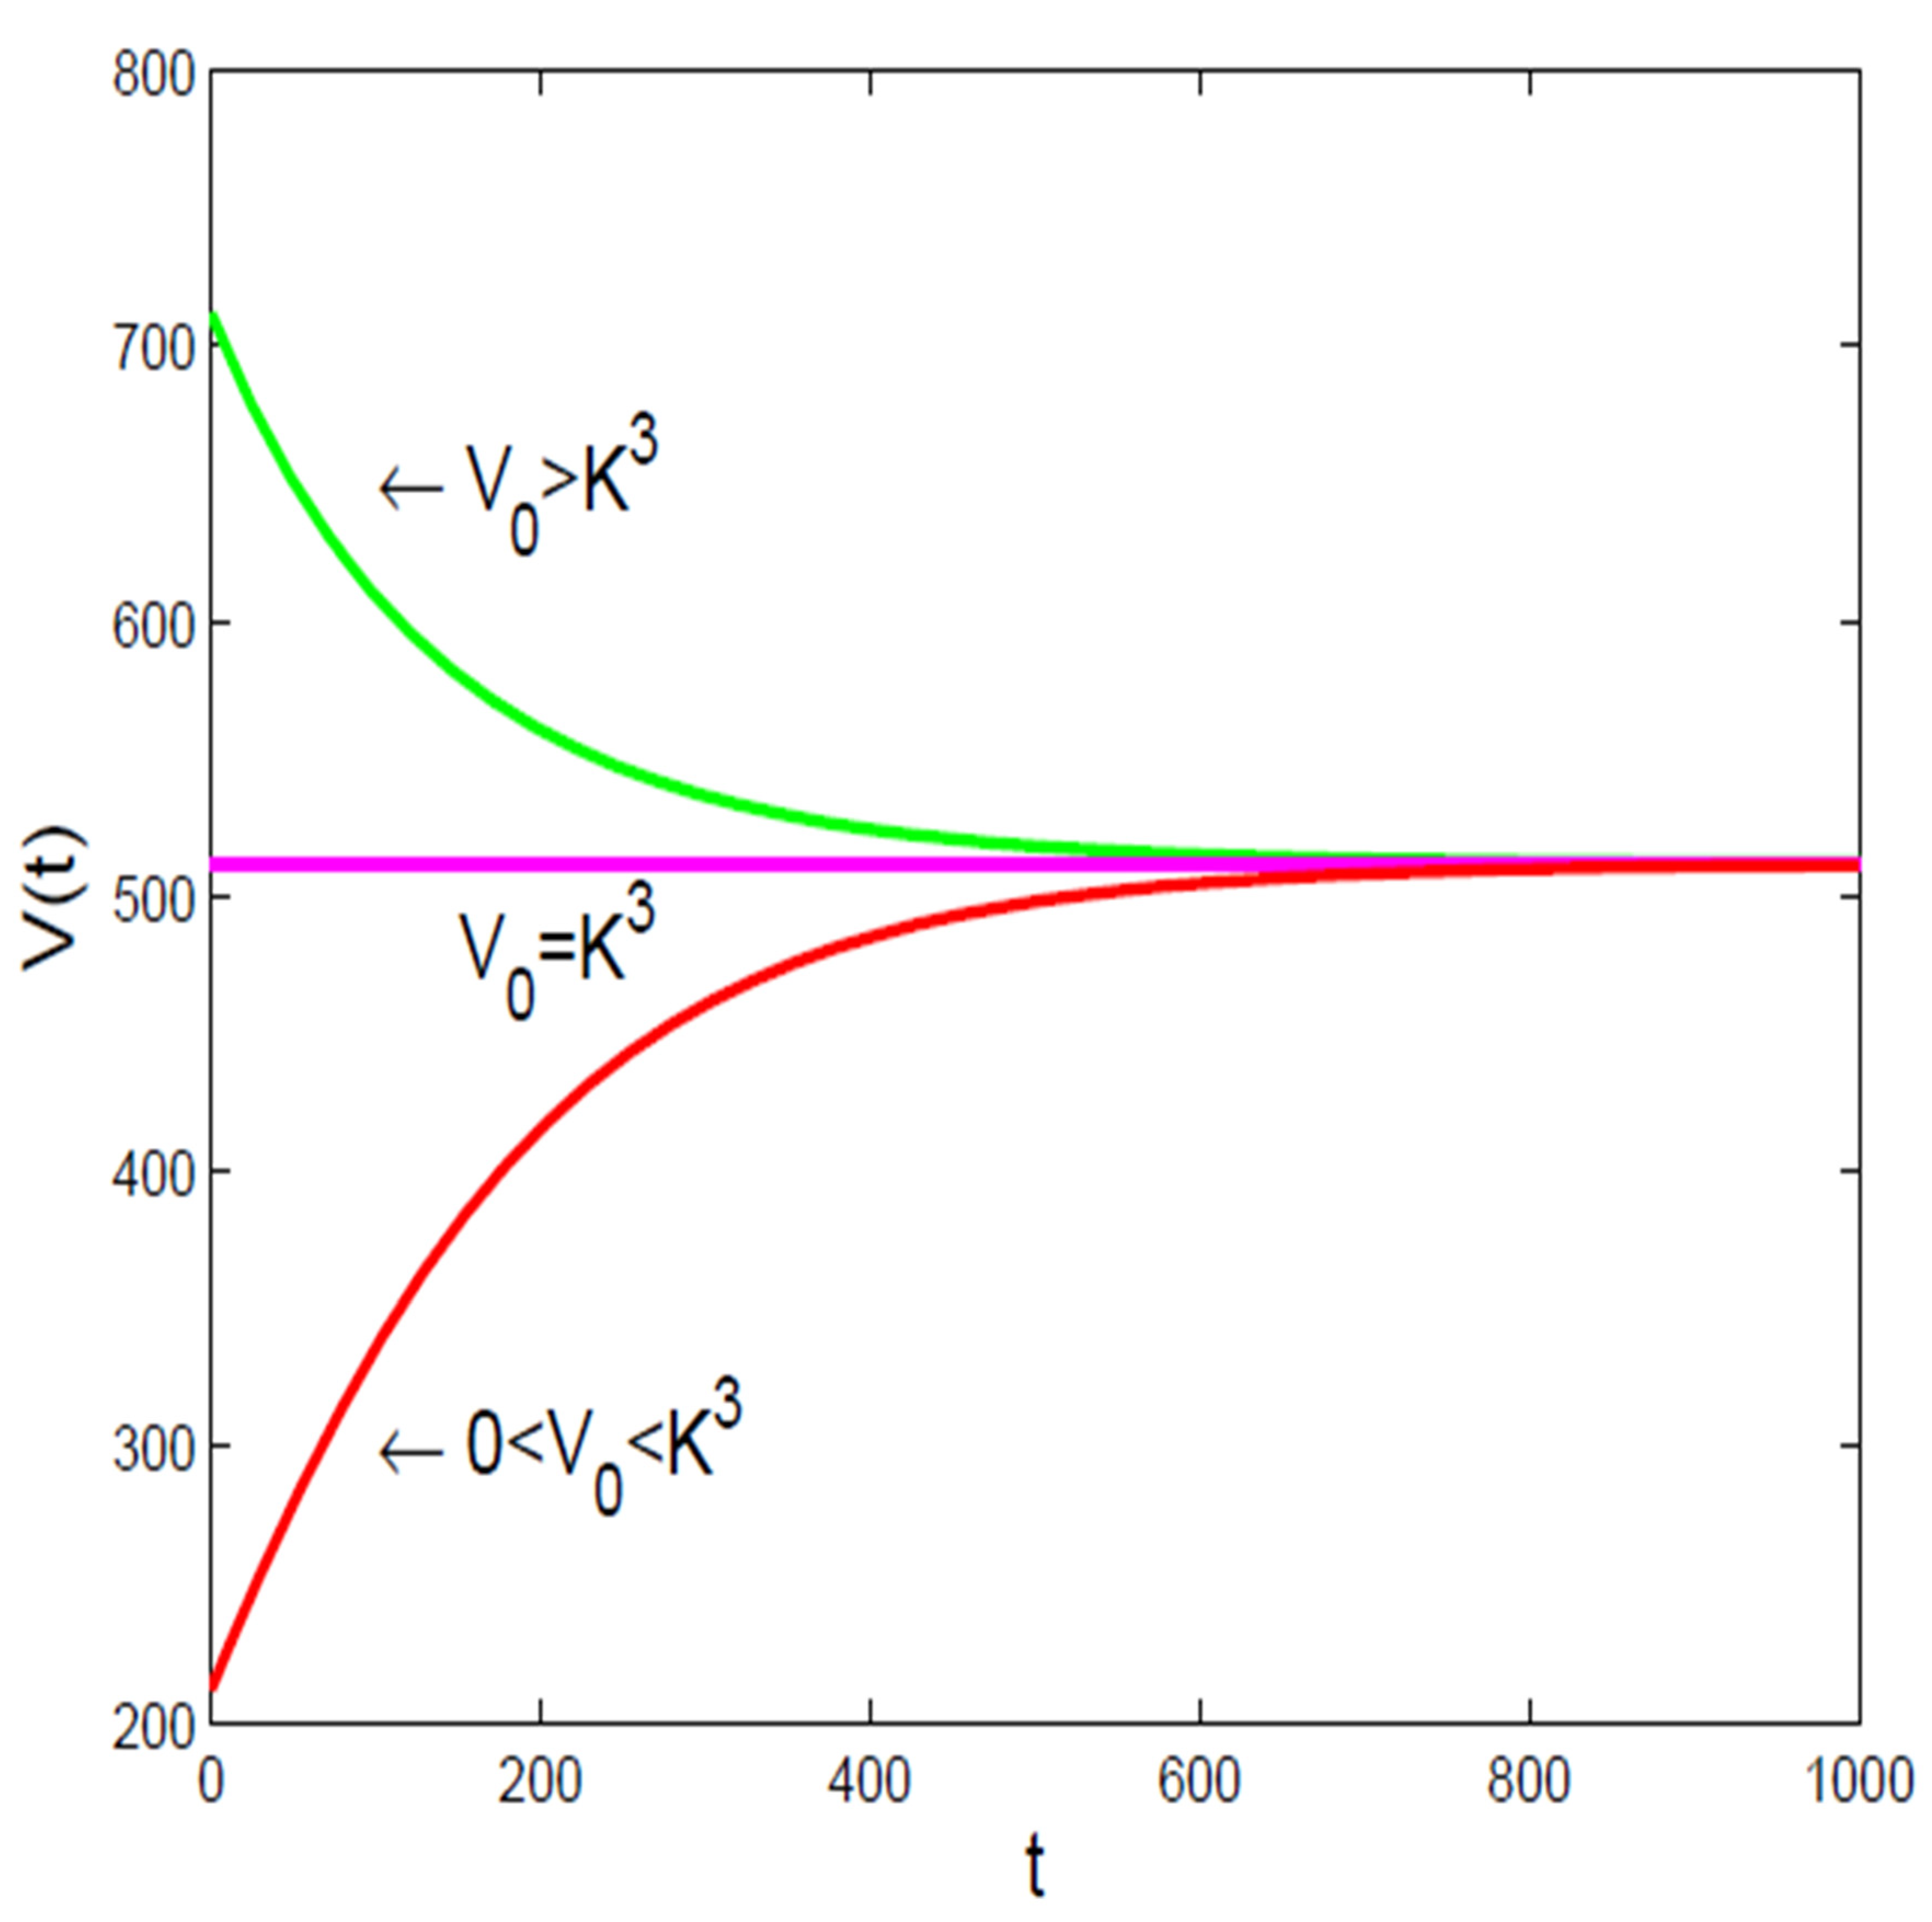
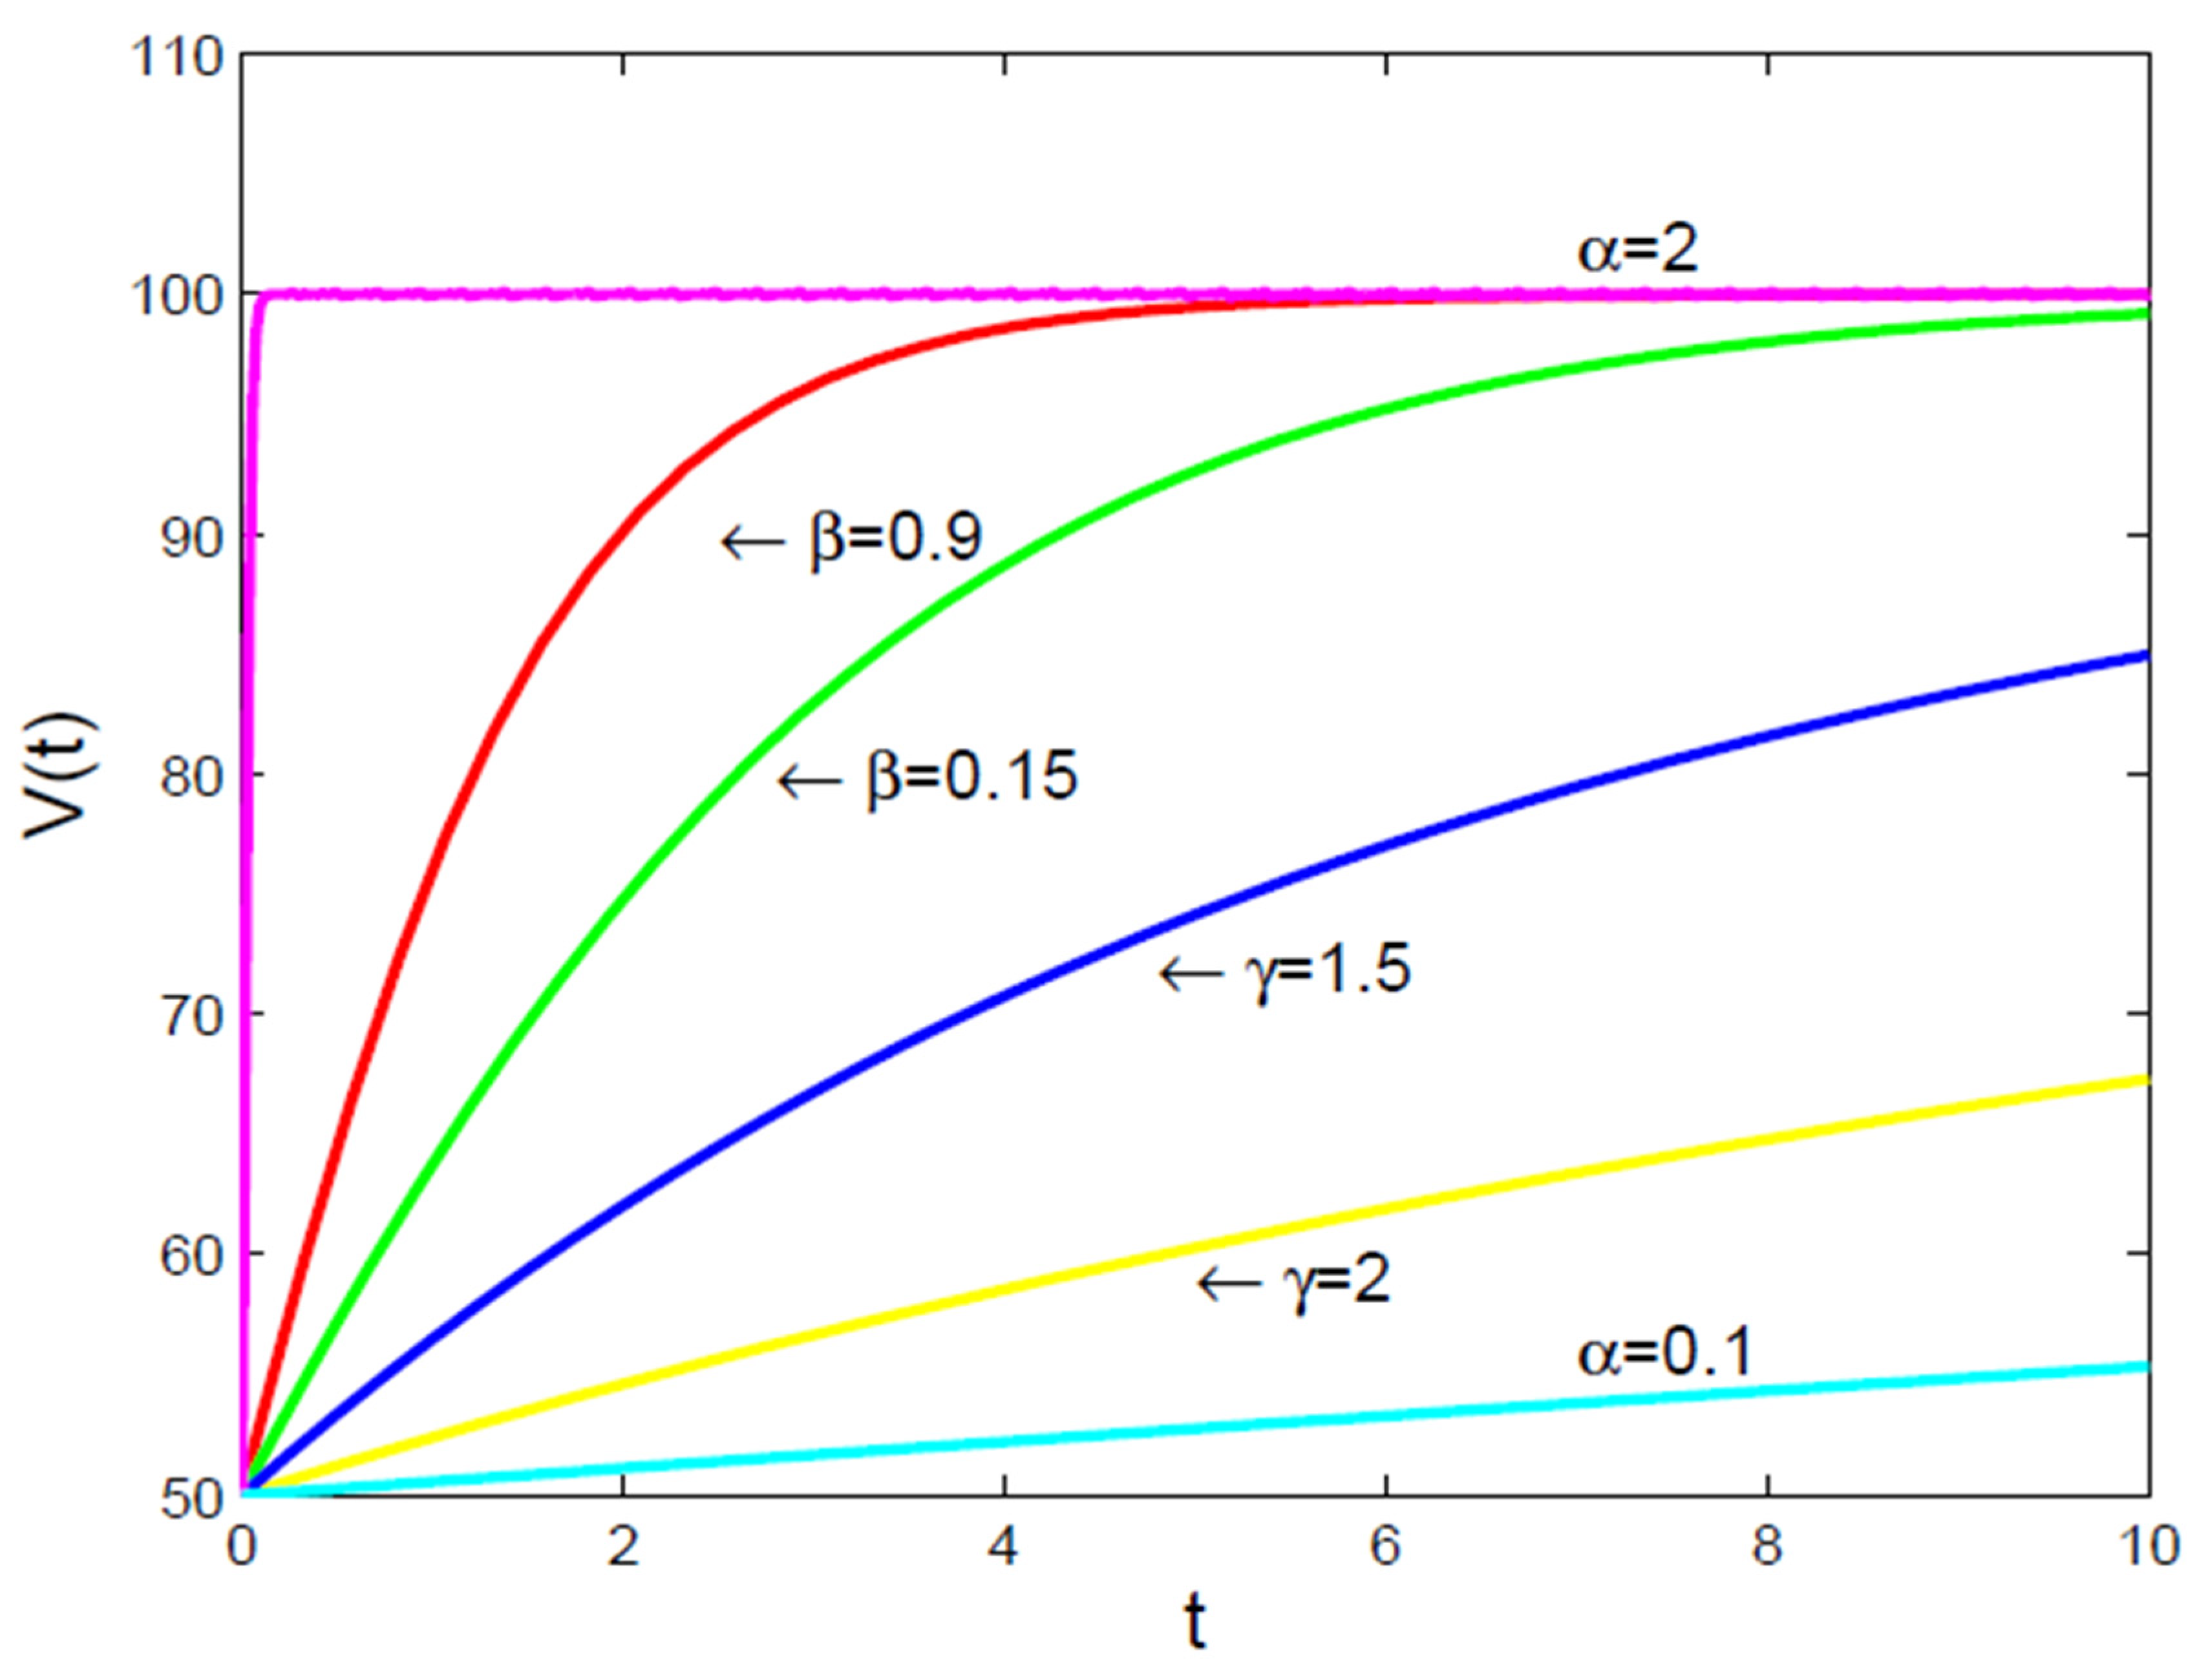
  • It is to be noted [16], that there are not many well-established principles in biology, like the “universal” growth law, which makes most mathematical models used in cancer research based on observations rather than fundamental rules. Because of this [16], it’s hard to determine the best models for understanding how tumors grow, and these models need to be updated as new biological information becomes available. Additionally, many important factors, like how quickly cancer cells grow or how many are resistant to treatment, are not well-defined or measurable with current technology, limiting the models’ ability to accurately predict treatment outcomes.
  • A key challenge [16] in creating predictive models for tumors is dealing with uncertainties in the data collected from experiments and the models themselves. Experimental data can be affected by random errors and inaccuracies [16], which can lead to wrong estimates of important factors like tumor size or protein levels. To address these uncertainties [16], researchers can use statistical methods that treat data and model parameters as probabilities, allowing for more accurate and reliable predictions about tumor behavior and treatment outcomes.
  • For mathematical models to be useful in medicine, they need to work with real patient data [16], such as information from imaging, biopsies, and genetic tests that help identify the type and severity of tumors. This data can be used to set up the models or adjust their parameters when direct measurements are not possible. It is really a burning open problem to offer an exploratory approach on how to combine imaging techniques, like MRI and PET scans, with mathematical models to better understand tumor growth and behavior, which can lead to improved cancer treatments.
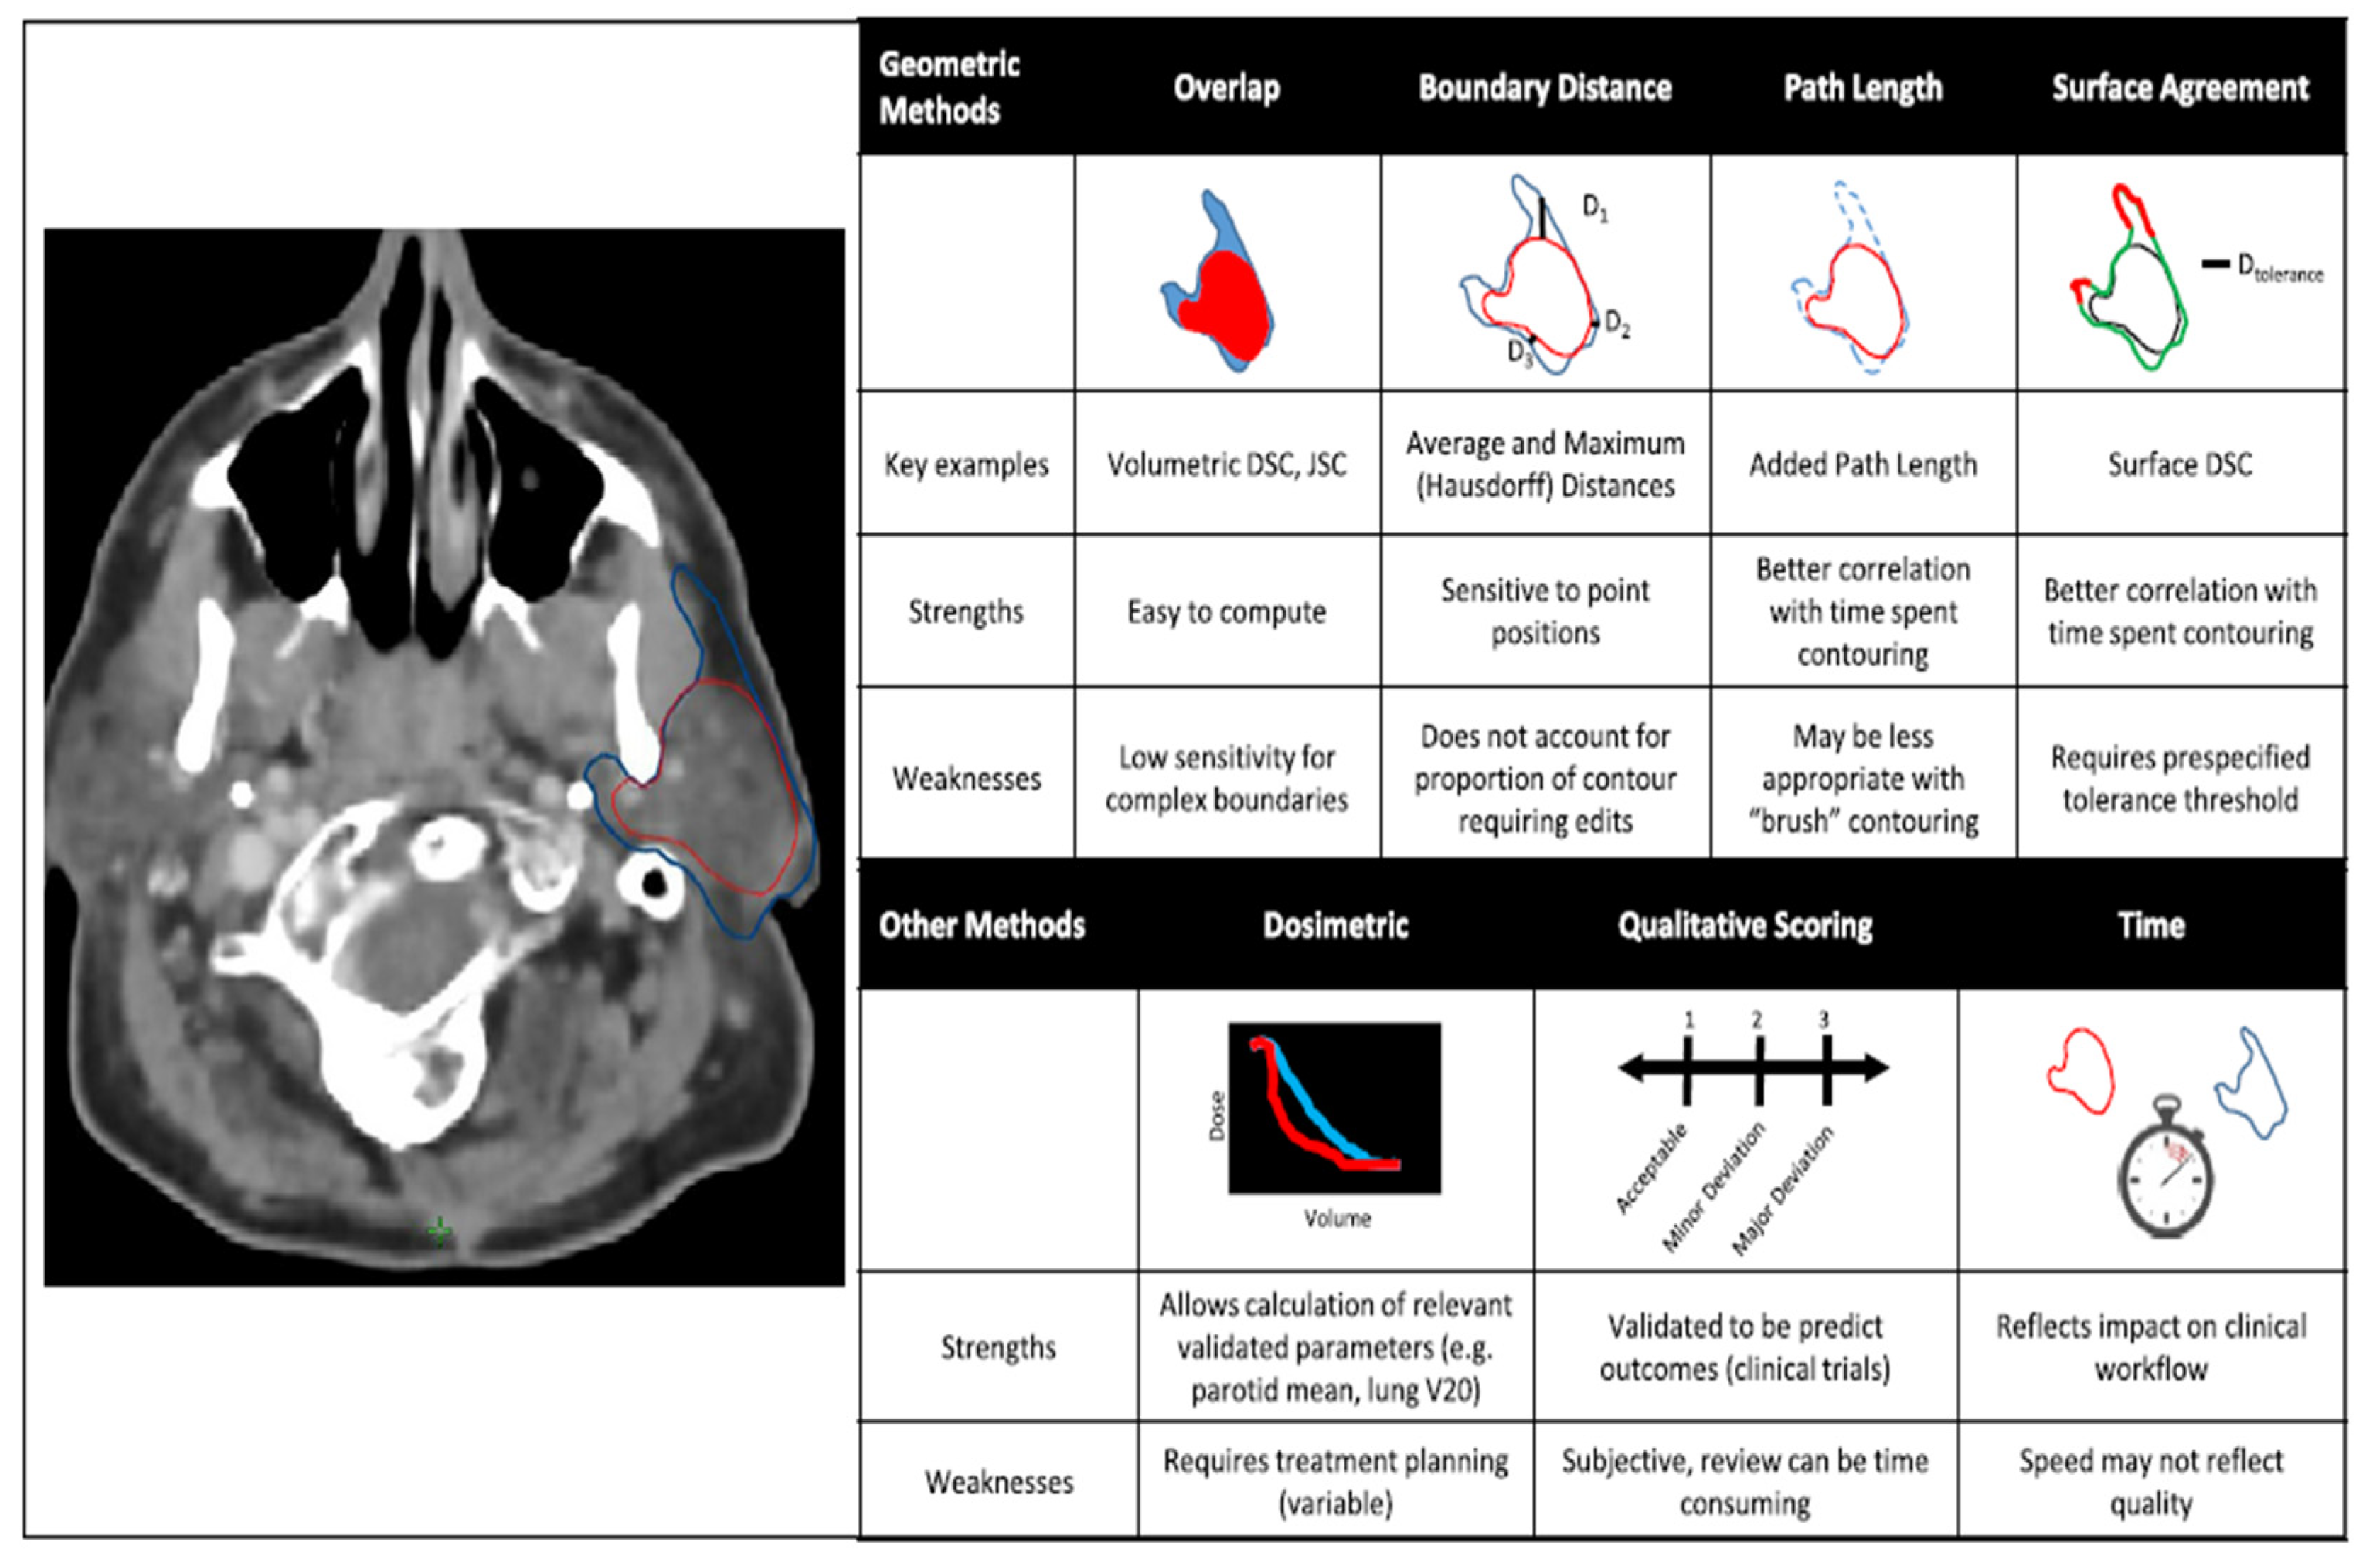
  • If the main goal is to ensure that the contours created by auto-segmentation are clinically relevant [29], the best method is still to have a physician evaluate them, as this method has the strongest link to patient outcomes. However [29], this evaluation process can take a lot of time and effort, so there is a need for alternative measures that can be used to assess the quality of these automated systems more efficiently. The evaluation should also focus on specific goals [29], like how accurate the anatomical shapes are or how quickly the process can be done, depending on what is most important for the clinical situation.
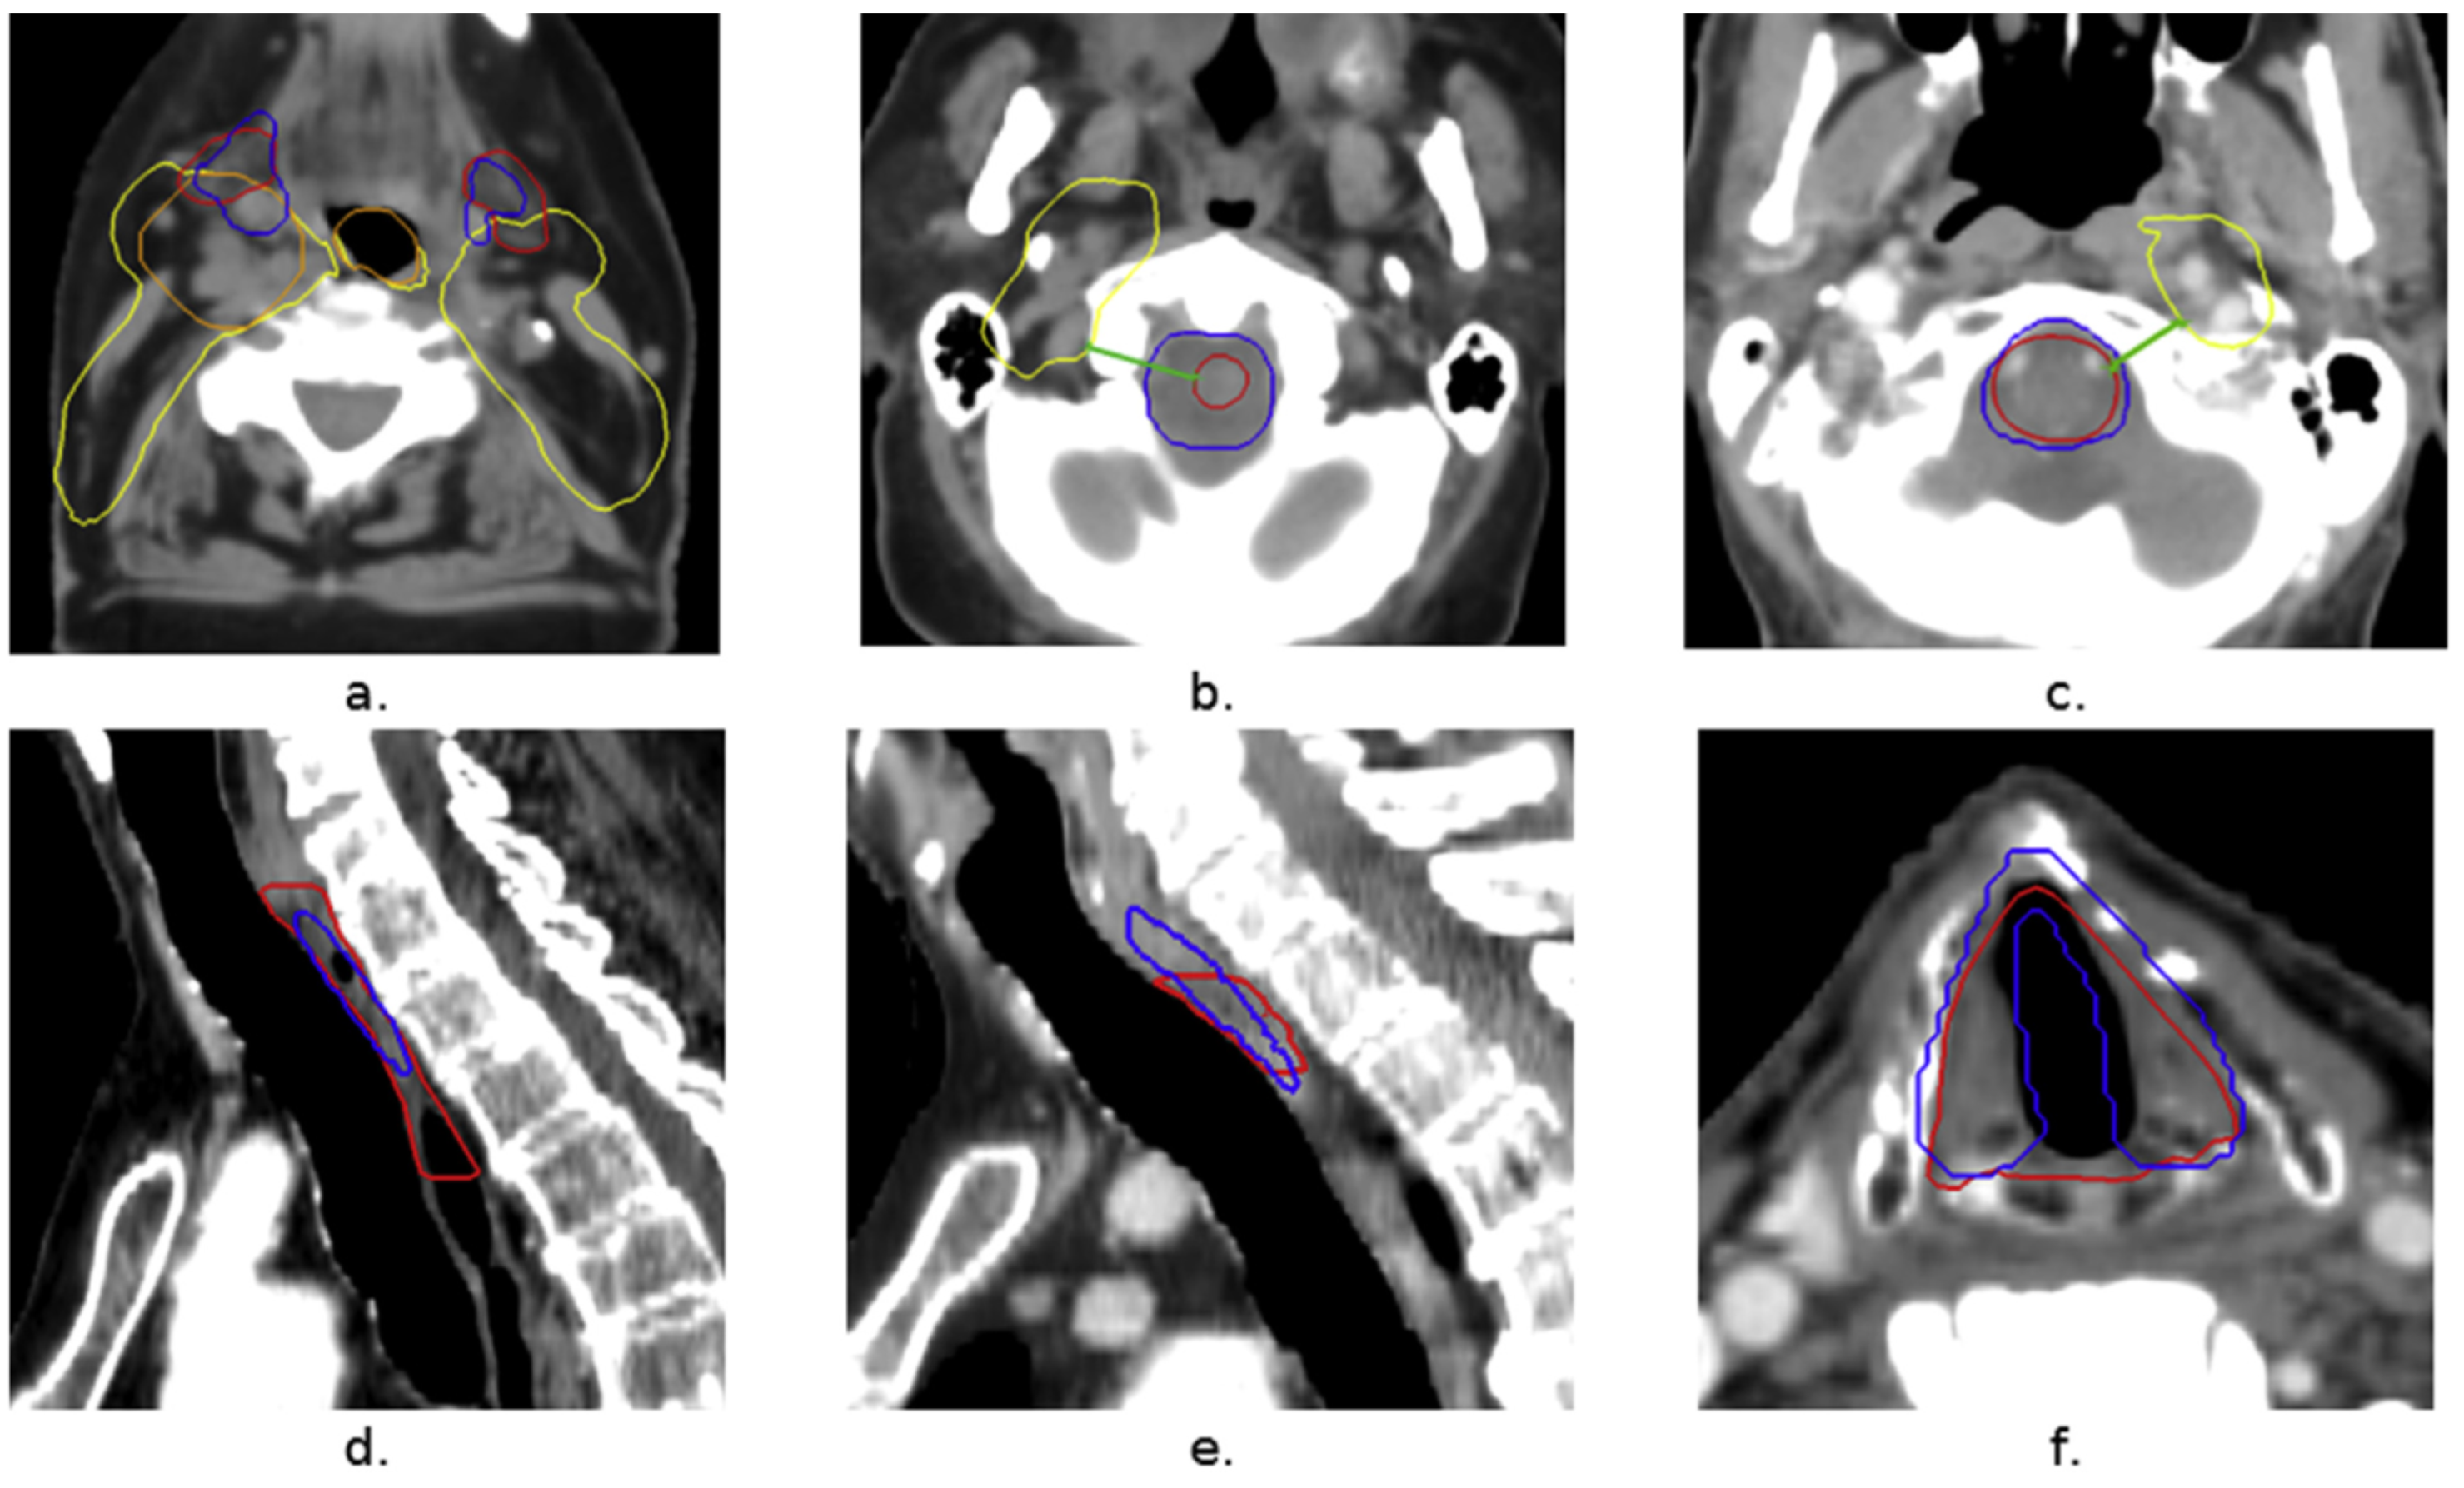
  • The main limitation of the study [31] is the lack of reliable “ground truth” data, which means that for some patients, the outline of the submandibular gland (SMG) can be clearly seen on CT scans, while for others, it is difficult to distinguish due to similar tissue densities. This can make accurate contouring challenging [31], and additional imaging techniques like MRI might be needed for better clarity. Other limitations include using only one evaluation metric for model performance, reducing the training area due to memory limits, and not testing the model on different datasets or types of treatment plans, which could affect the results.
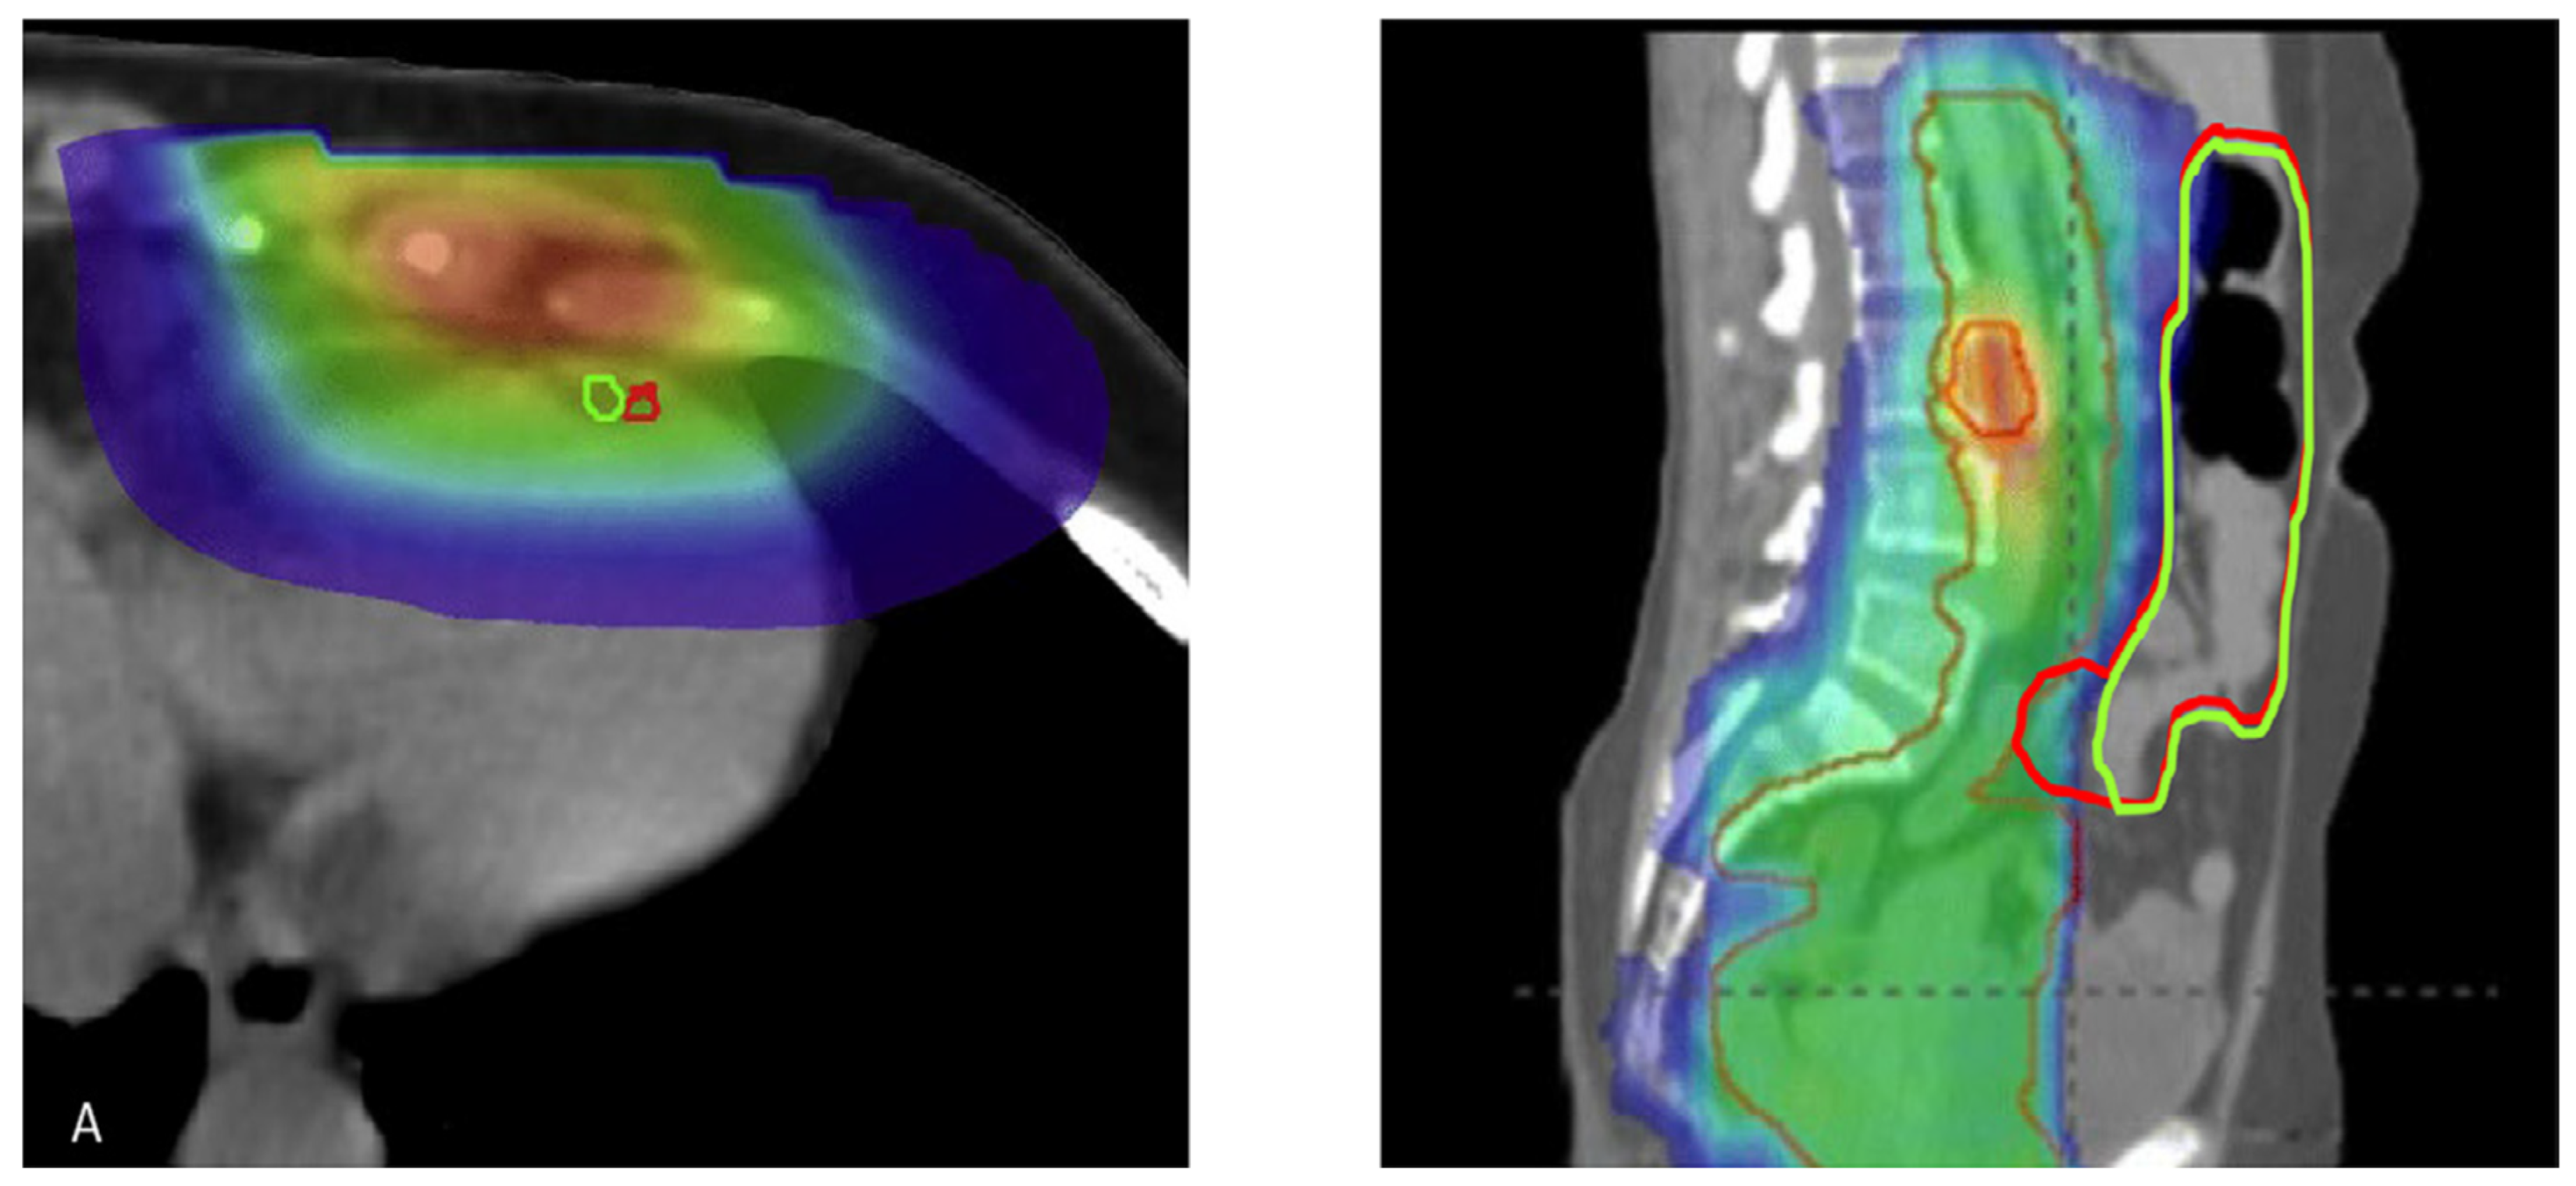
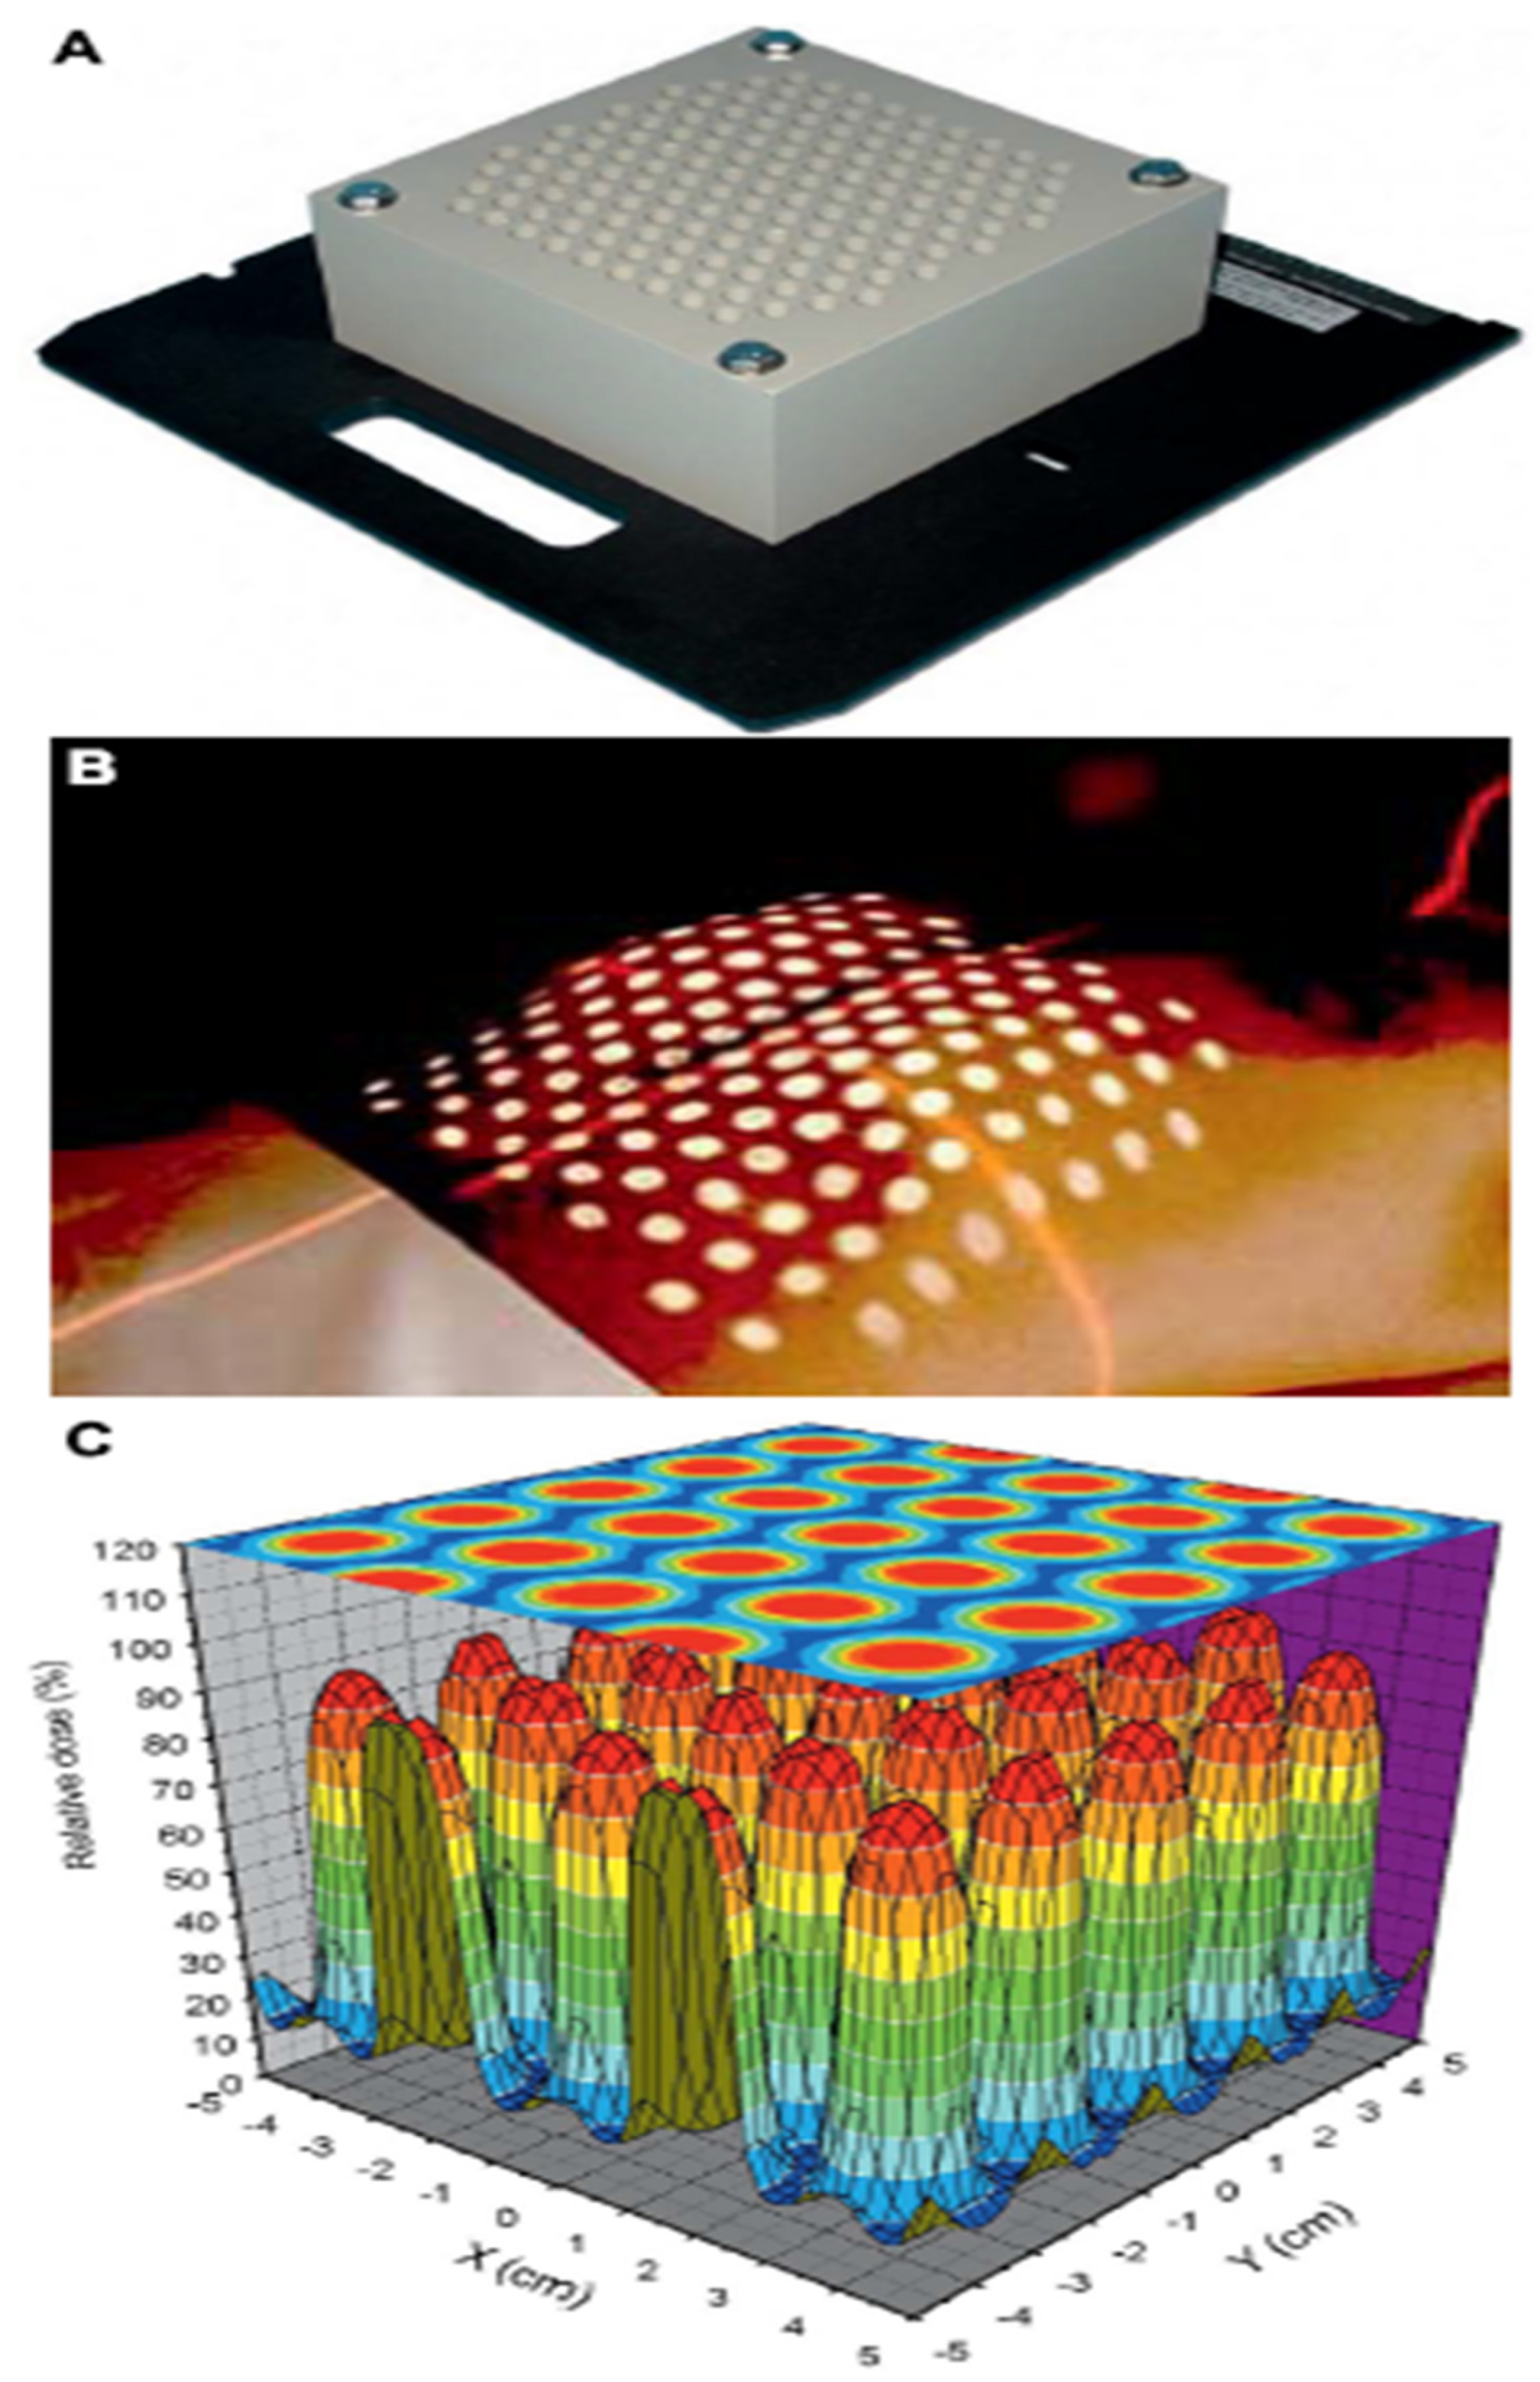
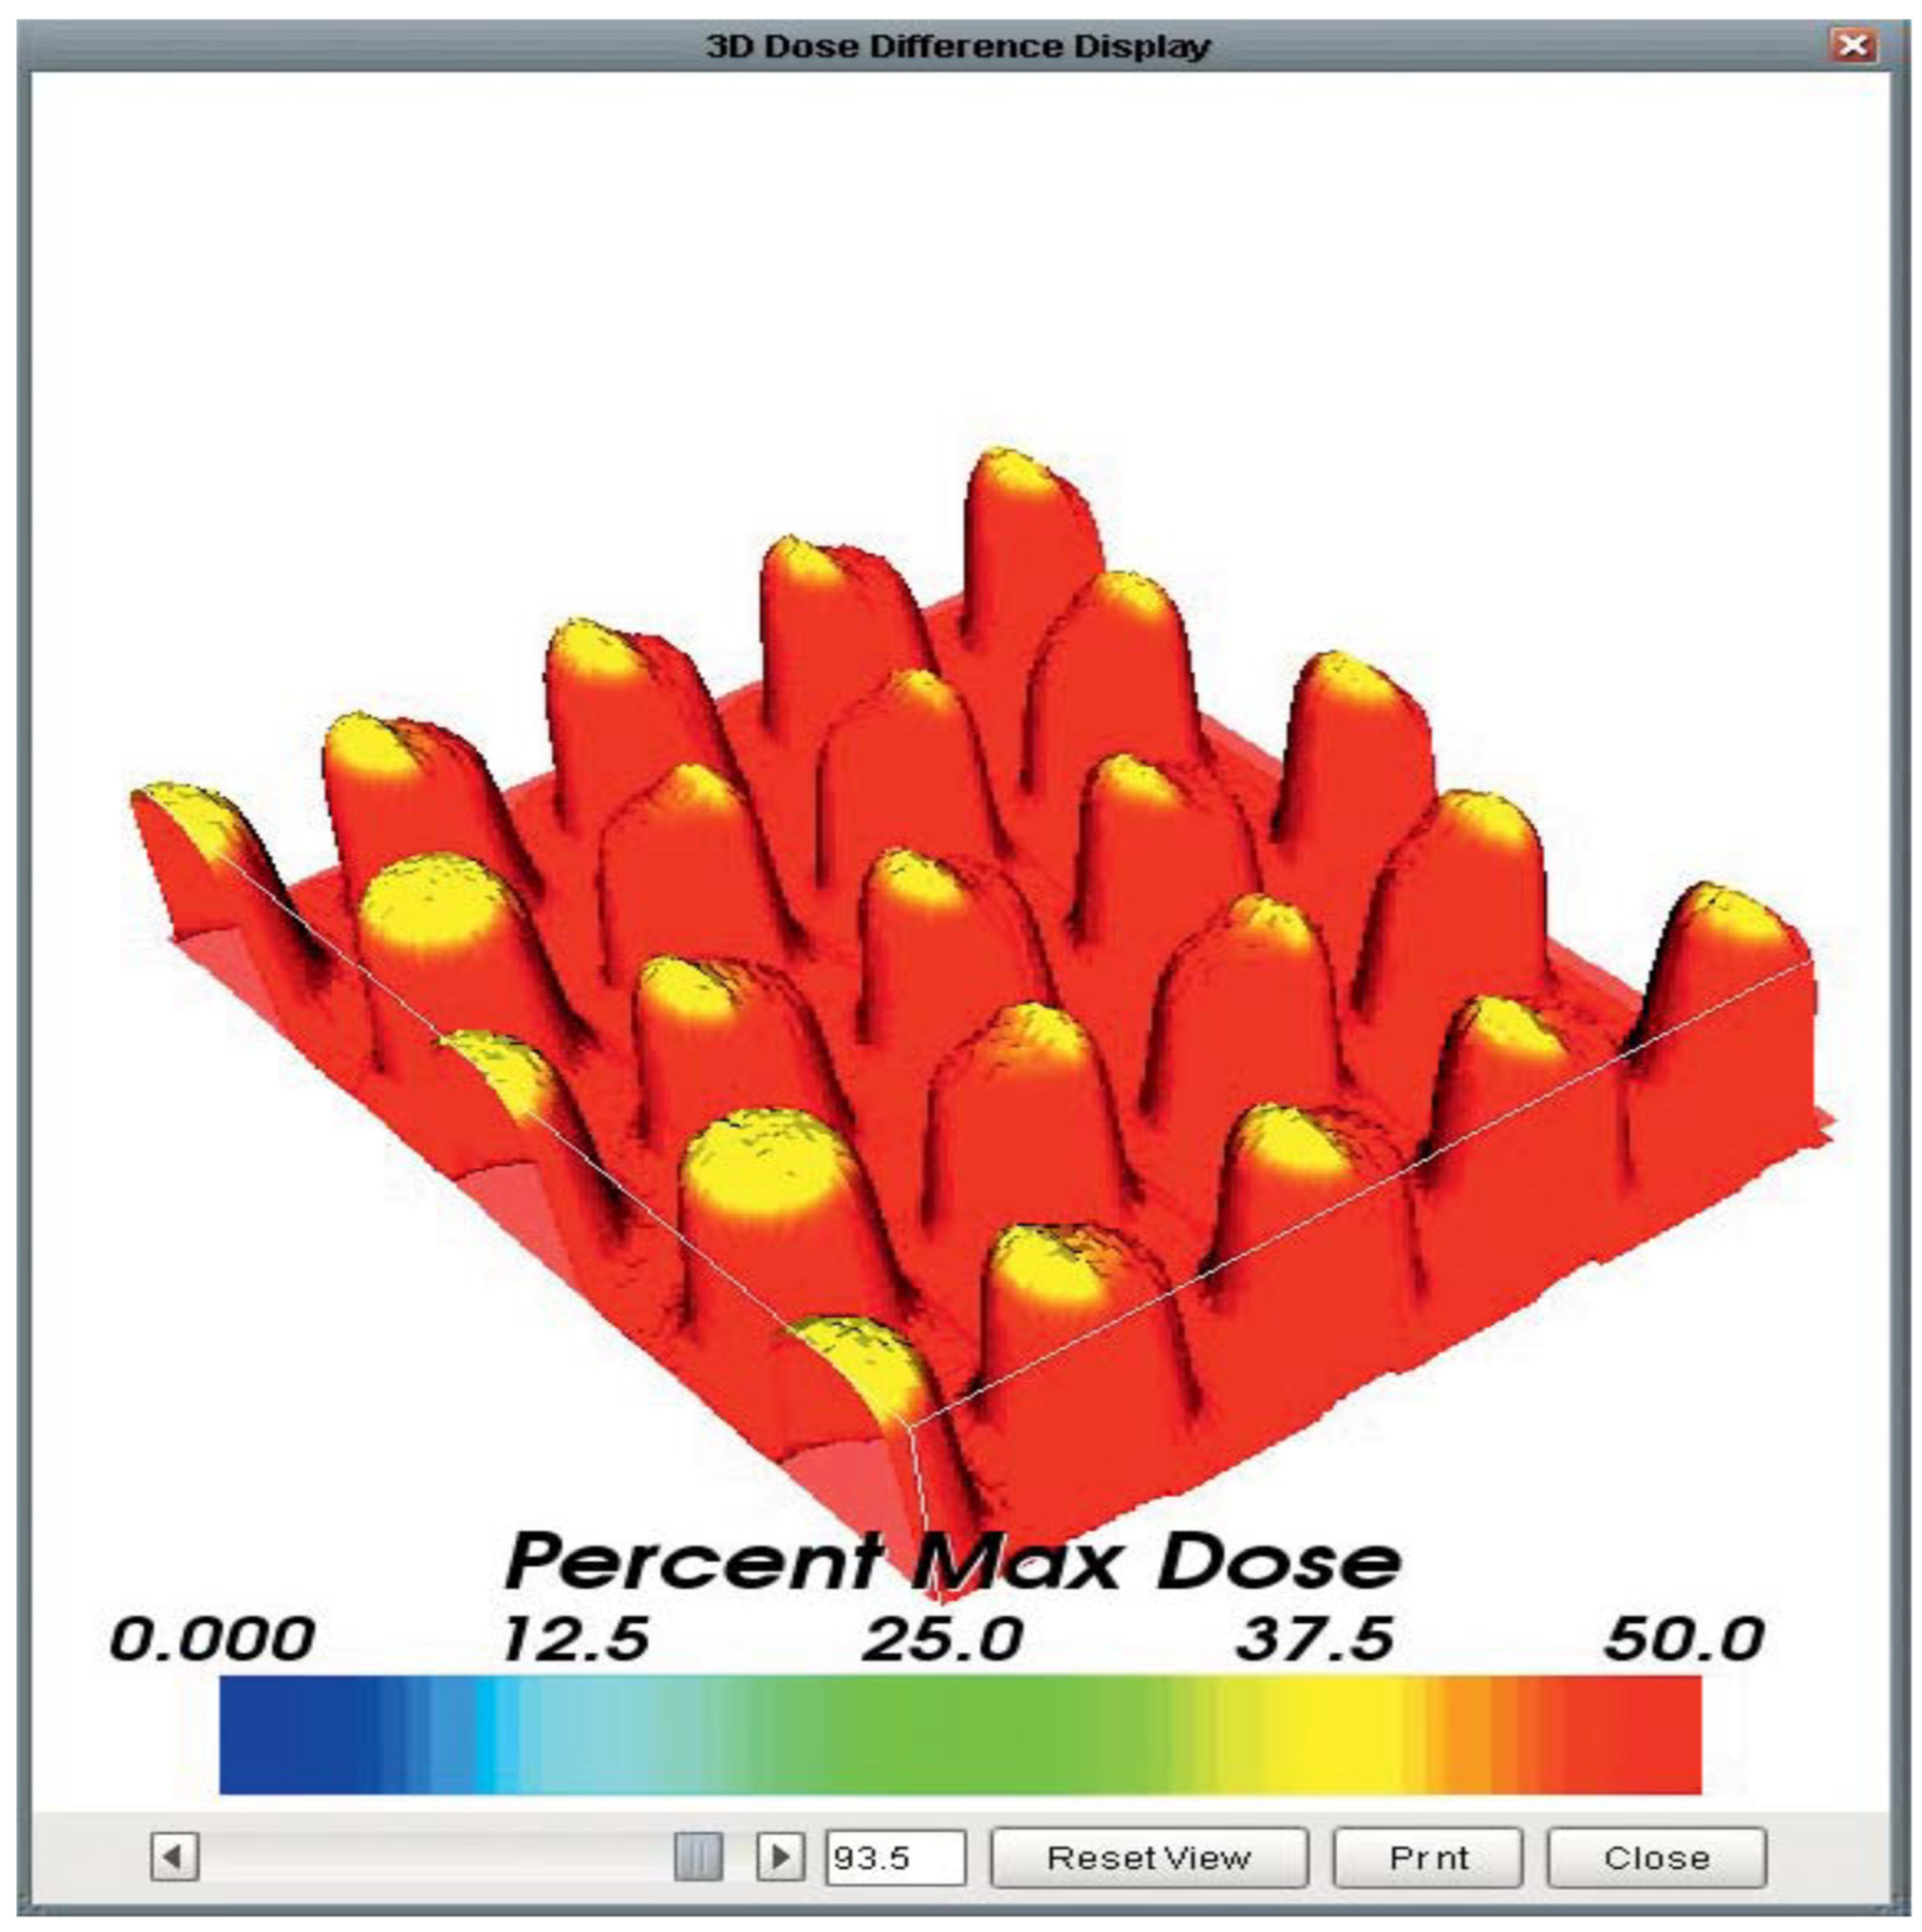
  • It is suggested [32] that the guidelines for GRID therapy should be adjusted according to specific treatment goals, like reducing the size of large tumors or enhancing the body’s immune response to cancer. As research in spatially fractionated radiation therapy (SFRT) continues to evolve, these guidelines must be updated to incorporate new findings and improve treatment effectiveness. This flexibility ensures that the therapy can be tailored to meet the unique needs of each patient.
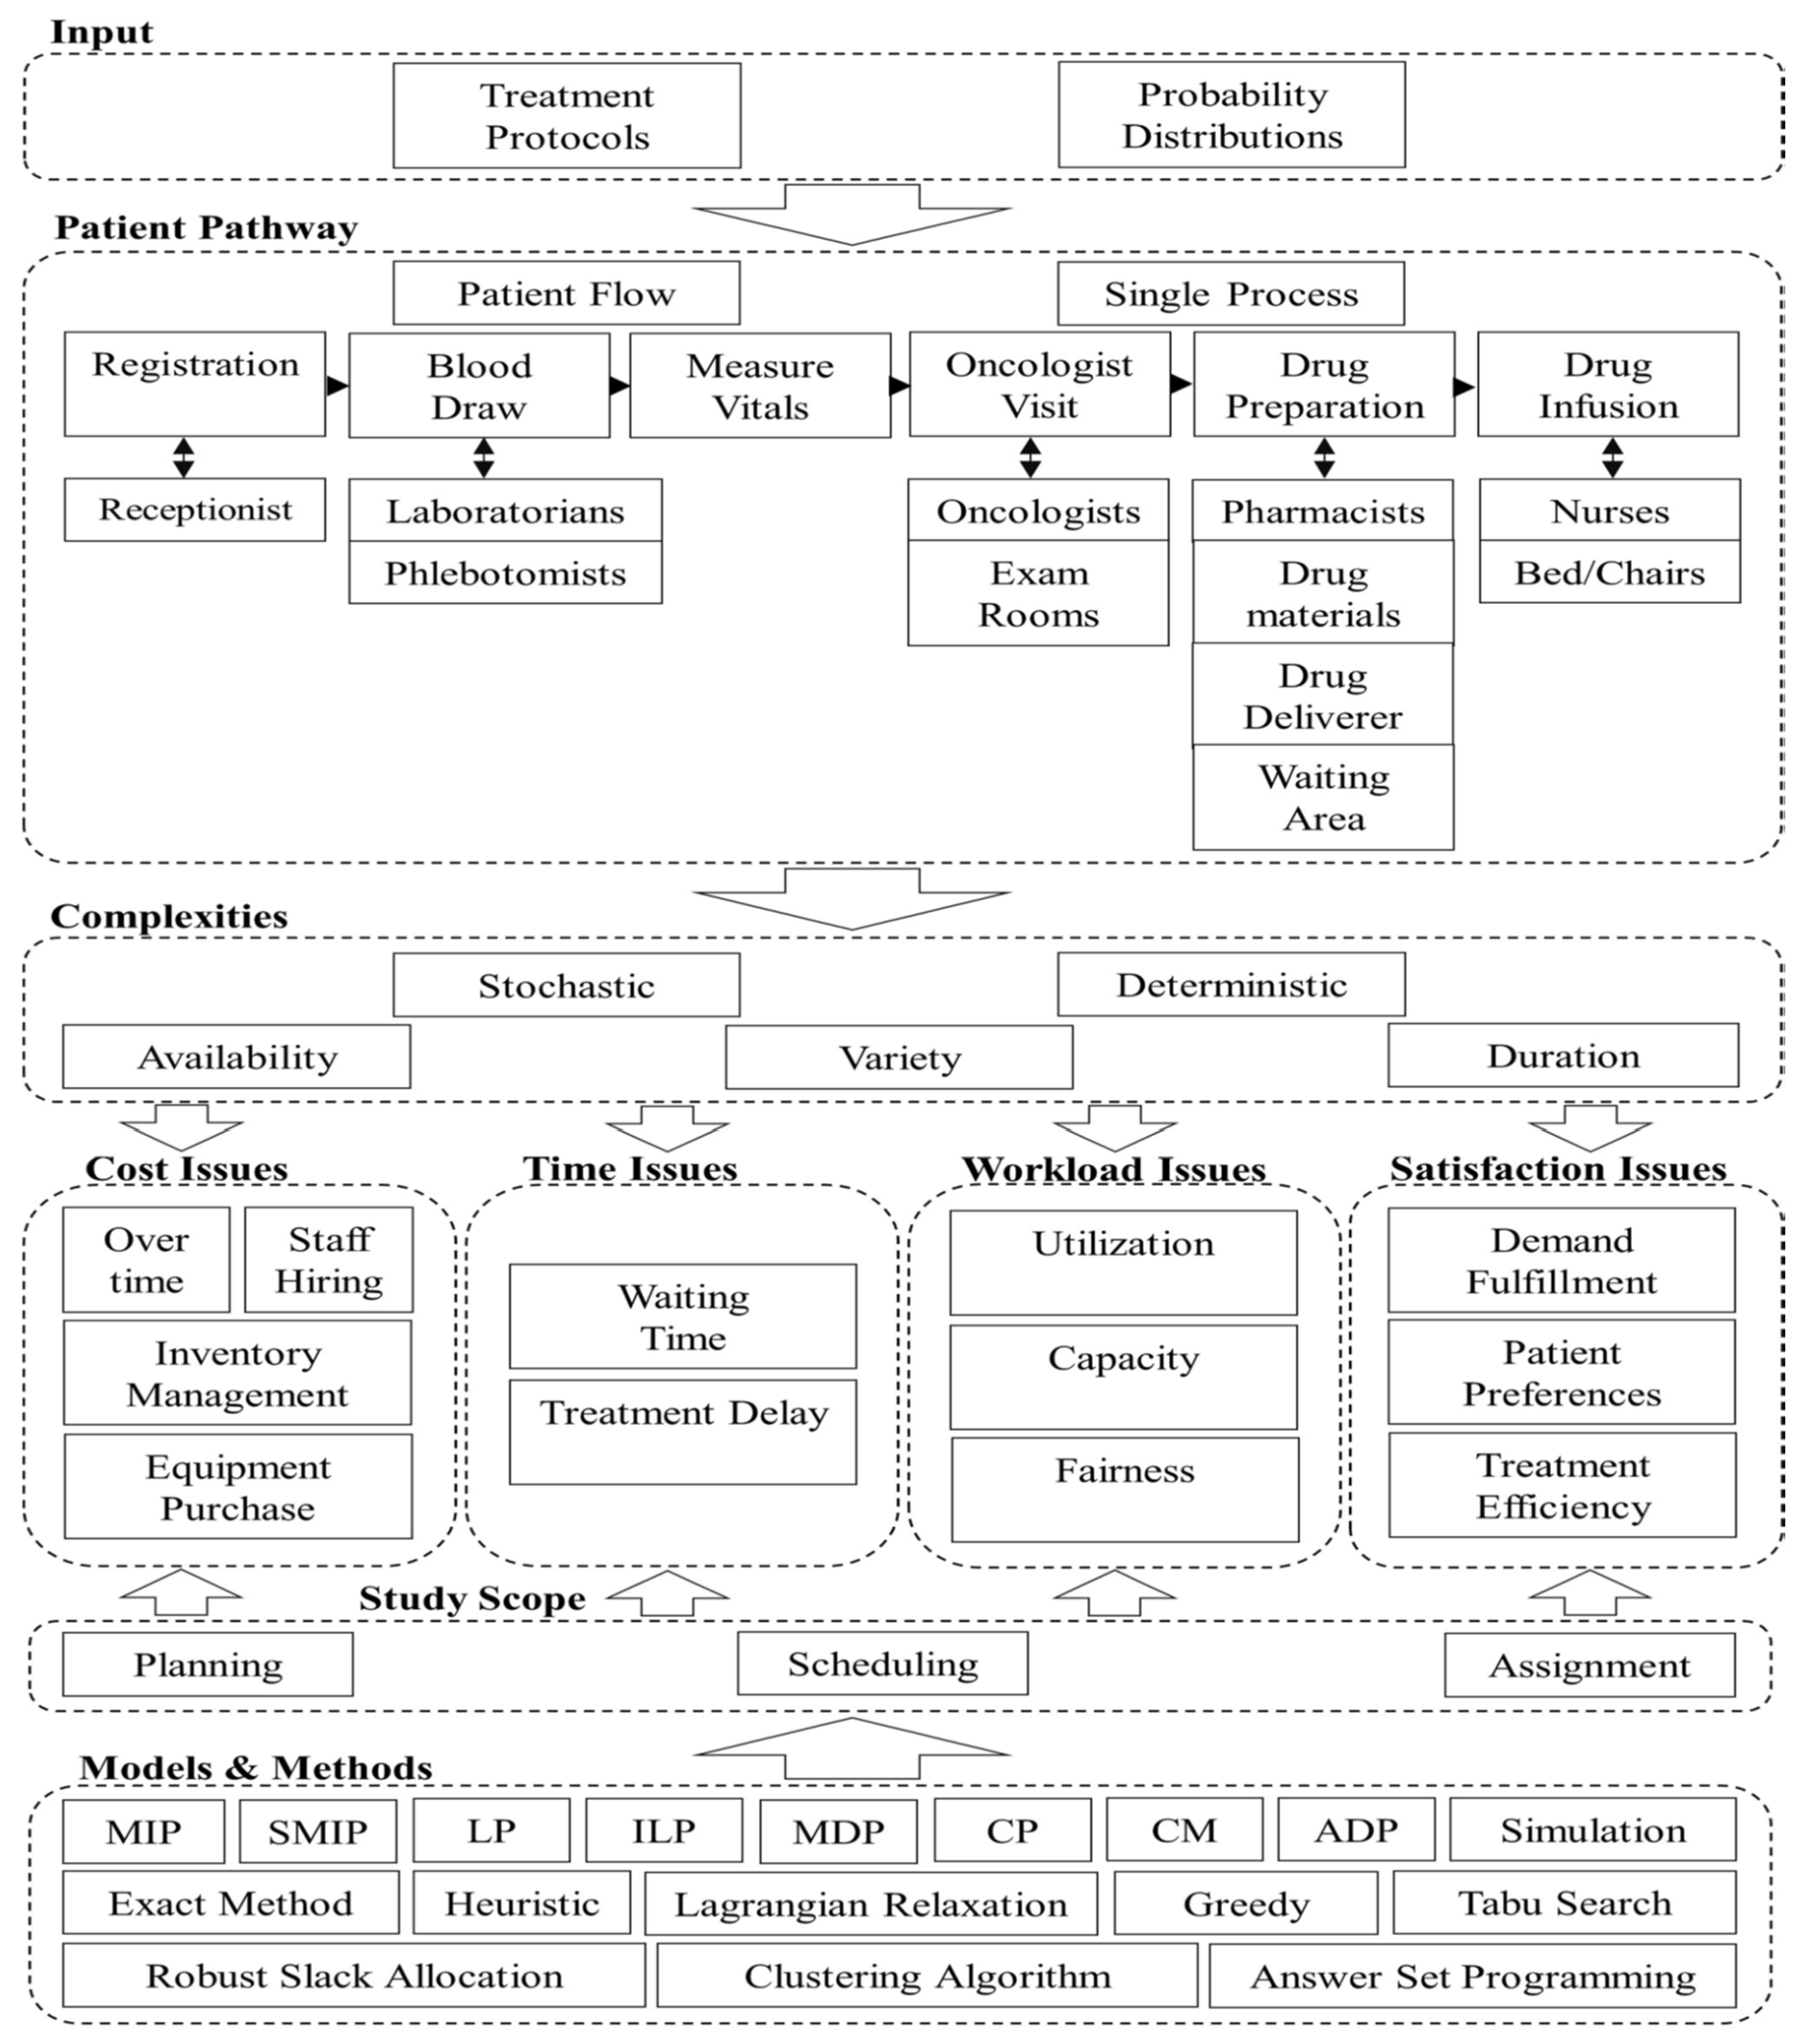
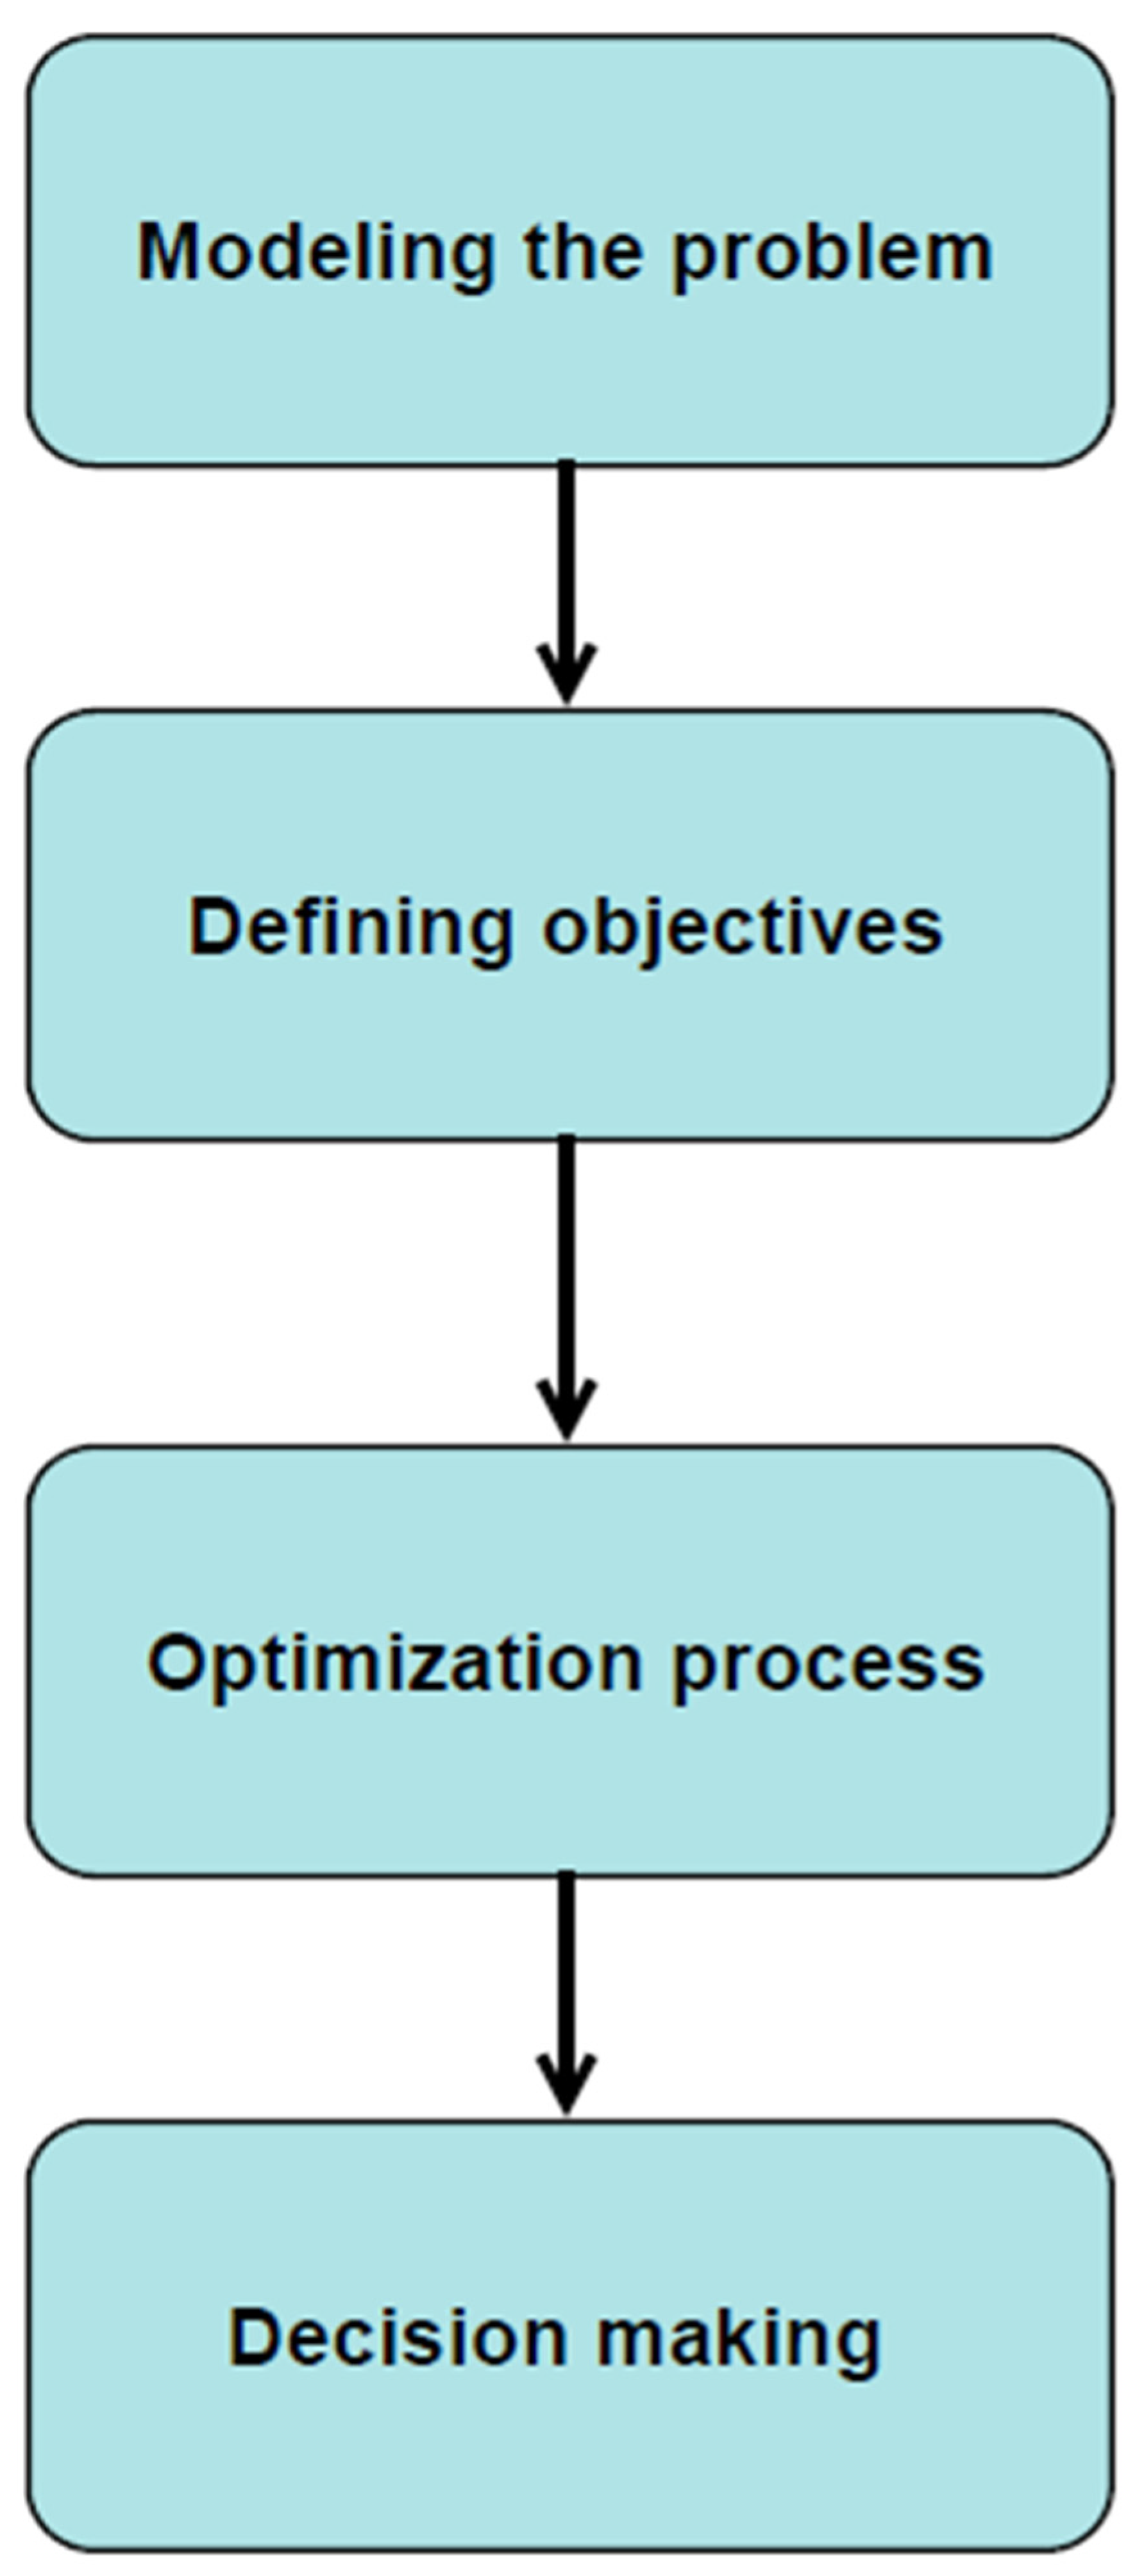
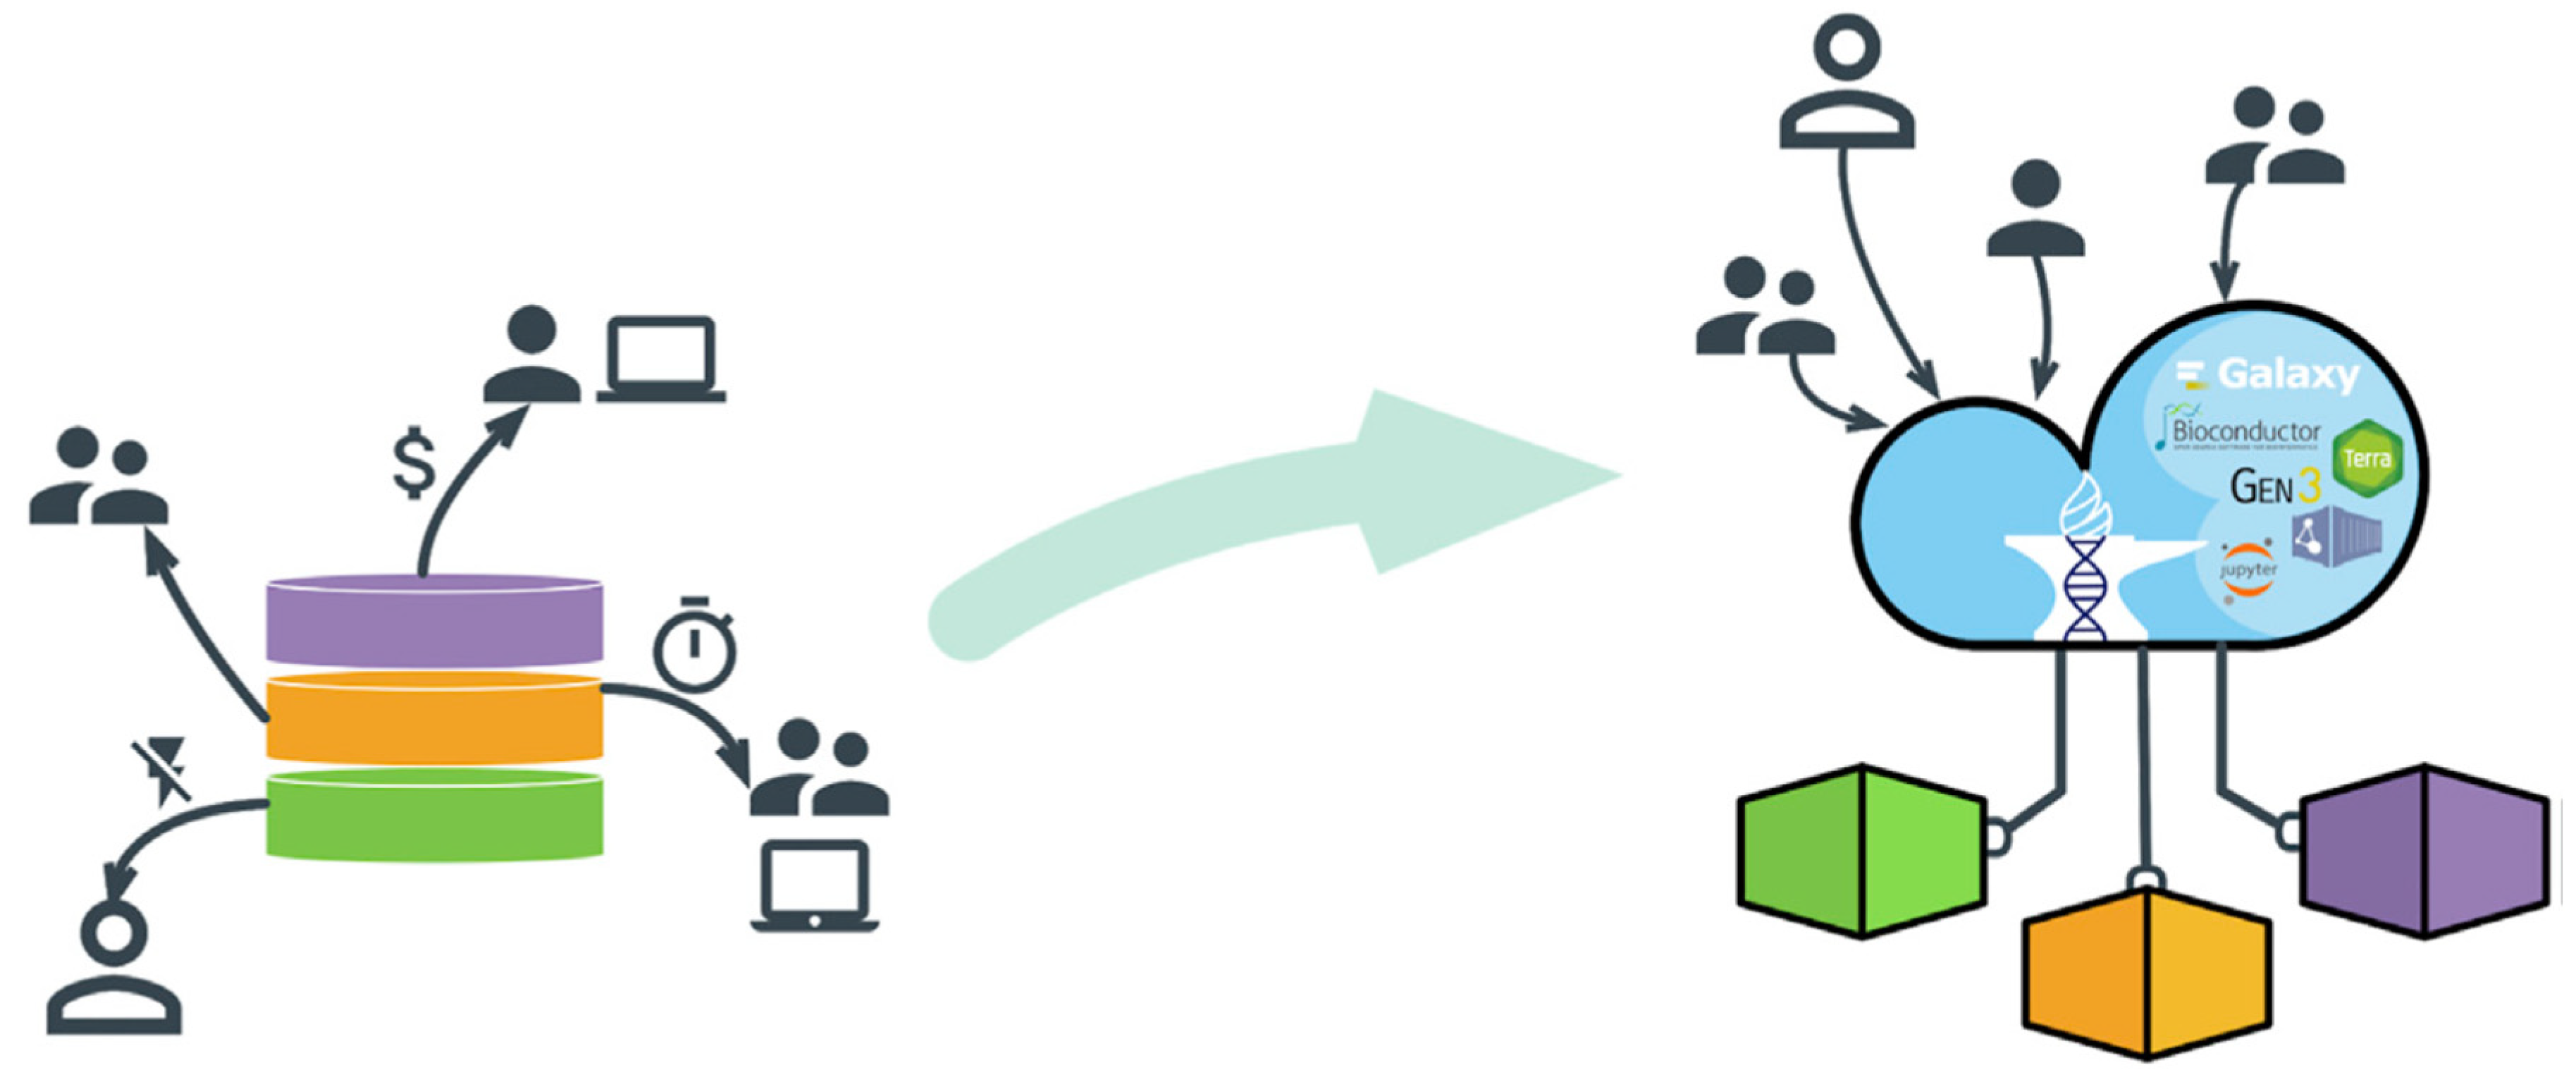
  • There is a significant gap [40] between research on outpatient chemotherapy operations management (OCP) and the use of advanced technologies from Industry 4.0, known as Health 4.0. Health 4.0 includes tools like cloud computing and big data, which can improve how chemotherapy services are automated and optimized. Integrating these technologies into existing models to enhance decision-making and service performance in outpatient clinics is a sophisticated open problem that needs to be solved.
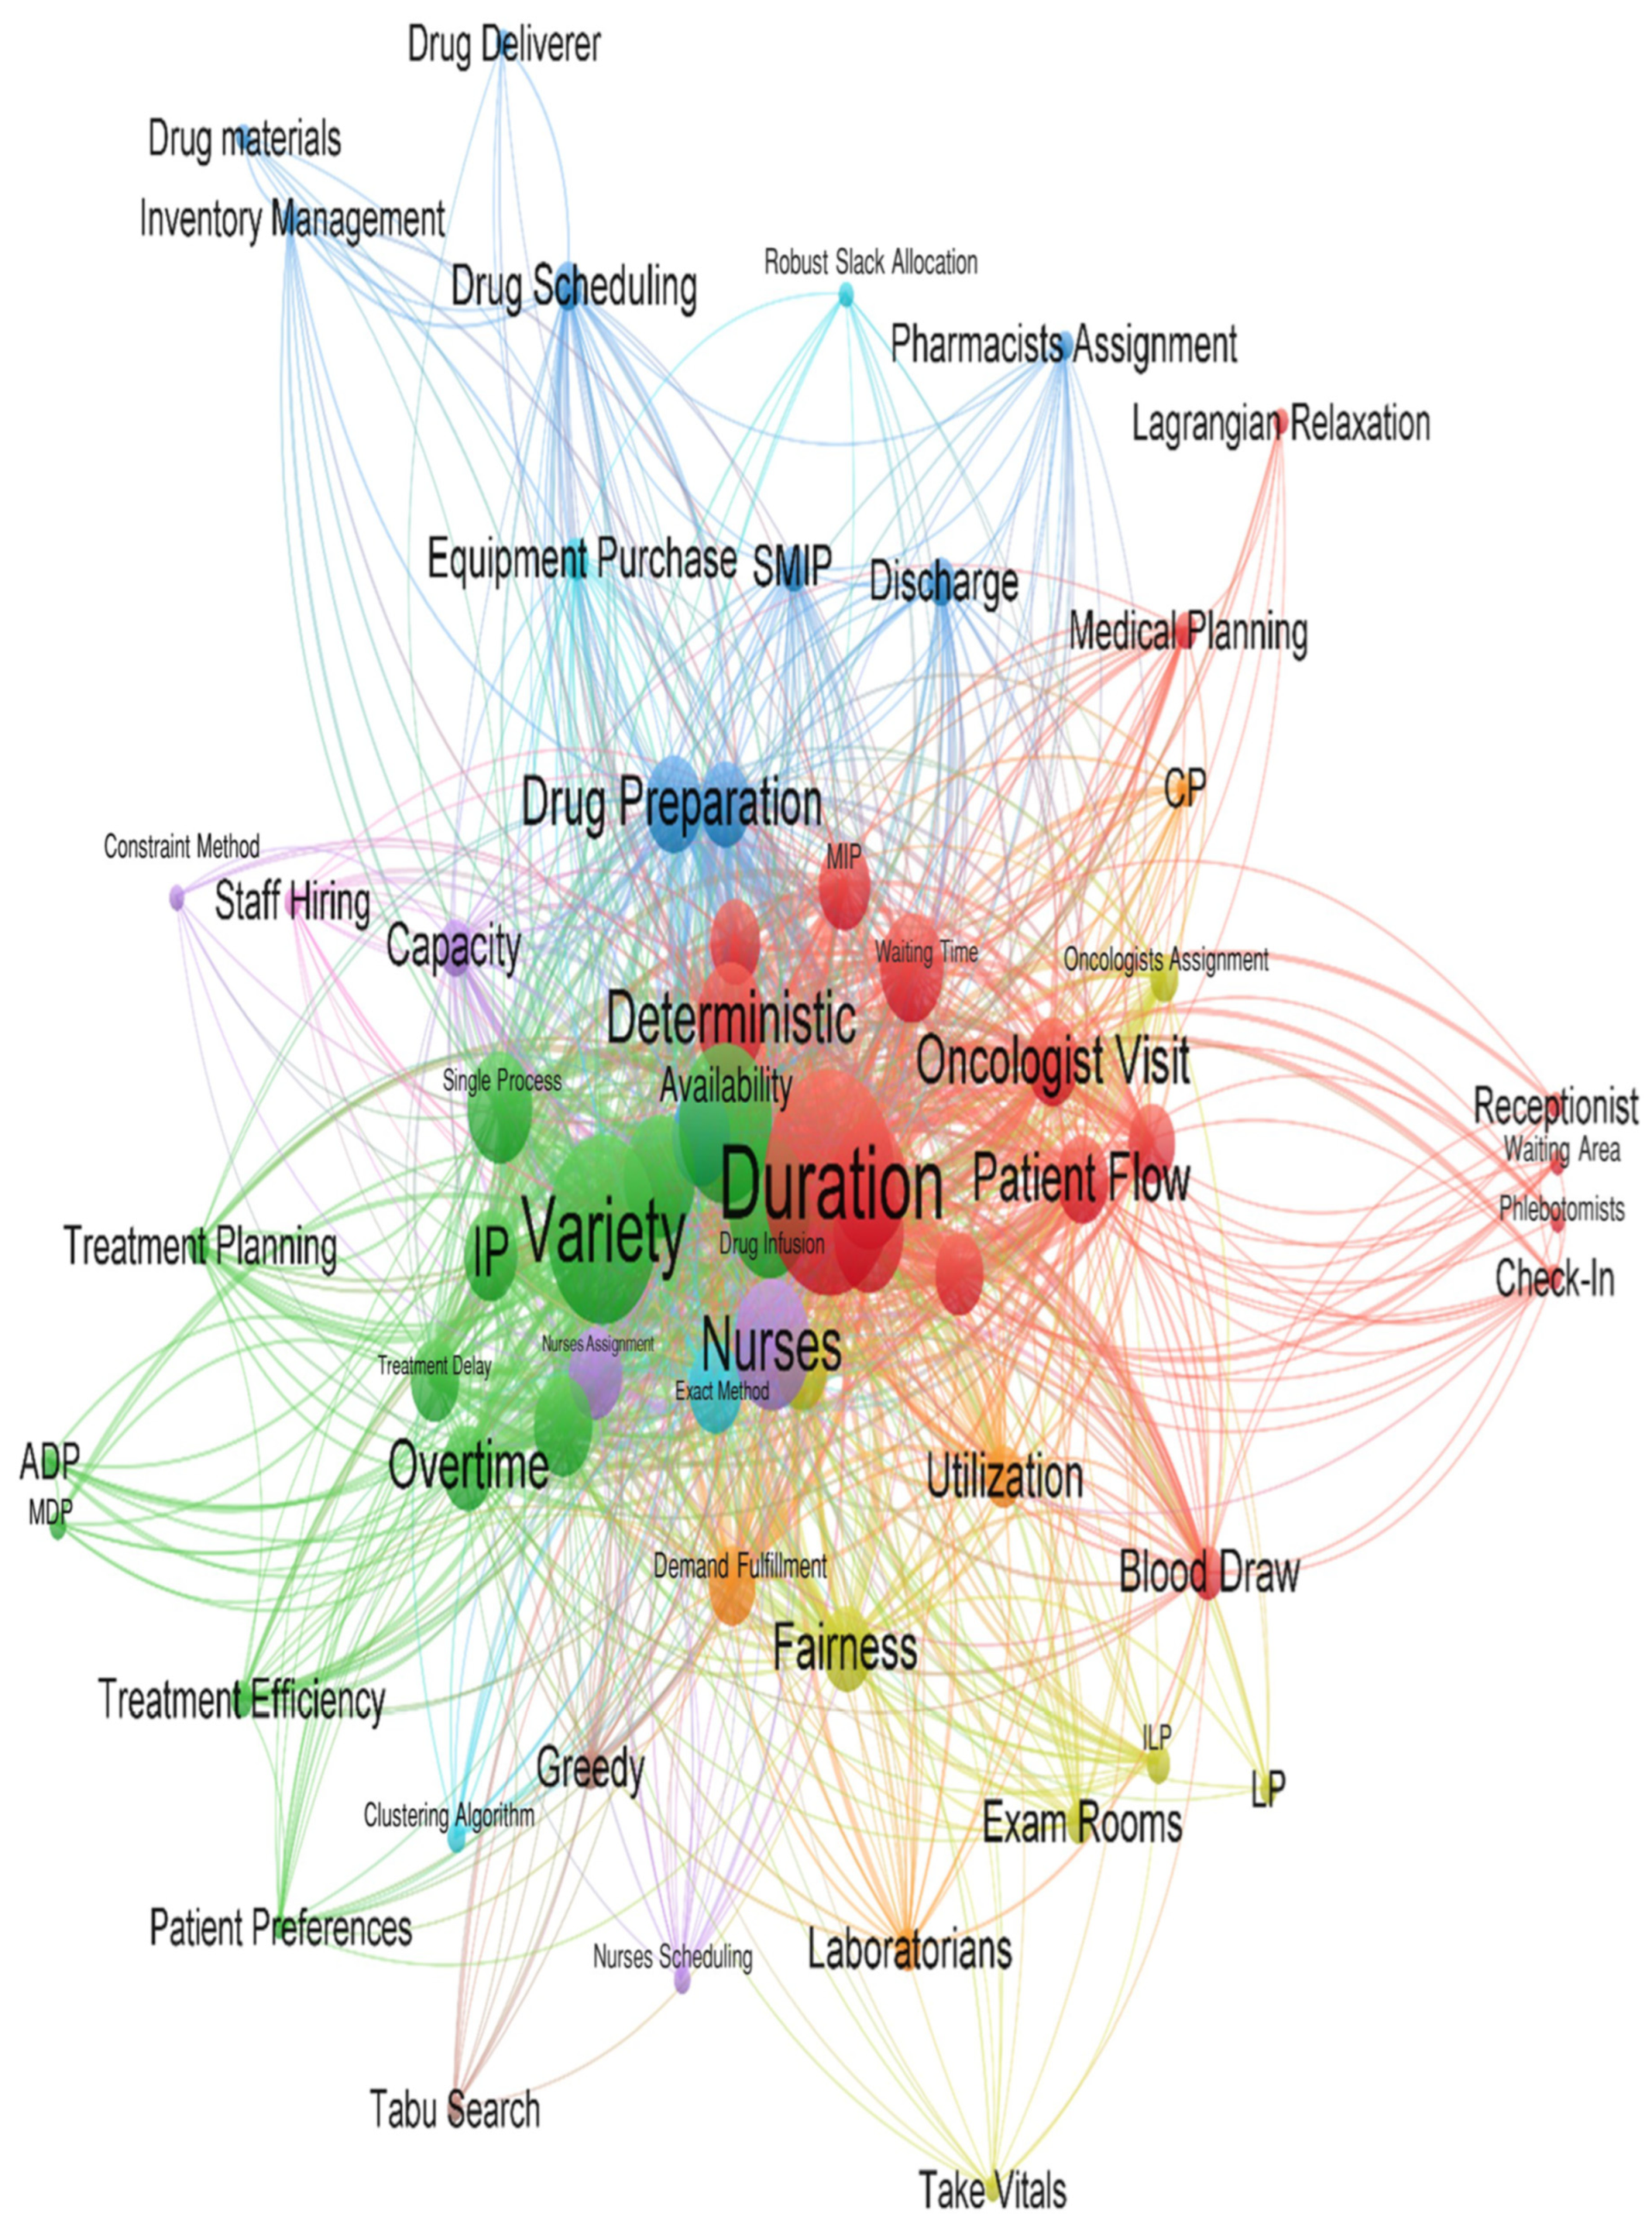
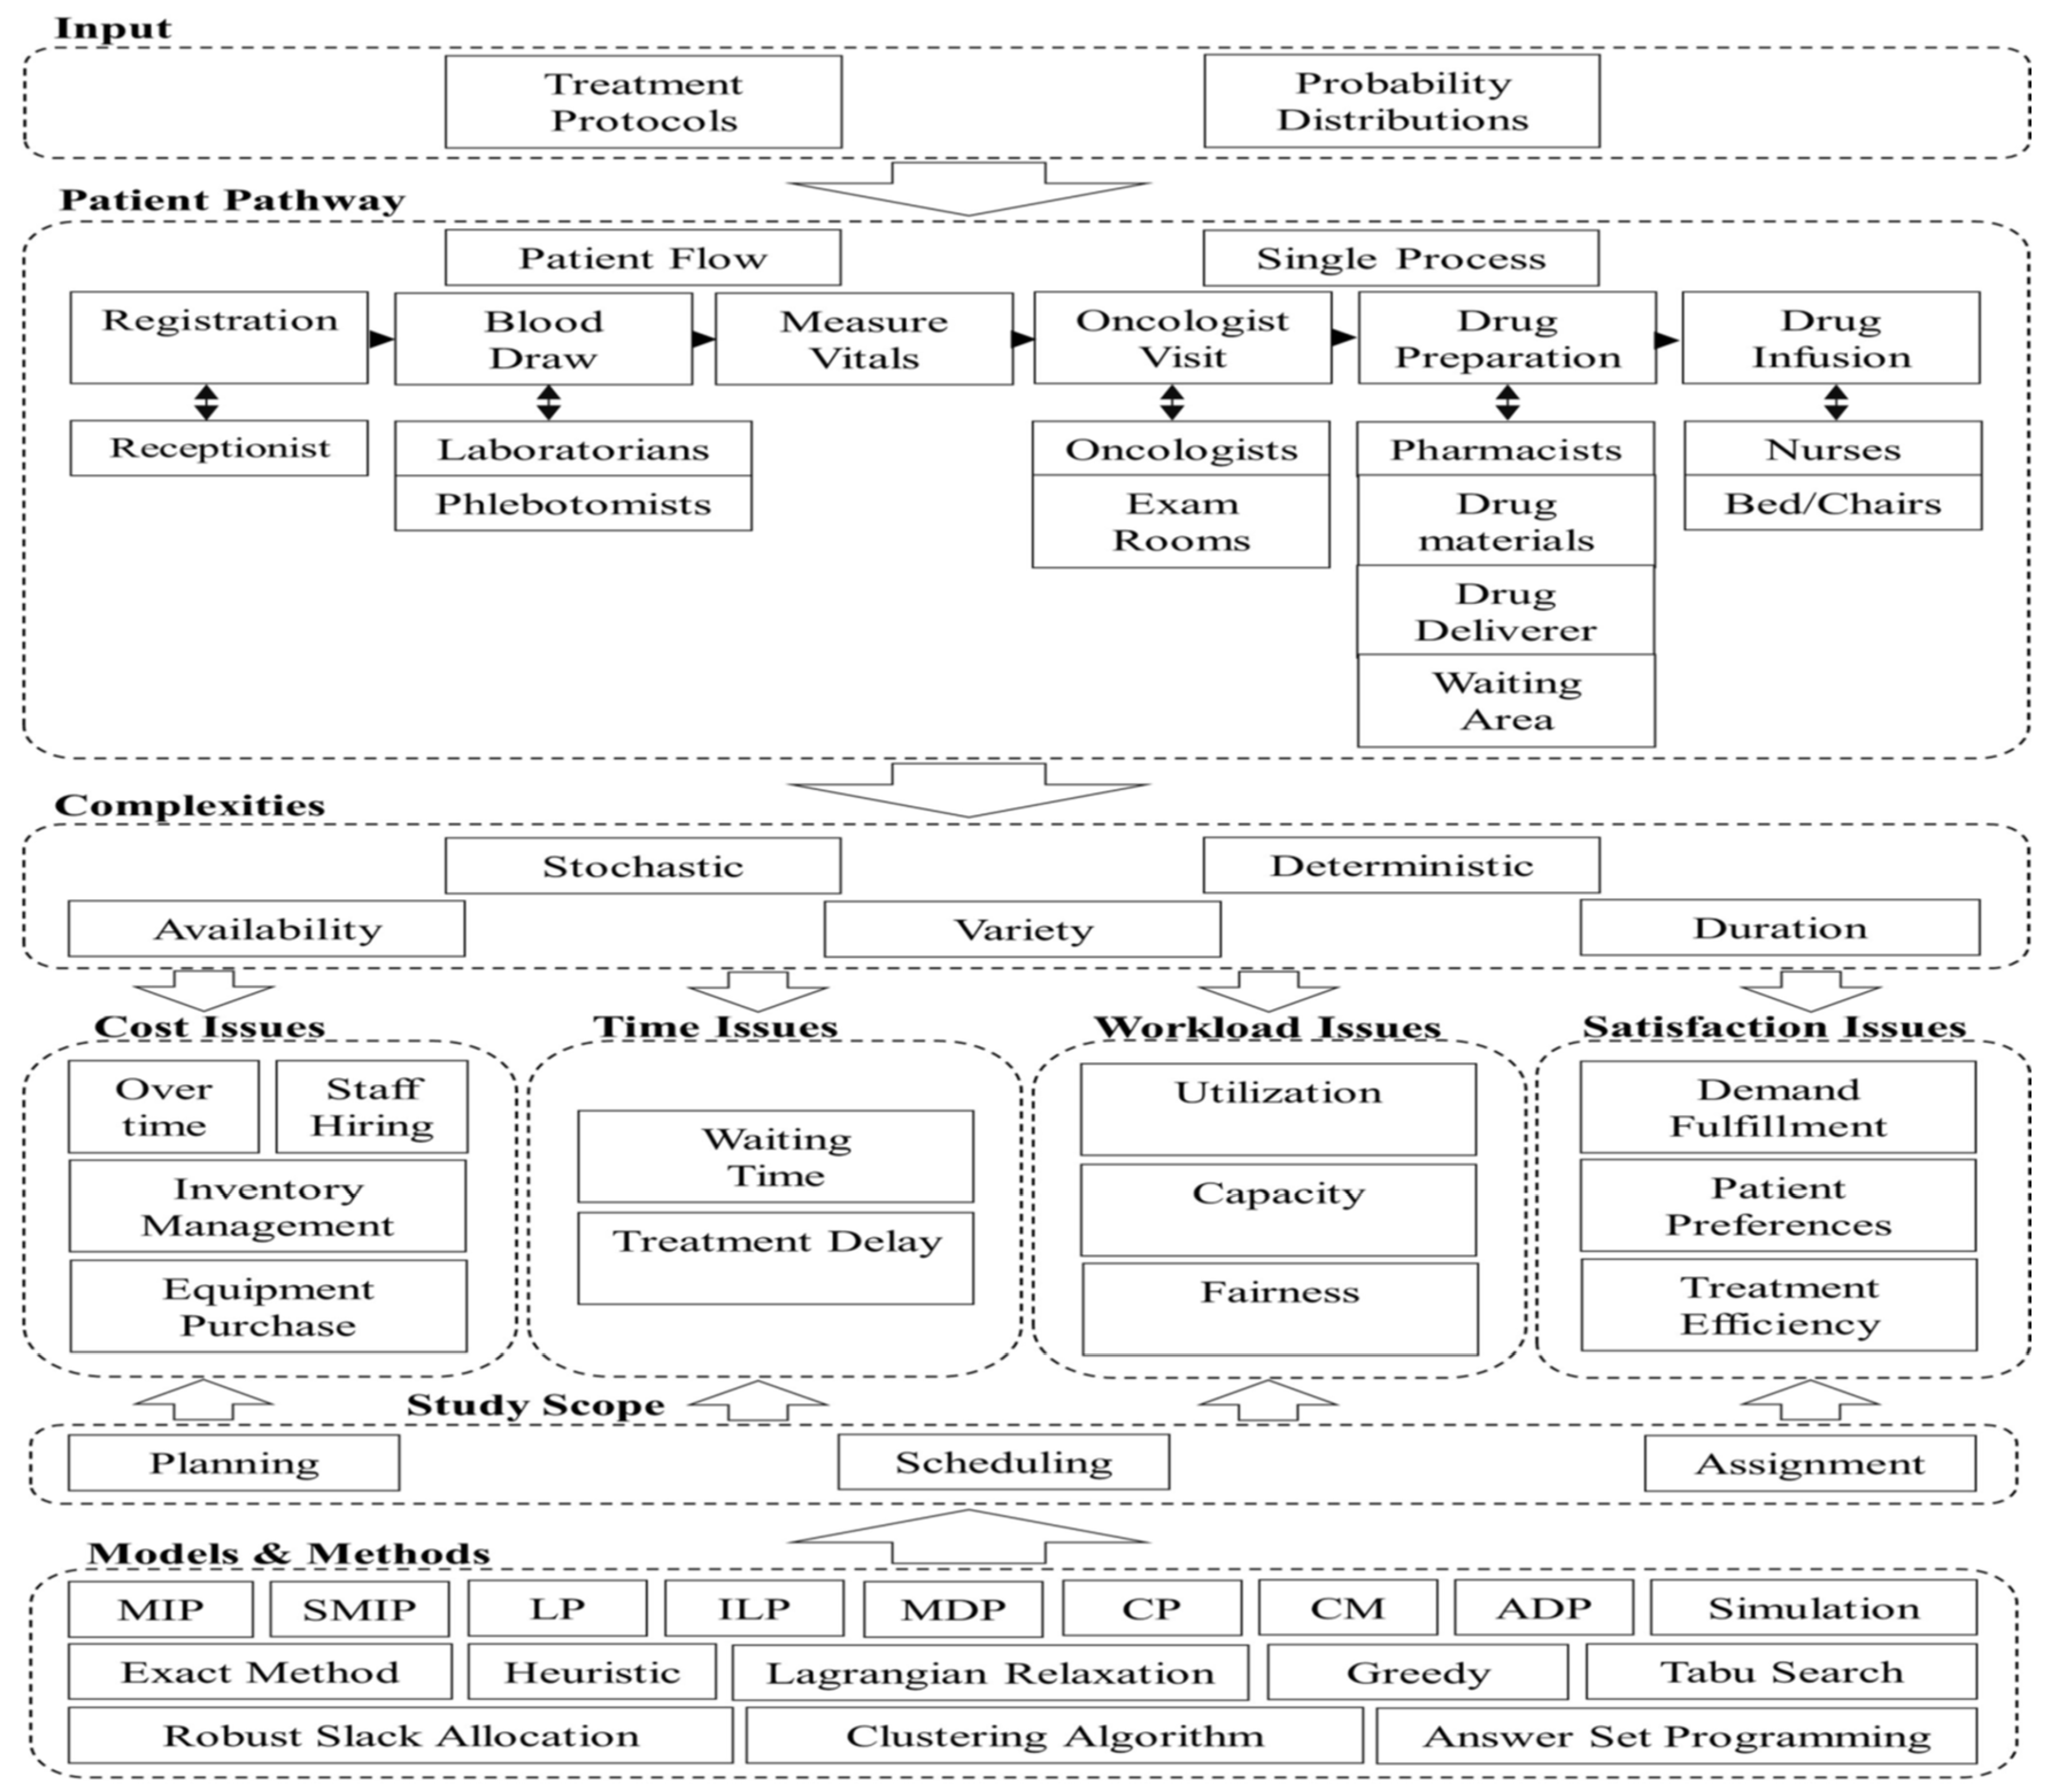
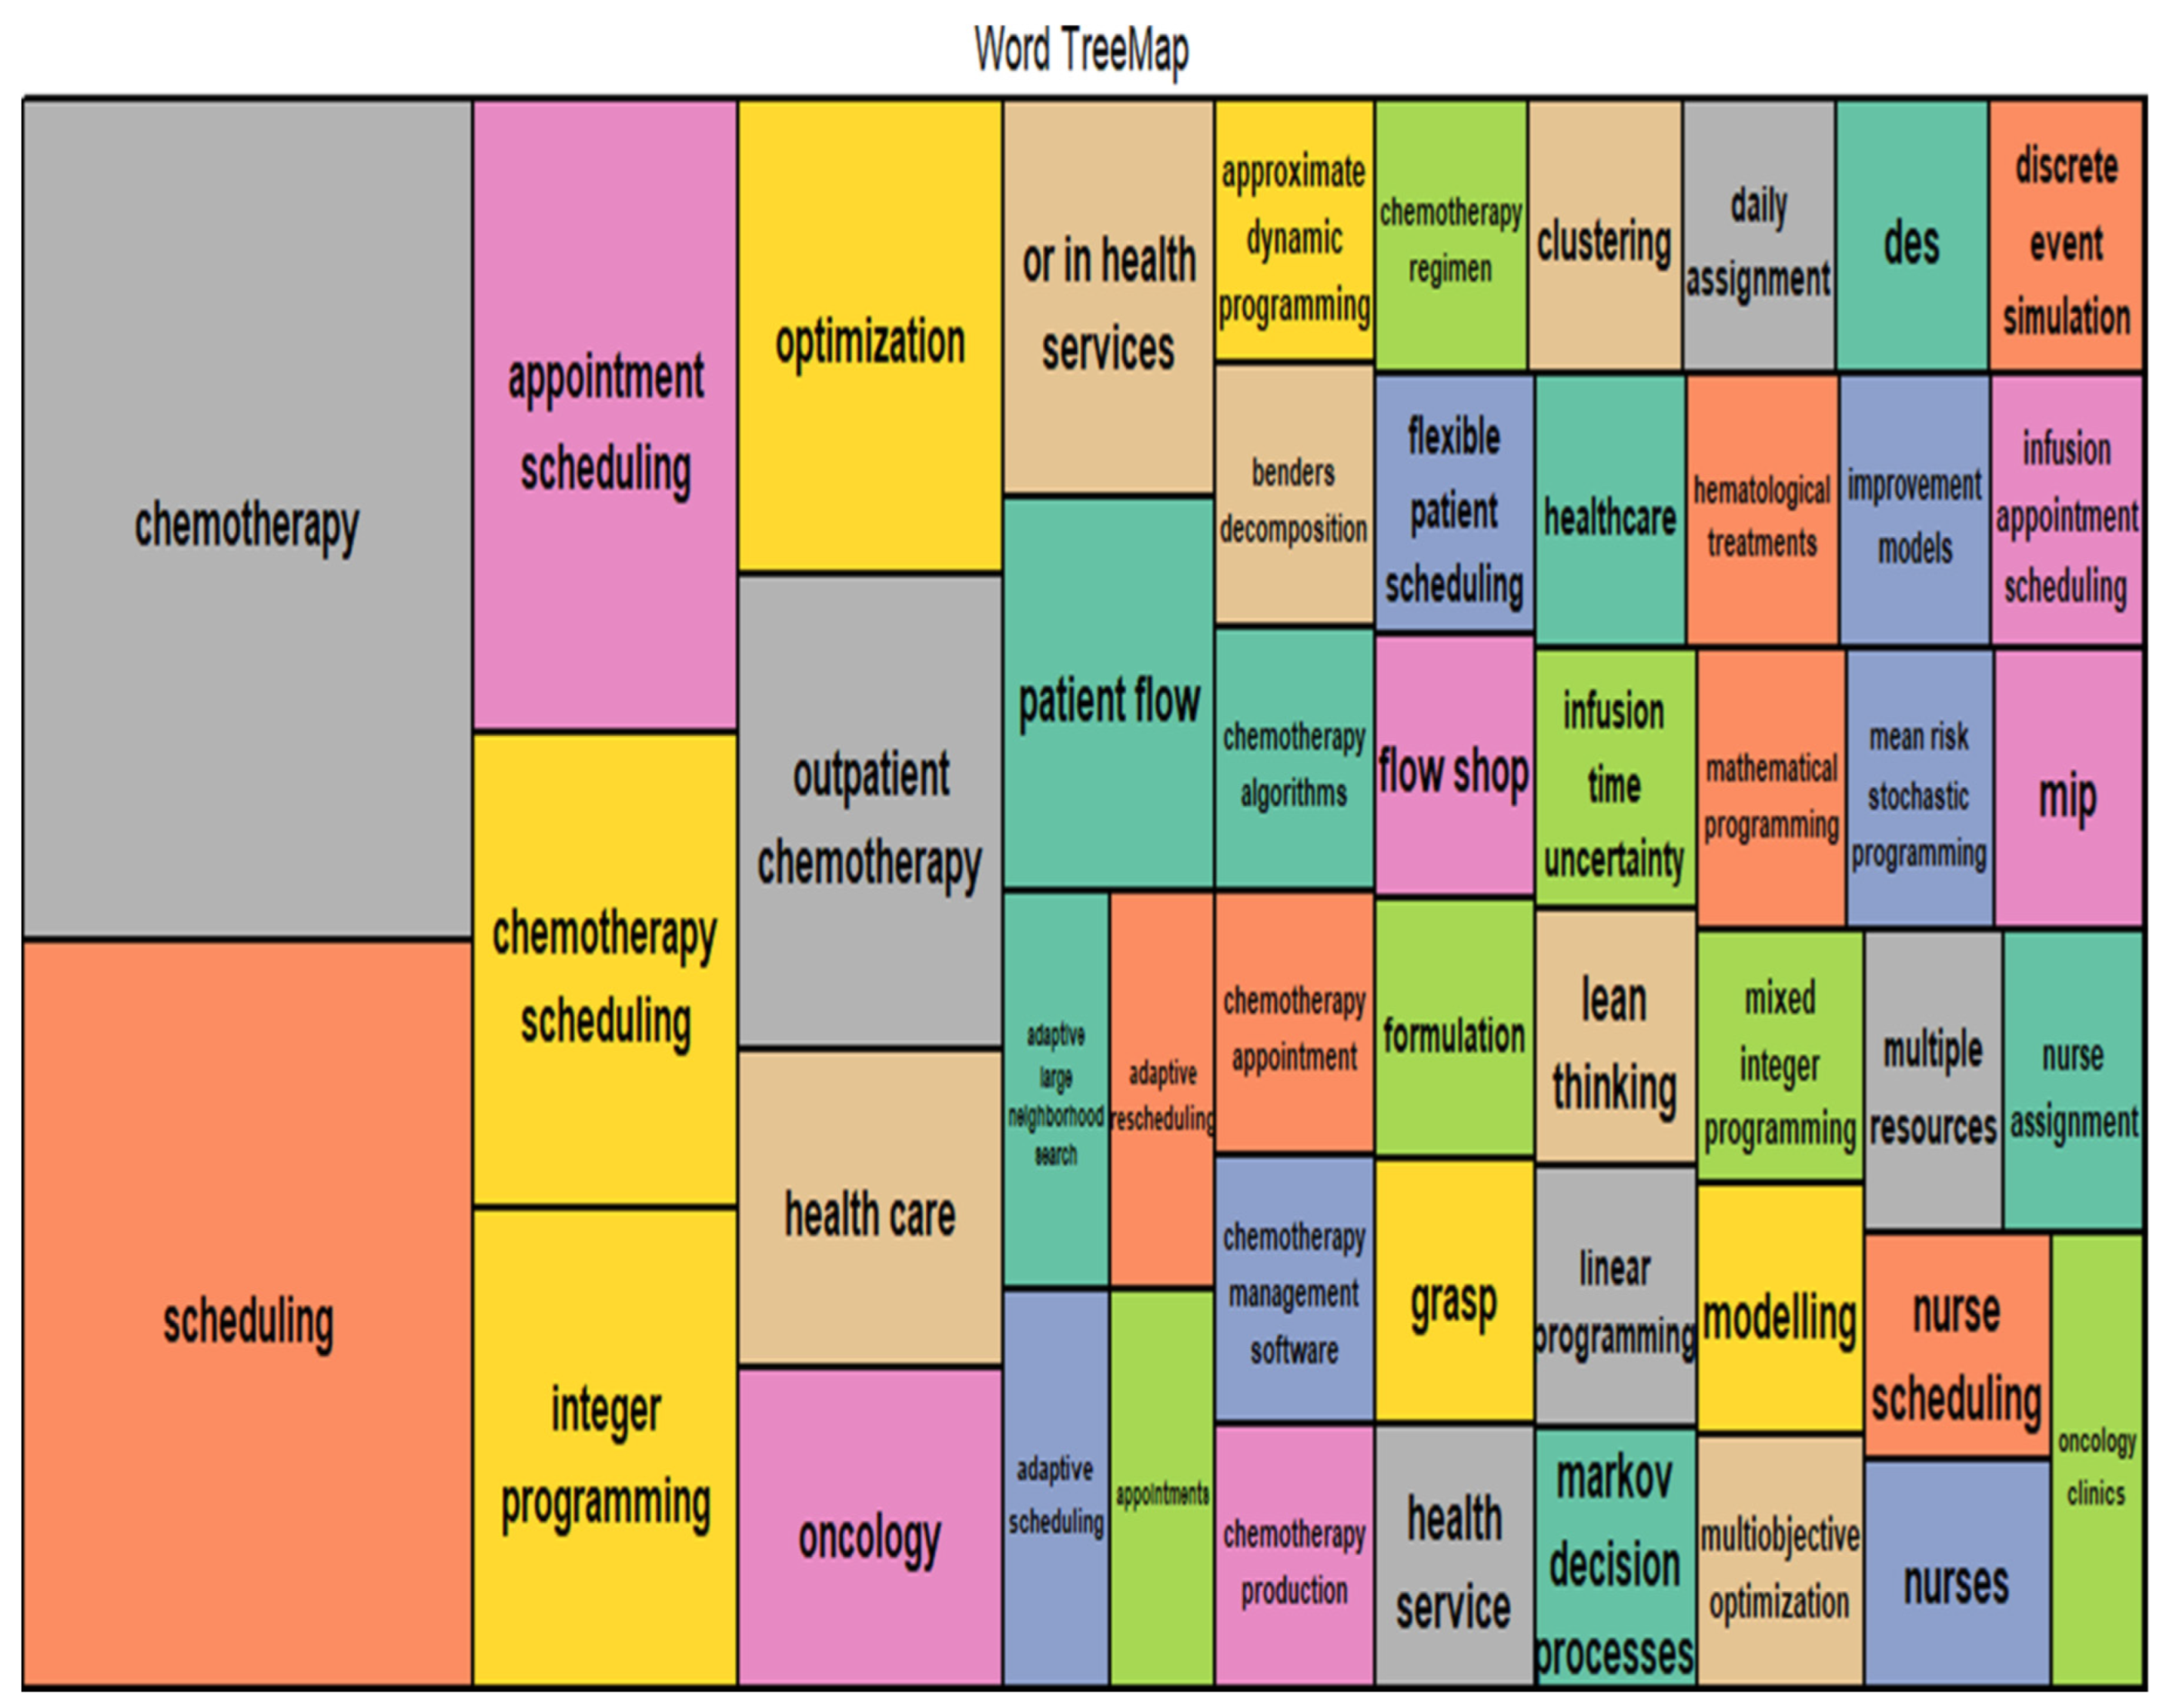
  • The current state of research in optimizing outpatient chemotherapy planning (OCP)[40], highlighting that many existing studies are still in the development phase and have not fully addressed important gaps, identifying eight key areas, including creating a comprehensive optimization model that can improve performance without oversimplifying the problem. Additionally [40], there is a need for faster methods, known as heuristics, to solve complex OCP models effectively and to improve processes in real-world applications, as summarized by the following Figure (c.f., [40]).
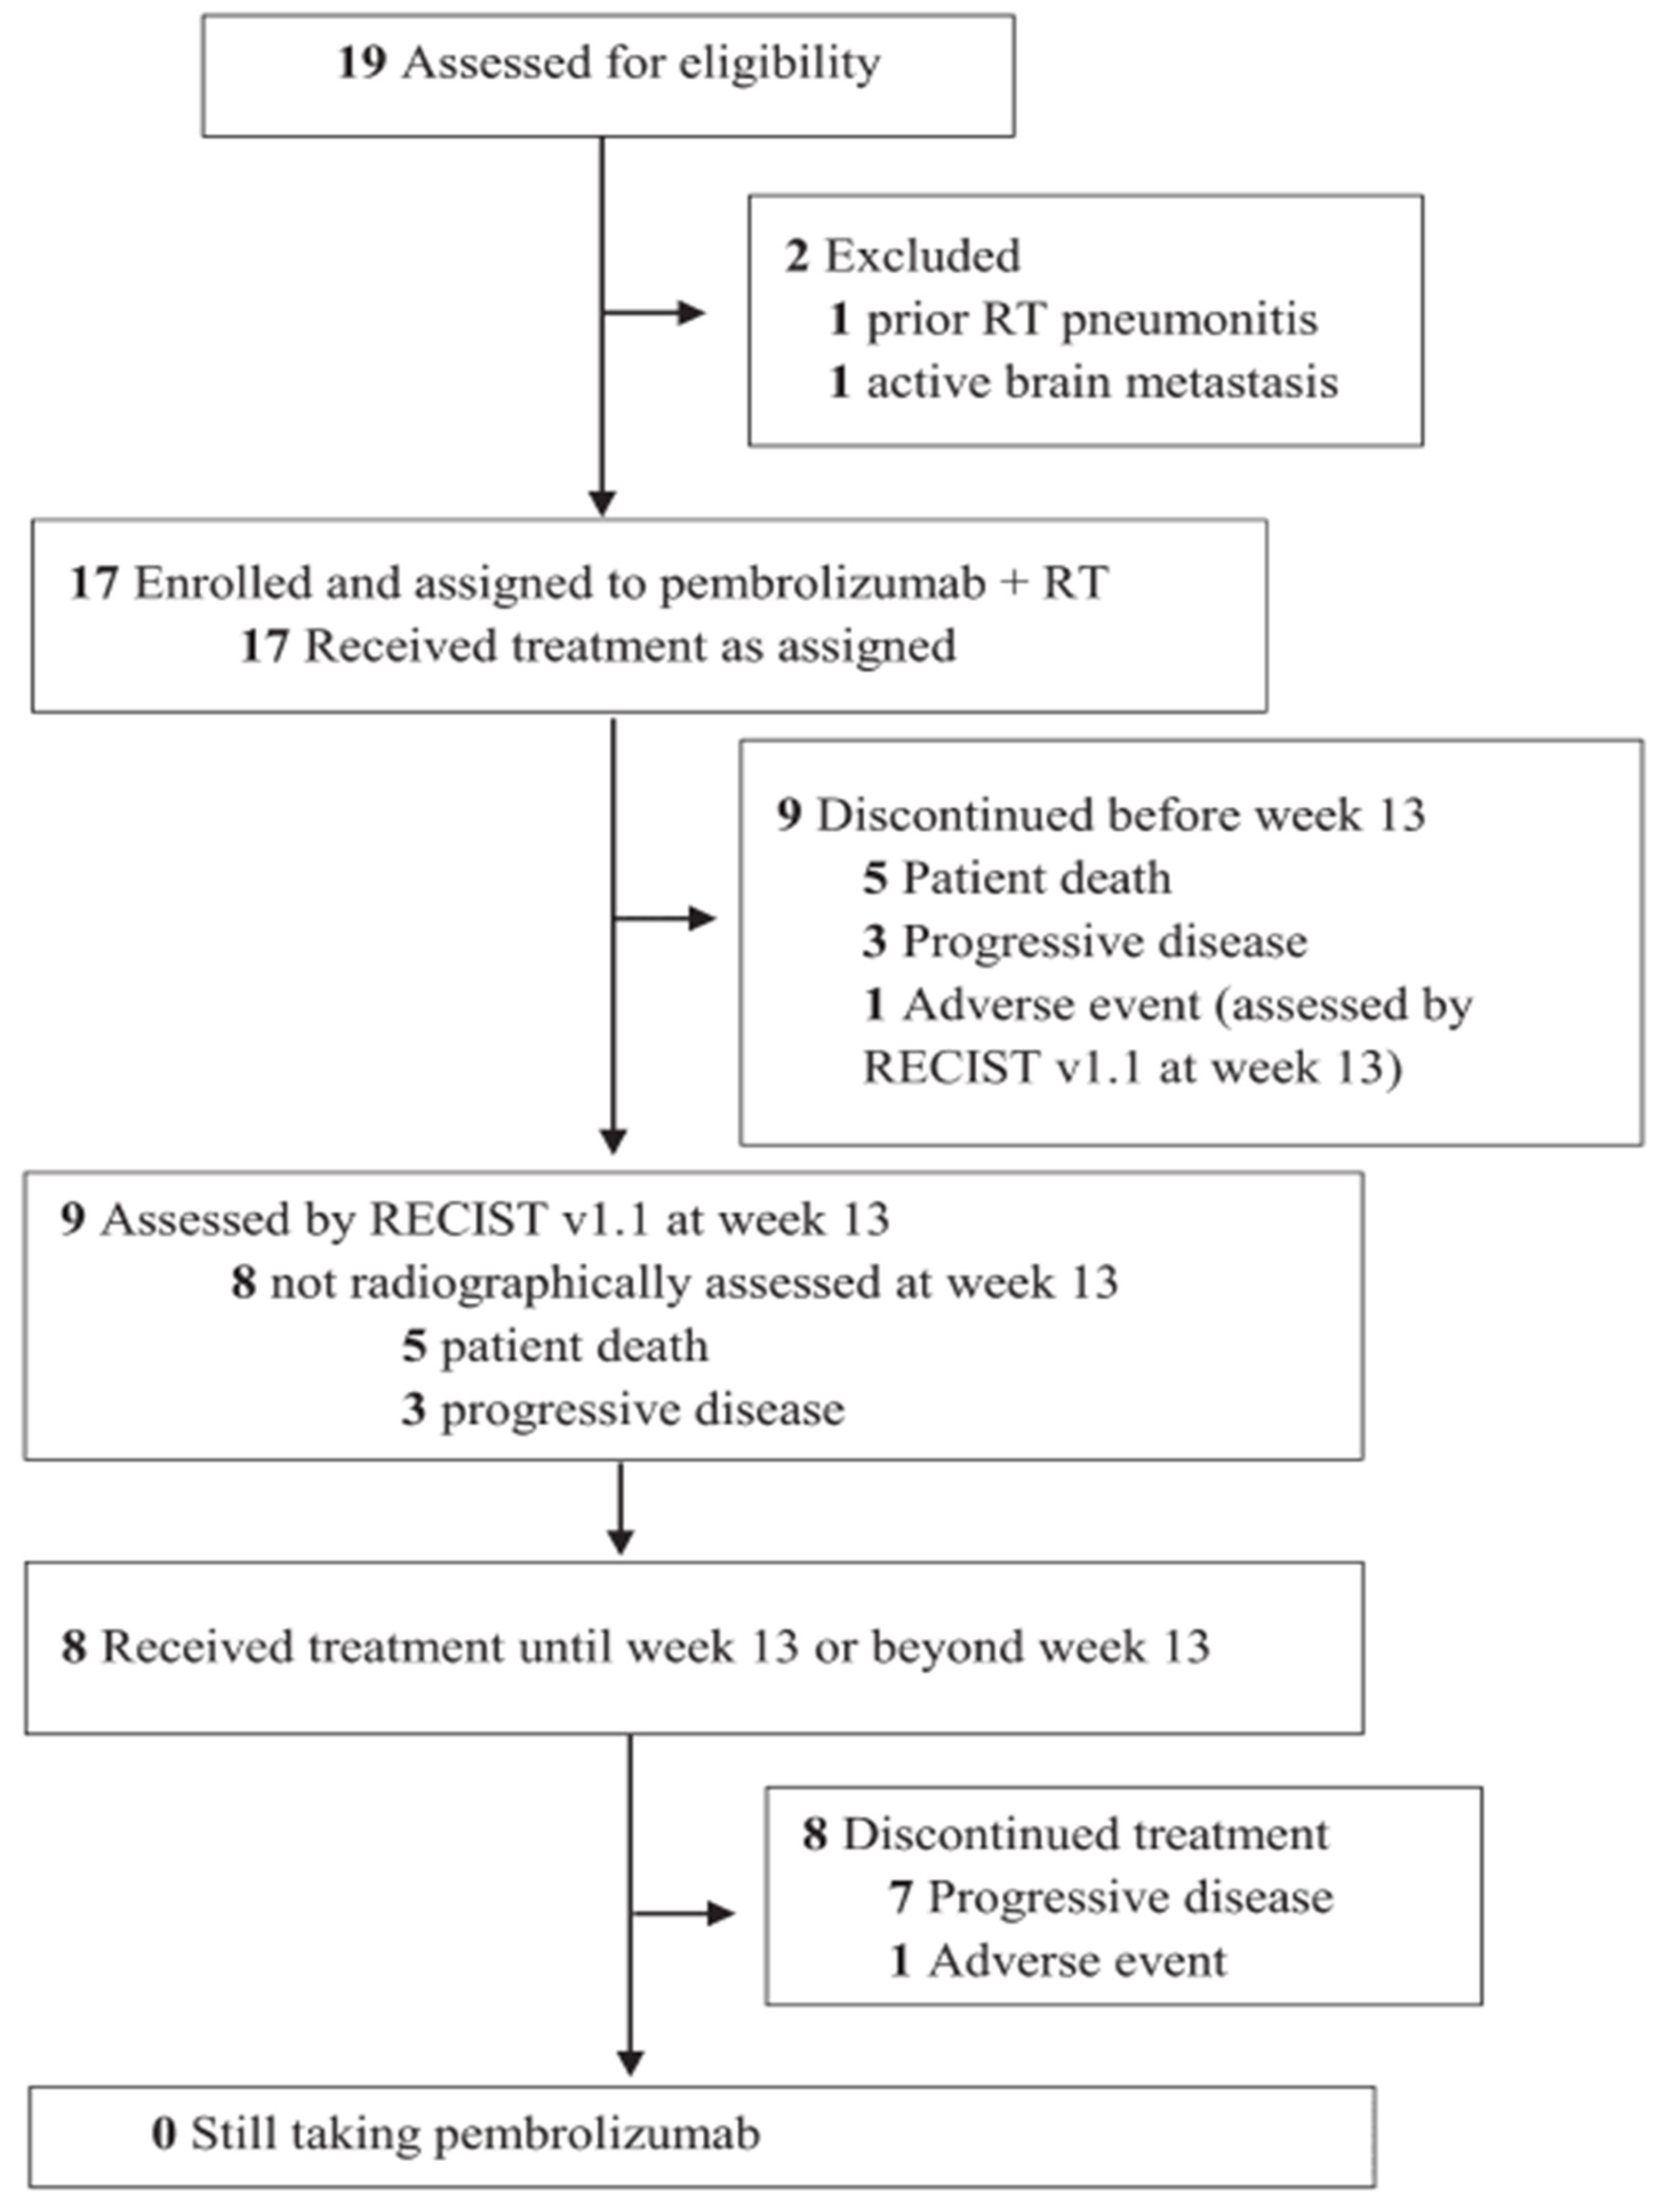
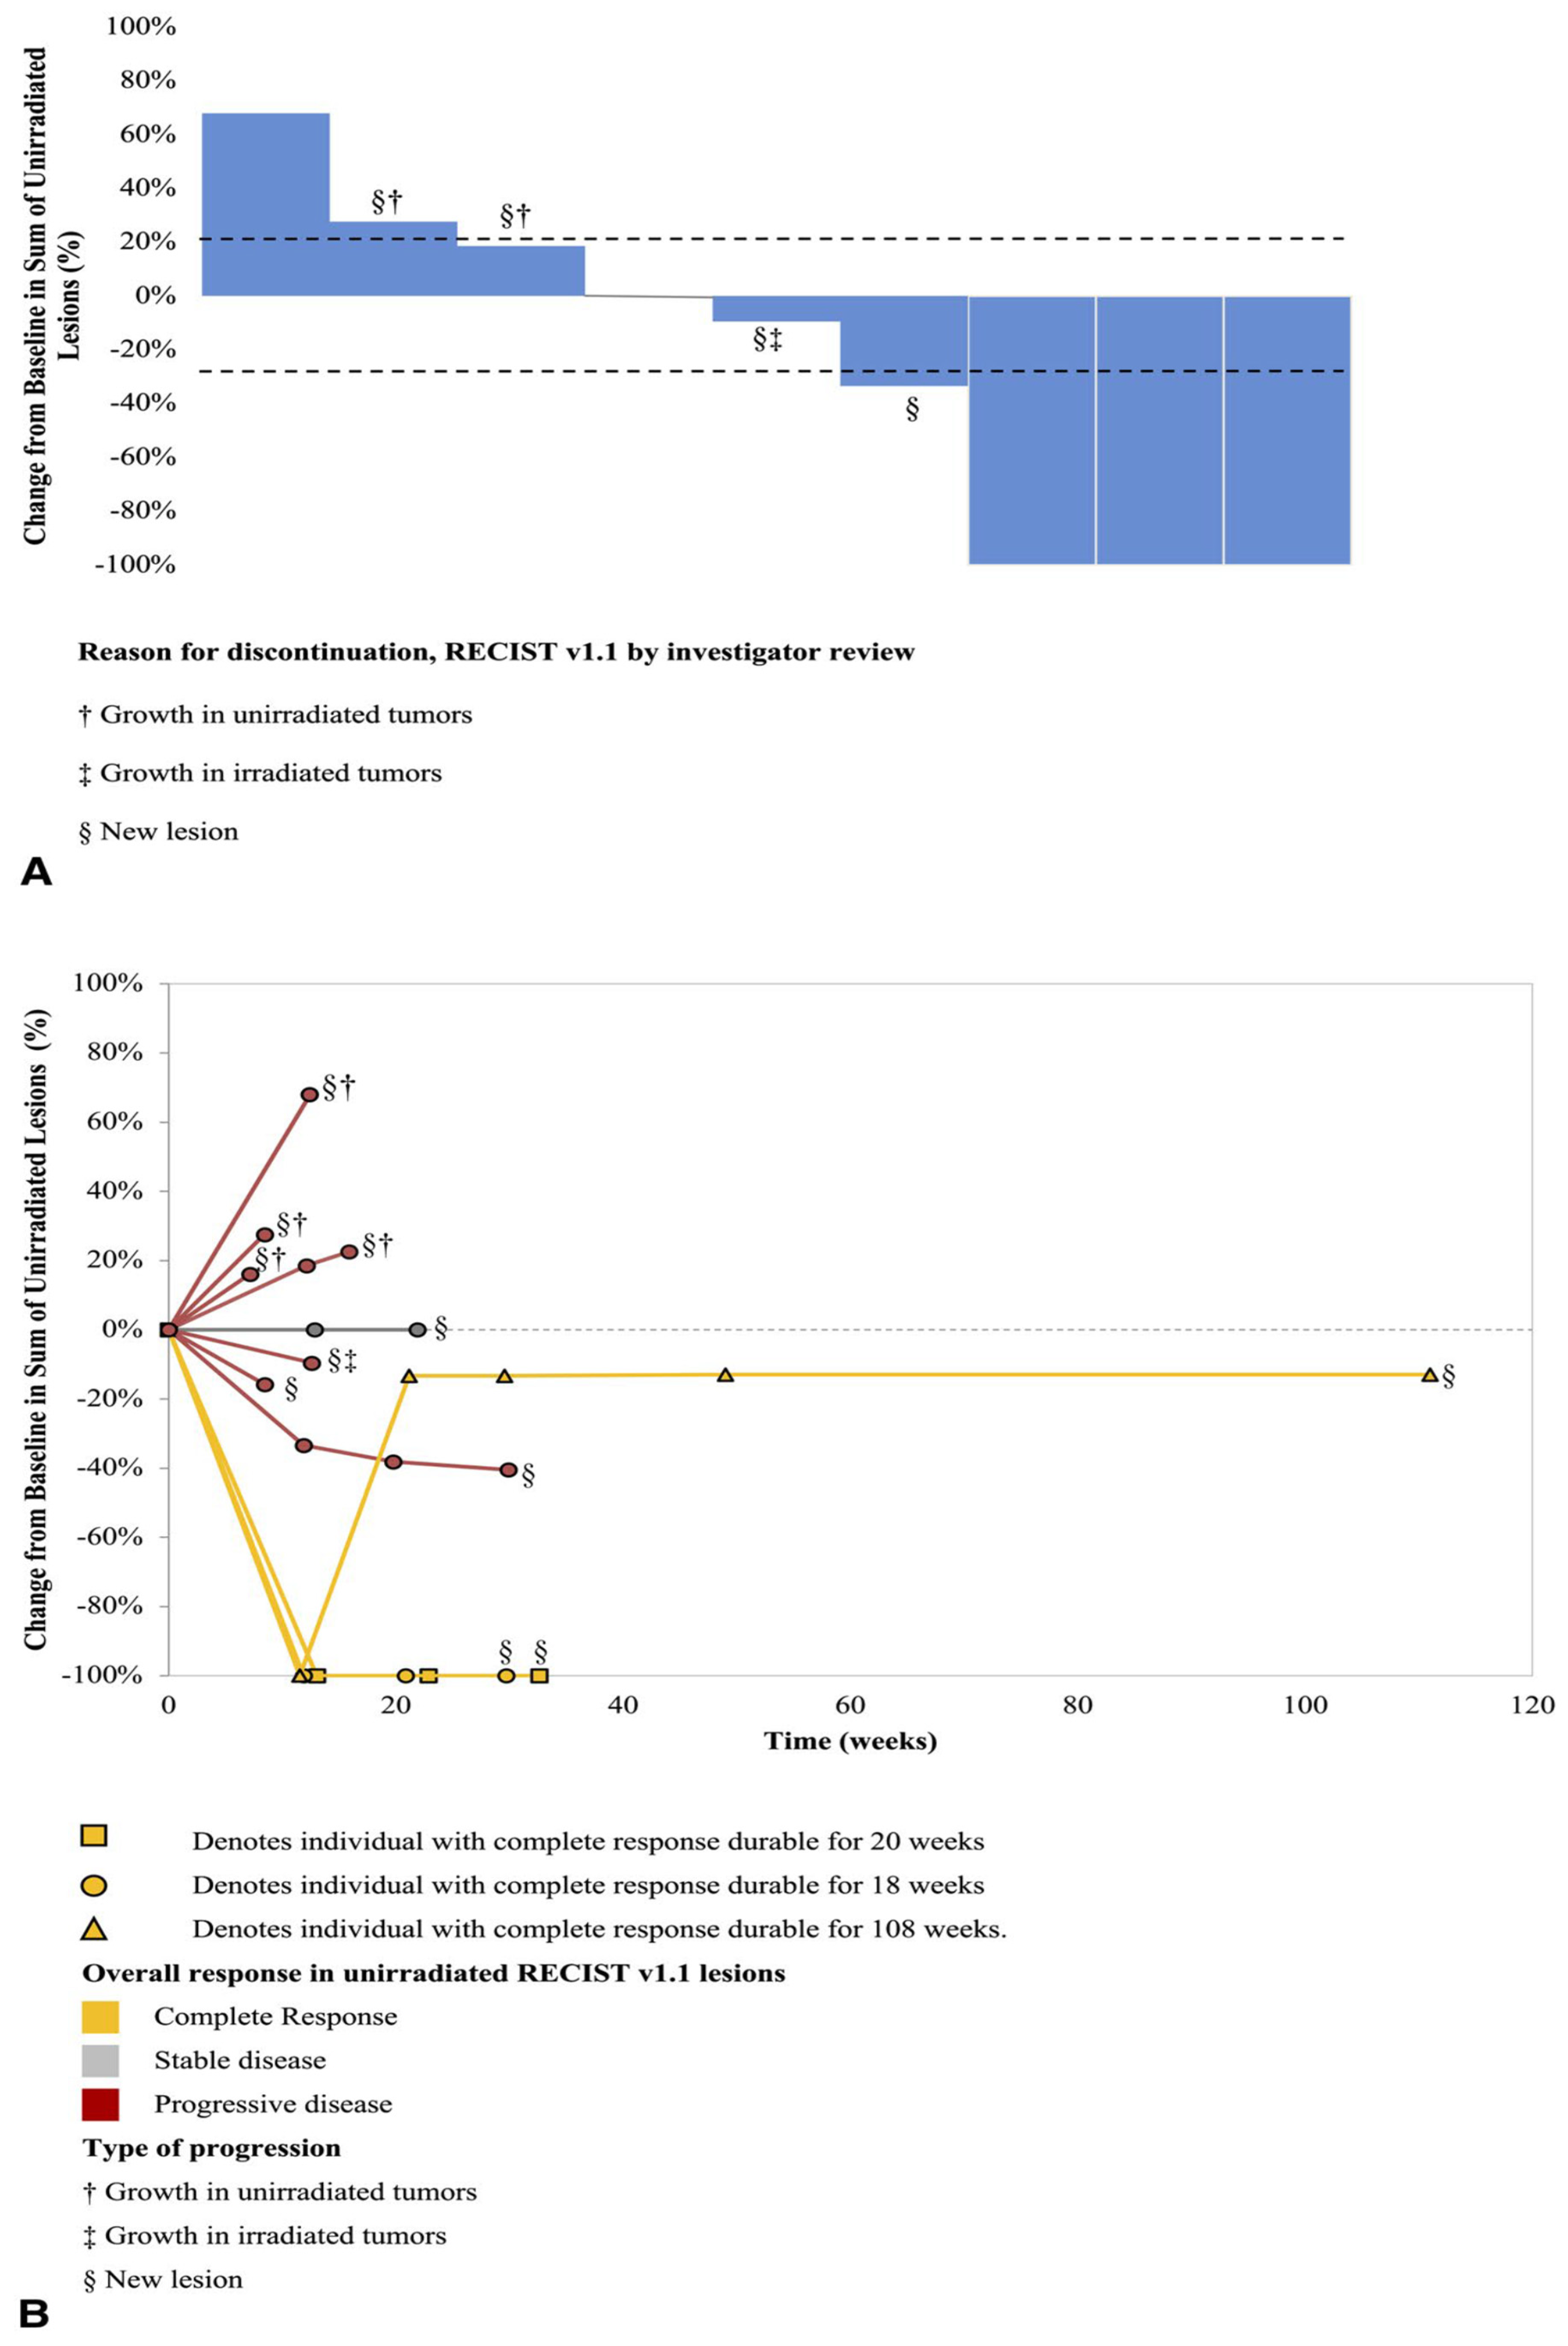
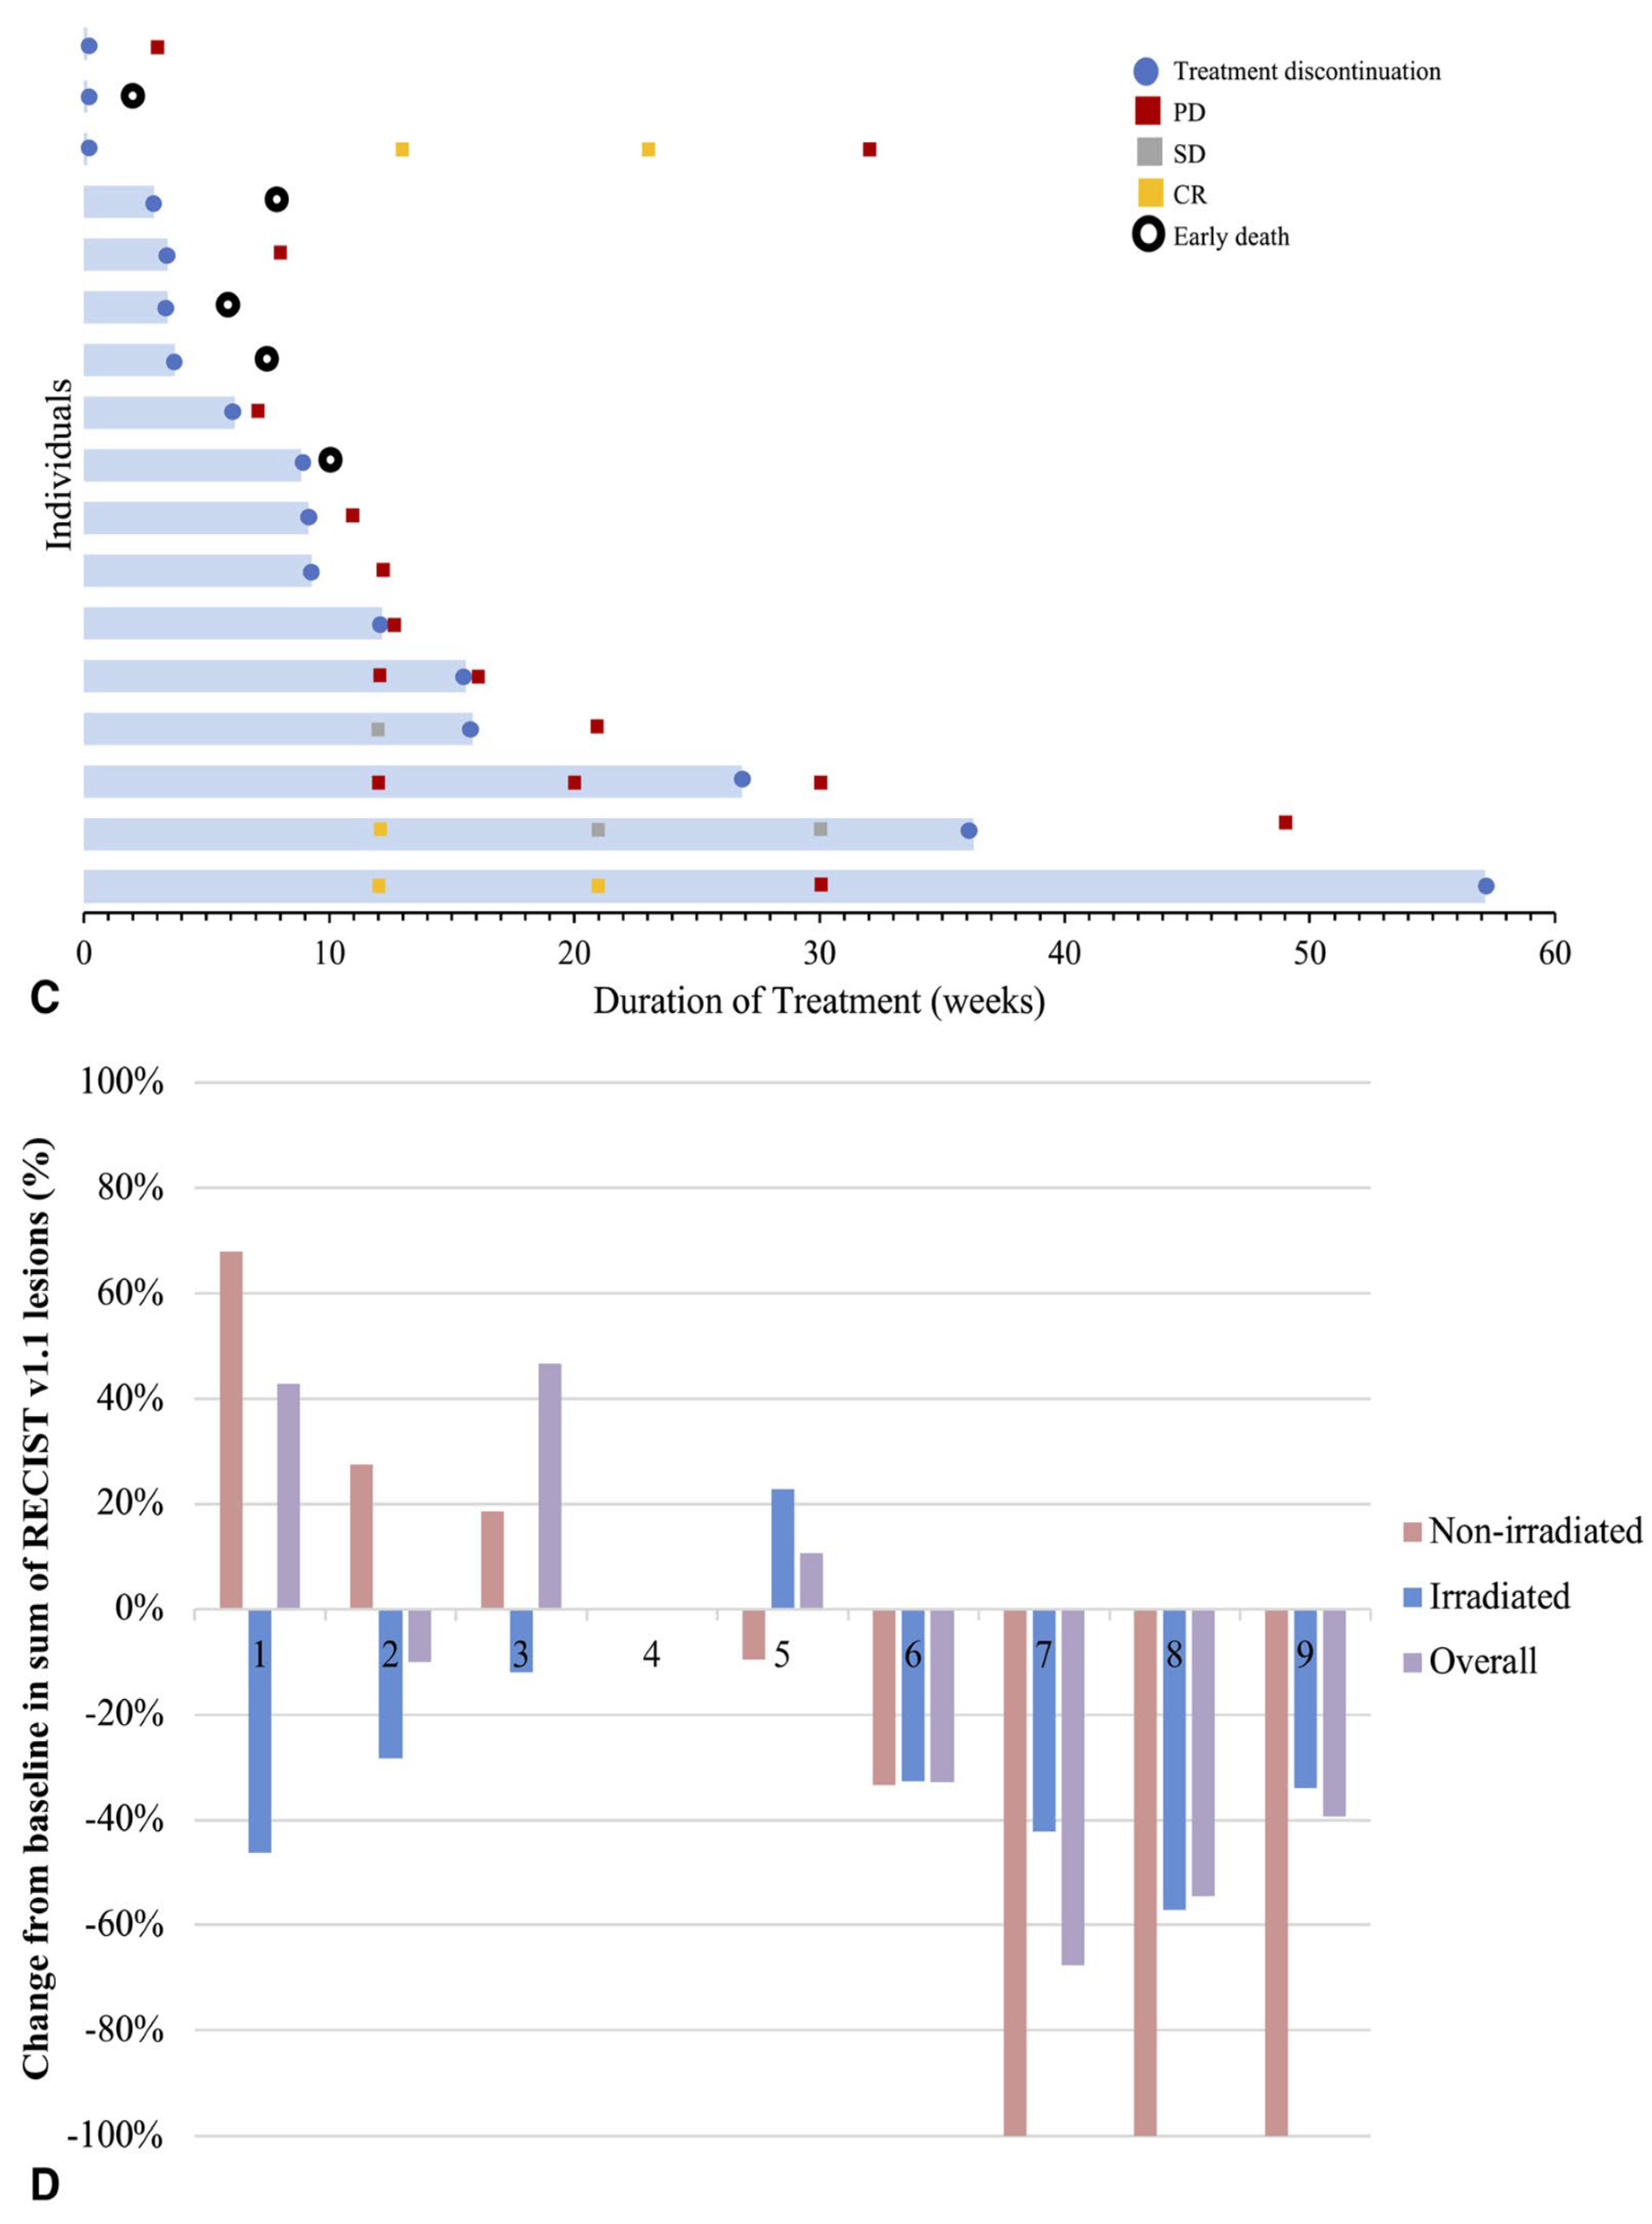
  • The authors [55] found that giving pembrolizumab (an immunotherapy drug) and radiation therapy (RT) at the same time made it hard to see how much each treatment contributed to the overall effect. Because the number of patients was small [55], the researchers couldn’t analyze many important factors that might affect treatment response, like previous treatments or tumor characteristics. They [55] also noted differences in how tumors responded, with some tumors showing complete responses while others did not, which complicates understanding how effective the combination treatment really is.
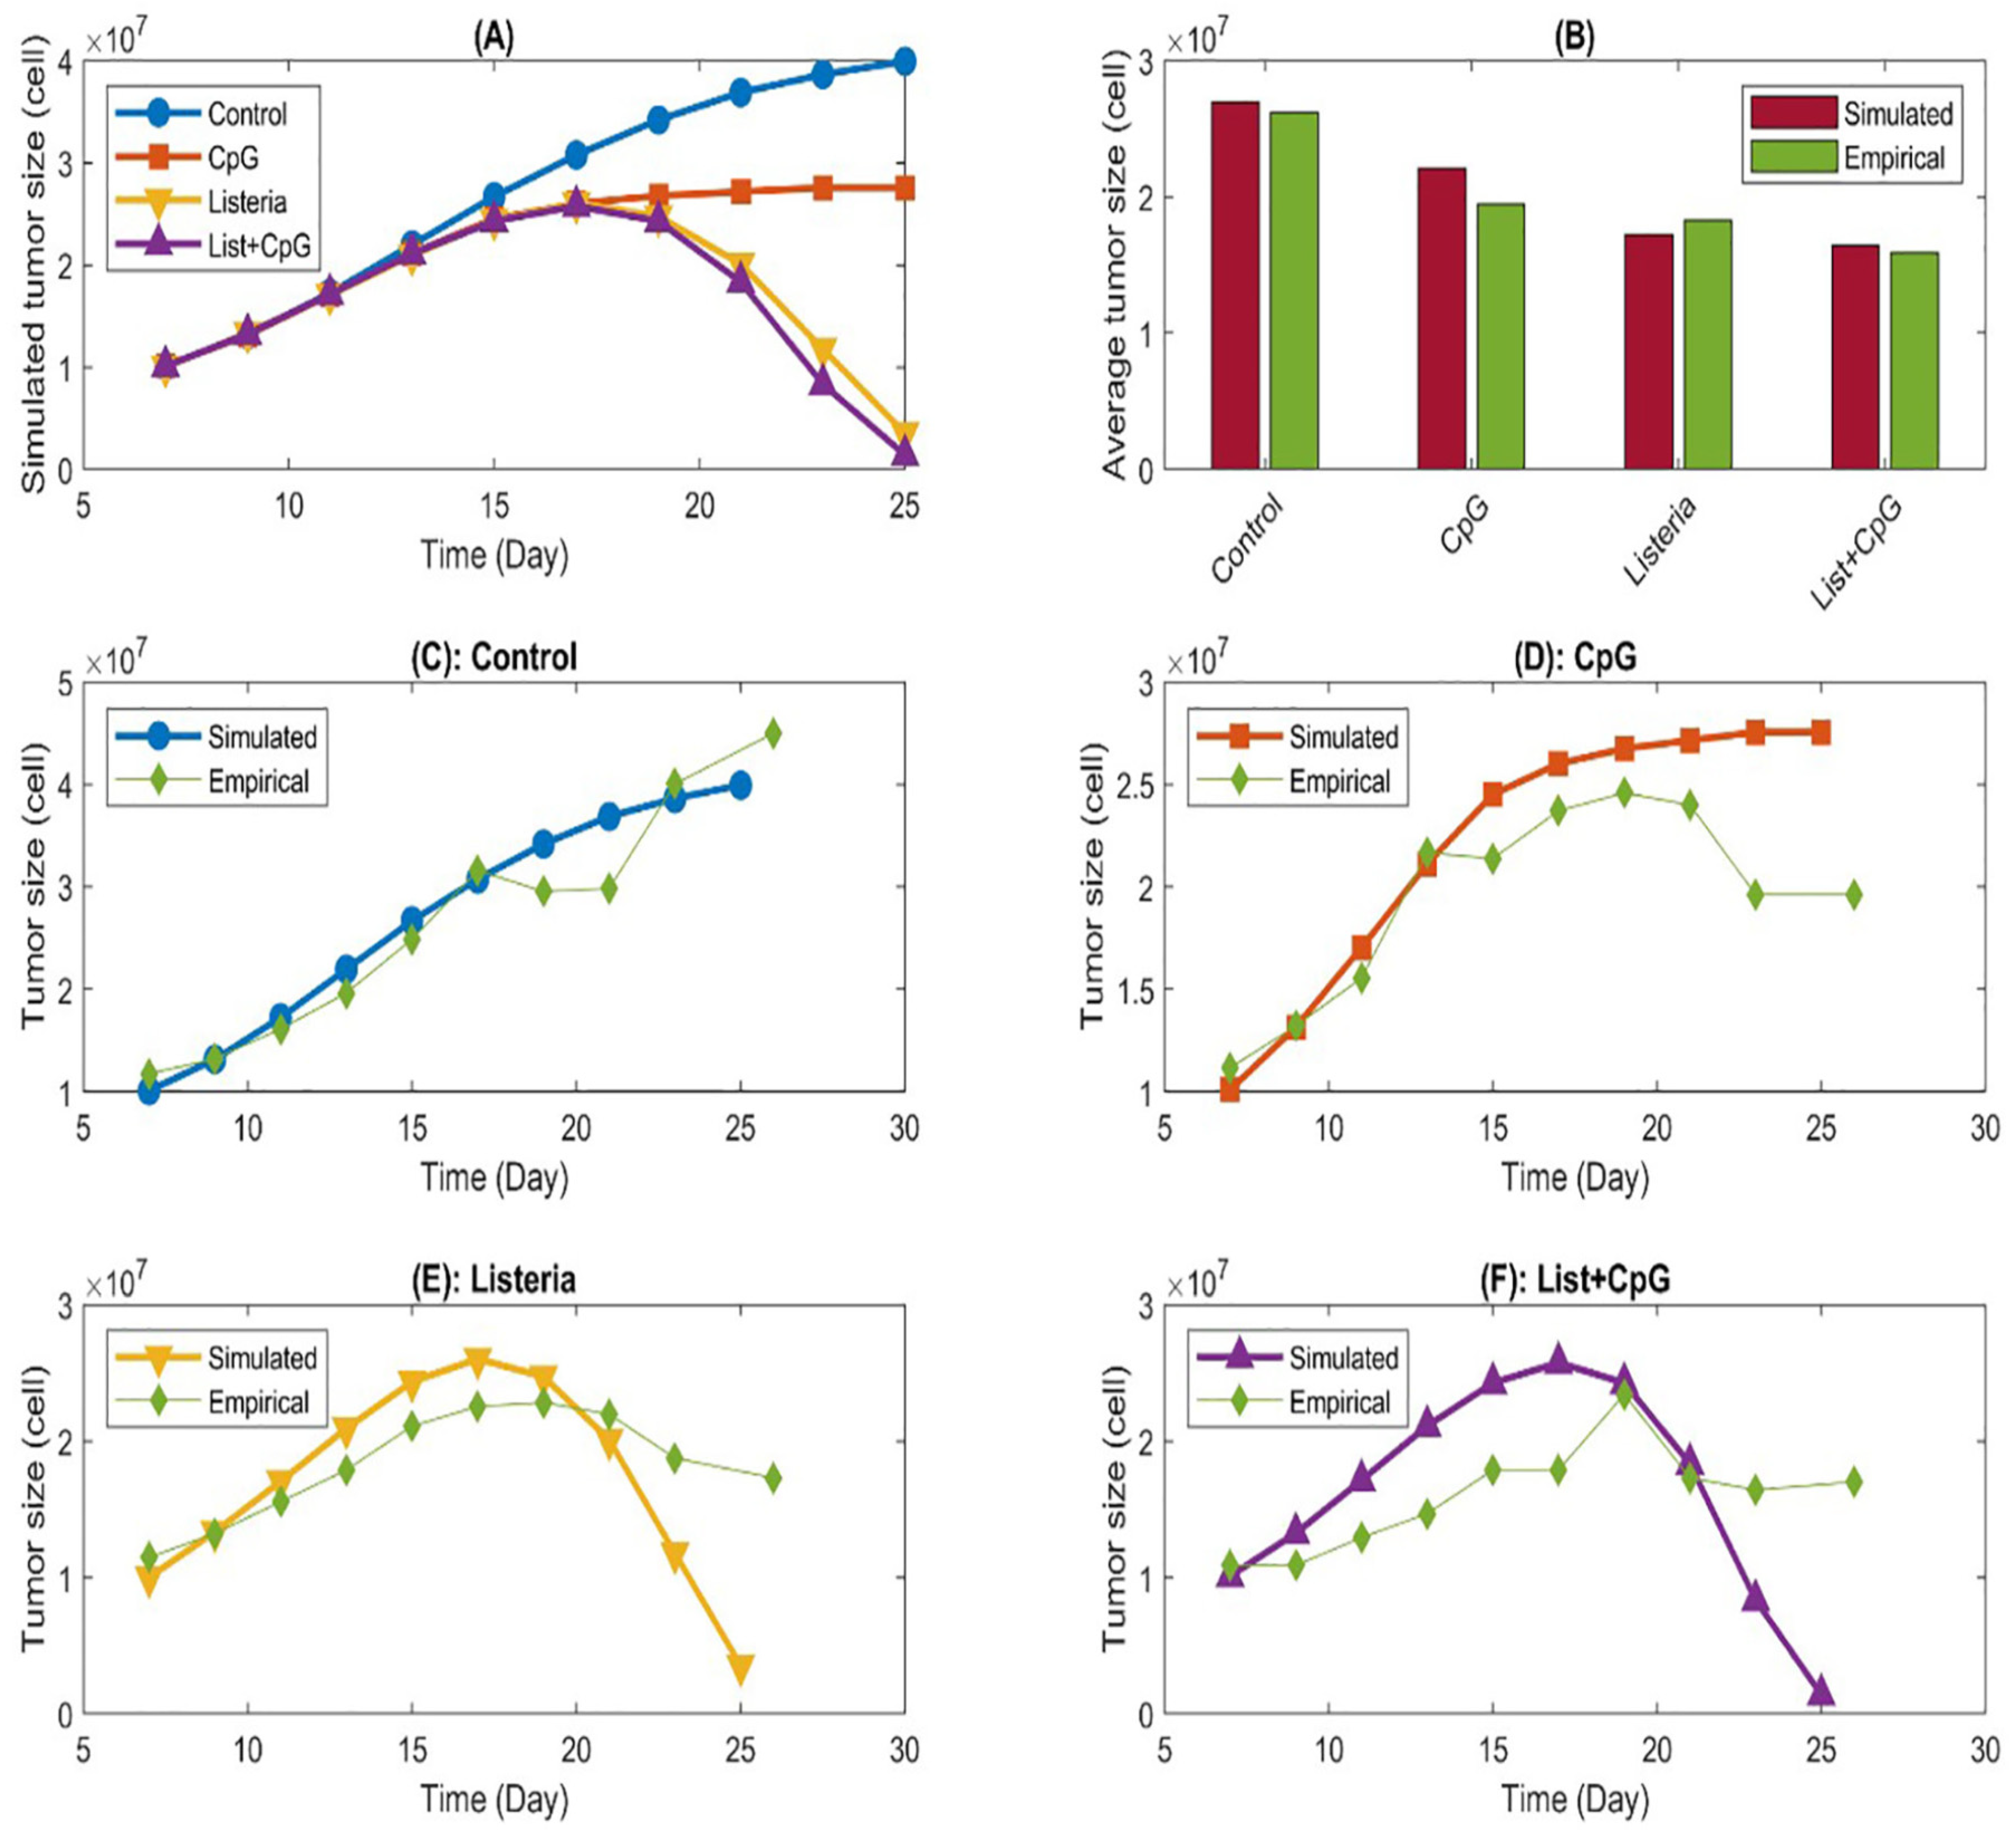
  • The study [76] acknowledged several limitations and suggests future directions for improving the mathematical model used in DC immunotherapy. Key issues include large discrepancies between experimental data and model predictions [76], which may stem from measurement errors or insufficient sample sizes. The authors [76] recommended incorporating more experimental data, especially regarding specific immune cell types [76], and conducting sensitivity analyses to simplify the model by focusing on the most important parameters, ultimately enhancing its accuracy and applicability in understanding tumor-immune interactions.
  • A strong and effective team of scientists working together is essential for developing biomarkers [89], which are important tools for diagnosing and treating diseases. By encouraging collaboration among researchers, the goal is to speed up the process of taking new scientific discoveries from the lab (bench) to real-world medical applications (bedside). This teamwork ultimately aims to enhance patient care and improve health outcomes. Until current, this open problem has not been solved yet.
The next phase of research includes finding possible solutions to the provided open problems, as well as the exploration of more mathematical applications in other interdisciplinary fields of human knowledge.
Figure.
Figure.
Preprints 145474 g051

References

  1. Primac, I., Penning, A., & Fuks, F. (2022). Cancer epitranscriptomics in a nutshell. Current opinion in genetics & development, 75, 101924. [CrossRef]
  2. Pearson, E. G. (2023). In a nutshell. [CrossRef]
  3. El Rami, F. E., Barsoumian, H. B., & Khneizer, G. W. (2020). Hereditary diffuse gastric cancer therapeutic roadmap: current and novel approaches in a nutshell. Therapeutic advances in medical oncology, 12, 1758835920967238. [CrossRef]
  4. Li, Z., Ke, X., Zuo, D., Wang, Z., Fang, F., & Li, B. (2022). New insights into the relationship between gut microbiota and radiotherapy for cancer. Nutrients, 15(1), 48. [CrossRef]
  5. Gupta, A., & Rao, L. N. (2021). Areca nut an ignored carcinogen of Asian continent in a nutshell. Journal of Global Oral Health, 4(1), 67-68. [CrossRef]
  6. Kirby, M. (2024). Prostate cancer in a nutshell. Trends in Urology & Men’s Health, 15(2), 17-18. [CrossRef]
  7. Pepple, N. M., Ekoriko, W. U., Idih, F. M., & Chidozie, V. O. (2020). Chemo preventive effect of methanol extract of Anacardium occidentale nut shell on ultra-violet radiation induced skin damage. Journal of Medicinal Plants Research, 14(9), 488-495. [CrossRef]
  8. Zombe, K., Nyirenda, J., Lumai, A., & Phiri, H. (2022). Impact of solvent type on total phenol and flavonoid content and sun protection factor of crude cashew nutshell liquid. Sustainable Chemistry, 3(3), 334-344. [CrossRef]
  9. Ziesche, S., & Yampolskiy, R. V. (2020). Towards the Mathematics of Intelligence. The Age of Artificial Intelligence: An Exploration, 1.
  10. Gill, P. E., Murray, W., & Wright, M. H. (2019). Practical optimization. Society for Industrial and Applied Mathematics. [CrossRef]
  11. Dhal, K. G., Sasmal, B., Das, A., Ray, S., & Rai, R. (2023). A comprehensive survey on arithmetic optimization algorithm. Archives of Computational Methods in Engineering, 30(5), 3379-3404. [CrossRef]
  12. Rhodes, T., Lancaster, K., & Rosengarten, M. (2020). A model society: maths, models and expertise in viral outbreaks. Critical Public Health, 30(3), 253-256. [CrossRef]
  13. Marshall, J. A., Reina, A., & Bose, T. (2019). Multiscale modelling tool: Mathematical modelling of collective behaviour without the maths. PloS one, 14(9), e0222906. [CrossRef]
  14. Hendriana, H., Prahmana, R. C. I., Ristiana, M. G., Rohaeti, E. E., & Hidayat, W. (2022, October). The theoretical framework on humanist ethno-metaphorical mathematics learning model: An impactful insight in learning mathematics. In Frontiers in Education (Vol. 7, p. 1030471). Frontiers Media SA. [CrossRef]
  15. O’Malley, M. A., & Parke, E. C. (2018). Microbes, mathematics, and models. Studies in History and Philosophy of Science Part A, 72, 1-10. [CrossRef]
  16. Jarrett, A. M., Lima, E. A., Hormuth, D. A., McKenna, M. T., Feng, X., Ekrut, D. A., ... & Yankeelov, T. E. (2018). Mathematical models of tumor cell proliferation: A review of the literature. Expert review of anticancer therapy, 18(12), 1271-1286. [CrossRef]
  17. Ira, J. I., Islam, M. S., Misra, J. C., & Kamrujjaman, M. (2020). Mathematical modelling of the dynamics of tumor growth and its optimal control. [CrossRef]
  18. Tabassum, S., Rosli, N. B., & Binti Mazalan, M. S. A. (2019, November). Mathematical modeling of cancer growth process: a review. In Journal of physics: conference series (Vol. 1366, No. 1, p. 012018). IOP Publishing. [CrossRef]
  19. Wei, H. C. (2018). A mathematical model of tumor growth with Beddington–DeAngelis functional response: a case of cancer without disease. Journal of biological dynamics, 12(1), 194-210. [CrossRef]
  20. Rivaz, A., Azizian, M., & Soltani, M. (2019). Various mathematical models of tumor growth with reference to cancer stem cells: a review. Iranian Journal of Science and Technology, Transactions A: Science, 43, 687-700. [CrossRef]
  21. Flegg, J. A., & Nataraj, N. (2019). Mathematical Modelling and Avascular Tumor Growth: Interdisciplinary Research. Resonance, 24, 313-325. [CrossRef]
  22. Zheng, X., & Sweidan, M. (2018). A mathematical model of angiogenesis and tumor growth: analysis and application in anti-angiogenesis therapy. Journal of Mathematical Biology, 77, 1589-1622. [CrossRef]
  23. Ali, A., Hussain, M., Ghaffar, A., Ali, Z., Nisar, K. S., Alharthi, M. R., & Jamshed, W. (2021). Numerical simulations and analysis for mathematical model of avascular tumor growth using Gompertz growth rate function. Alexandria Engineering Journal, 60(4), 3731-3740. [CrossRef]
  24. Abernethy, S., & Gooding, R. J. (2018). The importance of chaotic attractors in modelling tumor growth. Physica A: Statistical Mechanics and its Applications, 507, 268-277. [CrossRef]
  25. Trobia, J., Tian, K., Batista, A. M., Grebogi, C., Ren, H. P., Santos, M. S., ... & Iarosz, K. C. (2021). Mathematical model of brain tumor growth with drug resistance. Communications in Nonlinear Science and Numerical Simulation, 103, 106013. [CrossRef]
  26. Wilkie, K. P., & Aktar, F. (2020). Mathematically modelling inflammation as a promoter of tumor growth. Mathematical medicine and biology: a journal of the IMA, 37(4), 491-514. [CrossRef]
  27. Kuznetsov, M., & Kolobov, A. (2020). Investigation of solid tumor progression with account of proliferation/migration dichotomy via Darwinian mathematical model. Journal of Mathematical Biology, 80(3), 601-626. [CrossRef]
  28. Bull, J. A., Mech, F., Quaiser, T., Waters, S. L., & Byrne, H. M. (2020). Mathematical modelling reveals cellular dynamics within tumor spheroids. PLoS computational biology, 16(8), e1007961. [CrossRef]
  29. Sherer, M. V., Lin, D., Elguindi, S., Duke, S., Tan, L. T., Cacicedo, J., ... & Gillespie, E. F. (2021). Metrics to evaluate the performance of auto-segmentation for radiation treatment planning: A critical review. Radiotherapy and Oncology, 160, 185-191. [CrossRef]
  30. Giglioli, F. R., Garibaldi, C., Blanck, O., Villaggi, E., Russo, S., Esposito, M., ... & Mancosu, P. (2020). Dosimetric multicenter planning comparison studies for stereotactic body radiation therapy: methodology and future perspectives. International Journal of Radiation Oncology* Biology* Physics, 106(2), 403-412. [CrossRef]
  31. van Rooij, W., Dahele, M., Brandao, H. R., Delaney, A. R., Slotman, B. J., & Verbakel, W. F. (2019). Deep learning-based delineation of head and neck organs at risk: geometric and dosimetric evaluation. International Journal of Radiation Oncology* Biology* Physics, 104(3), 677-684. [CrossRef]
  32. Andres, E. A., Fidon, L., Vakalopoulou, M., Lerousseau, M., Carré, A., Sun, R., ... & Robert, C. (2020). Dosimetry-driven quality measure of brain pseudo computed tomography generated from deep learning for MRI-only radiation therapy treatment planning. International Journal of Radiation Oncology* Biology* Physics, 108(3), 813-823. [CrossRef]
  33. Zhang, H., Wu, X., Zhang, X., Chang, S. X., Megooni, A., Donnelly, E. D., ... & Mayr, N. A. (2020). Photon GRID radiation therapy: a physics and dosimetry white paper from the Radiosurgery Society (RSS) GRID/LATTICE, microbeam and FLASH Radiotherapy Working Group. Radiation research, 194(6), 665-677. [CrossRef]
  34. Tino, R., Yeo, A., Leary, M., Brandt, M., & Kron, T. (2019). A systematic review on 3D-printed imaging and dosimetry phantoms in radiation therapy. Technology in cancer research & treatment, 18, 1533033819870208. [CrossRef]
  35. Dudas, D., Saghand, P. G., Dilling, T. J., Perez, B. A., Rosenberg, S. A., & El Naqa, I. (2024). Deep learning-guided dosimetry for mitigating local failure of patients with non-small cell lung cancer receiving stereotactic body radiation therapy. International Journal of Radiation Oncology* Biology* Physics, 119(3), 990-1000. [CrossRef]
  36. Hachadorian, R., Bruza, P., Jermyn, M., Mazhar, A., Cuccia, D., Jarvis, L., ... & Pogue, B. (2019). Correcting Cherenkov light attenuation in tissue using spatial frequency domain imaging for quantitative surface dosimetry during whole breast radiation therapy. Journal of biomedical optics, 24(7), 071609-071609. [CrossRef]
  37. Chin, S., Eccles, C. L., McWilliam, A., Chuter, R., Walker, E., Whitehurst, P., ... & Choudhury, A. (2020). Magnetic resonance-guided radiation therapy: a review. Journal of medical imaging and radiation oncology, 64(1), 163-177. [CrossRef]
  38. Jones, S., Thompson, K., Porter, B., Shepherd, M., Sapkaroski, D., Grimshaw, A., & Hargrave, C. (2024). Automation and artificial intelligence in radiation therapy treatment planning. Journal of Medical Radiation Sciences, 71(2), 290-298. [CrossRef]
  39. Liu, C., Kim, J., Kumarasiri, A., Mayyas, E., Brown, S. L., Wen, N., ... & Chetty, I. J. (2018). An automated dose tracking system for adaptive radiation therapy. Computer methods and programs in biomedicine, 154, 1-8. [CrossRef]
  40. Hadid, M., Elomri, A., El Mekkawy, T., Jouini, O., Kerbache, L., & Hamad, A. (2022). Operations management of outpatient chemotherapy process: An optimization-oriented comprehensive review. Operations Research Perspectives, 9, 100214. [CrossRef]
  41. Dömény, M. F., Puskás, M., Kovács, L., & Drexler, D. A. (2024, May). A review of multi-objective optimization algorithms in the field of chemotherapy optimization. In 2024 IEEE 18th International Symposium on Applied Computational Intelligence and Informatics (SACI) (pp. 000345-000350). IEEE.
  42. Bräutigam, K. (2024). Optimization of chemotherapy regimens using mathematical programming. Computers & Industrial Engineering, 191, 110078. [CrossRef]
  43. Huang, Y. L., Bach, S. M., & Looker, S. A. (2019). Chemotherapy scheduling template development using an optimization approach. International journal of health care quality assurance, 32(1), 59-70. [CrossRef]
  44. Samy, P. G., Kanesan, J., & Tiu, Z. C. (2023). Optimization of chemotherapy using hybrid optimal control and swarm intelligence. IEEe Access, 11, 28873-28886. [CrossRef]
  45. Shindi, O., Kanesan, J., Kendall, G., & Ramanathan, A. (2020). The combined effect of optimal control and swarm intelligence on optimization of cancer chemotherapy. Computer Methods and Programs in Biomedicine, 189, 105327. [CrossRef]
  46. Bodzioch, M., Bajger, P., & Foryś, U. (2021). Angiogenesis and chemotherapy resistance: Optimizing chemotherapy scheduling using mathematical modeling. Journal of Cancer Research and Clinical Oncology, 147(8), 2281-2299. [CrossRef]
  47. Dömény, M. F., Puskás, M., Kovács, L., & Drexler, D. A. (2023, May). In silico chemotherapy optimization with genetic algorithm. In 2023 IEEE 17th International Symposium on Applied Computational Intelligence and Informatics (SACI) (pp. 000097-000102). IEEE.
  48. Abdulrashid, I., Delen, D., Usman, B., Uzochukwu, M. I., & Ahmed, I. (2024). A multi-objective optimization framework for determining optimal chemotherapy dosing and treatment duration. Healthcare Analytics, 5, 100335. [CrossRef]
  49. Dhieb, N., Abdulrashid, I., Ghazzai, H., & Massoud, Y. (2023). Optimized drug regimen and chemotherapy scheduling for cancer treatment using swarm intelligence. Annals of Operations Research, 320(2), 757-770. [CrossRef]
  50. Szűcs, T. D., Puskás, M., Drexler, D. A., & Kovács, L. (2023, May). Model predictive fuzzy control in chemotherapy optimization. In 2023 IEEE 17th International Symposium on Applied Computational Intelligence and Informatics (SACI) (pp. 103-108). IEEE.
  51. Ajayi, T., Hosseinian, S., Schaefer, A. J., & Fuller, C. D. (2024). Combination chemotherapy optimization with discrete dosing. INFORMS Journal on Computing, 36(2), 434-455. [CrossRef]
  52. Samy, P. G., Kanesan, J., Badruddin, I. A., Kamangar, S., & Ahammad, N. A. (2024). Optimizing chemotherapy treatment outcomes using metaheuristic optimization algorithms: A case study. Bio-Medical Materials and Engineering, (Preprint), 1-14. [CrossRef]
  53. Yee, L. M., McShane, L. M., Freidlin, B., Mooney, M. M., & Korn, E. L. (2019). Biostatistical and logistical considerations in the development of basket and umbrella clinical trials. The Cancer Journal, 25(4), 254-263. [CrossRef]
  54. D’Arrigo, G., El Hafeez, S. A., Mezzatesta, S., Abelardo, D., Provenzano, F. P., Vilasi, A., ... & Tripepi, G. (2024). Common mistakes in biostatistics. Clinical Kidney Journal, 17(7), sfae197. [CrossRef]
  55. Ho, A. Y., Barker, C. A., Arnold, B. B., Powell, S. N., Hu, Z. I., Gucalp, A., ... & McArthur, H. L. (2020). A phase 2 clinical trial assessing the efficacy and safety of pembrolizumab and radiotherapy in patients with metastatic triple-negative breast cancer. Cancer, 126(4), 850-860. [CrossRef]
  56. Mazumdar, M., Moshier, E. L., Özbek, U., & Parsons, R. (2018). Ten essential practices for developing or reforming a biostatistics core for a NCI designated cancer center. JNCI Cancer Spectrum, 2(1), pky010. [CrossRef]
  57. Cook, R. J., & Moodie, E. E. (2024). A retrospective and prospective study of biostatistics in Canada. Canadian Journal of Public Health, 1-5. [CrossRef]
  58. Hofman, M. S., Murphy, D. G., Williams, S. G., Nzenza, T., Herschtal, A., Lourenco, R. D. A., ... & Lawrentschuk, N. (2018). A prospective randomized multicentre study of the impact of gallium-68 prostate-specific membrane antigen (PSMA) PET/CT imaging for staging high-risk prostate cancer prior to curative-intent surgery or radiotherapy (proPSMA study): clinical trial protocol. BJU international, 122(5), 783-793. [CrossRef]
  59. Denkert, C., Seither, F., Schneeweiss, A., Link, T., Blohmer, J. U., Just, M., ... & Loibl, S. (2021). Clinical and molecular characteristics of HER2-low-positive breast cancer: pooled analysis of individual patient data from four prospective, neoadjuvant clinical trials. The Lancet Oncology, 22(8), 1151-1161. [CrossRef]
  60. Sedrak, M. S., Li, D., Walter, L. C., Mustian, K., High, K. P., Canin, B., ... & Sun, C. L. (2020). Cores for geriatric oncology infrastructure in the Cancer and Aging Research Group: Biostatistics, epidemiology, and research design (the analytics core). Journal of geriatric oncology, 11(2), 355-358. [CrossRef]
  61. Lin, R., Yin, G., & Shi, H. (2023). Bayesian adaptive model selection design for optimal biological dose finding in phase I/II clinical trials. Biostatistics, 24(2), 277-294. [CrossRef]
  62. Buteau, J. P., Moon, D., Fahey, M. T., Roberts, M. J., Thompson, J., Murphy, D. G., ... & Emmett, L. (2024). Clinical trial protocol for PRIMARY2: a multicentre, phase 3, randomised controlled trial investigating the additive diagnostic value of [68Ga] Ga-PSMA-11 positron emission tomography/computed tomography in men with negative or equivocal multiparametric magnetic resonance imaging for the diagnosis of clinically significant prostate cancer. European Urology Oncology, 7(3), 544-552. [CrossRef]
  63. Yang, Y., Jayaraj, S., Ludmir, E., & Roberts, K. (2024, January). Text classification of cancer clinical trial eligibility criteria. In AMIA Annual Symposium Proceedings (Vol. 2023, p. 1304).
  64. Rodin, G., Lo, C., Rydall, A., Shnall, J., Malfitano, C., Chiu, A., ... & Hales, S. (2018). Managing cancer and living meaningfully (CALM): a randomized controlled trial of a psychological intervention for patients with advanced cancer. Journal of Clinical Oncology, 36(23), 2422-2432. [CrossRef]
  65. Zhang, Z., Hernandez, K., Savage, J., Li, S., Miller, D., Agrawal, S., ... & Grossman, R. L. (2021). Uniform genomic data analysis in the NCI Genomic Data Commons. Nature communications, 12(1), 1226. [CrossRef]
  66. Schatz, M. C., Philippakis, A. A., Afgan, E., Banks, E., Carey, V. J., Carroll, R. J., ... & Walker, J. (2022). Inverting the model of genomics data sharing with the NHGRI Genomic Data Science Analysis, Visualization, and Informatics Lab-space. Cell Genomics, 2(1). [CrossRef]
  67. Xie, J., Wang, M., Xu, S., Huang, Z., & Grant, P. W. (2021). The unsupervised feature selection algorithms based on standard deviation and cosine similarity for genomic data analysis. Frontiers in Genetics, 12, 684100. [CrossRef]
  68. Kolisnik, T., Keshavarz-Rahaghi, F., Purcell, R. V., Smith, A. N., & Silander, O. K. (2024). pyRforest: A comprehensive R package for genomic data analysis featuring scikit-learn Random Forests in R. Briefings in Functional Genomics, elae038. [CrossRef]
  69. Dervishi, L., Wang, X., Li, W., Halimi, A., Vaidya, J., Jiang, X., & Ayday, E. (2023, April). Facilitating federated genomic data analysis by identifying record correlations while ensuring privacy. In AMIA annual symposium proceedings (Vol. 2022, p. 395).
  70. Liu, K., Newbury, P. A., Glicksberg, B. S., Zeng, W. Z., Paithankar, S., Andrechek, E. R., & Chen, B. (2019). Evaluating cell lines as models for metastatic breast cancer through integrative analysis of genomic data. Nature communications, 10(1), 2138. [CrossRef]
  71. Schneider, L., Laiouar-Pedari, S., Kuntz, S., Krieghoff-Henning, E., Hekler, A., Kather, J. N., ... & Brinker, T. J. (2022). Integration of deep learning-based image analysis and genomic data in cancer pathology: A systematic review. European journal of cancer, 160, 80-91. [CrossRef]
  72. Rehan, H. (2023). AI-Powered Genomic Analysis in the Cloud: Enhancing Precision Medicine and Ensuring Data Security in Biomedical Research. Journal of Deep Learning in Genomic Data Analysis, 3(1), 37-71.
  73. Piñero, J., Saüch, J., Sanz, F., & Furlong, L. I. (2021). The DisGeNET cytoscape app: Exploring and visualizing disease genomics data. Computational and structural biotechnology journal, 19, 2960-2967. [CrossRef]
  74. Huang, D., Xu, L., Tao, W., & Li, Y. (2024, August). Research on genome data recognition and analysis based on Louvain algorithm. In Fourth International Conference on Biomedicine and Bioinformatics Engineering (ICBBE 2024) (Vol. 13252, pp. 233-238). SPIE.
  75. Jarrett, A. M., Song, P. N., Reeves, K., Lima, E. A., Larimer, B., Yankeelov, T. E., & Sorace, A. G. (2023). Investigating tumor-host response dynamics in preclinical immunotherapy experiments using a stepwise mathematical modeling strategy. Mathematical Biosciences, 366, 109106. [CrossRef]
  76. Zand, B., Arab, S., Kheshtchin, N., Arabameri, A., Ashourpour, M., Asemani, D., ... & Hadjati, J. (2022). Identification of the optimal pattern of the injection and dosage of DC immunotherapy using the mathematical models based on ordinary differential equations. Iranian Journal of Immunology, 19(1), 1-17. [CrossRef]
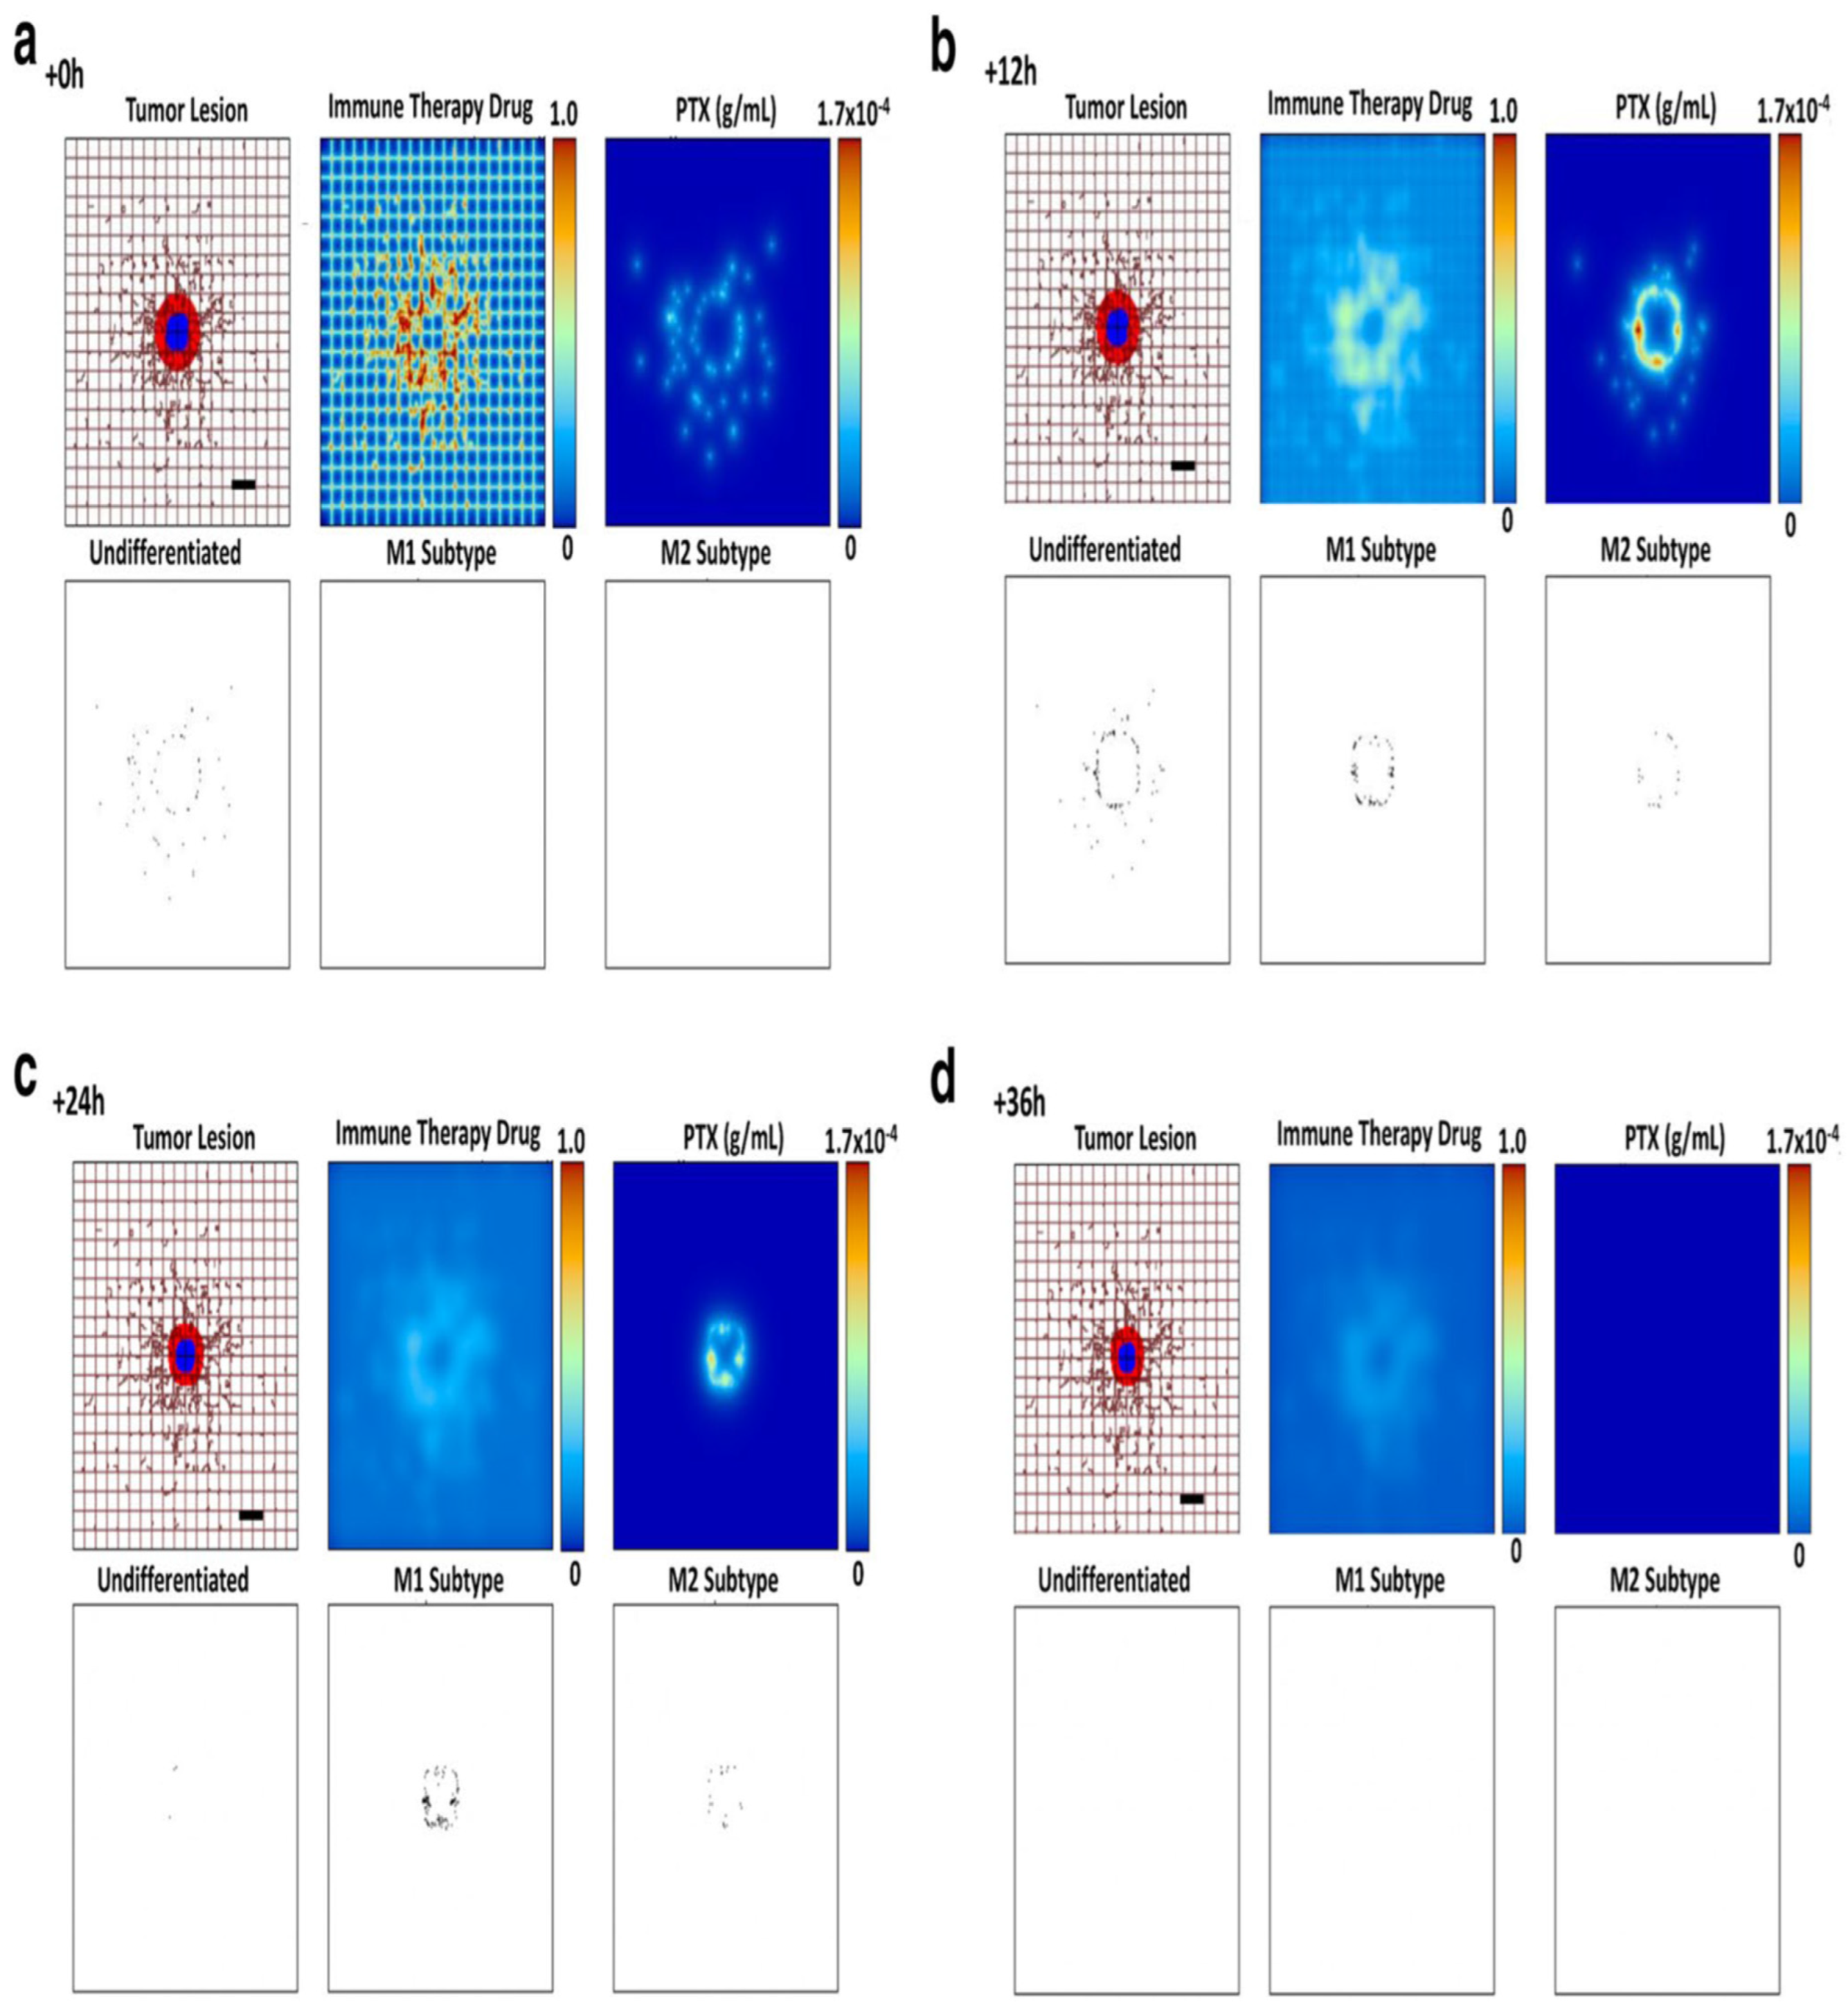
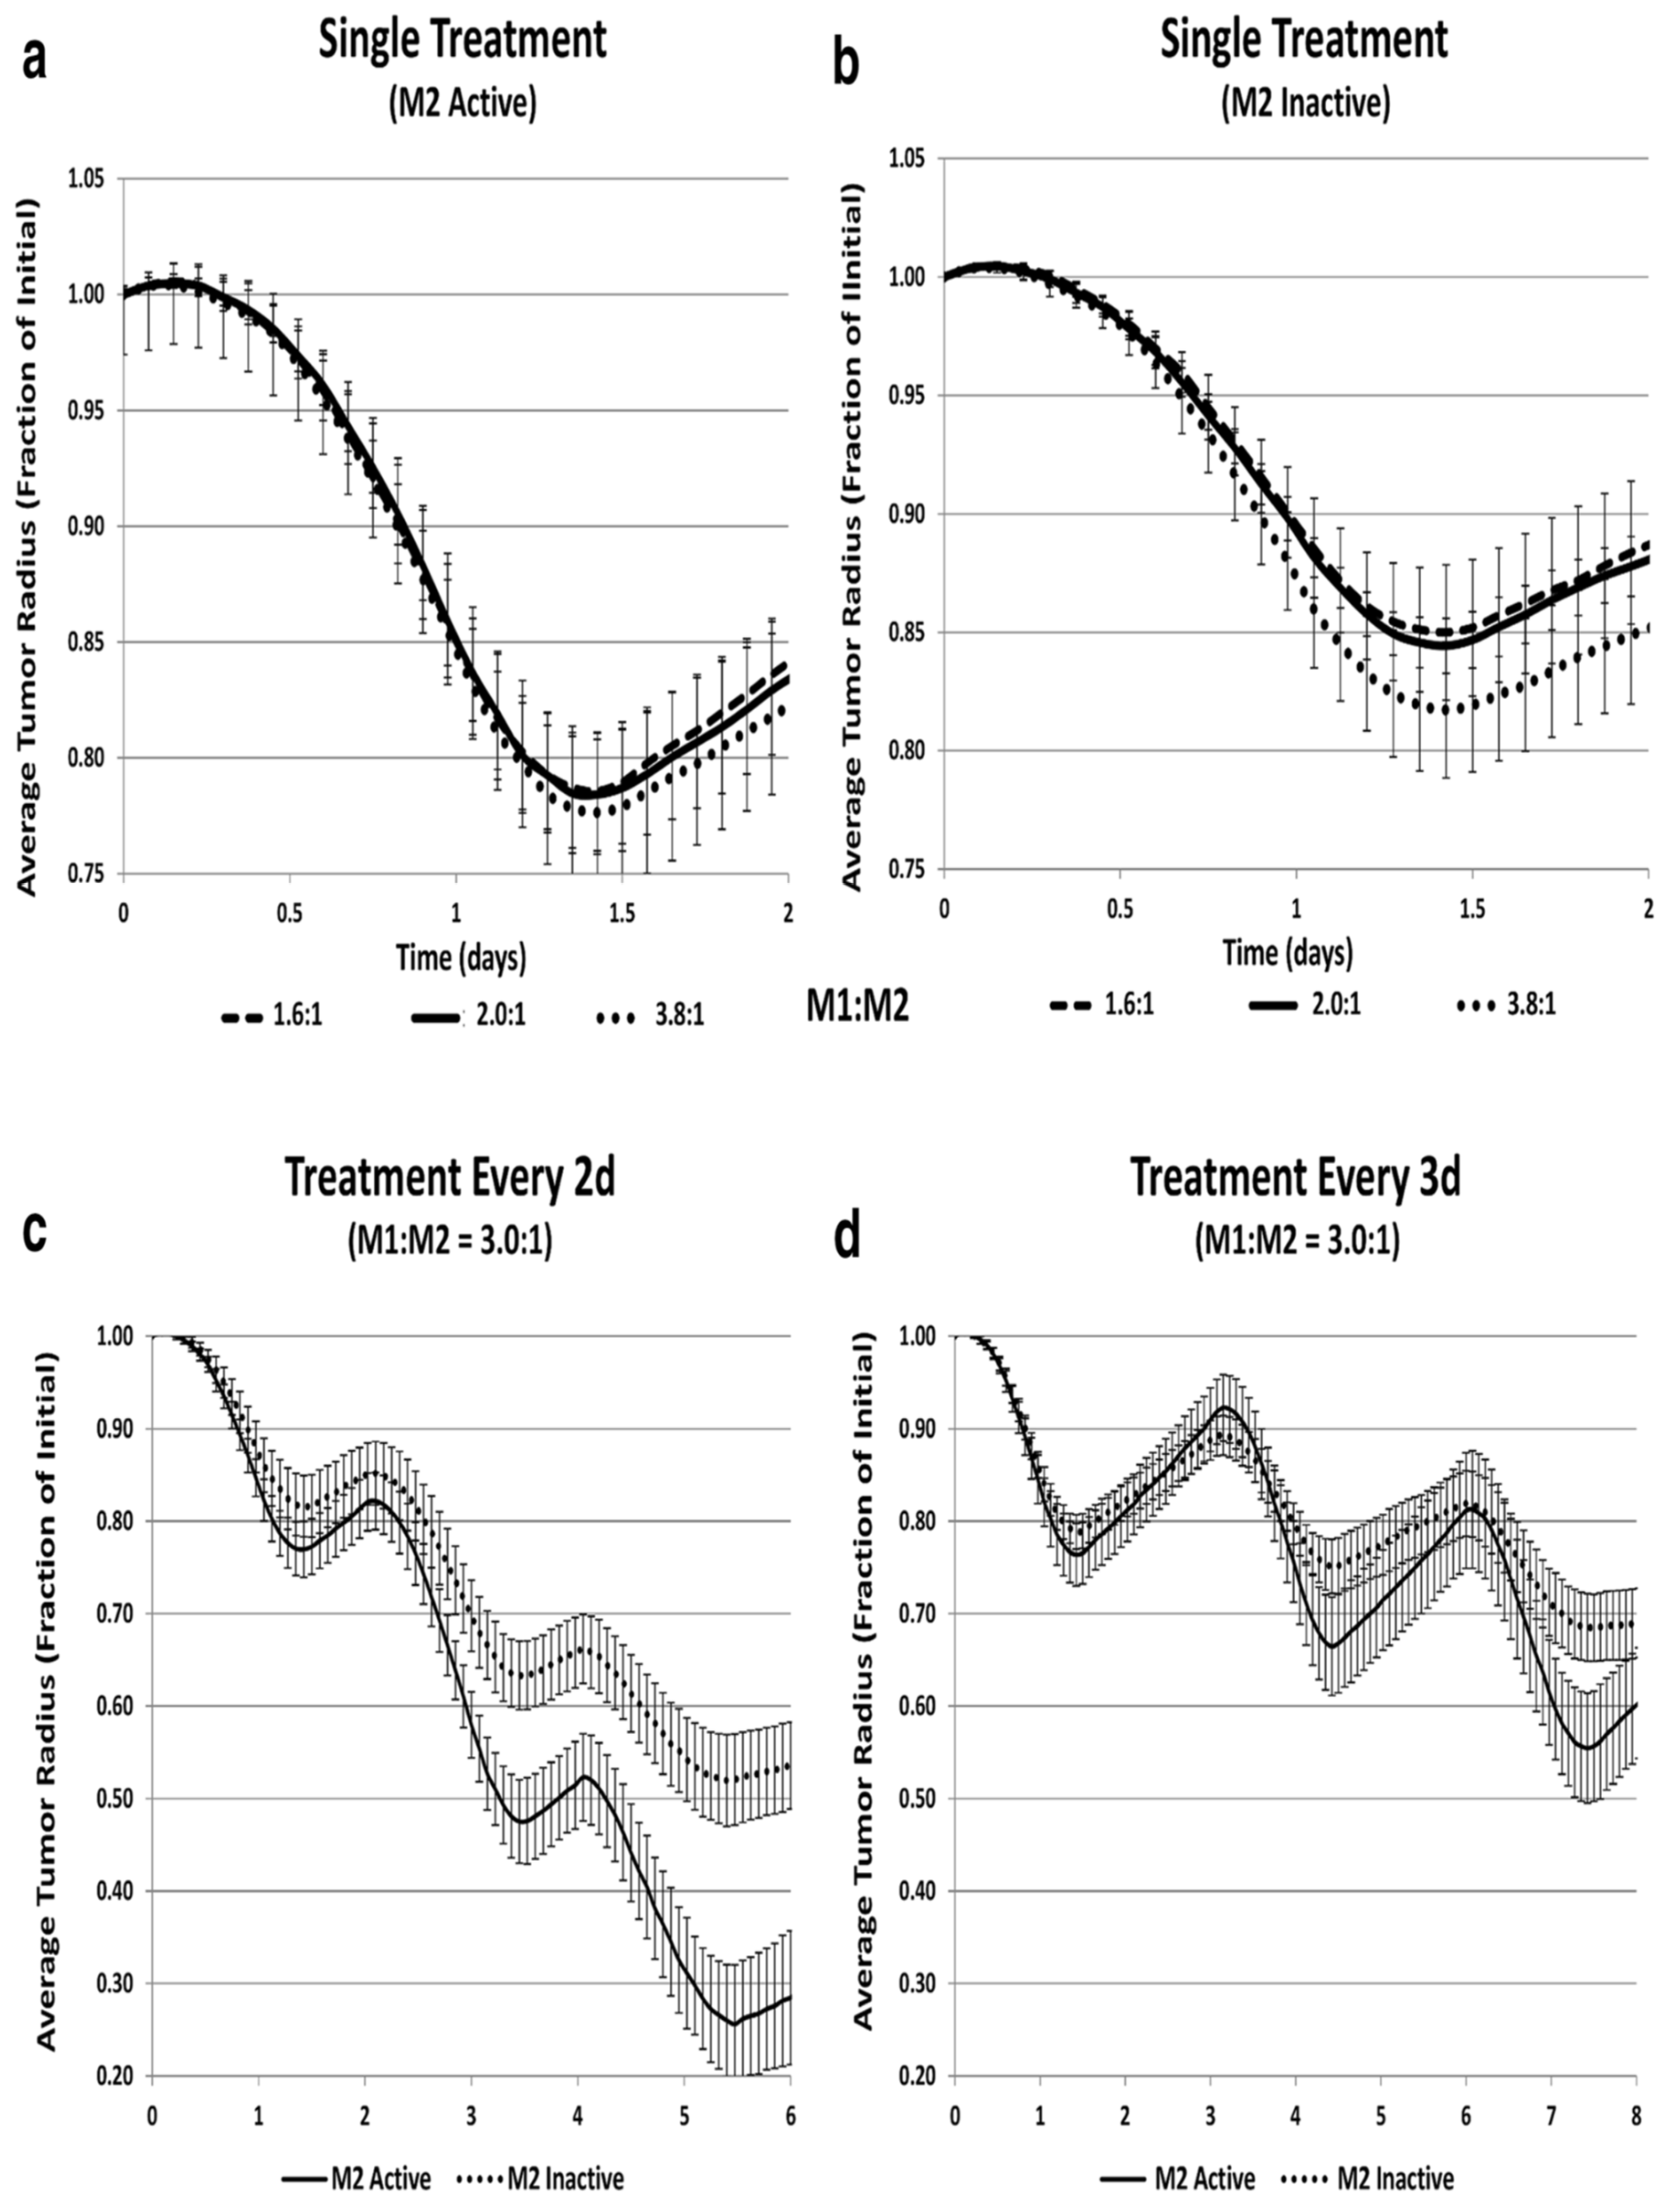
  77. Leonard, F., Curtis, L. T., Hamed, A. R., Zhang, C., Chau, E., Sieving, D., ... & Frieboes, H. B. (2020). Nonlinear response to cancer nanotherapy due to macrophage interactions revealed by mathematical modeling and evaluated in a murine model via CRISPR-modulated macrophage polarization. Cancer Immunology, Immunotherapy, 69, 731-744. [CrossRef]
  78. Atsou, K. K. (2020). Mathematical modeling of tumor-immune system interactions: equilibrium and escape phase (Doctoral dissertation, Universite cote d’Azur).
  79. Khalili, P., & Vatankhah, R. (2023). Studying the importance of regulatory T cells in chemoimmunotherapy mathematical modeling and proposing new approaches for developing a mathematical dynamic of cancer. Journal of Theoretical Biology, 563, 111437. [CrossRef]
  80. Nave, O., Elbaz, M., & Bunimovich-Mendrazitsky, S. (2020). Analysis of a breast cancer mathematical model by a new method to find an optimal protocol for HER2-positive cancer. Biosystems, 197, 104191. [CrossRef]
  81. Ghiyabi, E., Arabameri, A., & Charmi, M. (2024). Mathematical modeling of hypoxia and adenosine to explore tumor escape mechanisms in DC-based immunotherapy. Scientific Reports, 14(1), 11387. [CrossRef]
  82. Dehingia, K., Sarmah, H. K., Alharbi, Y., & Hosseini, K. (2021). Mathematical analysis of a cancer model with time-delay in tumor-immune interaction and stimulation processes. Advances in Difference Equations, 2021, 1-27. [CrossRef]
  83. Rahbar, S., Shafiekhani, S., Allahverdy, A., Jamali, A., Kheshtchin, N., Ajami, M., ... & Jafari, A. H. (2022). Agent-based modeling of tumor and immune system interactions in combinational therapy with low-dose 5-fluorouracil and dendritic cell vaccine in melanoma B16F10. Iranian Journal of Allergy, Asthma and Immunology. [CrossRef]
  84. Dhar, B., Gupta, P. K., & Yildirim, A. (2022). Dynamical behaviour of a tumour-immune model focusing on the dosage of targeted chemotherapeutic drug. International Journal of Computer Mathematics, 99(12), 2568-2582. [CrossRef]
  85. Cotra, S. (2024). Systems biology models for cancer immunotherapy.
  86. Przedborski, M., Smalley, M., Thiyagarajan, S., Goldman, A., & Kohandel, M. (2021). Systems biology informed neural networks (SBINN) predict response and novel combinations for PD-1 checkpoint blockade. Communications Biology, 4(1), 877. [CrossRef]
  87. Zhang, W., Chen, Y., Li, M., Cao, S., Wang, N., Zhang, Y., & Wang, Y. (2023). A PDA-Functionalized 3D Lung Scaffold Bioplatform to Construct Complicated Breast Tumor Microenvironment for Anticancer Drug Screening and Immunotherapy. Advanced Science, 10(26), 2302855. [CrossRef]
  88. Sloan, A., Song, Y., Gail, M. H., Betensky, R., Rosner, B., Ziegler, R. G., ... & Wang, M. (2019). Design and analysis considerations for combining data from multiple biomarker studies. Statistics in medicine, 38(8), 1303-1320. [CrossRef]
  89. Ou, F. S., Michiels, S., Shyr, Y., Adjei, A. A., & Oberg, A. L. (2021). Biomarker discovery and validation: statistical considerations. Journal of Thoracic Oncology, 16(4), 537-545. [CrossRef]
  90. Terkelsen, T., Krogh, A., & Papaleo, E. (2020). CAncer bioMarker Prediction Pipeline (CAMPP)—A standardized framework for the analysis of quantitative biological data. PLoS computational biology, 16(3), e1007665. [CrossRef]
  91. Feng, Z., & Pepe, M. S. (2020). Adding rigor to biomarker evaluations—EDRN experience. Cancer Epidemiology, Biomarkers & Prevention, 29(12), 2575-2582. [CrossRef]
  92. Xiao, Q., Zhang, F., Xu, L., Yue, L., Kon, O. L., Zhu, Y., & Guo, T. (2021). High-throughput proteomics and AI for cancer biomarker discovery. Advanced drug delivery reviews, 176, 113844. [CrossRef]
  93. Shieh, K. R., Huang, A., & Xu, Y. (2021). Response to immune checkpoint inhibitor treatment in advanced cervical cancer and biomarker study. Frontiers in Medicine, 8, 669587. [CrossRef]
  94. Hayes, D. F. (2021). Defining clinical utility of tumor biomarker tests: a clinician’s viewpoint. Journal of clinical oncology, 39(3), 238-248. [CrossRef]
  95. Hayes, D. F., Sauerbrei, W., & McShane, L. M. (2023). REMARK guidelines for tumour biomarker study reporting: A remarkable history. British Journal of Cancer, 128(3), 443-445. [CrossRef]
  96. Nakayasu, E. S., Gritsenko, M., Piehowski, P. D., Gao, Y., Orton, D. J., Schepmoes, A. A., ... & Metz, T. O. (2021). Tutorial: best practices and considerations for mass-spectrometry-based protein biomarker discovery and validation. Nature Protocols, 16(8), 3737-3760. [CrossRef]
  97. Chang, J., Lin, G., Ye, M., Tong, D., Zhao, J., Zhu, D., ... & Li, W. (2019). Decreased mean platelet volume predicts poor prognosis in metastatic colorectal cancer patients treated with first-line chemotherapy: results from mCRC biomarker study. BMC cancer, 19, 1-7. [CrossRef]
  98. Li, J., Cheng, B., Xie, H., Zhan, C., Li, S., & Bai, P. (2022). Bladder cancer biomarker screening based on non-targeted urine metabolomics. International Urology and Nephrology, 1-7. [CrossRef]
  99. Hristova, V. A., & Chan, D. W. (2019). Cancer biomarker discovery and translation: proteomics and beyond. Expert review of proteomics, 16(2), 93-103. [CrossRef]
  100. Elkahwagy, D. M. A. S., Kiriacos, C. J., & Mansour, M. (2024). Logistic regression and other statistical tools in diagnostic biomarker studies. Clinical and Translational Oncology, 26(9), 2172-2180. [CrossRef]
  101. Wang, M., Yang, Y., Xu, J., Bai, W., Ren, X., & Wu, H. (2018). CircRNAs as biomarkers of cancer: a meta-analysis. BMC cancer, 18, 1-10. [CrossRef]
  102. Bratman, S. V., Yang, S. C., Iafolla, M. A., Liu, Z., Hansen, A. R., Bedard, P. L., ... & Pugh, T. J. (2020). Personalized circulating tumor DNA analysis as a predictive biomarker in solid tumor patients treated with pembrolizumab. Nature Cancer, 1(9), 873-881. [CrossRef]
  103. Wang, W., Rong, Z., Wang, G., Hou, Y., Yang, F., & Qiu, M. (2023). Cancer metabolites: promising biomarkers for cancer liquid biopsy. Biomarker Research, 11(1), 66. [CrossRef]
  104. Bartha, Á., & Győrffy, B. (2021). TNMplot. com: a web tool for the comparison of gene expression in normal, tumor and metastatic tissues. International journal of molecular sciences, 22(5), 2622. [CrossRef]
  105. Xie, Y., Meng, W. Y., Li, R. Z., Wang, Y. W., Qian, X., Chan, C., ... & Leung, E. L. H. (2021). Early lung cancer diagnostic biomarker discovery by machine learning methods. Translational oncology, 14(1), 100907. [CrossRef]
  106. Kumbrink, J., Bohlmann, L., Mamlouk, S., Redmer, T., Peilstöcker, D., Li, P., ... & Holch, J. W. (2022). Serial analysis of gene mutations and gene expression during first-line chemotherapy against metastatic colorectal cancer: identification of potentially actionable targets within the multicenter prospective biomarker study reveal. Cancers, 14(15), 3631. [CrossRef]
  107. Zhang, Q., Xu, H., Liu, R., Gao, P., Yang, X., Jin, W., ... & Li, Q. (2019). A novel strategy for targeted lipidomics based on LC-tandem-MS parameters prediction, quantification, and multiple statistical data mining: evaluation of lysophosphatidylcholines as potential cancer biomarkers. Analytical chemistry, 91(5), 3389-3396. [CrossRef]
  108. Acs, B., Fredriksson, I., Rönnlund, C., Hagerling, C., Ehinger, A., Kovács, A., ... & Hartman, J. (2021). Variability in breast cancer biomarker assessment and the effect on oncological treatment decisions: a nationwide 5-year population-based study. Cancers, 13(5), 1166. [CrossRef]
Schematic 1.
Schematic 1.
Preprints 145474 g001
Figure 2.
Figure 2.
Preprints 145474 g002
Figure 3.
Figure 3.
Preprints 145474 g003
Figure 4.
Figure 4.
Preprints 145474 g004
Figure 6.
Figure 6.
Preprints 145474 g006
Figure 7.
Figure 7.
Preprints 145474 g007
Figure 8.
Figure 8.
Preprints 145474 g008
Figure 11.
Figure 11.
Preprints 145474 g011
Figure 12.
Figure 12.
Preprints 145474 g012
Figure 13.
Figure 13.
Preprints 145474 g013
Figure 14.
Figure 14.
Preprints 145474 g014
Figure 15.
Figure 15.
Preprints 145474 g015
Figure 16.
Figure 16.
Preprints 145474 g016
Figure 17.
Figure 17.
Preprints 145474 g017
Figure 18.
Figure 18.
Preprints 145474 g018
Figure 19.
Figure 19.
Preprints 145474 g019
Figure 20.
Figure 20.
Preprints 145474 g020
Figure 21.
Figure 21.
Preprints 145474 g021
Figure 22.
Figure 22.
Preprints 145474 g022
Figure 23.
Figure 23.
Preprints 145474 g023
Schematic 24.
Schematic 24.
Preprints 145474 g024
Figure 25.
Figure 25.
Preprints 145474 g025
Figure 26.
Figure 26.
Preprints 145474 g026
Figure 27.
Figure 27.
Preprints 145474 g027
Figure 28.
Figure 28.
Preprints 145474 g028
Figure 29.
Figure 29.
Preprints 145474 g029
Figure 30.
Figure 30.
Preprints 145474 g030
Figure 32.
Figure 32.
Preprints 145474 g032
Figure 33.
Figure 33.
Preprints 145474 g033
Figure 34.
Figure 34.
Preprints 145474 g034
Figure 35.
Figure 35.
Preprints 145474 g035
Figure 36.
Figure 36.
Preprints 145474 g036aPreprints 145474 g036b
Figure 37.
Figure 37.
Preprints 145474 g037
Figure 38.
Figure 38.
Preprints 145474 g038
Figure 39.
Figure 39.
Preprints 145474 g039
Figure 40.
Figure 40.
Preprints 145474 g040
Figure 41.
Figure 41.
Preprints 145474 g041
Figure 42.
Figure 42.
Preprints 145474 g042
Figure 43.
Figure 43.
Preprints 145474 g043
Figure 44.
Figure 44.
Preprints 145474 g044
Figure 45.
Figure 45.
Preprints 145474 g045
Figure 46.
Figure 46.
Preprints 145474 g046
Figure 47.
Figure 47.
Preprints 145474 g047
Figure 48.
Figure 48.
Preprints 145474 g048
Figure 49.
Figure 49.
Preprints 145474 g049
Figure 50.
Figure 50.
Preprints 145474 g050
Disclaimer/Publisher’s Note: The statements, opinions and data contained in all publications are solely those of the individual author(s) and contributor(s) and not of MDPI and/or the editor(s). MDPI and/or the editor(s) disclaim responsibility for any injury to people or property resulting from any ideas, methods, instructions or products referred to in the content.
Copyright: This open access article is published under a Creative Commons CC BY 4.0 license, which permit the free download, distribution, and reuse, provided that the author and preprint are cited in any reuse.
Prerpints.org logo

Preprints.org is a free preprint server supported by MDPI in Basel, Switzerland.

Subscribe

Disclaimer

Terms of Use

Privacy Policy

Privacy Settings

© 2025 MDPI (Basel, Switzerland) unless otherwise stated