
Submitted:
07 January 2025
Posted:
08 January 2025
You are already at the latest version
Abstract
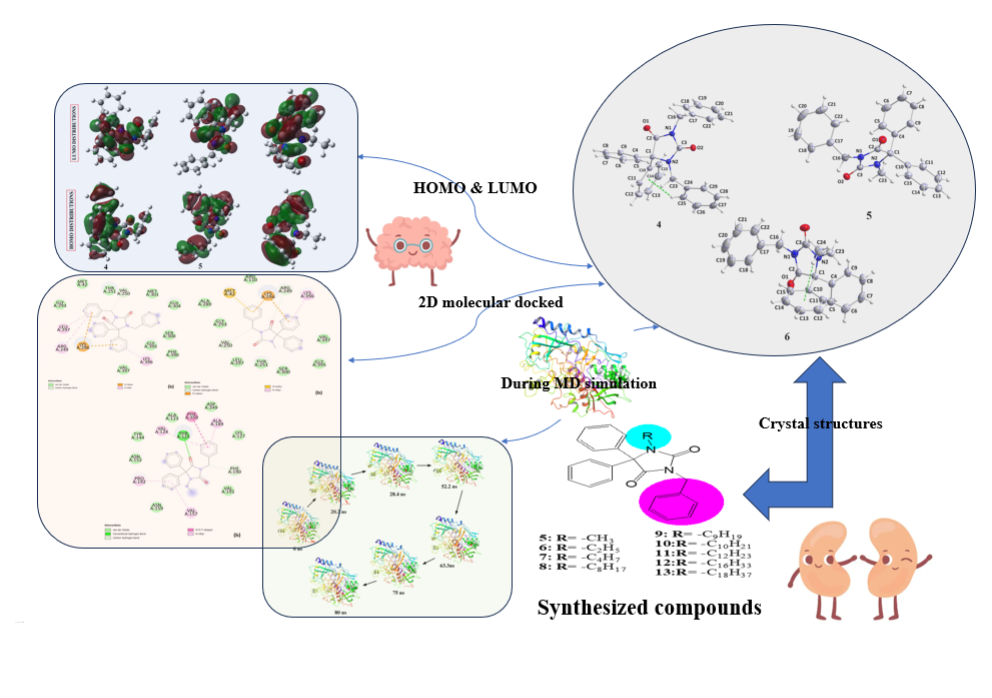
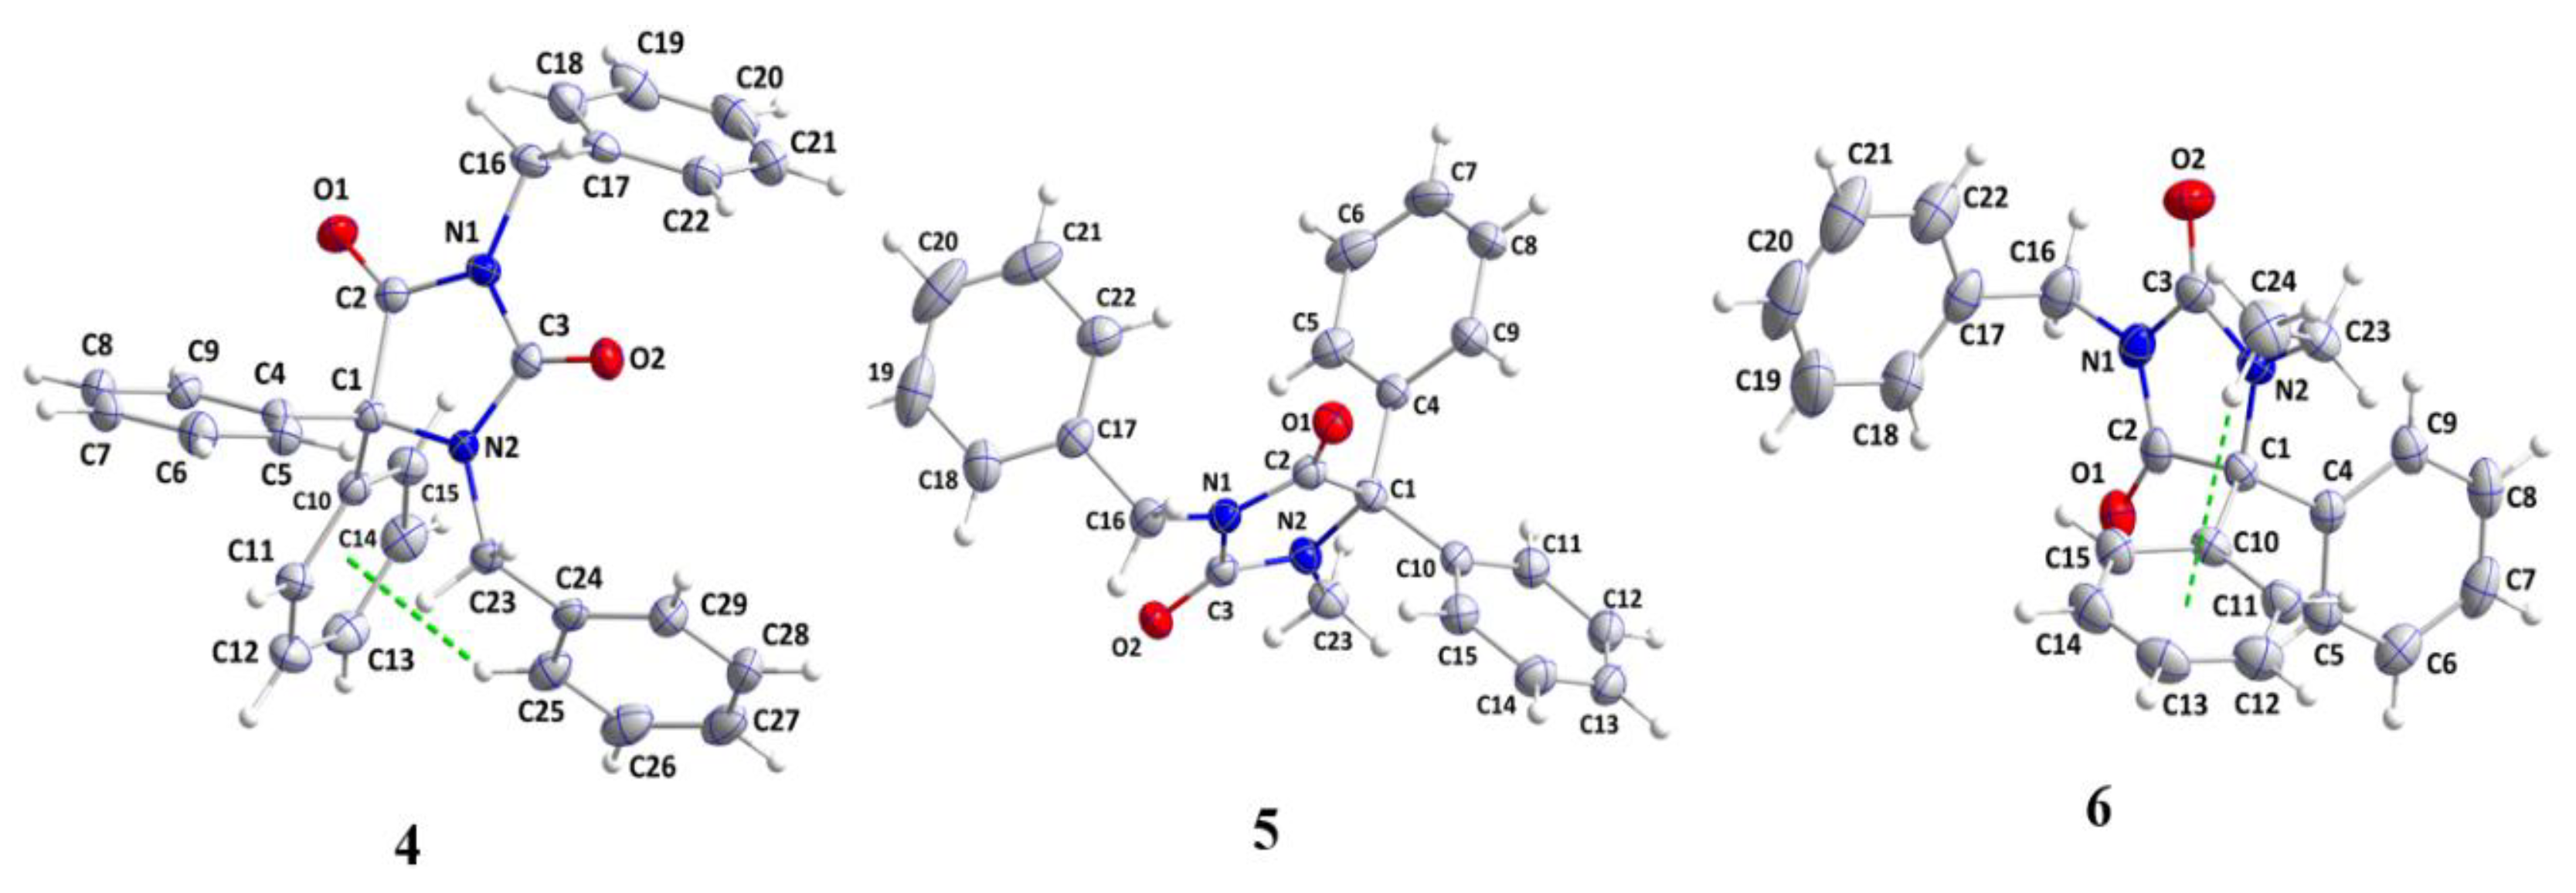
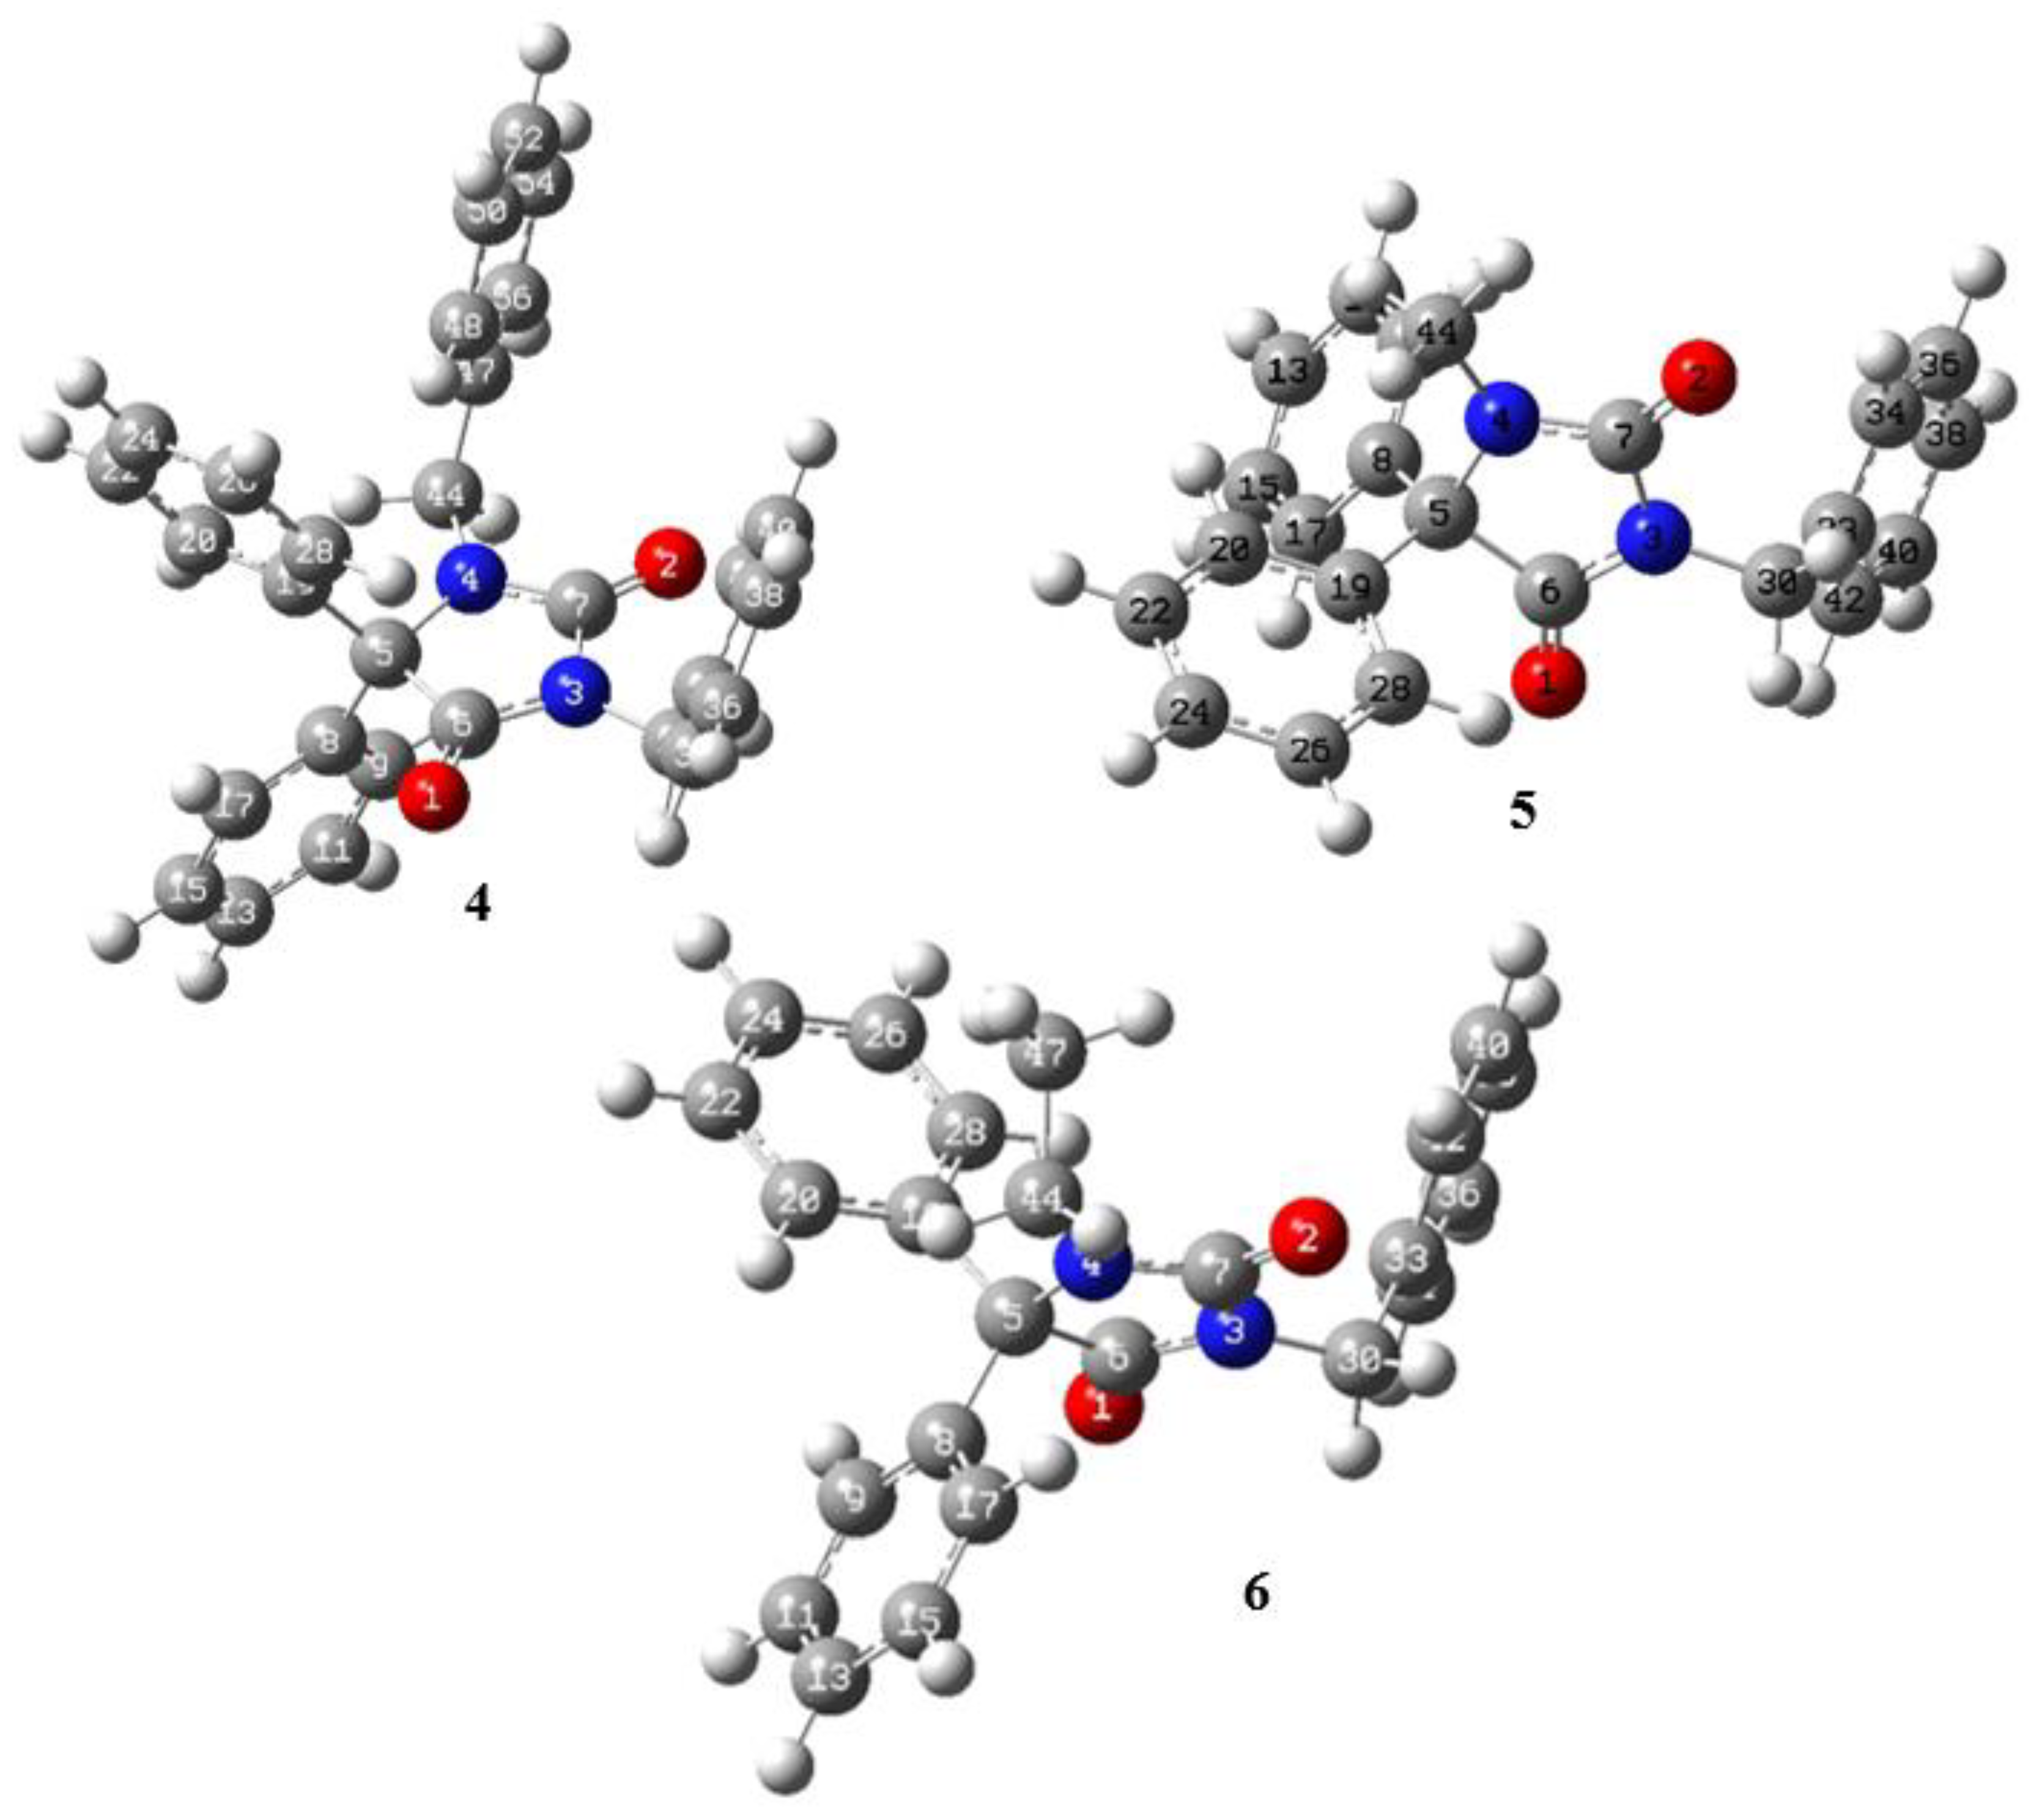
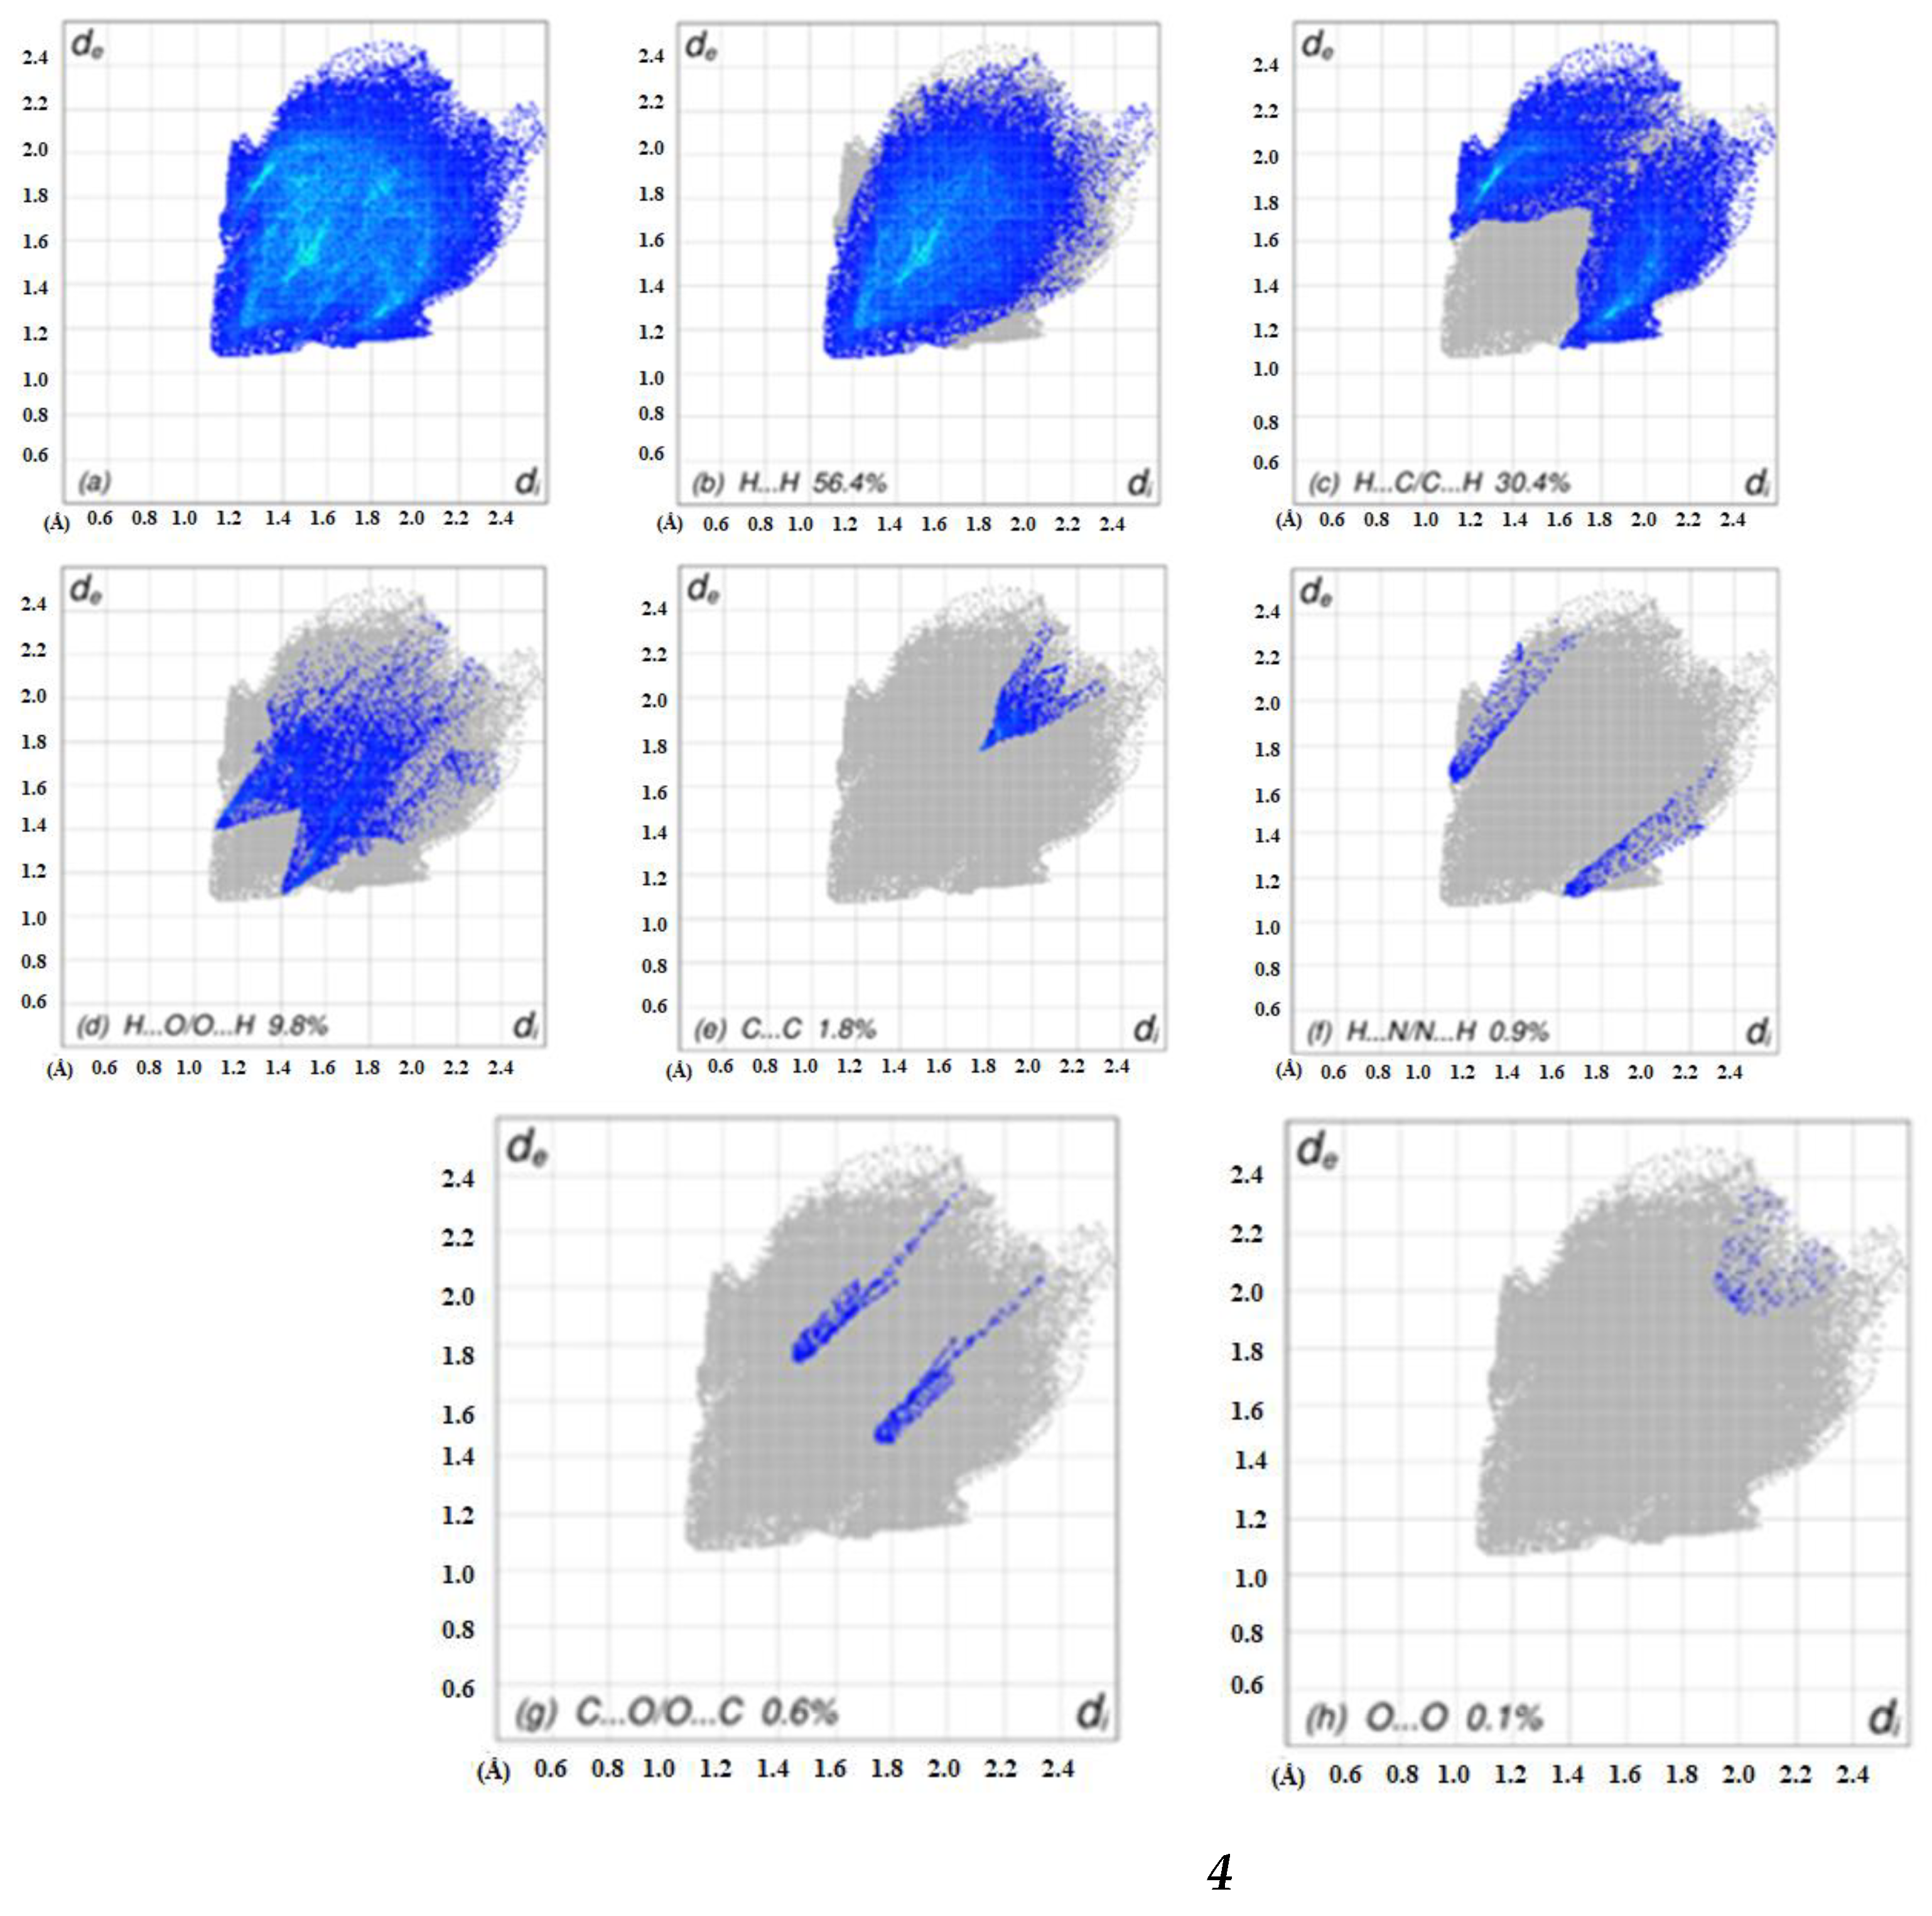
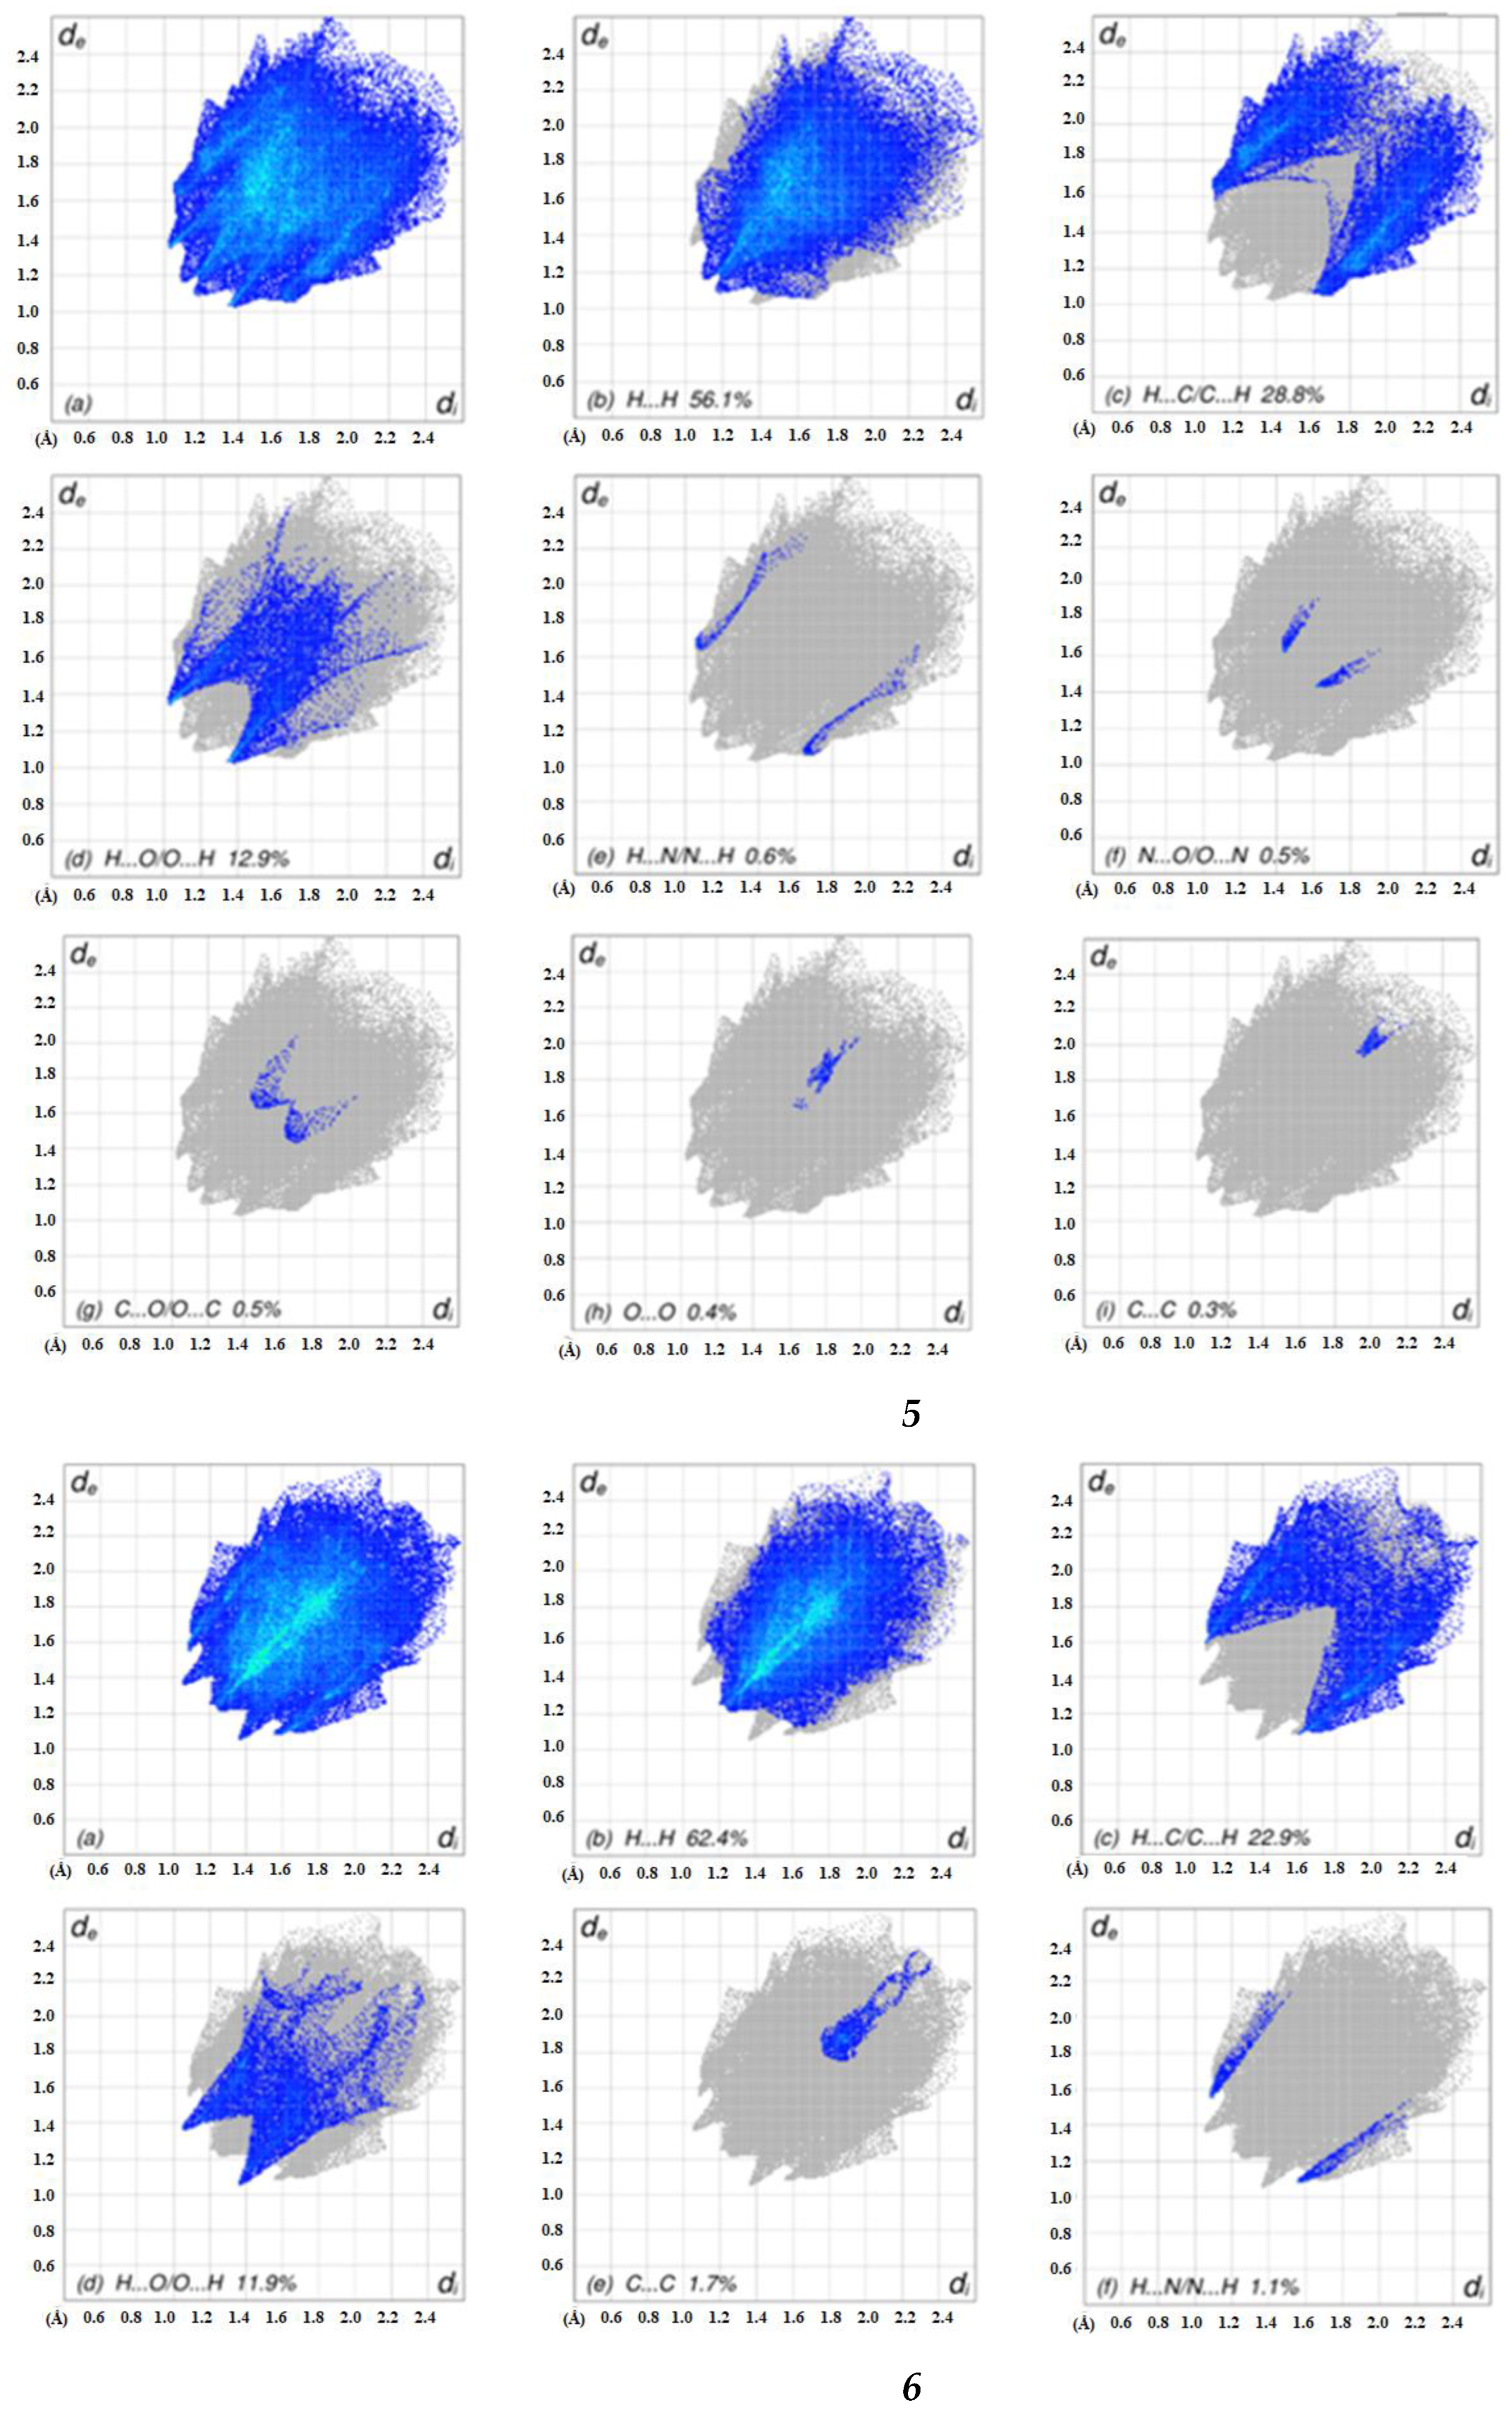
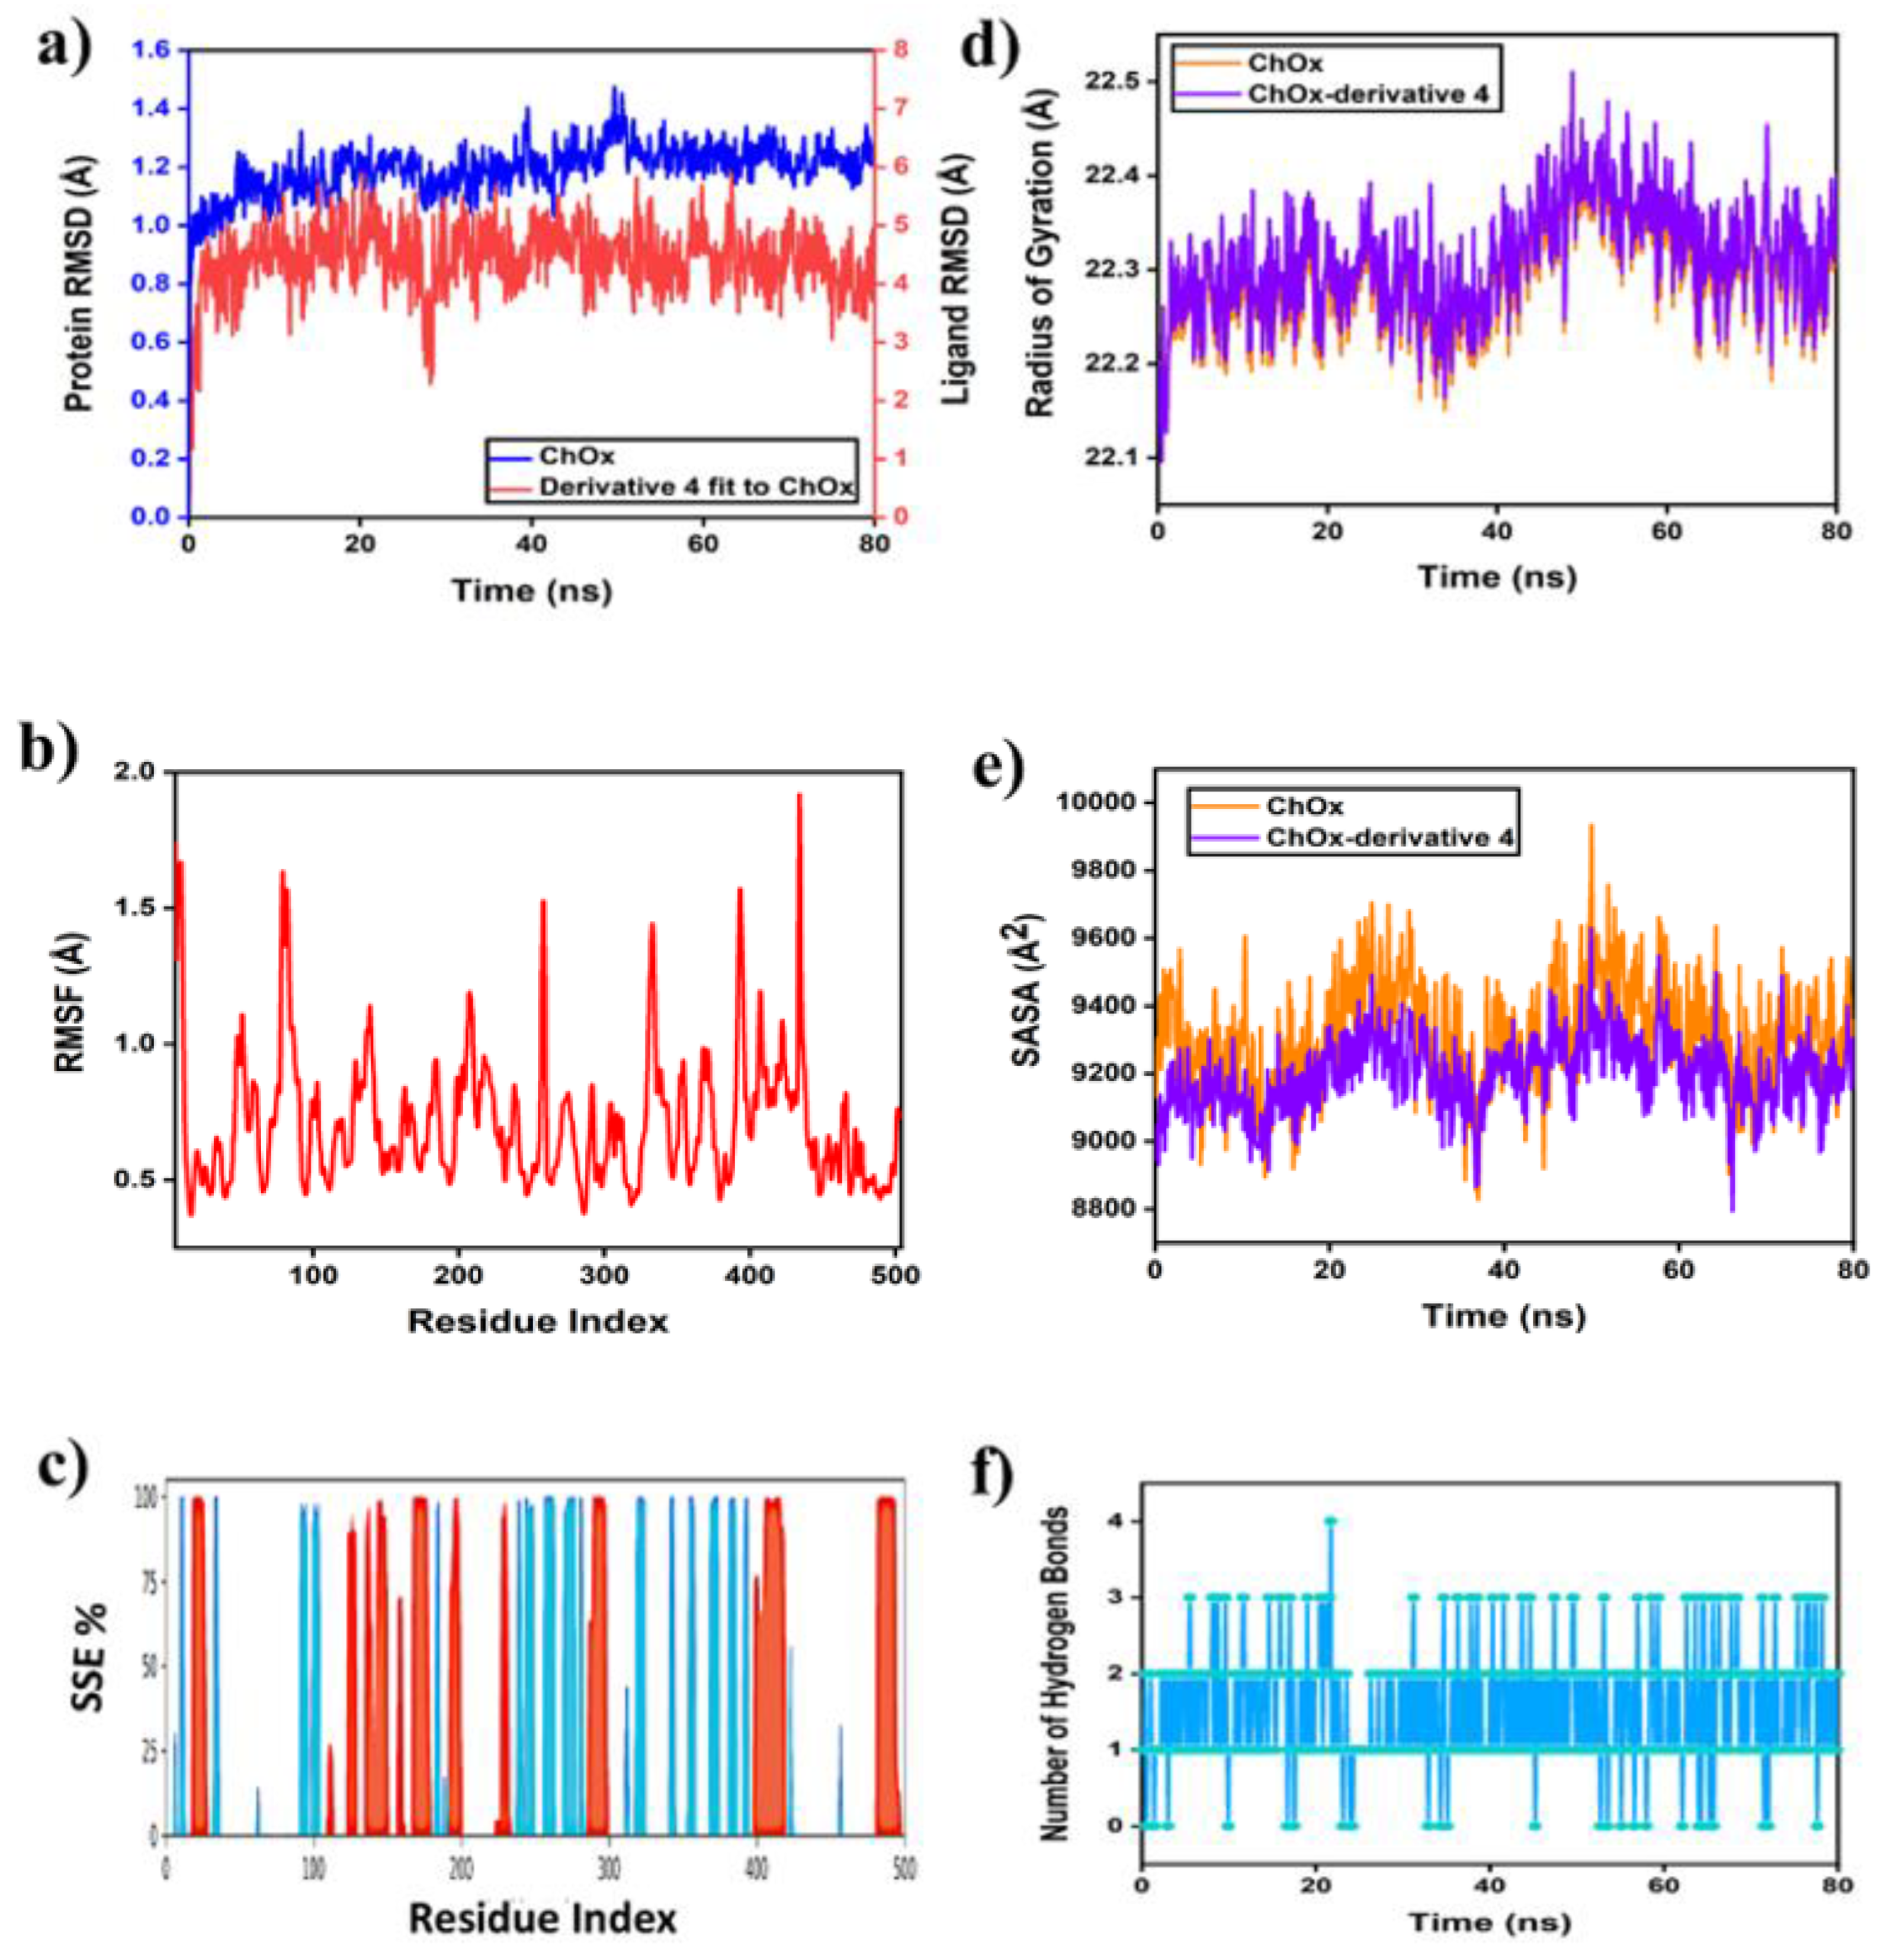
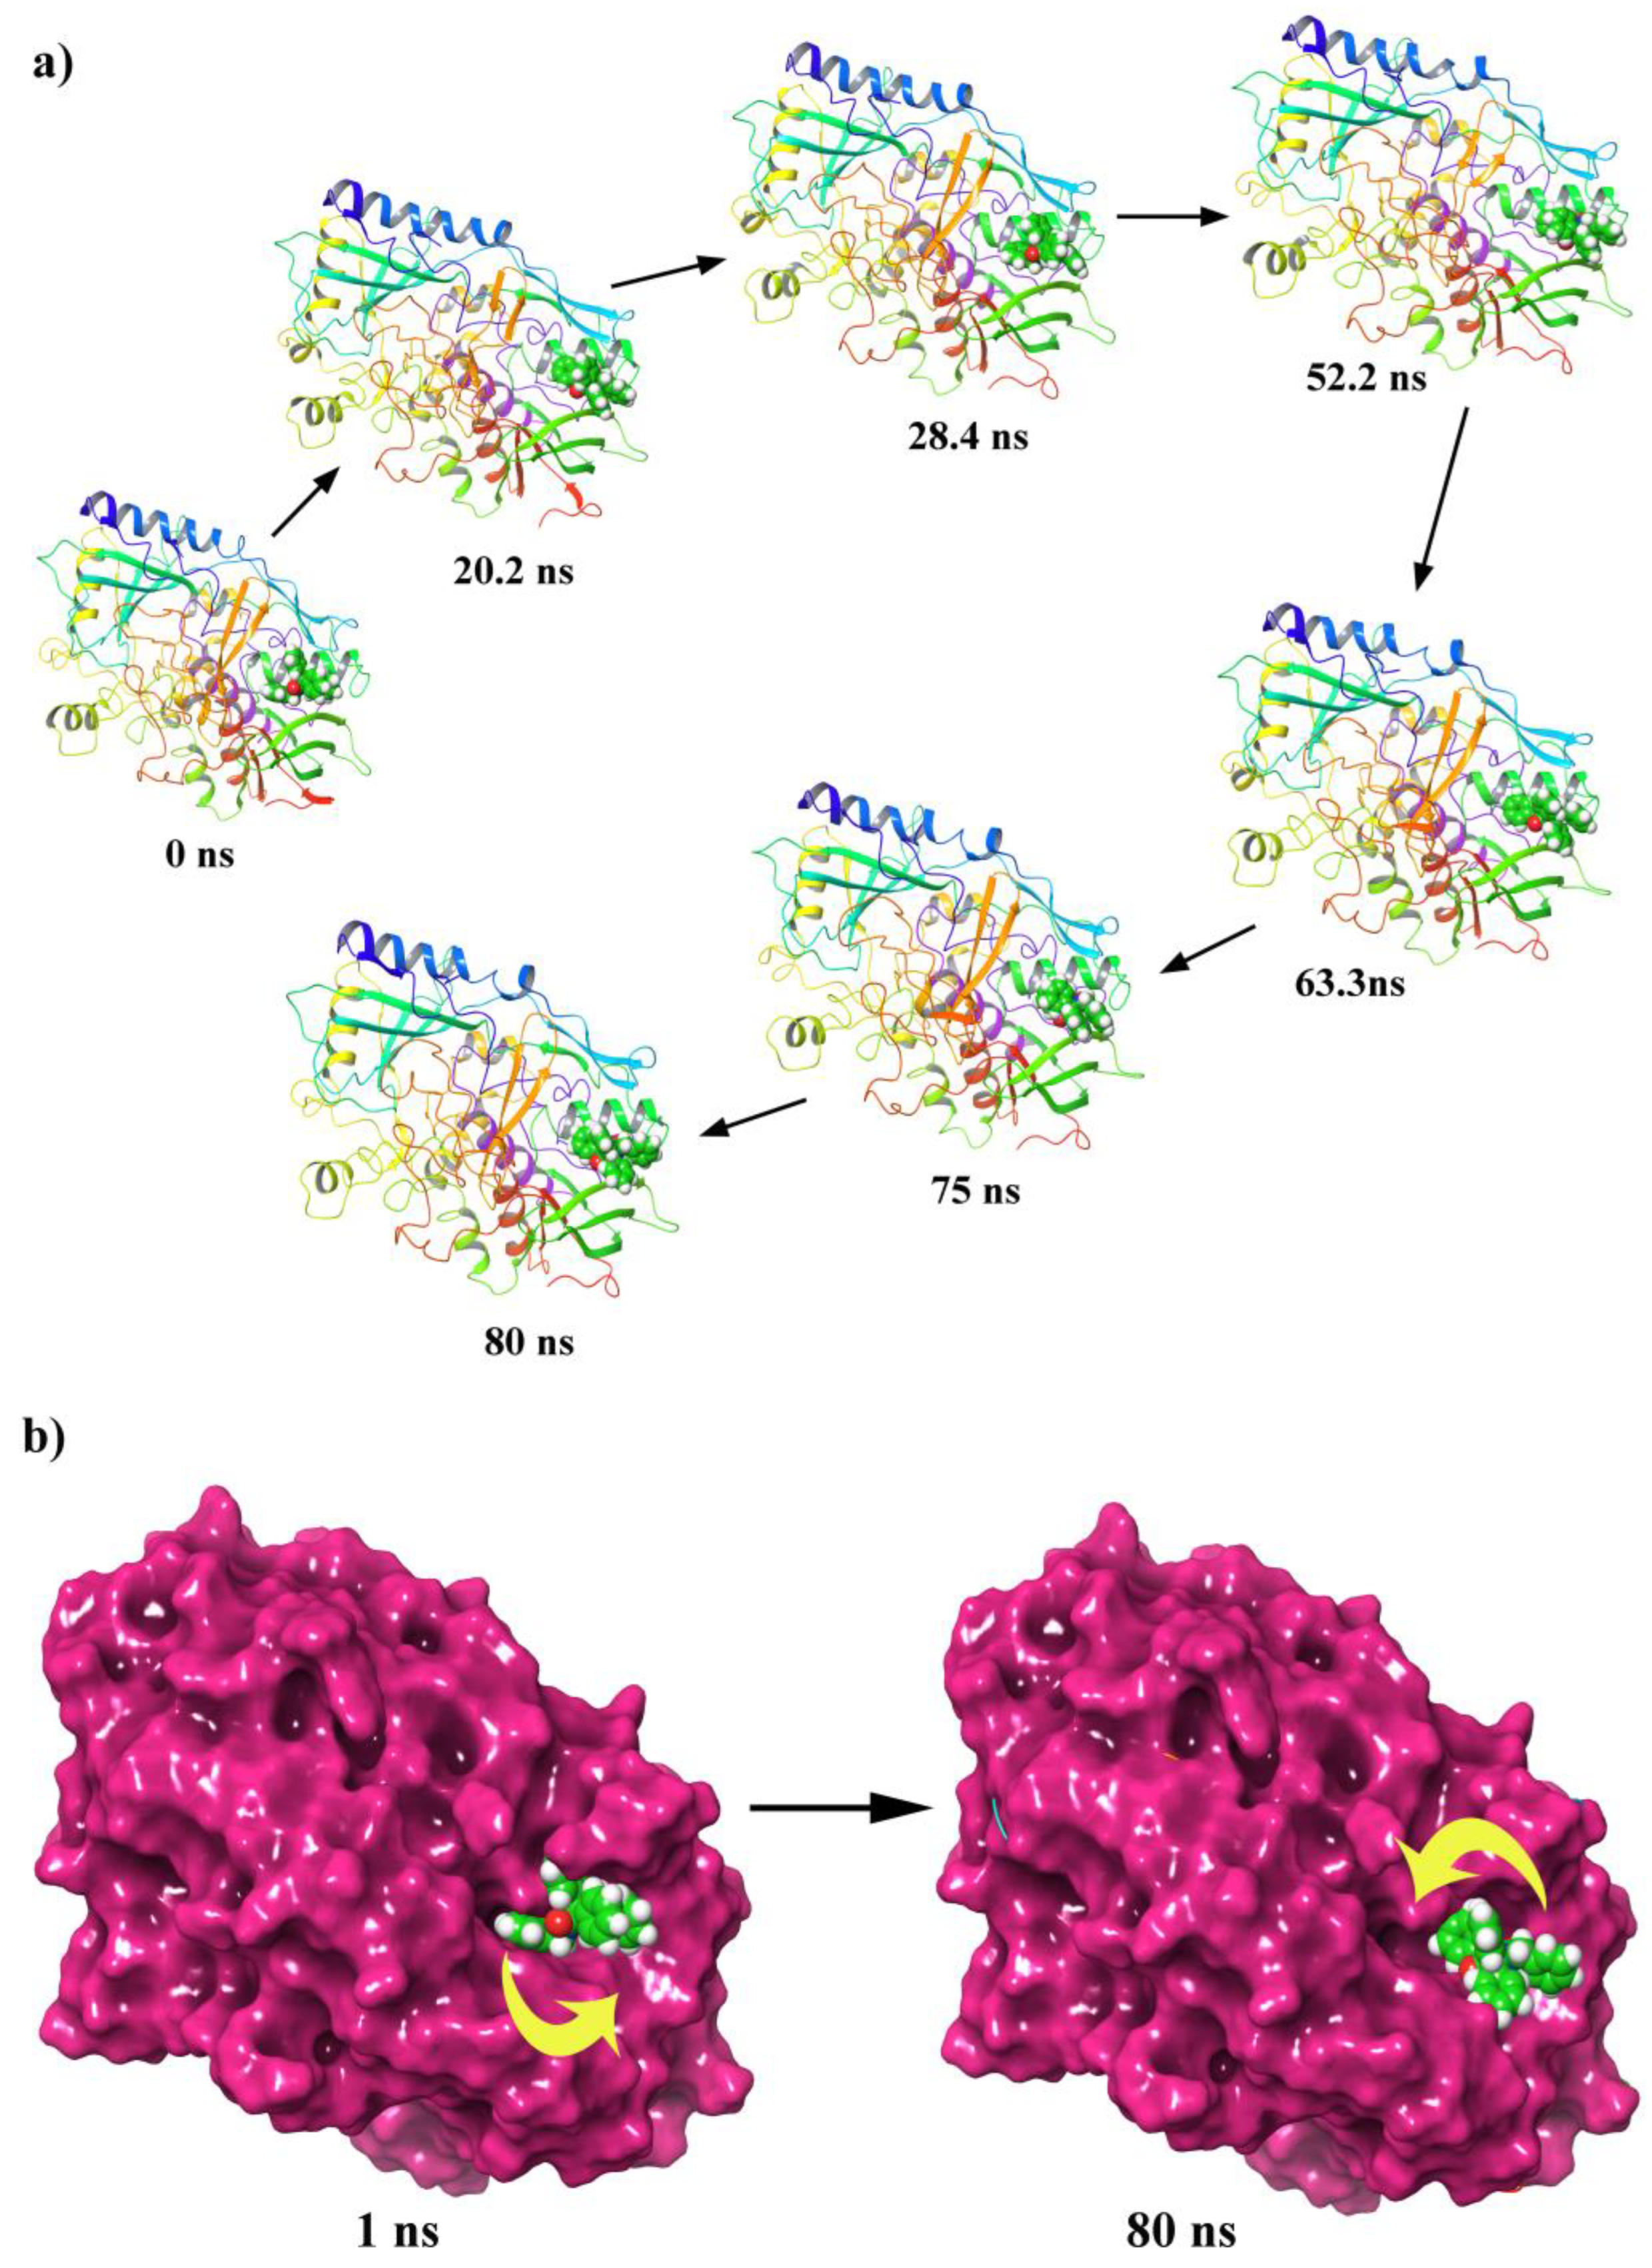
Nine N-alkylated phenytoin derivatives (5-13) have been synthesized and characterized using spectroscopic tools with the structures of 4-6 confirmed by X-ray crystallography. The starting material, phenytoin 2, was obtained by a base-catalyzed condensation from benzyl and urea. Its alkylation with benzyl chloride yields 3 and 4. Subsequently, the alkylation of 3 with various alkyl halides under solid-liquid phase transfer catalysis (PTC) led to the formation of 5-13. The intercontacts in 4-6 crystals are identified by analyzing their corresponding Hirshfeld surfaces and fingerprint plots, and the HS analysis reveals that the most intercontacts involved H…H interactions. DFT calculations relatively well reproduce X-ray geometrical parameters in IEF-PCM at the B3LYP/6-3111++G(d,p) level of theory. The calculated electronic and molecular properties demonstrate that the N-alkylation of 5-6 may have slight effects on the calculated, and that reactivity is relatively similar. The inhibitory potency of 4-6 towards cholesterol oxidase (ChOx) is estimated by investigating their binding affinity into the binding site of binding cholesterol oxidase. The compound 4 with N-benzyl moiety displays higher binding affinity than 5 and 6 with N-methyl and N-ethyl moieties. Additionally, the stability of 4 in the binding site ChOx was evaluated and an 80 ns MD simulation was conducted. MD analysis shows that the 4-ChOx complex remained stable throughout the simulation, showing minimal conformational changes, which confirms the stability of 4 in the ChOx binding site.
Keywords:
1. Introduction
2. Results and Discussion
2.1. X-ray Diffraction Analysis
2.2. Optimized Geometries
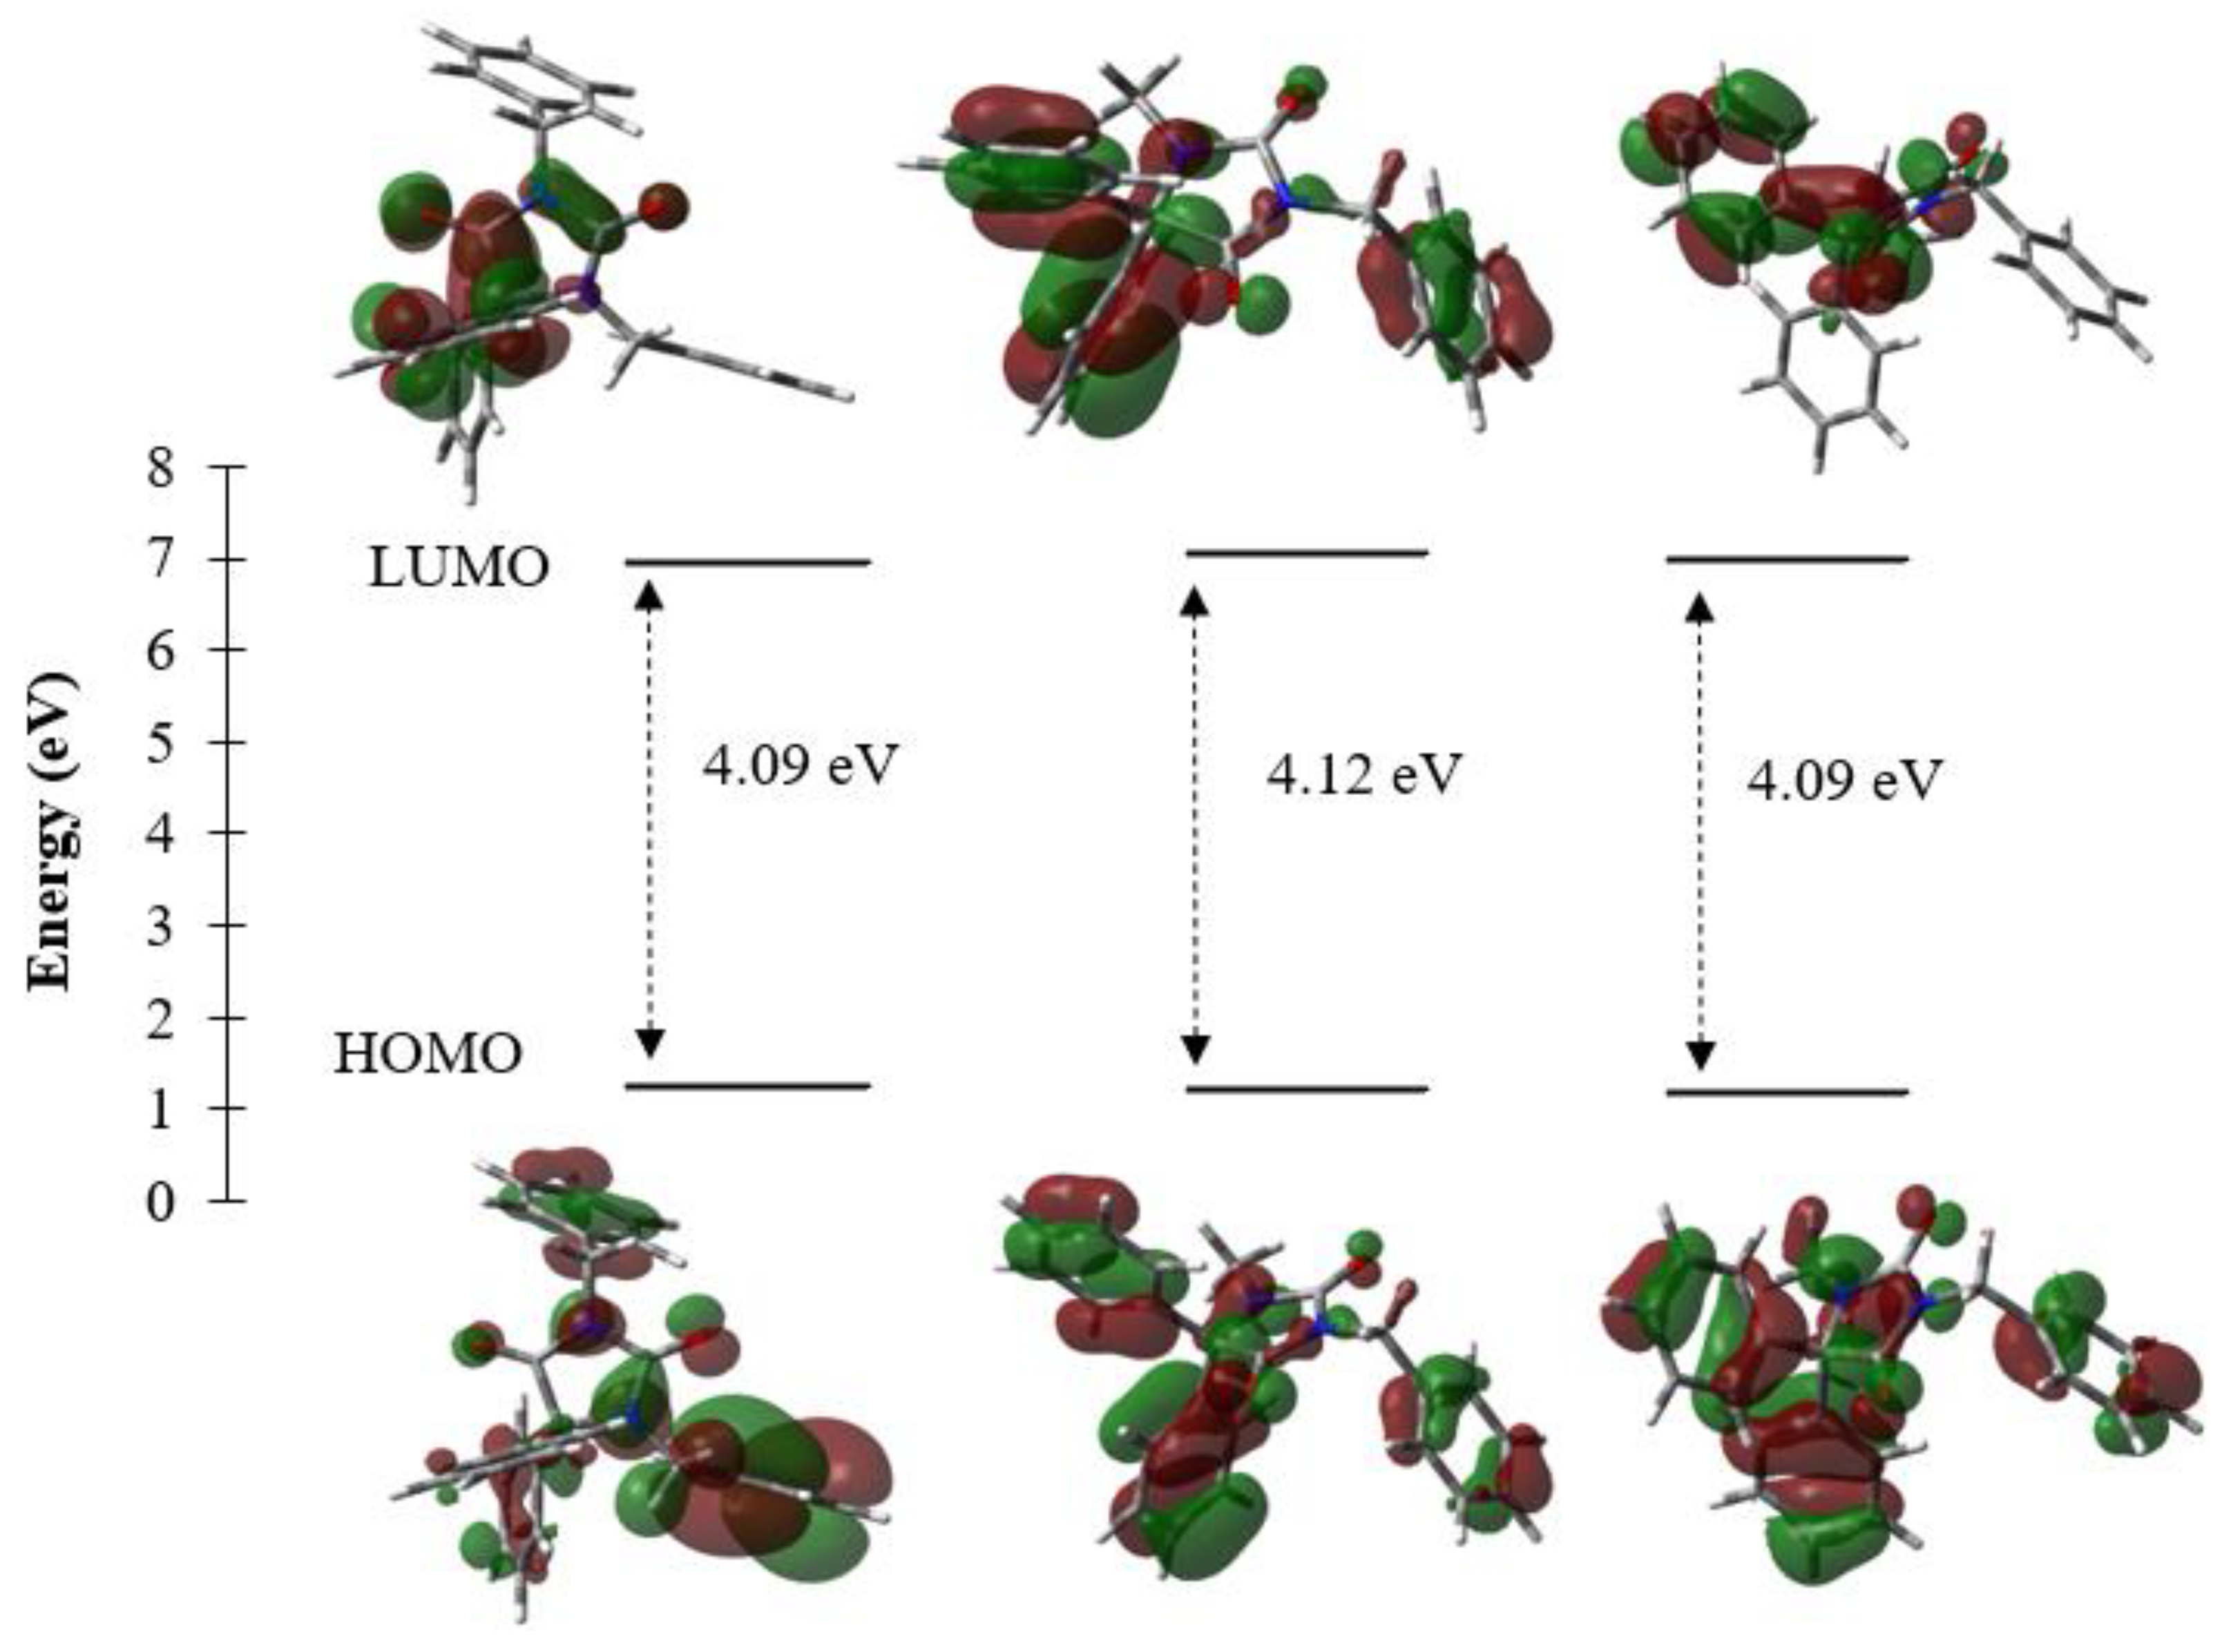
2.3. DFT Results
2.4. Hirshfeld Surface Analyses
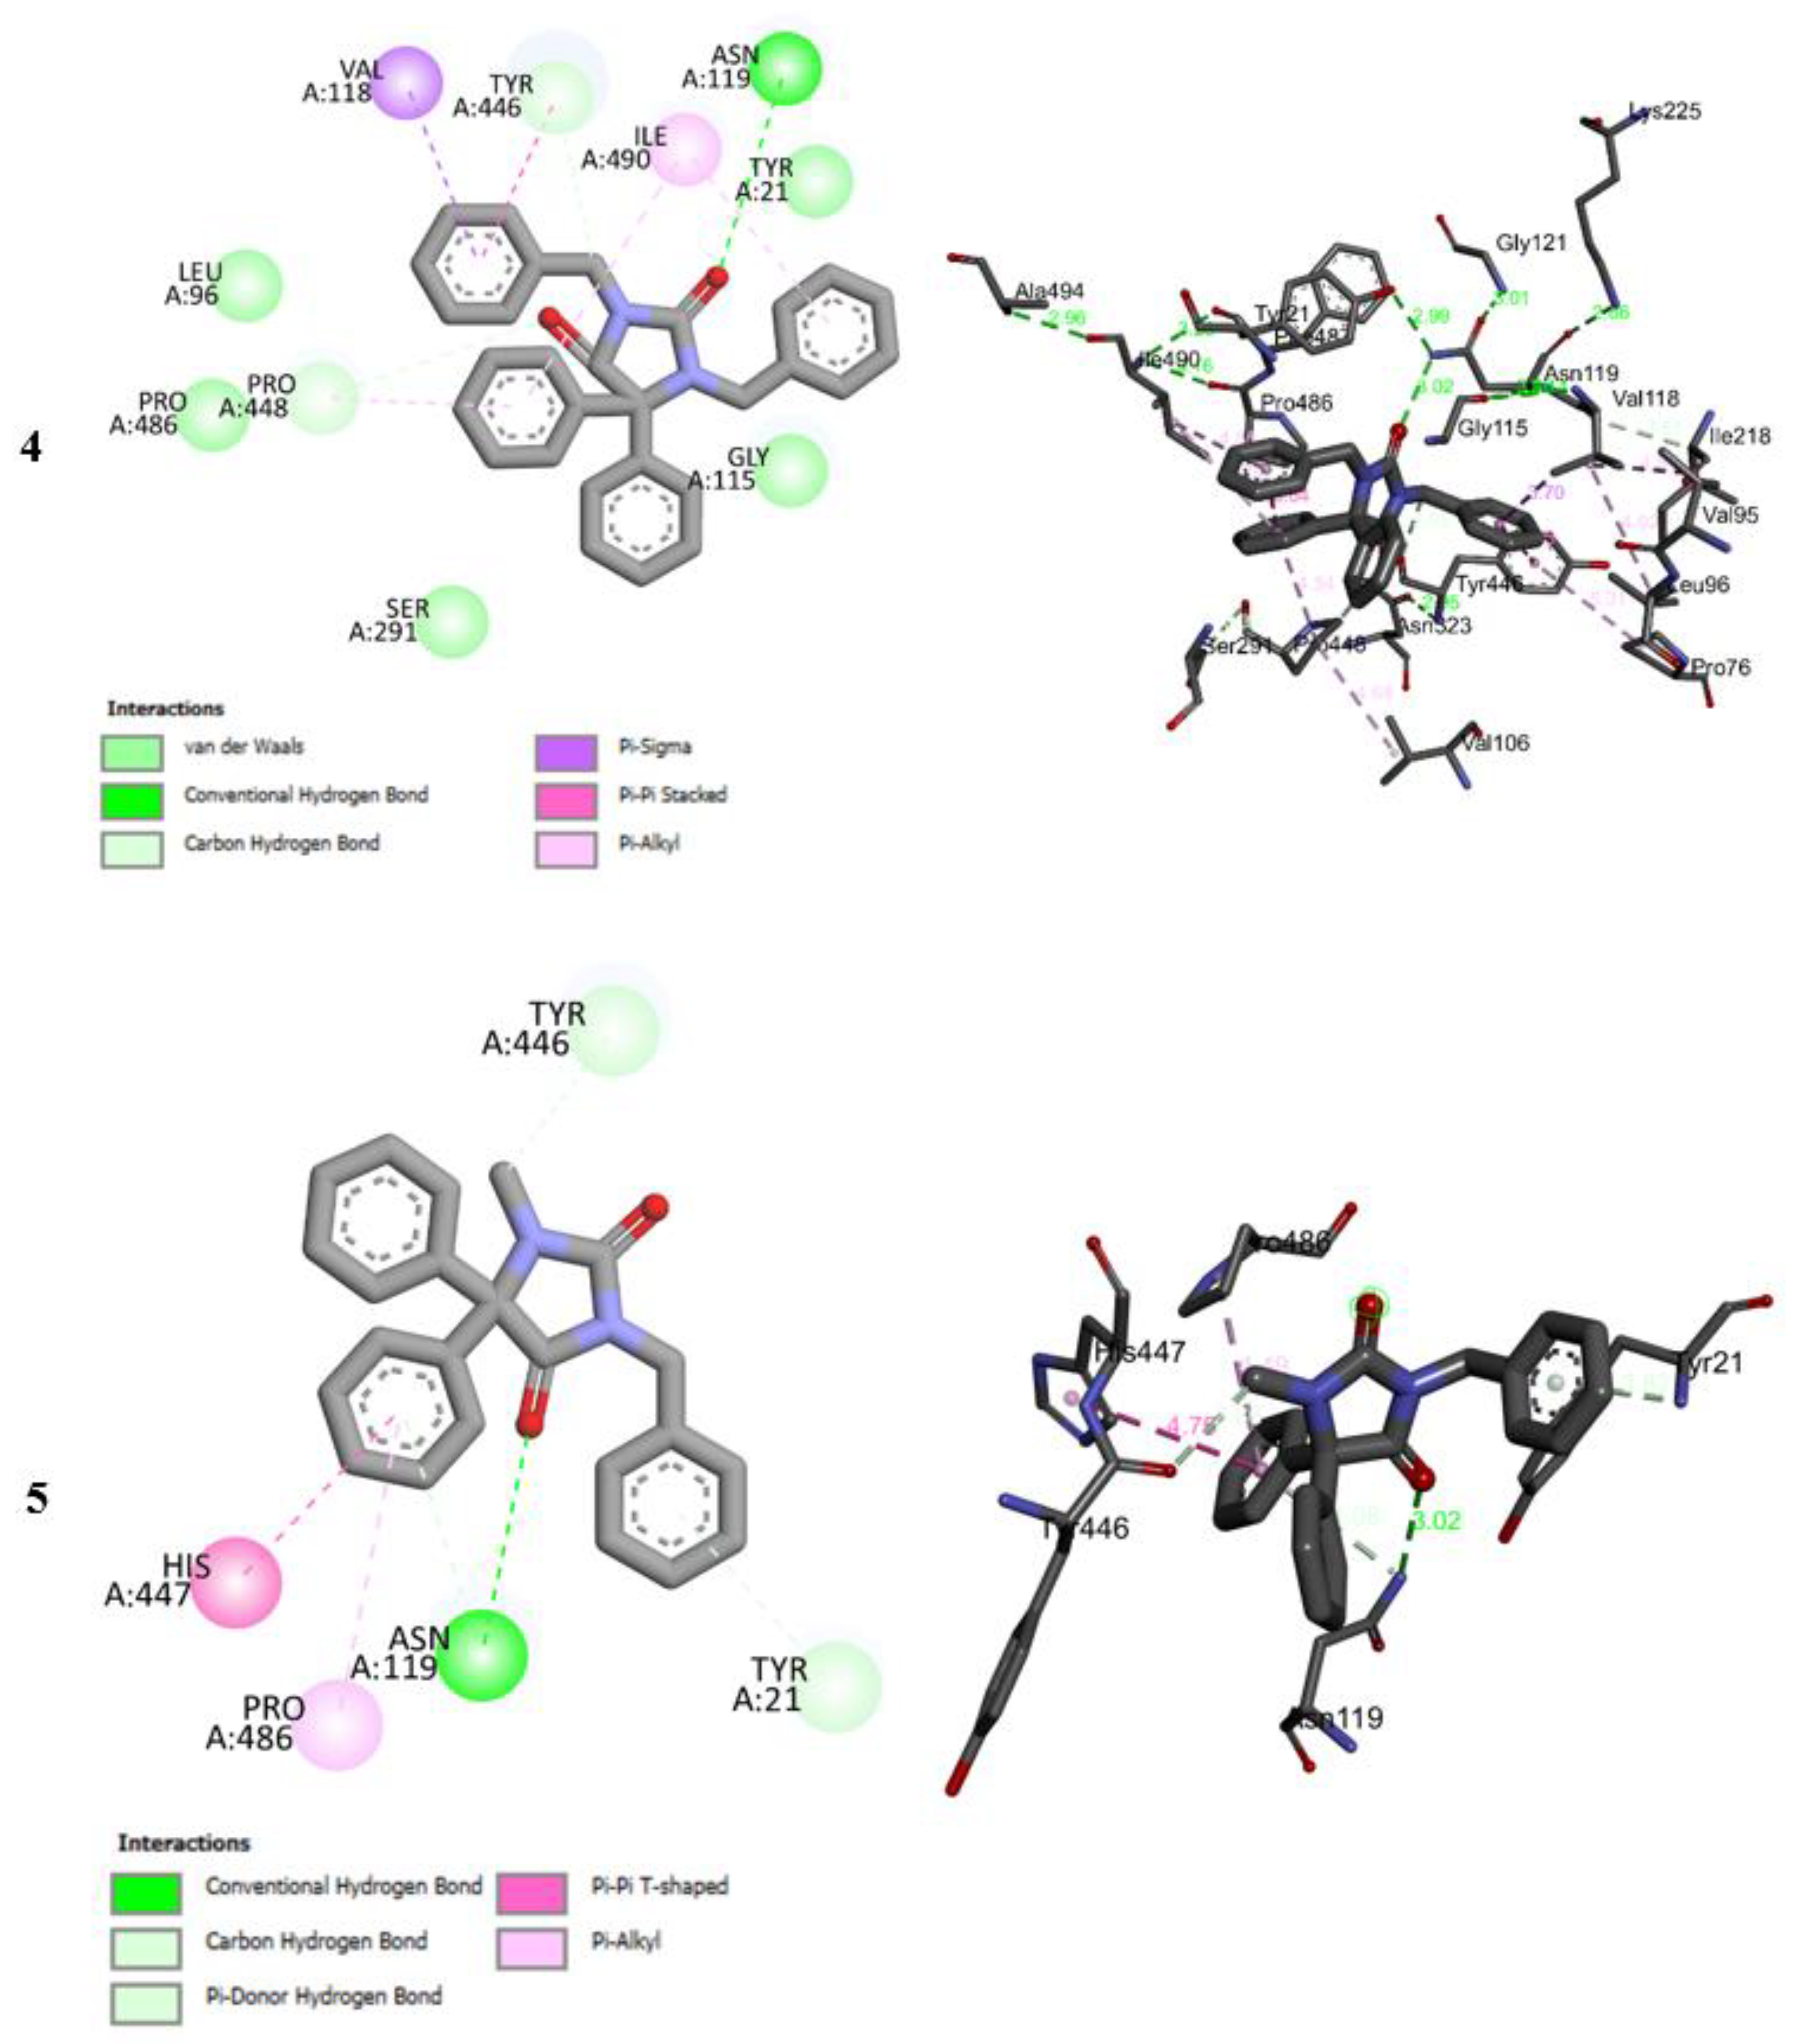
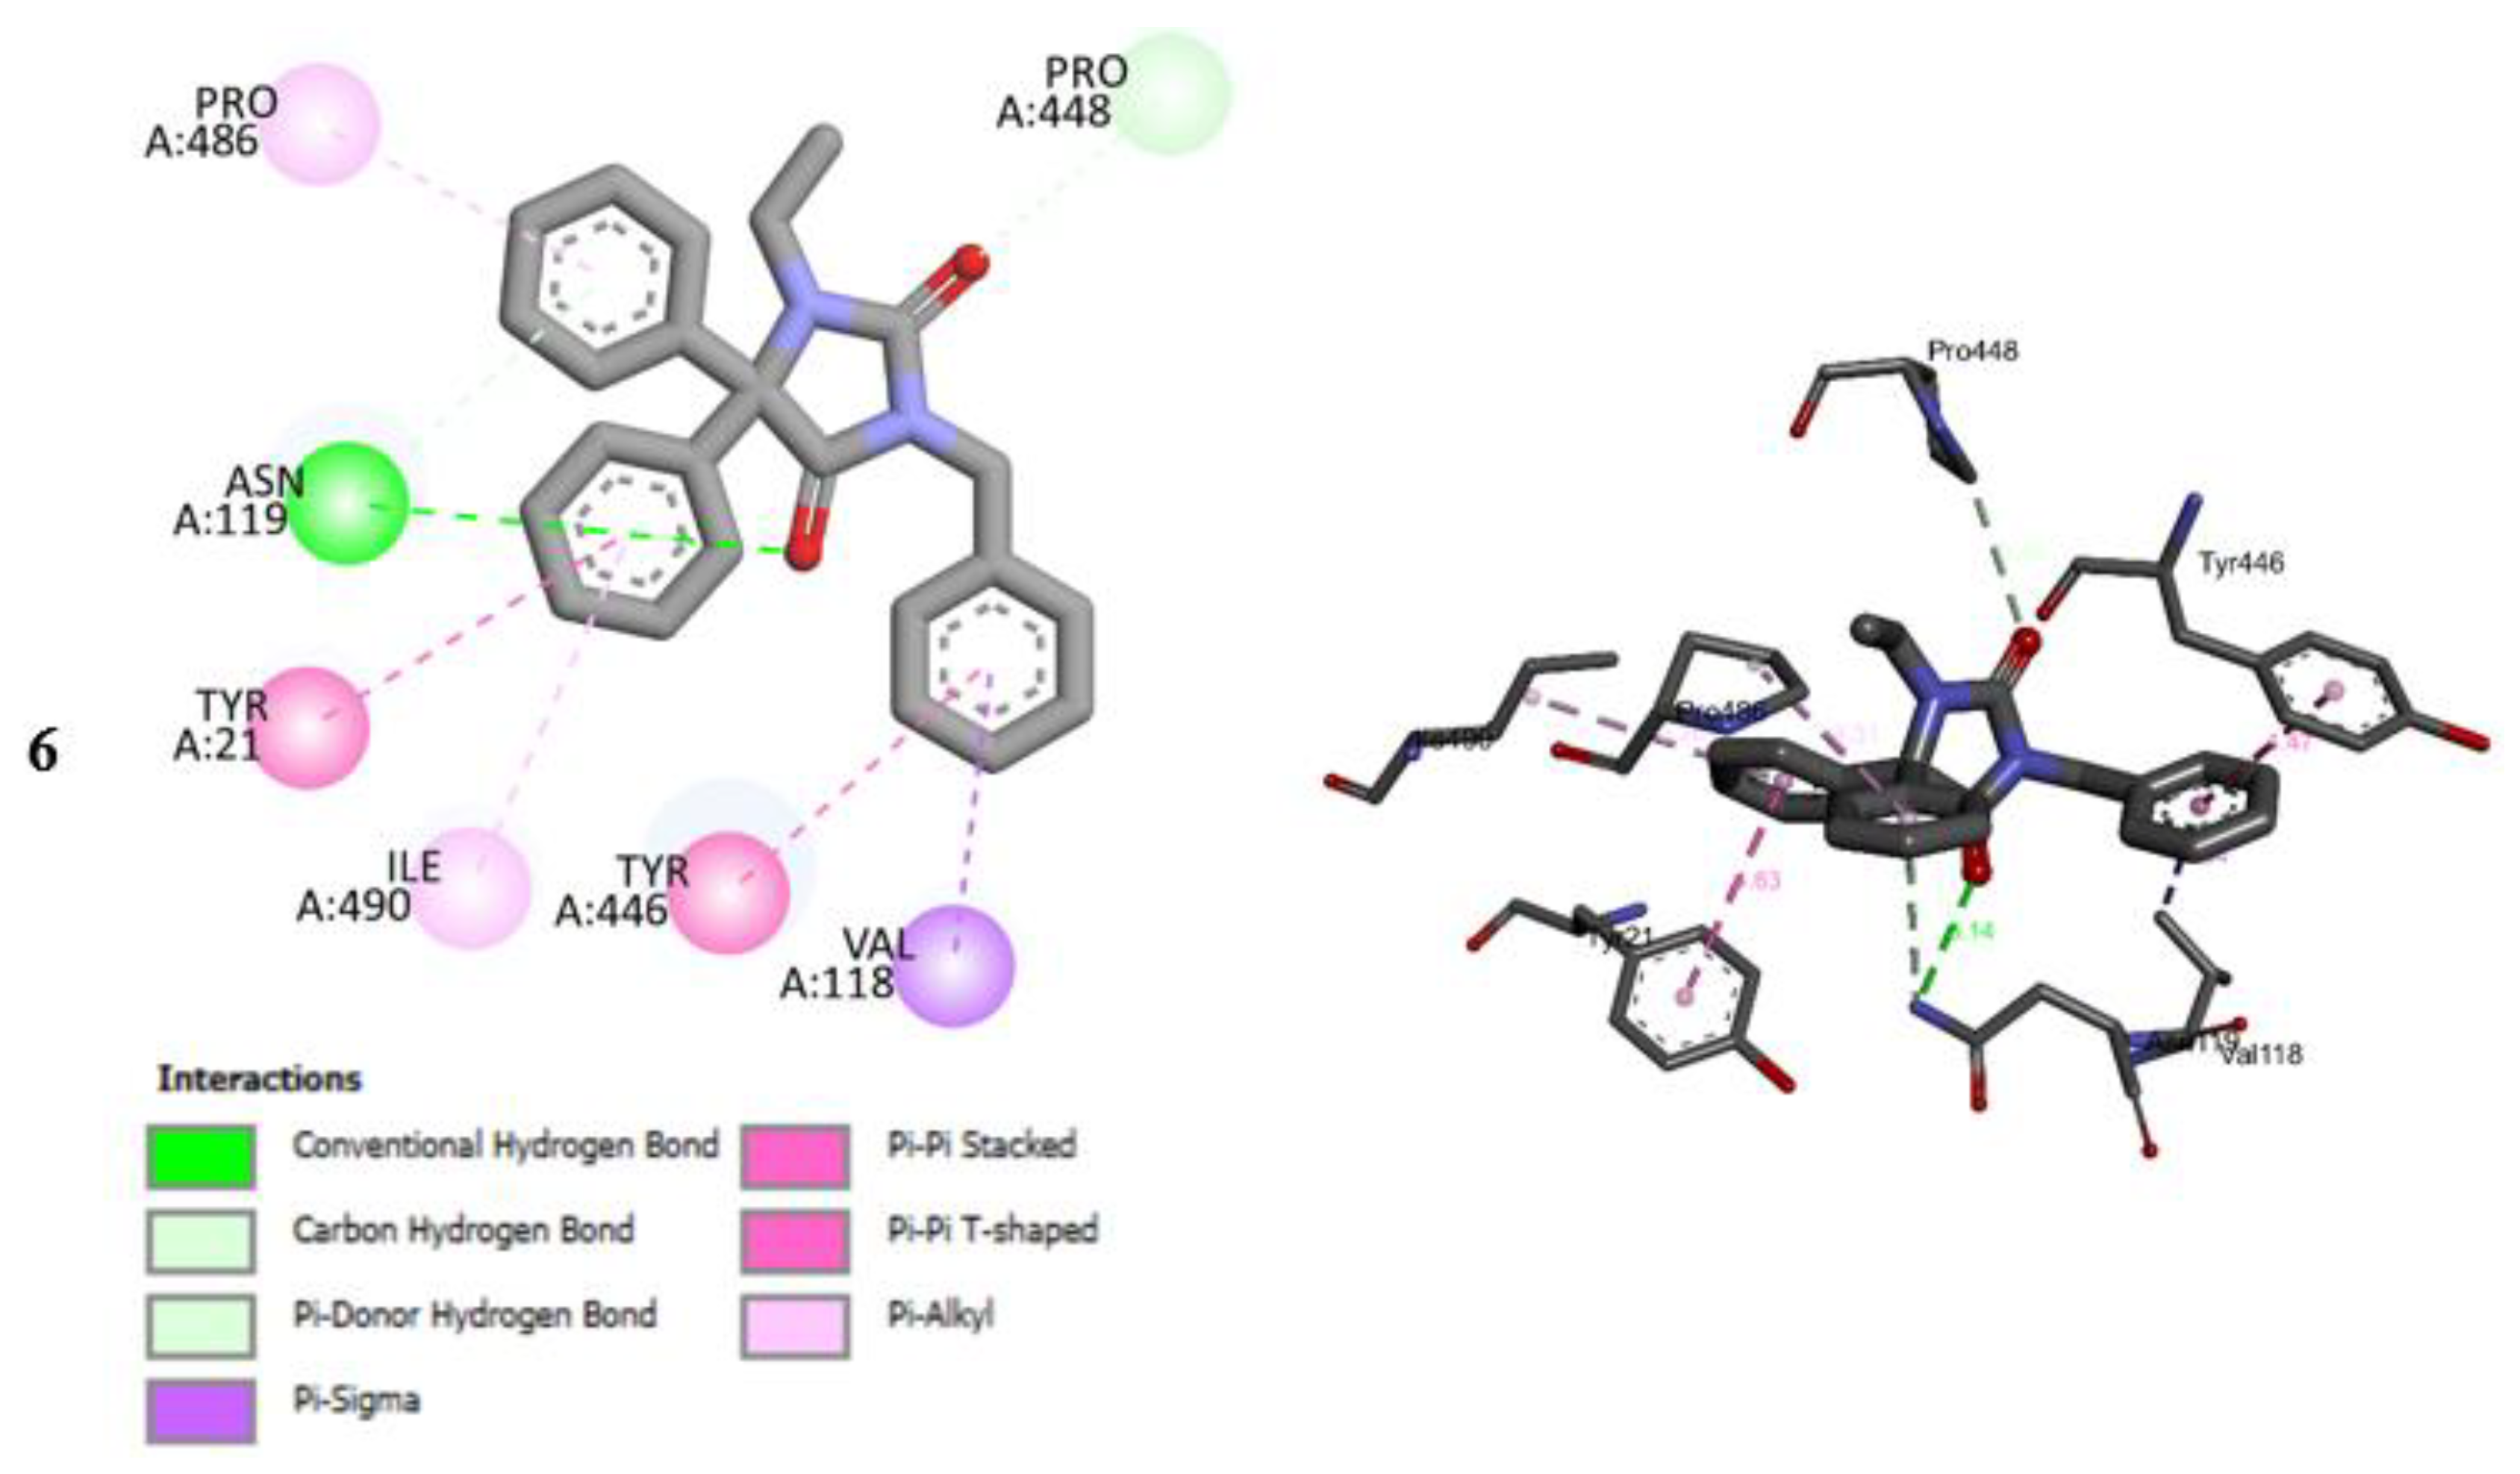
2.5. Molecular Docking Studies
2.6. Molecular Docking Studies MD Simulation
2.6.1. MD Simulation of Protein-Ligand Complex
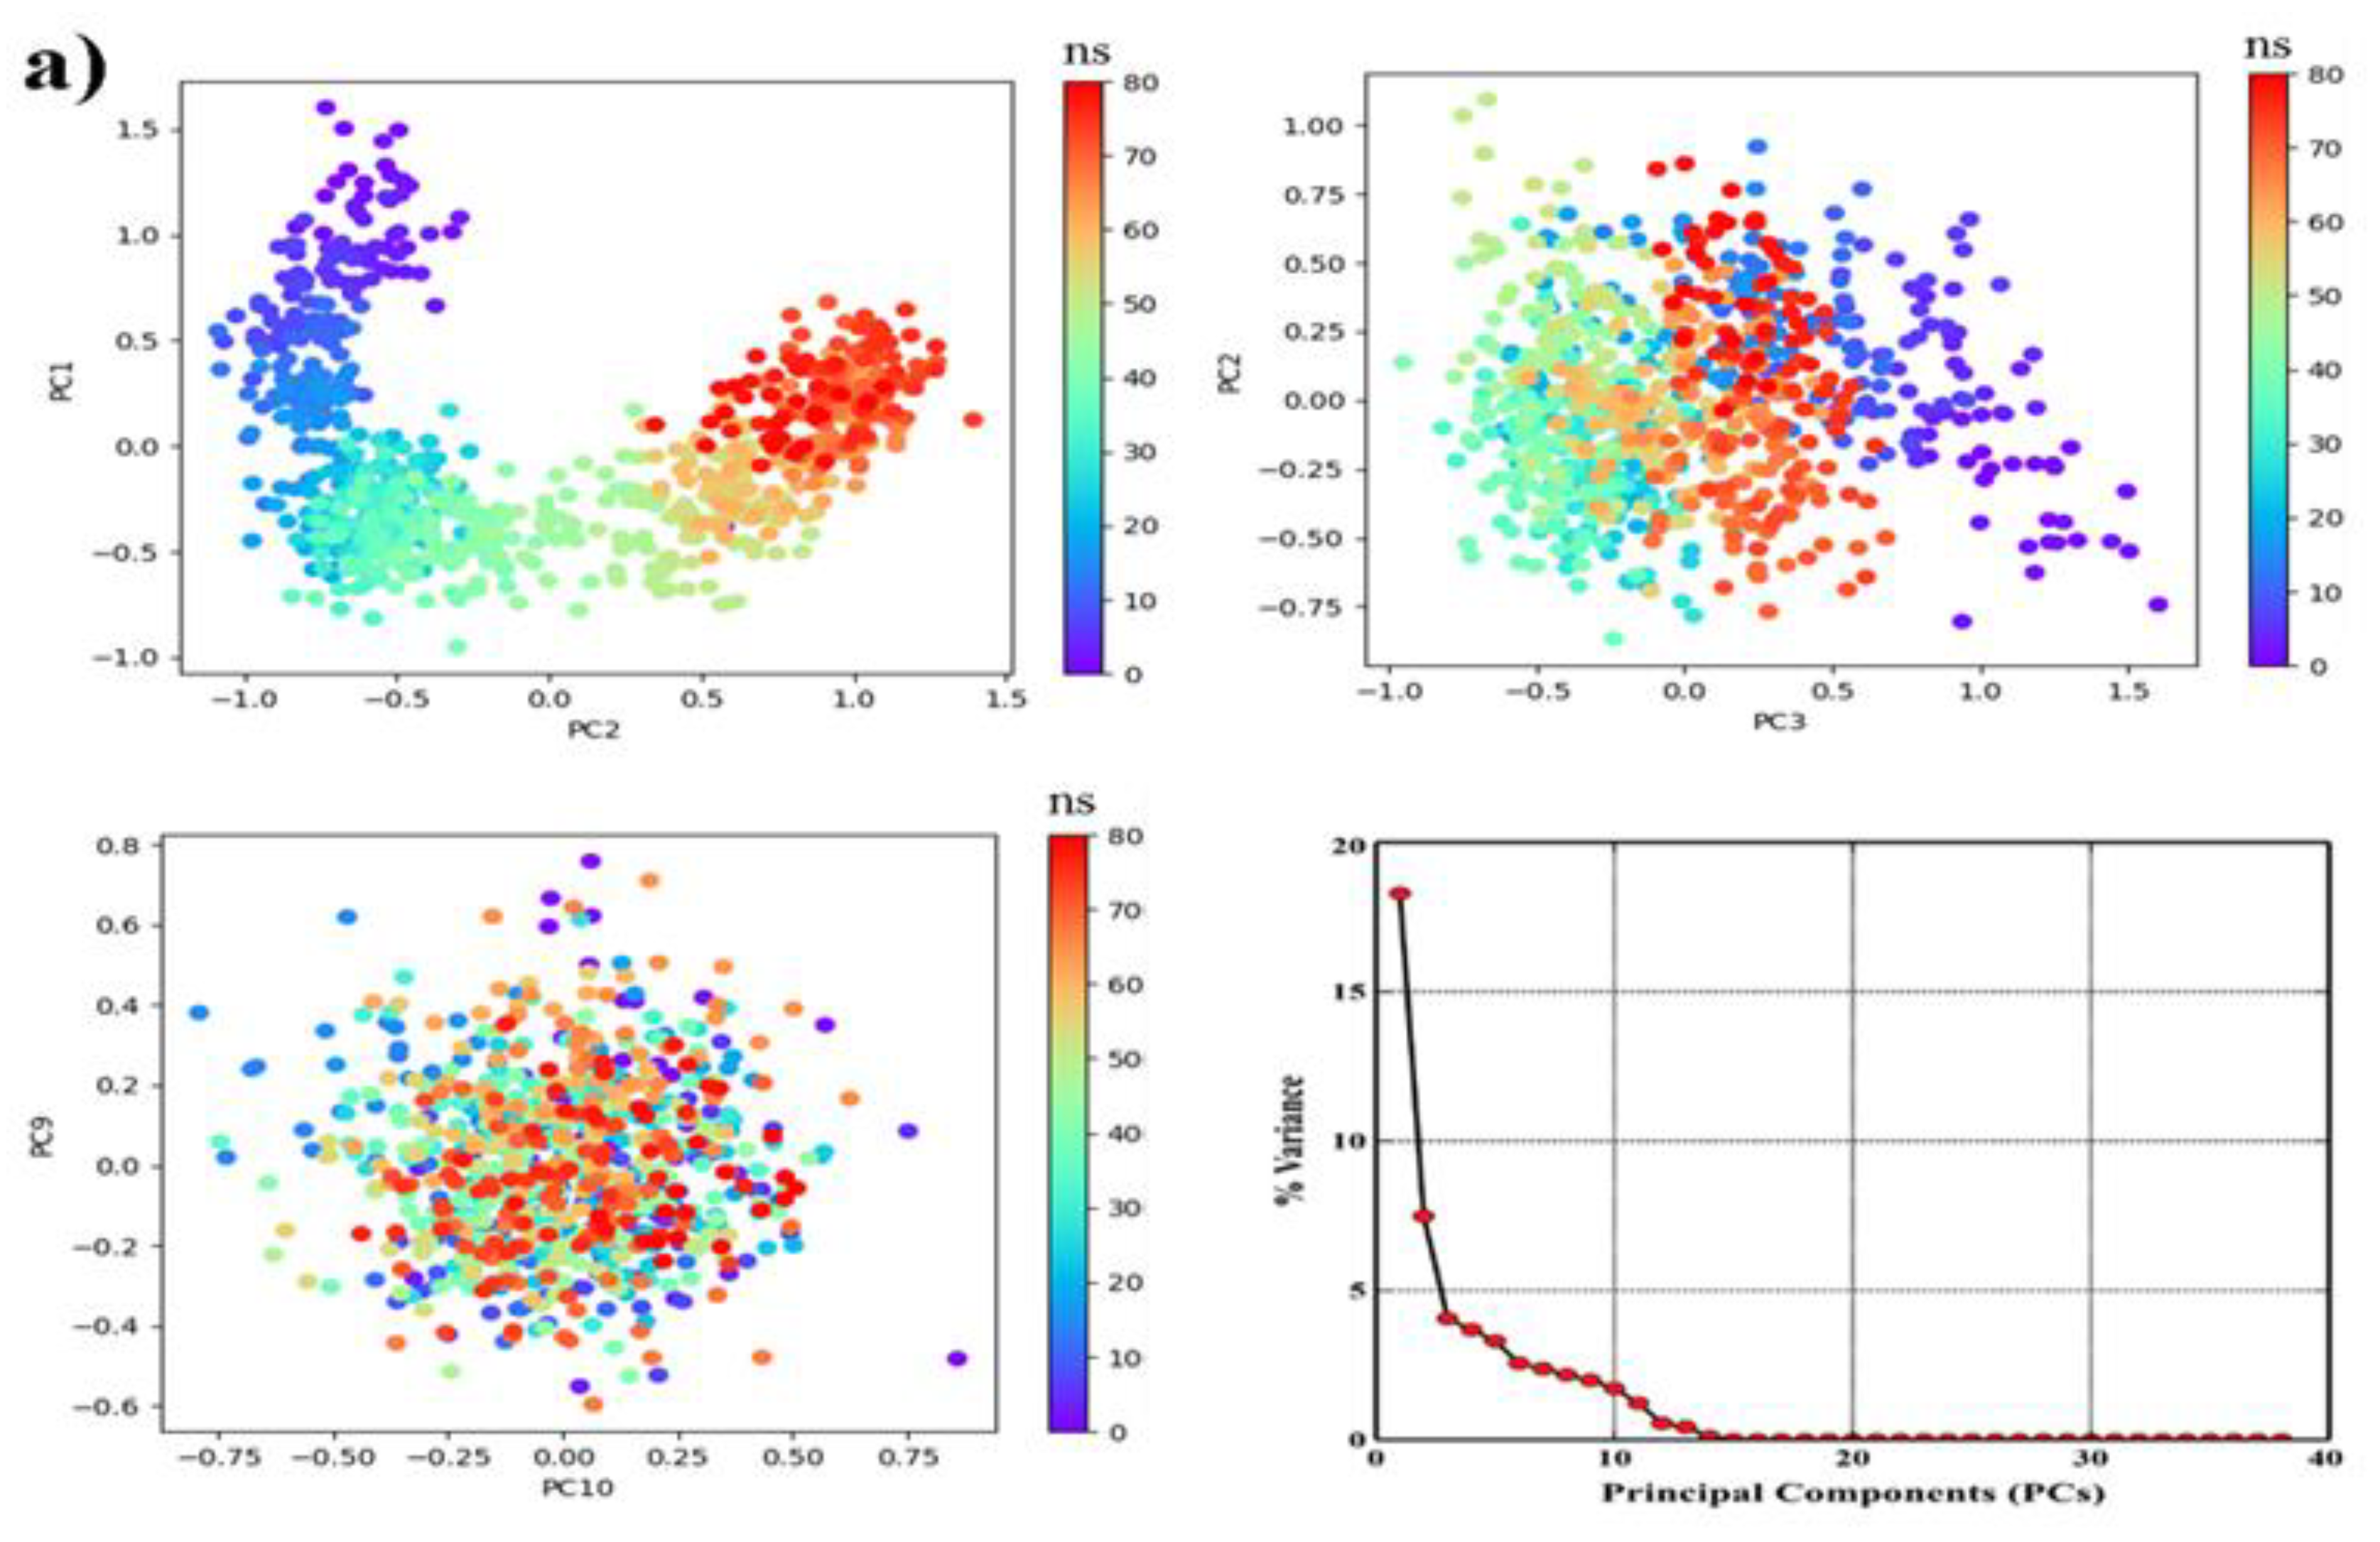
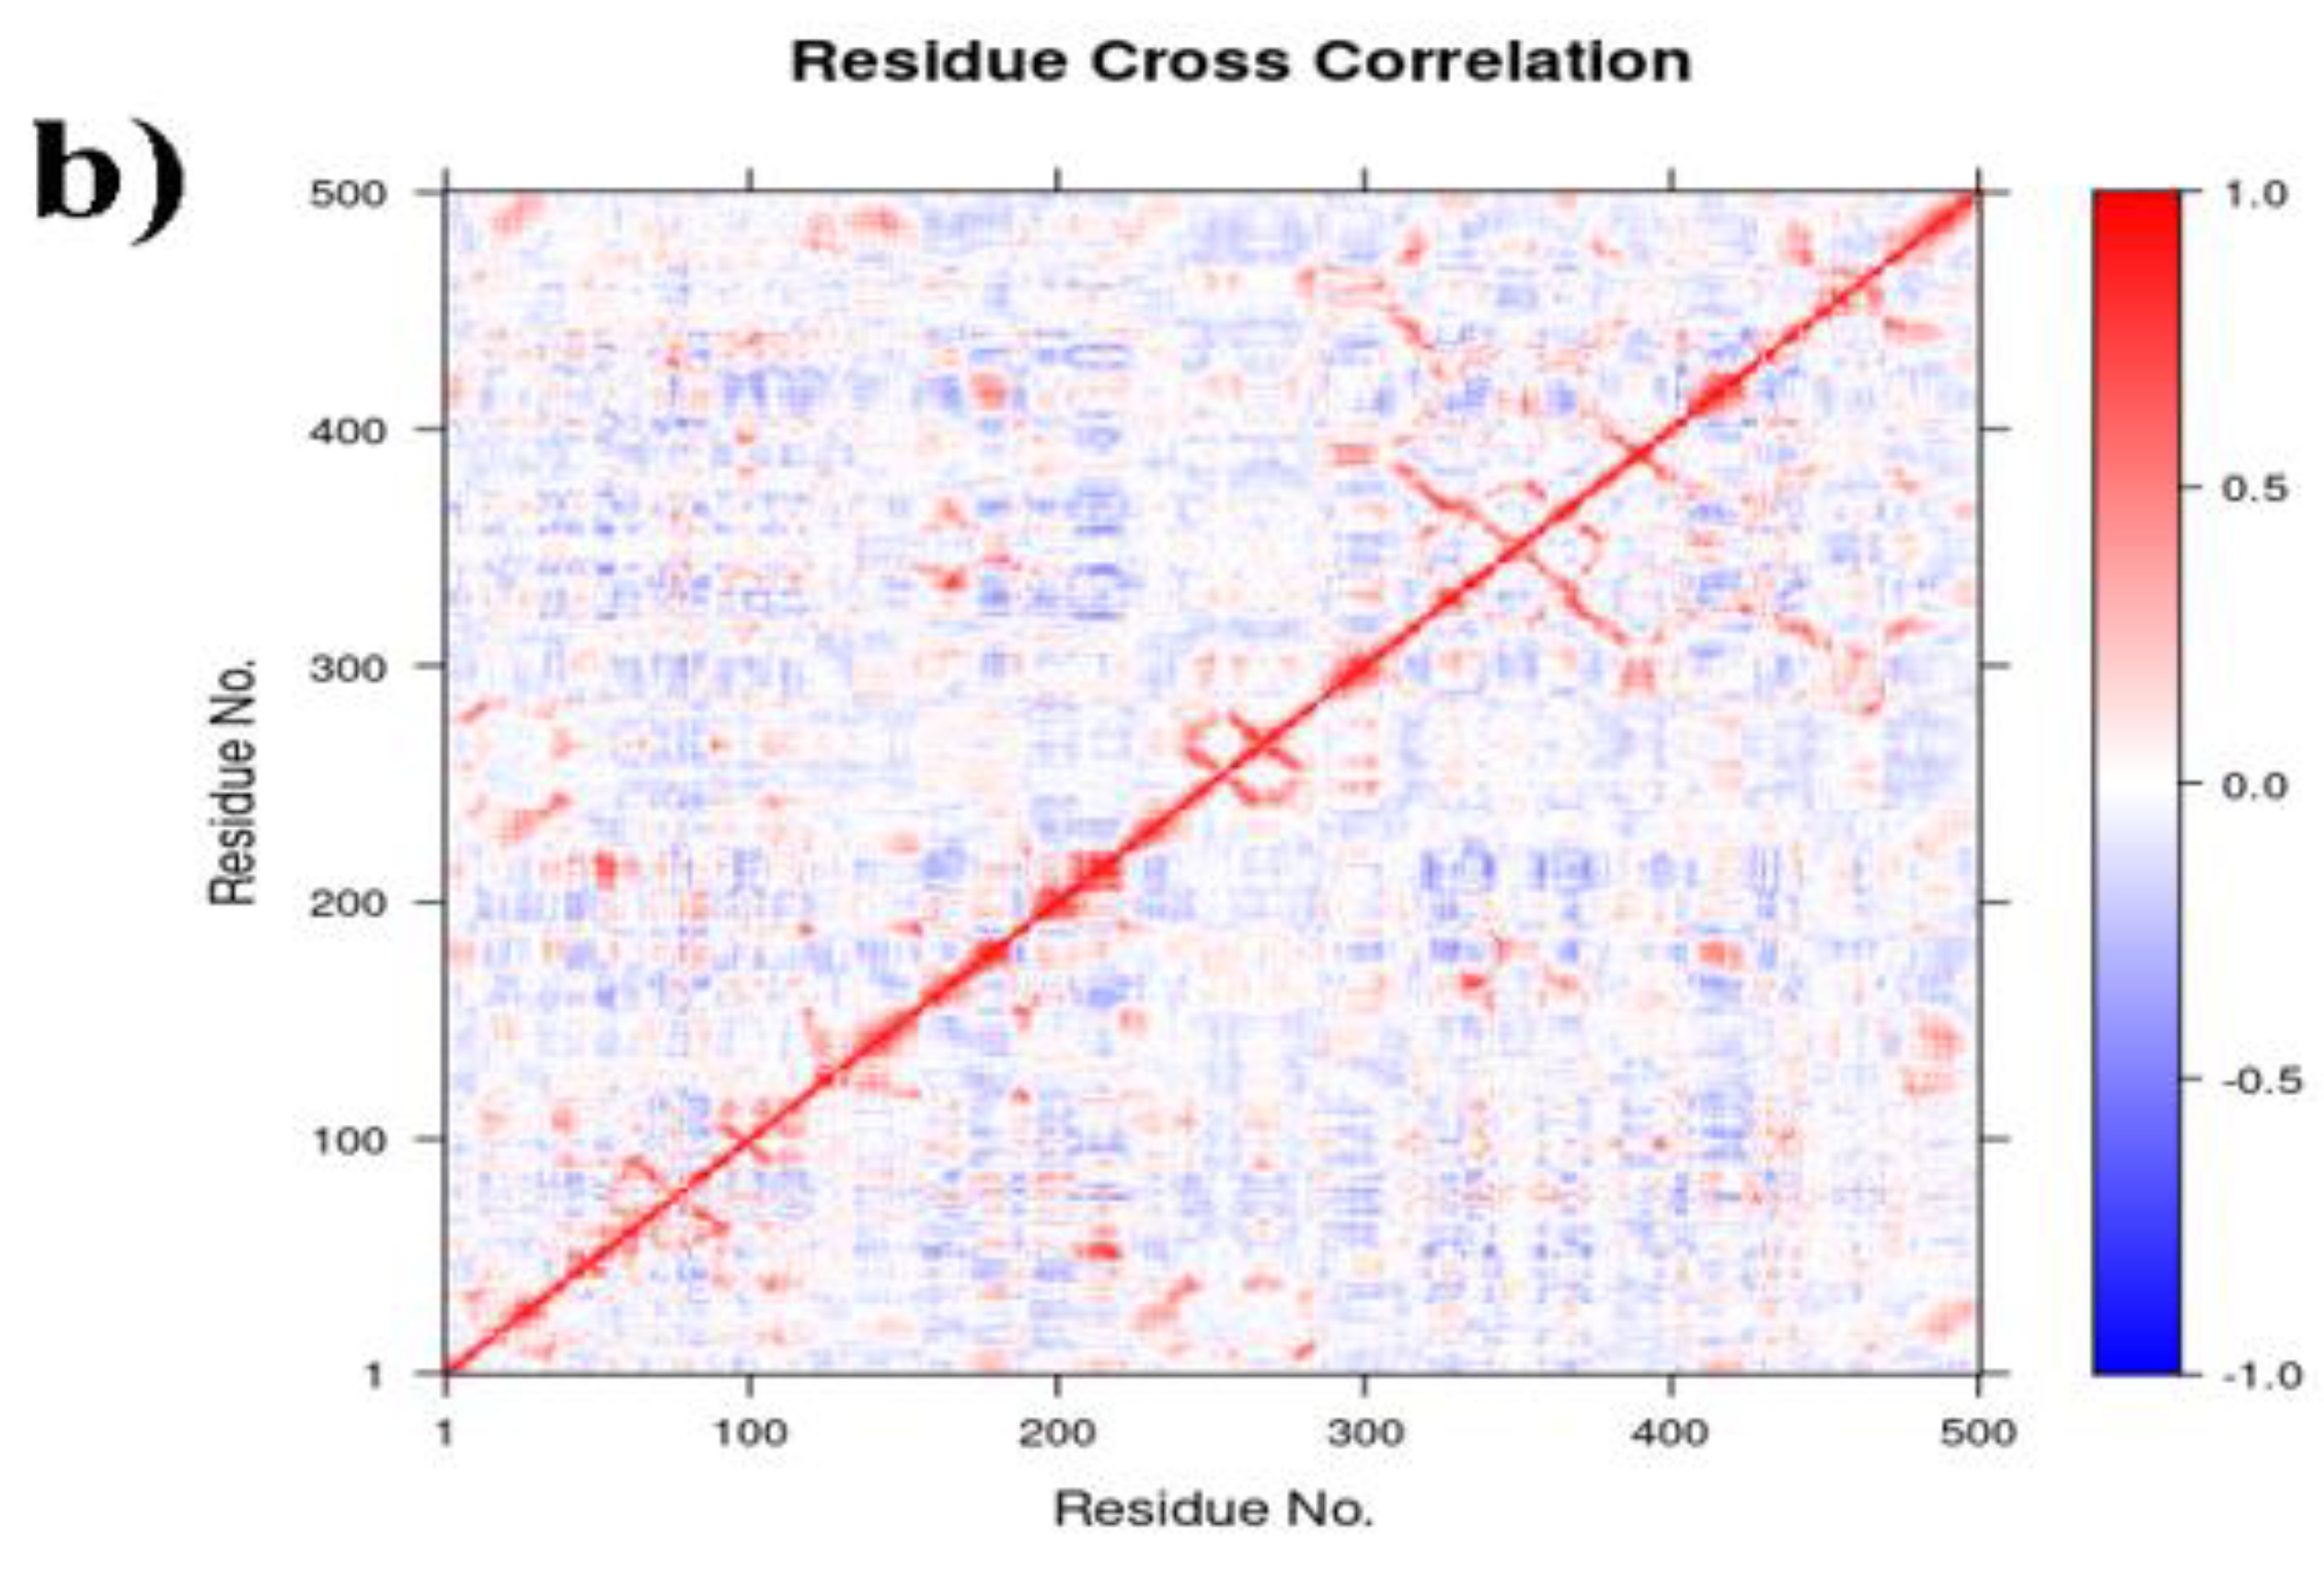
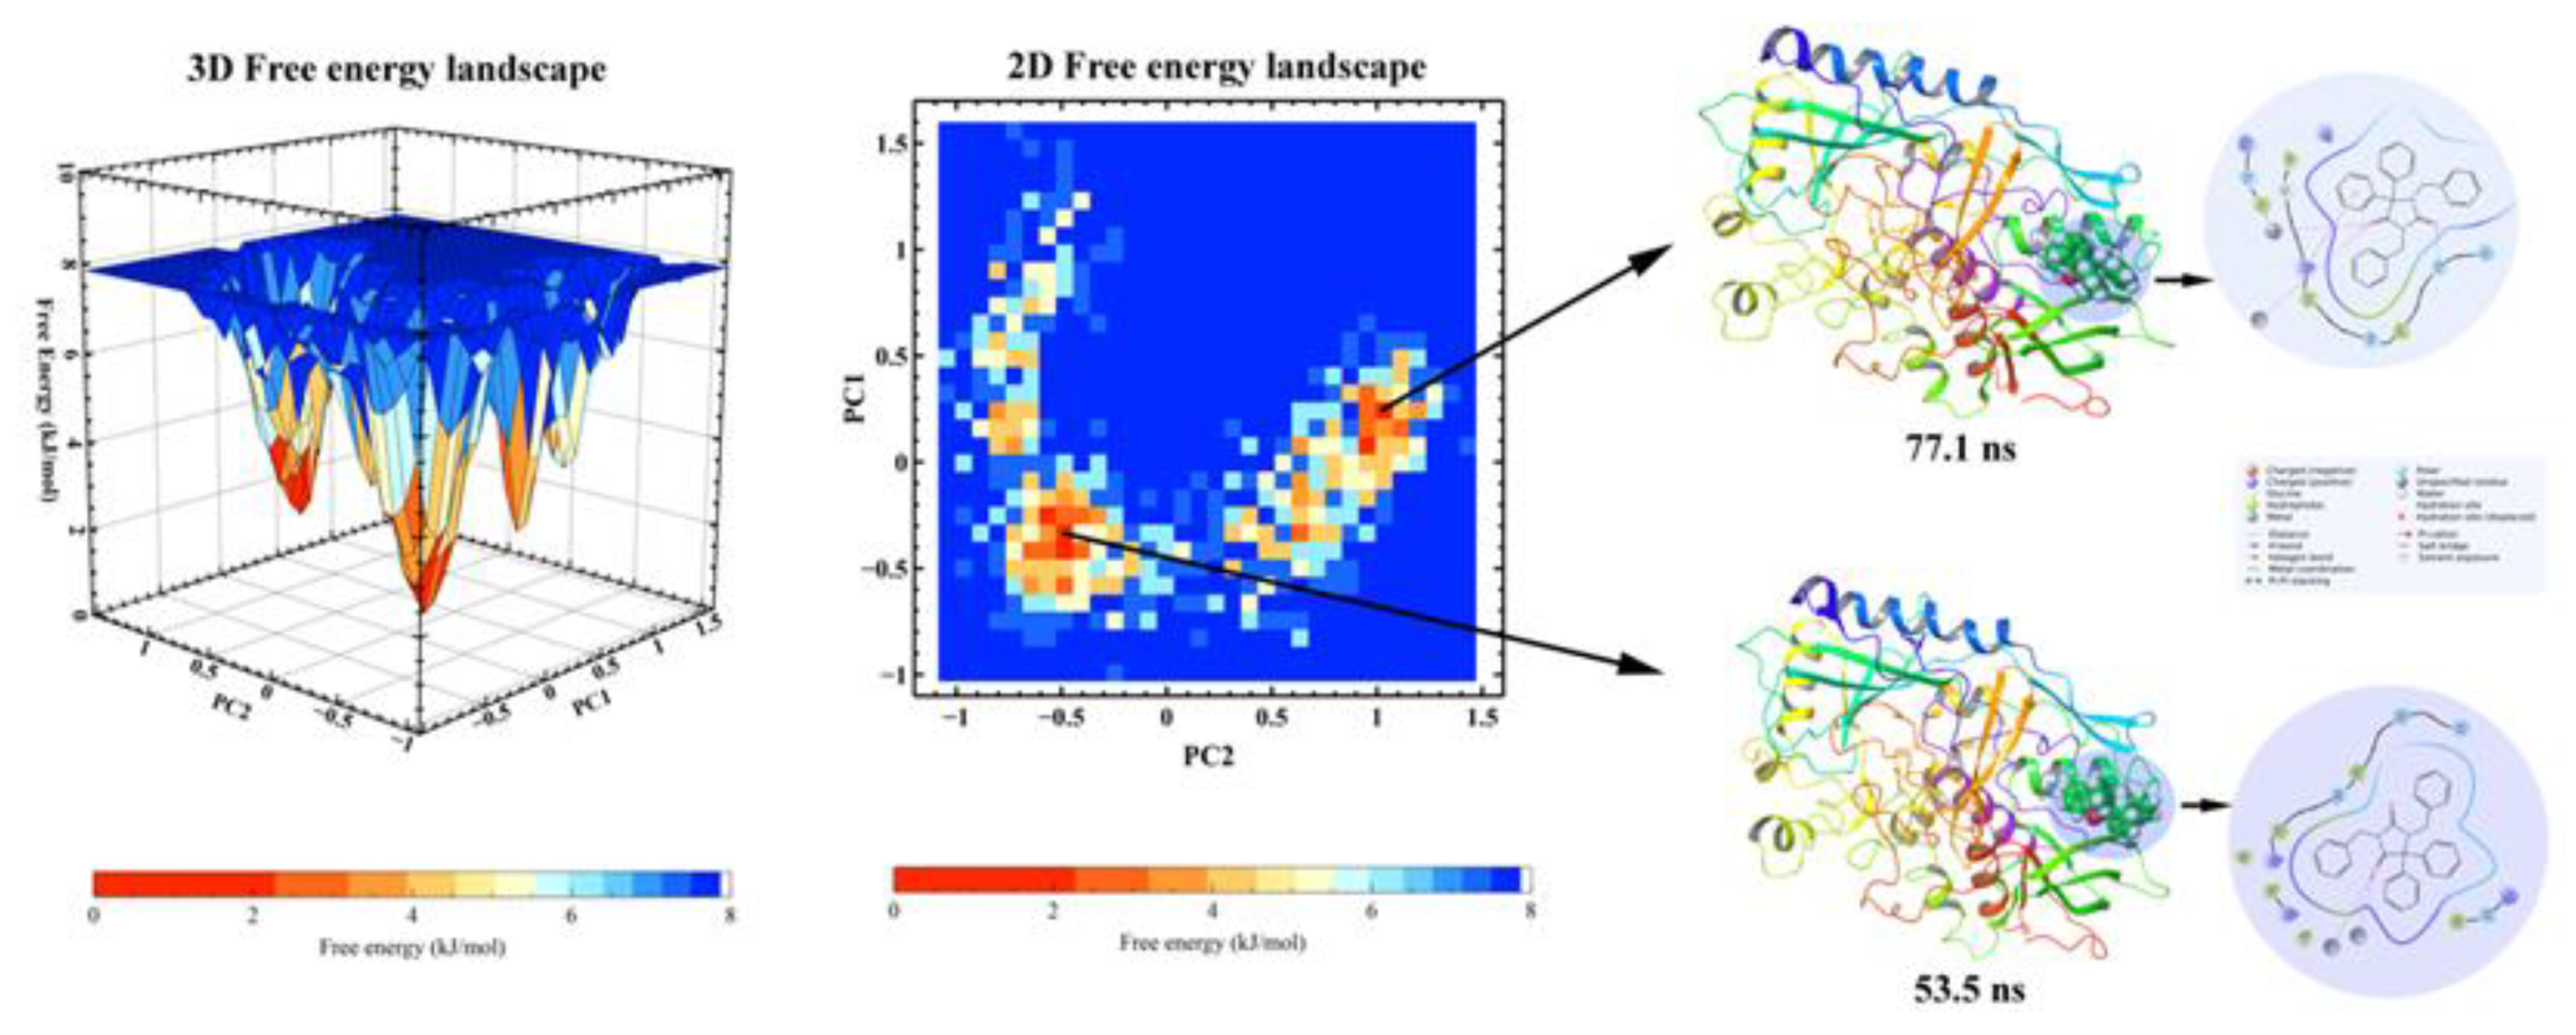
2.6.2. PCA, DCCM and FEL Analysis
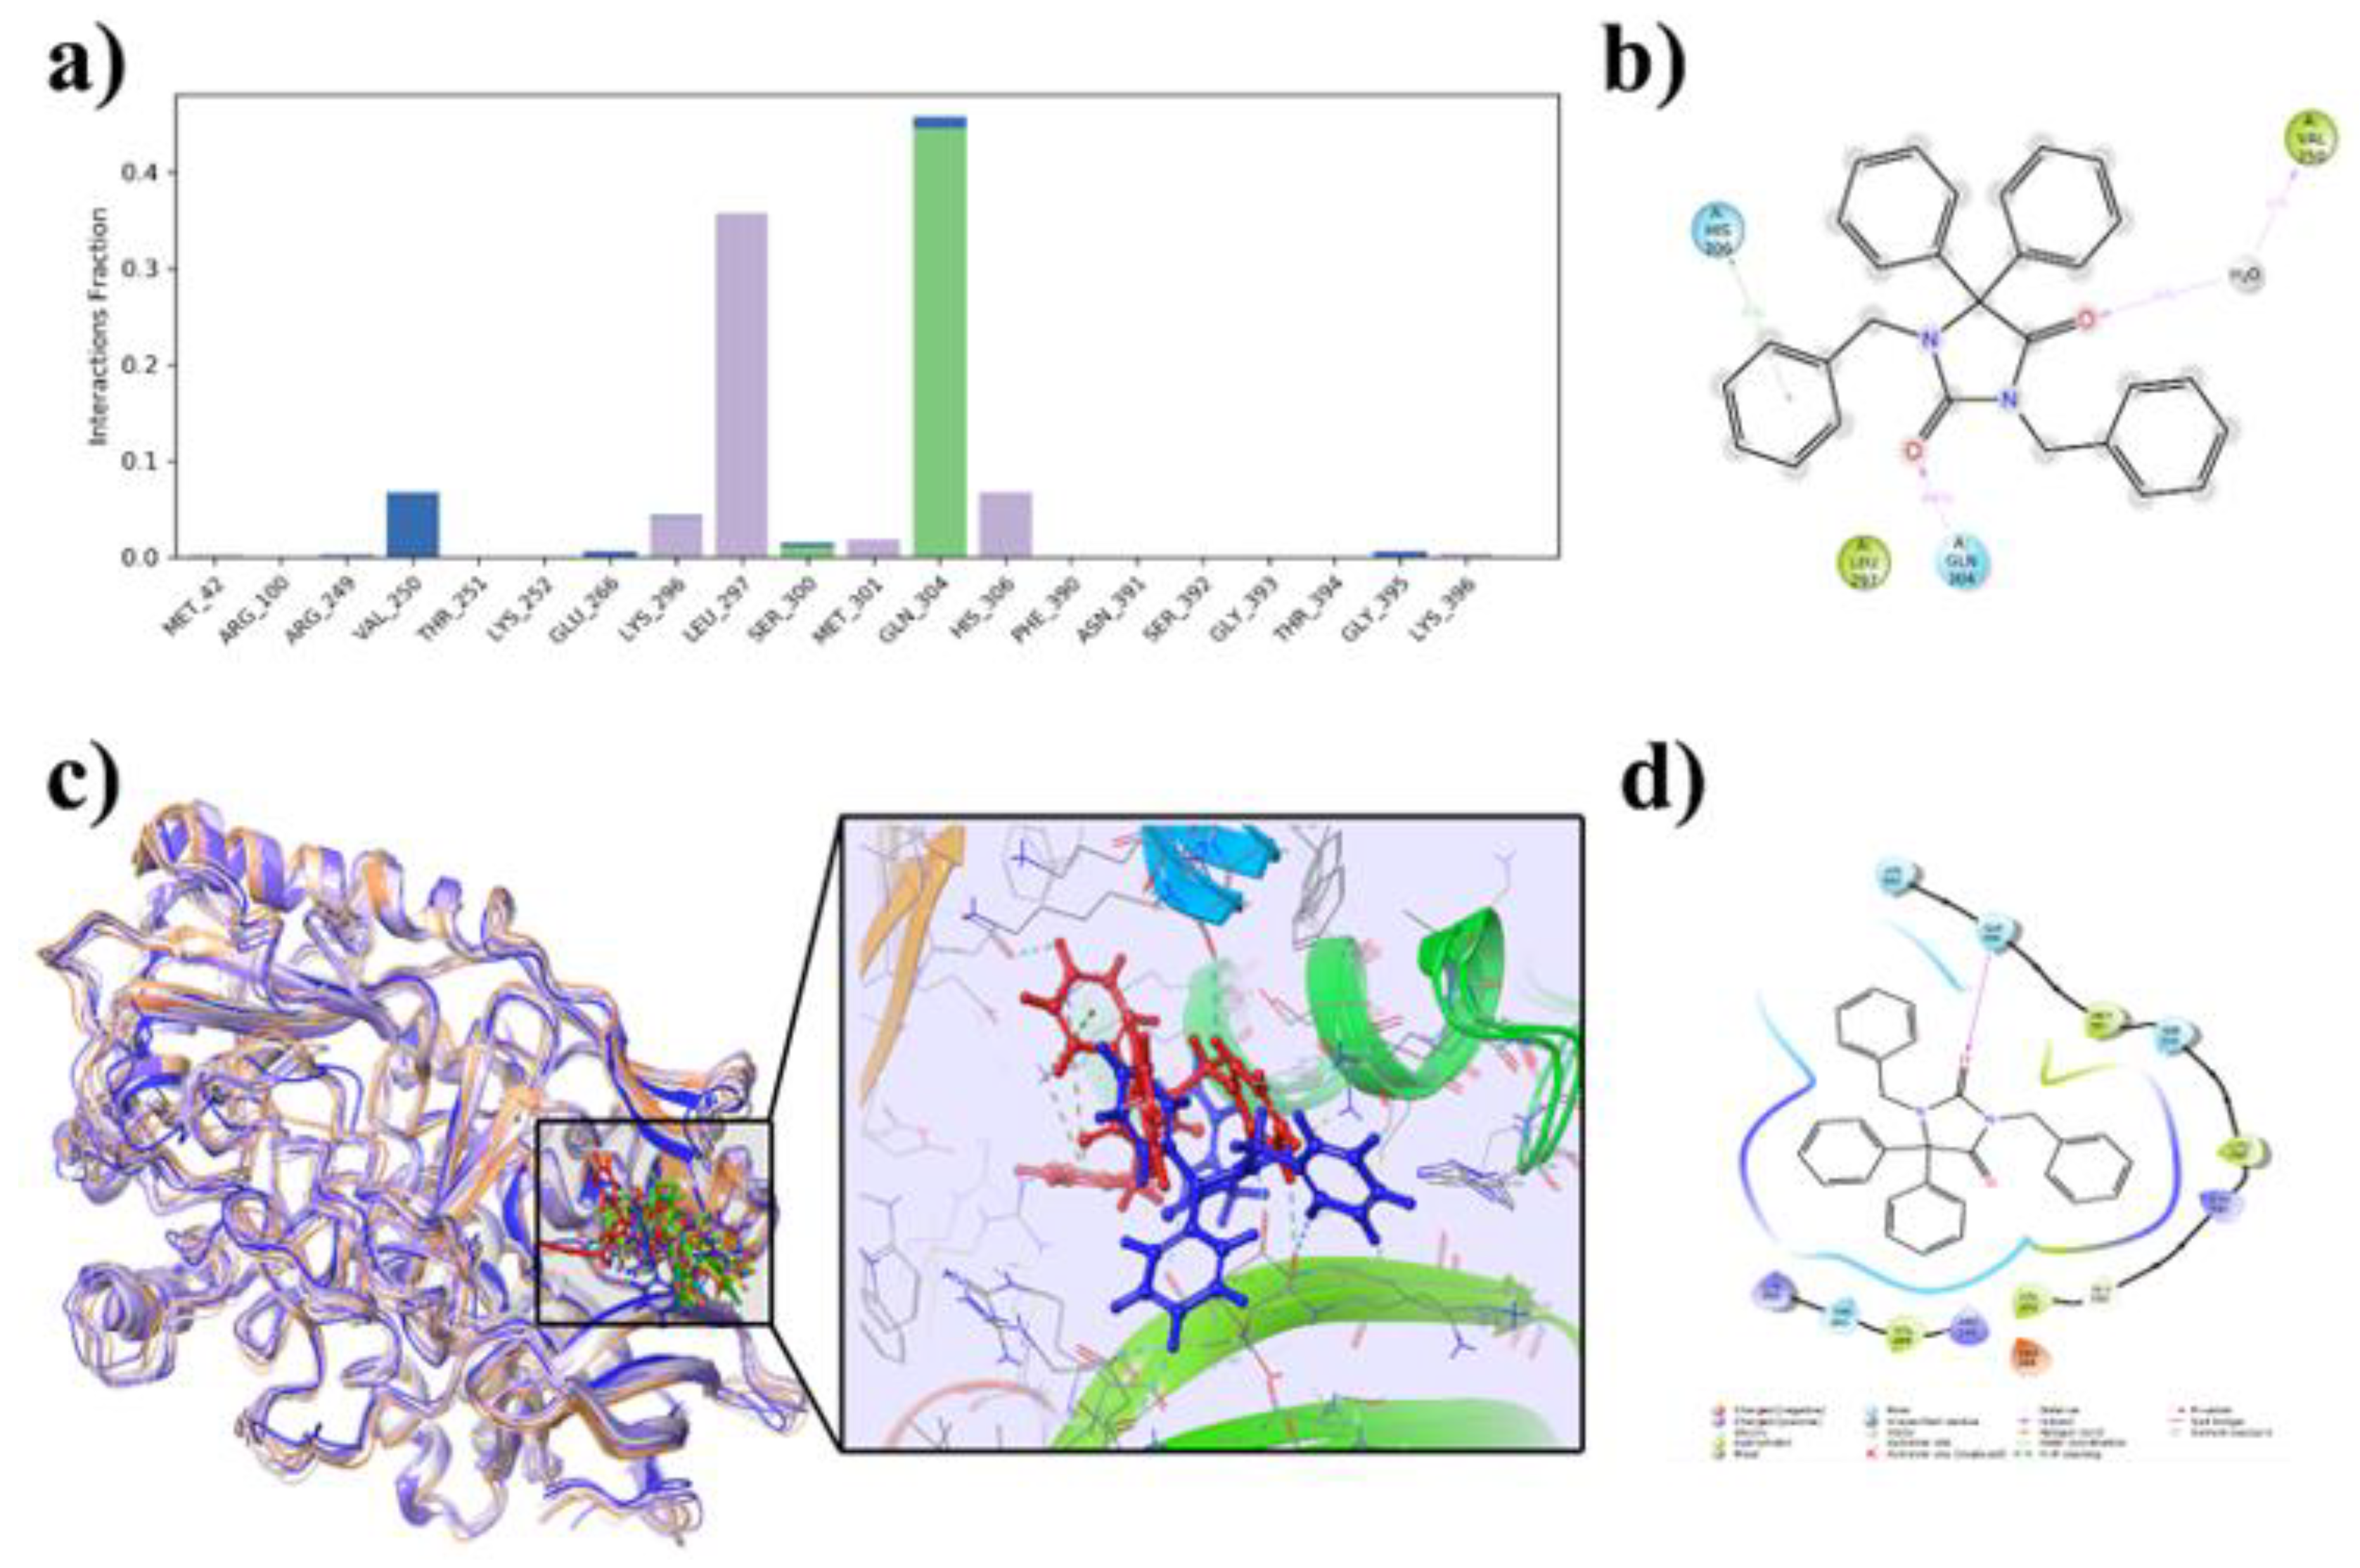
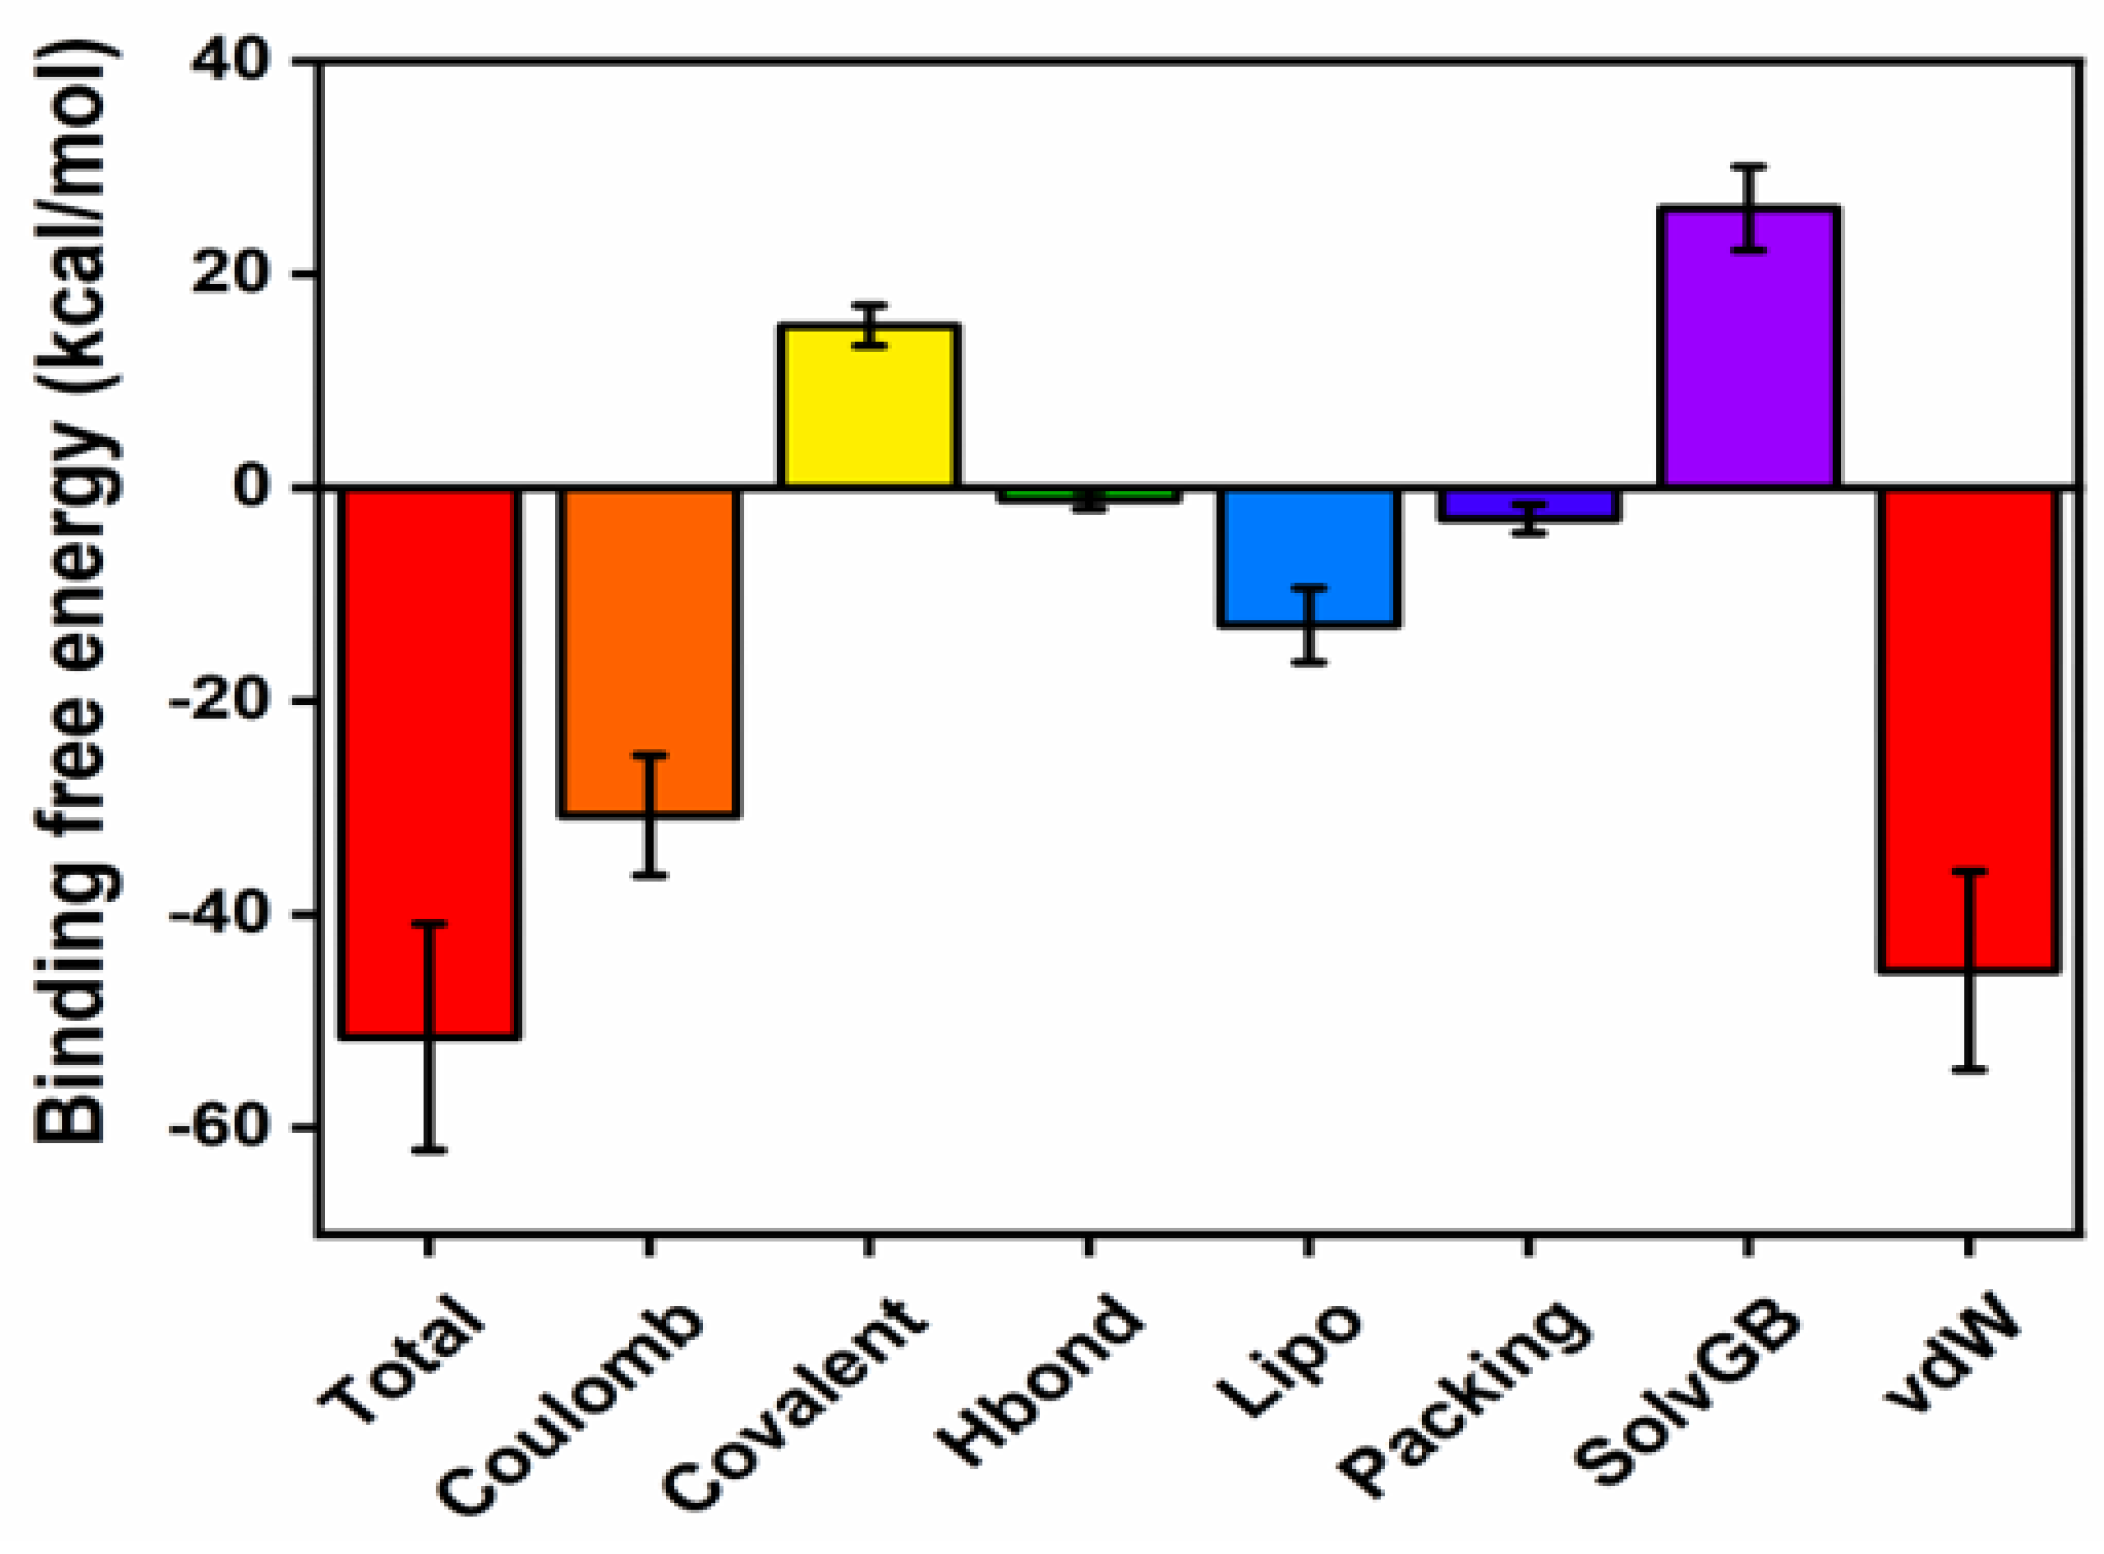
2.6.3. Protein-Ligand Contacts During the Simulation and MM-GBSA Binding Energies
3. Materials and Methods
3.1. Spectroscopic Characterization
2.2. Preparation of N-alkylated Phenytoin Derivatives (3-13)
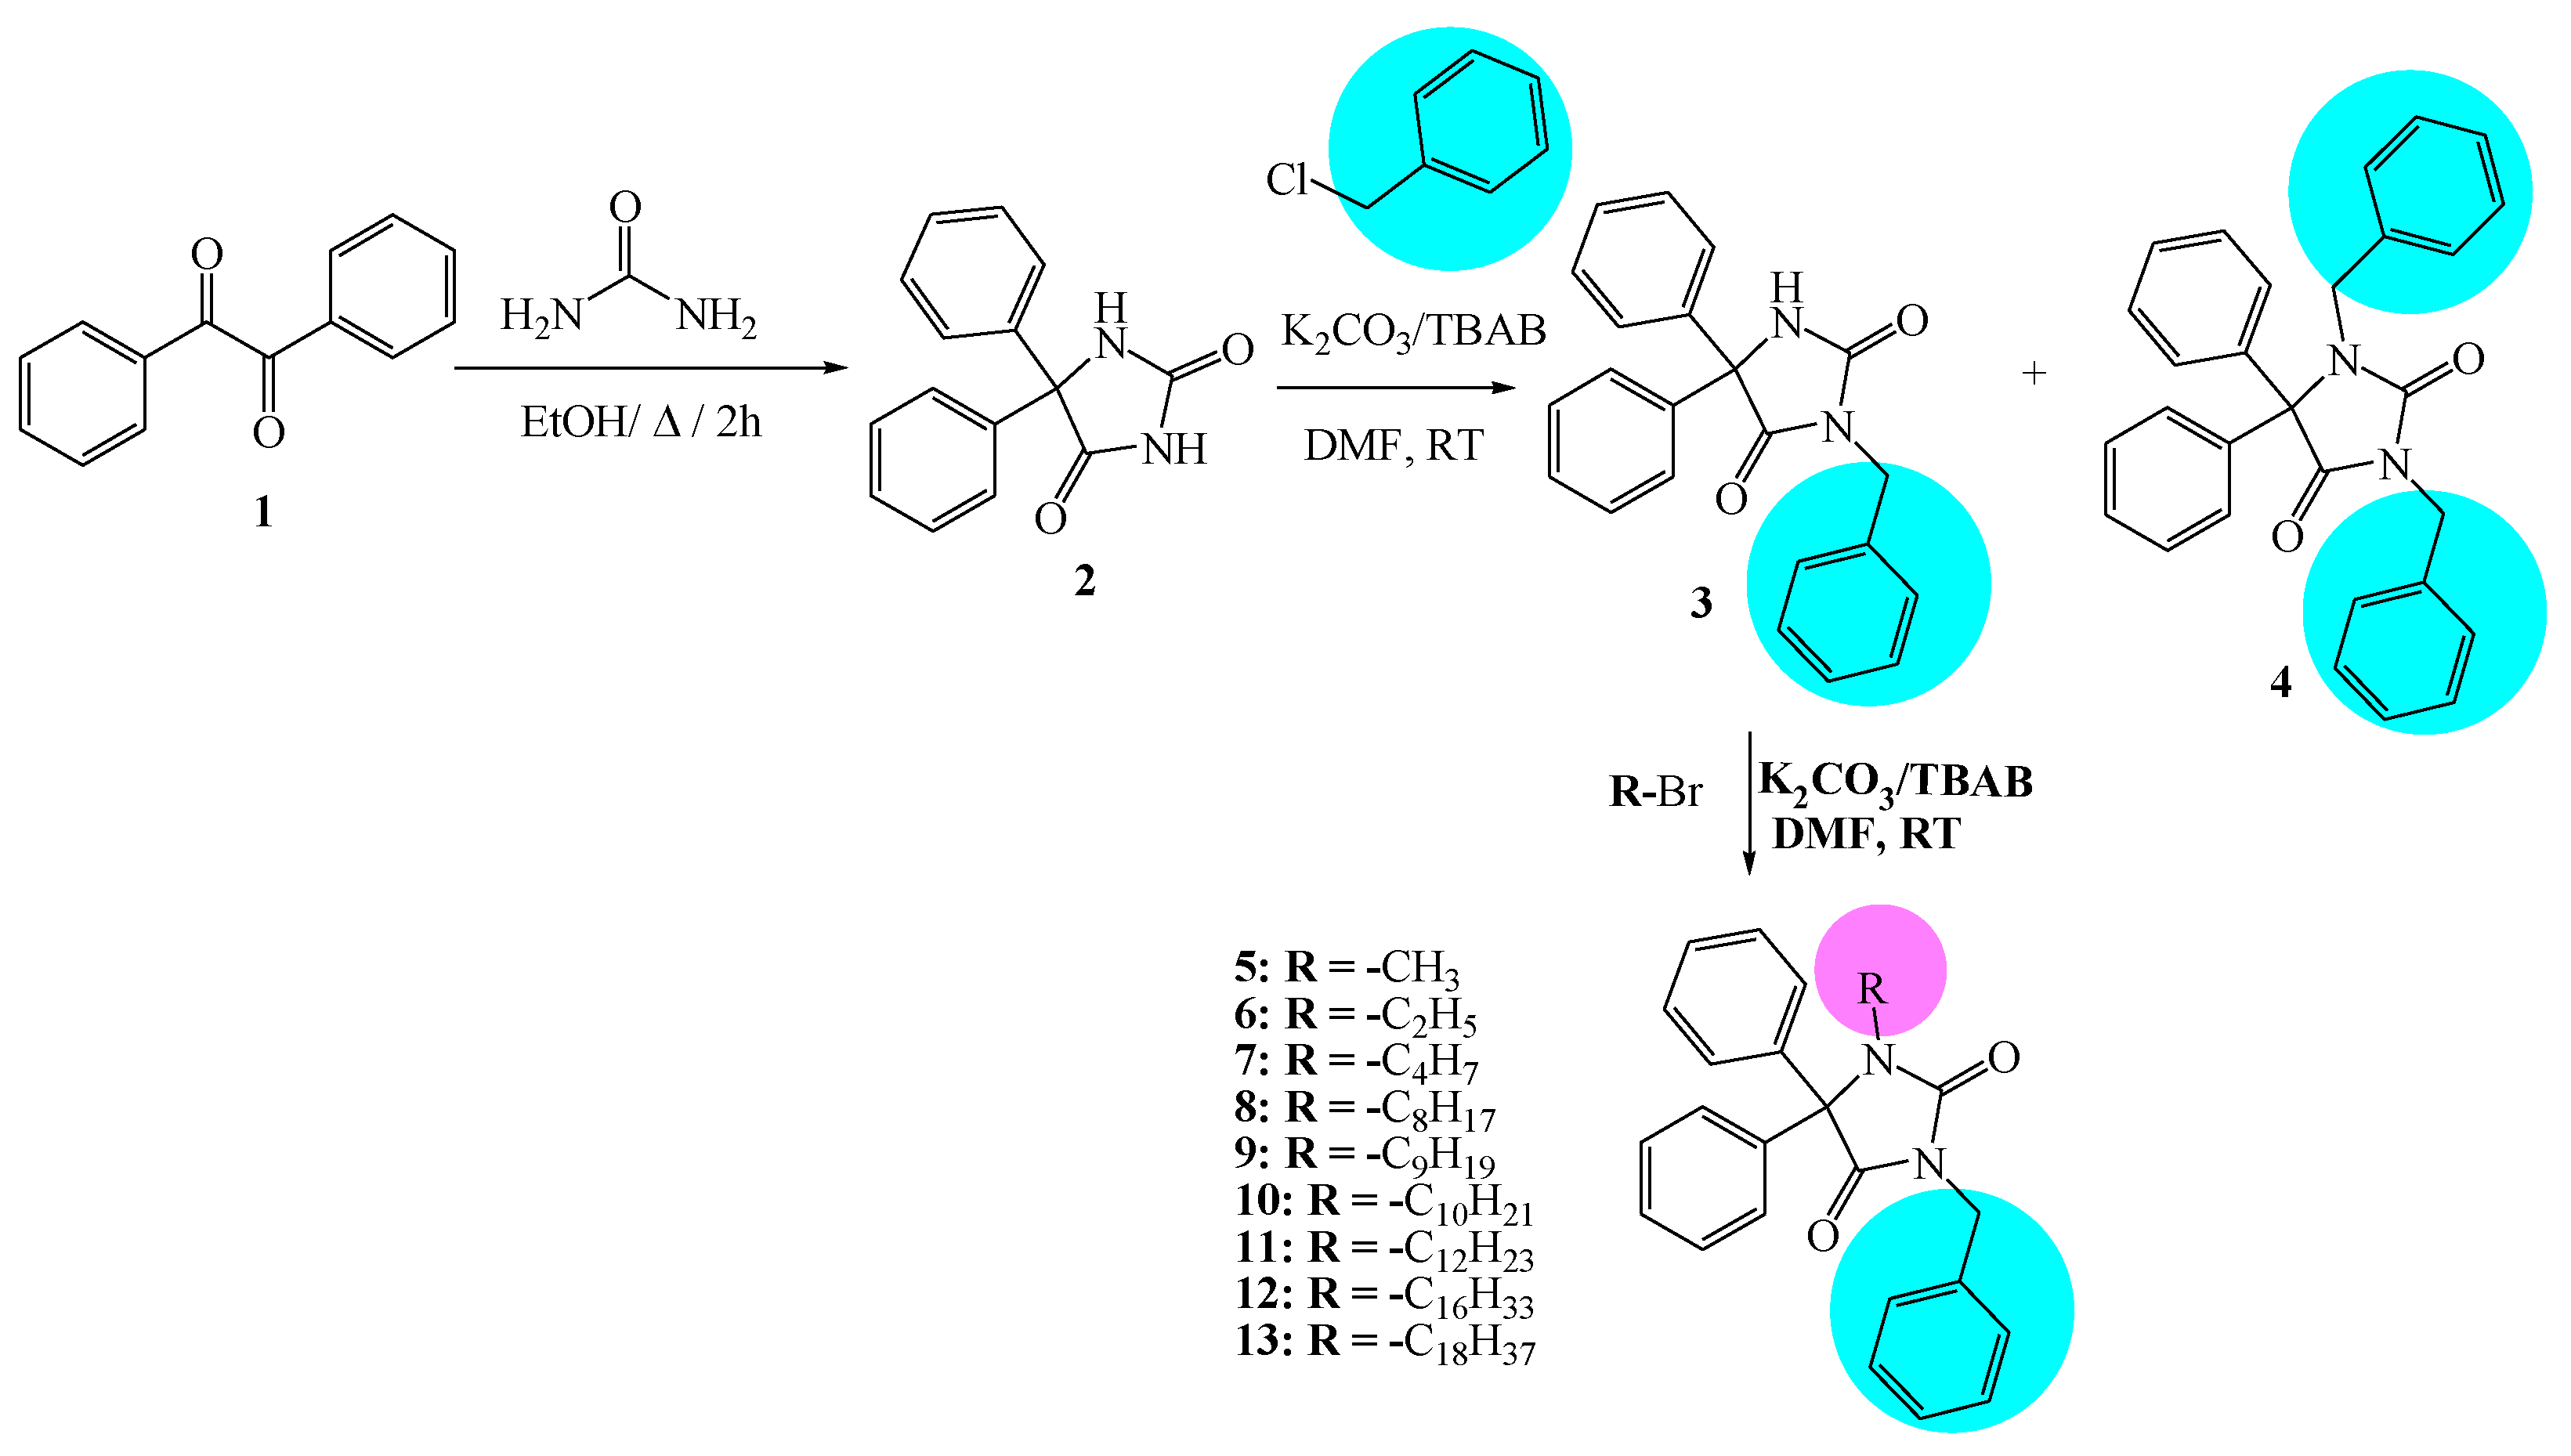
3.2.1. Synthesis Procedure of 2.
3.2.2. Alkylation of Phenytoin with Benzyl Chloride
3.2.3. Synthesis of Compounds (5-13):
3.3. X-ray and Theoretical Studies
3.4. Hirshfeld Surface Analysis
3.5. DFT Calculations
3.6. Molecular Docking Studies
3.7. Molecular Dynamics Simulation
3.8. MM-GBSA Analysis
4. Conclusions
Author Contributions
Funding
Informed Consent Statement
Data Availability Statement
Acknowledgments
Conflicts of Interest
References
- Hou, J.; Long, X.; Wang, X.; Li, L.; Mao, D.; Luo, Y.; Ren, H.; Global trend of antimicrobial resistance in common bacterial pathogens in response to antibiotic consumption. J. Hazard. Mater. 2023, 442, 130042. [CrossRef]
- Sghyar, R.; Lahyaoui, M.; El Ibrahimi, B.; Blacque, O.; Kartah, B. E.; Ez-zoubi, A.; Hökelek, T.; Mague, J. T.; El Mestafa, E.; Ben-Tama, A.; Newly synthesized based Schiff of phenylferrocene: molecular and crystal structures, Density Functional Theory calculations, Hirshfeld surface analyses, and improved molecular docking data. J. Mol. Struct. 2024, 1314, 138747. [CrossRef]
- Hafez, B.; Mokhtarі, M.; Elmsellem, H.; Steli, H.; Environmentally friendly inhibitor of the corrosion of mild steel: Commercial oil of eucalyptus. Int. J. Corros. Scale Inhib. 2019, 8, 3, 573–585. [CrossRef]
- Laaroussi, H.; Aouniti, A.; Hafez, B.; Mokhtari, O.;RA Sheikh, Hamdani, I.; Rahhou, I.; L'argan laisse l'activité antioxydante de l'extrait aqueux et la capacité d'inhibition de la corrosion de l'acier doux. Int. J. Corros. Échelle Inhib. 2022, 11, 4, 1539-1556.
- Sebbar, N. K.; Mekhzoum, M. E. M.; Essassi, E. M.; Zerzouf, A.; Talbaoui, A.; Bakri, Y.; Saadi, M.; Ammari, L. E.; Novel 1, 4-benzothiazine derivatives: synthesis, crystal structure, and anti-bacterial properties. Res. Chem. Intermed. 2016, 42, 6845-6862. [CrossRef]
- M'chaar, R.; Ouerfelli, N.; Messaâdi, A.; Zrelli, N.; Ferreira, I. L.; Hafez, B.; Elmsellem, H.; A simplified model correlating the excess proprieties for Bi-X binary systems (X=Cu, Sb) serving the concept of reduced Redlich-Kister function at different temperatures. Surf. Interfac. 2020, 21, 5, 100643. [CrossRef]
- Śladowska, K.; Handzlik, J.; Kieć-Kononowicz, K.; Mazur, L.; In vitro cytotoxic activity evaluation of phenytoin derivatives against human leukemia cells. Indian J Exp Biol. 2016, 54, 9, 553–559.
- Sangeetha, P.; Siva, T.; Balaji, R.; Tharini, K.;Synthesis of phenytoin compound using microwave technology and evaluation of its antibacterial activity. World J Sci Res. 2016, 1, 2, 26–30.
- Emami, S.; Valipour, M.; Kazemi Komishani, F.; Sadati-Ashrafi, F.; Rasoulian, M.; Ghasemian, M.; Tajbakhsh, M.; Honarchian, P.; Shakiba, A.; Irannejad, H.; Ahangar, N.; Bioorganic Chemistry as highly potent anticonvulsant agents. Bioorg Chem. 2021, 112, 104943. [CrossRef]
- Żesławska, E.; Kucwaj-Brysz, K.; Kincses, A.; Spengler, G.; Szymańska, E.; Czopek, A.; Handzlik, J.; An insight into the structure of 5-spiro aromatic derivatives of imidazolidine-2, 4-dione, a new group of very potent inhibitors of tumor multidrug resistance in T-lymphoma cells. Bioorg Chem. 2021, 109, 104735. [CrossRef]
- Da Silva Guerra, A. S. H.; Do Nascimento Malta, D. J.; Morais Laranjeira, L. P.; Souza Maia, M. B.; Cavalcanti Colaço, N.; Do Carmo Alves De Lima, M.; Galdino, S. L.; Da Rocha Pitta, I.; Gonçalves-Silva, T.;Anti-inflammatory and antinociceptive activities of indole-imidazolidine derivatives. Int. Immunopharmacol. 2011, 11, 11, 1816–1822. [CrossRef]
- Al-Nuzal, S. M.; Al-Dulaimi, M. F.; Hassan, A. T.;Synthesis and spectrometric study of some nucleophilic reactions of the antiepileptic molecule; 5, 5-diphenyl imidazolidine-2, 4-dione. J. of the University of Anbar for Pure Science. 2018, 12, 1, 38-53.
- Lamssane, H.; Haoudi, A.; Kartah, B. E.; Mazzah, A.; Mague, J. T.; Hökelek, T.; Kandri Rodi,Y.; Sebbar, N. K.; Crystal structure, Hirshfeld surface analysis, calculations of crystal voids, interaction energy and energy frameworks as well as density functional theory (DFT) calculations of 3-[2-(morpholin-4-yl) ethyl]-5, 5-diphenylimidazolidine-2, 4-dione. Acta Cryst. 2024, E80, 423–429. [CrossRef]
- Puccetti, F.; Lukin, S.; Užarević, K.; Colacino, E.; Halasz, I.; Bolm, C.; Hernández, J. G.; Mechanistic Insights on the Mechanosynthesis of Phenytoin, a WHO Essential Medicine. Chem. Eur. J. 2022, 28, 13, e202104409. [CrossRef]
- Lamssane, H.; Haoudi, A.; Kartah, B. E.; Mazzah, A.; Mague, J. T.; Hökelek, T.; Kandri Rodi,Y.; Sebbar, N. K.; Crystal structure and Hirshfeld surface analyses, crystal voids, intermolecular interaction energies and energy frameworks of 3-benzyl-1-(3-bromopropyl)-5,5-diphenylimidazolidin-2,4-dione, Acta Cryst. 2024, E80, 1118–1124. [CrossRef]
- Madushanka, A.; Moura, R. T.; Verma, N.; Kraka, E.; Quantum Mechanical Assessment of Protein–Ligand Hydrogen Bond Strength Patterns: Insights from Semiempirical Tight-Binding and Local Vibrational Mode Theory. Int. J. Mol. Sci. 2023, 24, 7, 6311. [CrossRef]
- Samad, A.; Ajmal, A.; Mahmood, A.; Khurshid, B.; Li, P.; Jan, S. M.; Rehman, A. U.; P. He, Abdalla, A. N.; Umair, M.; Hu, J.; Wadood, A.; Identification of novel inhibitors for SARS-CoV-2 as therapeutic options using machine learning-based virtual screening, molecular docking and MD simulation. Front. Mol. Biosci. 2023, 10, 1060076. [CrossRef]
- Rharmili, N.; Sert, Y.; Rodi, Y. K.; Chahdi, F. O.; Haoudi, A.; Mague, J. T.; Mazzah, A.; El Hachlafi, N.; Benkhaira, N.; Fikri-Benbrahim, K.; Essassi, E. M.; Sebbar, N. K.; Synthesis of new N-alkylated 6-bromoindoline-2.3-dione derivatives: crystal structures, spectroscopic characterizations, Hirschfeld surface analyses, molecular docking studies, DFT calculations, and antibacterial activity. Results Chem. 2024, 7, 101338. [CrossRef]
- Turner, M. J.; Grabowsky, S.; Jayatilaka, D.; Spackman, M. A.; Accurate and efficient model energies for exploring intermolecular interactions in molecular crystals. J. Phys. Chem. Lett. 2014, 5, 24, 4249−4255. [CrossRef]
- Rastelli, G.; Rio, A. D.; Degliesposti, G.; & Sgobba, M.; Fast and accurate predictions of binding free energies using MM-PBSA and MM-GBSA. J Comput Chem. 2010, 31, 4, 797-810. [CrossRef]
- Bouzina, A.; Y. Bouone, O.; Sekiou, O.; Aissaoui, M.; Ouk, T. S.; Djemel, A.; Mansouri, R.; Ibrahim-Ouali, M.; Bouslama, Z.; Aouf, N. E.; In vitro antitumor activity, molecular dynamics simulation, DFT study, ADME prediction, and Eg5 binding of eastern analogs. RSC Adv. 2023, 13, 28, 19567–19584. [CrossRef]
- Seqqat, Y., El Monfalouti, H., Laaraj, S., Mague, J. T., Chahdi, F. O., Rodi, Y. K., Sebbar, N. K. Experimental and theoretical investigations for novel 6-nitroquinoxaline-2, 3-dione derivatives: Synthesis, characterization, DFT calculations, ADME analysis, hirshfeld surface calculations, molecular docking studies, and antiproliferation evaluation. J. Mol. Struct. 2025, 1319, 139612. [CrossRef]
- Lobanov, M. Y.; Bogatyreva, N. S.; Galzitskaya, O. V.; Radius of gyration as an indicator of protein structure compactness. Mol. Biol. 2008, 42, 623-628. [CrossRef]
- Ahamad, S.; Kanipakam, H.; Birla, S.; Ali, M. S.; Gupta, D.; Screening Malaria-box compounds to identify potential inhibitors against SARS-CoV-2 Mpro, using molecular docking and dynamics simulation studies. Eur. J. Pharmacol. 2021, 890, 173664. [CrossRef]
- Street, A. G.; Mayo, S. L.; Pairwise calculation of protein solvent-accessible surface areas. Folding and Design. 1998, 3, 4, 253-258. [CrossRef]
- Wang, J.; Wang, W.; Huo, S.; Lee, M.; Kollman, P. A.; Solvation model based on weighted solvent accessible surface area. J. Phys. Chem. B. 2001, 105, 21, 5055–5067. [CrossRef]
- Chikalov, I.; Yao, P.; Moshkov, M.; Latombe, J. C.; Learning probabilistic models of hydrogen bond stability from molecular dynamics simulation trajectories. BMC Bioinformatics, 2011, 12, 1, 1-6. [CrossRef]
- Sittel, F.; Jain, A.; Stock, G.; Principal component analysis of molecular dynamics: On the use of Cartesian vs. internal coordinates. J. Chem. Phys. 2014, 141, 014111. [CrossRef]
- Papaleo, E.; Mereghetti, P.; Fantucci, P.; Grandori, R.; De Gioia, L.; Free-energy landscape, principal component analysis, and structural clustering to identify representative conformations from molecular dynamics simulations: The myoglobin case. J. Mol. Graph. Modelling. 2009, 27, 8, 889-899. [CrossRef]
- Kumar, N.; Awasthi, A.; Kumari, A.; Sood, D.; Jain, P.; Singh, T.; Sharma, N.; Grover, A.; Chandra, R.; Antitussive noscapine and antiviral drug conjugates as arsenal against COVID-19: a comprehensive chemoinformatics analysis. J. Biomolecular Structure and Dynamics. 2020, 40, 1, 101-116. [CrossRef]
- BIOVIA Discovery Studio Visualizer - Dassault Systèmes. 2021. https://discover.3ds.com/discovery-studio-visualizer-download.
- Kasahara, K.; Fukuda, I.; Nakamura, H.; A novel approach of dynamic cross-correlation analysis on molecular dynamics simulations and its application to Ets1 dimer–DNA complex. PloS one. 2014, 9, 11, e112419. [CrossRef]
- Prada-Gracia, D.; Gómez-Gardeñes, J.; Echenique, P.; Falo, F.; Exploring the free energy landscape: from dynamics to networks and back. PLoS Comput Biol. 2009, 5, 6, e1000415. [CrossRef]
- Mukerjee, N.; Das, A.; Maitra, S.; Ghosh, A.; Khan, P.; Alexiou, A.; Dey, A.; Baishya, D.; Ahmad, F.; Sachdeva, P.; Al-Muhanna, M. K.; Dynamics of natural product Lupenone as a potential fusion inhibitor against the spike complex of novel Semliki Forest Virus. Plos one. 2022, 17, 2, e0263853. [CrossRef]
- Dallakyan, S.; Olson, A. J.; Small-molecule library screening by docking with PyRx. Chem Biol. 2015, 243-250. [CrossRef]
- Biltz, H.; Über die Konstitution der Einwirkungsprodukte von substituierten Harnstoffen auf Benzil und über einige neue Methoden zur Darstellung der 5.5-Diphenyl-hydantoine. Berichte Der Deutschen Chemischen Gesellschaft. 1908, 41, 1, 1379–1393. [CrossRef]
- Bruker, APEX4 and SAINT, Bruker AXS LLC, Madison, Wisconsin, USA, 2021.
- Krause, L.; Herbst-Irmer, R.; Sheldrick, G.M.; Stalke, D.; Comparison of silver and molybdenum microfocus X-ray sources for single-crystal structure determination. J. Appl. Cryst. 2015, 48, 3–10. [CrossRef]
- Sheldrick, G.M.; SHELXT–Integrated space-group and crystal-structure determination, Acta Cryst. 2015, A71, 3–8. [CrossRef]
- Sheldrick, G.M.; Crystal structure refinement with SHELXL, Acta Cryst. 2015, C71, 3–8. [CrossRef]
- Becke, A. D.; Density-Functional Thermochemistry. III. The Role of Exact Exchange, J. Chem. Phys. 1993, 98, 5648-5652. [CrossRef]
- Spackman, M. A.; Jayatilaka, D.; Hirshfeld surface analysis. CrystEngComm. 2009, 11, 1, 19–32. [CrossRef]
- Turner, M.; Kinnon, J. M.; Wolff, S.; Grimwood, D.; Spackman, P.; Jayatilaka, D.; Spackman, M.; CrystalExplorer17, University of Western Australia. 2017.
- Spackman, P. R.; Turner, M. J.; McKinnon, J. J.; Wolff, S. K.; Grimwood, D. J.; Jayatilaka, D.; Spackman, M. A.; CrystalExplorer: a program for Hirshfeld surface analysis, visualization and quantitative analysis of molecular crystals. J. Appl. Cryst. 2021, 54, 1006–1011. [CrossRef]
- Frisch, M.; Trucks, G.; Schlegel, H.; Scuseria, G.; Robb, M.; Cheeseman, J.; Scalmani, G.; Barone, V.; Petersson, G.; Nakatsuji, H.; Gaussian 16. Gaussian, Inc. Wallingford. 2016, CT.
- Li, J.; Vrielink, A.; Brick, P.; Blow, D. M.; Crystal structure of cholesterol oxidase complexed with a steroid substrate: implications for flavin adenine dinucleotide dependent alcohol oxidases. Biochem. 1993, 32, 43, 11507–11515. [CrossRef]
- Bowers, K. J.; Chow, E.; Xu, H.; Dror, R. O.; Eastwood, M. P.; Gregersen, B. A.; Klepeis, J. L.; Kolossvary, I.; Moraes, M. A.; Sacerdoti, F. D.; Salmon, J. K.; Shan, Y.; Shaw, D. E.; Scalable algorithms for molecular dynamics simulations on commodity clusters. Proceedings of the 2006 ACM/IEEE Conference on Supercomputing, SC’06. 2006, 84-es. [CrossRef]
- Jacobson, M. P.; Friesner, R. A.; Xiang, Z.; Honig, B.; On the role of the crystal environment in determining protein side-chain conformations. J. Mol. Biol. 2002, 320, 3, 597–608. [CrossRef]
- Zielkiewicz, J.; Structural properties of water: Comparison of the SPC, SPCE, TIP4P, and TIP5P models of water. J. Chem. Phys. 2005, 123, 10, 104501. [CrossRef]
- Martyna, G. J.; Klein, M. L.; Tuckerman, M.; Nosé-Hoover chains: The canonical ensemble via continuous dynamics. J. Chem. Phys. 1992, 97, 4, 2635–2643. [CrossRef]
- Tuckerman, M.; Berne, B. J.; Martyna, G. J.; Reversible multiple time scale molecular dynamics. J. Chem. Phys. 1992, 97, 1990–2001. [CrossRef]
- Grant, B. J.; Skjaerven, L.; Yao, X. Q.; The Bio3D packages for structural bioinformatics. Protein Science, 2021, 30, 1, 20-30. [CrossRef]
- Kagami, L. P.; das Neves, G. M.; Timmers, L. F. S. M.; Caceres, R. A.; Eifler-Lima, V. L.; Geo-Measures: A PyMOL plugin for protein structure ensembles analysis. Comput boil chem, 2020, 87,107322. [CrossRef]
- Genheden, S.; Ryde, U.; The MM/PBSA and MM/GBSA methods to estimate ligand-binding affinities. Expert Opin. Drug Discov. 2015, 10, 5, 449-461. [CrossRef]

| 4 | 5 | 6 | |
|---|---|---|---|
| Crystal data | |||
| Chemical formula | C29H24N2O2 | C23H20N2O2 | C24H22N2O2 |
| CCDC Deposition Number | 2268587 | 2268588 | 2268590 |
| F.Wt.(g/mol) | 432.50 | 356.41 | 370.43 |
| Crystal system | Triclinic | Monoclinic | |
| Space group | P | P21/n | P21/c |
| Temperature (K) | 150 | ||
| a, b, c (Å) |
8.6435 (3), 9.9463 (3), 14.5015 (5) |
13.5107 (7), 7.6329 (4), 17.981 (1) |
19.2649 (5), 10.9737 (3), 9.5064 (2) |
| α, β, γ (°) |
97.090 (1), 107.309 (1), 107.159 (1) |
- 94.882 (2) - |
- 92.412 (1) - |
| V (Å3) | 1106.37 (6) | 1847.58 (17) | 2007.94 (9) |
| Z | 2 | 4 | |
| µ (mm−1) | 0.65 | 0.66 | 0.62 |
| Crystal size (mm) | 0.21 × 0.17 × 0.09 | 0.25 × 0.21 × 0.05 | 0.36 × 0.17 × 0.13 |
| Data collection | |||
| Diffractometer | Bruker D8 Venture PHOTON 3 CPAD | ||
|
No. of measured, independent and observed [I> 2σ(I)] reflections |
46243, 4625, 4090 |
53297, 3604, 3307 |
34703, 3916, 3624 |
| Rint | 0.025 | 0.036 | 0.036 |
| (sin θ/λ)max (Å−1) | 0.618 | 0.618 | 0.617 |
| Refinement | |||
| R[F2> 2σ(F2)], wR(F2), S |
0.034, 0.084, 1.04 |
0.033, 0.089, 1.06 |
0.038, 0.099, 1.03 |
| No. of reflections | 4265 | 3604 | 3916 |
| No. of parameters | 298 | 245 | 254 |
| Δρmax, Δρmin (e Å−3) | 0.24, −0.17 | 0.22, −0.17 | 0.23, −0.20 |
| 4 | ||||||||
|---|---|---|---|---|---|---|---|---|
| Bond | Cal | Exp | B. Angle | Cal | Exp | D. Angle | Cal | Exp |
| O1-C2 | 1.242 | 1.2077(12) | C2-N1-C3 | 112.05 | 111.98(8) | C3-N2-C1-C10 | -123.94 | -124.42(8) |
| O2-C3 | 1.244 | 1.2174(12) | C2-N1-C16 | 124.84 | 124.42(8) | C23-N2-C1-C10 | 57.72 | 57.25(11) |
| N1-C2 | 1.373 | 1.3686(13) | C3-N1-C16 | 123.05 | 123.58(8) | C3-N2-C1-C4 | 108.15 | 108.17(9) |
| N1-C3 | 1.412 | 1.4066(12) | C3-N2-C1 | 111.98 | 112.64(8) | C3-N2-C1-C2 | 4.92 | 5.01(9) |
| N1-C16 | 1.475 | 1.4667(12) | N2-C1-C10 | 110.26 | 110.54(7) | C3-N1-C2-O1 | 179.91 | 179.46(9) |
| N2-C3 | 1.371 | 1.3543(12) | N2-C1-C4 | 111.98 | 112.90(7) | C16-N1-C2-O1 | 0.83 | 0.55(15) |
| N2-C23 | 1.474 | 1.4669(12) | O1-C2-N1 | 126.97 | 126.49(9) | N2-C1-C2-O1 | -177.97 | -178.54(9) |
| N2-C1 | 1.498 | 1.4687(12) | O2-C3-N2 | 127.57 | 127.58(9) | - | - | - |
| 5 | ||||||||
| O1-C2 | 1.351 | 1.2131(13) | C2-N1-C3 | 111.14 | 112.24(8) | C3-N2-C1-C4 | -113.92 | -114.50(9) |
| O2-C3 | 1.290 | 1.2121(12) | C2-N1-C16 | 124.91 | 125.19(9) | C3-N2-C1-C10 | 115.84 | 116.26(9) |
| N1-C2 | 1.451 | 1.3582(13) | C3-N1-C16 | 122.36 | 122.21(8) | C3-N2-C1-C2 | -1.27 | -1.72(10) |
| N1-C3 | 1.501 | 1.4063(14) | C3-N2-C1 | 112.97 | 112.48(8) | C3-N1-C2-O1 | -178.41 | -178.51(10) |
| N1-C16 | 1.397 | 1.4596(12) | N2-C1-C10 | 110.01 | 110.15(8) | C3-N1-C2-C1 | 3.10 | 3.07(10) |
| N2-C3 | 1. 434 | 1.3542(13) | N2-C1-C4 | 111.95 | 112.61(8) | C16-N1-C2-C1 | 176.75 | 176.33(8) |
| N2-C23 | 1. 503 | 1.4508(13) | O1-C2-N1 | 126.28 | 126.75(10) | N2-C1-C2-O1 | -179.36 | -179.27(10) |
| N2-C1 | 1.506 | 1.4672(13) | O2-C3-N2 | 128.87 | 128.45(10) | - | - | - |
| 6 | ||||||||
| O1-C2 | 1.322 | 1.2146(13) | C2-N1-C3 | 111.74 | 111.99(9) | C3-N2-C1-C10 | -118.52 | -118.03(10) |
| O2-C3 | 1.295 | 1.2109(14) | C2-N1-C16 | 124.23 | 124.83(10) | C23-N2-C1-C10 | 52.43 | 52.72(13) |
| N1-C2 | 1.412 | 1.3561(14) | C3-N1-C16 | 123.18 | 123.08(10) | C3-N2-C1-C4 | 114.81 | 114.69(10) |
| N1-C3 | 1.527 | 1.4126(15) | C3-N2-C1 | 112.45 | 112.78(9) | C3-N2-C1-C2 | 0.05 | 0.04(11) |
| N1-C16 | 1.484 | 1.4711(14) | N2-C1-C10 | 109.72 | 109.61(8) | C3-N1-C2-O1 | 178.45 | 178.96(10) |
| N2-C3 | 1.363 | 1.3500(14) | N2-C1-C4 | 113.36 | 113.09(8) | C16-N1-C2-O1 | 2.65 | 2.55(17) |
| N2-C23 | 1.492 | 1.4648(14) | O1-C2-N1 | 126.17 | 126.59(10) | N2-C1-C2-O1 | 179.95 | 179.88(10) |
| N2-C1 | 1.569 | 1.4669(13) | O2-C3-N2 | 127.85 | 127.90(11) | - | - | - |
| 4 | 5 | 6 | |
|---|---|---|---|
| Ionization potential (IP = -EHOMO) | 6.95 | 7.04 | 6.98 |
| Electron affinity (EA = -ELUMO) | 1.23 | 1.20 | 1.19 |
| Gap Energy (Egap = ELUMO-EHOMO) | 4.09 | 4.12 | 4.09 |
| Electronegativity (χ = (I+A)/2) | 5.71 | 5.83 | 5.79 |
| Chemical hardness (h = (I-A)/2) | 0.09 | 0.09 | 0.09 |
| Chemical softness (S = 1/2h) | 1.46 | 1.46 | 1.44 |
|
Electrophilicity index (w = μ2/2h, μ=-(I+A)/2) |
5.71 | 5.83 | 5.79 |
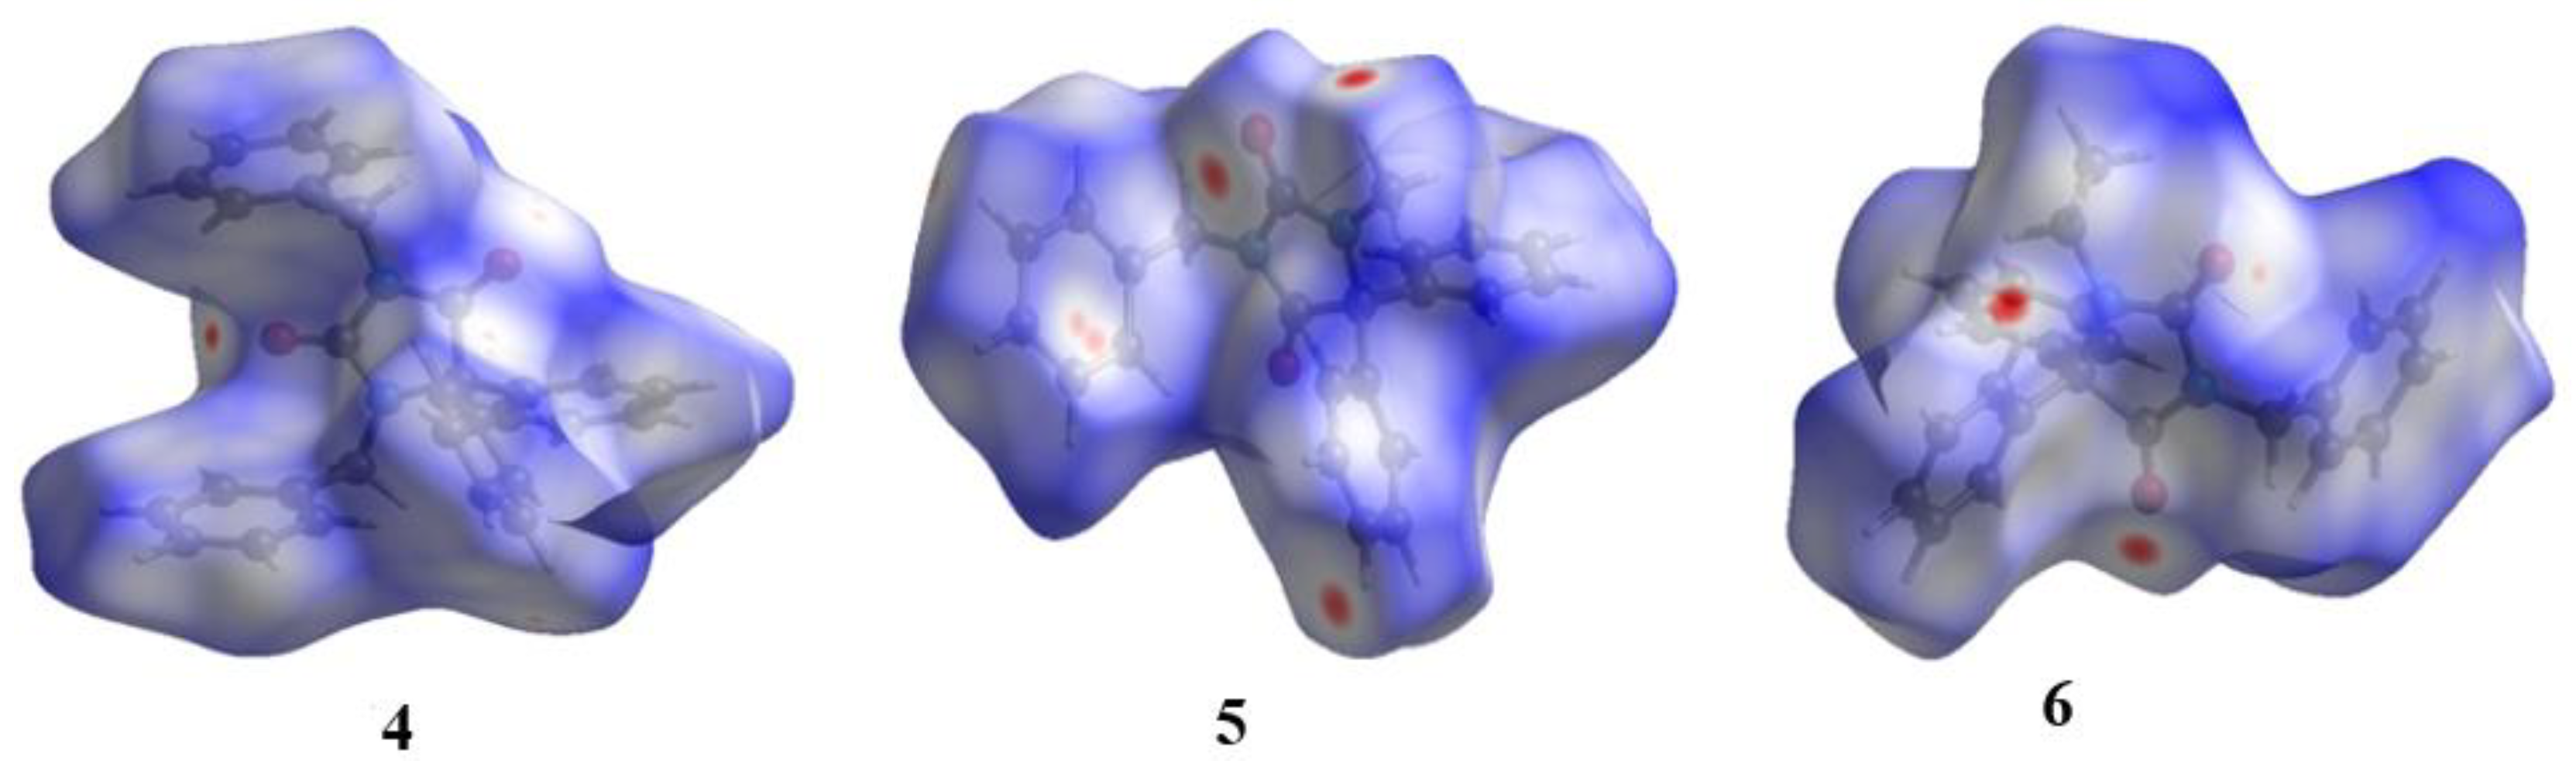
| Dipole moment (Debye) | 3.48 | 3.50 | 3.67 |
Disclaimer/Publisher’s Note: The statements, opinions and data contained in all publications are solely those of the individual author(s) and contributor(s) and not of MDPI and/or the editor(s). MDPI and/or the editor(s) disclaim responsibility for any injury to people or property resulting from any ideas, methods, instructions or products referred to in the content. |
© 2025 by the authors. Licensee MDPI, Basel, Switzerland. This article is an open access article distributed under the terms and conditions of the Creative Commons Attribution (CC BY) license (http://creativecommons.org/licenses/by/4.0/).


