Submitted:
22 May 2024
Posted:
23 May 2024
You are already at the latest version
Abstract
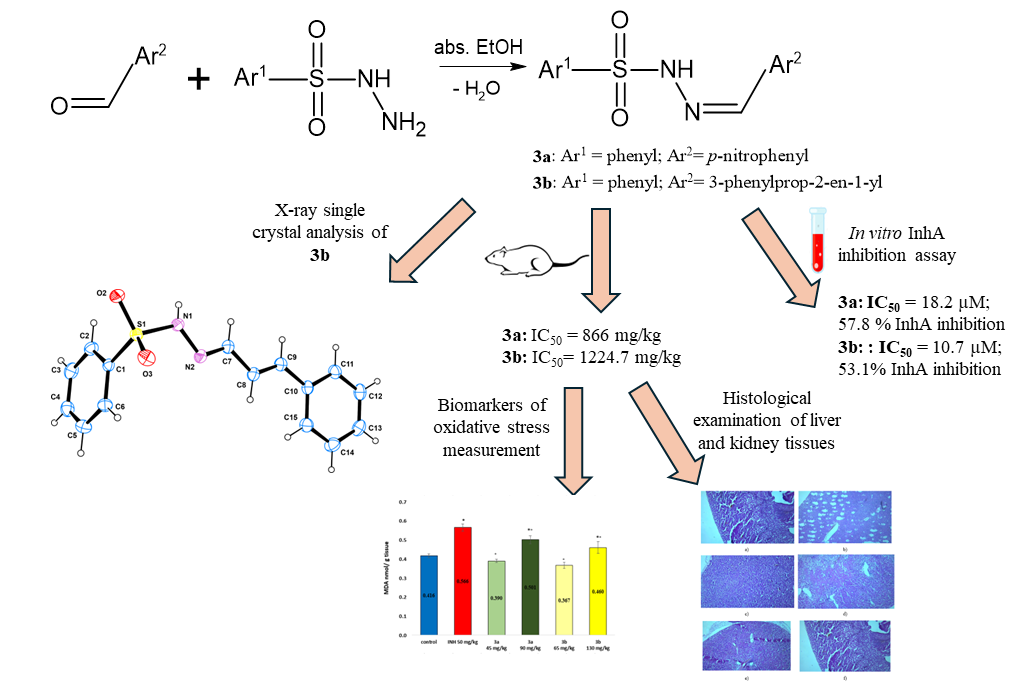
Taking into consideration the arising resistance towards the currently available antimycobacterial, there is still an unmet need for the development of new chemotherapeutic agents to combat the infectious agent. This study presents the X-ray single-crystal analysis to verify the structure of leading sulfonyl hydrazone 3b, which have proven their potent antimycobacterial activity against Mycobacterium tuberculosis H37Rv with MIC value of 0.0716 μM, respectively, low cytotoxicity and very high selectivity indexes (SI=2216) and fully characterized by NMR and HRMS methods. Furthermore, this study assessed the ex vivo antioxidant activity, acute and subacute toxicity, and in vitro inhibition capacity against enoyl-ACP reductase of hydrazones 3a and 3b, as 3a was identified as the second leading compound in our previous research. Compared to isoniazid, compounds 3a and 3b demonstrated lower acute toxicity for intraperitoneal administration, with LD50 values of 866 and 1224.7 mg/kg, respectively. Subacute toxicity tests, involving the repeated administration of a single dose of the test samples per day, revealed no significant deviations in hematological and biochemical parameters or pathomorphological tissues. The compounds exhibited potent antioxidant capabilities, reducing malondialdehyde (MDA) levels and increasing reduced glutathione (GSH). Enzyme inhibition assays of the sulfonyl hydrazones 3a and 3b with IC50 values of 18.2 µM and 10.7 µM, respectively and molecular docking studies revealed enoyl acyl carrier protein reductase (InhA) as the possible target enzyme of the compounds to show their antitubercular activities. In conclusion, the investigated sulfonyl hydrazones display promising antitubercular drug-like properties and warrant further investigation.
Keywords:
tuberculosis
; sulfonyl hydrazones
; acute toxicity
; sub-acute toxicity
; antioxidant activity
; Mycobacterium tuberculosis
; enoyl-ACP reductase
; Single crystal x-ray diffraction
1. Introduction
Despite the advancement in the drug discovery over the last two decades, tuberculosis (TB) remains a global health challenge, with reported incidence during 2021 of 10.6 million new cases and increased incidence of multidrug-resistant/rifampicin-resistant TB (MDR/RR-TB) between 2020 and 2021 (estimated 450 000 new cases in 2021). [1] Another unfavourable finding is that the COVID-19 pandemic had detrimental impact on the dynamics of the disease. Therefore, due to the continuous and arising resistance towards the currently applied antimycobacterial agents and the high cost and prolonged duration of MDR/RR-TB treatment regimens, the discovery of novel non-toxic drug candidates with straightforward mechanism of action has emerged as highly important.
Meanwhile, sulfonyl hydrazones were reported to possess variety of pharmacological effects including antimycobacterial [2,3,4,5] and antimicrobial [3,6,7,8,9] in numerous literature sources.
Based on the literature findings, our scientific group focuses their work on sulfonyl hydrazone moiety as potent antimicobacterial scaffold. In a previous publication of our scientific unit during 2022, we described the design and characterization of a series of novel sulfonyl hydrazones. [10] Their antimycobacterial activity was assessed against Mycobacterium tuberculosis strain H37Rv, cytotoxicity was evaluated against two cell lines (HEK-293T and CCL-1), underwent ADME/Tox computational predictions and were successfully docked with two crystallographic structures of enoyl-ACP reductase (InhA), providing encouraging insight into their potential mechanism of action. Among the series, sulfonyl hydrazones 3a and 3b testified significant antitubercular activity, expressed in the lowest values of MIC - 0.0763 and 0.0716 µM and highest selectivity indexes – 1819 and 2216, respectively. [10] Their chemical scaffolds are presented on Figure 1.
In another study of our research group, we reported the in vivo toxicity, redox-modulating capacity and intestinal permeability of antimycobacterial aroyl hydrazone derivatives, containing thiadiazole and indole fragment. [11] Also, in connection to the future prospects of our work, we performed a detailed review on the recent advances of antimycobacterial hydrazide-hydrazones, which inhibit the InhA enzyme [12].
Consequently, in continuation to our previously initiated work with sulfonyl hydrazones [10], the aim of the present study is to evaluate the toxicological effect of the two lead compounds (3a and 3b on Figure 1), when administered to experimental animals, to assess their potential antioxidant acitivity and to further examine their potential mechanism of action by inhibiting the enzyme enoyl-ACP reductase (InhA), which was suggested by the results of the molecular docking wth scrystallographic structures of the enzyme.
2. Material and Methods
2.1. Chemistry
The chemicals and reagents, engaged in the preparation of the compounds, were purchased from Sigma-Aldrich (Merck KGaA, Darmstadt, Germany).
N’-[(4-nitrophenyl)methylidene]benzenesulfonohydrazide (3a) was prepared by condensation reaction of p-nitrobenzaldehyde and benzenesulfonohydrazide, while N’-[3-phenylprop-2-en-1-ylidene]benzenesulfonohydrazide (3b) was prepared by condensation reaction of cinnamaldehyde and benzenesulfonohydrazide at molar ratio 1:1 (4.0 mmol) in absolute ethanol for 1–3 h, as described before [10]. The two synthesized derivatives were confirmed by 1H NMR, 13C NMR, and HRMS spectral data [10]. The spectral characteristics are presented in Table S1 (Supplementary information).
2.2. Biology
2.2.1. Experimental Animals
The Animal Care Ethic Committee approved the study protocol, and Ethical clearance for the study was issued by the Bulgarian Agency for Food Safety (No 125 from 7 October 2020). The mice were housed, maintained, and euthanized following the relevant international rules and recommendations as stated in the European Convention for the Protection of Vertebrate Animals used for Experimental and Other Scientific Purposes (ETS 123) [13]
The experiments were conducted using male and female pathogen-free Jcl: ICR mice (6 weeks old, 25–30 g), obtained from the National Breeding Center, Sofia, Bulgaria. A minimum of 7 days of acclimatization was allowed before the start of the study. Age-appropriate standard complete commercial pelleted mouse feed and fresh drinking water were available ad libitum during the experimental period of 14 days. The animals were housed in Plexiglas cages (4 per cage) in a 12/12 light/dark cycle under standard laboratory conditions (ambient temperature 20 ± 2 °C and humidity 72 ± 4%). 54 females were used in the acute toxicity test, while 32 males were used for the sub-acute toxicity test. Before the start of the experiment, mice were acclimatized to vivarium conditions for seven days, and their health was monitored daily.
2.2.2. Acute Toxicty in Mice
Acute toxicity was assessed in 54 female mice after peroral (p.o.) and intraperitoneal (i.p.) administration of the compounds using a simplified method of Lorke with slight modifications [14]. We used three animals per dose at 5 fixed-dose intervals. For both compounds, during the p.o. route of administration, the lowest dose was 500 mg/kg and the highest dose was 5000 mg/kg. During the i.p. route, the lowest dose for both compounds was 250 mg/kg and the highest was 1500 mg/kg b.w. Both compounds were solubilized with Tween 80 (0.1%) before application due to low water solubility. We calculated the LD50 by the means of the following equation: LD50=, where D0 is the highest non-lethal dose and D100 is the lowest lethal dose [15]. Surviving animals were observed every 3 h for the first 24 h and once a day for up to 14 days. On day 14, animals were anesthetized with ketamine/xylazine, decapitated and internal organs were inspected for possible macroscopic abnormalities (organ color, consistency, neoplasms, etc.).
2.2.3. Sub-Acute Toxicity in Mice
To make assessment of the sub-acute toxicity of the two investigated compounds, they were administered intraperitoneally for 14 days to male mice. The two studied derivatives have been administered to animals in two concentrations, calculated as 1/20 and 1/10 from the LD50 value, received after i.p. administration during the acute toxicity study. For 3a, the two doses were 45 mg/kg and 90 mg/kg body weight, while for 3b the doses were 65 mg/kg and 130 mg/kg b.w. The experiments were performed with male Jcl: ICR mice at the same age of 6 weeks and weighing approximately 40–45 g, in which the substances were administered daily for 14 days intraperiotneally at approximately the same time of the day. The compounds were solubilized with Tween 80 (0.1%) in distilled water and administered intraperitoneally in a volume of 0.1 mL per 10.0 g. Animals were observed daily for behavioral changes and signs of toxicity. All results were compared with the positive control isoniazid (INH).
2.2.4. Experimental Design
For the sub-acute toxicity tests, the animals were divided into 6 experimental group, each consistening of 6 mice (n = 6). Group 1—control mice; Group 2—mice treated intraperitoneally with isoniazid (INH) 50 mg/kg [16]; Group 3—mice treated intraperitoneally with 3a at a dose of 45 mg/kg (1/20 LD50); Group 4—mice treated intraperitoneally with 3a at a dose of 90 mg/kg (1/10 LD50); Group 5—mice treated intraperiotneally with 3b at a dose of 65mg/kg (1/20 LD50); Group 6—mice treated intraperitoneally with 3b at a dose of 130 mg/kg (1/10 LD50).
On days 1, 5, 7, 11, and 13 the body weights of the treated animals were measured with a laboratory balance. After that, on the 14th day, the animals were anesthetized with ketamine/xylazine and decapitated. Blood for serum biochemical investigations was collected in tubes containing a clot activator. The serum was separated after centrifugation at 3000 x g for 10 min. For complete blood count blood was also taken in vacutainers after decapitation and assessed using an automated biochemical analyzer (BS-120, Mindray, China) following the instructions of the manufacturer. The hematological parameters that have been measured, are the following: white blood cells (WBC), lymphocytes (LYM), MID, granulocytes (GRA), red blood cells (RBC), hemoglobin (HgB), hematocrit (HCT), mean corpuscular volume (MCV), mean corpuscular hemoglobin (MCH), mean corpuscular hemoglobin concentration (MCHC), platelets (PLT), mean platelet volume (MPV), platelet distribution width (PDW) using a semi-automated hematological analyzer BC-2800 Vet, (Mindray, Shenzhen, China) according to the manufacturer’s instructions. Livers were taken to assess oxidative stress and antioxidant status in the study groups. Livers and kidneys were also taken for histological analysis.
2.2.5. Histological Evaluation of Tissue Specimens
Post-mortem were collected tissues from the liver and kidneys of the mice from all groups and fixed in 10% buffered formalin for 48 h. Fixed tissues were processed according to the classical paraffin method [17]. The cutting of the paraffin blocks was performed using a paraffin rotary microtome Leica RM 2255 at a slice thickness of 5 m. The sections were stained with hematoxylin and eosin (H&E). Histological changes were examined and imaged with a Leica DM2500 light microscope equipped with a Leica MC120HD digital camera and also with Euromex BioBlue (Belgium) digital camera.
2.3. Assessment of the Oxidative Stress Biomarkers
Oxidative damage was determined by measuring the quantity of thiobarbituric acid reactive substances (TBARS), expressed as malondialdehyde (MDA) equivalents as described by Polizio and Peña [18]. Reduced glutathione (GSH) was assessed by measuring the non-protein sulfhydryls after precipitation of proteins with trichloracetic acid (TCA), using the method, described by Bump et al. [19].
Catalase activity was assessed using the method of Aebi et al. [20]. The CAT activity was determined by monitoring the decomposition of H2O2, which was measured spectrophotometrically by the decrease in absorbance at 240 nm. Enzyme activity was calculated using a molar extinction coefficient of 0.043 mM−1 cm−1 and expressed as nM/minute/mg protein.
2.4. InhA Inhibition Assay
The in vitro InhA inhibition activity of the compounds has been studied by the means of spectrophotometric method, as previously reported by Chetty et al. [21] and Doğan et al. [22,23] with slight modifications. All necessary reagents and the recombinant Mycobacterium tuberculosis enoyl-[acyl-carrier-protein] reductase have been purchased by Sigma-Aldrich (Merck KGaA, Darmstadt, Germany). The investigated compounds have been studied in five different concentrations – 1 µM, 10 µM, 25 µM, 50 µM, 100 µM. Triclosan was used as positive control at concentration. All solid compounds have been dissolved in DMSO at concentration 1 mg/ml and diluted to the necessary concentrations, such as the concentration of DMSO in the final assay has not been higher than 1%. The final volume of each sample has been 1 ml, containing 30 nm Pipes buffer, 250 µM NADH, 50 µM trans-2-dodecenoyl-coenzyme A, 220 nm InhA and the solution of the investigated compound. The absorbance was measured at 340 nm, measuring the oxidation of NADH to NAD+ for one minute. The control sample contained all described components, except of the inhibitor. All assays have been performed in triplicate. For calculation of the % enzyme inhibition, initial velocity (v) has been calculated for the first minute from the slope of the plot absorbance vs time for each concentration. The initial velocity of the control reaction without inhibitor (v0) has also been estimated. The % inhibition activity of the compounds has been calculated from formulate [1 – (v/v0)] * 100, where v/v0 is the residual activity of the enzyme. The IC50 values have been calculated by plotting the % enzyme inhibition vs the logarithm of inhibitor’s concentration.
2.5. Single-Crystal X-ray Analysis
Diffraction data were collected at 150 K by ω-scan technique, on a Bruker D8 Venture diffractometer equipped with PhotonII CMOS detector using mirror-monochromatized Mo Kα radiation from a micro-focus source (λ = 0.7107 Å). Bruker Apex 4 and Saint and Sadabs program packages were used for the determination of cell parameters, data integration, scaling and absorption correction [24,25]. The structures were solved by intrinsic methods using (SHELXT) [26] and refined by full matrix least-square procedures on F2 (SHELXL) [26]. The non-hydrogen atoms were refined anisotropically and hydrogen atoms were placed at idealized positions and refined using the riding model. The hydrogen atom near N1 was located from difference Fourier map and refined freely. A summary of the fundamental crystal and refinement data is provided in Table S2 (Supplementary Information).
Crystallographic data (excluding structure factors) for the structural analysis was deposited with the Cambridge Crystallographic Data Centre, CCDC No. 2356559 A copy of this information may be obtained free of charge from: The Director, CCDC, 12 Union Road, Cambridge, CB2 1EZ, UK. Fax: +44 1223 336 033, e-mail:deposit@ccdc.cam.ac.uk, or www.ccdc.cam.ac.uk
3. Results and Discussion
3.1. Synthesis of the Sulfonyl Hydrazone Derivatives
The preparation of sulfonyl hydrazones by a condensation reaction (Figure 2) was described previously in details [10]. The two derivatives, which are subject of the current study, demonstrated significant results – lowest MICs, low cytotoxicity and highest selectivity index, and are presented on Figure 1. The spectral characteristics are presented in Table S1 (Supplementary information).
3.2. X-ray Crystallography
We were able to grow single crystals of 3b suitable for structural analyses by slow evaporation from a mixture of hexane:diethyl ether (3:1). Compound 3b crystallizes in the monoclinic space group P21/c (No 4) with one molecule per asymmetric unit (Figure 3) and four molecules in the unit cell (Z=4). The refinement of the structure showed that the molecular features of 3b (bond distances and angle, Tables S3–S5, Supplementary Information) are similar to those of analogical compounds [27,28,29,30]. The molecule in the crystal structure adopts the (E,E) conformation. The 3-phenylprop-2-en-1-yl (Ar2 moiety) is nearly planar with rmsd of the mean plane 0.071 Å (Figure 4a). The angle between the two aromatic rings is 82.83° thus adjacent molecules are “head to tail” oriented. One typical hydrogen bond (N1–H1…O3) and two weak C–H…O interactions (Table 1) stabilize the three-dimensional arrangement of the molecules in the crystal structure of 3b (Figure 4b). As a results pseudo-layers, produced through chains with graph set notation, are visualized in in the along ab (Figure 5).
3.3. Acute Toxicity in Mice
During the oral toxicity study, the highest administered dose for both compounds was 5000 mg/kg and no mortality was associated with it, which may be result of poor resorption of the studied substances. The results from the i.p. toxicity tests of the two derivatives are presented on Table 2 and Table 3.
Based on the results from the above table, for 3a, D0 is 750 mg/kg, D100 is 1000 mg/kg, LD50 = = = 866 mg/kg.
Since no mortality was observed with oral administration at the highest dose of 5000 mg/kg, LD50 > 3000 mg/kg. The resorption index (IR) is then calculated as follows:
IR = LD50 i.p./LD50 p.os. x 100 = 866/3000 x 100 ≈ 28.9 %
Based on the above, for 3b, D0 is 1000 mg/kg, D100 is 1500 mg/kg, LD50= = = 1224.7 mg/kg.
Since no mortality was observed with oral administration at the highest dose of 5000 mg/kg for 3b as well, LD50 > 3000 mg/kg. IR is then calculated as follows:
IR = LD50 i.p./LD50 p.os. x 100 = 1224.7/3000 x 100 ≈ 40.8 %
The study of the acute toxicity of the two novel sulfonyl hydrazones resulted in them showing low oral toxicity and slightly more expressed parenteral toxicity. According to the Hodge and Sterner scale [31], the two leading sulfonyl derivatives could be classified as slightly toxic after oral and intraperitoneal administration to female mice, as LD50 is in the range of 500 – 5000 mg/kg. A more in-depth analysis shows that 3a demonstrated slightly higher toxicity compared to 3b, due to the fact that at concentration 1000 mg/kg b.w. 3a led to 33 % mortality, while at the same dose, the other derivative led to no mortality. 3b exhibited its toxic effect at a dose of 1500 mg/kg.
3.4. Sub-Acute Toxicity of Mice, Hematological, Biochemical Parameters amd Markes of Oxidative Stress after Sub-Acute Toxicity Study
As described in Section 2. Materials and methods, during the sub-acute toxicity tests, the two investigated compounds were administered intraperitoneally at approximately the same time every day in continuation of 14 days. Changes of body weight of experimental animals are presented on Figure 6 and Figure 7.
During the 14-day experimental period, the administration of INH, 3a 45 mg/kg and 3b in both doses, results in statistically significant alterations in the body weight (p≤ 0.05). All 6 groups of animals show slight weight changes during different stages of the experiment. However, a more detailed review of the results, might conclude that 3b in both concentrations of 65 mg/kg and 130 mg/kg led to slight weight gain of treated animals, compared to the body weight on the 1st day of the experiment. The assumption of our scientific group is that this might be related to the cinnamon scaffold in the structure of 3b, as there are literatute sources, testifying slight appetite-enhancing effect of trans-cinnamaldehyde [32].
3.5. Complete Blood Count (CBC) and Biochemistry in the Blood of Mice
The complete blood count of the treated animals is presented in Table S7, while Table S8 summarizes the results from biochemistry tests, ran in both plasma and blood serum. Both tables are present on the Supplementary information materal. A more in-depth analysis of the received results has been conducted and showed that both studied compounds in each of their doses led to a slight decrease in the levels of lymphocytes and erythrocytes in comparison to the control group, however still remaining within the reference values interval. Increased levels of blood glucose and urea have been demonstrated by all treated groups, including INH administered animals, in comparison to the controls, in Table S8 in the Supplementary information, but however, the testified values remain within the reference value range. During the experiment, there have been no deviations outside the reference values, reported in literature sources for the particular breed of animals.
3.6. Markers of Oxidative Stress
To further assess the pharmacological profile of both solfonyl hydrazones and their toxicity mechanism, we studied the influencing ROS-mediated homeostasis in the liver of experimental animals. In most cases, the peroxidation of lipids, which occurs in cellular biomembranes, is mediated by free radical processes. The measurement of MDA content (endogenous genotoxic product) is typically employed as a basis for determining the level of lipid peroxidation and reflecting the extent of tissue and cell damage, caused by prooxidant agents [33].
As ilustrated on Figure 8, the 14-day intraperitoneal administration of INH and the higher doses of both compounds increased the level of MDA with 26.5%, 16.9% and 9.6% respectively compared to the control group. However, in the animals treated with both compounds and at both administered doses, the level of MDA was statistically significantly lower than in the group treated with isoniazid. In the groups treated with the low doses 3a and 3b, the level of MDA was 32% and 33% lower compared to the INH group and was practically comparable to that of the control animals.
Glutathione (GSH), on the other hand, is known as the “master antioxidant” since it is the most important redox regulator and controls inflammatory processes in the body [34]. Liver diseases, induced by drugs, alcohol, diet, and environmental pollutants, are usually associated with causing disturbances in the GSH homeostasis [35]. Also, glutathione depletion occurs, if ROS production is not controlled, and this leads to increased patients susceptibility to immunosuppression, organ damage, increased vascular permeability, shock, and thrombotic events [36].
The conduction of endogenous GSH content test led to the results, presented on Figure 9. Isoniazid and the two tested compounds in both doses lead to a statistically significant decrease in the level of GSH compared to the control group. INH decreased statistically significantly the level of GSH by 76%, low doses of the two studied compounds reduced the level of GSH by about 62%, and high doses of 3a and 3b decreased the level of GSH by 43% and 30%, respectively, compared to the control group. Both compounds administered at both doses reduced the depletion of GSH and it was statistically higher compared to isoniazid. In the group treated with compound 3a GSH level was 37.3% and 57.3% respectively higher than in INH treated animals, while in the groups treated with compound 3b the level of GSH was 36.7% and 65.5% higher than in in INH group.
A catalase is one of the crucial antioxidant enzymes that mitigates oxidative stress to a considerable extent by destroying cellular hydrogen peroxide to produce water and oxygen. Deficiency or malfunction of catalase is postulated to be related to the pathogenesis of many age-associated degenerative diseases like diabetes mellitus, hypertension, anemia, vitiligo, Alzheimer’s disease, Parkinson’s disease, bipolar disorder, cancer, and schizophrenia [37] As demonstrated on
Figure 10, the repeated administration of compound 3a at concentration of 90 mg/kg led to statistically significant increase in the level of catalase with 25.9% and 33.1% in comparison to the control and the INH group. Derivative 3b increased statistically significant the activity of catalase with 15.3% and 30% vs. the control group and with 23.5% and 36.8% in comparison to the INH group. This increase in the activity of the enzyme is probably related to the attempt of the liver tissue to overcome the oxidative stress and liver damage caused by compound 3b, which liver disorder was also evident from the histomorphological observations (Figure 12e,f).
3.7. Histological Examinationof Tissue Specimens Post-Mortem
3.7.1. Kidney
Histological findings in the kidneys show normal histology without pathological deviations (Figure 11). There are small foci of lymphocytic infiltration in the parenchyma. Vascular congestion without intimal hyperplasia and obliteration of the lumens was observed. No signs of tubular atrophy, inflammation and glomerulitis were present. The tubules were lined with epithelium with preserved histologic structure. Elements of glomerular and extraglomerular mesangium were visualized with no proliferation. The renal pelvis in all tested groups had normal architecture.
3.7.2. Liver
The histological findings in the liver parenchyma showed isolated degenerative changes. The overall architecture was preserved with lobular configuration and absence of major remodeling changes. Areas of cholestasis were present in all groups. Vascular congestion, minimal periportal predominantly lymphocytic inflammation and dilation of sinusoidal spaces were observed. Sings of increased ballooning degeneration in small percent of hepatocytes in groups 3b 65 mg/kg and 3b 130 mg/kg were found. In these two groups areas of necrosis were present measuring respectively 0.1 cm and 0.3 cm. The areas of necrosis are circled with red color on Figure 12.
3.8. In Vitro InhA Inhibition Assay
In a previous publication of our scientific unit, molecular docking of the sulfonyl hydrazones 3a and 3b with two X-ray crystallographic structures of M. tuberculosis enoyl reductase (PDB ID 2X22 and PDB ID 4TZK) has been reported [10]. The results of the molecular docking showed that 3b appeared as the top-ranked compound after docking with both structures of InhA with scores of -12.36 and –12.83 kcal/mol, while 3a presented slightly lower docking scores of -11.98 and –12.80 kcal/mol (Figures S1A and S1B in the Supplementary information present the protein–ligand interactions (PLI) diagrams of the sulfonyl hydrazones 3a and 3b in the ligand-binding domains of both receptors, 2X22 and 4TZK). In both enzyme structures, the reference compound isoniazid recorded worse results, with docking scores of -9.18 and 8.51 [10]. Encouraged by the outcome of the molecular docking study, an in vitro InhA inhibition assay was conducted to confirm whether the enoyl-ACP reductase can be validated as one of the targets of the investigated derivatives. The results of the spectrophotometrically conducted assay of the potential enoyl-ACP reductase inhibition effect demonstrate that both compounds possess moderate to good inhibition activity slightly higher than 50 %. The inhibition capacity of each concentration of the investigated compounds has been presented in Table 4. The average inhibition activity of compound 3a has been calculated as 57.8 %, for compound 3b the average inhibition activity was calculated as 53.1%, while the sample, containing triclosan as positive reference compound, demonstrated 82.3 % inhibition activity against the recombinant Mycobacterium tuberculosis Mtb enoyl-acyl carrier protein reductase enzyme at the particular reaction conditions. Compound 3a at concentration of 100 µM demonstrated equal activity as the positive control triclosan at the same concentration. By plotting the percent inhibition against each concentration for the two compounds, the IC50 values have been calculated as 18.2 µM and 10.7 µM for compound 3a and 3b, respectively. The received results during the InhA inhibition assay provide potential pharmacological pathway to combat the resistance of Mycobacterium tuberculosis (Mtb) towards izoniazid and other first-line options. Considering the enzyme inhibition values are consistent with the antimycobacterial activity of the compounds and the previously reported results from molecular docking with two crystallographic structures of InhA (10), it can be concluded that inhibiton of enoyl-ACP reductase enzyme is a validated pathway for the activity of these compounds.
4. Conclusions
To conclude, in the current study the investigated sulfonyl hydrazones 3a and 3b were characterized for their: • acute oral and intraperitoneal toxicity; • sub-acute intraperitoneal toxicity in mice, • influence on the biomarkers of oxidative stress; • in vitro enoyl-ACP reductase inhibition activity. Additionally, the structure of the leader compound 3b was elucidated using single crystal X-ray diffraction. In the crystal structure, the molecule adopts the (E,E) conformation. As a result, the tested compounds were classified as slightly toxic, according to the Hodge and Sterner scale, have good tolerability from the experimental animals, do not lead to any statistically significant deviations in biochemical and hematological parameters, and show only isolated pathomorphological deviations. The repeated administration of compound 3b led to a slight weight gain in the treated animals, which might be related to the cinnamon fragment in its structure, which has been described to show a low appetite-enhancing effect in some literature sources. In addition, the two derivatives demonstrated moderate InhA inhibition capacity during the in vitro experiment with recombinant Mtb InhA reductase enzyme. To conclude, the two chemical compounds possess the necessary characteristics to be considered for further development as drugs, which can help to combat the ongoing resistance of Mycobacterium tuberculosis towards isoniazid and other first-line therapies.
Supplementary Materials
The following supporting information can be downloaded at the website of this paper posted on Preprints.org.
Author Contributions
Conceptualization, V.T.A. and R.S.; writing—original draft preparation..; writing—review and editing, Y.T., R.S., V.T.A.; supervision, R.S., V.T.A.; project administration, R.S., V.T.A.; funding, Y T. V.T.A., Investigations Y.T., V.T.A, R.S.,O.B., H.S.
Institutional Review Board Statement
The animal study protocol was approved by the Animal Care Ethics Committee of the Bulgarian Agency for Food Safety (BAFS) (protocol code 125 of 7 October 2020) for studies involving animals.
Informed Consent Statement
Not applicable.
Data Availability Statement
All obtained data are presented in this article.
Acknowledgments
We acknowledge the financial support from the Bulgarian National Science Fund (Grant KP-06-N41/3, 2020).
Conflicts of Interest
The authors declare no conflict of interest.
Crystallographic data (excluding structure factors) for the structural analysis was deposited with the Cambridge Crystallographic Data Centre, CCDC No. 2356559.
A copy of this information may be obtained free of charge from: The Director, CCDC, 12 Union Road, Cambridge, CB2 1EZ, UK. Fax: +44 1223 336 033, e-mail:deposit@ccdc.cam.ac.uk, or www.ccdc.cam.ac.uk.
References
- WHO. WHO consolidated guidelines on tuberculosis Module 4: Treatment Drug-susceptible tuberculosis treatment. World Health Organization 2022; 2022.
- Ghiano DG, Recio-Balsells A, Bortolotti A, Defelipe LA, Turjanski A, Morbidoni HR, et al. New one-pot synthesis of anti-tuberculosis compounds inspired on isoniazid. European journal of medicinal chemistry. 2020;208:112699.
- Ghiya S, Joshi YC. Synthesis and antimicrobial evaluation of hydrazones derived from 4-methylbenzenesulfonohydrazide in aqueous medium. Medicinal Chemistry Research. 2016;25(5):970-6.
- Mascarello A, Mori M, Chiaradia-Delatorre LD, Menegatti ACO, Monache FD, Ferrari F, et al. Discovery of Mycobacterium tuberculosis Protein Tyrosine Phosphatase B (PtpB) Inhibitors from Natural Products. PLOS ONE. 2013;8(10):e77081.
- Navakoski de Oliveira K, Chiaradia LD, Alves Martins PG, Mascarello A, Sechini Cordeiro MN, Carvalho Guido RV, et al. Sulfonyl-hydrazones of cyclic imides derivatives as potent inhibitors of the Mycobacterium tuberculosisprotein tyrosine phosphatase B (PtpB). MedChemComm. 2011;2(6):500-4.
- Bhat M, Poojary B, Kumar SM, Hussain MM, Pai N, Revanasiddappa BC, et al. Structural, crystallographic, Hirshfeld surface, thermal and antimicrobial evaluation of new sulfonyl hydrazones. Journal of Molecular Structure. 2018;1159:55-66.
- Ozmen UO, Olgun G. Synthesis, characterization and antibacterial activity of new sulfonyl hydrazone derivatives and their nickel(II) complexes. Spectrochim Acta A Mol Biomol Spectrosc. 2008;70(3):641-5.
- Popiołek, Ł. The bioactivity of benzenesulfonyl hydrazones: A short review. Biomedicine & Pharmacotherapy. 2021;141:111851.
- Siemann S, Evanoff DP, Marrone L, Clarke AJ, Viswanatha T, Dmitrienko GI. N-Arylsulfonyl Hydrazones as Inhibitors of IMP-1 Metallo-β-Lactamase. Antimicrobial Agents and Chemotherapy. 2002;46(8):2450-7.
- Angelova VT, Pencheva T, Vassilev N, K-Yovkova E, Mihaylova R, Petrov B, et al. Development of New Antimycobacterial Sulfonyl Hydrazones and 4-Methyl-1,2,3-thiadiazole-Based Hydrazone Derivatives. Antibiotics (Basel, Switzerland). 2022;11(5):562.
- Valcheva V, Simeonova R, Mileva M, Philipov S, Petrova R, Dimitrov S, et al. In Vivo Toxicity, Redox-Modulating Capacity and Intestinal Permeability of Novel Aroylhydrazone Derivatives as Anti-Tuberculosis Agents. Pharmaceutics. 2022;15(1):79.
- Teneva Y, Simeonova R, Valcheva V, Angelova VT. Recent Advances in Anti-Tuberculosis Drug Discovery Based on Hydrazide–Hydrazone and Thiadiazole Derivatives Targeting InhA. Pharmaceuticals. 2023;16(4):484.
- Europe Co. European Convention for the Protection of Vertebrate Animals Used for Experimental and Other Scientific Purposes (ETS 123). In: Europe Co, editor. Strasbourg, France1991.
- Lorke, D. A new approach to practical acute toxicity testing. Arch Toxicol. 1983;54(4):275-87.
- Chinedu E, Arome D, Ameh FS. A new method for determining acute toxicity in animal models. Toxicol Int. 2013;20(3):224-6.
- Chen C, Wicha SG, de Knegt GJ, Ortega F, Alameda L, Sousa V, et al. Assessing Pharmacodynamic Interactions in Mice Using the Multistate Tuberculosis Pharmacometric and General Pharmacodynamic Interaction Models. CPT Pharmacometrics Syst Pharmacol. 2017;6(11):787-97.
- Lillie, R.D. STUDIES ON HISTOCHEMICAL ACYLATION PROCEDURES. I. PHENOLS. J Histochem Cytochem. 1964;12:522-9.
- Polizio AH, Peña C. Effects of angiotensin II type 1 receptor blockade on the oxidative stress in spontaneously hypertensive rat tissues. Regulatory peptides. 2005;128(1):1-5.
- Bump EA, Taylor YC, Brown JM. Role of glutathione in the hypoxic cell cytotoxicity of misonidazole. Cancer Research. 1983;43(3):997-1002.
- Aebi, H. [13] Catalase in vitro. Methods in enzymology. 105: Elsevier; 1984. p. 121-6.
- Chetty S, Armstrong T, Sharma Kharkwal S, Drewe WC, De Matteis CI, Evangelopoulos D, et al. New InhA Inhibitors Based on Expanded Triclosan and Di-Triclosan Analogues to Develop a New Treatment for Tuberculosis. Pharmaceuticals. 2021;14(4):361.
- Doğan H, Doğan Ş D, Gündüz MG, Krishna VS, Lherbet C, Sriram D, et al. Discovery of hydrazone containing thiadiazoles as Mycobacterium tuberculosis growth and enoyl acyl carrier protein reductase (InhA) inhibitors. European Journal of Medicinal Chemistry. 2020;188:112035.
- Doğan ŞD, Gündüz MG, Doğan H, Krishna VS, Lherbet C, Sriram D. Design and synthesis of thiourea-based derivatives as Mycobacterium tuberculosis growth and enoyl acyl carrier protein reductase (InhA) inhibitors. European journal of medicinal chemistry. 2020;199:112402.
- Bruker, A. APEX 2. Bruker Advanced X-ray Solutions. Madison, Wisconsin, USA; 2004.
- Bruker, A. Saint and SADABS. Bruker AXS Inc, Madison, Wisconsin, USA. 2009.
- Sheldrick, G.M. SHELXT–Integrated space-group and crystal-structure determination. Acta Crystallographica Section A: Foundations and Advances. 2015;71(1):3-8.
- Cunha MR, Tavares MT, Carvalho CF, Silva NA, Souza AD, Pereira GJ, et al. Environmentally safe condition for the synthesis of aryl and alkyl sulfonyl hydrazones via one-pot reaction. ACS Sustainable Chemistry & Engineering. 2016;4(4):1899-905.
- Ozochukwu IS, Okpareke OC, Izuogu DC, Ibezim A, Ujam OT, Asegbeloyin JN. N’-(Pyridin-3-ylmethylene) benzenesulfonohydrazide: Crystal structure, DFT, Hirshfeld surface and in silico anticancer studies. European Journal of Chemistry. 2021;12(3):256-64.
- Rahman MM, Hussain MM, Arshad MN, Awual MR, Asiri AM. Arsenic sensor development based on modification with (E)-N′-(2-nitrobenzylidine)-benzenesulfonohydrazide: a real sample analysis. New Journal of Chemistry. 2019;43(23):9066-75.
- Blatova OA, Asiri AM, Al-Amshany ZM, Arshad MN, Blatov VA. Molecular packings and specific-bonding patterns in sulfonamides. New Journal of Chemistry. 2014;38(9):4099-106.
- Hodge HC, Sterner JH. Tabulation of Toxicity Classes. American Industrial Hygiene Association Quarterly. 1949;10(4):93-6.
- Ogawa K, Ito M. Appetite-enhancing Effects of trans-Cinnamaldehyde, Benzylacetone and 1-Phenyl-2-butanone by Inhalation. Planta Med. 2016;82(1-2):84-8.
- Niedernhofer LJ, Daniels JS, Rouzer CA, Greene RE, Marnett LJ. Malondialdehyde, a Product of Lipid Peroxidation, Is Mutagenic in Human Cells *. Journal of Biological Chemistry. 2003;278(33):31426-33.
- Bains VK, Bains R. The antioxidant master glutathione and periodontal health. Dent Res J (Isfahan). 2015;12(5):389-405.
- Chen Y, Dong H, Thompson DC, Shertzer HG, Nebert DW, Vasiliou V. Glutathione defense mechanism in liver injury: Insights from animal models. Food and Chemical Toxicology. 2013;60:38-44.
- Nair A, Sharma P, Tiwary MK. Glutathione deficiency in COVID19 illness-does supplementation help? Saudi Journal of Anaesthesia. 2021;15(4):458-60.
- Nandi A, Yan LJ, Jana CK, Das N. Role of Catalase in Oxidative Stress- and Age-Associated Degenerative Diseases. Oxid Med Cell Longev. 2019;2019:9613090.
Figure 1.
a) Chemical structure of 3a; b) chemical structure of 3b.
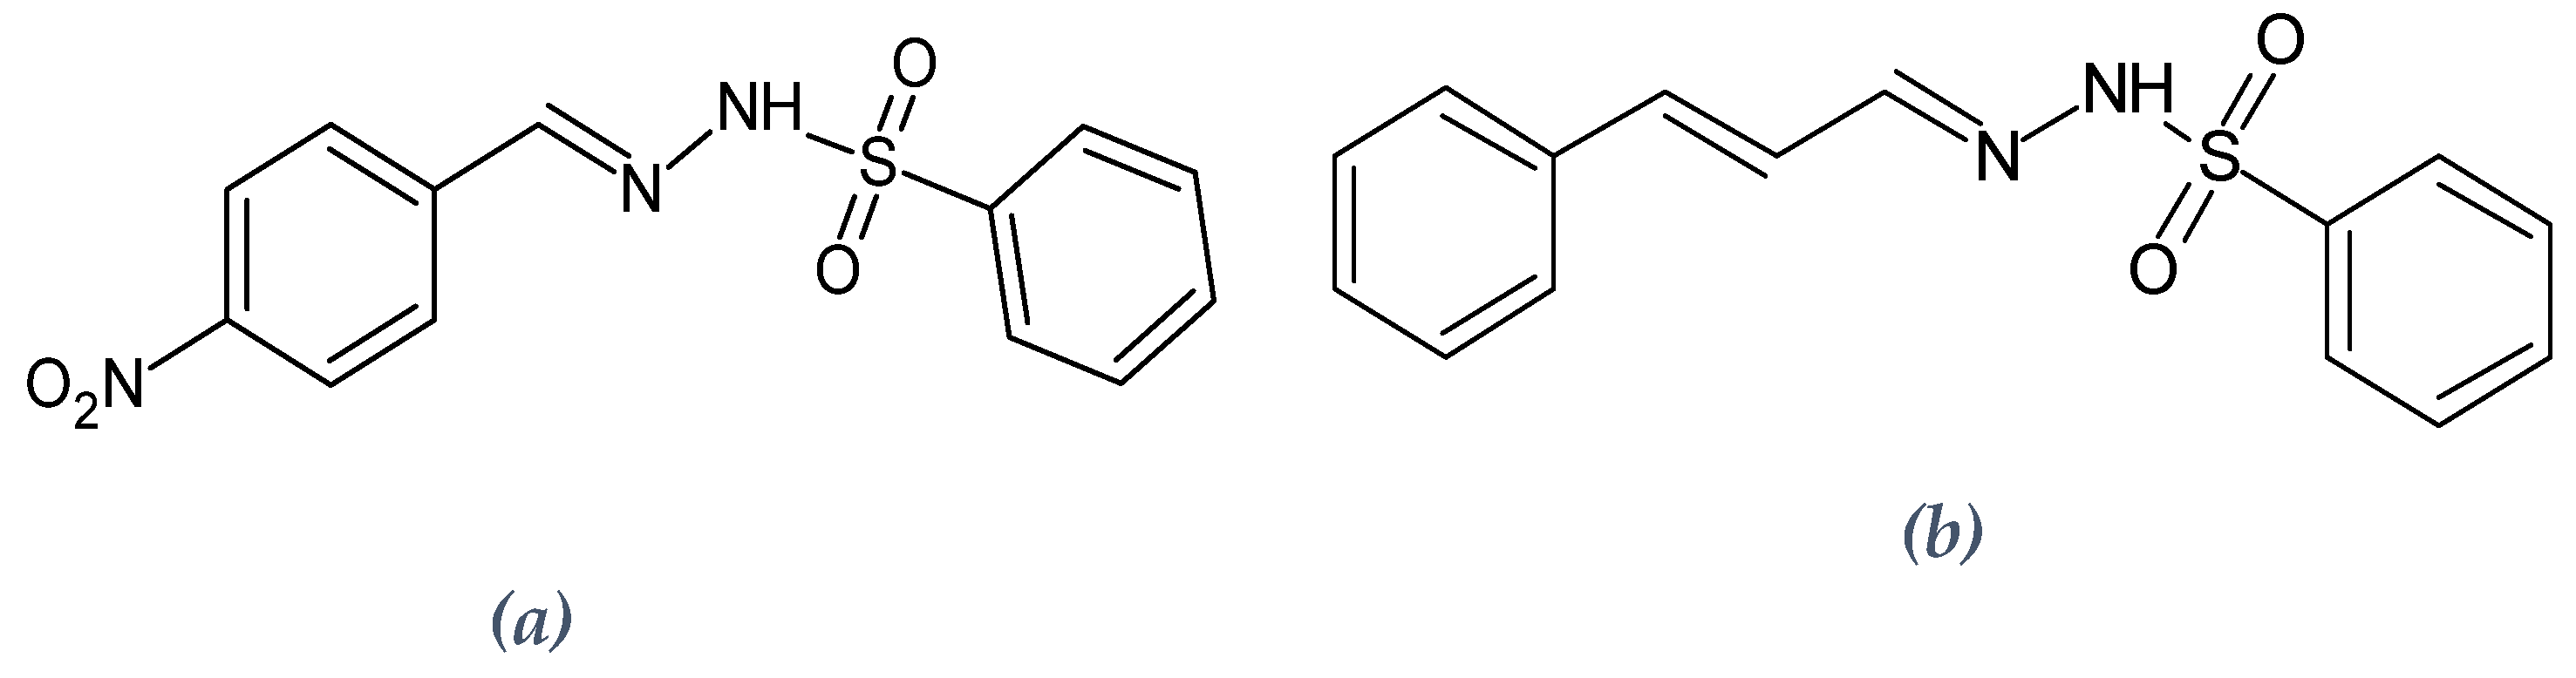
Figure 2.
Synthetic procedure for the preparation of the sulfonyl hydrazones.
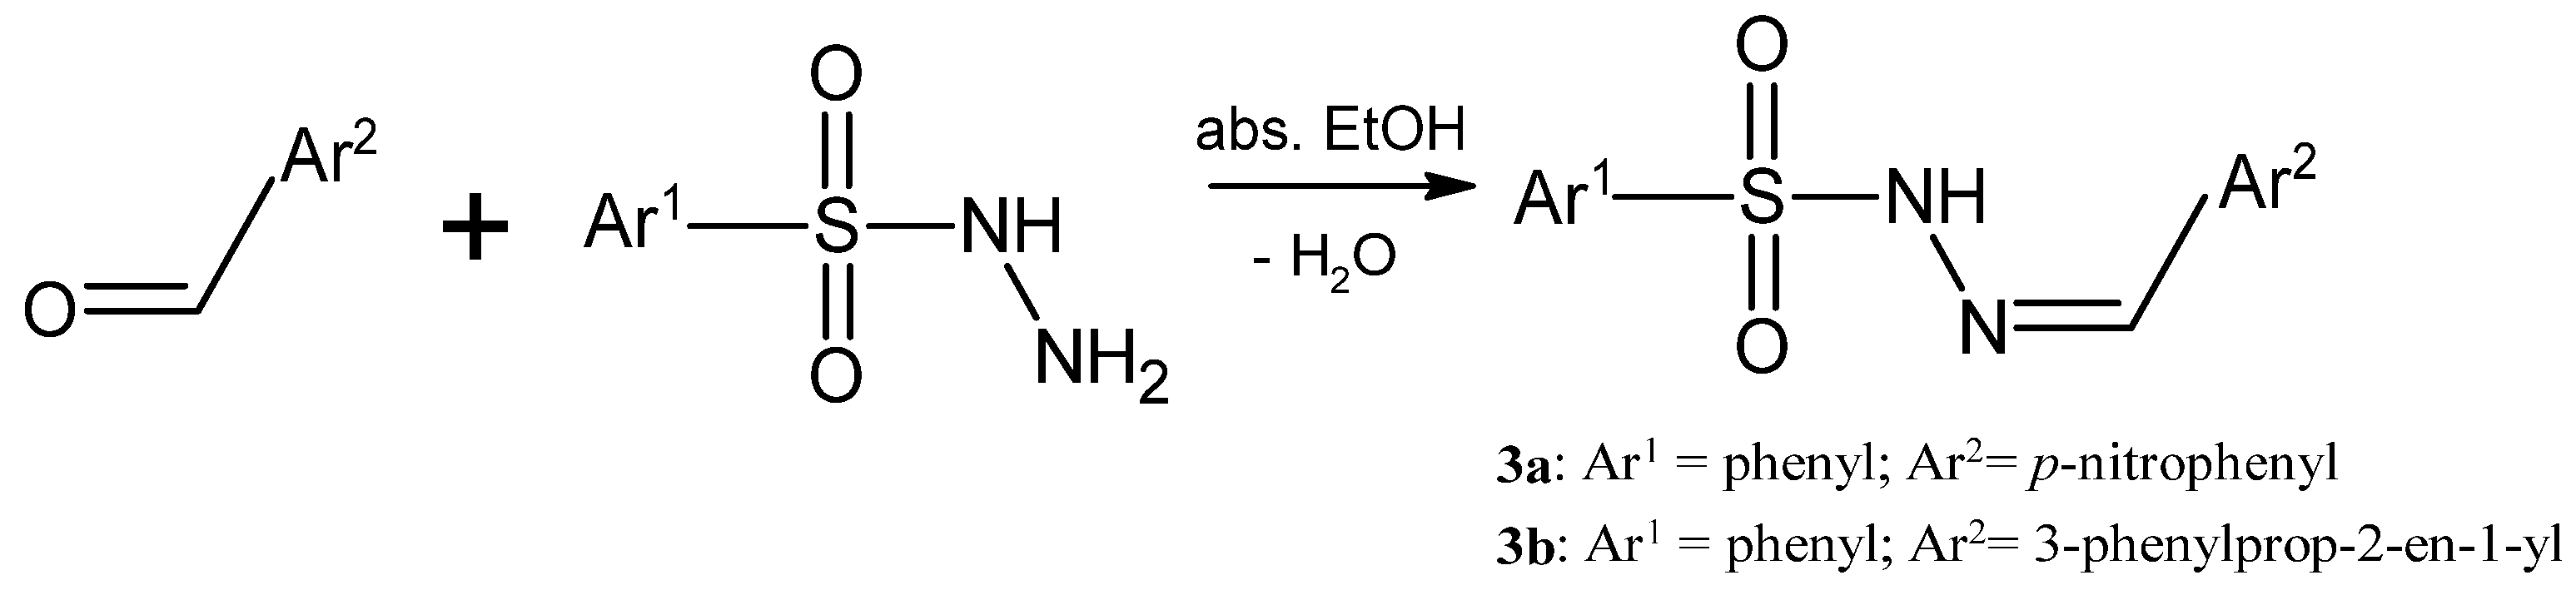
Figure 3.
Molecular structure of 3b, as obtained by single-crystal X-ray structural analysis (50% ellipsoids; H atoms are shown as sphere of arbitrary radii).
Figure 3.
Molecular structure of 3b, as obtained by single-crystal X-ray structural analysis (50% ellipsoids; H atoms are shown as sphere of arbitrary radii).
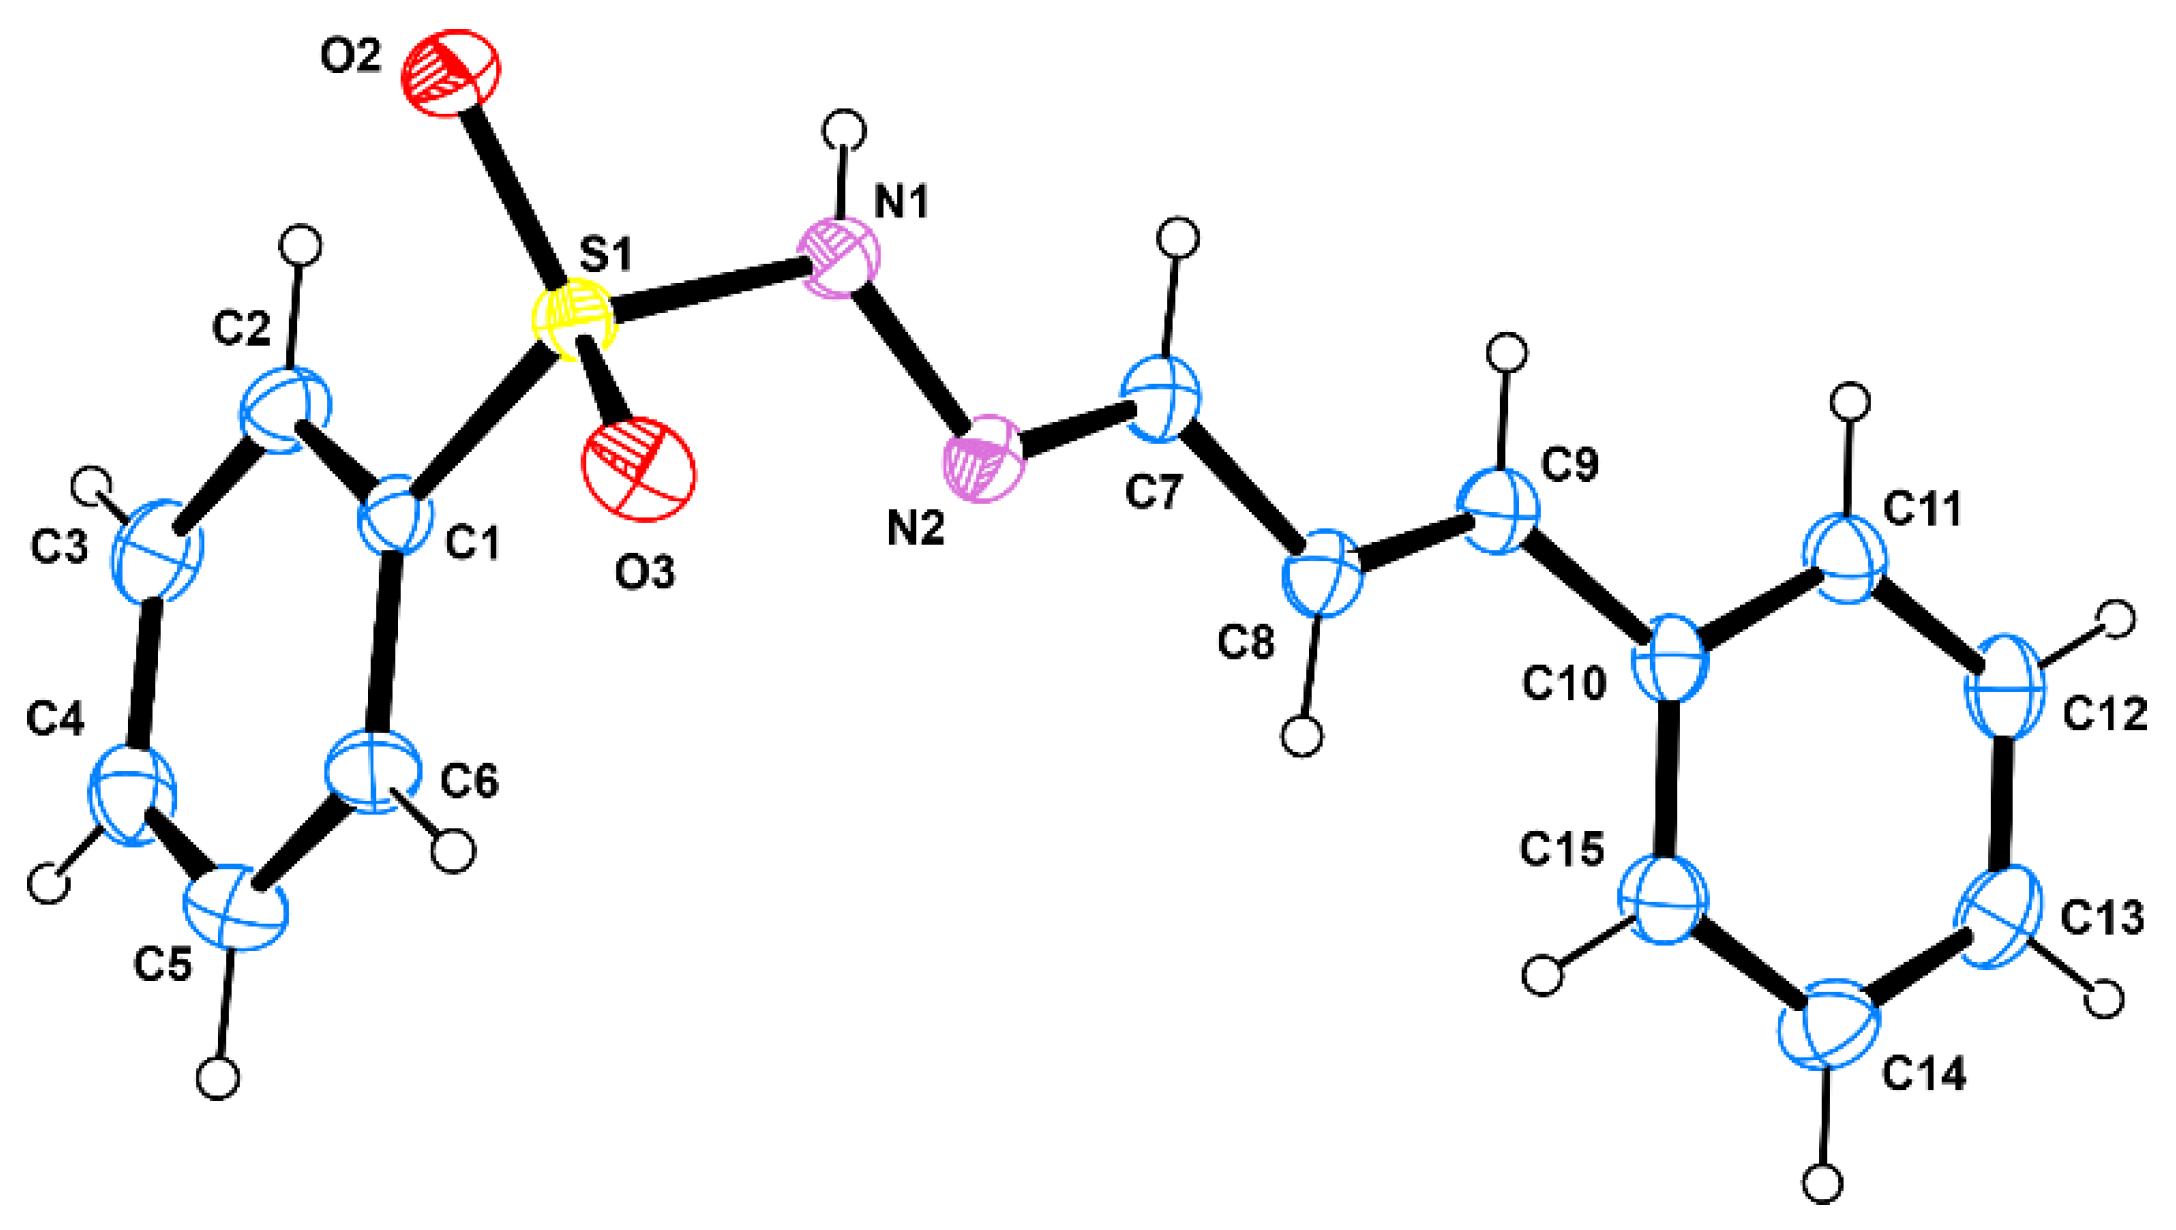
Figure 4.
Depiction of the (a) angle between the mean planes of Ar2 and Ar1 and (b) visualization of the hydrogen bond and weak C–H…O interactions (indicated by dashed lines) between adjacent molecules of 3b; Symmetry operation: (i) x, 1+y, z; (ii) 2-x, y – 1/2, 3/2 – z.
Figure 4.
Depiction of the (a) angle between the mean planes of Ar2 and Ar1 and (b) visualization of the hydrogen bond and weak C–H…O interactions (indicated by dashed lines) between adjacent molecules of 3b; Symmetry operation: (i) x, 1+y, z; (ii) 2-x, y – 1/2, 3/2 – z.
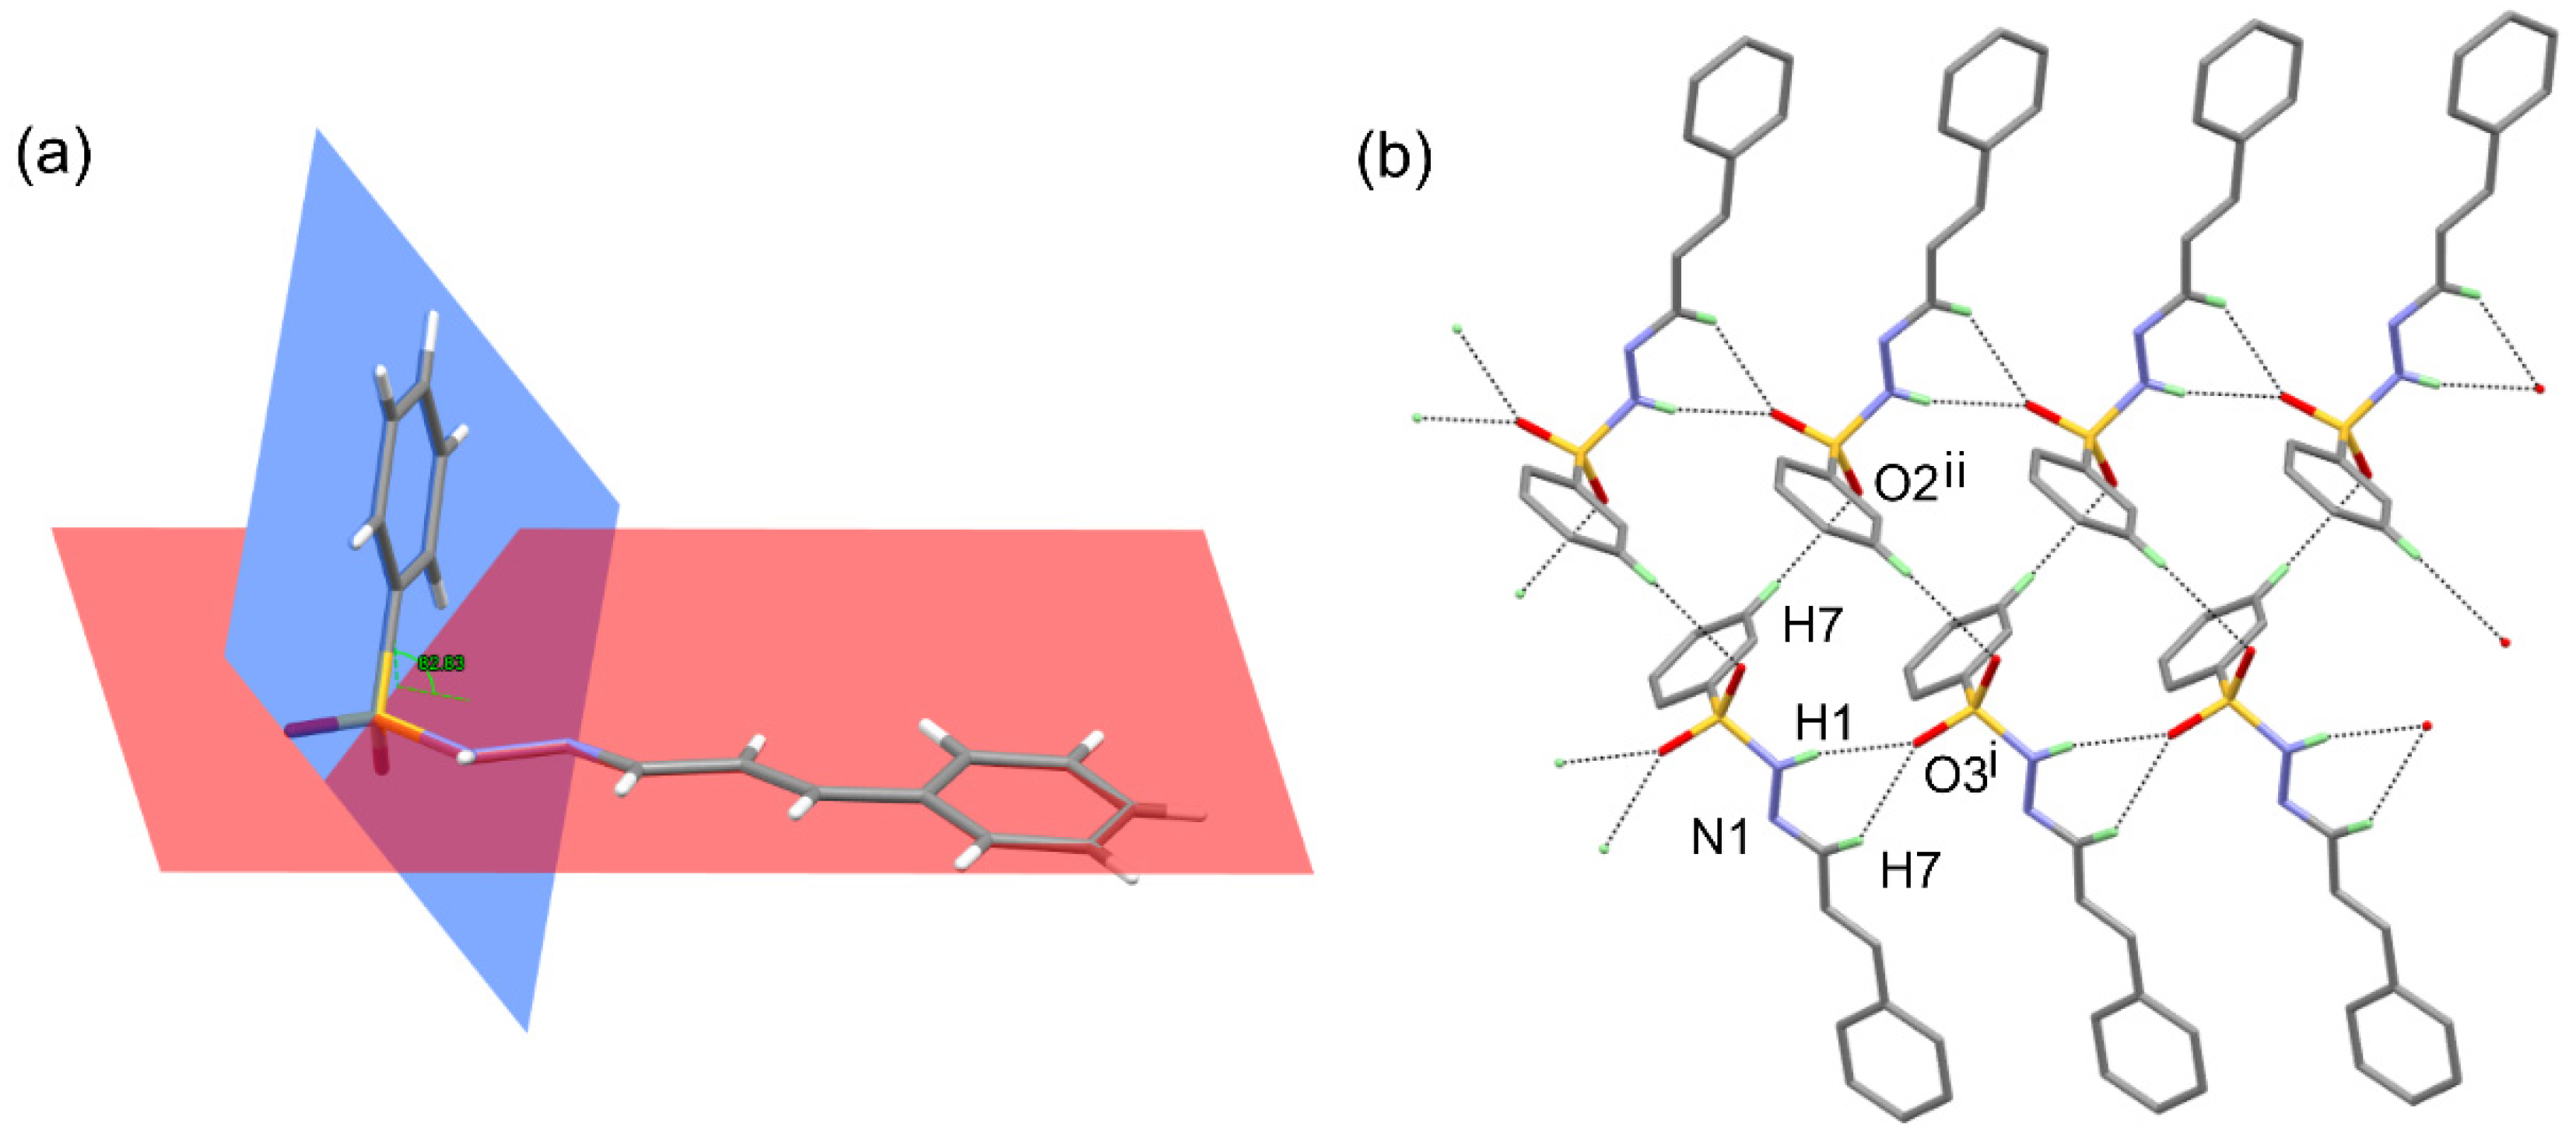
Figure 5.
Crystal packing diagram of 3b, viewed along a and b axis (the hydrogen bonds are indicated by dashed lines) disclosing the formation of pseudo layers.
Figure 5.
Crystal packing diagram of 3b, viewed along a and b axis (the hydrogen bonds are indicated by dashed lines) disclosing the formation of pseudo layers.

Figure 6.
Changes of body weight of animals, treated with INH and 3a in comparison to control group. *p≤ 0.05 vs control group; +p≤ 0.05 vs INH group. Results are presented as mean ± SD (n=6).
Figure 6.
Changes of body weight of animals, treated with INH and 3a in comparison to control group. *p≤ 0.05 vs control group; +p≤ 0.05 vs INH group. Results are presented as mean ± SD (n=6).
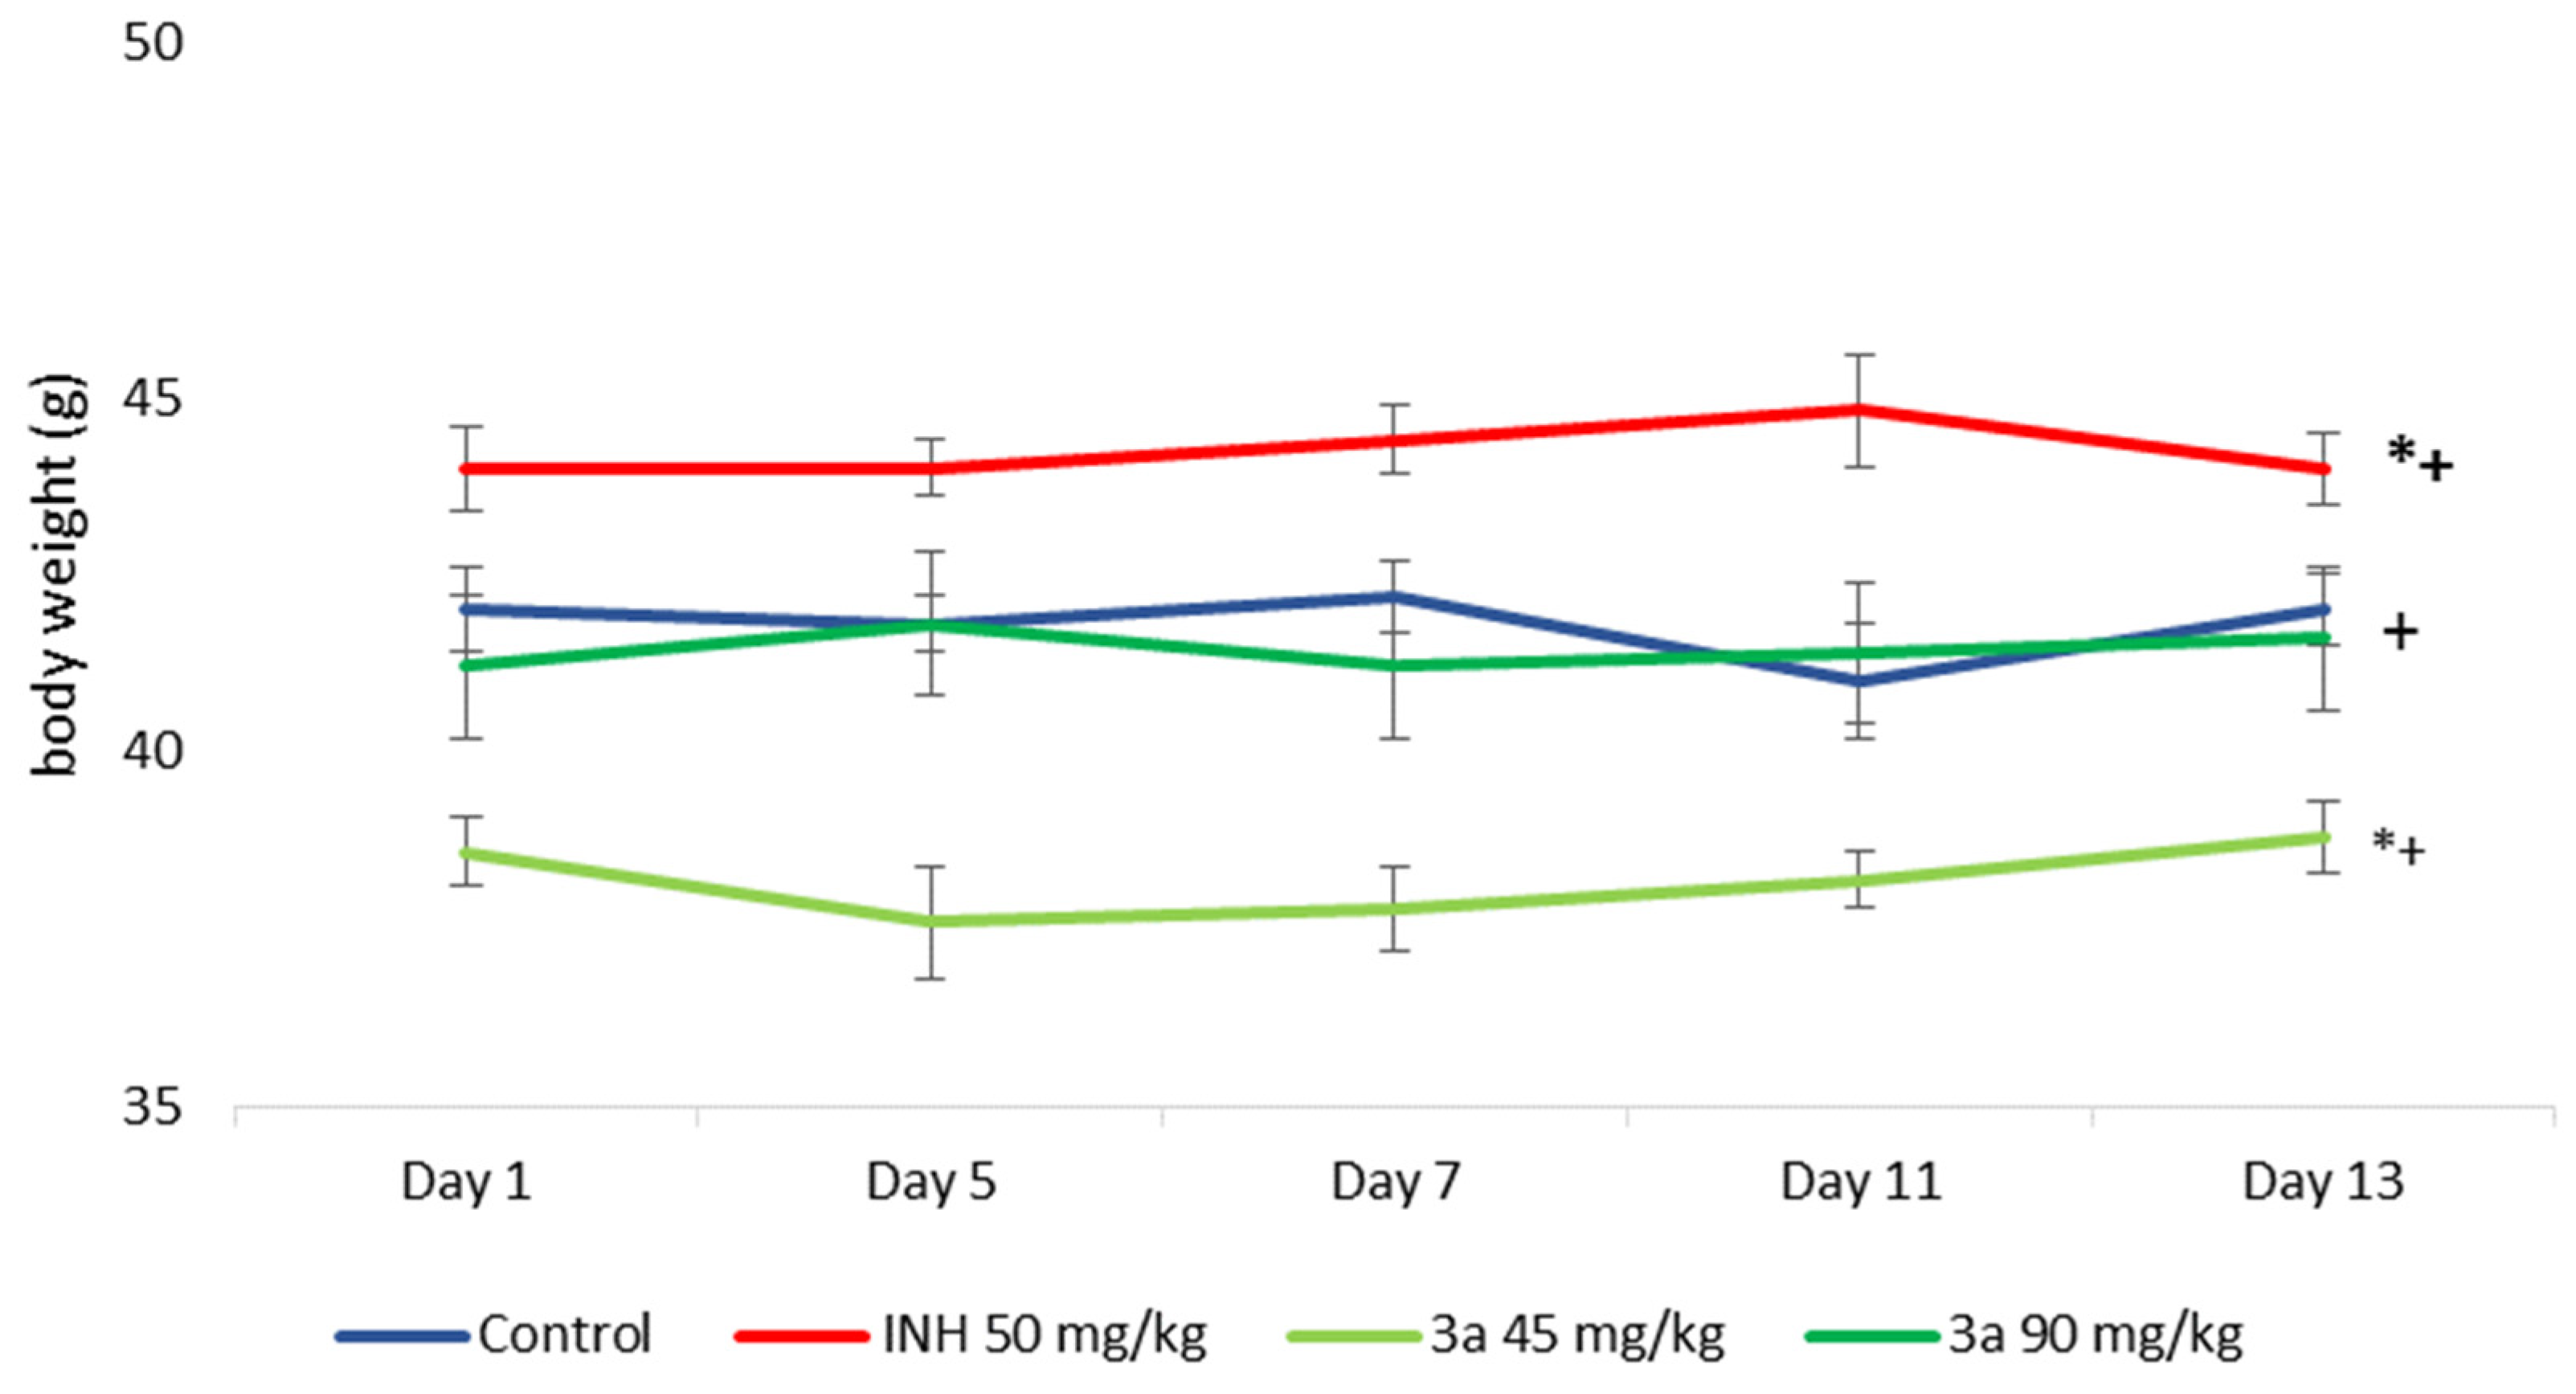
Figure 7.
Changes of body weight of animals, treated with INH and 3b in comparison to control group; *p≤ 0.05 vs control group; +p≤ 0.05 vs INH group. Results are presented as mean ± SD (n=6).
Figure 7.
Changes of body weight of animals, treated with INH and 3b in comparison to control group; *p≤ 0.05 vs control group; +p≤ 0.05 vs INH group. Results are presented as mean ± SD (n=6).
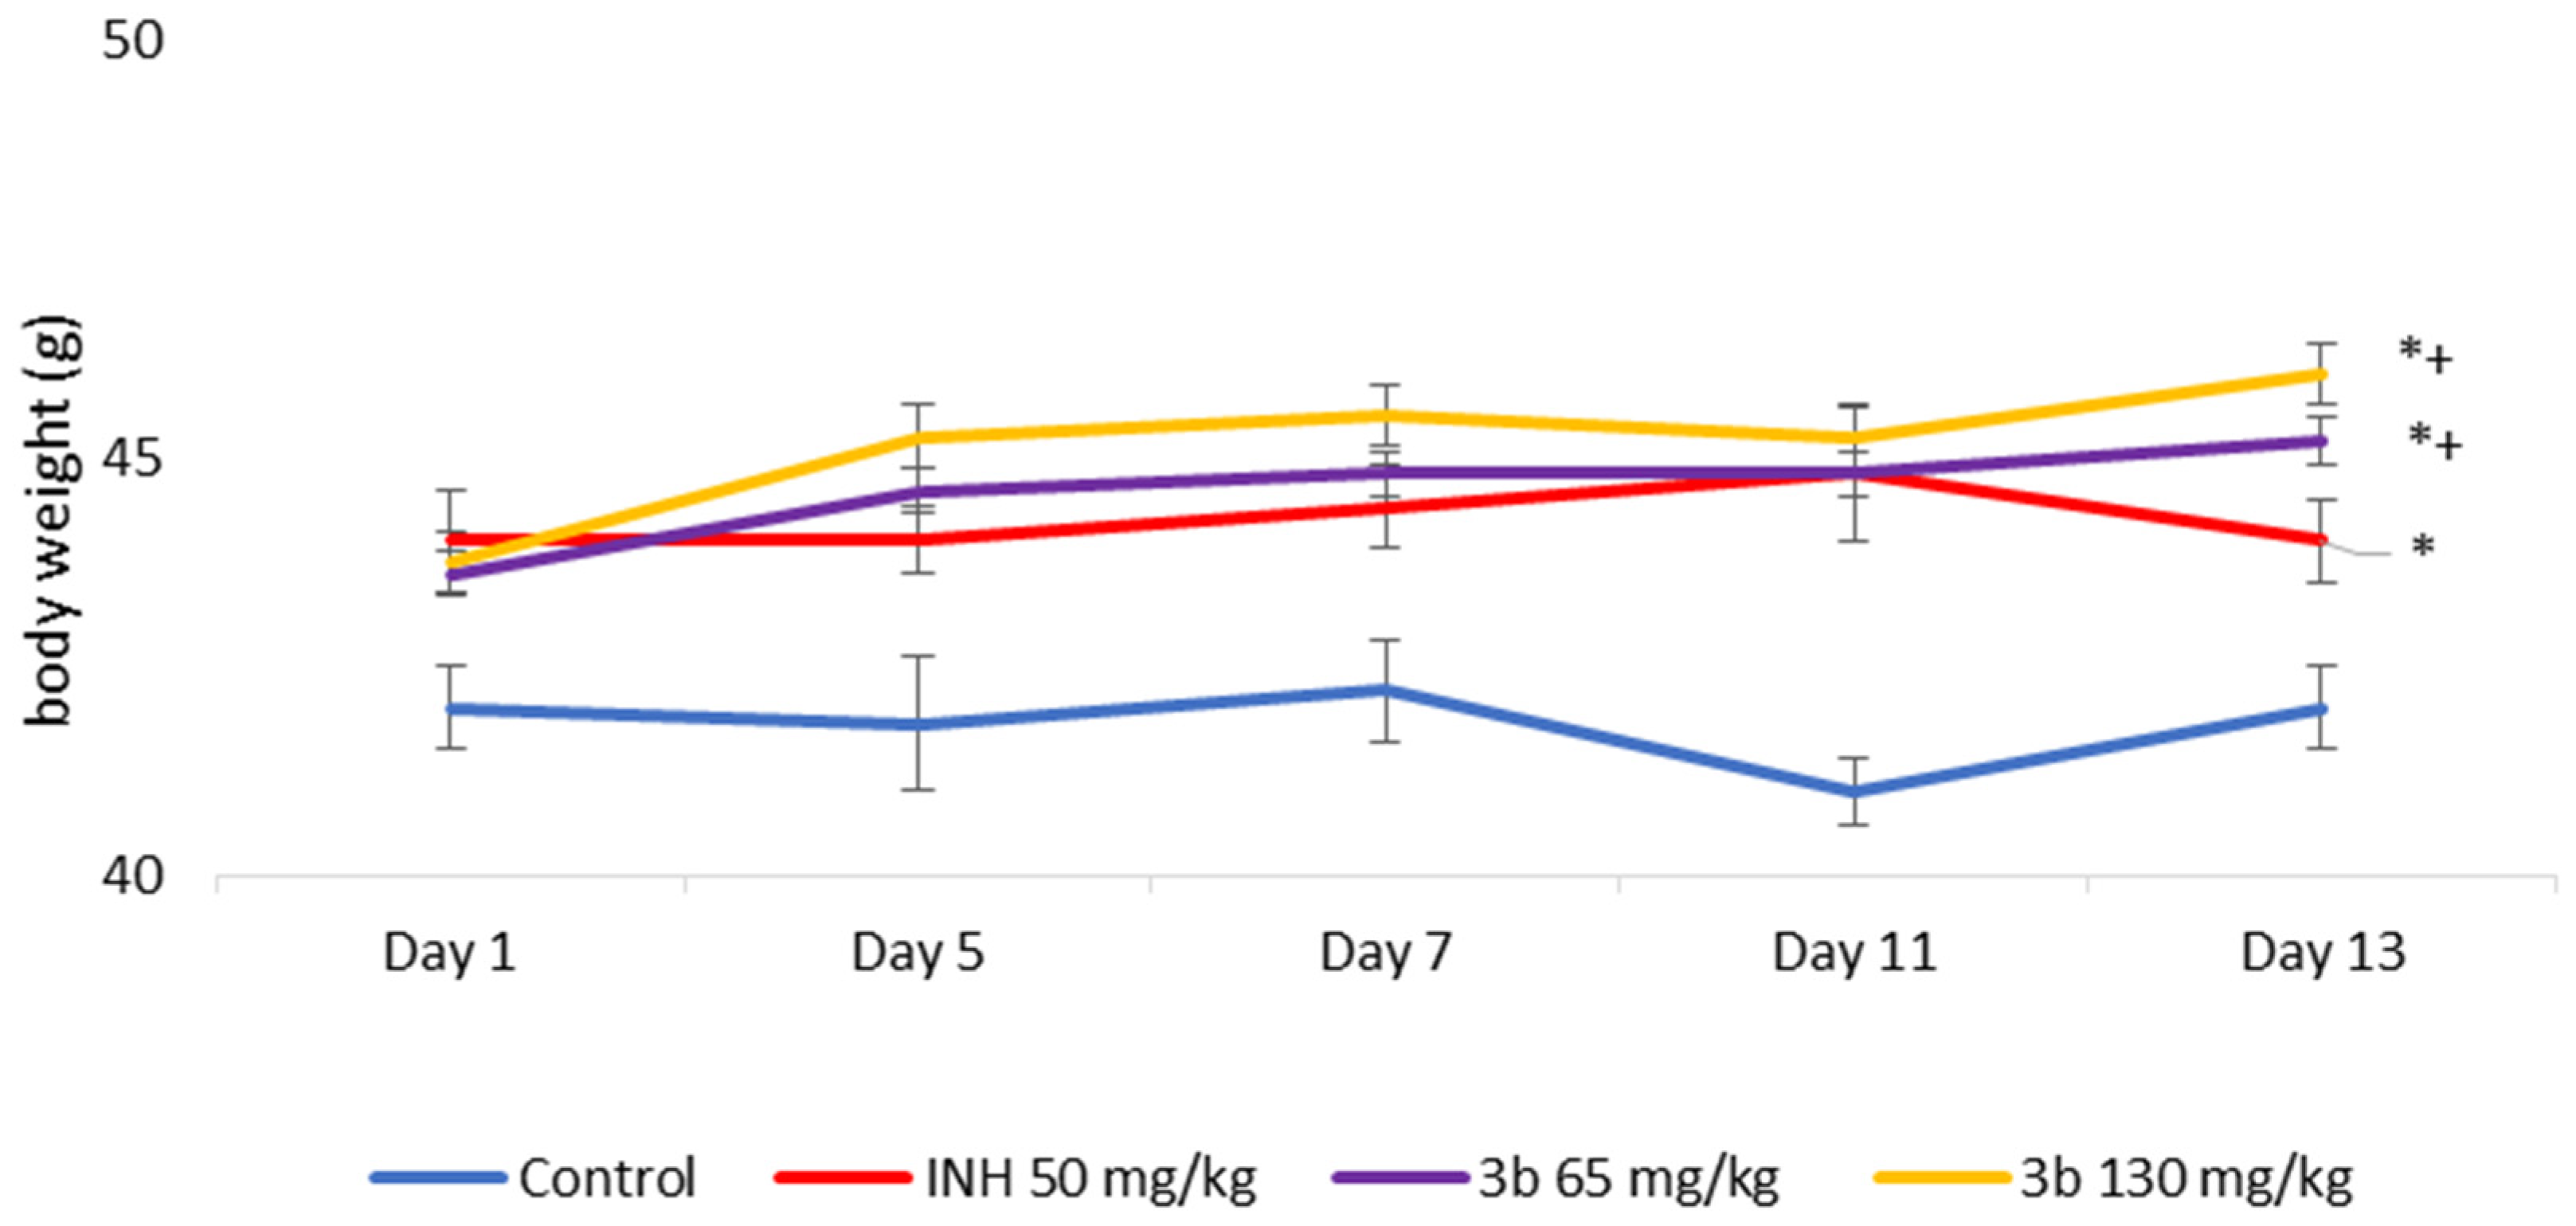
Figure 8.
Endogenous content of MDA in the liver homogenate of experimental groups. The significance of the data was assessed using the nonparametric Mann–Whitney U test. Results are presented as mean ± SD (n=6 for each compound and dose). *p≤ 0.05 vs control group; +p≤ 0.05 vs INH group.
Figure 8.
Endogenous content of MDA in the liver homogenate of experimental groups. The significance of the data was assessed using the nonparametric Mann–Whitney U test. Results are presented as mean ± SD (n=6 for each compound and dose). *p≤ 0.05 vs control group; +p≤ 0.05 vs INH group.
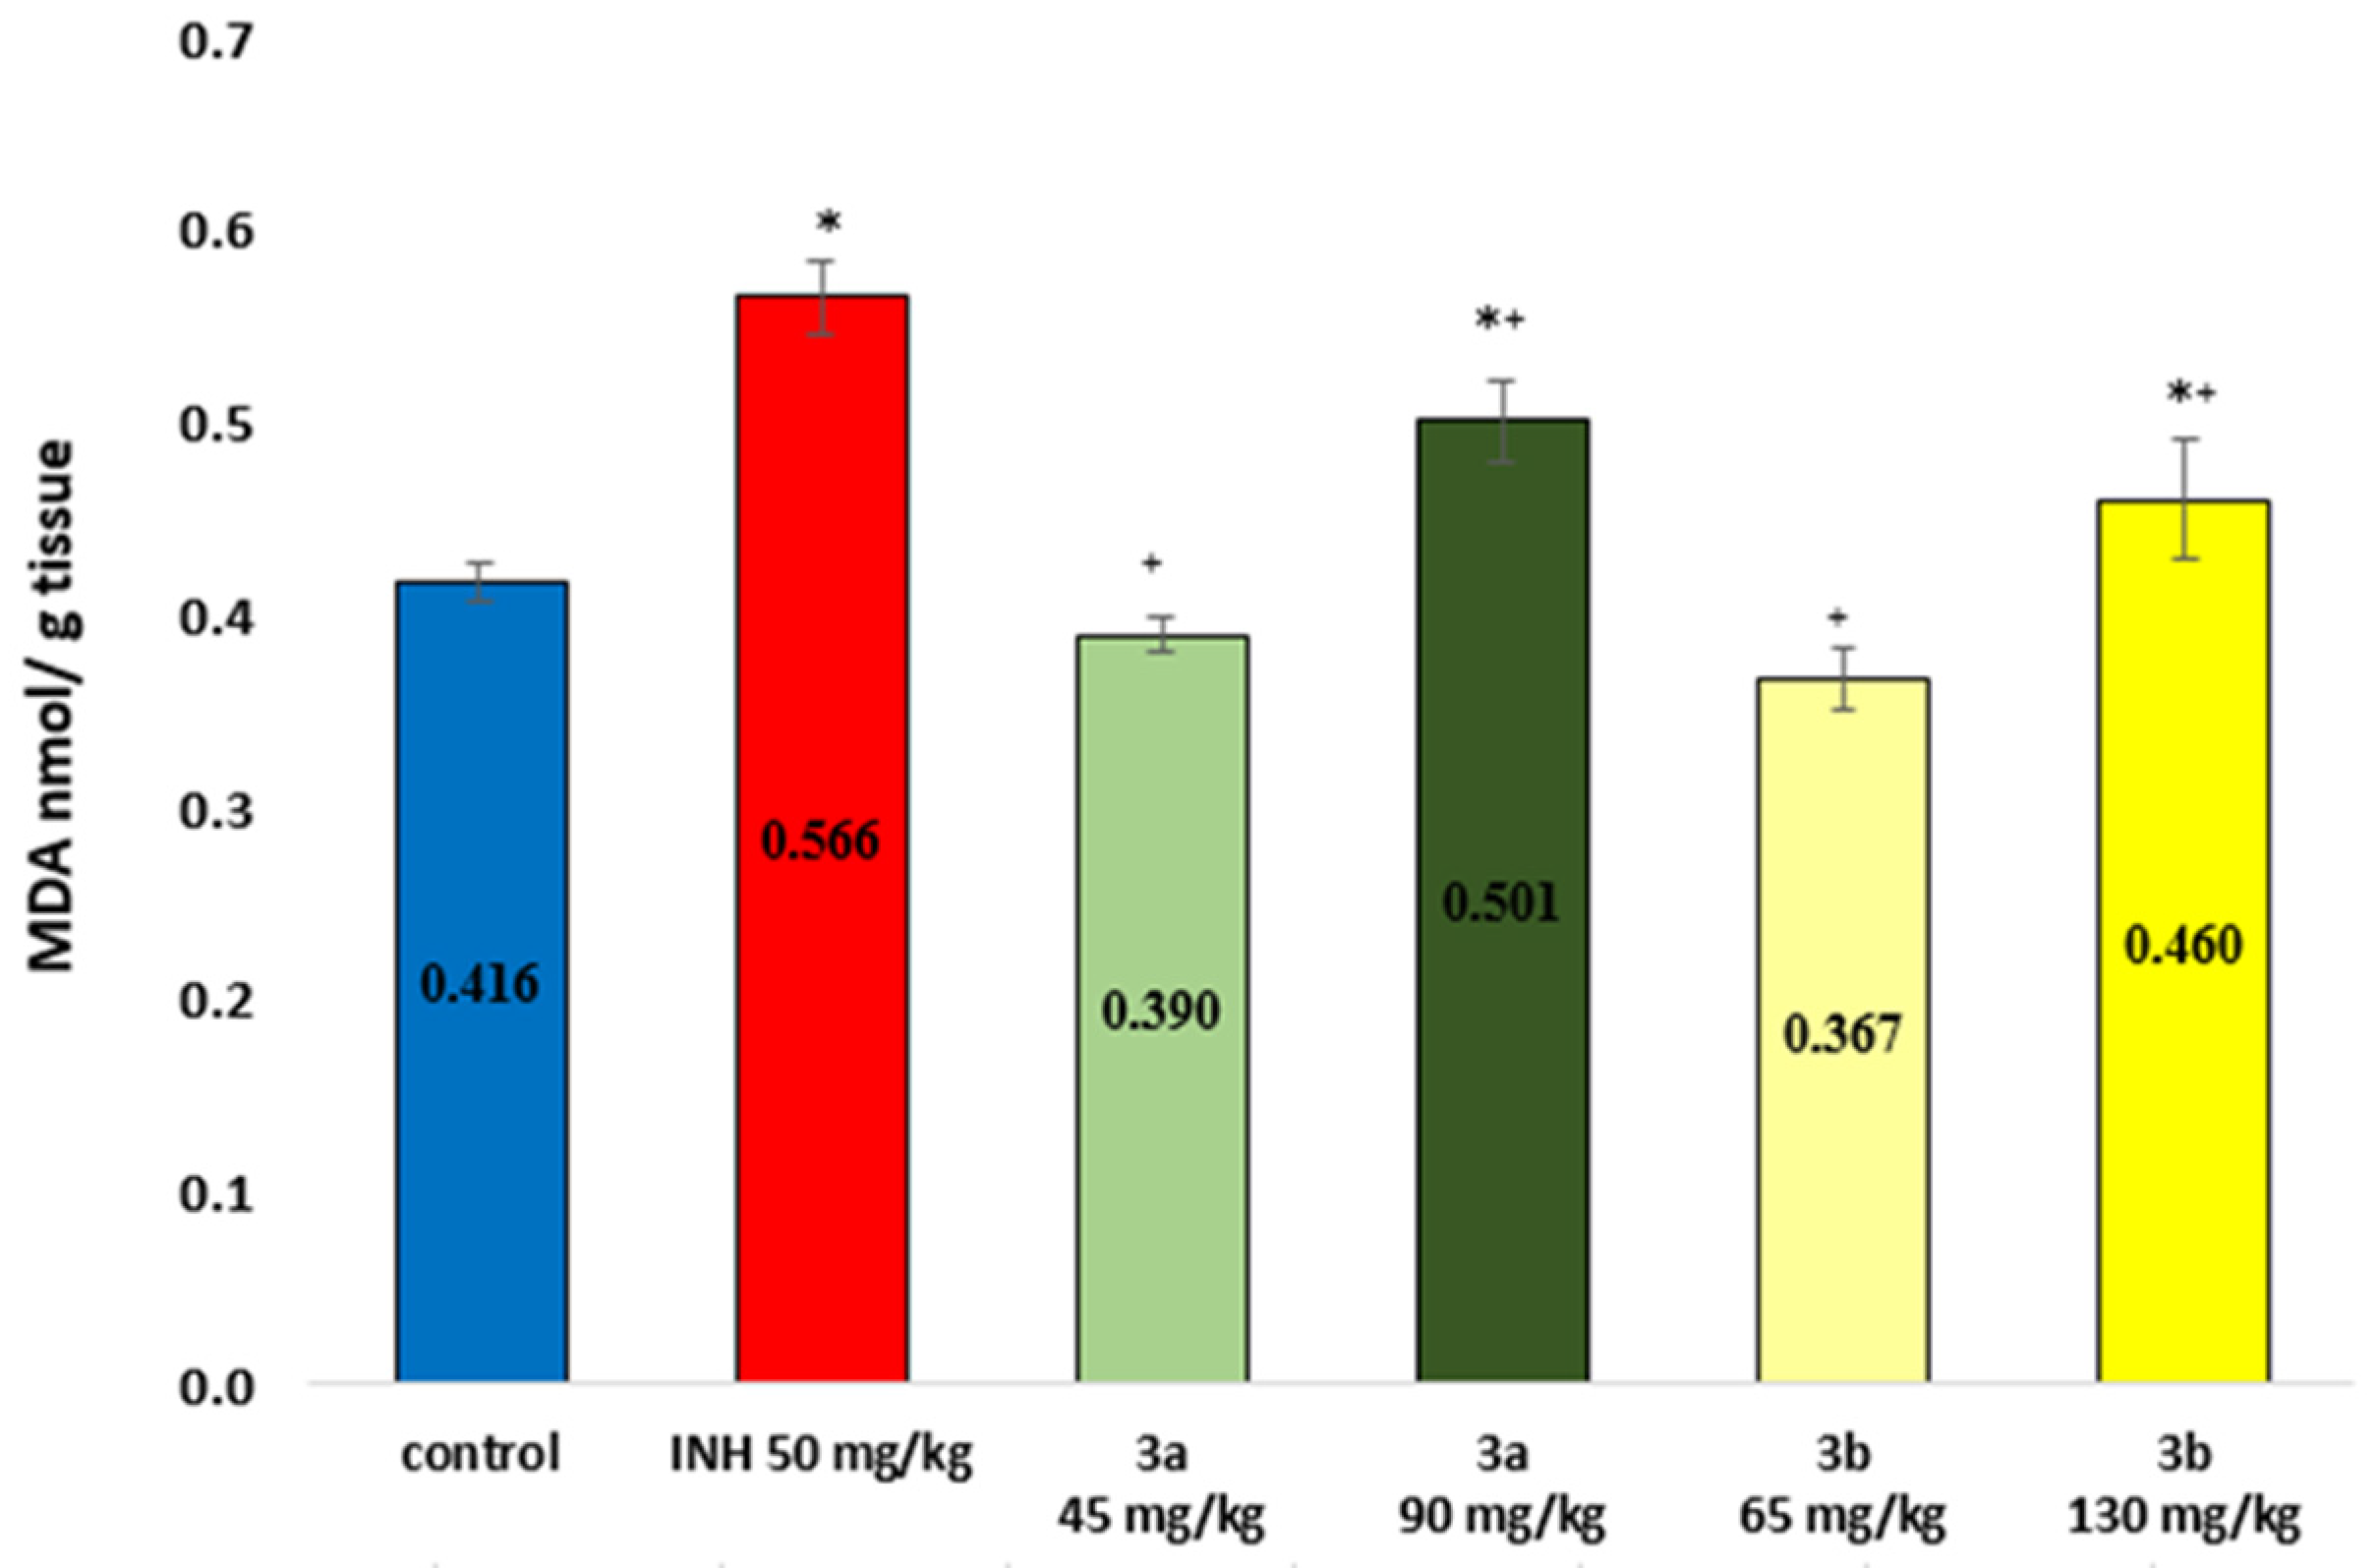
Figure 9.
Endogenous content of GSH in the liver homogenate of experimental groups. The significance of the data was assessed using the nonparametric Mann–Whitney U test. Results are presented as mean ± SD (n=6 for each compound and dose). **p≤ 0.01 vs control group; +p≤ 0.05 vs INH group
Figure 9.
Endogenous content of GSH in the liver homogenate of experimental groups. The significance of the data was assessed using the nonparametric Mann–Whitney U test. Results are presented as mean ± SD (n=6 for each compound and dose). **p≤ 0.01 vs control group; +p≤ 0.05 vs INH group
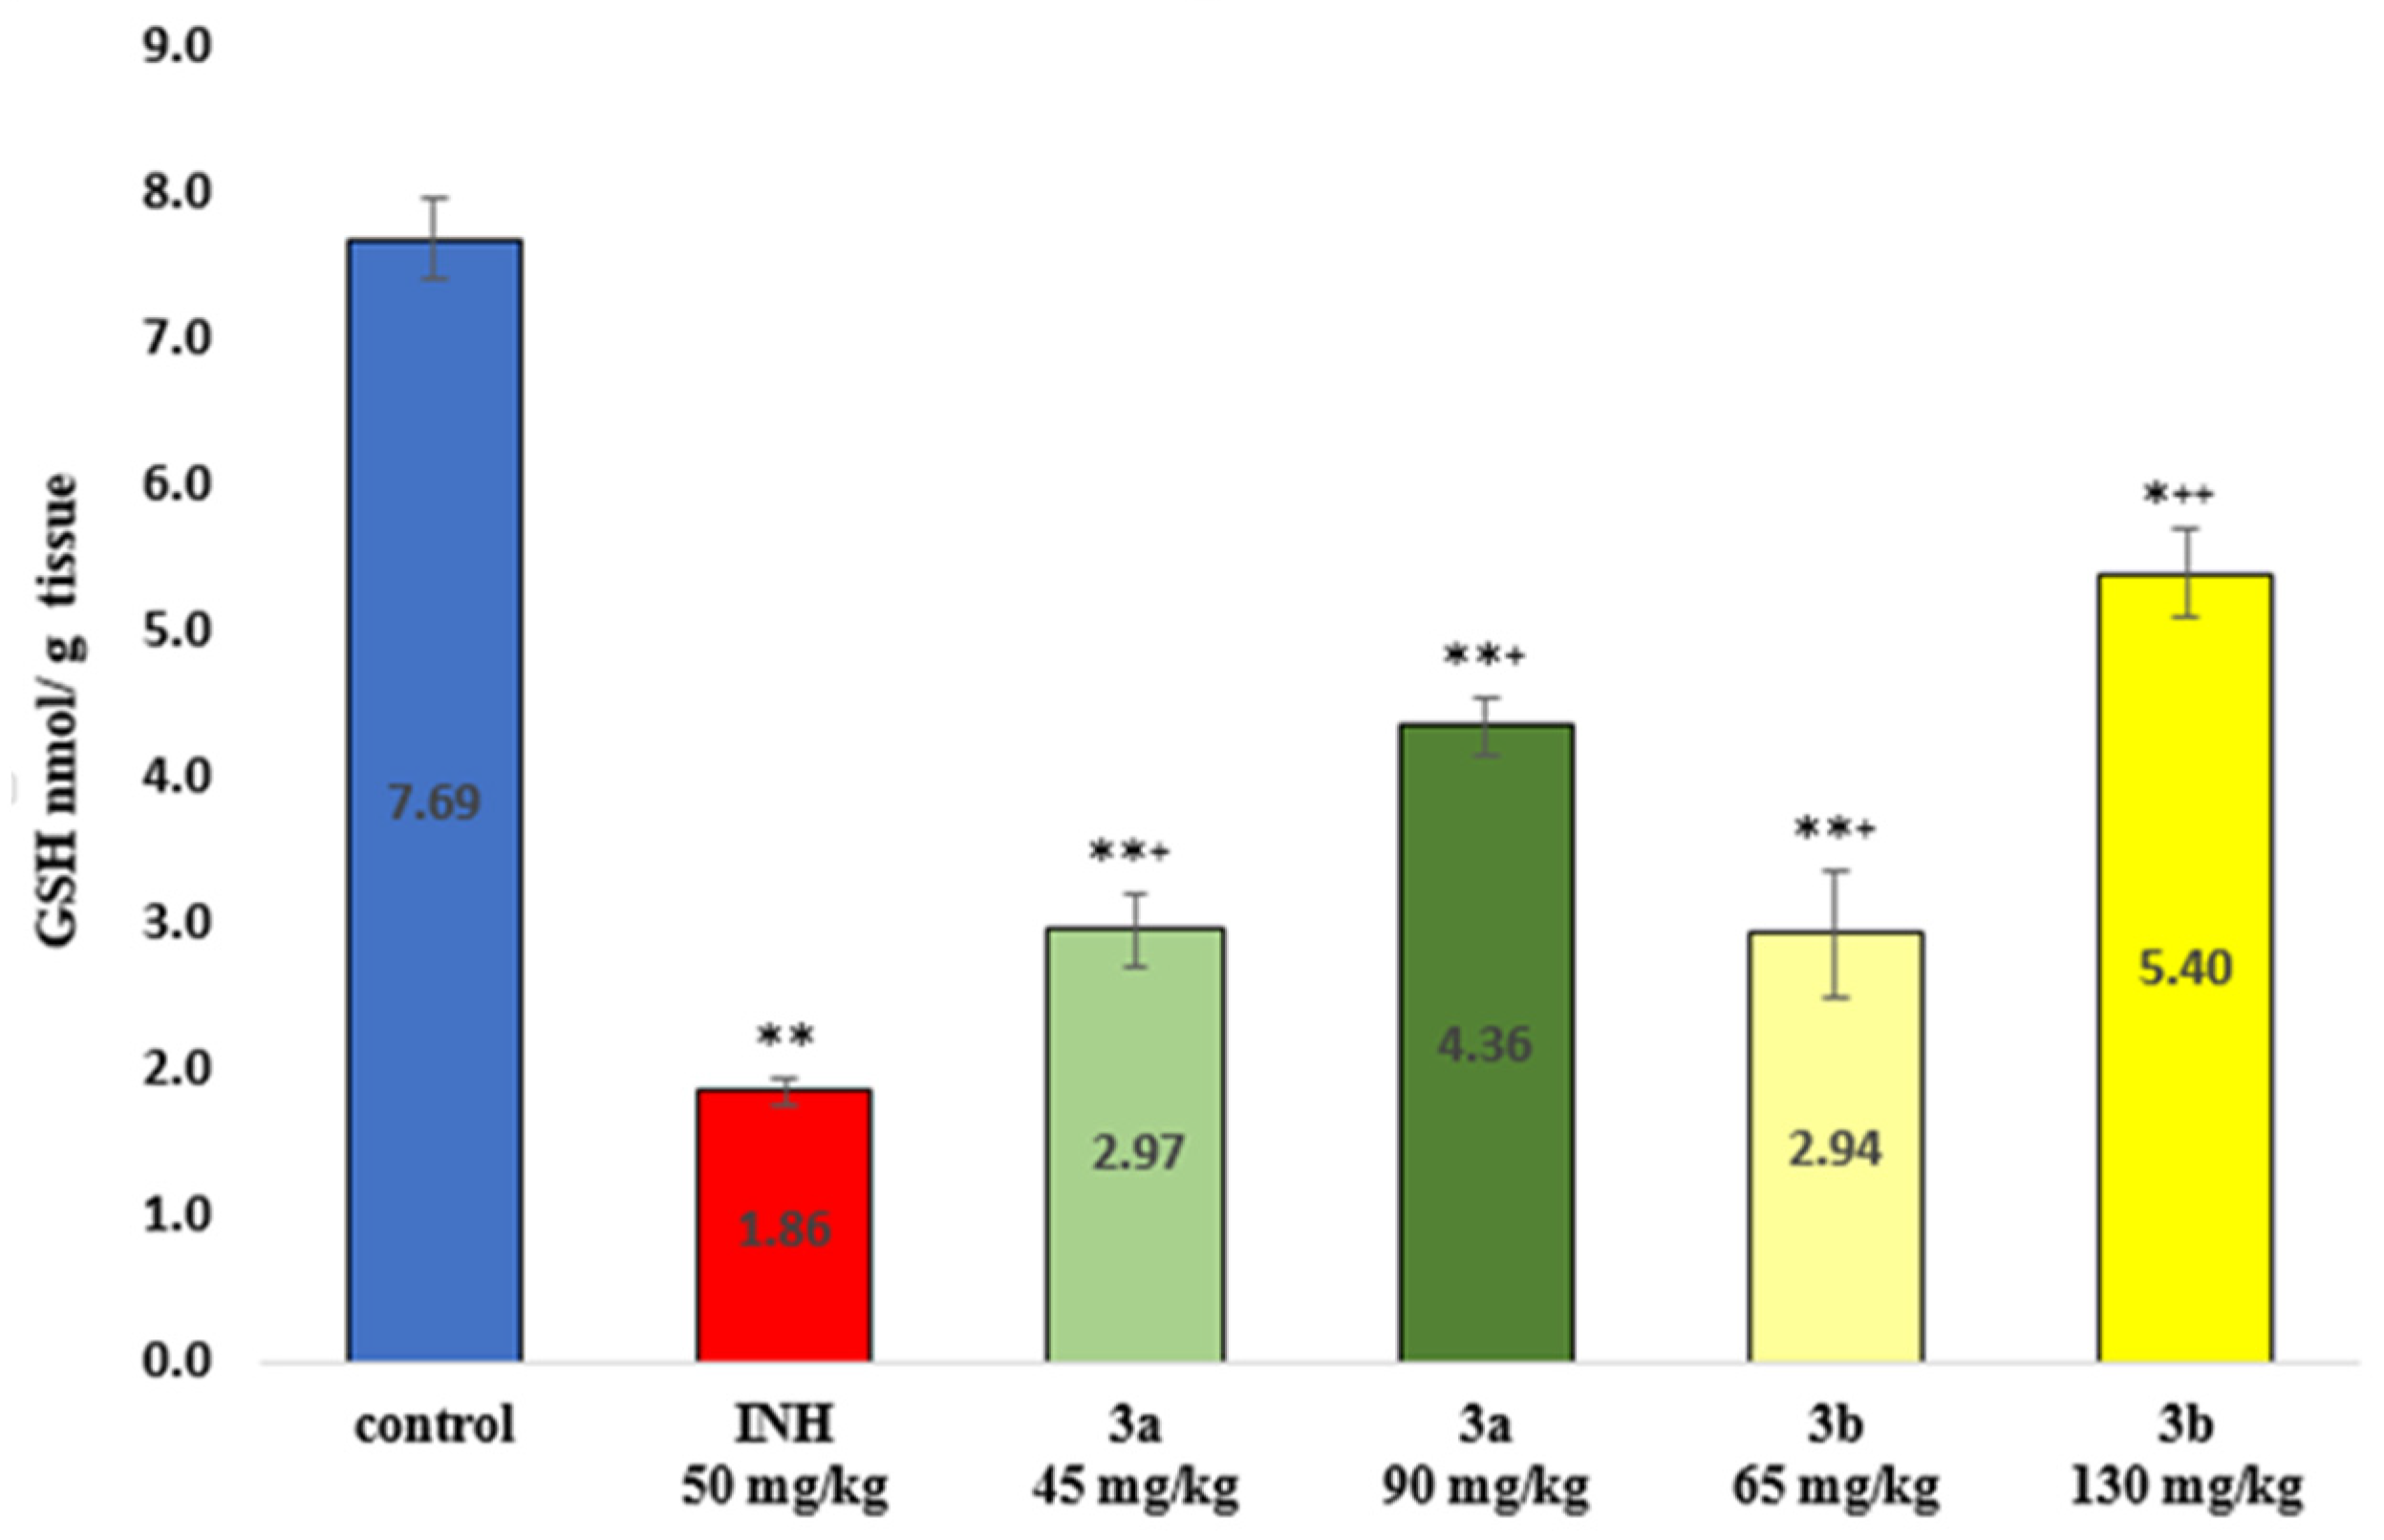
Figure 10.
Activity of catalase enzyme in the liver homogenate of experimental groups after sub-acute toxicity study. The significance of the data was assessed using the nonparametric Mann–Whitney U test. Results are presented as mean ± SD (n=6 for each compound and dose). **p≤ 0.01 vs control group; +p≤ 0.05 vs INH group.
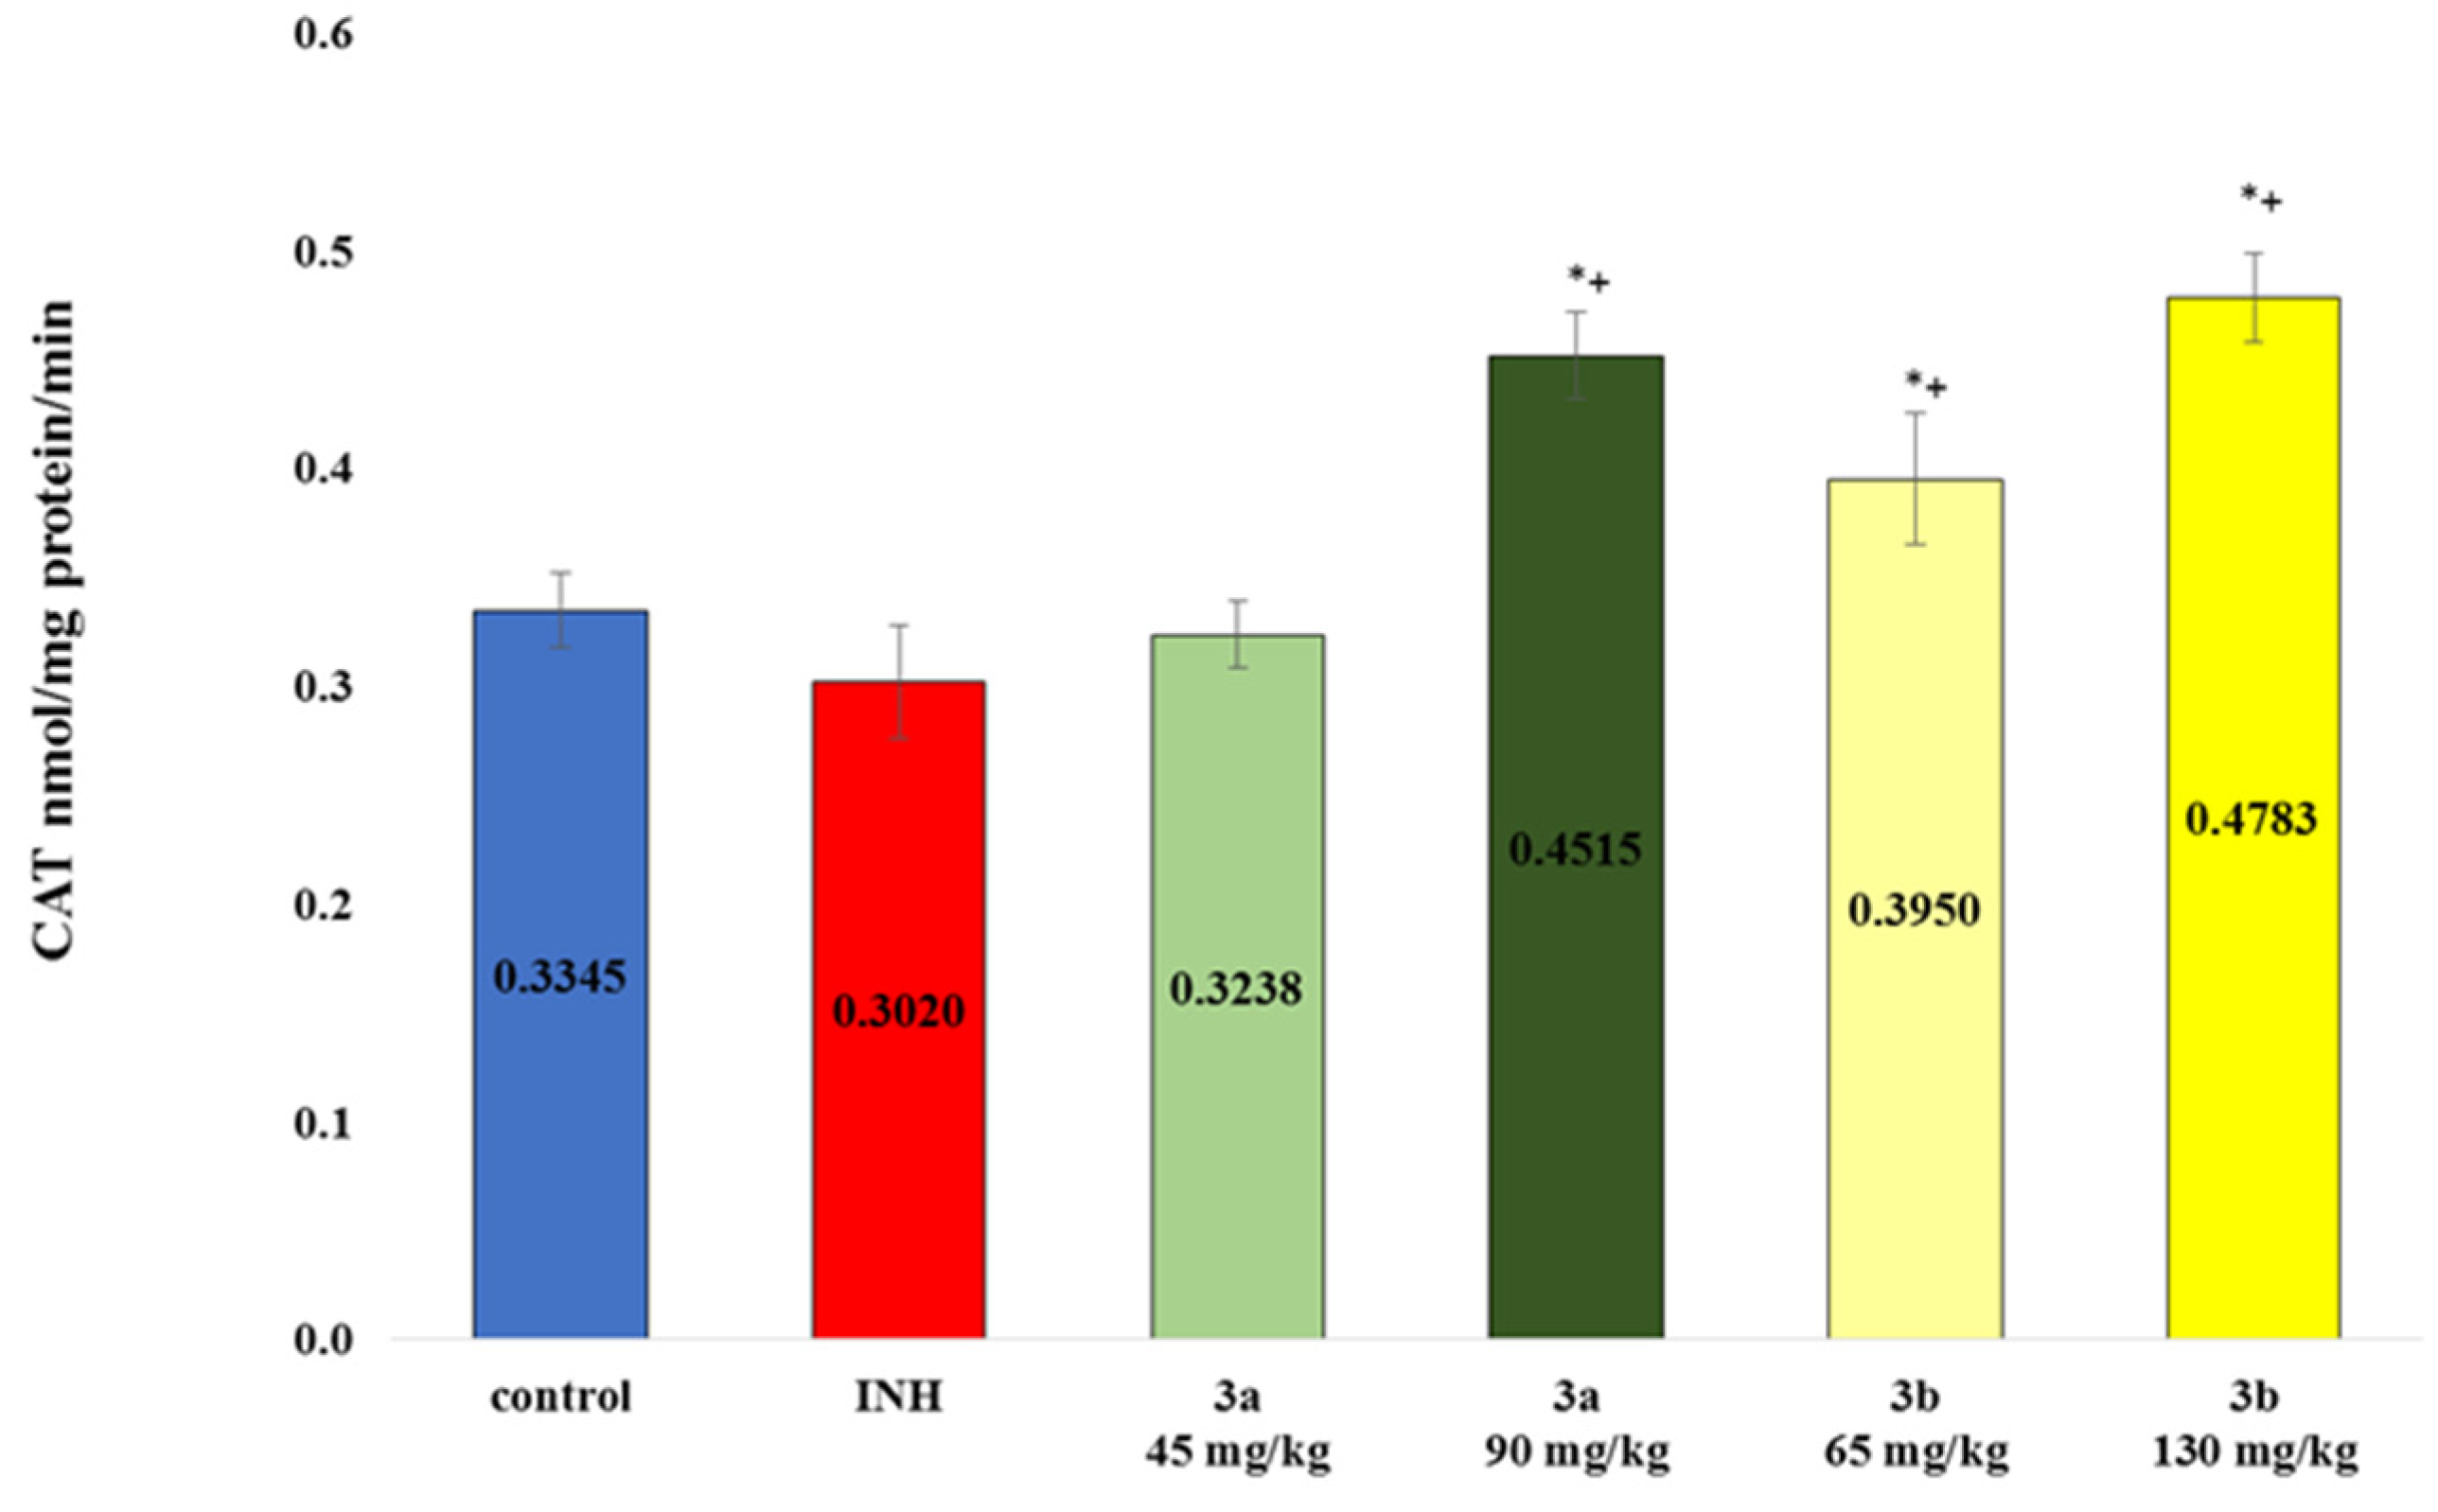
Figure 11.
Pathomorphological findings in the kidney in mice after intraperitoneal administration of INH and investigated compounds. Legend: a) control group – not treated; b) INH 50mg/kg; c) 3a 45 mg/kg; d) 3a 90 mg/kg; e) 3b 65 mg/kg; f) 3b 130 mg/kg b.w. The field magnification is 100x.
Figure 11.
Pathomorphological findings in the kidney in mice after intraperitoneal administration of INH and investigated compounds. Legend: a) control group – not treated; b) INH 50mg/kg; c) 3a 45 mg/kg; d) 3a 90 mg/kg; e) 3b 65 mg/kg; f) 3b 130 mg/kg b.w. The field magnification is 100x.
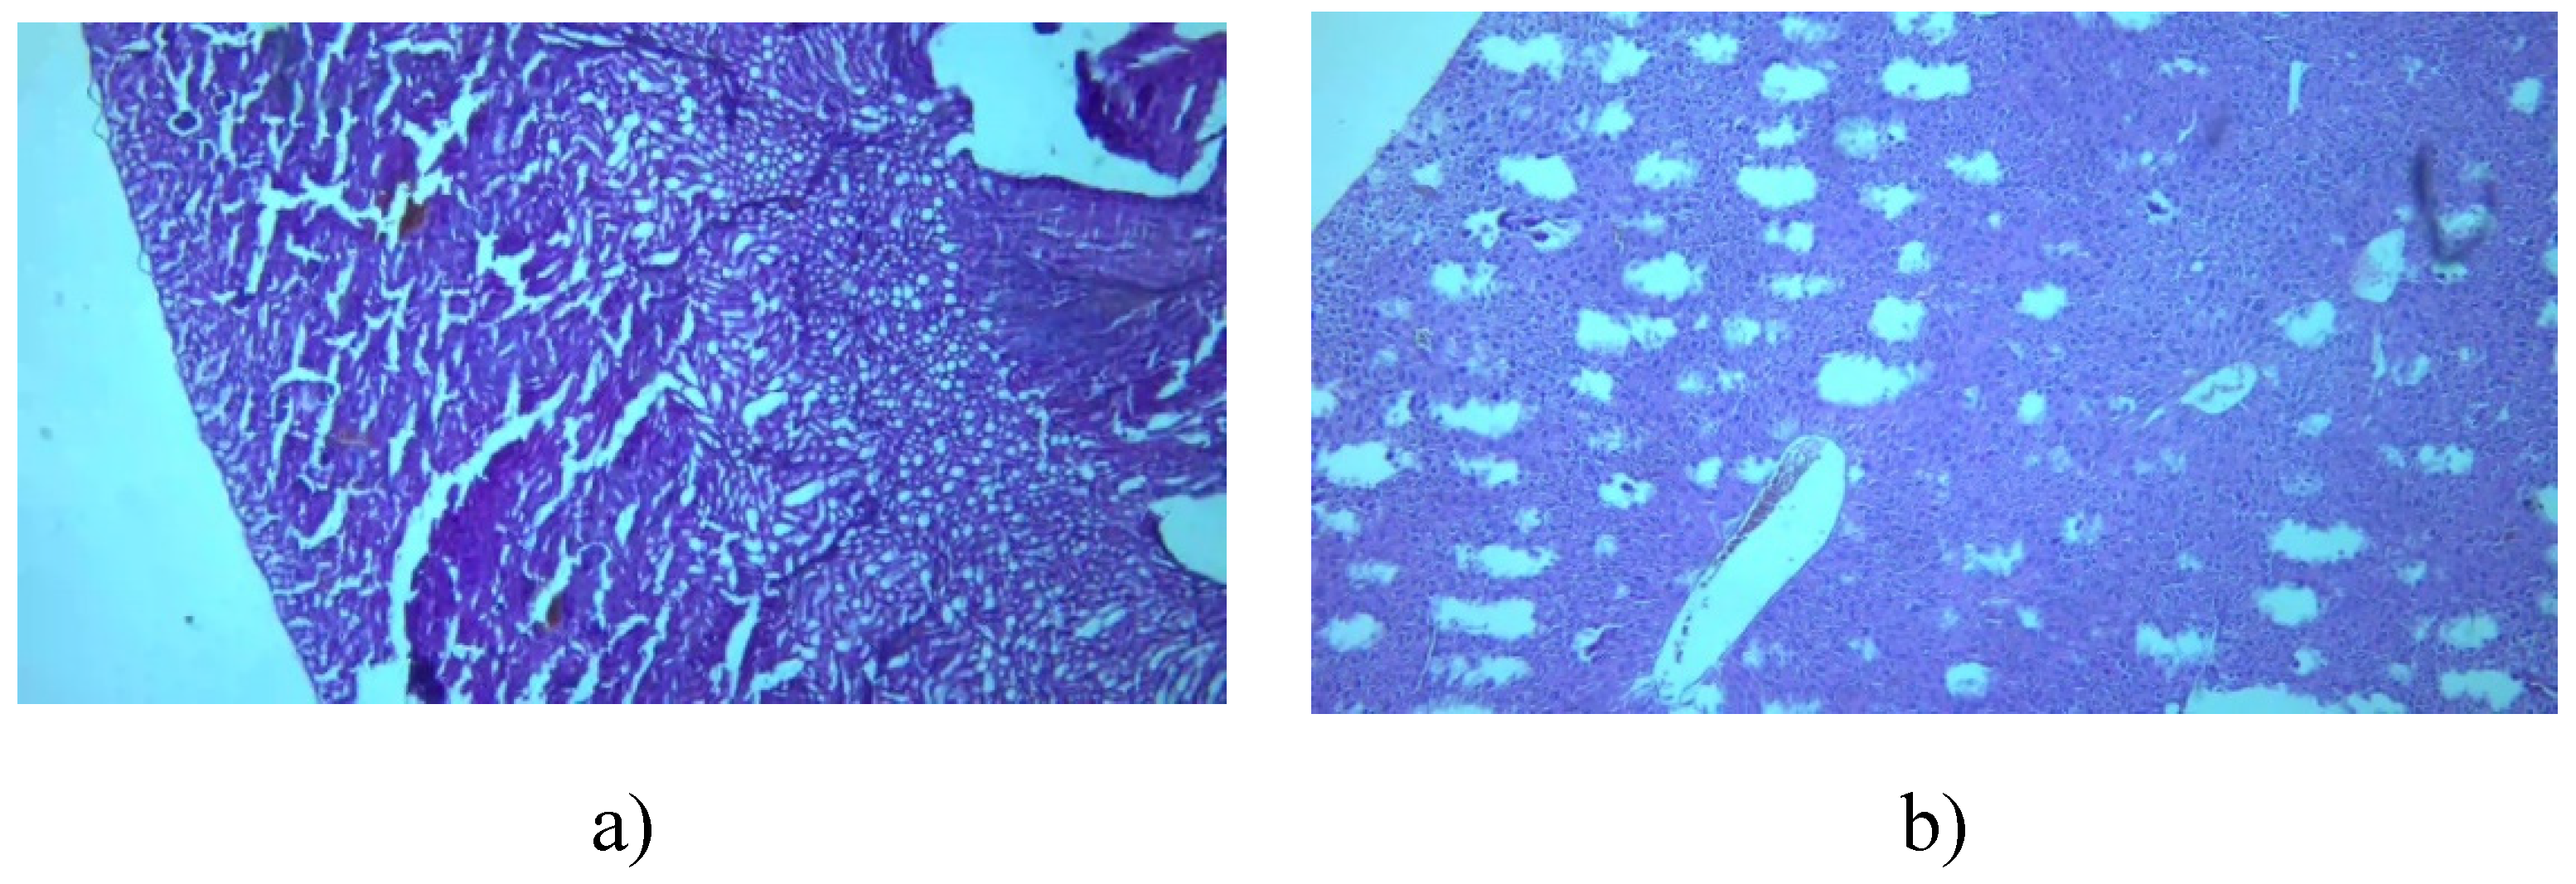
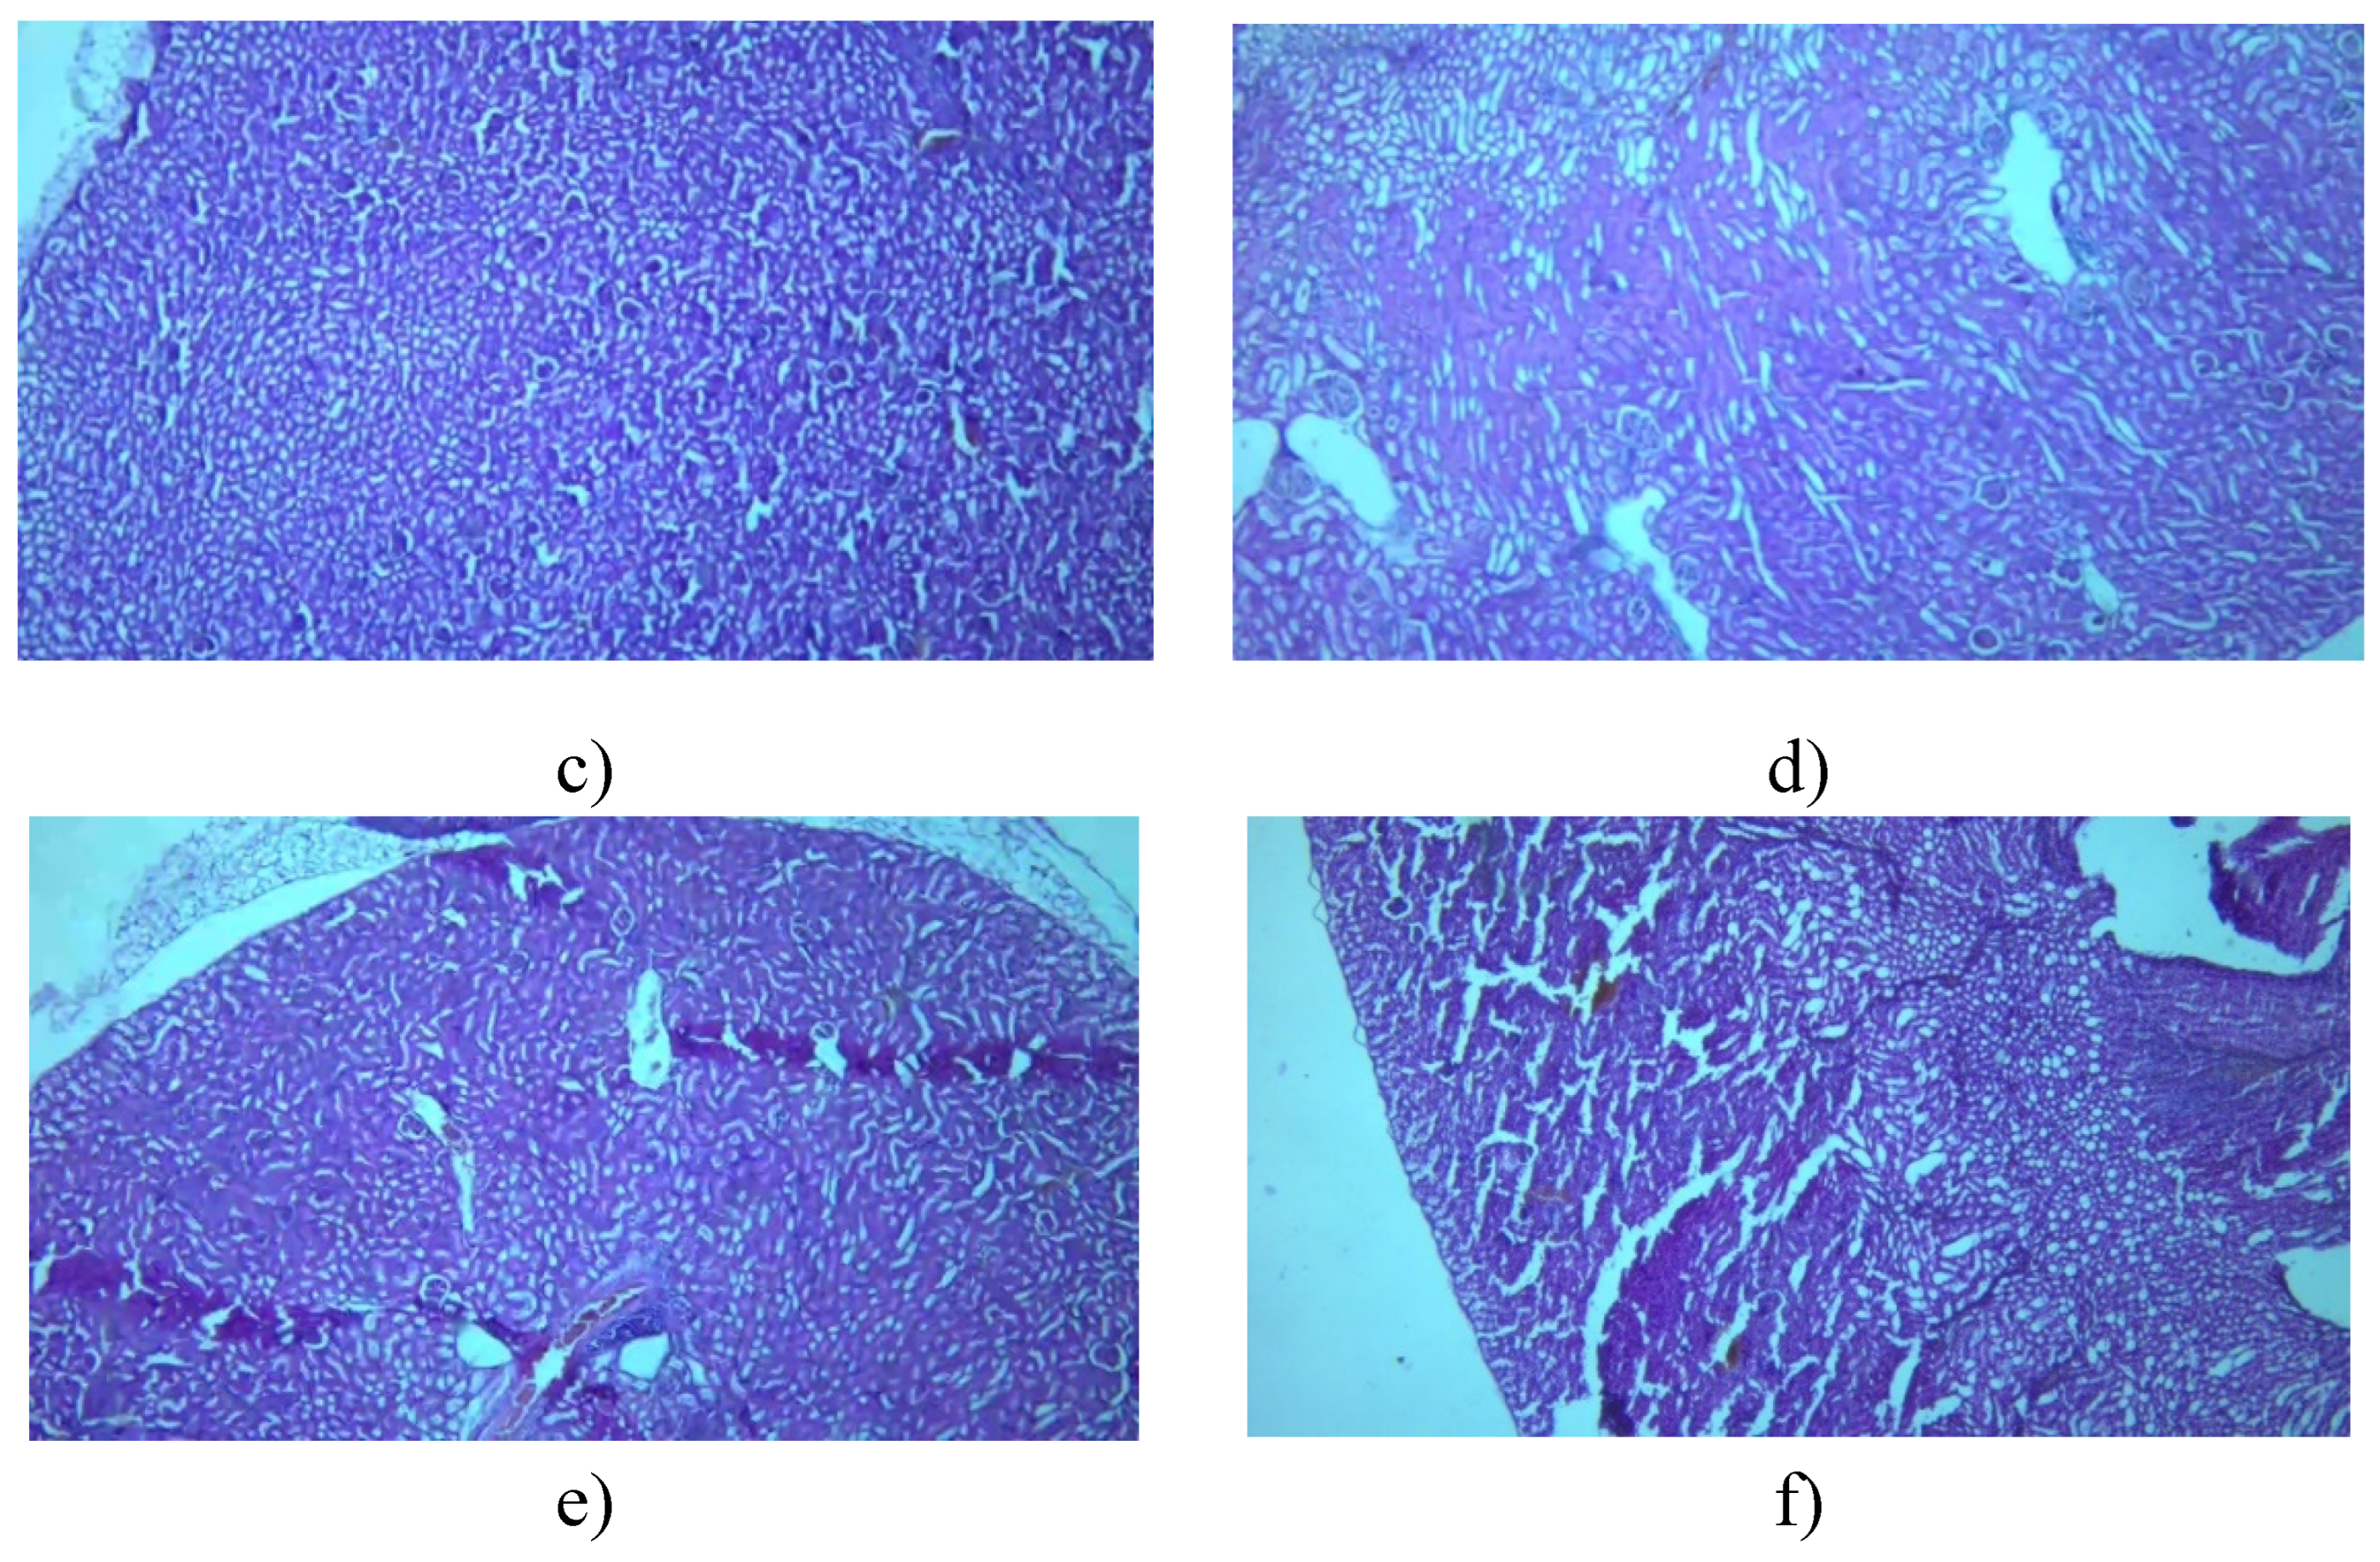
Figure 12.
Pathomorphological findings in the liver in mice after intraperitoneal administration of INH and investigated compounds. Legend: a) control group – not treated; b) INH 50mg/kg; c) 3a 45 mg/kg; d) 3a 90 mg/kg; e) 3b 65 mg/kg; f) 3b 130 mg/kg. The field magnification is 100x.
Figure 12.
Pathomorphological findings in the liver in mice after intraperitoneal administration of INH and investigated compounds. Legend: a) control group – not treated; b) INH 50mg/kg; c) 3a 45 mg/kg; d) 3a 90 mg/kg; e) 3b 65 mg/kg; f) 3b 130 mg/kg. The field magnification is 100x.
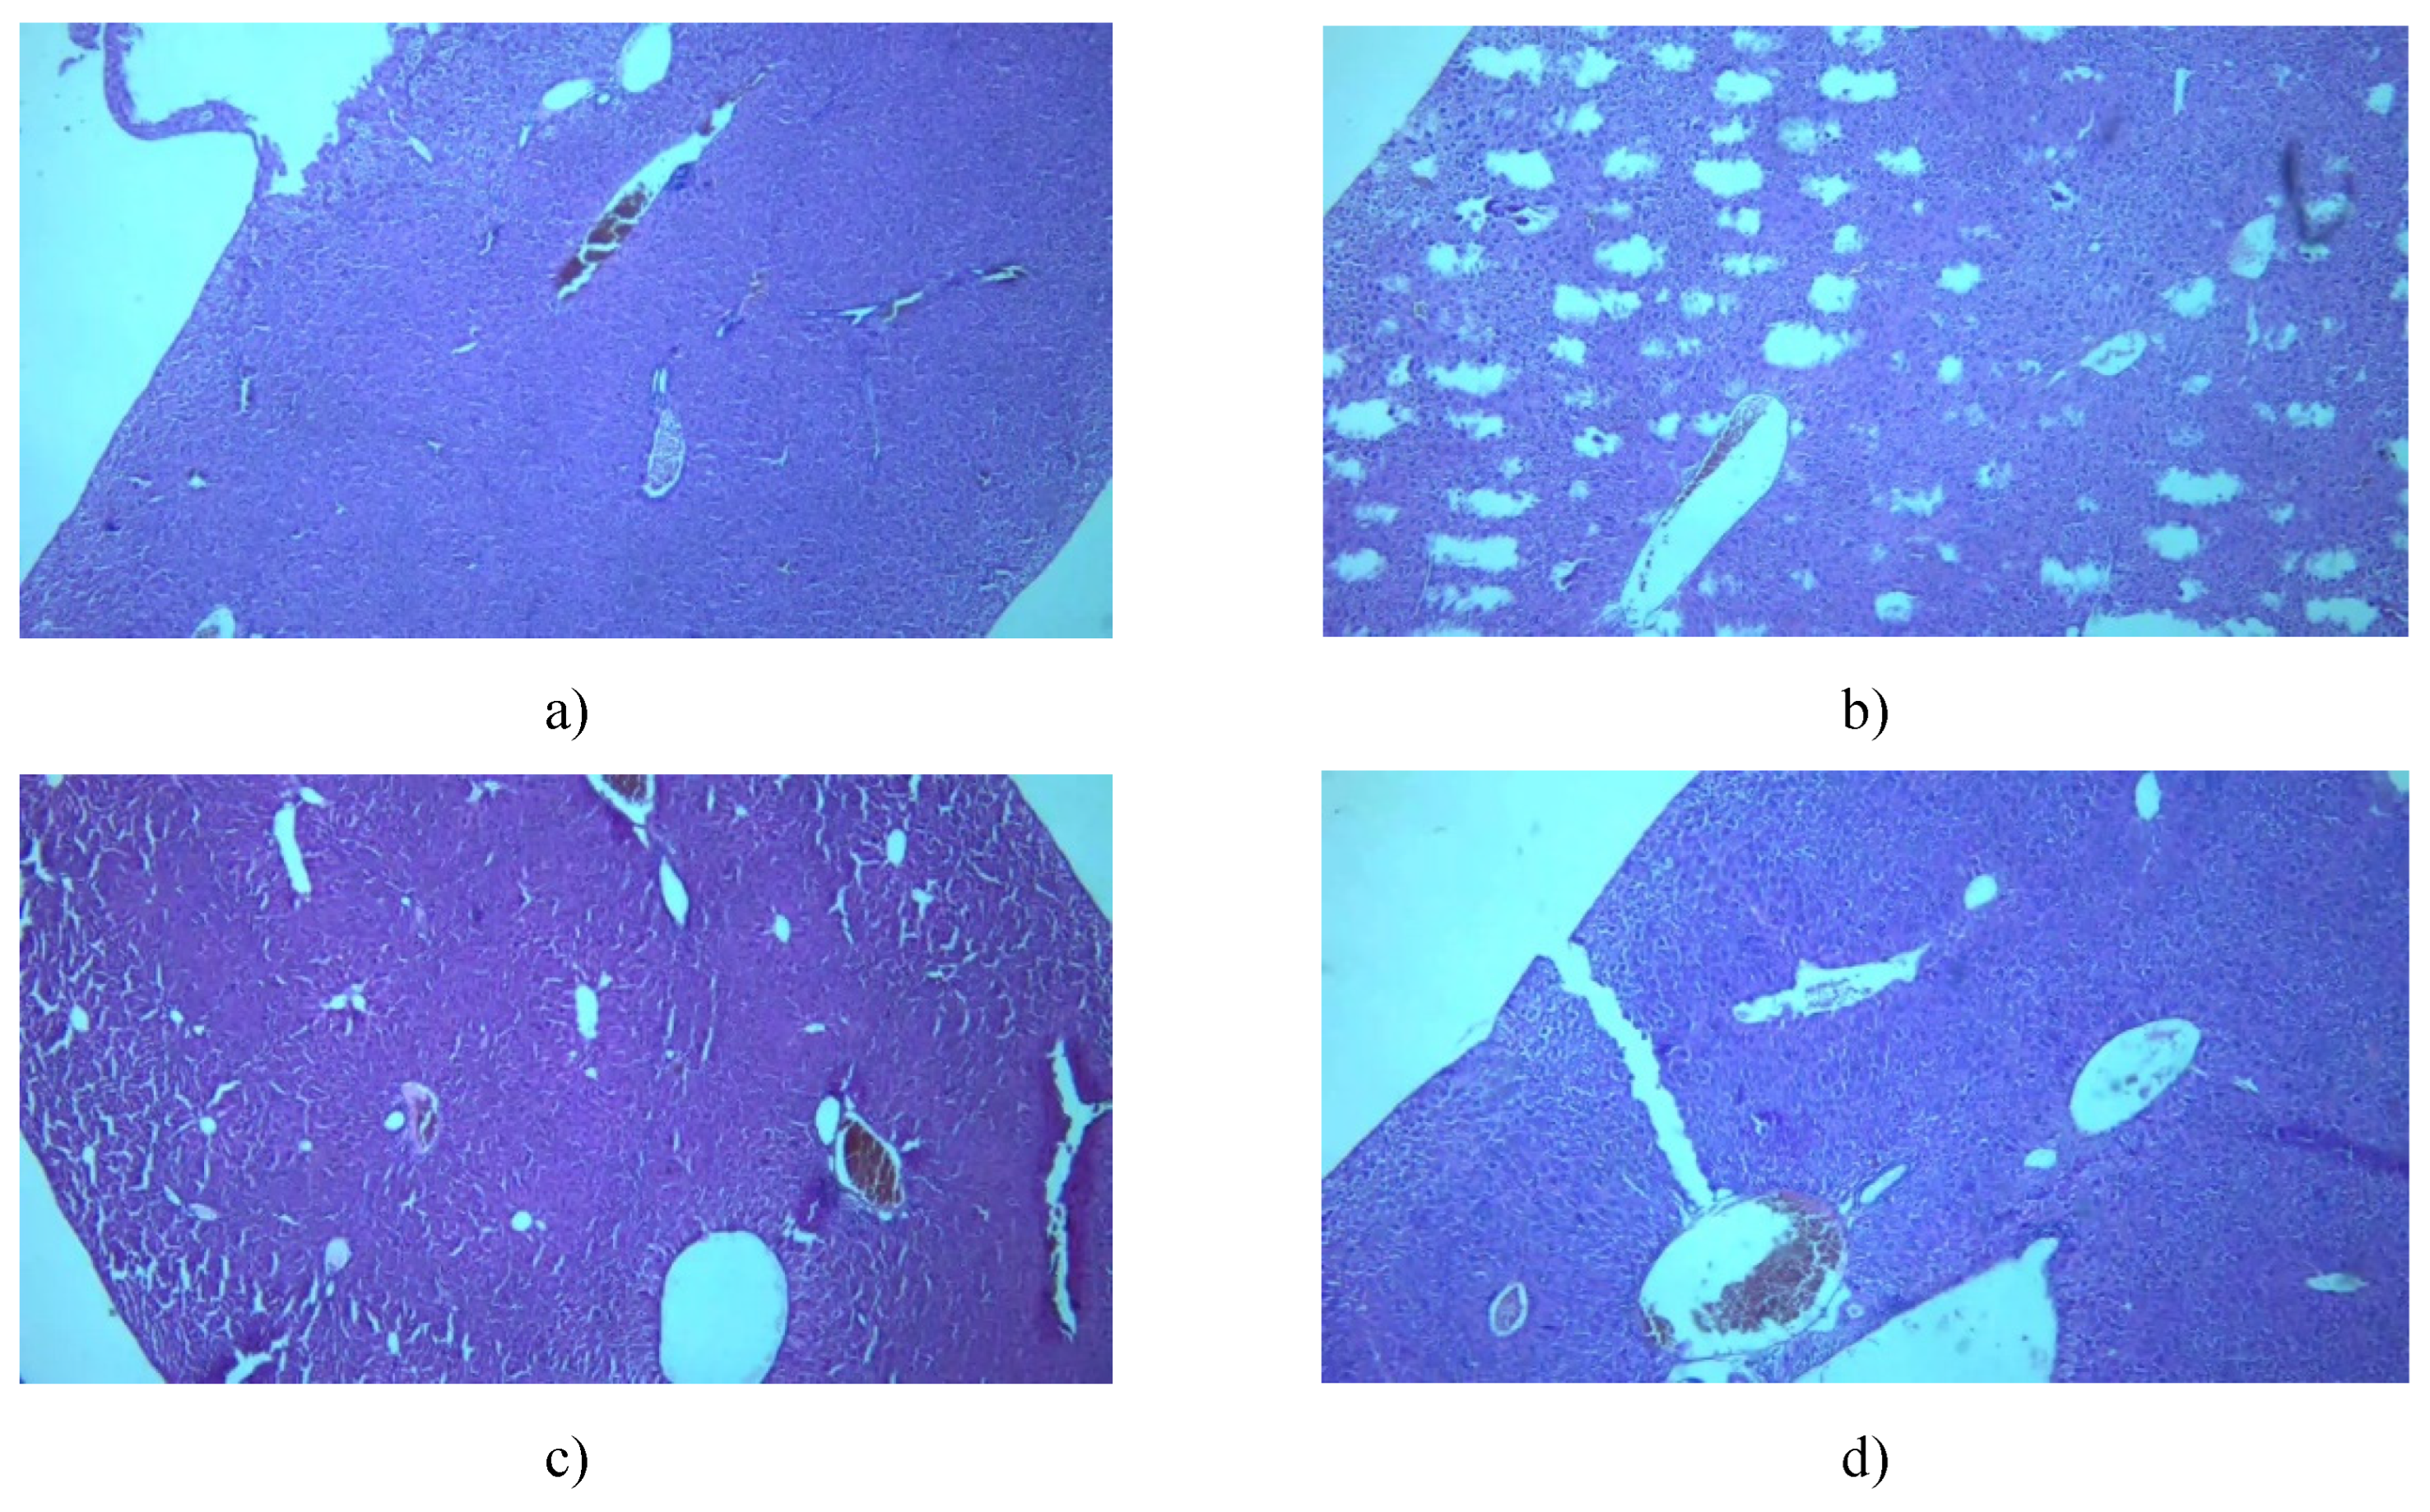
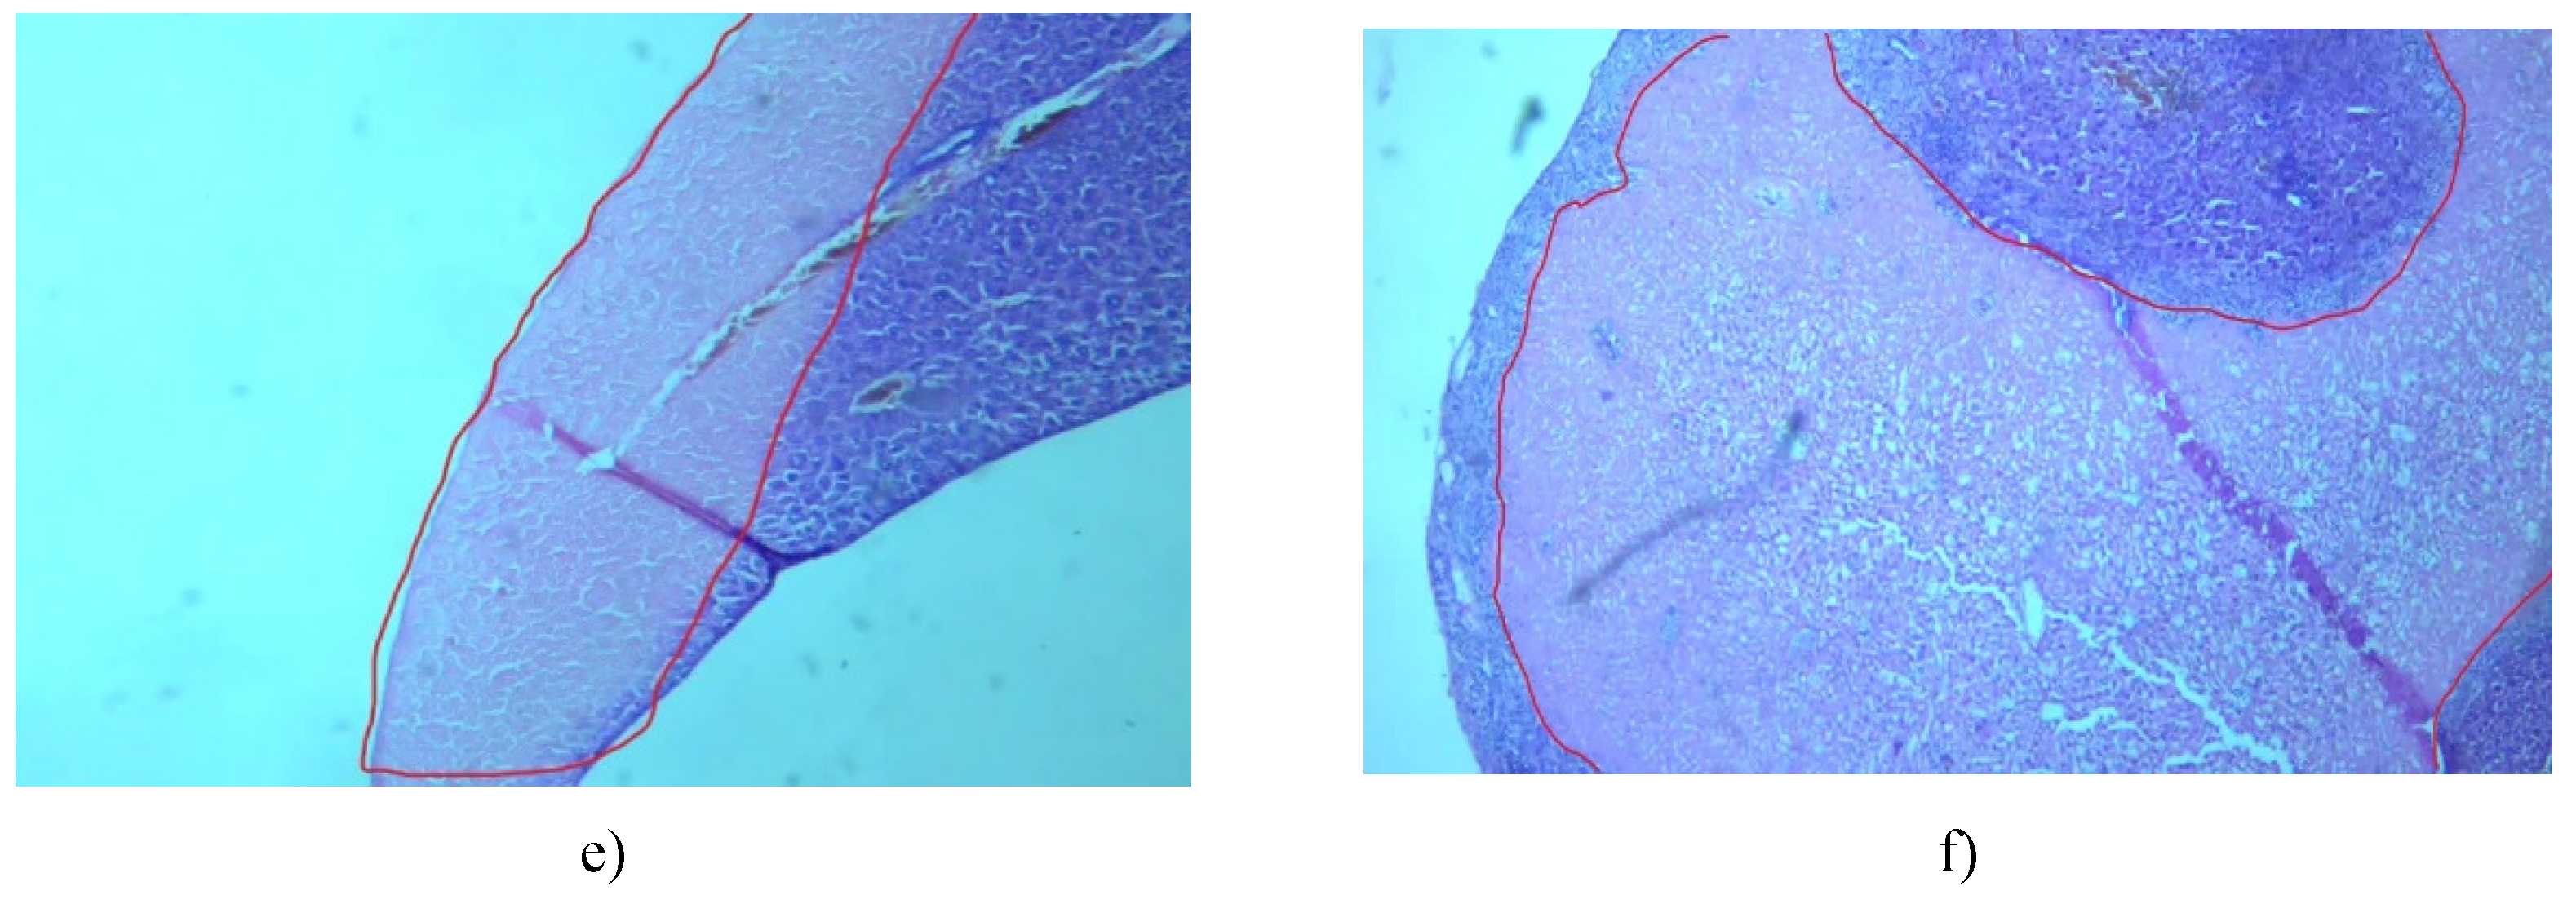

Table 2.
Acute intraperitoneal toxicity of 3a.
| Dose mg/kg b.w. | Effect/Lethality | Time of occurrence | Symptoms |
|---|---|---|---|
| 1500 | 2/3 (66%) | After 24h | Delayed reflexes, somnolence, lethal outcome |
| 1000 | 1/3 (33%) | After 7 days | Impaired coordination, rapid breathing, lethal outcome |
| 750 | 0/3 | - | - |
| 500 | 0/3 | - | - |
| 250 | 0/3 | - | - |
Table 3.
Acute intraperitoneal toxicity of 3b.
| Dose mg/kg b.w. | Effect/Lethality | Time of occurrence | Symptoms |
|---|---|---|---|
| 1500 | 3/3 (100%) | After 24h | Respiratory failure with long pauses, ataxia, piloerection, seizures, lethal outcome. |
| 1000 | 0/3 | - | - |
| 750 | 0/3 | - | - |
| 500 | 0/3 | - | - |
| 250 | 0/3 | - | - |
Table 4.
InhA inhibition capacity of the two investigated compounds in each of their concentrations.
Table 4.
InhA inhibition capacity of the two investigated compounds in each of their concentrations.
| Compound | Concentration (µM) | % inhibition of InhA |
|---|---|---|
| 3a | 1 | 35.2 |
| 10 | 54.1 | |
| 25 | 52.9 | |
| 50 | 64.7 | |
| 100 | 82.3 | |
| 3b | 1 | 29.3 |
| 10 | 54.1 | |
| 25 | 58.8 | |
| 50 | 64.7 | |
| 100 | 58.8 | |
| Triclosan | 100 | 82.3 |
Disclaimer/Publisher’s Note: The statements, opinions and data contained in all publications are solely those of the individual author(s) and contributor(s) and not of MDPI and/or the editor(s). MDPI and/or the editor(s) disclaim responsibility for any injury to people or property resulting from any ideas, methods, instructions or products referred to in the content. |
© 2024 by the authors. Licensee MDPI, Basel, Switzerland. This article is an open access article distributed under the terms and conditions of the Creative Commons Attribution (CC BY) license (https://creativecommons.org/licenses/by/4.0/).
Copyright: This open access article is published under a Creative Commons CC BY 4.0 license, which permit the free download, distribution, and reuse, provided that the author and preprint are cited in any reuse.


