Preprint
Article

This version is not peer-reviewed.

Quaternary Evaporative Facies Interpretation by Seismic Sedimentology in Biogas-Bearing Sanhu Depression, Qaidam Basin, NW China

A peer-reviewed article of this preprint also exists.

Submitted:

04 January 2025

Posted:

07 January 2025

You are already at the latest version

Abstract

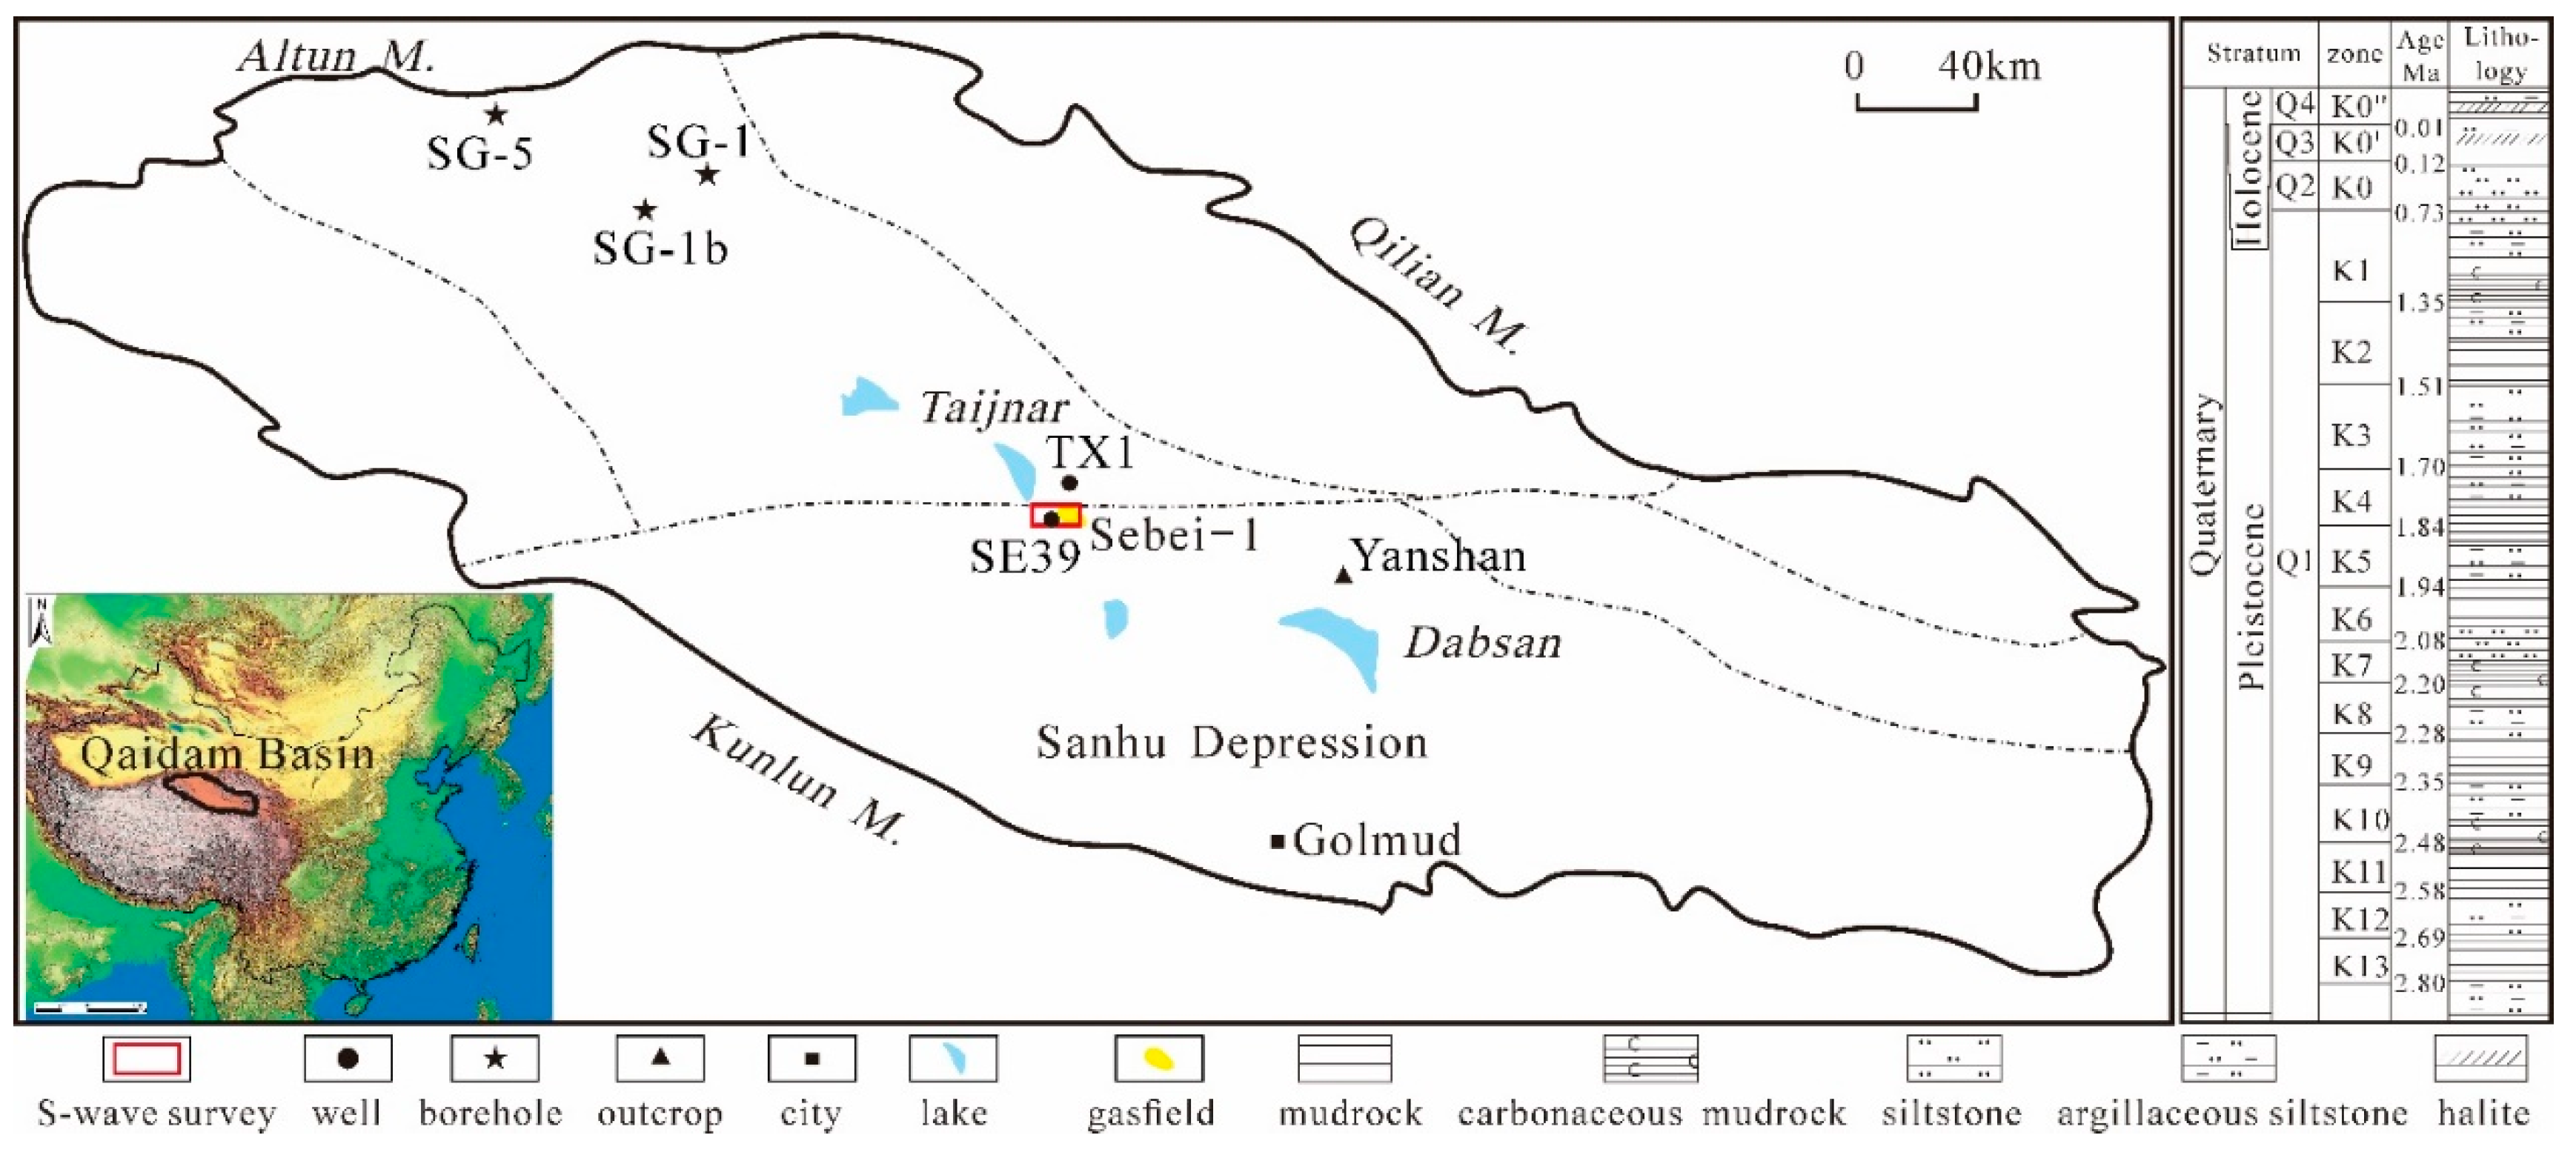
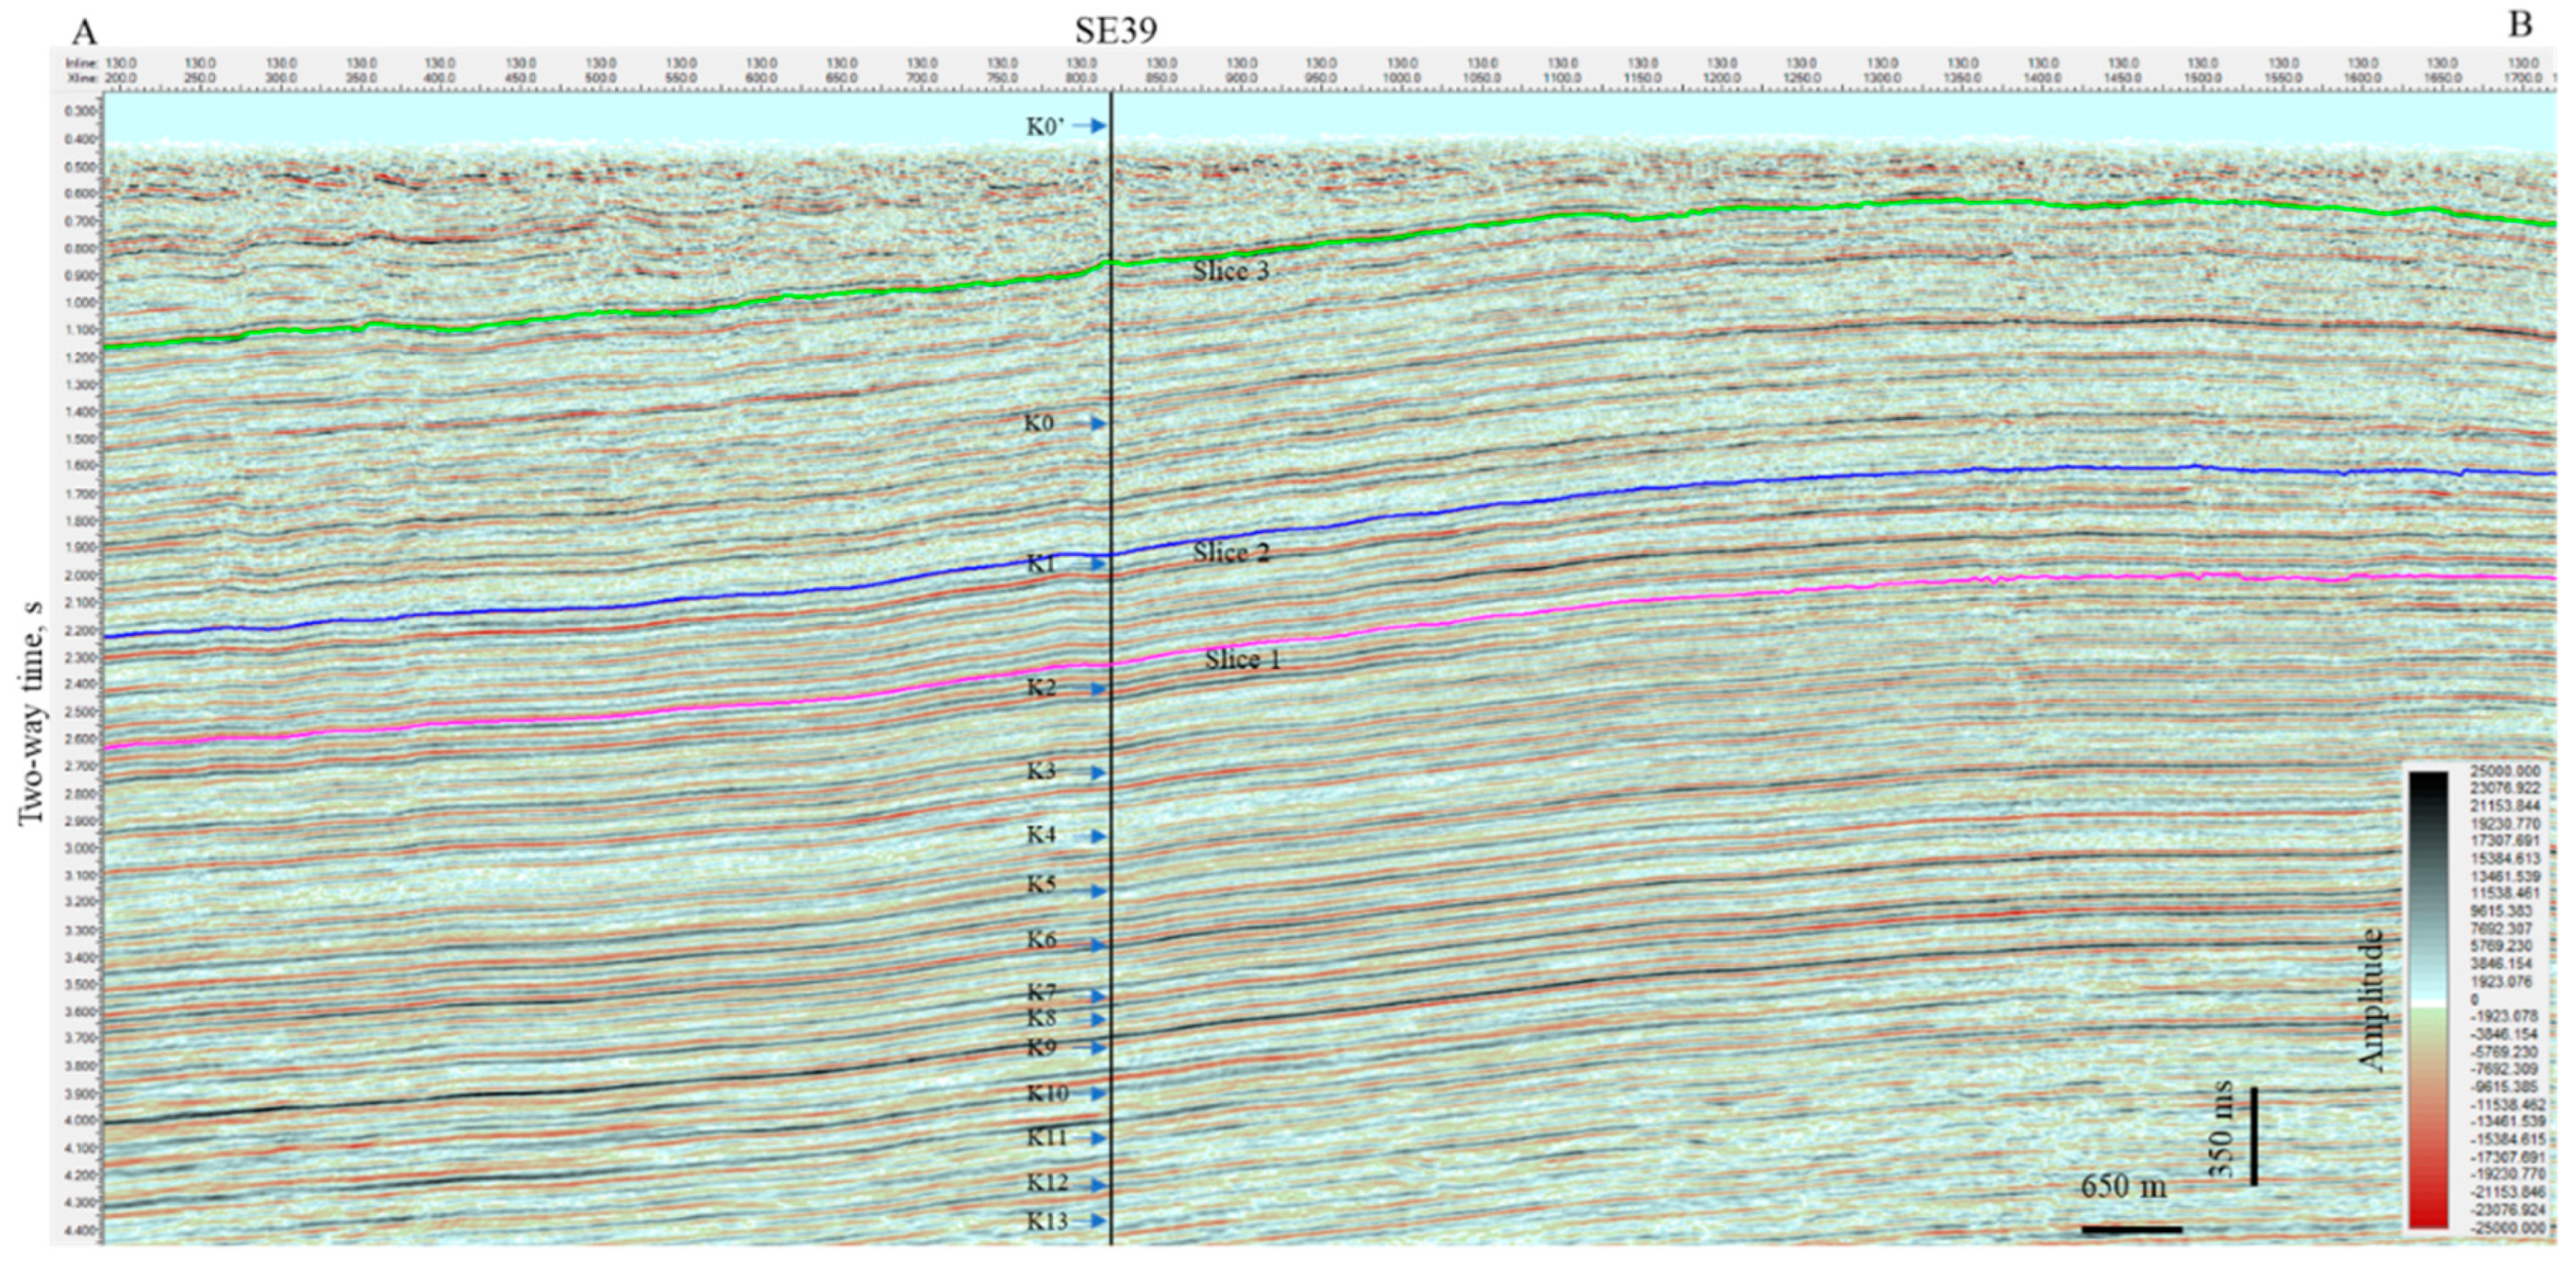
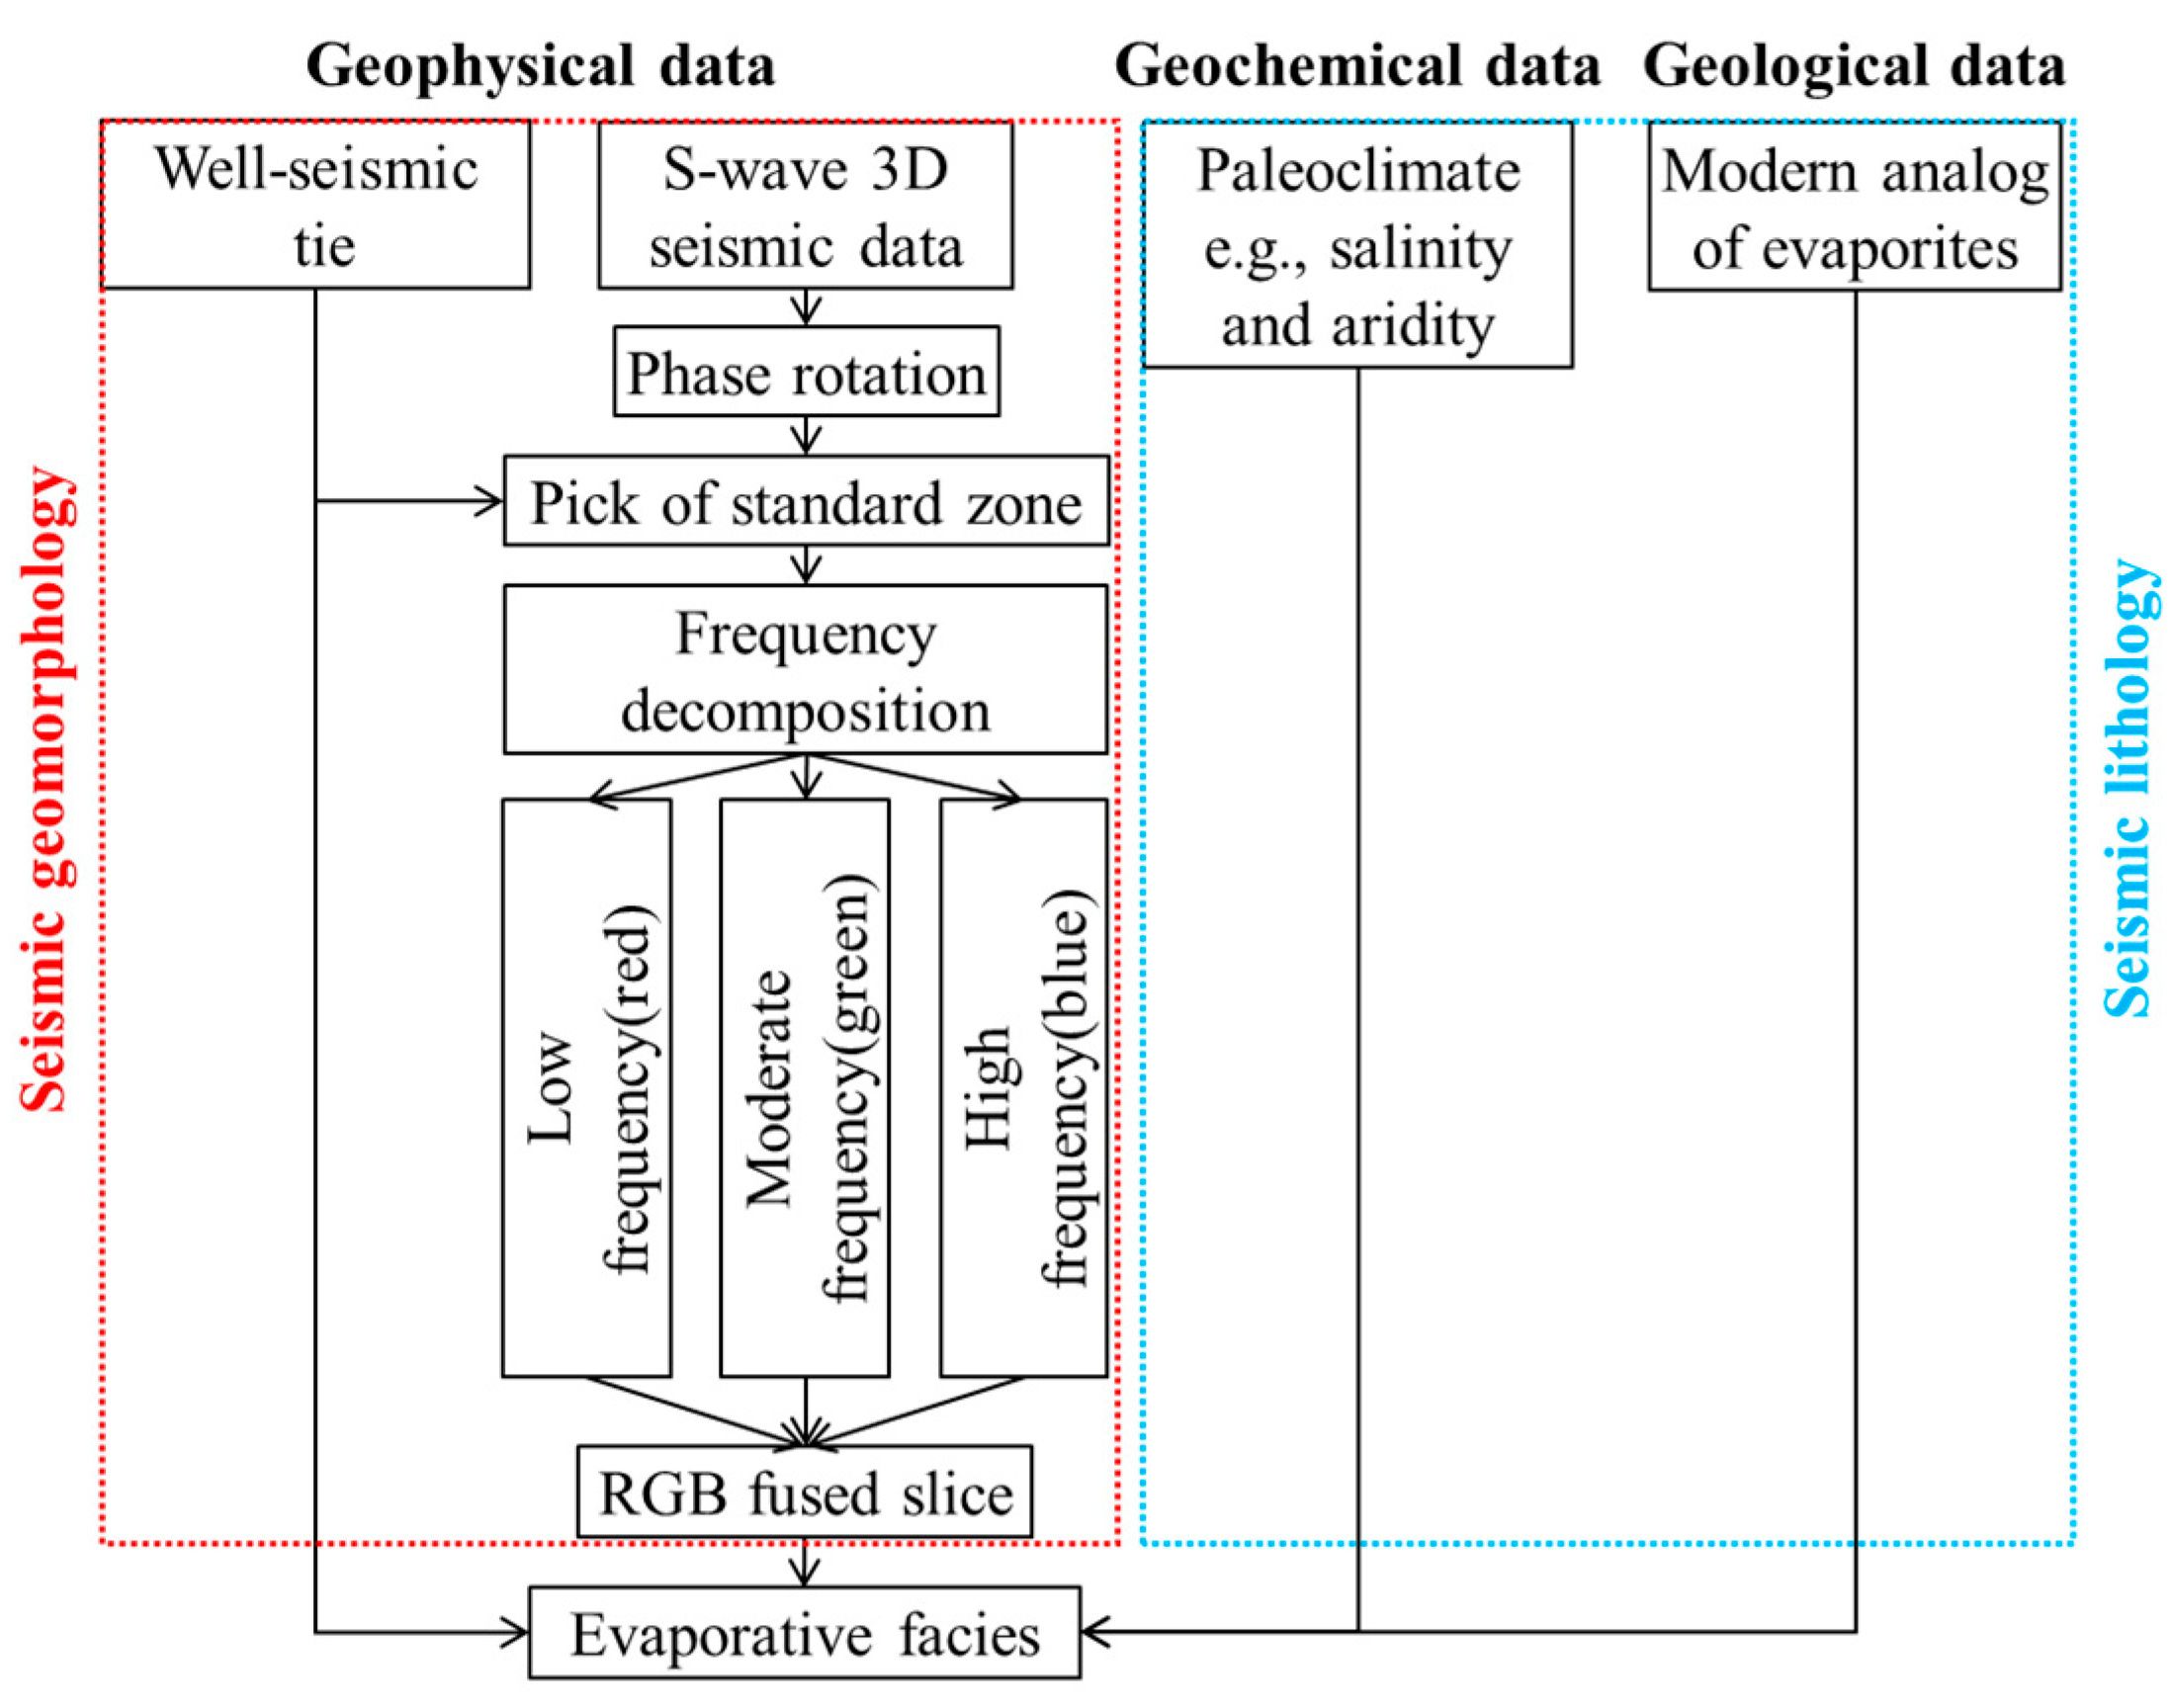
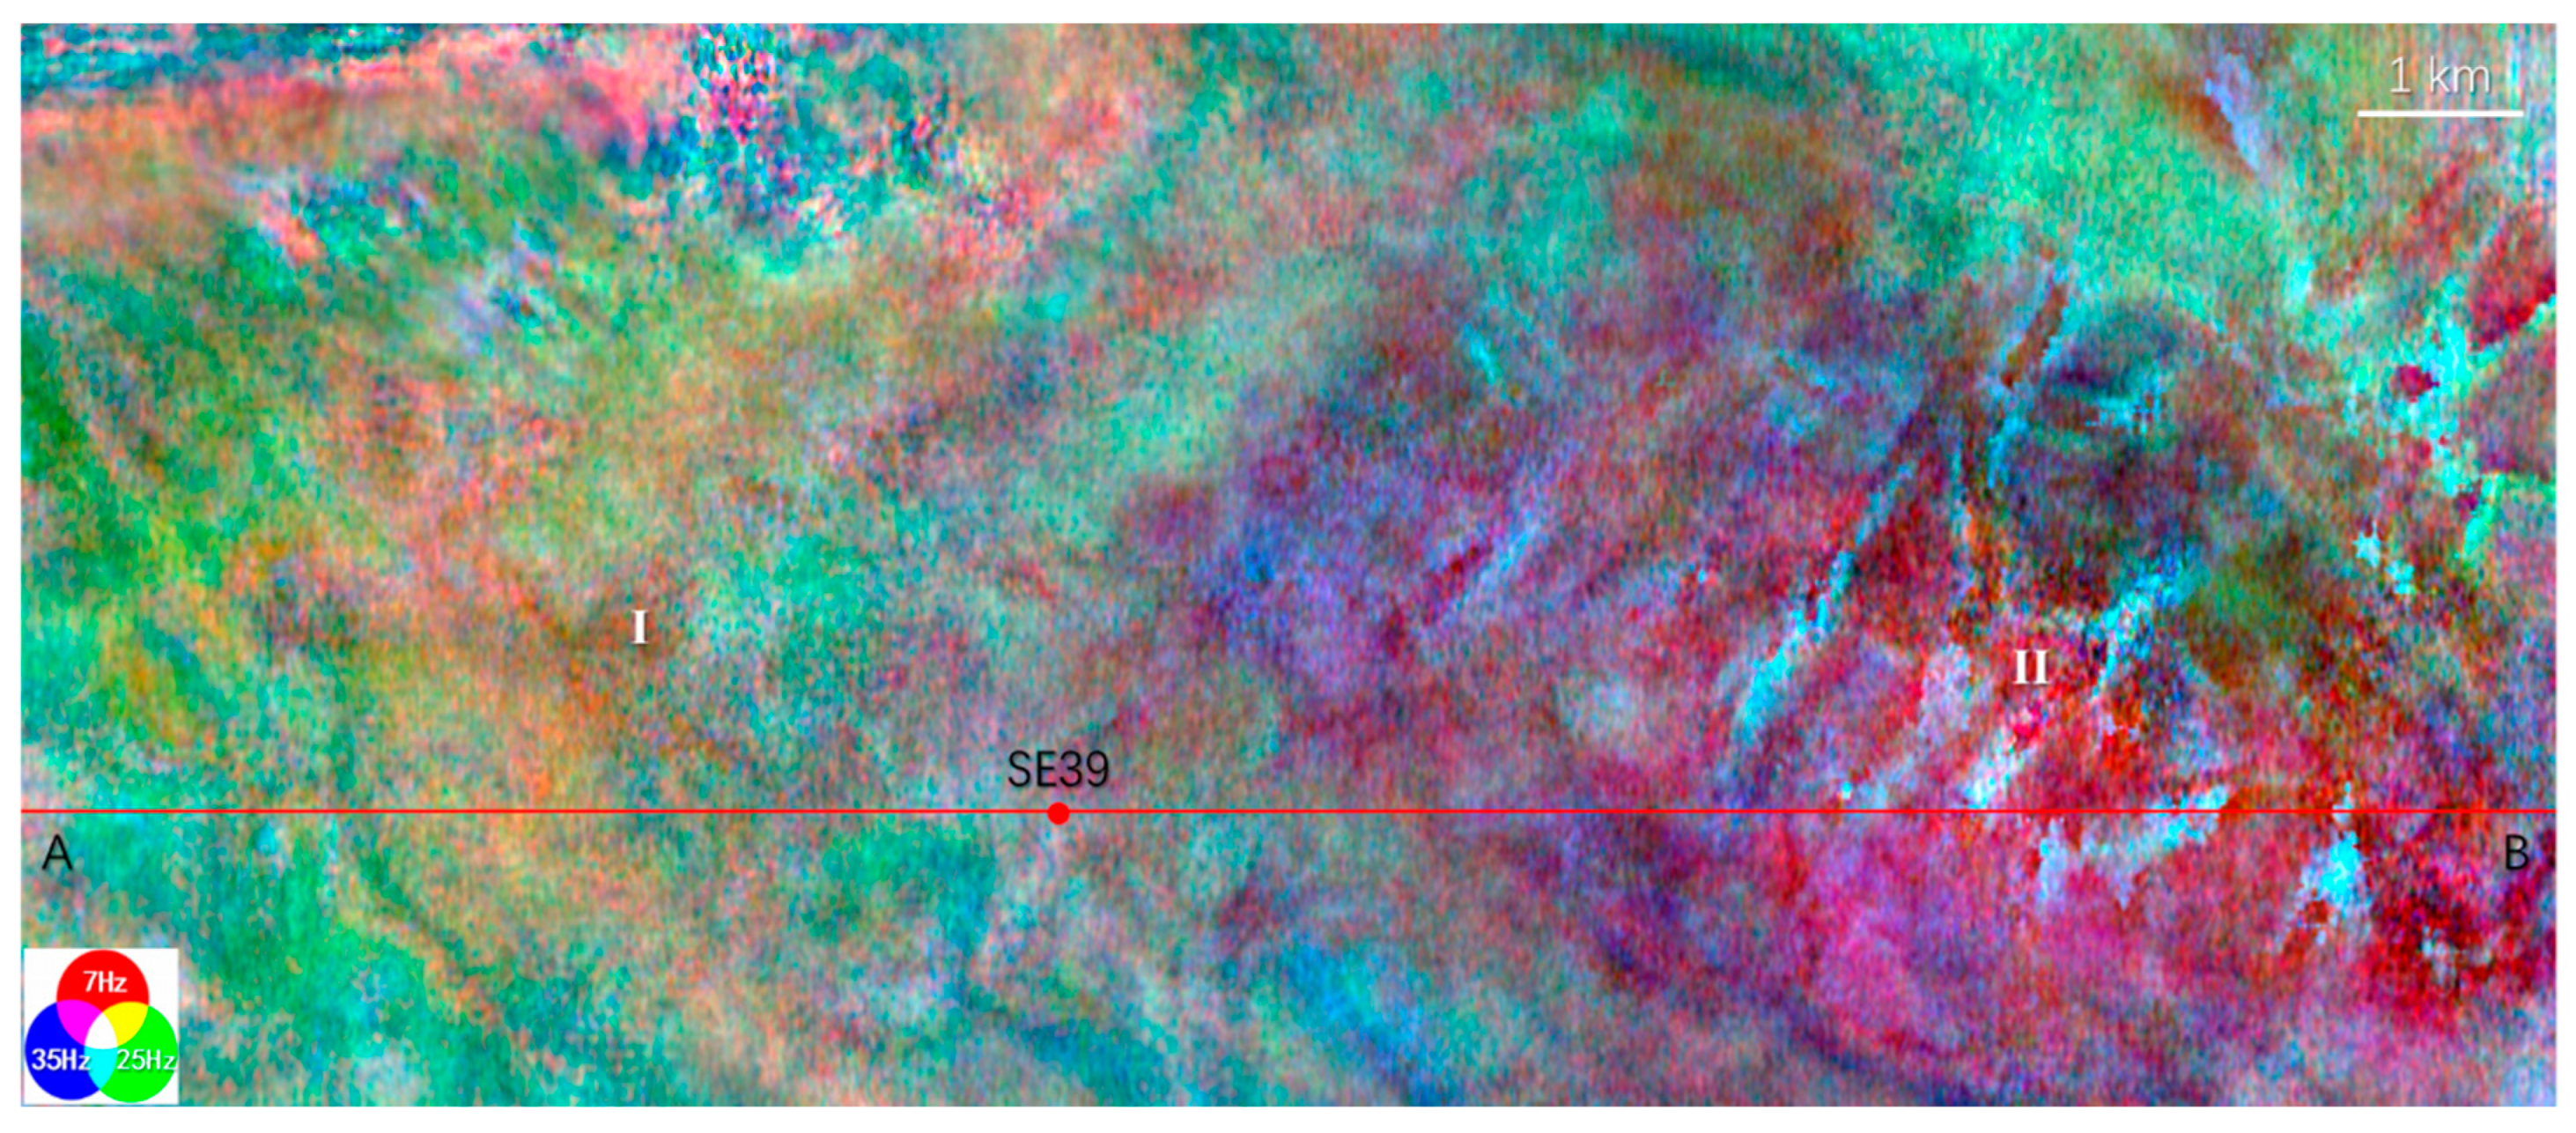
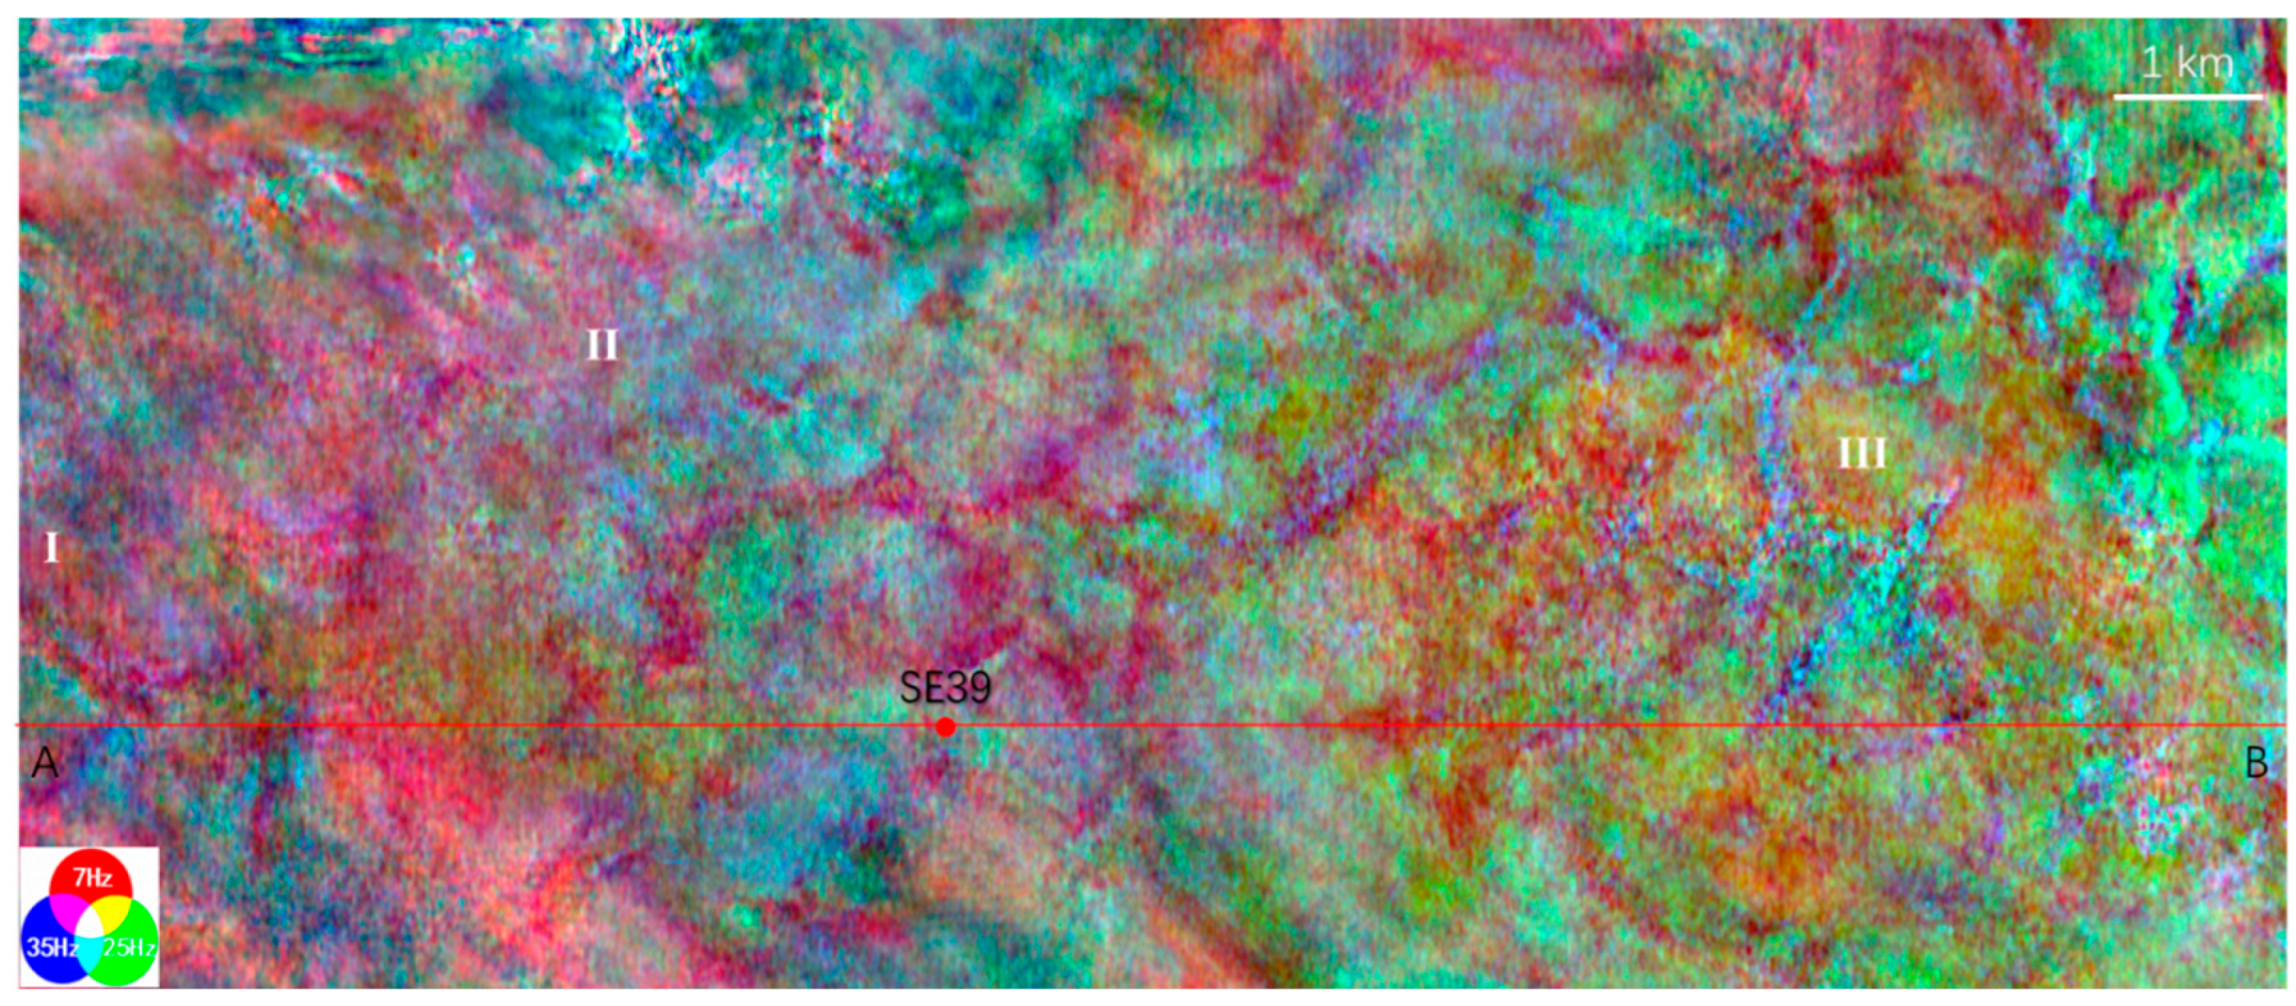
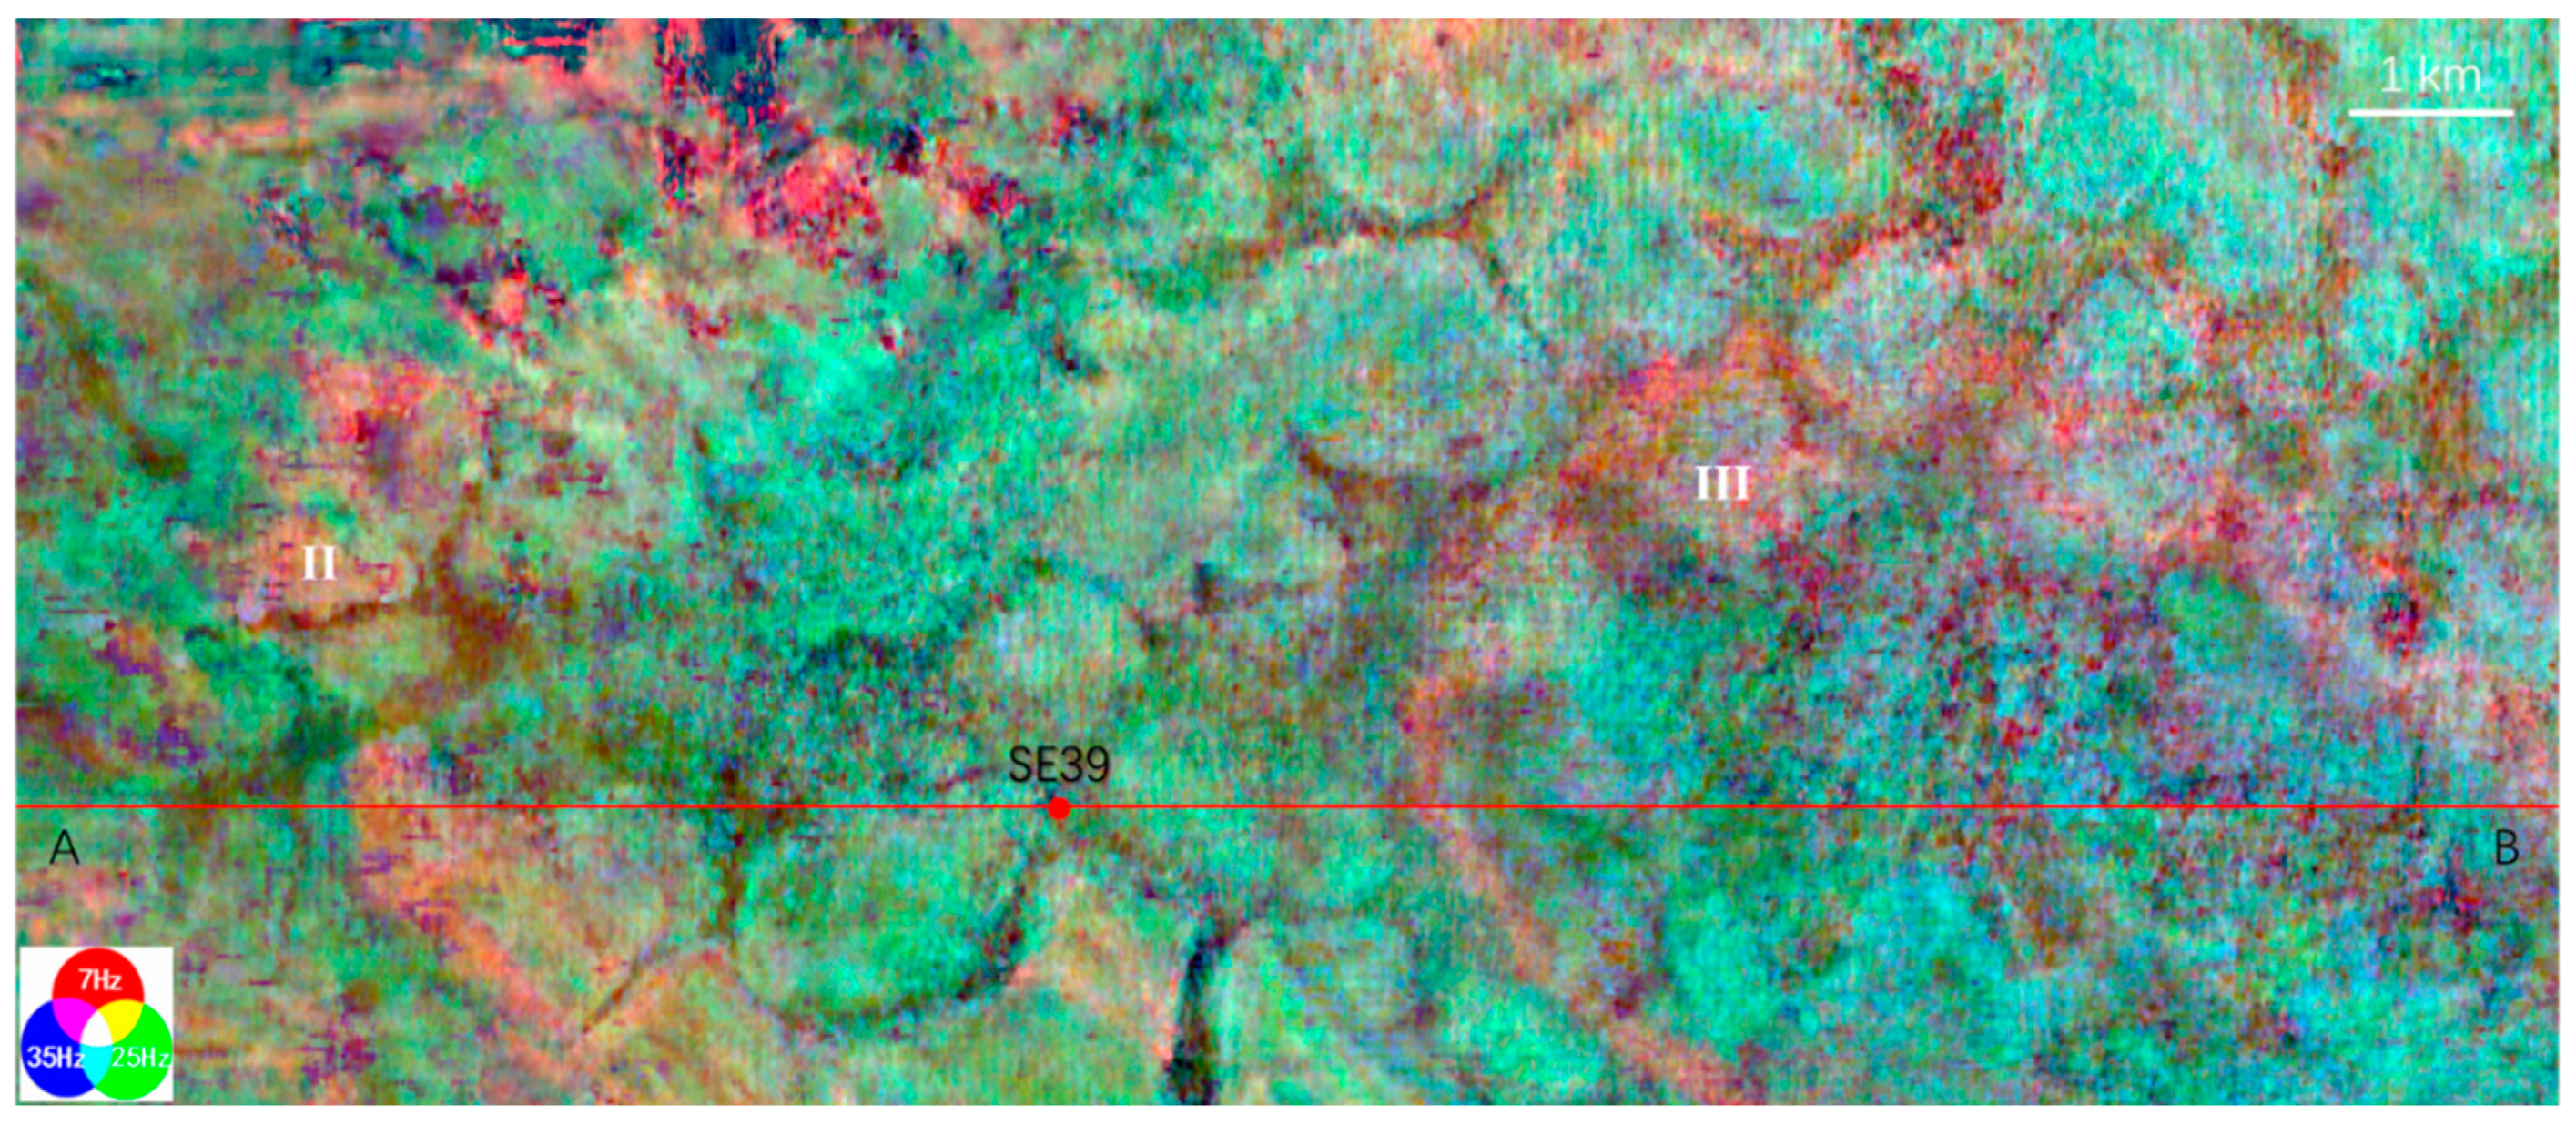
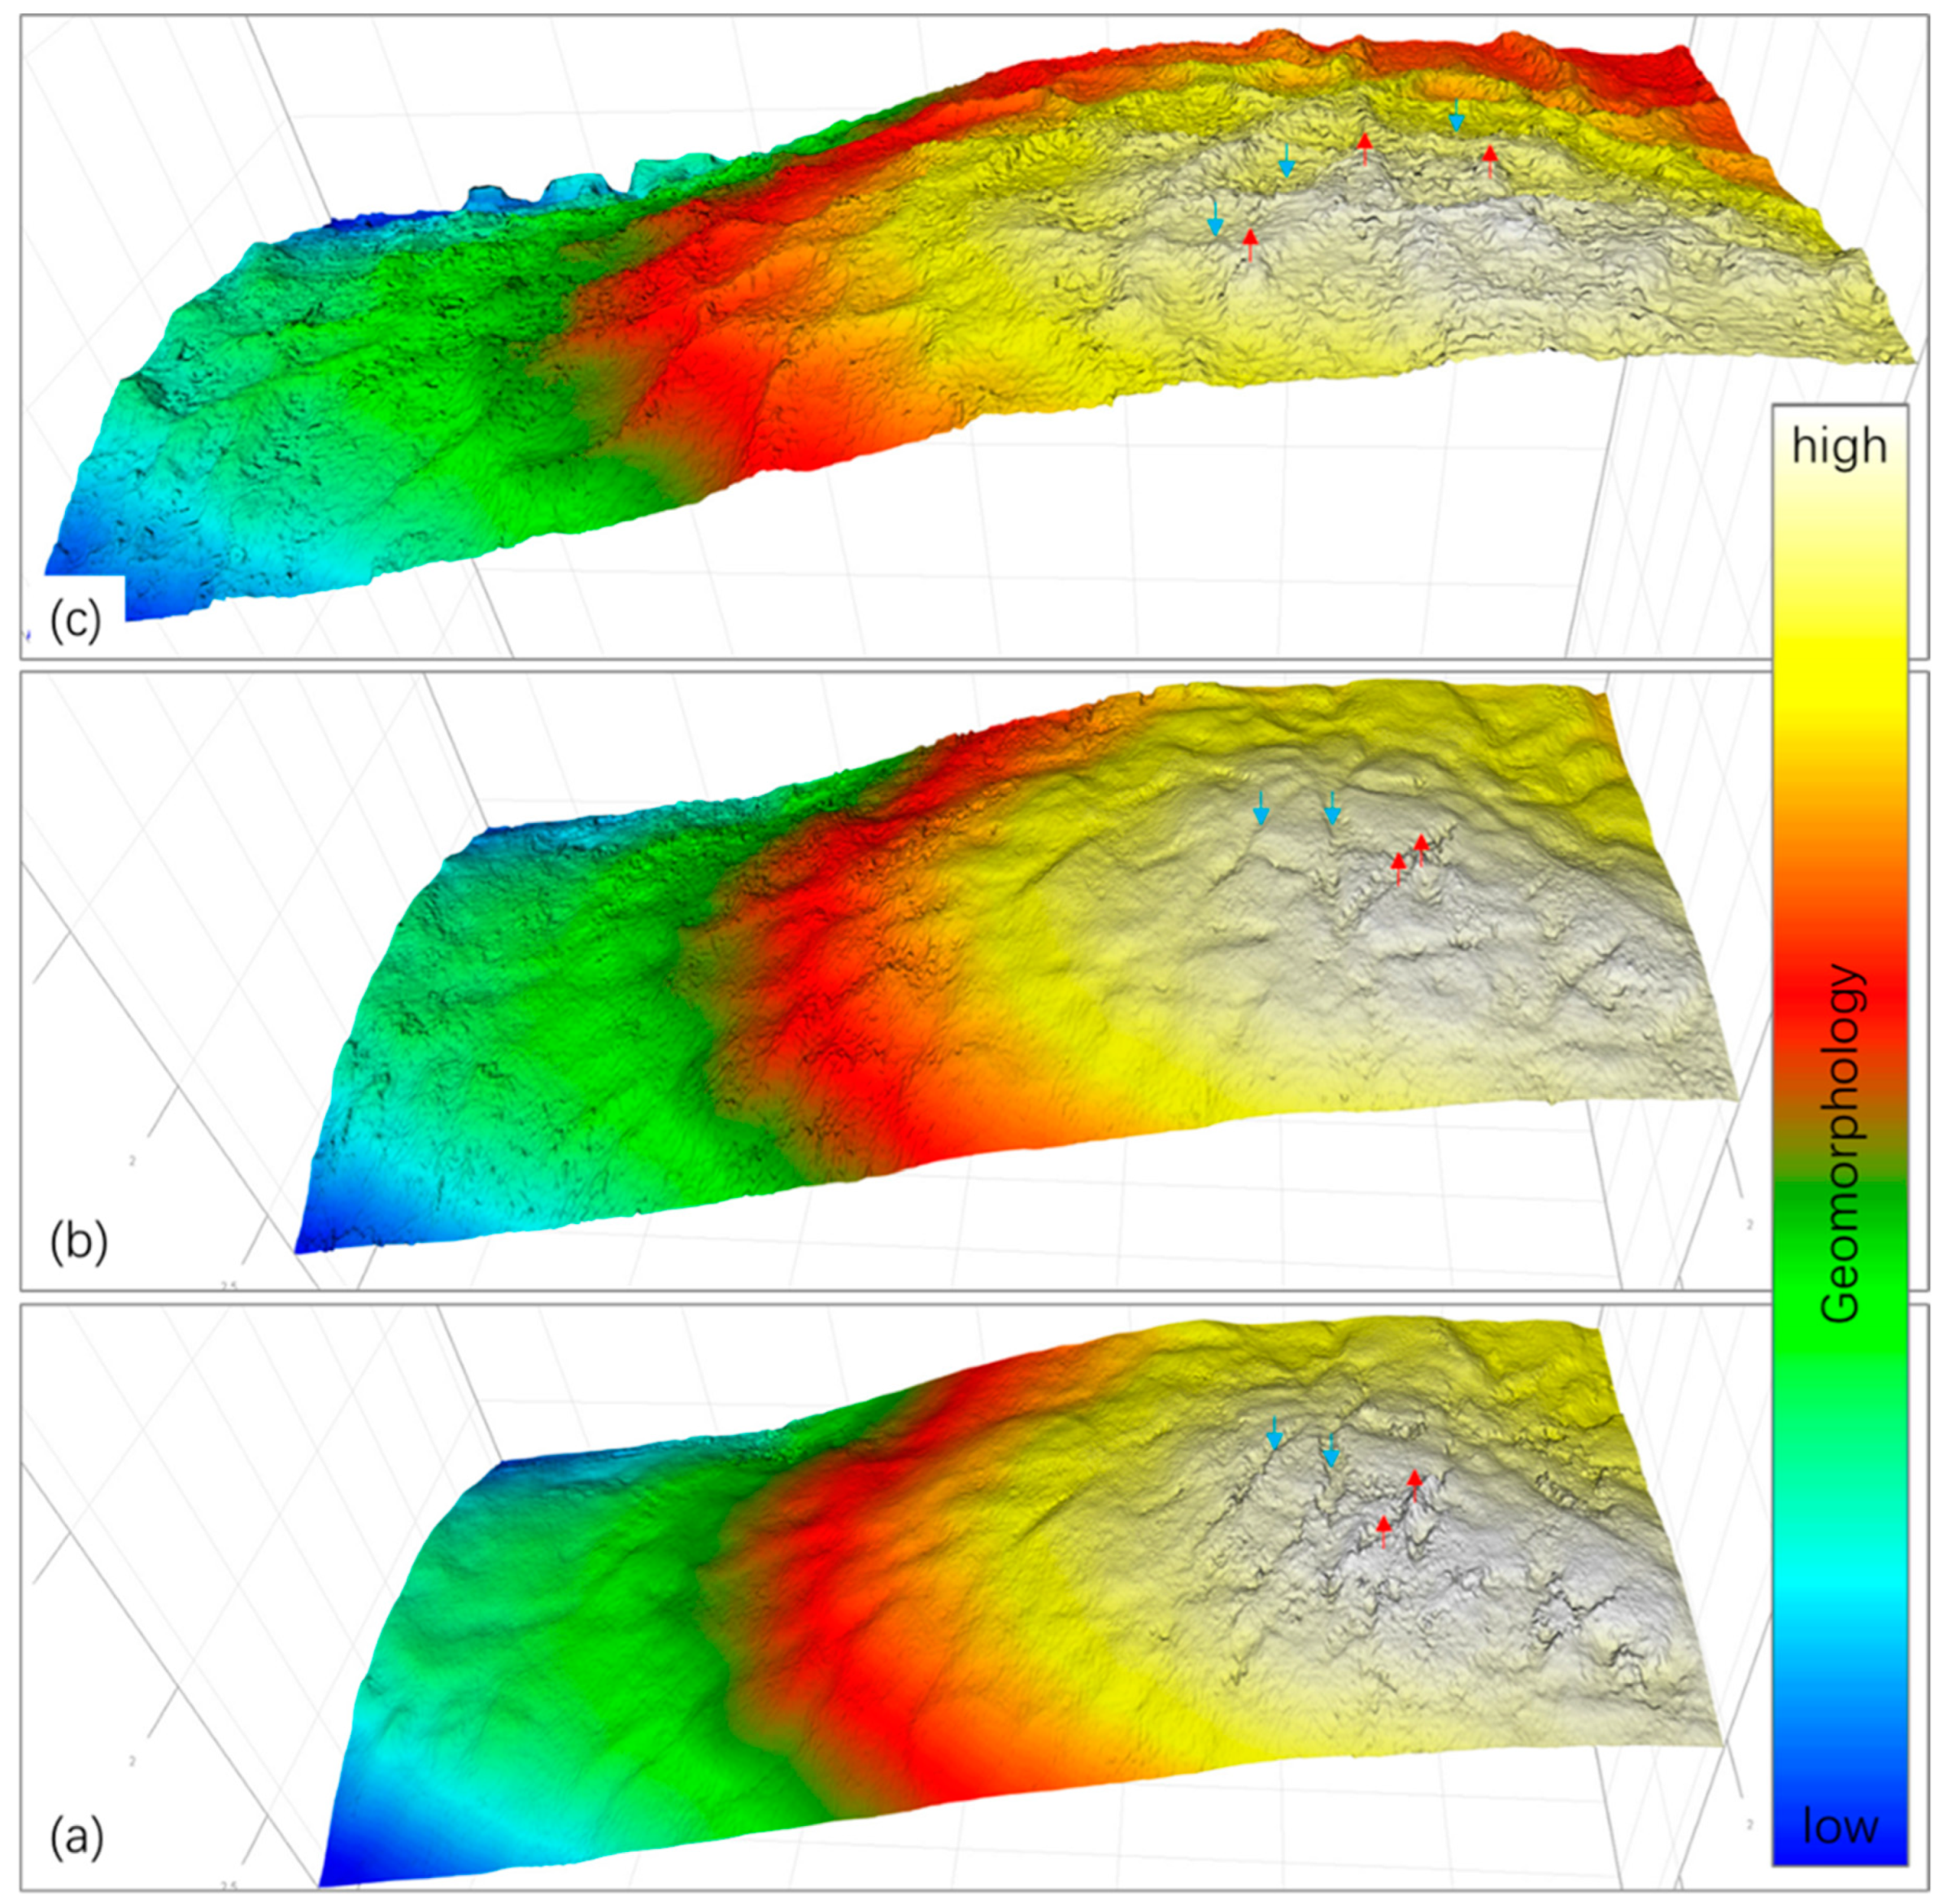
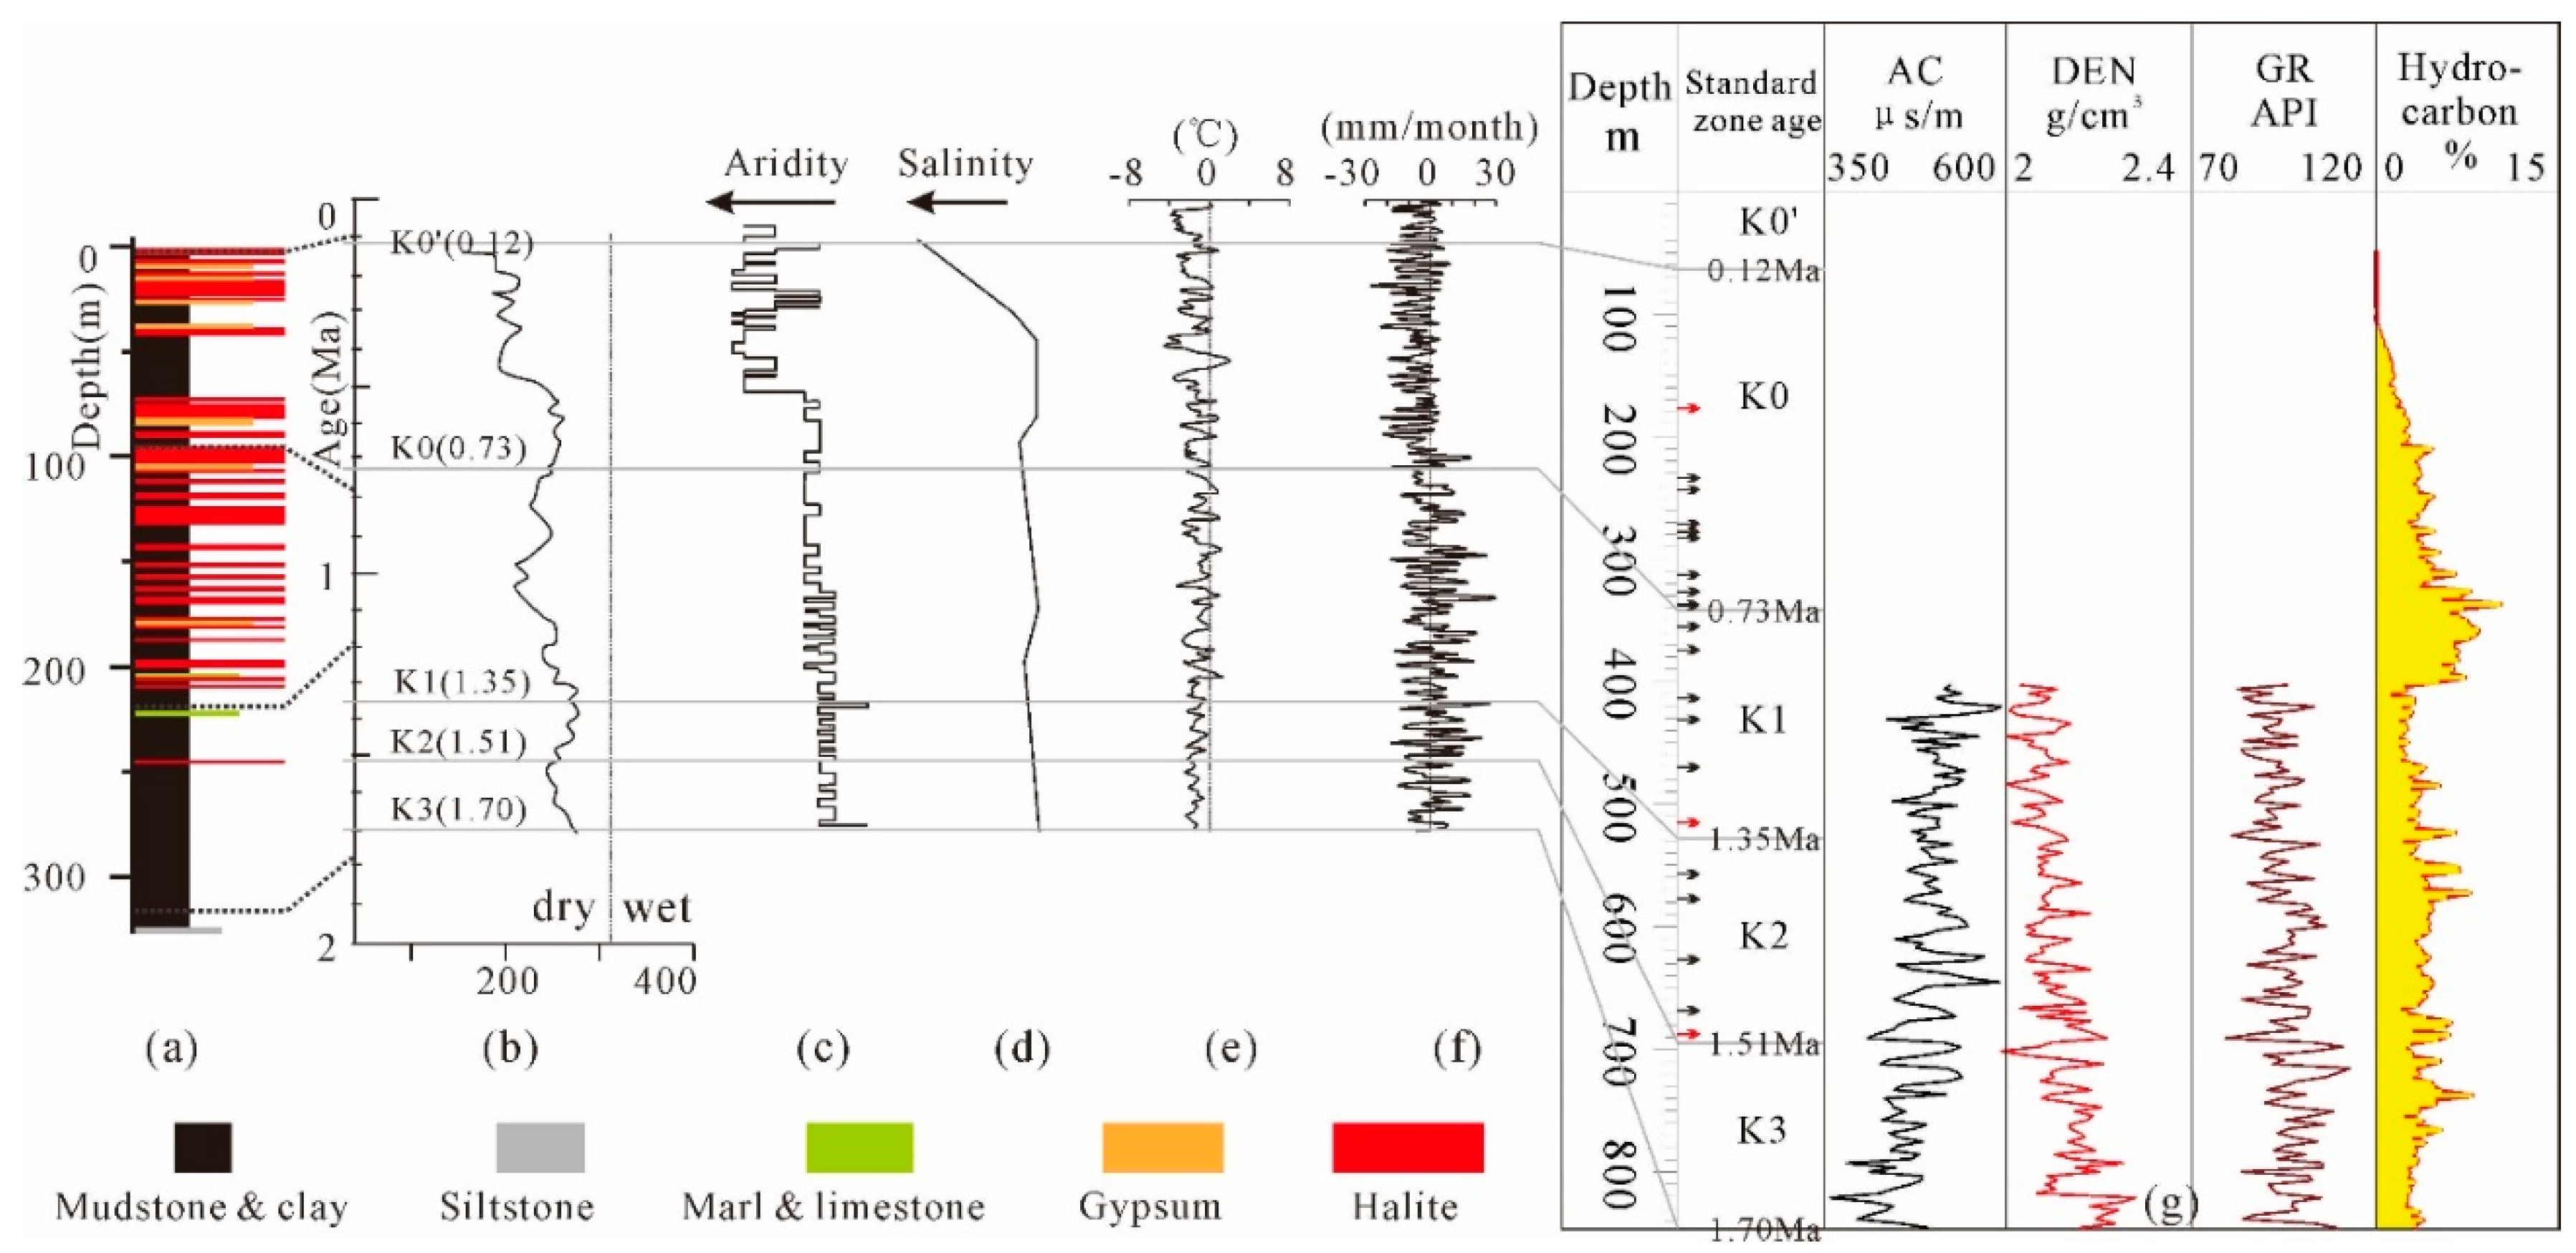
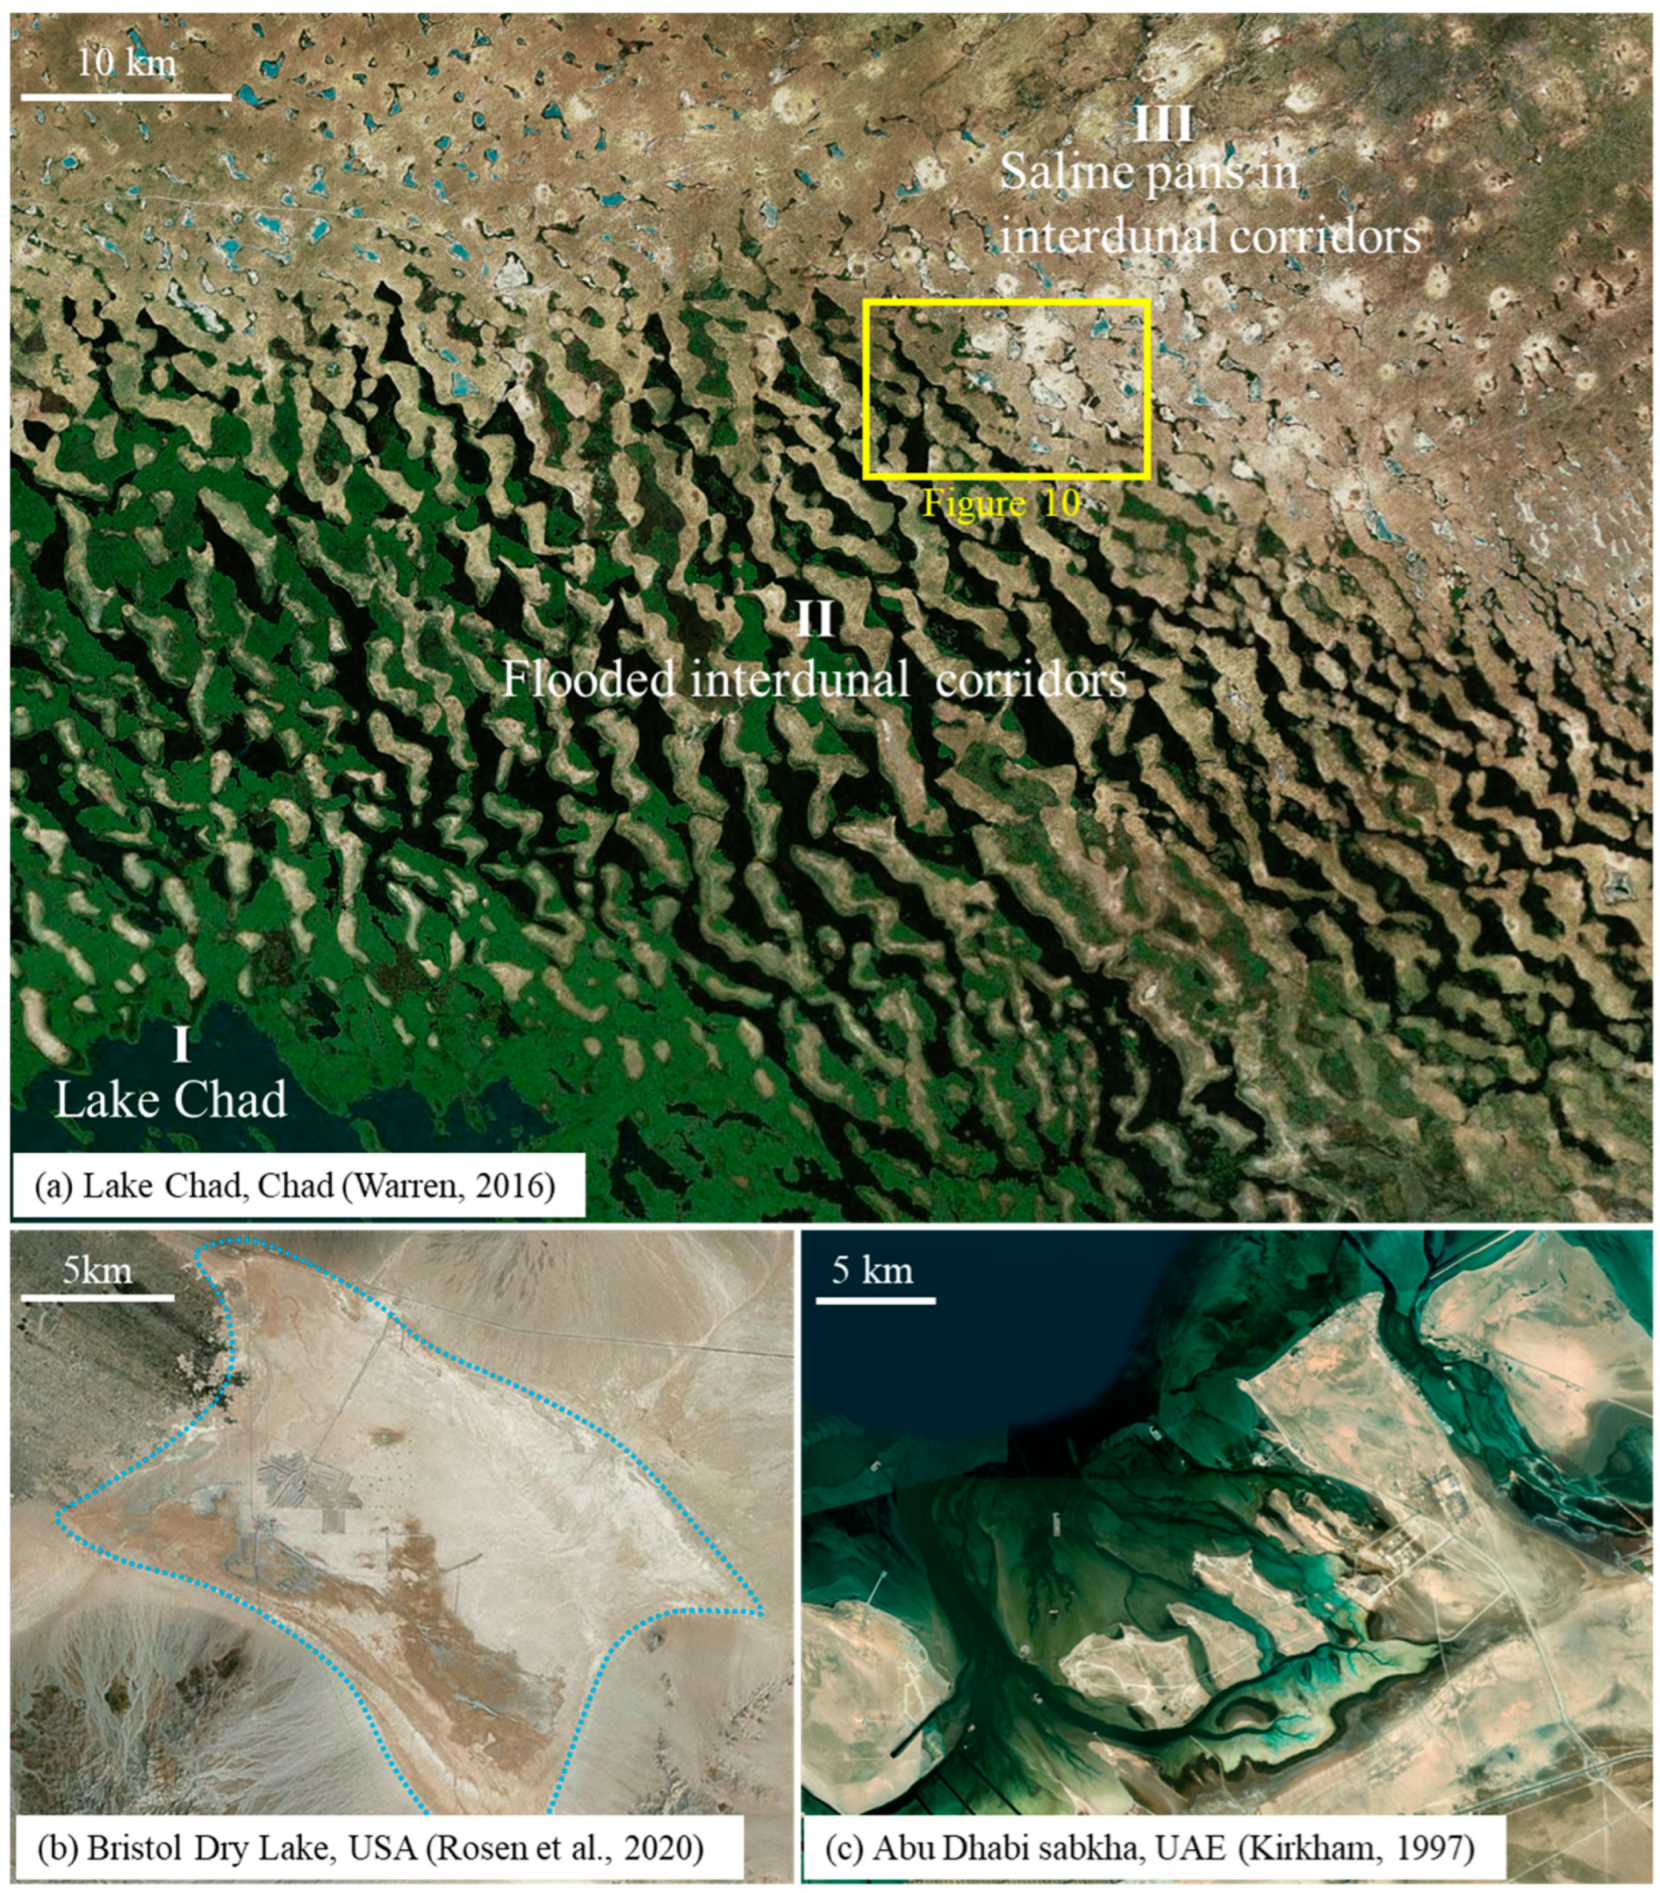
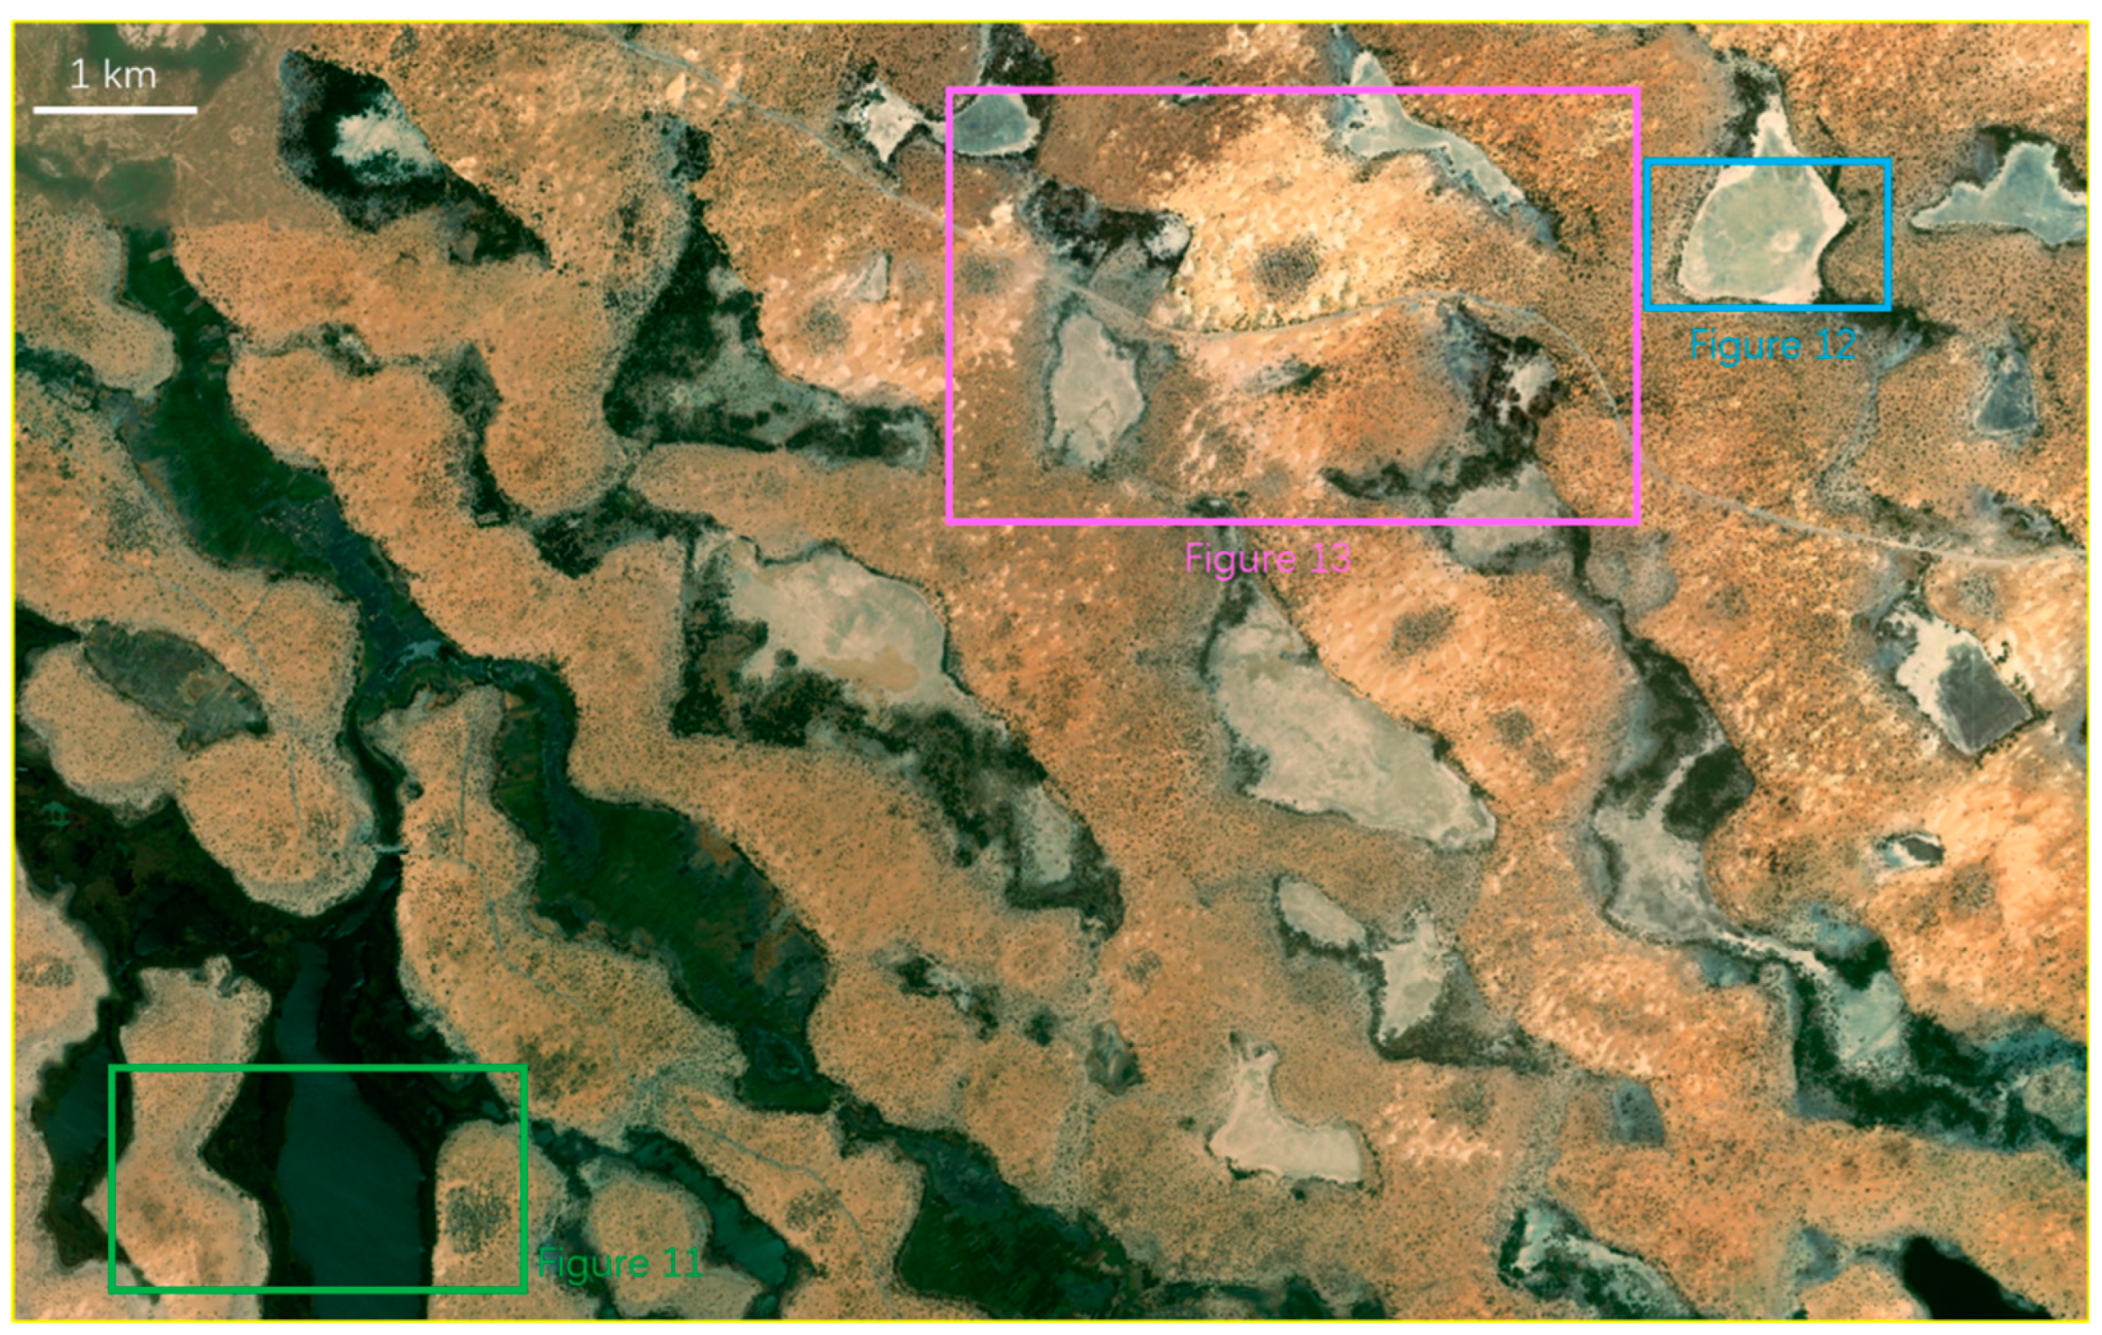
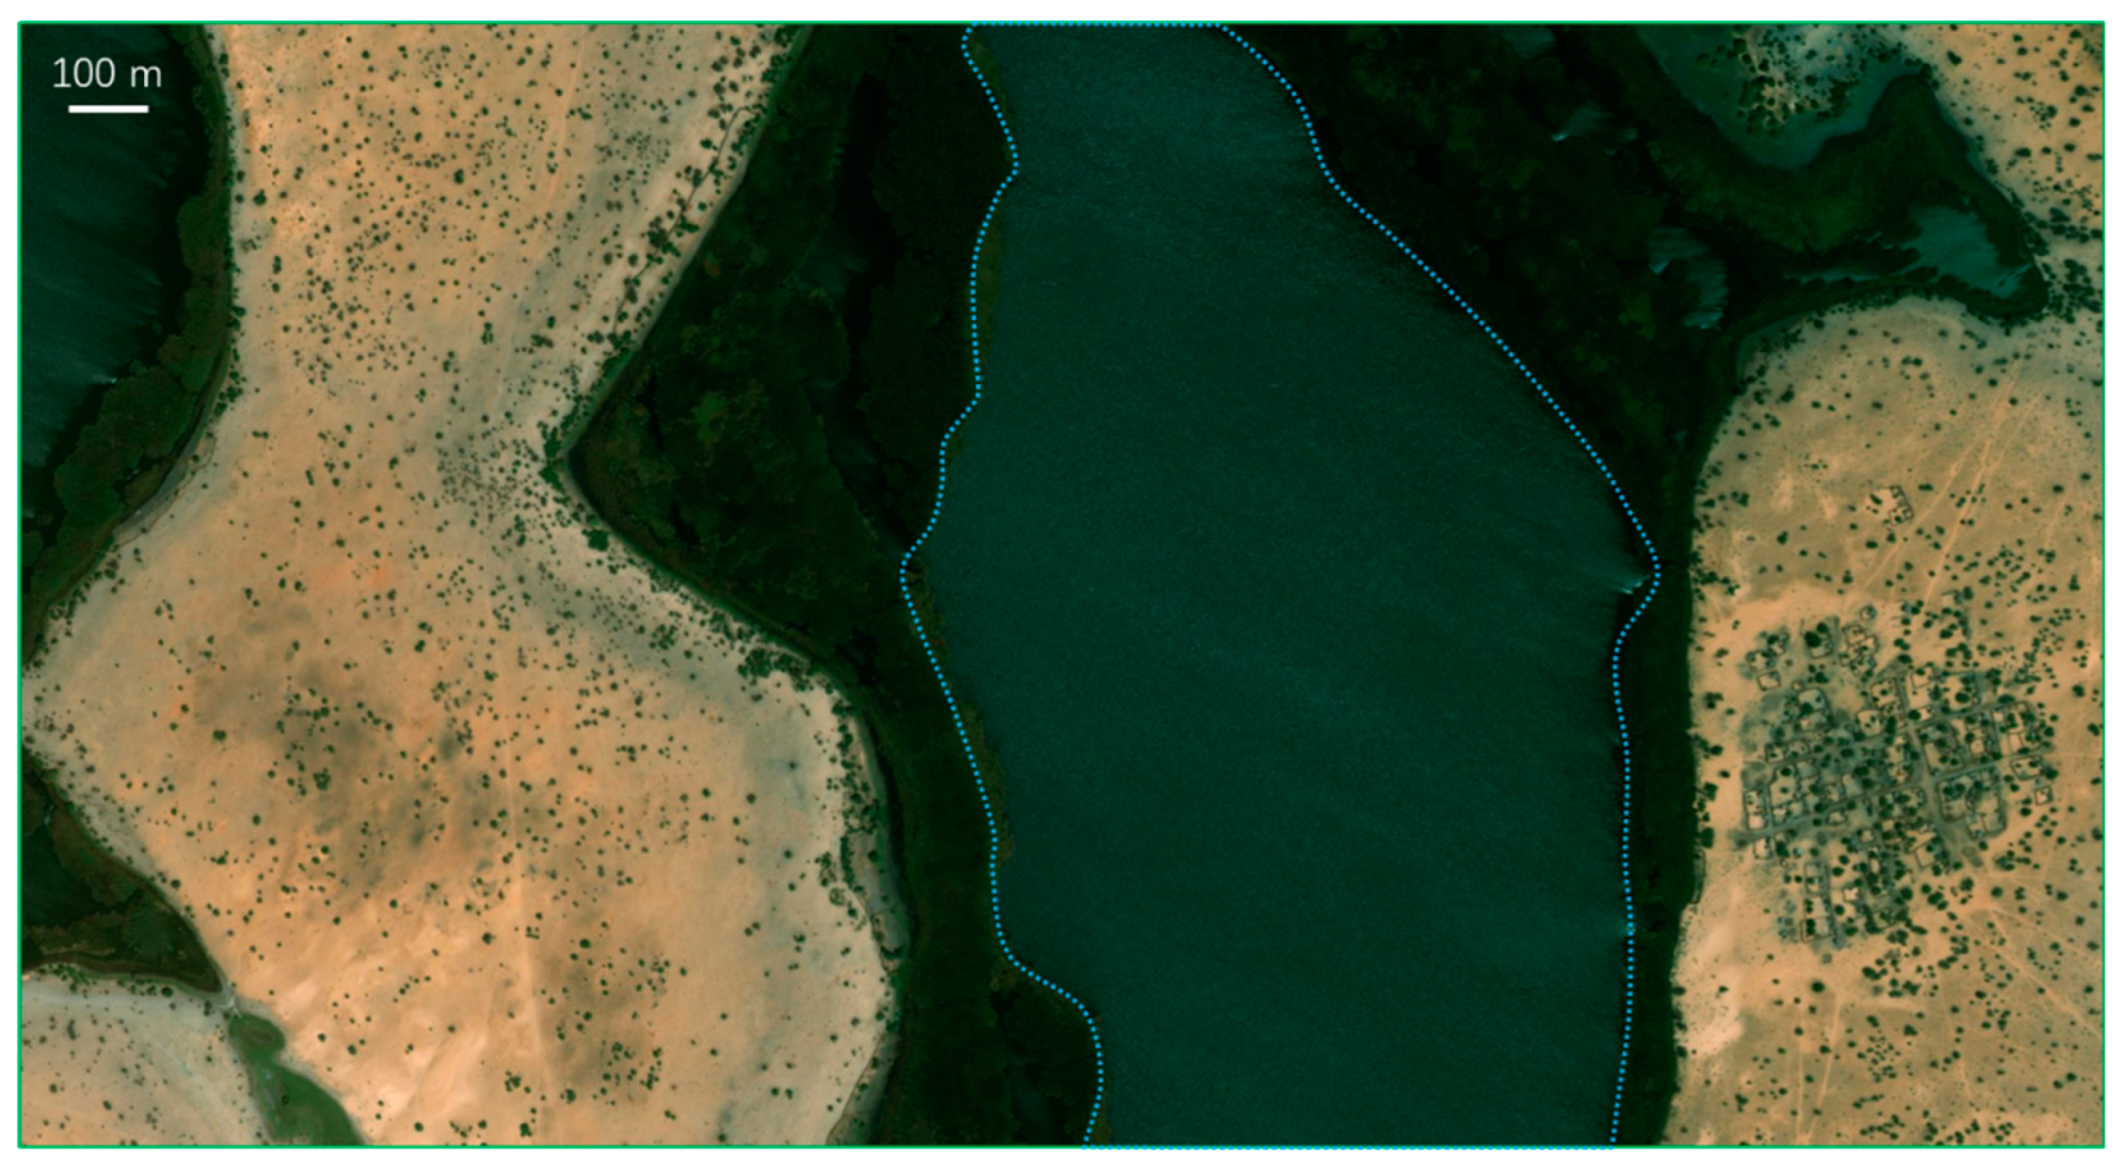
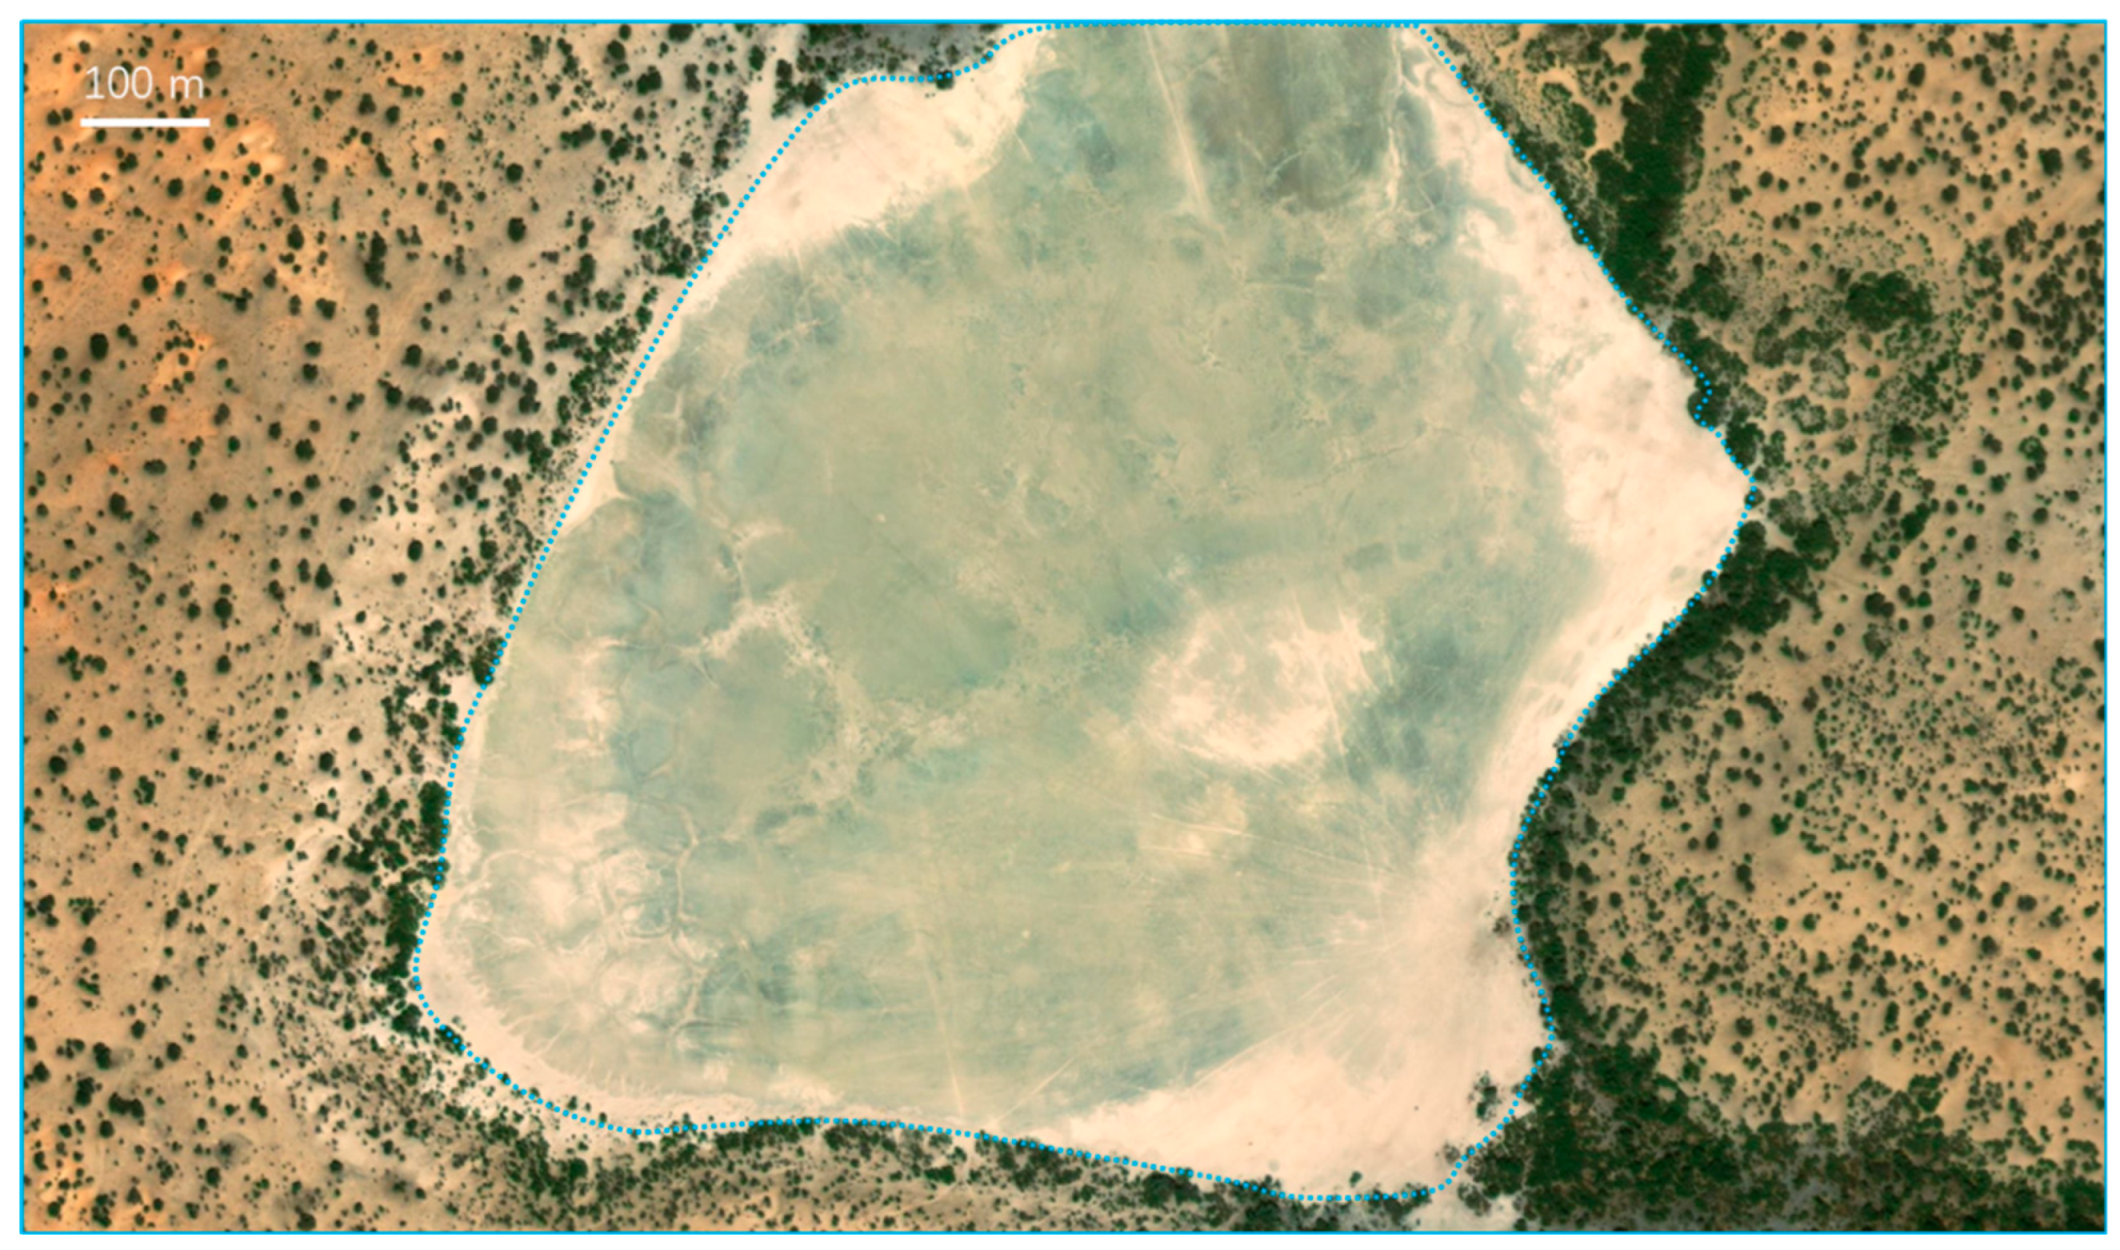
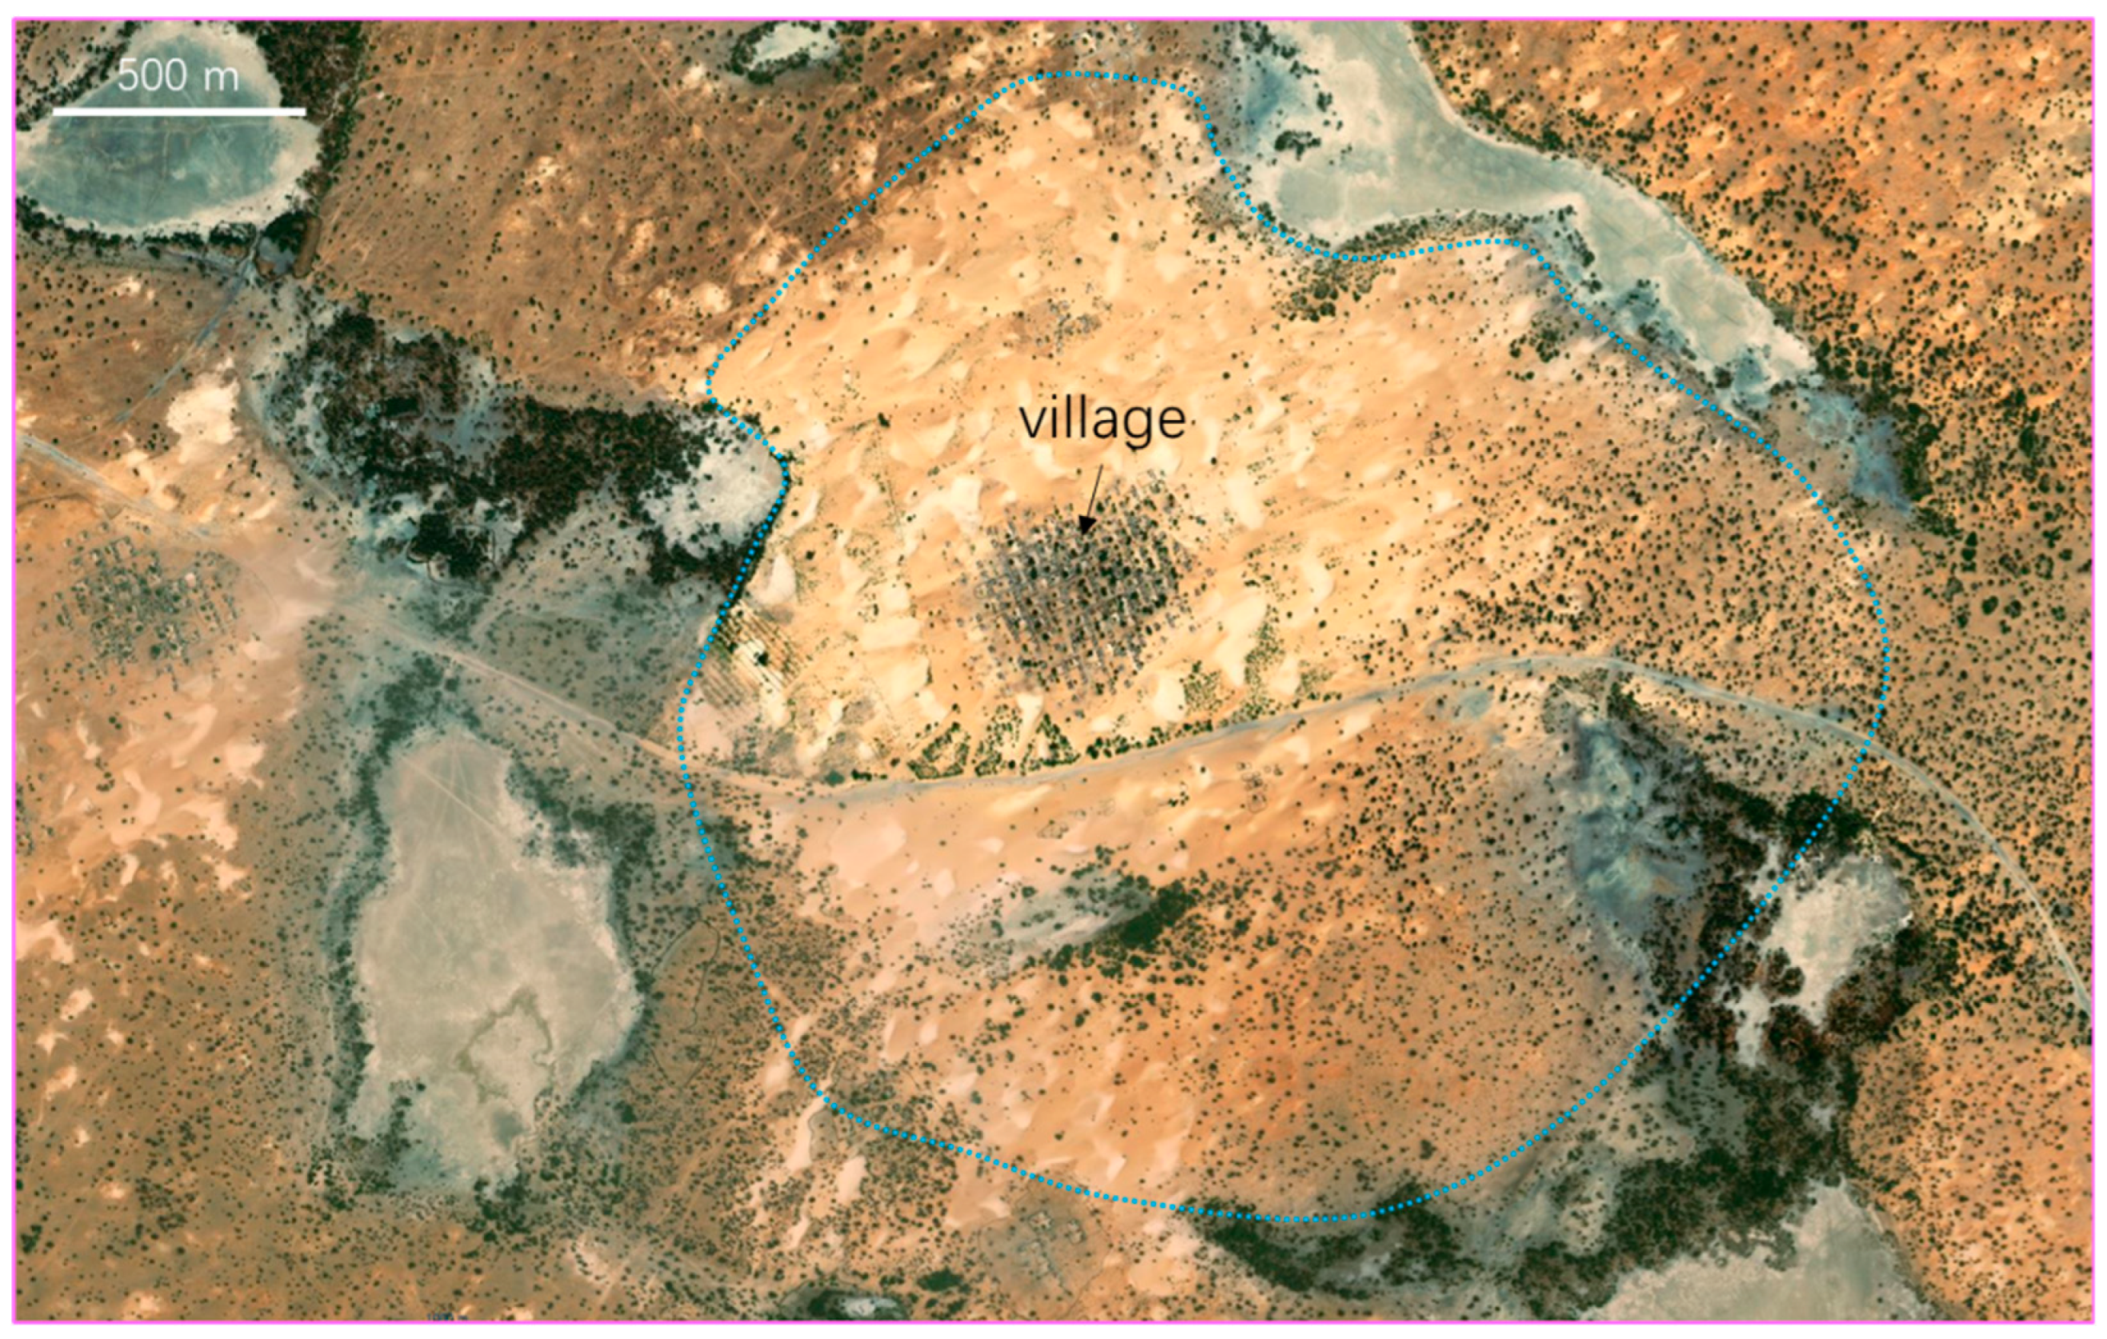
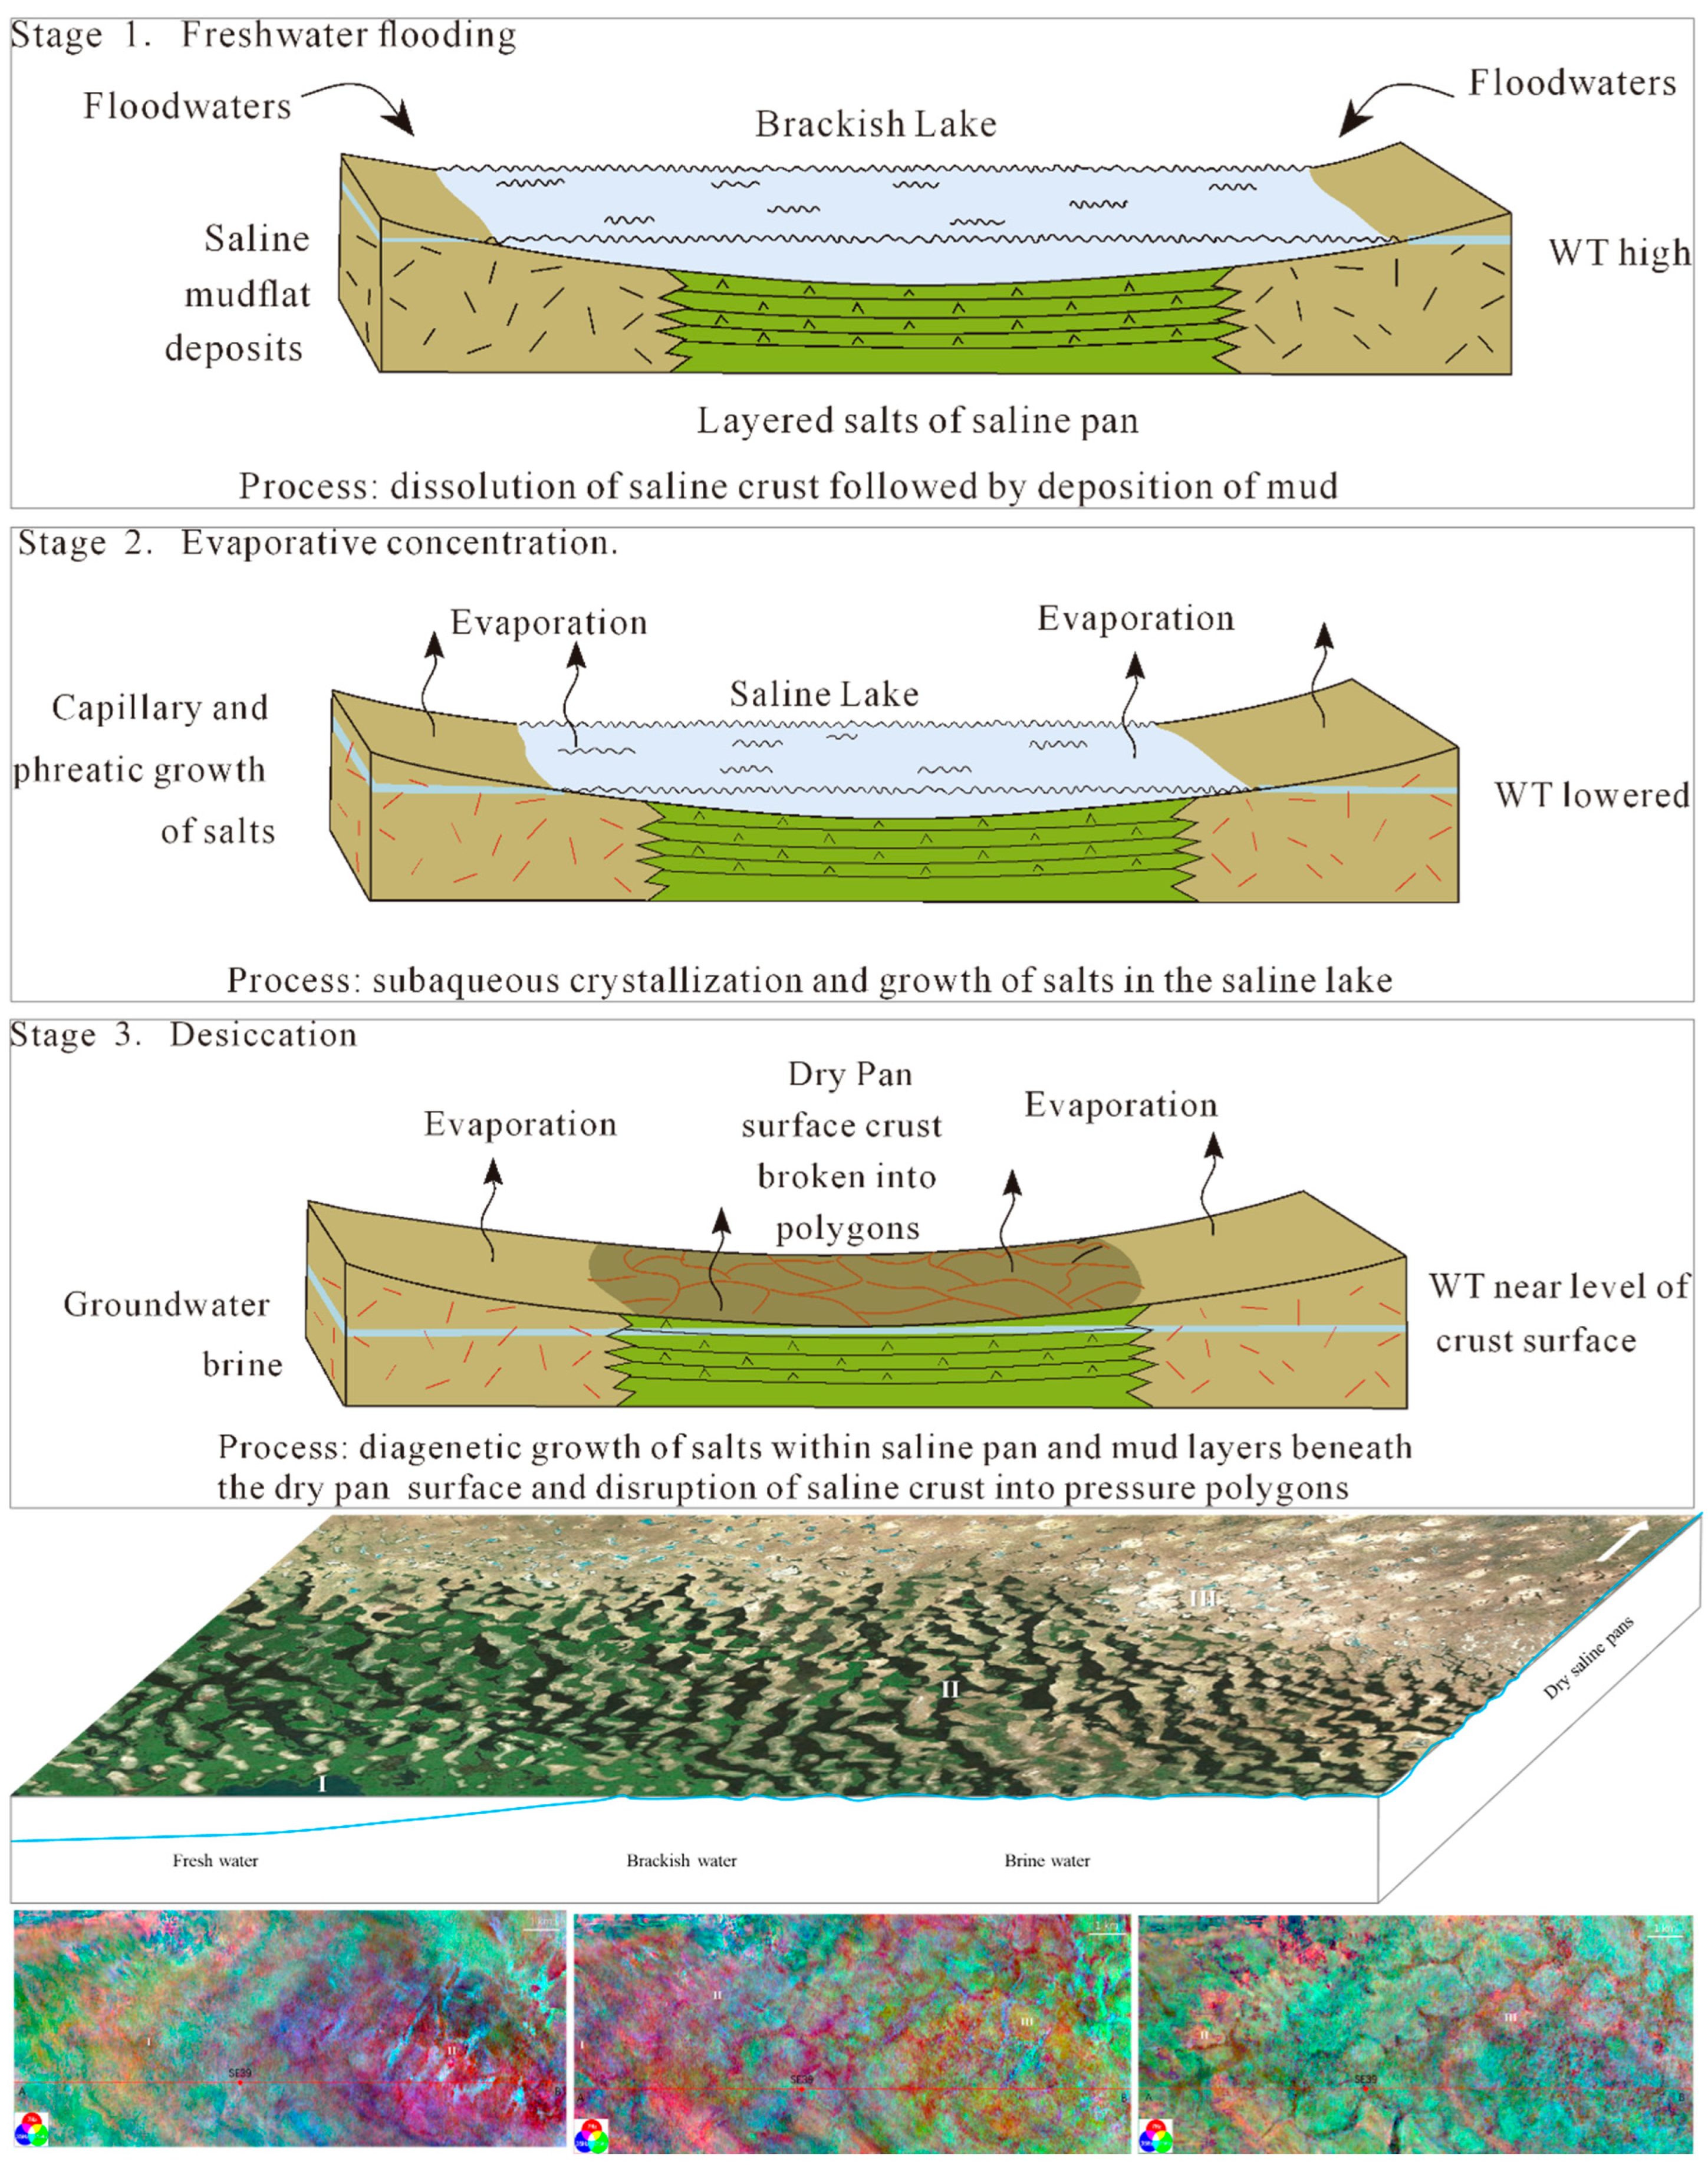
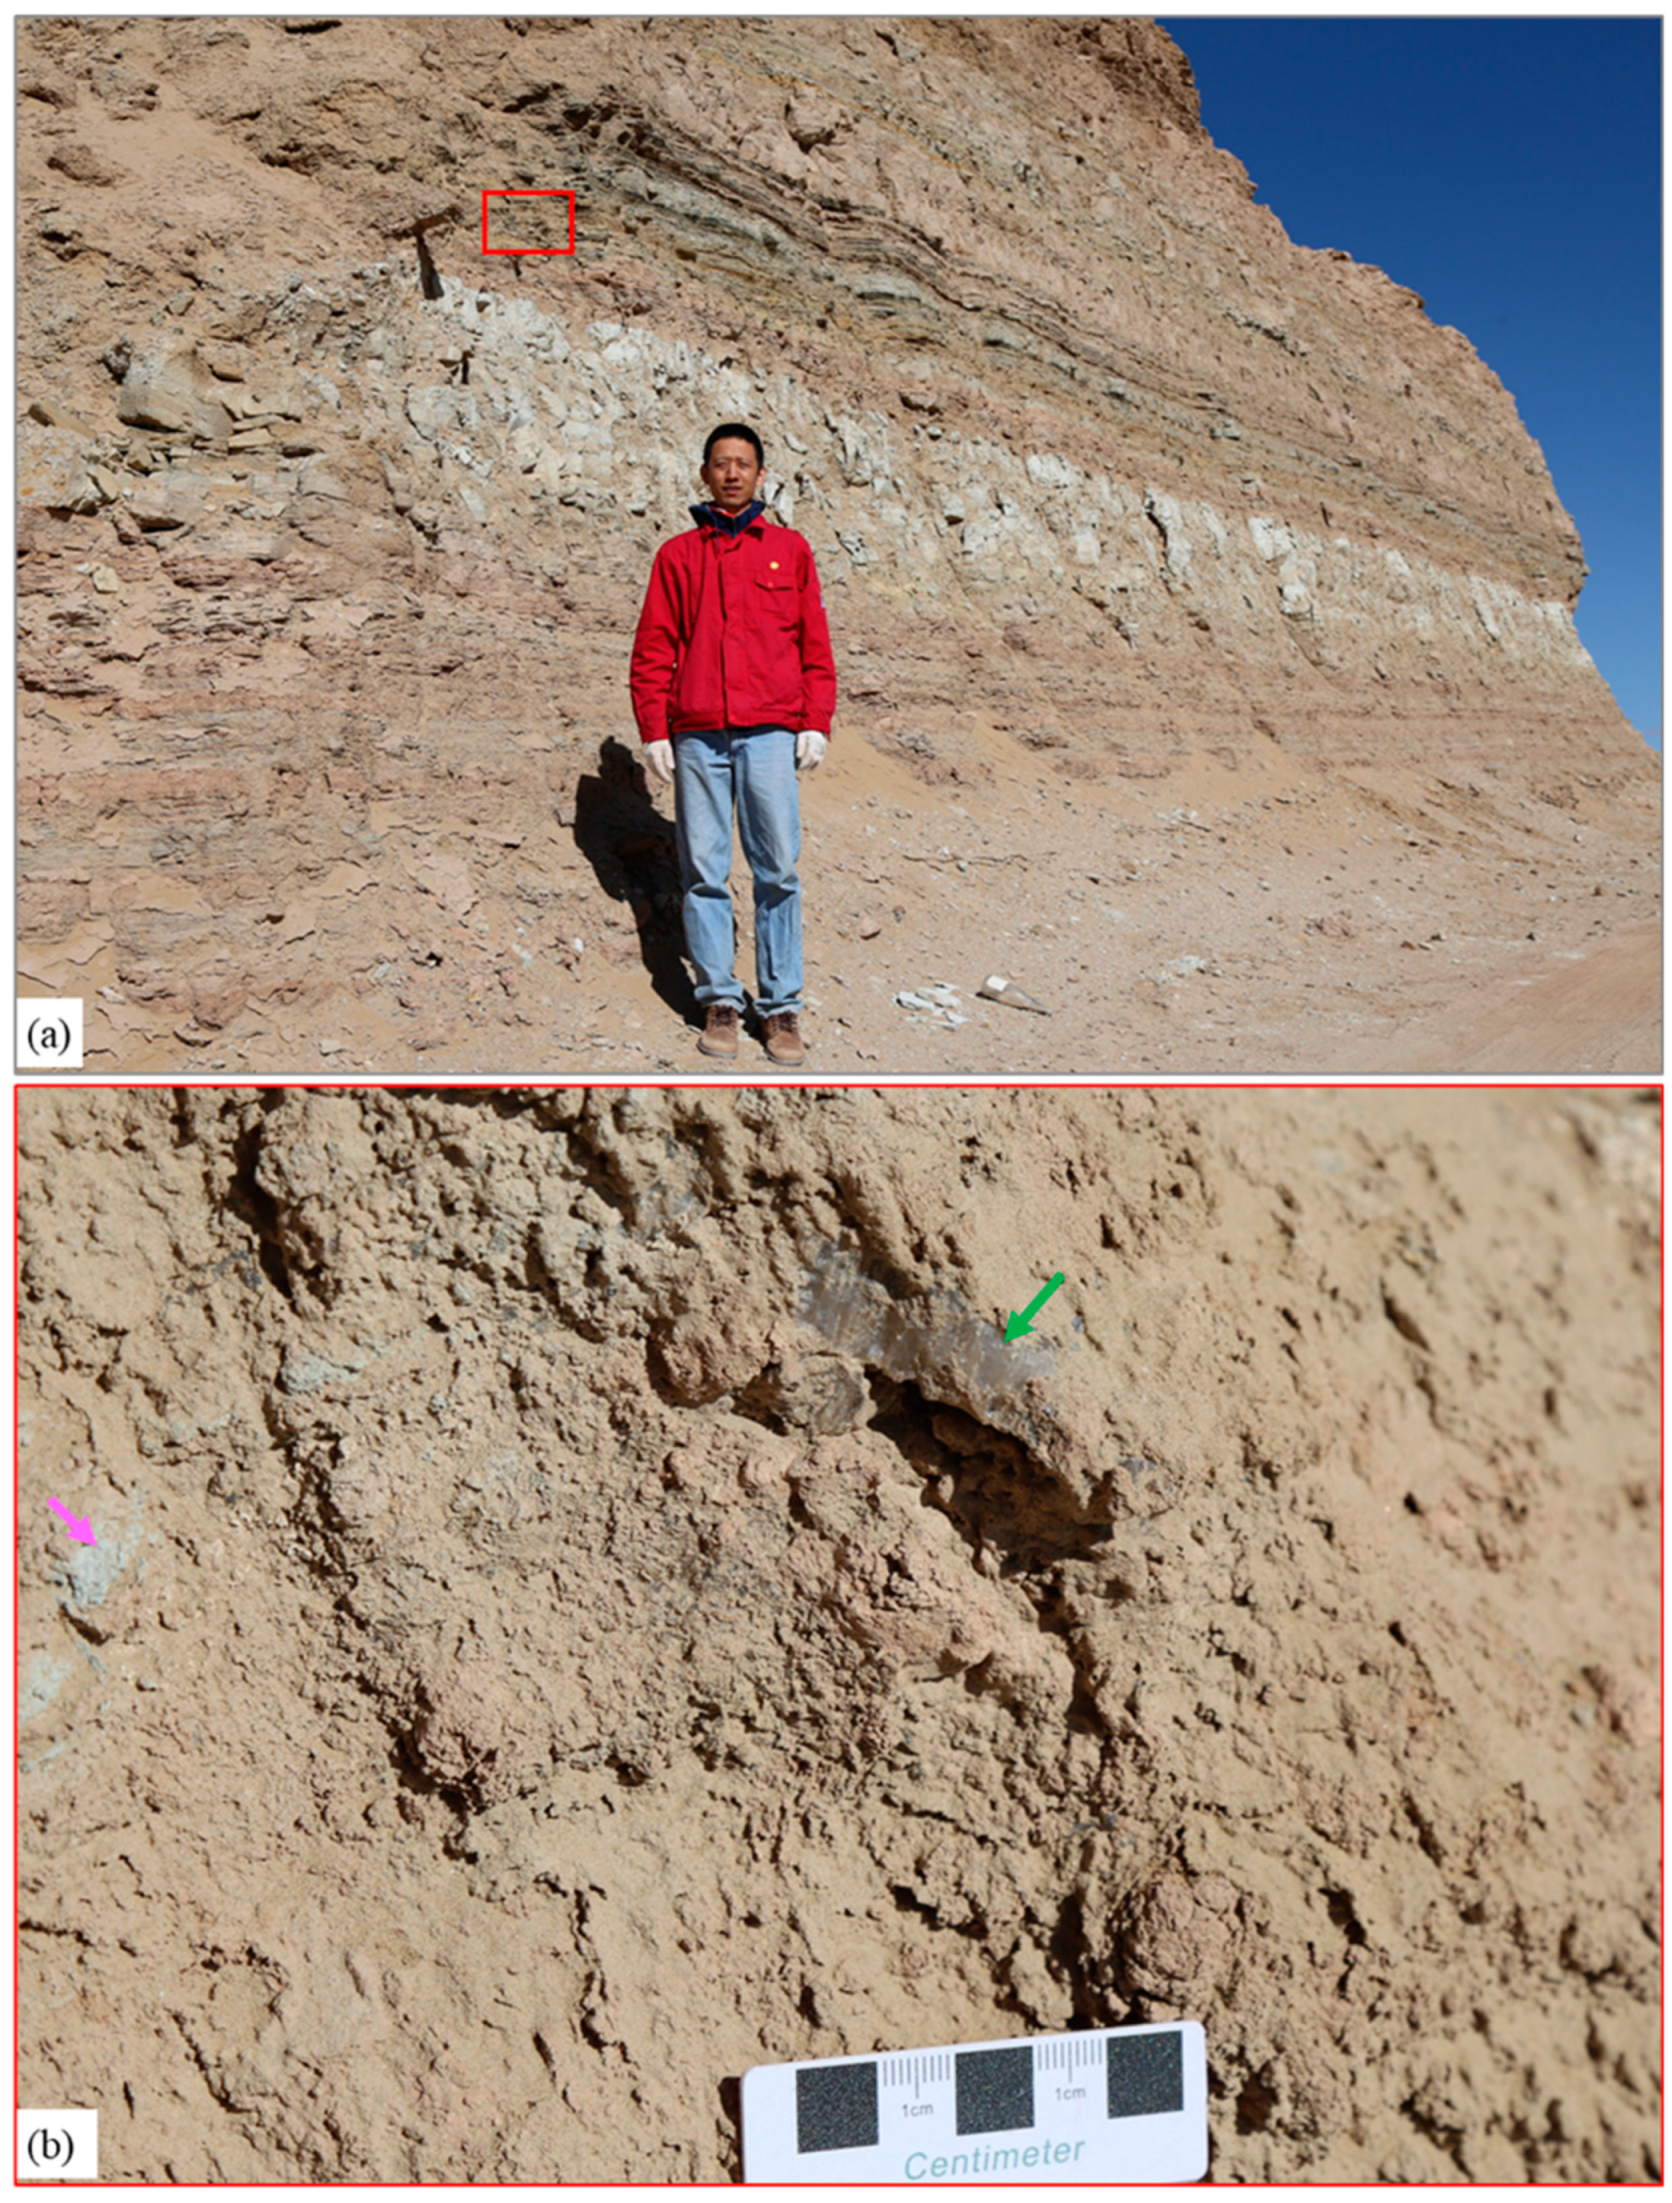
S-wave seismic data are unaffected by natural gas trapped in strata, making them a valuable tool for seismic sedimentology. In this study, S-wave seismic data were utilized to construct an isochronous framework and analyze evaporative facies in the Quaternary biogenic gas-bearing Taidong area, Sanhu Depression, Qaidam Basin, NW China, with calibration from wireline logs and modern analogs. Techniques of phase rotation, frequency decomposition, R (Red), G (Green), B (Blue) fusion, and stratal slices were integrated to reconstruct seismic geomorphological features within the isochronous framework. Linear and sub-circular morphologies, resembling those observed in modern saline pans such as Lake Chad, were identified. Observations from Upper Pleistocene outcrops of anhydrite and halite at Yanshan, east of the Taidong area, salinity measurements from Well TX1 to the north, and lithological and paleo-environmental records from boreholes SG-5, SG-1, and SG-1b to the northwest support the seismic findings. The RGB-fused slices generated from the S-wave seismic data in Taidong area indicate a progressive increase in the occurrence of evaporative features from the K2 standard zone upwards. The vertical occurrence of evaporative facies in the Taidong area mirrors the contemporary regional and global paleo-environmental changes. The interpretation of Quaternary stratal slices from seismic sedimentology—spanning K2, K1, and K0 standard zones—reveals a transition from a freshwater lake to brackish, saline, and finally, a dry saline pan, overlaid by silt. This analysis provides valuable insights into locating evaporites as cap rocks for biogenic gas accumulation and also into mining the evaporite resources in shallow layers of the Taidong area.

Keywords: 
;  ;  ;  ;  ;  

1. Introduction

Biogenic gas, characterized by its high methane content, represents a more environmentally friendly energy source compared to oil, coal, and other fossil fuels. It has been discovered in several basins worldwide, including the Cook Inlet Basin in Alaska (George et al., 1980), the West Siberian Basin in Russia (John et al., 1986), the Central Pannonian Basin in Hungary (Czauner et al., 2023), and the North Papua Basin in Indonesia (Efrina et al., 2023). Over 20% of global gas reserves are of biogenic origin (Dudley et al., 1981), with several giant biogenic gas fields, such as Agostino-Porto Garibaldi in Italy (3.5 trillion cubic feet [Tcf] original gas in place), Sebei-1 in the Sanhu Depression (China, 95 Tcf), and Urengoy in Russia (220 Tcf) (Czauner et al., 2023). Due to its "green energy" attributes, widespread distribution, and shallow burial depth, biogenic gas is becoming an increasingly important resource. In the Sanhu Depression, Qaidam Basin, NW China, biogenic gas has been produced continuously for 13 years, with an annual output of 50×108 m3 (Xu et al., 2024).
The primary moderate-buried (1000–1500 m) gas-bearing zones in the Sanhu Depression are sealed by mudrock rather than hydrostatic pressure (Dudley et al., 1981; Li and Lin, 2010). However, compared to mudrock and hydrostatic pressure, halite possesses superior sealing capacity. In the Sanhu Depression, where loose sediments are prevalent, the presence of an effective sealing cap rock is a key factor controlling biogenic gas accumulation. Evidence from outcrops and groundwater tests reveals the presence of evaporite lithologies, such as halite and anhydrite, in shallow layers (less than 800 m) in the region. The global decline in temperature and precipitation since the Late Quaternary aligns with the evaporative environment observed in the Qaidam Basin (Wara et al., 2005; Williams et al., 2024). Numerous wells have confirmed the presence of biogenic gas in shallow layers, ranging from tens to several hundred meters in depth, likely sealed by evaporites. The distribution of evaporites, particularly halite and anhydrite, has become a critical issue for biogenic gas exploration and development as well as for evaporites mining in the Sanhu Depression. However, due to the influence of gas chimney or gas cloud, traditional P-wave seismic data cannot be used to set up stratal framework, let alone to predict lithology distribution.
Halite may precipitate in restricted areas such as marine basins, inland seas, nonmarine brine lakes, and salt pans (Goldsmith, 1969). Salt pans have been investigated primarily through outcrops, satellite images, and modern sediment studies (Morris et al., 1957). Few studies have utilized S-wave 3D seismic data, which has superior vertical resolution than P-wave data in shallow layers to investigate evaporative facies because of the lacking of S-wave data.
Seismic sedimentology, a concept developed after sequence stratigraphy, is employed to study sedimentary rocks and depositional processes using seismic data (Zeng et al., 1998; Zeng and Hentz, 2004). This field incorporates two complementary aspects: model-driven seismic geomorphology and data-driven seismic lithology (Zeng et al., 2018). Taidong area is located in the northwest of Sanhu Depression, and is covered by a newly derived S-wave 3D seismic data. Considering the superior vertical resolution of S-wave seismic data and the decent lateral resolution of seismic sedimentology methods, this paper applies seismic sedimentology to the S-wave 3D seismic data, revealing unique sub-circular features on RGB-fused slices generated from the Quaternary strata in the Taidong area, west of the Sebei-1 gas field, for the first time. Considering the geological context and modern analogs, these features are interpreted as saline pans (Goodall et al., 2000), formed in continental lacustrine and eolian interdunal playa environments (Warren, 2016). The morphological and structural features observed in the geophysical (seismic) data, combined with geochemical evidence (salinity data), confirm the existence and evolution of salt pans in the area. The insights gained from this study are valuable not only for theoretical research on Quaternary environments but also for practical applications in the exploration and development of biogenic gas resources. Moreover, the distribution and evolution of evaporative facies in the Taidong area may assist in the mining of shallow evaporite resources.

2. Geological Setting

The Qaidam Basin, located on the northeastern Tibetan Plateau, is an intermontane basin surrounded by the Altun, Qilian, and Kunlun Mountains (Figure 1). The average elevations of the basin and the surrounding mountains are 2800 m and 4000–5000 m, respectively (Zhang et al., 2021). Covering an area of 12×104 km2, the basin is situated on Proterozoic crystalline and Paleozoic folded basements. Its tectonic evolution has occurred in four distinct stages: rifting from the Early to Middle Jurassic, compression from the Late Jurassic to Cretaceous, local strike-slip and regional compression from the Paleogene to Late Pliocene, and compressional folding and depression from the Late Pliocene to the Quaternary (Jin et al., 2004). The basin's evolution provides important insights into the tectonic processes of the Tibetan Plateau, which has influenced the climate of the Northern Hemisphere (Manabe and Broccoli, 1990).
In the Sanhu Depression of the Qaidam Basin, tectonic activity and the Quaternary drying climate have resulted in approximately 3000 m of sediment accumulation during the Pleistocene and Holocene. Sediments deposited since 2.8 Ma BP are divided into standard zones from K13 to K0’’. The Pleistocene is further subdivided into three subunits: Lower Pleistocene (Q1, K13 [2.8 Ma BP] to K0 [0.73 Ma BP]), Middle Pleistocene (Q2, K0 [0.73 Ma BP] to K0’ [0.12 Ma BP]), and Upper Pleistocene (Q3, K0’ [0.12 Ma BP] to K0’’ [0.01 Ma BP]). The Holocene corresponds to Q4 (K0’’ [0.01 Ma BP] to the present). Drilling in the Sanhu Depression has revealed over 3000 m of Quaternary mudrock, carbonaceous mudrock, siltstone, and argillaceous siltstone, with evaporites present in shallow zones and at the surface (Figure 1). During the formation of the sediments in the Taidong area, northwestern of Sanhu Depression and western of Sebei-1 gas field, the lake level was deep in the K13 to K10 and K5 to K3 intervals, while it was shallow in the K9 to K6 and K2 to K0 intervals. The last period of shallow lake levels coincided with the emergence of an evaporative lagoon at west part of Taidong area (Xu et al., 2024). The evolution of sedimentary facies from K13 to K0, particularly the presence of halite in K0’ (Upper Pleistocene) and K0’’ (Holocene), reflects the extreme arid conditions that characterize the region, in line with the regional climate changes in the Qaidam Basin (Liu et al., 2021).

3. Data and method

3.1. Data

This study utilizes seismic, wireline log, drill core, outcrop, and related geochemical test data. The 82.5 km2 Taidong S-wave 3D seismic dataset, acquired west of the Sebei-1 gas field in the Taidong area, is not influenced by biogenic gas in the strata (Figure 2). The seismic survey has a bin spacing of 20 m in the inline direction and 10 m in the crossline direction, with a time sampling rate of 2 milliseconds. The predominant frequency varies across different strata: 26 Hz from K13 to K10, 25 Hz from K9 to K6, 33 Hz from K5 to K3, 18 Hz from K2 to K0, and 31 Hz from K0 to K0’’. Well SE39, which includes S-wave acoustic wireline logs (DTS) and density logs (DEN), was used for tying the well data to the S-wave 3D seismic data. A decent well-seismic tie shows that the average interval velocity from K13 to K0’ is 2917 m/s to 801 m/s for P-wave data and 1406 m/s to 343 m/s for S-wave data. As a result, the S-wave 3D seismic data offer better vertical resolution (3~13 m, 28 Hz) compared to P-wave data (7~24m, 30 Hz) from K13 upward, particularly in the shallower standard zones for their low velocity.
Chloride content was measured in Well TX1, located north of the Sebei-1 gas field, which may assist in reconstructing the sedimentary environment. Data from boreholes SG-1, SG-1b, and SG-5 in the western part of the Qaidam Basin were also referenced and analyzed from published literature to interpret the evolution of paleoclimate from a geochemical perspective. The modern evaporitic analog from northeast Lake Chad, a present key to the past, was used as a geological model to analyze Quaternary sedimentary facies in the Taidong area.

3.2. Method

A seismic sedimentological workflow was developed by integrating geophysical, geochemical, and geological data to reconstruct evaporative facies in the Taidong area (Figure 3). The S-wave 3D seismic dataset was first phase-rotated to -90°. Wireline logs, including DTS and DEN, were then used to tie the phase-rotated seismic data. After achieving a good well-seismic tie, boundaries of the standard zones were interpreted. These boundaries define an isochronous framework, providing a connection between the two-way travel time in the seismic data and the depth and geological age indicated by the standard zones (Figure 1 and Figure 3). This connection is essential for analyzing the relationship between sedimentary facies and regional climate change.
The phase-rotated seismic data were decomposed into three sub-cubes using a wavelet algorithm: low-frequency (7 Hz), moderate-frequency (25 Hz), and high-frequency (35 Hz) components. These sub-cubes were then fused using the RGB method, where red, green, and blue represent low, moderate, and high frequencies, respectively. In this scheme, low frequencies correspond to thicker strata, moderate frequencies indicate intermediate thickness, and high frequencies reflect thinner layers (Xu et al., 2024). The independent nature of the three primary colors in the RGB fusion allows for the expression of geological features at different scales within the same map (Henderson et al., 2008; Xu et al., 2019). Stratal slices were generated from the RGB-fused cube and subsequently interpreted using geochemical and geological data.
The geochemical data, derived from regional and global parameters, reflect variables such as precipitation, temperature, and water salinity. Geological data, including modern Lake Chad's evaporative environment and published saline pan models, were used for further interpretation. Stratal slices were generated every two milliseconds, corresponding to the sampling rate of the S-wave seismic data, starting from the bottom of K2 (1.5 Ma BP) upwards. Three representative slices (Slice 1, 2, and 3) from the K2, K1, and K0 standard zones, where aridity and water salinity are different (Figure 2) were selected to investigate seismic facies by seismic geomorphology and seismic lithology. These seismic facies were then transformed into sedimentary facies by integrating geochemical and geological information in Qaidam Basin and modern analogs in Lake Chad. Time-structural maps of the three slices assisted in interpreting the sedimentary environments.

4. Results and Interpretation

Stratal slices were generated by seismic geomorphology and show us an outlook of the morphology features. According to quantitative reginal geochemical, mineral, and lithological data, evaporative facies were analyzed by seismic lithology.

4.1. Results

Slice 1 (Figure 4) exhibits two distinct regions: the eastern part, characterized by red to pink hues, and the western part, where green to yellow colors dominate. The color variations indicate differing strata thickness, with the eastern part being thicker than the western. The strong color contrast between red and blue in the eastern region suggests high heterogeneity, while the weak contrast in the western region reflects relatively low heterogeneity. In the eastern section (II), linear blue morphologies oriented NNE-SSW or NNE-SSE are visible, some of which are interconnected. In the western section (I), concentric bands of green to yellow surround the eastern red area.
On the RGB-fused stratal slice 2 (Figure 5), the eastern region is predominantly green (III), while the western region transitions from red (II) to pink (III). This color distribution indicates that the western part is thicker than the eastern. The linear morphologies observed in slice 1 evolve into sub-circular features that extend further to the west and north. At the boundaries of the sub-circular polygons, the colors transition from blue to purple, while the interiors range from green to yellow. These observations suggest a distinct vertical frequency structure, with higher frequency at the boundaries and lower frequency within the interiors. The average diameter of these polygons is approximately 1 km.
The RGB-fused stratal slice 3 (Figure 6), generated from the middle K0 standard zone, shows a relatively thin (green to yellow) feature in the study area. The sub-circular morphologies extend further, and in the eastern location (III), where these morphologies initially appear, they are replaced by larger elliptical features. The diameter of the larger ellipse is approximately 6.5 km. The boundaries of these polygons exhibit green to red coloring, while the interiors are green to blue, indicating lower frequency at the boundaries and higher frequency within the polygons. In the western part (II), the sub-circular morphologies are replaced by linear ones.
The time-structural maps of the three RGB-fused stratal slices provide valuable insights into the present geomorphology (Figure 7). On the time-structural map of slice 1, the eastern part is a dome dissected by several NNE-SSW ridges (red arrows) and troughs (blue arrows), as seen in Figure 7a. The dome becomes more dispersed due to the cutting of additional troughs and ridges (Figure 7b). The troughs and ridges are surrounded by relatively sub-circular highs in green to yellow colors on slice 2. The ridges narrow, and the troughs widen on the time-structural map of slice 3 (Figure 7c). The ridges are shown as red boundaries, and the troughs are flat, indicated by green to blue colors. The relief between the troughs and ridges increases from lower K2 to upper K0.
The lateral correspondence between geomorphology (time-structural maps) and vertical frequency structure (RGB-fused stratal slices) aids in interpreting the formation mechanisms of the unique linear to sub-circular morphologies observed in the study area. These sub-circular morphologies are present in multiple layers, with their frequency of occurrence increasing from K2 upwards (Figure 8g). Stratal slices 1, 2, and 3, taken from K2, K1, and K0, respectively, were selected as examples to correlate with contemporary regional climate, water salinity, and sedimentary facies.

4.2. Interpretation

Borehole SG-5, located in the western Qaidam Basin, reveals mudstone, clay, siltstone, marl, limestone, gypsum, and halite from a depth of 300 m upwards. Evaporites, such as gypsum and halite, appear around 250 m, corresponding roughly to the K2 standard zone in the Taidong area. The frequency of halite occurrence generally increases as burial depth shallows in the borehole (Figure 8a). Mn concentration data from boreholes SG-1 and SG-1b near SG-5 suggest that the climate has become progressively drier since K3 deposits (~1.7 Ma BP), with two periods of reduced aridity: upper K2 and lower K0 (Figure 8b). Water level and Mg/Ca values in borehole SG-1 were used to reconstruct aridity (Figure 8c) and water salinity (Figure 8d). Both aridity and salinity increased after 1.7 Ma BP, with a sharp escalation occurring after 0.73 Ma BP during K0 deposition. Global temperature anomalies (Figure 8e) and precipitation anomalies (Figure 8f) reflect a continuous decline in both temperature and precipitation, particularly after 0.73 Ma BP. Paleoyardangs found in the Sanhu area at 2.4 Ma BP further indicate persistent hyper-arid conditions since 1.2 Ma BP (Heermance et al., 2013).
Regional climate changes, derived from geological and geochemical data, provide critical insights into interpreting the unique features observed on RGB-fused stratal slices and time-structural maps. The timing and frequency of the sub-circular morphologies align with the evaporite distribution in borehole SG-5 and the regional climate evolution.
Sub-circular morphologies, such as those observed at the Bonneville Salt Flats, Utah (Bowen et al., 2017), generally have much smaller diameters—on the order of several meters—compared to the larger morphologies found in the Taidong area. Considering their geomorphology, vertical-frequency structure, average diameter, and associated lithologies, the sub-circular morphologies in Taidong are interpreted as saline pans formed in an eolian/interdunal sabkha (Figure 9a). This is distinct from sub-circular morphologies found in fluvial-lacustrine (Figure 9b) or marine-dominated sabkhas (Figure 9c) (Hanford, 1981; Kirkham, 1997; Warren, 2016; Rosen et al., 2020). Similar sub-circular morphologies with comparable dimensions are also observed in the northeastern region of modern Lake Chad (Warren, 2016), where the saline water is represented in sky-blue, plants in green, and saline sediment in grey-white.
The increase in the restricted degree of water from Lake Chad to its northeastern area follows a distinct pattern (Figure 9a). Freshwater predominates in the open Lake Chad (I), transitioning to semi-restricted brackish water in the northeastern flooded interdunal corridors (II), and finally to restricted brine water in the saline pans of the further northeastern interdunal corridors (III). As salinity increases from west to east, vegetation coverage decreases correspondingly. The water pools exhibit a shift in contour shape, from linear in the flooded interdunal corridors to sub-circular in the saline pan areas (Figure 10). Linear dunes in the region often connect at their ends. The salinity progression across this area starts with fresh water in Lake Chad, moving through brackish and saline water to dry saline pans in the most restricted and evaporative regions.
The sub-circular morphologies in northeastern Lake Chad are driven by monsoonal intensity and consist of dunes and saline pans. Mineral paragenesis in this area follows a sequential pattern from Lake Chad to the beach: calcite, aragonite, magnesium calcite, dolomite, huntite, magnesite, sodium carbonates, sodium sulfates, halite, and sylvite (Gac et al., 1979). This lateral mineral distribution reflects an increasing degree of evaporation, creating a sedimentary environment dominated by sand and salt deposits. Core analysis further supports this trend, revealing a rise in chloride concentration with shallower burial depths (Isiorho et al., 1996), indicating a vertical increase in evaporation intensity in the area.
Monsoon winds from the northeast during the dry season and from the southwest during the rainy season govern dune orientation in the region, which typically trends northwest-southeast. In the brackish lakes (Figure 11) located in the flooded interdunal corridors near Lake Chad, water is semi-restricted with higher salinity than the freshwater of Lake Chad.
In the sub-circular saline lakes, water is shallow with high salinity. Sparse vegetation surrounds these saline lakes due to the brine concentration. Within the saline lakes, halite and sylvite may precipitate, forming small (tens of meters in diameter) polygonal structures in the southwestern parts of the lake (Figure 12). In the central areas, larger polygons (up to 100 meters in diameter) are observed, likely caused by sand bridges or evaporative buildups.
As evaporation intensifies, a saline lake eventually transforms into a dry saline pan when all brine water evaporates completely (Figure 13). Despite some vegetation planted near a village in the central region, the landscape is almost entirely covered with silt or mixed with evaporite deposits.
Building upon the inspiration from the sedimentary environment variations observed in Lake Chad and its northeastern area, we interpret the evaporative facies in Taidong area using the saline pan evolution model proposed by Lowenstein and Hardie (1985) (Figure 14). This model describes the development of saline pans through three key stages: freshwater flooding in a brackish lake, evaporative concentration in a saline lake, and desiccation in a dry saline pan where surface crusts break into sub-circular polygons. In an eolian-dominated setting, silt can cover these polygons, further influencing the morphology of the sedimentary environment.
Sedimentary process varies in the three stages. In stage 1, the water level is high, and older saline crusts are dissolved by the influx of fresh water. This leads to the deposition of mud and/or eolian silt in the brackish lake. In stage 2, As evaporation intensifies, the water level lowers, and saline concentration increases. In the saline lake, subaqueous crystallization occurs, leading to the formation of salt crystals, including syntaxial saline overgrowths and nucleated rafts and hoppers at the water surface. In stage 3, With the complete evaporation of the lake water, a dry saline pan forms. Diagenetic salt growth within the pan and beneath the crust leads to the formation of pressure polygons. These polygons exhibit sub-circular geometries.
In an eolian-dominated sabkha (desert lake), the process continues with ongoing salt growth, fissuring, and dissolution. Eolian silt infiltrates cracks, deforming the crust surface into knobs and ridges. Clays beneath the crust may also be pushed upward through the fractures (Lugli et al., 1999).
Given the generally drying and cooling environmental conditions in the Sanhu area over the past 1.51 million years, an eolian-dominated lacustrine sabkha serves as the geological background for the sedimentary facies observed in the three RGB-fused stratal slices from K2, K1, and K0 in the Taidong area (Figure 14).
Slice 1: The western part (I) is interpreted as a freshwater lake, while the eastern part (II) is a brackish lake, with embryonic sub-circular geometries in kilometer scale. The orientation of these geometries follows a northeast-southwest trend, nearly vertical to the Quaternary monsoon direction (Ma et al., 2022) in the Qaidam Basin.
Slice 2: As evaporation intensifies, the kilometer scale sub-circular geometries become more defined and widespread, indicating a shift to an increasingly evaporative environment. Freshwater lakes retreat to the west (I). Diameter of the subcircular geometries increases slightly in brackish lakes (II) while decreases to less than 1 km in saline lakes (III).
Slice 3: In the final stage of evaporation (K0), dry saline pans (III) emerge in the eastern part of Taidong area. These dry pans may be covered by eolian silt, which obscures the sub-circular polygons into a larger ellipse with 6.5 km in diameter. The western part (II) remains a saline lake with sub-circular geometries.
Stratal distribution and lithologies observed at the Yanshan outcrop (corresponding to upper Pleistocene) east of the Taidong area provide further evidence for the evaporative facies interpretation. The strata are gently dipping (<1°) and exhibit parallel interbedding of siltstone, limy-mudstone, and evaporative saline layers at the decimeter scale (Figure 15a). The siltstone layer appears brown, the limy-mudstone is light grey, and the evaporative saline layer is greyish-green. Notably, the evaporative layers contain anhydrite (indicated by a pink arrow in Figure 15b) and halite (indicated by a green arrow in Figure 15b).

5. Conclusions

1. The S-wave 3D seismic data have superior vertical resolution because of their lower velocity than the P-wave data in shallow buried strata. The S-wave data are unaffected by biogenic gas, and are proved to be valuable for constructing an isochronous framework in the Quaternary biogenic gas-bearing Taidong area in the Sanhu Depression of the Qaidam Basin. By calibrating the S-wave acoustic wireline log, the framework of standard zones interpreted from the seismic data was successfully tied to geological ages, providing a solid foundation for reconstructing evaporite facies in the Taidong area using synchronized geochemical and geological features.
2. The application of seismic sedimentological techniques—such as phase rotation, frequency decomposition, RGB fusing, and stratal slicing—proved effective in mapping seismic facies at different depths from K2 upward across the Taidong area. By integrating regional climate data, water salinity information, and modern analogs, these seismic data allowed for a comprehensive interpretation of sedimentary facies based on their geomorphological and frequency characteristics.
3. The sub-circular polygons recognized on the stratal slices generated by seismic sedimentology were interpreted as evaporative facies, i.e., brackish lake, brine saline lake, and dry saline pans for the first time. The evaporative facies in Taidong area occur from K2 (1.51 Ma BP) and increase in frequency thereafter. The evaporative intensity generally strengthened in response to regional increases in aridity and water salinity. Through the analysis of three typical RGB-fused slices from K2, K1, and K0, the study identified the progression of different evaporative environments, including fresh water lakes in the west, brackish lakes in the middle, and brine saline lakes and/or dry saline pans covered by silt in the east.
4. The lateral distribution and vertical evolution of evaporative facies in the Taidong area provide critical insights into the regional climate changes during the Quaternary period. This information not only aids in identifying superior sealing rocks for biogenic gas accumulation but also has potential applications in the exploration and extraction of evaporite resources in the region.

Author Contributions

Conceptualization, G. L. and Z. X.; methodology, G. L., Z. X., H. Z., and X. Z.; validation, Z. X. and Y. S.; formal analysis, J. L. and C. L.; investigation, G. L., Z. X., J. L., C. L., J. T., and L. J.; resources, G. L., Z. X., J. L., C. L., Z. W., and J. T.; writing—original draft preparation, Z. X. and G. L.; writing—review and editing, G. L., H. Z., Y. S., and X. Z.; funding acquisition, Z. X. All authors have read and agreed to the published version of the manuscript.

Funding

This research was funded by CNPC Science and Technology Projects, grant numbers 2022-N/G-47808, 2023-N/G-67014; RIPED International Cooperation Project, grant number 19HTY5000008.

Conflicts of Interest

The authors declare no conflict of interest.

References

  1. Bowen, B. B.; Kipnis, E. L.; Raming, L. W. Temporal dynamics of flooding, evaporation, and desiccation cycles and observations of salt crust area change at the Bonneville Salt Flats, Utah. Geomorphology. 2017, 299, 1–11. [Google Scholar] [CrossRef]
  2. Czauner, B.; Szabó, Z.; Márton, B.; Mádl-Sz˝onyi, J. Basin-scale hydraulic evaluation of groundwater flow controlled biogenic gas migration and accumulation in the central Pannonian Basin. Water. 2023, 15, 3272. [Google Scholar] [CrossRef]
  3. Dudley, D. R.; George, E. C. Generation, accumulation, and resource potential of biogenic gas. AAPG Bulletin. 1981, 65, 5–25. [Google Scholar]
  4. Efrina, C. A. P.; Hermes, P.; Hamriani, R.; Nor, S. H. Biogenic gas – “from drilling hazard to promising future hydrocarbon resource”: Study of Mamberamo Frontier Basin, north Papua, Indonesia. BIO Web of Conferences. 2023, 73, 04007. [Google Scholar]
  5. Gac, J. Y.; Al-Droubi, A.; Paquet, H.; Fritz, B.; Tardy, Y. Chemical model for origin and distribution of elements in salts and brines during evaporation of waters. Application to some saline lakes of Tibesti, Chad. Physics and Chemistry of the Earth. 1979, 11, 149–158.
  6. George, E. C.; Charles, N. T.; Leslie B., M. Biogenic and thermogenic origins of natural gas in Cook Inlet Basin, Alaska. AAPG Bulletin. 1980, 64, 1131–1139. [Google Scholar]
  7. Goldsmith, L. H. Concentration of potash salts in saline basins. AAPG Bulletin. 1969, 53, 790–797. [Google Scholar]
  8. Goodall, T. M.; North, C. P.; Glennie, K. W. Surface and subsurface sedimentary structures produced by salt crusts. Sedimentology. 2000, 47, 99–118. [Google Scholar] [CrossRef]
  9. Hanford, C. R. A process-sedimentary framework for characterizing recent and ancient sabkhas. Sedimentary Geology. 1981, 30, 255–265. [Google Scholar] [CrossRef]
  10. Heermance, R. V.; Pullen, A.; Kapp, P.; Garzione, C. N.; Bogue, S.; Ding, L.; Song, P. Climatic and tectonic controls on sedimentation and erosion during the Pliocene-Quaternary in the Qaidam Basin (China). GSA Bulletin. 2013, 125, 833–856. [Google Scholar] [CrossRef]
  11. Henderson, J.; Purves, S.J.; Fisher, G.; Leppard, C. Delineation of geological elements from seismic attributes and RGB blending. Lead. Edge. 2008, 27, 342–350. [Google Scholar] [CrossRef]
  12. Isiorho, S. A.; Matisoff, G.; Wehn, K. S. Seepage relationships between Lake Chad and the Chad aquifers. Ground Water. 1996, 34, 819–826. [Google Scholar] [CrossRef]
  13. Jin, Z.; Zhang, M.; Tang, L.; Li, J. Evolution of Meso-Cenozoic Qaidam Basin and its control on oil and gas. Oil & Gas Geology. 2004, 25, 603–608.
  14. John, D. G.; George, F. H. Giant gas fields of northern west Siberia. AAPG Bulletin. 1986, 70, 830–852. [Google Scholar]
  15. Kirkham, A. Shoreline Evolution, Aeolian deflation and anhydrite distribution of the Holocene, Abu Dhabi. GeoArabia. 1997, 2, 403–416. [Google Scholar] [CrossRef]
  16. Li, Y.; Lin, C. Exploration methods for late Quaternary shallow biogenic gas reservoirs in the Hangzhou Bay area, eastern China. AAPG Bulletin. 2010, 94, 1741–1759. [Google Scholar] [CrossRef]
  17. Liu, Y.; Yang, Y.; Ye, C.; Yang, R.; Appel, E.; Fang, X. Global change modulated Asian inland climate since 7.3Ma: Carbonate manganese records in the western Qaidam Basin. Frontiers in Earth Science. 2021, 9, 1–11.
  18. Liu, Z.; Sun, S.; Yang, F.; Zhou, Z. Quaternary stratigraphy and its chronology analysis from Sanhu region of Qaidam Basin. Science in China (Series B). 1990, 11, 1201–1212.
  19. Lowenstein, T. K.; Hardie, L. A. Criteria for the recognition of salt-pan evaporites. Sedimentology. 1985, 32, 627–644. [Google Scholar] [CrossRef]
  20. Lu, S.; Ma, Y.; Lü, S.; Han, W.; Han, S.; Han, F.; Fang, X. Systematic boron isotope analysis on a Quaternary deep SG-1 core from the Qaidam Basin, NE Tibetan Plateau and its paleoclimate implication. Quaternary International. 2022, 631, 1–10. [Google Scholar] [CrossRef]
  21. Lugli, S.; Schreiber, B. C.; Triberti, B. Giant polygons in the Realmonte mine (Agrigento, Sicily): Evidence for the desiccation of a Messinian halite basin. Journal of Sedimentary Research Section A-Sedimentary Petrology & Processes. 1999, 69, 764–771.
  22. Ma, F.; Lv, P.; Cao, M. The Effects of Wind Regime and Sand Supply on the Coexistence of Barchans and Linear Dunes in China’s Qaidam Basin. Front. Earth Sci. 2022, 10, 897640. [Google Scholar] [CrossRef]
  23. Manabe, S.; Broccoli, A.J. Mountains and arid climates of middle latitudes. Science, 1990, 247, 192–195limates of middle latitudes.
  24. Morris, R. C.; Dickey, P. A. Modern evaporite deposition in Peru. AAPG Bulletin. 1957, 41, 2467–2474. [Google Scholar]
  25. Rosen, M. R.; Stillings, L. L.; Kane, T.; Campbell, K.; Vitale, M. P. G.; Spanjers, R. P.G. Li and Ca enrichment in the Bristol dry lake brine compared to brines from Cadiz and Danby dry lakes, Barstow-Bristol Trough, California, USA. Minerals. 2020, 10, 284. [Google Scholar] [CrossRef]
  26. Wang, J.; Fang, X.; Appel, E.; Song, C. Pliocene-Pleistocene climate change at the NE Tibetan Plateau deduced from lithofacies variation in the drill core SG-1, western Qaidam Basin, China. J. Sediment. Res. 2012, 82, 933–952. [Google Scholar] [CrossRef]
  27. Wara, M. W.; Ravelo, A. C.; Delaney, M. L. Permanent El Niño-Like conditions during the Pliocene warm period. Science. 2005, 309, 758–761. [Google Scholar] [CrossRef] [PubMed]
  28. Warren, J.K. Evaporites: A Geological compendium (second edition). Springer International Publishing Switzerland, 2016.
  29. Williams, C. J. R.; Lord. N. S.; Kennedy-Asser, A. T.; Richards, D. A.; Crucifix, M.; Kontula, A.; Thorne, M.; Valdes, P. J.; Foster, G. L.; Brown, R.; McClymont, E. L.; Lunt, D. J. The relative role of orbital forcing, CO2 and ice sheet feedbacks on Quaternary climate. 2024, Preprint.
  30. Xu, Z.; Hu, S.; Wang, L.; Zhao, W.; Cao, Z.; Wang, R.; Shi, S.; Jiang, L. Seismic sedimentologic study of facies and reservoir in middle Triassic Karamay Formation of the Mahu Sag, Junggar Basin, China. Marine and Petroleum Geology. 2019, 107, 222–236. [Google Scholar] [CrossRef]
  31. Xu, Z.; Li, J.; Li, J.; Chen, Y; Yang, S.; Wang, Y.; Shao, Z. Application of 9-component S-wave 3D seismic data to study sedimentary facies and reservoirs in a biogas-bearing area: A case study on the Pleistocene Qigequan Formation in Taidong area, Sanhu Depression, Qaidam Basin, NW China. PETROL. EXPLOR. DEVELOP. 2024, 51, 647–660.
  32. Zeng, H.; Henry, S. C.; Riola, J. P. Stratal slicing: Part II. Real seismic data. Geophysics. 1998, 63, 514– 522.
  33. Zeng, H.; Hentz, T. F. High-frequency sequence stratigraphy from seismic sedimentology: applied to Miocene, Vermilion Block 50, Tiger Shoal area, offshore Louisiana. AAPG Bulletin. 2004, 88, 153–174. [Google Scholar] [CrossRef]
  34. Zeng, H.; Zhao, W.; Xu, Z.; Fu, Q.; Hu, S.; Wang, Z.; Li, B. Carbonate seismic sedimentology: A case study of Cambrian Longwangmiao Formation, Gaoshiti-Moxi area, Sichuan Basin, China. PETROL. EXPLOR. DEVELOP. 2018, 45, 830–839. [Google Scholar] [CrossRef]
  35. Zhang, W.; Li, T.; Fang, X.; Zhang, T.; Yan, M.; Zan, J.; Yang, Y.; Khatri, D. B. Chronological and rock magnetic constraints on the transition of the Quaternary paleoclimate in the western Qaidam Basin, NE Tibetan Plateau. Quaternary Research. 2021, 104, 1–12. [Google Scholar] [CrossRef]
Figure 1. Location of Qaidam Basin, data points in the basin, and Quaternary lithological column in Sanhu Depression.
Preprints 145177 g001
Figure 2. S-wave 3D seismic profile crossing Well SE39 (see the location of profile AB in Figure 4).
Preprints 145177 g002
Figure 3. Data and workflow used in this study.
Preprints 145177 g003
Figure 4. RGB-fused stratal slice 1 at lower K2 (see the pink line for the slice location in Figure 2).
Preprints 145177 g004
Figure 5. RGB-fused stratal slice 2 at lower K1 (see the blue line for the slice location in Figure 2).
Preprints 145177 g005
Figure 6. RGB-fused stratal slice 3 at middle K0 (see the green line for the slice location in Figure 2).
Preprints 145177 g006
Figure 7. Present time structure maps corresponding to the three stratal slices in K2 (a), K1 (b), and K0 (c).
Preprints 145177 g007
Figure 8. Quaternary regional climate and water salinity in Qaidam Basin and global temperature and precipitation anomaly. (a) Lithology in borehole SG-5 (Zhang et al., 2021). (b) Mn content and environment in SG-1 and SG-1b (Liu et al., 2021). (c) Water level in SG-1 (Wang et al., 2012). (d) Salinity in SG-1(Lu et al., 2022). (e) Globel temperature anomaly (Wara et al., 2005; Williams, et al., 2024). (f) Globel precipitation anomaly (Williams et al., 2024). (g) Well information and standard zone age (Liu et al., 1990) in Well SE39 (arrows indicate location with sub-circular morphologies; the three red arrows indicate location of the three analyzed slices).
Preprints 145177 g008
Figure 9. Image of Lake Chad (a), Bristol Dry Lake (b), and Abu Dhabi sabkha (c) to show eolian, fluvial-lacustrine, and marine dominated sabkha, respectively.
Preprints 145177 g009
Figure 10. Image of brackish lake (Figure 11), saline lake (Figure 12), and dry saline pan (Figure 13) in interdunal corridors northeastern Lake Chad.
Preprints 145177 g010
Figure 11. Image of a brackish lake in interdunal corridors northeastern Lake Chad.
Preprints 145177 g011
Figure 12. Image of a saline lake in interdunal corridors northeastern Lake Chad.
Preprints 145177 g012
Figure 13. Image of a dry saline pan in interdunal corridors northeastern Lake Chad.
Preprints 145177 g013
Figure 14. Model of saline pan evolution (modified from Lowenstein and Hardie, 1985; Warren, 2016), modern Lake Chad, and interpretation of evaporative facies in Taidong area.
Preprints 145177 g014
Figure 15. Stratal distribution and evaporites at Upper Pleistocene Yanshan outcrop east of Taidong area.
Preprints 145177 g015
Disclaimer/Publisher’s Note: The statements, opinions and data contained in all publications are solely those of the individual author(s) and contributor(s) and not of MDPI and/or the editor(s). MDPI and/or the editor(s) disclaim responsibility for any injury to people or property resulting from any ideas, methods, instructions or products referred to in the content.
Copyright: This open access article is published under a Creative Commons CC BY 4.0 license, which permit the free download, distribution, and reuse, provided that the author and preprint are cited in any reuse.
Prerpints.org logo

Preprints.org is a free preprint server supported by MDPI in Basel, Switzerland.

Subscribe

Disclaimer

Terms of Use

Privacy Policy

Privacy Settings

© 2025 MDPI (Basel, Switzerland) unless otherwise stated