
Submitted:
03 January 2025
Posted:
06 January 2025
You are already at the latest version
Abstract
Well-aging strategies include the use of both oral and topic products to nourish the skin from the inside out. A clinical-instrumental study was conducted on 96 subjects with mild to moderate facial aging to demonstrate the efficacy of probiotics (Lactobacillus plantarum PBS067, Lactobacillus reuteri PBS072 and Lactobacillus rhamnosus LRH020) intake combined with topical ectoin and sodium hyaluronate. The skin sebum content, hydration and moisturization, profilometry (wrinkle depth and skin smoothness), TEWL, elasticity (R0 and R2 parameters), radiance, and pores (size and impurities) were measured after 4 and 8 weeks of products use. These parameters were also integrated by a self-assessment questionnaire to align the measured and the perceived efficacy. One hour after serum application, wrinkle depth was reduced by 9.2%, while skin hydration increased by 16.6% and skin radiance by 19.1% following cream application. After 4 and 8 weeks of use, both the oral and topical products were shown to respect the skin's hydrolipid film, effectively improve skin parameters associated with aging, and detoxify the skin from impurities. The mechanism behind these improvements was linked to an enhancement of the skin microbiome. Our findings clearly demonstrate the efficacy of probiotic intake combined with topical ectoin and sodium hyaluronate in enhancing skin health and mitigating signs of skin aging.
Keywords:
skin aging
; probiotics
; ectoin
; sodium hyaluronate
; clinical trial
1. Introduction
The human skin is a complex living ecosystem that hosts a rich variety of microorganisms, collectively known as the skin microbiota, which includes bacterial species such as Cutibacterium, Corynebacterium, Staphylococcus, and Proteobacteria [1,2,3,4]. The skin microbiota is essential to skin barrier function, helping to protect the skin and the deeper organs from inflammation, infections, and environmental stressors like UV radiation and pollution [1,5,6,7,8,9,10]. It also shares a bidirectional relationship with aging, as both changing with age and influencing the skin aging process [11,12,13]. This bidirectional relationship is part of the skin interactome, a novel integration the “genome-microbiome-exposome” that plays a significant role in skin aging and skin health [11,14].
Imbalance of the skin microbiota (i.e. dysbiosis) is often associated with skin conditions such as acne vulgaris, rosacea, psoriasis and atopic dermatitis, as well as pathological conditions including cutaneous wounds and ulceration, and melanoma [15,16,17,18,19,20,21,22,23,24]. The dysbiosis typically involves an increased colonization of pathogens, a reduced number of beneficial commensals, and a variation in both alpha (i.e. evenness and abundance of microbial species at sample level) and beta diversity (i.e. similarity or difference in microbial communities between samples or conditions) [25,26,27]. The study of skin microbiota dysbiosis, as well as the normal microbiota, and skin aging is therefore of great interest for diagnosing skin diseases, identifying therapeutic options, and maintaining the skin barrier in optimal condition [28].
Growing evidence also highlights a crucial role of the gut microbiota in supporting skin health by strengthening the skin barrier function [29,30]. Disruption of gut integrity and imbalances in its microbiota can significantly impact skin homeostasis and allostasis, with a growing body of research highlighting a bidirectional interaction between the gut and the skin [29]. This interaction, termed the “gut–skin axis”, highlights the complex relationship between the gut and the skin [31,32].
The interaction between the skin and the gut microbiomes underpins the combined use of food supplements and cosmetic products (in & out approach) to address skin aging on multiple levels, helping to nourish the skin from within while providing topical benefits [33,34,35,36]. This trial aimed to assess the antiaging efficacy of a patented [37] “in & out” approach providing targeted microbiome support through a combination of oral probiotics containing Lactobacillus plantarum PBS067, Lactobacillus reuteri PBS072 and Lactobacillus rhamnosus LRH020, supported by adjuvant topical products containing ectoin (an amino acid derivative with osmoprotectant properties), fruit water, triglycerides and a proprietary multi-molecular weight hyaluronate compound.
2. Materials and Methods
2.1. Trial Design and Ethics
The trial was a single-center, randomized (1:1:1:1 balanced randomization), double-blind, placebo-controlled with four treatment arms, conducted at Complife Italia S.r.l. facility in San Martino Siccomario (PV), Italy, from March to September 2023. It consisted of a screening visit, a baseline visit (W0) and two follow-up visits after 4 (W4) and 8 (W8) weeks of products use. During the baseline visit, the filler effect of the serum and the hydrating and glowing effect of the cream were tested 1 hour after products application. After the enrollment subjects were randomized to receive the active food supplement and the placebo cosmetic products (AFPC), the placebo food supplement and the placebo cosmetic products (PFPC), the active food supplement and the active cosmetic products (AFAC) and the placebo food supplement and the active cosmetic products (PFAC).
All trial procedures were conducted in accordance with the World Medical Association’s (WMA) Helsinki Declaration and its amendments. The study protocol and all trial-related documents were approved by the “Comitato Etico Indipendente per le Indagini Cliniche Non Farmacologiche” (ref. no. 2002/01 by 02/02/2022). Each participant provided written informed consent (ICF) prior to the initiation of any study-related procedures.
The trial was designed to demonstrate the test product claim(s) in the current framework proposed by Commission Regulation (EU) No 655/2013. Endpoints were measured using techniques currently accepted in the cosmetic field while biases are minimized by procedure(s) standardization according to ISO 9001 Quality Management System.
2.2. Participants and Compliance with Treatment
Eligible participants included healthy male and female subjects aged 45 to 65 years with mild to moderate signs of facial aging and (self-declarative) sensitive skin. Exclusion criteria included natural or artificial UV exposure (e.g., tanning beds or facial lamps), dermatological skin conditions and medical histories that could interfere with study outcomes, pharmacological treatments interfering with the study outcomes (e.g. antibiotics), Botox treatment or intention to have Botox treatment during the study period, breastfeeding, pregnancy, and unwillingness to take the necessary precautions to avoid pregnancy (for women of childbearing potential). The complete inclusion and exclusion list is reported in the Supplementary Materials (Table S1).
Throughout the study period, participants were asked to maintain a journal documenting their food and drink consumption to ensure stability in their dietary habits. They were also instructed to report any adverse events. Compliance with treatment was evaluated by counting and recording the number of the remaining (not used) stick packs after 4 and 8 weeks of treatment, with a compliance threshold set at ≥ 80%.
2.3. Interventions and Randomization
The test item was a commercially available in & out patented (no. EP4151217) [37] treatment (“AWvi – The skin method”) supplied by AW Srl (Sesto Fiorentino, FI, Italy). The treatment consisted of a food supplement (AWvi – The Skin Biotic), a cleanser (AWvi – The Gentle Cleanser), a serum (AWvi – The Power of Serum), and a cream (AWvi – The Active Cream).
Each treatment arm consisted of 24 subjects receiving the active food supplement and the placebo cosmetic products (group AFPC), the placebo food supplement and the active cosmetic products (group PFAC), the active food supplement and the active cosmetic products (AFAC), the placebo food supplement and the placebo cosmetic products (PFPC). The active food supplement treatment arm received (daily) 1 stick pack containing 10 mg Lactobacillus plantarum (PBS067-DSM 24937), 25 mg Lactobacillus reuteri (PBS072-DSM 25175), Lactobacillus rhamnosus (LRH020-LMG P-29513/DSM 25568), 927.015 Sorbitol, 1000 mg Fructo-oligosaccharides, 1.476 mg Vitamin A Acetate, 0.009 mg Biotin, 20 mg Silicon dioxide (E551). The placebo product formula was identical to the active formula, except that lactobacilli were replaced by an equivalent amount (51.5 mg) of maltodextrin.
The cosmetic products actives were sodium hyaluronate, ectoin, fruit water and triglycerides. The complete ingredient (INCI) list is reported in the Supplementary Materials (Table S2).
The placebo formulas (Supplementary Table S2) were the same as the active’s formulas without the following active ingredients: ECTOIN and SODIUM HYALURONATE. Both the active and placebo products were applied as follows: massage the cleanser onto damp skin and rinse with water; apply the serum to dry and cleansed skin and once the serum is absorbed apply the cream. All the products were applied twice a day (morning and evening) all over the face (including the neck and the eye contour area).
2.4. Outcomes
2.4.1. Primary Outcomes
The primary outcomes of the trial were the measurement of the skin sebum content and the skin hydration (ability of the product to attract water when applied, humectant) and moisturization (increase of the water content by improvement of the skin barrier efficiency).
The skin sebum content (μg/cm2) measurement was based on the “grease spot photometry” technique with a Sebumeter® SM 815 (Courage + Khazaka electronic GmbH, Cologne, Germany).
The skin hydration (1 hour after the cream application) and the skin moisturization (after 4 and 8 weeks of each tested treatment) were measured by the capacitance method using a Corneometer® CM 825 (Courage + Khazaka electronic GmbH, Cologne, Germany).
2.4.2. Secondary Outcomes
The secondary outcomes of the trial were related to the assessment of the efficacy of the products in improving skin signs related to aging. The secondary outcomes included the following measurements: wrinkle depth, skin smoothness, transepidermal water loss (TEWL), skin elasticity, skin radiance, pores (size and impurities) and skin microbiome.
The profilometric properties (wrinkle depth and skin smoothness) of the skin were measured in the “crow’s feet” area by a PRIMOSCR small field device (Canfield Scientific Europe, BV, Utrecht, The Netherlands). Subjects repositioning between each visit was ensured by a stereotactic device (Canfield Scientific Europe, BV, Utrecht, The Netherlands).
Transepidermal water loss (TEWL) was measured with an open-chamber Tewameter® TM Hex (Courage + Khazaka electronic GmbH, Cologne, Germany) in the cheeks area.
The skin elasticity measurement was based on the suction method using Cutometer® MPA 580 equipped with a 2 mm diameter probe. The measured parameters included R0 (Uf) and R2 (Ua/Uf). R0, referred to as skin firmness, represents the maximum skin deformation (Uf) observed during the suction phase, while R2, known as overall elasticity, is defined as the ratio of skin distension during the elongation phase (Ua) to the maximum skin deformation (Uf) during the suction phase. Both parameters were measured in the cheeks area.
Skin radiance was measured, in the cheeks area, by the 8°gloss parameter taken with a colorimeter/spectrophotometer CM 700D (Konica Minolta, Milan, Italy).
The pore sizes and the protoporphyrin (microbial impurities) distribution were measured in the area near the nose by morphometric and colorimeter image analysis on digital pictures taken with VISIA®-CR (Canfield Scientific Europe, BV, Utrecht, The Netherlands).
Microbiome samples were obtained by swabbing a 3.5 x 5.5 cm area on the volunteers’ face (cheek), outlined by a disposable adhesive template (Copan Spa, Brescia, Italy), by using a moistened FLOQswab® (Copan Spa, Brescia, Italy). For each participant, the collection site was brushed 10 times horizontally and 10 times vertically. Subsequently, the swabs were immersed in 1 mL of preservation medium (eNat®, Copan Spa, Brescia, Italy), and stored at room temperature for up to four weeks. Prior to isolating microbial DNA, the samples were prepared in accordance with the methodology previously described [38] and immediately stored at –20°C until further use.
Bacterial DNA was isolated using the QIAamp® DNA Microbiome Kit (Qiagen, Hilden, Germany), in accordance with the manufacturer’s guidelines. The yield and quality of the extracted DNA were assessed using the QubitTM 1X dsDNA HS Assay Kit (Invitrogen Co., Carlsbad, CA, USA) on a QubitTM Flex Fluorometer (Thermo Fisher Scientific, Waltham, MA, USA). Polymerase chain reaction (PCR) amplification of the V1-V3 hypervariable regions of the bacterial 16S rRNA gene was performed using the Microbiota Solution A kit (Arrow Diagnostics, Genoa, Italy). The resulting products were purified using Agencourt AMPure XP magnetic beads (Beckman Coulter Inc., Brea, CA, USA). The amplicon size and purity of the PCR products, including a negative control, were determined by electrophoresis on 1.5% agarose gel in TAE buffer (1X). A further measurement was performed to ascertain the DNA concentration of the libraries, and samples were pooled in equimolar concentrations. The final amplicon libraries were sequenced on a MiSeq Illumina® sequencing platform using a MiSeq Reagent Kit v2 cartridge for 2 × 250 paired-end sequencing (Illumina Inc., San Diego, CA, USA).
2.4.3. Self-Assessment Questionnaire
At each checkpoint Subjects were asked to give their opinion on the tested product by answering a questionnaire about the product’s perceived effects and satisfaction. The questionnaire was taken before any outcome measurement so as not to influence the participants’ answers. Possible answers were “fully agree”, “agree”, “neither agree nor disagree”, “rather don’t agree”, or “don’t agree al all”. Both “fully agree” and “agree” were included in the calculation of the responders.
2.5. Sample Size
The sample size was determined using a two-sided significance level of 5% and a power of 80%. The calculation accounted for a 20% variation in the primary endpoints, attributable to both inter-individual variability and measurement technique errors. The sample size was calculated using PASS 11 statistical software (version 11.0.8, PASS, LLC, Kaysville, UT, USA). A sample size of 20 subjects per group was obtained. Four subjects more were added in each panel to take an anticipate dropout rate by 20%.
2.6. Randomization and Blinding
Subjects were randomized in a 1:1:1:1 ratio to receive either active or placebo treatments using a computer-generated randomization list (PASS 11, version 11.0.8, PASS, LLC, Kaysville, UT, USA) based on the "Efron's biased coin" algorithm. The randomization list was securely concealed within sequentially numbered, sealed, and opaque envelopes. The study followed established protocols to ensure a clear separation between the investigator and their collaborators and the staff administering the intervention. All the products were identical in size and shape.
2.7. Statistical Analysis
2.7.1. Analysis of Clinical Endpoints
The intragroup (vs. baseline) statistical analysis was performed on the raw data by repeated measures analysis of variance (RM-ANOVA) followed by Tukey-Kramer post hoc test or by t test of Student. The intergroup (active vs. placebo) statistical analysis was performed on the percentage variations by one-way analysis of variance followed by Tukey-Kramer post hoc test. Statistically significant data were reported as follows: * p < 0.05, ** p < 0.01, and *** p < 0.001.
2.7.2. Analysis of Microbiome Data
Raw sequencing data were processed using MicrobAT (Microbiota Analysis Tool) v.1.1.0 software (SmartSeq Srl, Novara, Italy) by comparison with the Ribosomal Database Project (RDP) database. Once filtered for read length (< 200 nt) and quality (average Phred quality score < 25) [39], the resulting sequences were aligned with a similarity threshold of ≥ 97% and assigned to taxonomic levels with a query coverage of 80% [40]. Features without taxa designation were ascribed to the corresponding unclassified group. A secondary analysis of the results was performed using MicrobiomeAnalyst Software [41,42], where features with low counts and variance were identified and removed while the remainder were analyzed according to their median abundance levels (minimum count 4) across samples.
Sample biodiversity calculated as the alpha diversity (diversity within the group) and the beta diversity (diversity between groups). For alpha diversity, two indices were employed: the Shannon index, which estimates the overall number of different taxa present; a higher Shannon index indicates a greater diversity of individual taxa. The Simpson index, often referred to as the "evenness" index, is based on a logarithmic scale and evaluates whether a few taxa dominate the microbiome (values close to 1) or if the abundance distribution is more balanced (values closer to 0). Beta diversity analysis was performed to evaluate differences in the overall taxonomic composition between groups. The distance matrix, generated by using the Bray-Curtis dissimilarity method, was visualized in two plots through principal coordinate analysis (PCoA). In these plots, each point represents the entire microbiota of a single sample. The statistical significance of the observed differences between microbial communities of each group was assessed using permutational analysis of variance (PERMANOVA) and reported as follows: * p < 0.05, ** p < 0.01, and *** p < 0.001.
3. Results
3.1. Participant Characteristics, Tolerability, and Compliance with Treatment
A total of 121 (n = 121) subjects were screened; 25 were excluded, with 16 not meeting the inclusion criteria and 9 declining to participate. The trial successfully randomized 96 subjects with 24 subjects per group. Ninety-four subjects completed the study, while two subjects in the AFAC group dropped out for personal reason not related to products use. The participants flow chart is reported in Figure 1.
The enrolled subjects were male and female Caucasian aged between 45 and 65 years old with mild to moderate signs of facial aging and sensitive skin. Additional demographics and the baseline characteristics of the participants are shown in Table 1 and clearly indicate the absence of covariates.
All tested products were well tolerated, with no adverse effects reported either by the investigator or the participant. Dietary habits remained consistent throughout the study period and did not represent a covariate between the groups.
Compliance with treatment was above 90% in each group (AFPC: 97.4 ± 0.5%; PFAC: 97.8 ± 0.5%; AFAC: 97.2 ± 0.5%; PFPC: 97.3 ± 0.4%).
3.2. Short Term Results With Topical Products Apllication
The wrinkle depth in the “crow’s feet area” (Figure 2a) was 293.1 ± 14.1 μm in the active group (n = 48) and 290.5 ± 14.2 μm in the placebo group (n = 48). One hour after applying the active serum, wrinkle depth statistically significantly (p < 0.001) decreased by 9.2% compared to a 3.9% reduction (p < 0.01) in the placebo group. The effect size of the serum in reducing wrinkle depth was then 2.4 times greater in the active group compared to the placebo group (p < 0.05).
The skin hydration 1-hour after the application (Figure 2b) of the active cream was statistically significantly (p < 0.001) increased by 16.6% (55.2 ± 0.9 c.u. at T1h vs. 47.6 ± 1.0 at T0 cu). The placebo group also showed a statistically significant increase in skin hydration of 9.2% (p < 0.001), with the effect of the active cream being 1.8 times greater (p < 0.001).
A statistically significant increase of skin radiance (Figure 2c) was recorded with both the active (+19.1%, p < 0.001) and the placebo cream (+13.1%, p < 0.001) after 1 hour, with a 1.5 times greater effect for the active cream (p < 0.05).
3.3. Primary Endpoints
In the AFPC group, skin moisturization statistically significant increased by 10.7% (p < 0.001) and 17.0% (p < 0.001), after 4 and 8 weeks of treatment, respectively (Table 2). A similar (p < 0.05) increase in skin moisturization was observed in the PFAC group, with 12.8% (p < 0.001) at W4 and 14.5% at W8 (p < 0.001). In the AFAC group the increase in skin moisturization was higher both at W4 (+15.5%, p < 0.001) and W8 (+21.4%, p < 0.001), although the differences were not statistically significant (p < 0.05) compared to the AFPC and the PFAC groups. These variations were 2.9 and 3.2 times greater than the results obtained in the PFPC placebo group. A slight but statistically significant increase was also observed in the PFPC placebo group, with increases of +5.4% (p < 0.01) at 4 weeks and +6.6% (p < 0.001) at 8 weeks. Although the increase in skin moisturization peaked at W4 in PFAC and PFPC groups, it was further increased at W8 in both the AFPC (p < 0.05) and AFAC (p < 0.001) groups. Statistical differences between the PFPC placebo group and the active groups were as follows: p < 0.05 for AFPC at week 8, p < 0.05 for AFAC at week 4, and p < 0.01 for AFAC at week 8.
All the products did not alter (p > 0.05) the skin sebum content neither at W4 and W8 (Table 2). A small but statistically significant decrease in skin sebum content (p < 0.01) was observed in the AFAC group at week 8, with sebum levels remaining within the normal range.
3.4. Secondary Endpoints
3.4.1. Skin Profilometry
Wrinkle depth in the “crow’s feet” area decreased in all subjects treated with active products (Table 3). In the AFPC group wrinkle depth decreased by 9.3% (p < 0.01) after 4 weeks and 13.8% (p < 0.001) after 8 weeks of treatment. A similar reduction was observed in the PFAC group, with an 8.1% decrease at week 4 (p < 0.01) and 9.9% decrease at week 8 (p < 0.01). In the AFAC group, wrinkle depth reduction at week 4 (−10.3%, p < 0.01) was comparable to that observed in the AFPC and PFAC groups, but at week 8, it was significantly greater (−16.5%, p < 0.001) and showed a significant increase compared to week 4 (p < 0.05). In the PFPC placebo group, winkle depth was slightly reduced, although this change was not statistically significant (p < 0.05). Compared to the PFPC placebo group, the change in wrinkle depth in the AFAC group was 3.8 times greater at week 4 and 5.1 times greater at week 8 (p < 0.05 vs. PFPC at W8).
An improvement in skin smoothness (Sa parameter, Table 3) was observed only in the AFAC group, with a reduction of 5.1% at week 4 (p < 0.05) and 5.8% at week 8 (p < 0.01). Although the Sa parameter also decreased in the AFPC and the PFAC group, this variation was not statistically significant (p > 0.05). In contrast, the PFPC placebo group showed a statistically significant worsening of +1.6% in skin smoothness at week 8 (p < 0.05).
3.4.2. Transepidermal Water Loss (TEWL)
A statistically significant decrease of TEWL (Table 3) was recorded in both the PFAC (−5.3%, p < 0.05 at W4; −7.2%, p < 0.01 at W8) and AFAC (−6.6%, p < 0.01 at W4; −10.8%, p < 0.001 at W8) groups after 4 and 8 weeks of treatment. Moreover, a statistically significant (p < 0.01) decrease of 6.1% in TEWL was observed in the AFPC group at week 8. TEWL remained unchanged (p < 0.05) in the PFPC placebo group. At week 8, the TEWL reduction in the AFAC group was 5.8 times greater compared to the change in TEWL in the PFPC placebo group.
3.4.3. Skin Elasticity
Treatment with the active products positively affected skin firmness (R0 parameter) and elasticity (R2 parameter), with improvements observed after both 4 and 8 weeks of treatment (Table 4). The R0 parameter in the AFPC group decreased by 2.1% (p < 0.05) at week 4 and was further decreased by 4.7% (p < 0.001 vs. baseline and p < 0.05 vs. placebo PCPC group) after 8 weeks of treatment, respectively. The 8-weeks reduction was statistically significantly higher than the 4-weeks variation (p < 0.05). In the PFAC group, the decrease was 3.9% (p < 0.01) at week 4 and 6.5% (p < 0.001) at week 8, while in the AFAC group, it decreased by 5.1% (p < 0.001) at week 4 ad 7.7% (p < 0.001) at week 8. Skin firmness in the placebo PFPC group remained unchanged (p < 0.05) after both 4 and 8 weeks of treatment. At week 8, the reduction in the R0 parameter was statistically significantly higher in PFAC (p < 0.01) and AFAC (p < 0.001) groups compared to the PFPC placebo group. At week 8, the reduction in the R0 parameter in the PFAC group was 38.6 times greater compared to the change in the R0 parameter in the PFPC placebo group, while it was 45.5 times greater in AFAC group.
A similar trend was observed for the R2 parameter, which improved across all active groups (AFPC, PFAC, and AFAC) after both 4 and 8 weeks of treatment (Table 4). The results in the AFAC group were 9.4 times (p < 0.05 vs. PFPC group) higher than those in the placebo group at week 4 and 5.5 times (p < 0.001 vs. PFPC group) higher at week 8. Interestingly, the R2 parameter at week 8 showed a further increase compared to week 4 in both the AFPC (+5.4% at W8 vs. +2.4% at W4, p < 0.001) and AFAC (+4.7% at W8 vs. +7.1% at W4, p < 0.05) groups. R2 parameter was unchanged (p > 0.05) in the placebo PFPC group.
3.4.4. Skin Radiance
The skin radiance (Table 5) showed a positive increase across all active products, with a slight improvement also observed in the PFPC placebo group. in the AFPC group the skin radiance was improved by 10.4% (p < 0.001) after 4 weeks and by 19.2% (p < 0.001) after 8 weeks of treatment. Skin radiance demonstrated a steady enhancement from week 4 to week 8 in both the AFPC group (+19.2% at W8 vs. +10.4% at W4, p < 0.001) and the PFAC group (+22.5% at W8 vs. +12.3% at W4, p < 0.01). The results obtained in the AFAC group were 5.3 times (p < 0.001 vs. PFPC group) higher than those in the placebo group (p < 0.001 vs. PFPC group) at week 4 and 5.0 times higher at week 8. While the change in skin radiance was statistically significant in the PFPC group, it was smaller (+5.0% at W4, p < 0.05 and + 6.3% at W8, p < 0.001) than that observed in all active groups.
3.4.5. Pores Size and Impurities (Protoporphyrin Distribution)
The size of skin pores did not show any statistically significant change (p > 0.05) in any study group, either after 4 weeks or 8 weeks of treatment (Table 5).
The protoporphyrin distribution was decreased in all the active study groups (Table 5). In the AFPC group the distribution of the protoporphyrin was decreased by 8.7% (p < 0.05) after 4 weeks and by 8.8% (p < 0.05) after 8 weeks. A similar decrease was also observed in the PFAC group (−4.9% at W4, p < 0.05; −6.0% at W8, p < 0.05) and in the AFAC group (−9.6% at W4, p < 0.05; −9.8% at W8, p < 0.01), while no change was noted in the placebo PFPC group.
3.4.6. Skin Microbiome
The microbial composition of the most abundant genera and their parent taxa included Cutibacterium (52.4%), Corynebacterium (3.2%), Kocuria (0.5%), Acetobacter (0.6%), Achromobacter (0.3%), Staphylococcus (21.0%), Gemella (0.3%), Streptococcus (2.0%), and Anaerococcus (0.9%).
Both alpha (Shannon and Simpson index) and beta diversity indexes remained unchanged (p > 0.05) in AFPC, PFAC, PFPC group (Figure 3). In contrast, a statistically significant difference between week 4 and 8 was observed in the AFAC group for both the Shannon (p < 0.01 at phylum level) and the Simpson index (p < 0.01 at phylum and p < 0.05 at genus level) but not for the beta diversity index (p > 0.05).
In the AFPC group the linear discriminant analysis effect size (LDA LEfSe) at week 8 revealed a statistically significant decrease in Achromobacter (−0.37%, LDA score = 4.23, p < 0.001) and an increase in Gemella (+0.26%, LDA score = −4.16, p < 0.05) relative abundances. In the PFAC group there was an increase in the relative abundance of Acetobacter (+0.70%, LDA score = −4.23, p < 0.05) and Acinetobacter (+0.59%, LDA score = −4.48, p < 0.05). In the AFAC group there was an increase of Cutibacterium (+10.32%, LDA score = −5.65) even if not statistically significant (p > 0.05). This variation should be related to the increase in the Simpson index value (both at genus and phylum level). In the PFPC group, the microbiome was unchanged.
3.4.7. Self-Assessment Questionnaire
All the active products, both topical and oral, received positive evaluations from the study participants. Detailed results for each group are provided in the supplementary material (Table S3).
4. Discussion
Skin aging is a complex and multifactorial process in which cellular senescence (i.e. cellular proliferation arrest) and skin inflammaging are driven by the alteration of the skin barrier properties [43,44,45,46]. In recent years the alteration of the skin barrier waswas also correlated with skin microbiota alterations [1,5,6,7,8,9,10]. Supporting the skin barrier, respecting its hydrolipidic film and protecting the skin microbiota is then crucial to maintain skin longevity and well-being over time [47,48].
The results of this randomized, double-blind, placebo-controlled trial involving 96 subjects showed that the product use has high level of compliance with treatment without adverse effects during an eight weeks period of use.
The short-term effects observed one hour after a single application of the cosmetic products revealed statistically significant improvements: wrinkle depth decreased by 9.2% with serum application, while skin hydration and radiance increased by 16.6% and 19.1%, respectively, with cream application.
In the long term, all active products effectively maintained the skin hydrolipidic film. The skin sebum content remained stable, except for a slight decrease observed in the AFAC group at week 8, likely due to a sebum normalizing effect in subjects with oily skin. On the contrary the skin moisturization was increased in all the groups including the placebo PFCP group. Interestingly, skin moisturization showed a consistent improvement from week 4 to week 8 in the active food supplement groups (AFPC and AFAC), while it reached its maximum efficacy in both the active cosmetic product (PFAC) and placebo (PFPC) groups. These findings clearly highlight the synergistic effect of the food supplement and its role in enhancing the efficacy of the cosmetic product.
The product's efficacy in preserving skin lipids while enhancing the hydric component of the skin's hydrolipidic film was reflected in its positive impact on the skin microbiome. In the active cosmetic product (PFAC) group, increased skin moisturization correlated with a rise in the relative abundance of transient microbiota members, specifically Proteobacteria (Acetobacter and Acinetobacter), which are associated with higher epidermal water content [1,4]. Interestingly the active food supplement group (AFPC) showed an increase in fermentative bacteria from the Gemella genus, which may reflect a manifestation of the gut-skin axis [50]. These findings were evident in the active food supplement and cosmetic products (AFAC) group as a promotion of a better bacterial distribution.
Long-term effects observed at 4- and 8-weeks post-treatment initiation revealed statistically significant improvements from baseline to the 8-week follow-up in the active-active group. These included reductions in wrinkle depth, transepidermal water loss (indicating improved skin barrier function and condition), protoporphyrin distribution (associated with impurity removal), and skin sebum content. Concurrently, enhancements were noted in skin smoothness, moisturization, radiance/brightness, elasticity, and firmness.
The beneficial role of probiotics, particularly for their skin anti-aging properties, is increasingly acknowledged in scientific literature. In a recent clinical trial on Lactobacillus plantarum HY7714 Lee et al. reported its efficacy in reducing epidermal moisture loss and wrinkle depth while enhancing skin gloss and elasticity [51]. Our results confirm the beneficial effects of probiotics also for antiaging properties.
5. Conclusions
The results of this randomized, double-blinded, placebo-controlled study of the Skin Method shows positive short term and long-term results in the active cosmetic products of serum and cream (which contain the proprietary hyaluronate, ectoin, active waters and triglycerides) compared with the placebo group (active waters and triglycerides only).
The effects are seen as early as 1 hour after a single application including improvement in wrinkles, increase in hydration and radiance. The effects on primary and secondary outcomes were significantly improved at 4 and 8 weeks after commencing treatment.
There were superior improvements in skin moisturization, wrinkles, smoothness, radiance, elasticity and firmness and transepidermal water loss in the active cosmetic and food supplement group compared with the other three groups. Sebum content and impurities removal improved at 8 weeks only in the active cosmetic and food supplement group. There were no differences noticed regarding pore size in any group.
A strong increase in the efficacy of the cosmetic products was seen with the addition of the active food supplement, which contains L. plantarum, L reuteri and L rhamnosus, D-biotin and Vitamin A, compared with the placebo food supplement which contains active components of D-biotin and Vitamin A only. This finding confirms the efficacy of probiotics (AFPC group) in improving the measured skin health parameters and highlights their synergistic interaction with cosmetic products.
Improvements were self-reported by many subjects, up to 95%, for all parameters, and the proportion of subjects reporting improvements was higher in the active cosmetics and active supplement group compared with the other groups.
The use of the combined use of oral probiotics and topic products is fully supported by the results of this study, with a food supplement supporting active topical products, results in significant improvements as early as 1 hour, with further improvements over 8 weeks, and with superior results than using the food supplement or topical products individually.
Supplementary Materials
The following supporting information can be downloaded at: www.mdpi.com/xxx/s1, Table S1: Inclusion and exclusion criteria; Table S2: Ingredient list cosmetic products; Table S3: Self-assessment questionnaire at week 8.
Author Contributions
Conceptualization, C.H., G.S. and V.N.; methodology, C.H. V.N. and F.C.; validation, V.N. and F.C.; formal analysis, V.N. and F.C.; investigation, E.C. and F.C.; resources, G.S.; data curation, V.N.; writing—original draft preparation, C.H. and V.N.; writing—review and editing, C.H., V.N. and G.S.; visualization, V.N.; supervision C.H. and V.N.; project administration, V.N. and G.S.; funding acquisition, G.S. All authors have read and agreed to the published version of the manuscript.
Funding
This research was funded by ROELMI HPC Srl (Origgio, VA, Italy), grant number 2943/2022. The APC was funded by AW Srl (Sesto Fiorentino, FI, Italy).
Institutional Review Board Statement
The study was conducted in accordance with the Declaration of Helsinki and approved by “Comitato Etico Indipendente per le Indagini Cliniche Non Farmacologiche” (ref. no. 2002/01 by 02/02/2022).
Informed Consent Statement
Informed consent was obtained from all subjects involved in the study.
Data Availability Statement
The data presented in this study are available on request from the corresponding author. The data are not publicly available since they are the property of the sponsor of the study (ROELMI HPC Srl, 21040 Origgio, VA, Italy).
Acknowledgments
The authors would like to express their gratitude to the Complife Italia staff, who contributed to the study and recruited the subjects, for their professionalism and support during study development.
Conflicts of Interest
C.H. acts as the Lead for Health and Wellness with financial interests for AWvi.life, the company that manufactures and sells products based on this research output. G.S. is the President of ROELMI Holding, the parent company of the company that sponsored this study. This does not alter the author’s adherence to all the journal policies on sharing data and materials. The other authors declare no conflicts of interest. The funders had no role in the design of the study; in the collection, analyses, or interpretation of data; in the writing of the manuscript; or in the decision to publish the results.
References
- Grice, E. A.; Kong, H. H.; Conlan, S.; Deming, C. B.; Davis, J.; Young, A. C.; Program, N. C. S.; Bouffard, G. G.; Blakesley, R. W.; Murray, P. R.; Green, E. D.; Turner, M. L.; Segre, J. A. Topographical and Temporal Diversity of the Human Skin Microbiome. Science (New York, N.Y.) 2009, 324, 1190. [Google Scholar] [CrossRef] [PubMed]
- Byrd, A. L.; Belkaid, Y.; Segre, J. A. The Human Skin Microbiome. Nat Rev Microbiol 2018, 16, 143–155. [Google Scholar] [CrossRef] [PubMed]
- Boxberger, M.; Cenizo, V.; Cassir, N.; La Scola, B. Challenges in Exploring and Manipulating the Human Skin Microbiome. Microbiome 2021, 9, 125. [Google Scholar] [CrossRef] [PubMed]
- Lee, H.-J.; Kim, M. Skin Barrier Function and the Microbiome. International Journal of Molecular Sciences 2022, 23, 13071. [Google Scholar] [CrossRef]
- Patra, V.; Wagner, K.; Arulampalam, V.; Wolf, P. Skin Microbiome Modulates the Effect of Ultraviolet Radiation on Cellular Response and Immune Function. iScience 2019, 15, 211. [Google Scholar] [CrossRef]
- Uberoi, A.; Bartow-McKenney, C.; Zheng, Q.; Flowers, L.; Campbell, A.; Knight, S. A. B.; Chan, N.; Wei, M.; Lovins, V.; Bugayev, J.; Horwinski, J.; Bradley, C.; Meyer, J.; Crumrine, D.; Sutter, C. H.; Elias, P.; Mauldin, E.; Sutter, T. R.; Grice, E. A. Commensal Microbiota Regulates Skin Barrier Function and Repair via Signaling through the Aryl Hydrocarbon Receptor. Cell Host Microbe 2021, 29, 1235–1248.e8. [Google Scholar] [CrossRef]
- Harris-Tryon, T. A.; Grice, E. A. Microbiota and Maintenance of Skin Barrier Function. Science 2022, 376, 940–945. [Google Scholar] [CrossRef]
- Larson, P. J.; Zhou, W.; Santiago, A.; Driscoll, S.; Fleming, E.; Voigt, A. Y.; Chun, O. K.; Grady, J. J.; Kuchel, G. A.; Robison, J. T.; Oh, J. Associations of the Skin, Oral and Gut Microbiome with Aging, Frailty and Infection Risk Reservoirs in Older Adults. Nat Aging 2022, 2, 941–955. [Google Scholar] [CrossRef]
- Zhang, X.-E.; Zheng, P.; Ye, S.-Z.; Ma, X.; Liu, E.; Pang, Y.-B.; He, Q.-Y.; Zhang, Y.-X.; Li, W.-Q.; Zeng, J.-H.; Guo, J. Microbiome: Role in Inflammatory Skin Diseases. JIR 2024, 17, 1057–1082. [Google Scholar] [CrossRef]
- Grant, G. J.; Kohli, I.; Mohammad, T. F. A Narrative Review of the Impact of Ultraviolet Radiation and Sunscreen on the Skin Microbiome. Photodermatology, Photoimmunology & Photomedicine 2024, 40, e12943. [Google Scholar] [CrossRef]
- Ratanapokasatit, Y.; Laisuan, W.; Rattananukrom, T.; Petchlorlian, A.; Thaipisuttikul, I.; Sompornrattanaphan, M. How Microbiomes Affect Skin Aging: The Updated Evidence and Current Perspectives. Life 2022, 12, 936. [Google Scholar] [CrossRef] [PubMed]
- Russo, E.; Di Gloria, L.; Cerboneschi, M.; Smeazzetto, S.; Baruzzi, G. P.; Romano, F.; Ramazzotti, M.; Amedei, A. Facial Skin Microbiome: Aging-Related Changes and Exploratory Functional Associations with Host Genetic Factors, a Pilot Study. Biomedicines 2023, 11, 684. [Google Scholar] [CrossRef] [PubMed]
- Myers, T.; Bouslimani, A.; Huang, S.; Hansen, S. T.; Clavaud, C.; Azouaoui, A.; Ott, A.; Gueniche, A.; Bouez, C.; Zheng, Q.; Aguilar, L.; Knight, R.; Moreau, M.; Song, S. J. A Multi-Study Analysis Enables Identification of Potential Microbial Features Associated with Skin Aging Signs. Front. Aging 2024, 4. [Google Scholar] [CrossRef] [PubMed]
- Khmaladze, I.; Leonardi, M.; Fabre, S.; Messaraa, C.; Mavon, A. The Skin Interactome: A Holistic “Genome-Microbiome-Exposome” Approach to Understand and Modulate Skin Health and Aging. Clin Cosmet Investig Dermatol 2020, 13, 1021–1040. [Google Scholar] [CrossRef]
- Dréno, B.; Dagnelie, M. A.; Khammari, A.; Corvec, S. The Skin Microbiome: A New Actor in Inflammatory Acne. Am J Clin Dermatol 2020, 21 (Suppl 1), 18–24. [Google Scholar] [CrossRef]
- Zhu, W.; Hamblin, M. R.; Wen, X. Role of the Skin Microbiota and Intestinal Microbiome in Rosacea. Front Microbiol 2023, 14, 1108661. [Google Scholar] [CrossRef]
- Sánchez-Pellicer, P.; Eguren-Michelena, C.; García-Gavín, J.; Llamas-Velasco, M.; Navarro-Moratalla, L.; Núñez-Delegido, E.; Agüera-Santos, J.; Navarro-López, V. Rosacea, Microbiome and Probiotics: The Gut-Skin Axis. Front Microbiol 2023, 14, 1323644. [Google Scholar] [CrossRef]
- Olejniczak-Staruch, I.; Ciążyńska, M.; Sobolewska-Sztychny, D.; Narbutt, J.; Skibińska, M.; Lesiak, A. Alterations of the Skin and Gut Microbiome in Psoriasis and Psoriatic Arthritis. Int J Mol Sci 2021, 22, 3998. [Google Scholar] [CrossRef]
- Celoria, V.; Rosset, F.; Pala, V.; Dapavo, P.; Ribero, S.; Quaglino, P.; Mastorino, L. The Skin Microbiome and Its Role in Psoriasis: A Review. Psoriasis (Auckl) 2023, 13, 71–78. [Google Scholar] [CrossRef]
- Edslev, S. M.; Agner, T.; Andersen, P. S. Skin Microbiome in Atopic Dermatitis. Acta Derm Venereol 2020, 100, adv00164. [Google Scholar] [CrossRef]
- Demessant-Flavigny, A.-L.; Connétable, S.; Kerob, D.; Moreau, M.; Aguilar, L.; Wollenberg, A. Skin Microbiome Dysbiosis and the Role of Staphylococcus Aureus in Atopic Dermatitis in Adults and Children: A Narrative Review. J Eur Acad Dermatol Venereol 2023, 37 Suppl 5, 3–17. [Google Scholar] [CrossRef]
- Tomic-Canic, M.; Burgess, J. L.; O’Neill, K. E.; Strbo, N.; Pastar, I. Skin Microbiota and Its Interplay with Wound Healing. Am J Clin Dermatol 2020, 21 (Suppl 1), 36–43. [Google Scholar] [CrossRef] [PubMed]
- Woo, Y. R.; Cho, S. H.; Lee, J. D.; Kim, H. S. The Human Microbiota and Skin Cancer. Int J Mol Sci 2022, 23, 1813. [Google Scholar] [CrossRef] [PubMed]
- Mekadim, C.; Skalnikova, H. K.; Cizkova, J.; Cizkova, V.; Palanova, A.; Horak, V.; Mrazek, J. Dysbiosis of Skin Microbiome and Gut Microbiome in Melanoma Progression. BMC Microbiol 2022, 22, 63. [Google Scholar] [CrossRef]
- Myles, I. A.; Williams, K. W.; Reckhow, J. D.; Jammeh, M. L.; Pincus, N. B.; Sastalla, I.; Saleem, D.; Stone, K. D.; Datta, S. K. Transplantation of Human Skin Microbiota in Models of Atopic Dermatitis. JCI Insight 2016, 1, e86955–86955. [Google Scholar] [CrossRef]
- Kennedy, E. A.; Connolly, J.; Hourihane, J. O.; Fallon, P. G.; McLean, W. H. I.; Murray, D.; Jo, J.-H.; Segre, J. A.; Kong, H. H.; Irvine, A. D. Skin Microbiome before Development of Atopic Dermatitis: Early Colonization with Commensal Staphylococci at 2 Months Is Associated with a Lower Risk of Atopic Dermatitis at 1 Year. J Allergy Clin Immunol 2017, 139, 166–172. [Google Scholar] [CrossRef]
- Hidalgo-Cantabrana, C.; Gómez, J.; Delgado, S.; Requena-López, S.; Queiro-Silva, R.; Margolles, A.; Coto, E.; Sánchez, B.; Coto-Segura, P. Gut Microbiota Dysbiosis in a Cohort of Patients with Psoriasis. British Journal of Dermatology 2019, 181, 1287–1295. [Google Scholar] [CrossRef]
- Yang, Y.; Qu, L.; Mijakovic, I.; Wei, Y. Advances in the Human Skin Microbiota and Its Roles in Cutaneous Diseases. Microbial Cell Factories 2022, 21, 176. [Google Scholar] [CrossRef]
- Salem, I.; Ramser, A.; Isham, N.; Ghannoum, M. A. The Gut Microbiome as a Major Regulator of the Gut-Skin Axis. Front Microbiol 2018, 9, 1459. [Google Scholar] [CrossRef]
- Mahmud, M. R.; Akter, S.; Tamanna, S. K.; Mazumder, L.; Esti, I. Z.; Banerjee, S.; Akter, S.; Hasan, M. R.; Acharjee, M.; Hossain, M. S.; Pirttilä, A. M. Impact of Gut Microbiome on Skin Health: Gut-Skin Axis Observed through the Lenses of Therapeutics and Skin Diseases. Gut Microbes 2022, 14, 2096995. [Google Scholar] [CrossRef]
- Arck, P.; Handjiski, B.; Hagen, E.; Pincus, M.; Bruenahl, C.; Bienenstock, J.; Paus, R. Is There a “Gut-Brain-Skin Axis”? Exp Dermatol 2010, 19, 401–405. [Google Scholar] [CrossRef] [PubMed]
- De Pessemier, B.; Grine, L.; Debaere, M.; Maes, A.; Paetzold, B.; Callewaert, C. Gut–Skin Axis: Current Knowledge of the Interrelationship between Microbial Dysbiosis and Skin Conditions. Microorganisms 2021, 9, 353. [Google Scholar] [CrossRef] [PubMed]
- Marasca, C.; Ruggiero, A.; Cacciapuoti, S.; Fabbrocini, G.; Annunziata, M. C. Probiotic Supplement Combined with Topical Therapy in the Treatment of Mild to Moderate Acne: Results from an Italian Single Centre Interventional Study. Ital J Dermatol Venerol 2022, 157, 510–514. [Google Scholar] [CrossRef] [PubMed]
- Carlomagno, F.; Roveda, G.; Michelotti, A.; Ruggeri, F.; Tursi, F. Anti-Skin-Aging Effect of a Treatment with a Cosmetic Product and a Food Supplement Based on a New Hyaluronan: A Randomized Clinical Study in Healthy Women. Cosmetics 2022, 9, 54. [Google Scholar] [CrossRef]
- Milani, M.; Colombo, F. Skin Anti-Aging Effect of Oral Vitamin A Supplementation in Combination with Topical Retinoic Acid Treatment in Comparison with Topical Treatment Alone: A Randomized, Prospective, Assessor-Blinded, Parallel Trial. Cosmetics 2023, 10, 144. [Google Scholar] [CrossRef]
- Jwo, J.-Y.; Chang, Y.-T.; Huang, Y.-C. Effects of Probiotics Supplementation on Skin Photoaging and Skin Barrier Function: A Systematic Review and Meta-Analysis. Photodermatol Photoimmunol Photomed 2023, 39, 122–131. [Google Scholar] [CrossRef]
- Malanchin, R.; Carlomagno, F. Combined Topical and Oral Compositions for the Treatment of Gut-Skin Dysbiosis. EP4151217A1, 22 March 2023. https://patents.google.com/patent/EP4151217A1/en?oq=P.P.EP4151217+ (accessed 2024-10-26). [Google Scholar]
- Robert, C.; Cascella, F.; Mellai, M.; Barizzone, N.; Mignone, F.; Massa, N.; Nobile, V.; Bona, E. Influence of Sex on the Microbiota of the Human Face. Microorganisms 2022, 10, 2470. [Google Scholar] [CrossRef]
- Ewing, B.; Green, P. Base-Calling of Automated Sequencer Traces Using Phred. II. Error Probabilities. Genome Res 1998, 8, 186–194. [Google Scholar] [CrossRef]
- Bona, E.; Massa, N.; Toumatia, O.; Novello, G.; Cesaro, P.; Todeschini, V.; Boatti, L.; Mignone, F.; Titouah, H.; Zitouni, A.; Lingua, G.; Vuolo, F.; Gamalero, E. Climatic Zone and Soil Properties Determine the Biodiversity of the Soil Bacterial Communities Associated to Native Plants from Desert Areas of North-Central Algeria. Microorganisms 2021, 9, 1359. [Google Scholar] [CrossRef]
- Torre, E.; Sola, D.; Caramaschi, A.; Mignone, F.; Bona, E.; Fallarini, S. A Pilot Study on Clinical Scores, Immune Cell Modulation, and Microbiota Composition in Allergic Patients with Rhinitis and Asthma Treated with a Probiotic Preparation. Int Arch Allergy Immunol 2022, 183, 186–200. [Google Scholar] [CrossRef]
- Mellai, M.; Allesina, M.; Edoardo, B.; Cascella, F.; Nobile, V.; Spina, A.; Amone, F.; Zaccaria, V.; Insolia, V.; Perri, A.; Lofaro, D.; Puoci, F. A Randomized, Double-Blind, Placebo-Controlled Trial: Efficacy of Opuntia Ficus-Indica Prebiotic Supplementation in Subjects with Gut Dysbiosis. Nutrients 2024, 16, 586. [Google Scholar] [CrossRef] [PubMed]
- Chambers, E. S.; Vukmanovic-Stejic, M. Skin Barrier Immunity and Ageing. Immunology 2019, 160, 116. [Google Scholar] [CrossRef] [PubMed]
- Waller, J. M.; Maibach, H. I. Age and Skin Structure and Function, a Quantitative Approach (I): Blood Flow, pH, Thickness, and Ultrasound Echogenicity. Skin Research and Technology 2005, 11, 221–235. [Google Scholar] [CrossRef]
- Wilhelm, K. P.; Cua, A. B.; Maibach, H. I. Skin Aging. Effect on Transepidermal Water Loss, Stratum Corneum Hydration, Skin Surface pH, and Casual Sebum Content. Arch Dermatol 1991, 127, 1806–1809. [Google Scholar] [CrossRef]
- Agrawal, R.; Hu, A.; Bollag, W. B. The Skin and Inflamm-Aging. Biology (Basel) 2023, 12, 1396. [Google Scholar] [CrossRef]
- Luca, C. D.; Valacchi, G. Surface Lipids as Multifunctional Mediators of Skin Responses to Environmental Stimuli. Mediators of Inflammation 2010, 2010, 321494. [Google Scholar] [CrossRef]
- Luebberding, S.; Krueger, N.; Kerscher, M. Age-Related Changes in Skin Barrier Function - Quantitative Evaluation of 150 Female Subjects. Int J Cosmet Sci 2013, 35, 183–190. [Google Scholar] [CrossRef]
- Gao, T.; Wang, X.; Li, Y.; Ren, F. The Role of Probiotics in Skin Health and Related Gut-Skin Axis: A Review. Nutrients 2023, 15, 3123. [Google Scholar] [CrossRef]
- Łoś-Rycharska, E.; Gołębiewski, M.; Sikora, M.; Grzybowski, T.; Gorzkiewicz, M.; Popielarz, M.; Gawryjołek, J.; Krogulska, A. A Combined Analysis of Gut and Skin Microbiota in Infants with Food Allergy and Atopic Dermatitis: A Pilot Study. Nutrients 2021, 13, 1682. [Google Scholar] [CrossRef]
- Lee, D. E.; Huh, C.-S.; Ra, J.; Choi, I.-D.; Jeong, J.-W.; Kim, S.-H.; Ryu, J. H.; Seo, Y. K.; Koh, J. S.; Lee, J.-H.; Sim, J.-H.; Ahn, Y.-T. Clinical Evidence of Effects of Lactobacillus Plantarum HY7714 on Skin Aging: A Randomized, Double Blind, Placebo-Controlled Study. J Microbiol Biotechnol 2015, 25, 2160–2168. [Google Scholar] [CrossRef]
Figure 1.
Participant flow chart. AFPC is the active food supplement and the placebo cosmetic products group; PFAC is the placebo food supplement and the active cosmetic products group; AFAC is the active food supplement and the active cosmetic products group; PFPC is the placebo food supplement and placebo cosmetic products group.
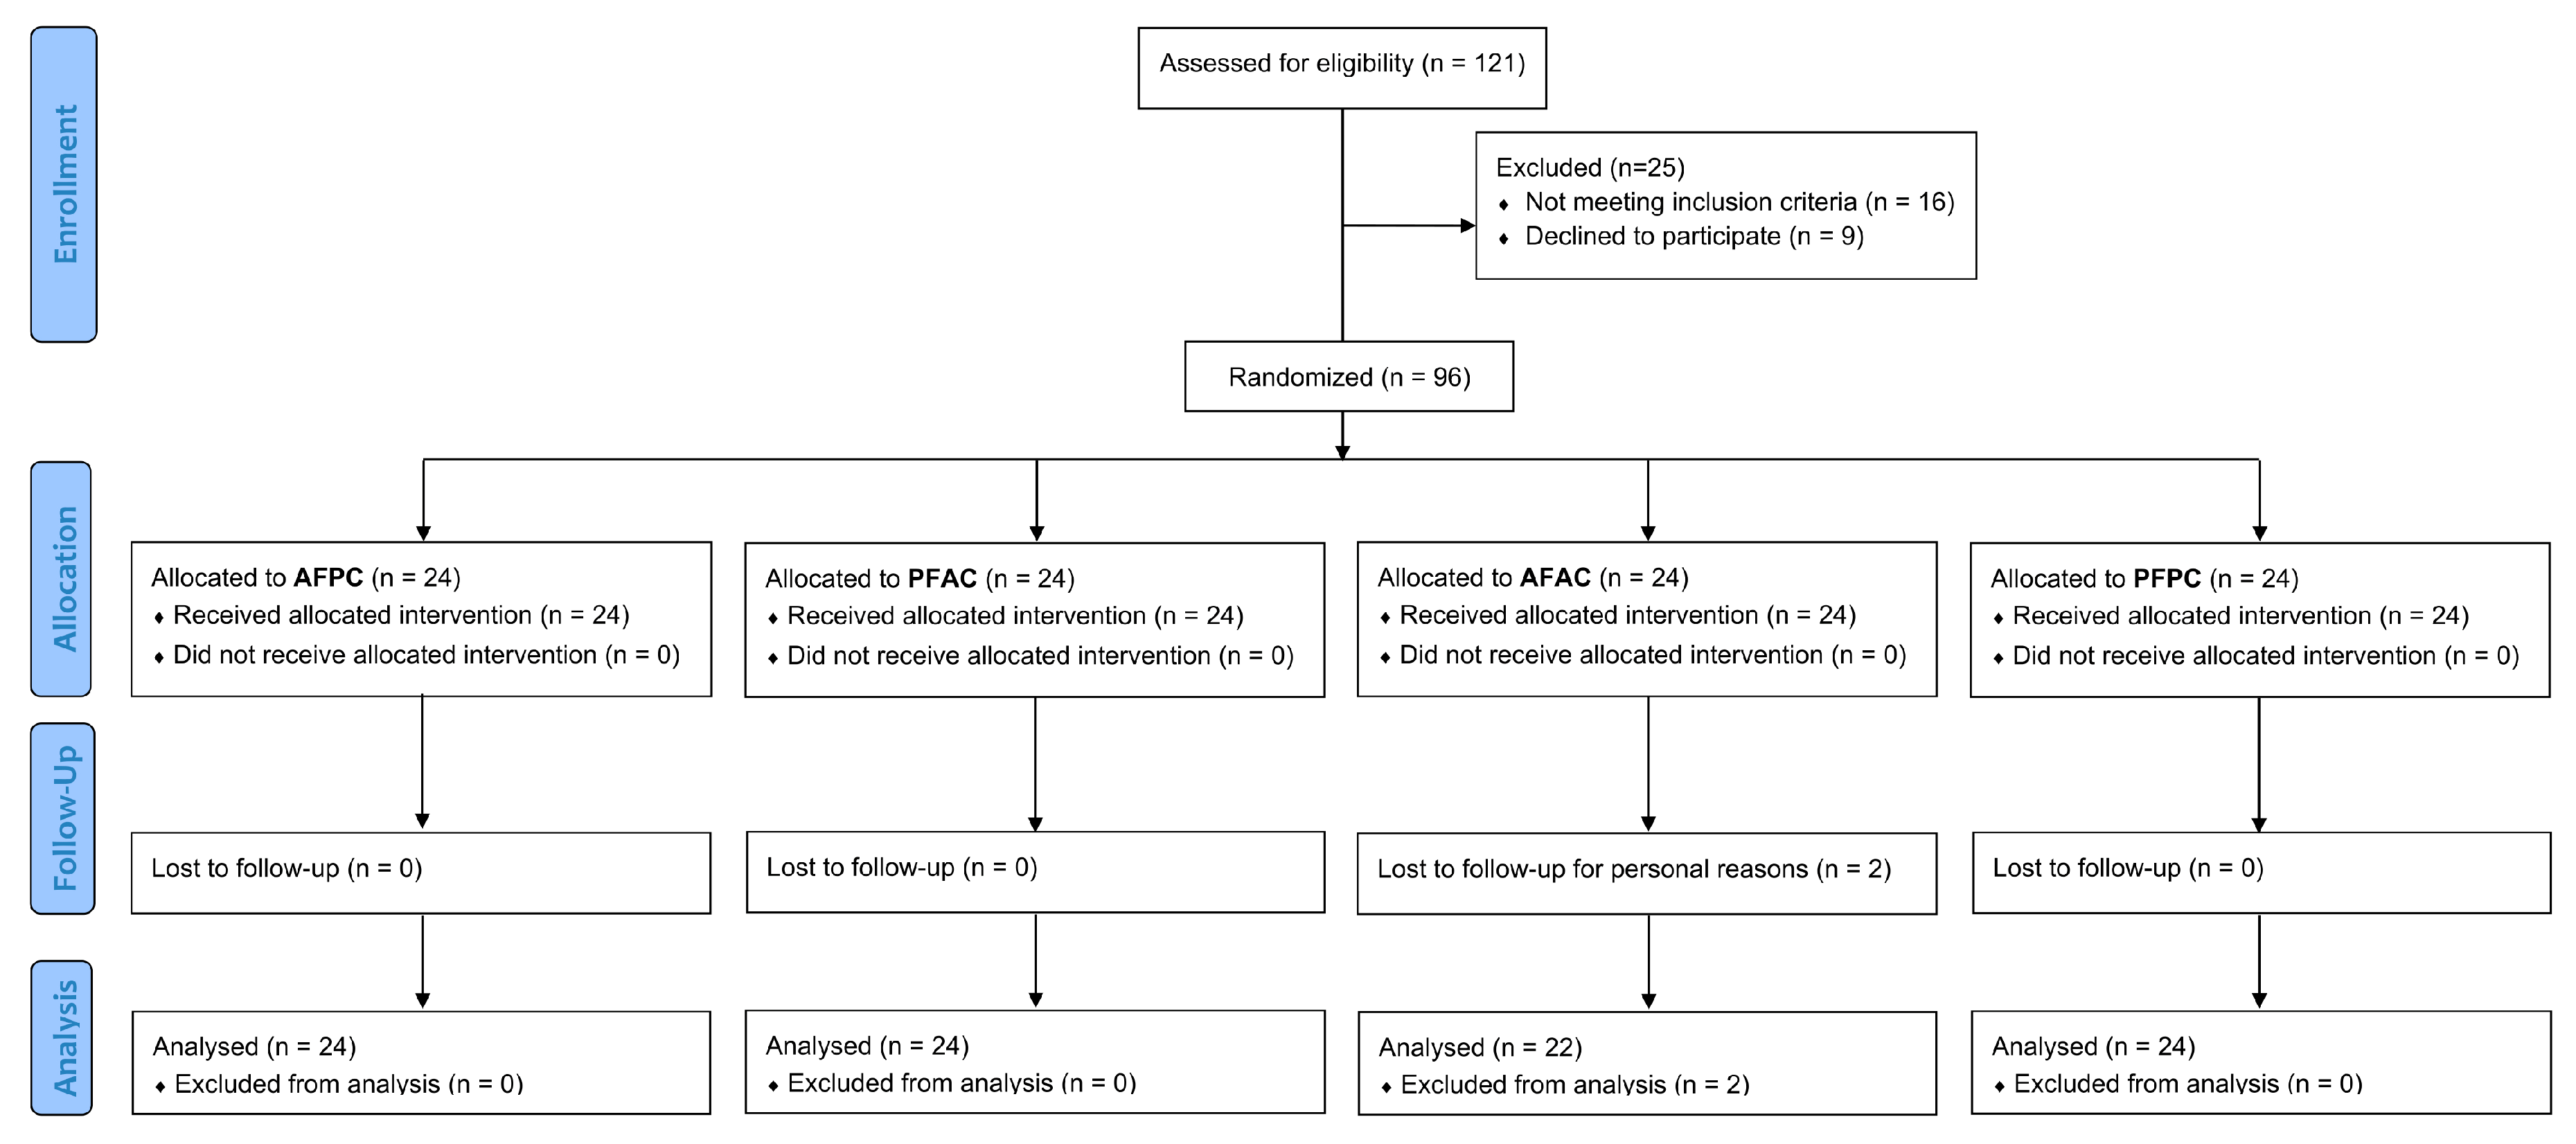
Figure 2.
(a) Wrinkle depth in the “crow’s feet area”. (b) Skin hydration. (c) Skin radiance. The intragroup (vs. T0) statistical analysis is indicated inside the bars with the symbol *, while the intergroup (between treatment groups) statistical analysis is shown above the bars with the symbol. The significance levels are as follows: */# p < 0.05, **/## p < 0.01, and ***/### p < 0.001.
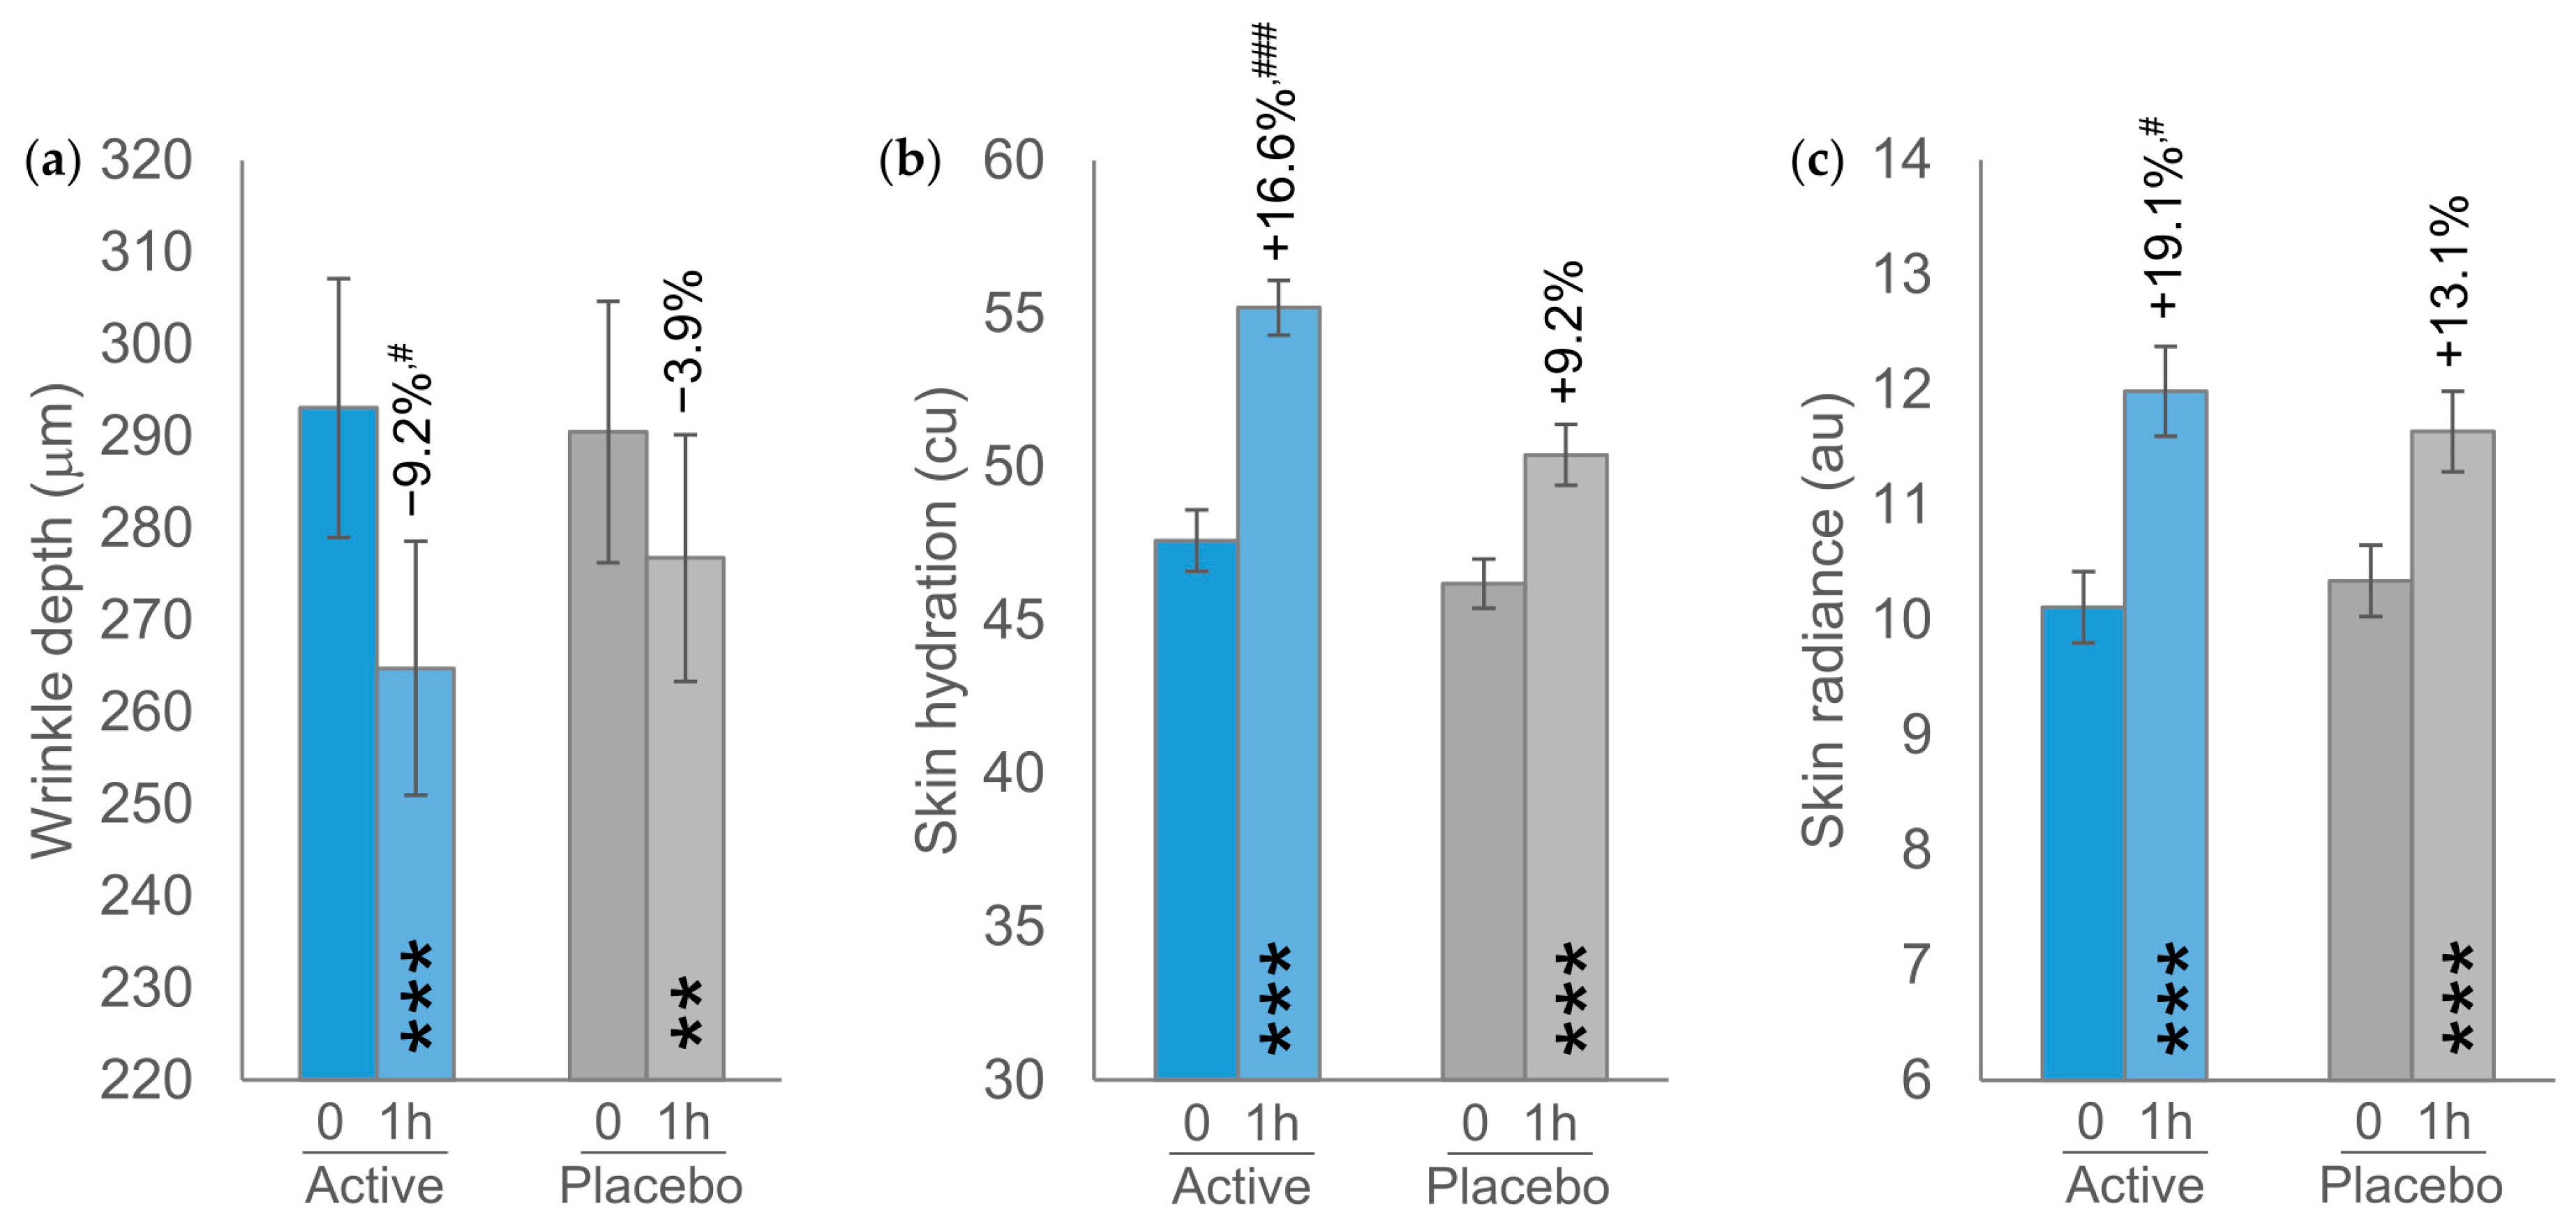
Figure 3.
(a) Shannon index. (b) Simpson index. The intragroup (vs. T0) statistical analysis is indicated above the bars with the symbol * as follows: * p < 0.05 and ** p < 0.01.
Figure 3.
(a) Shannon index. (b) Simpson index. The intragroup (vs. T0) statistical analysis is indicated above the bars with the symbol * as follows: * p < 0.05 and ** p < 0.01.
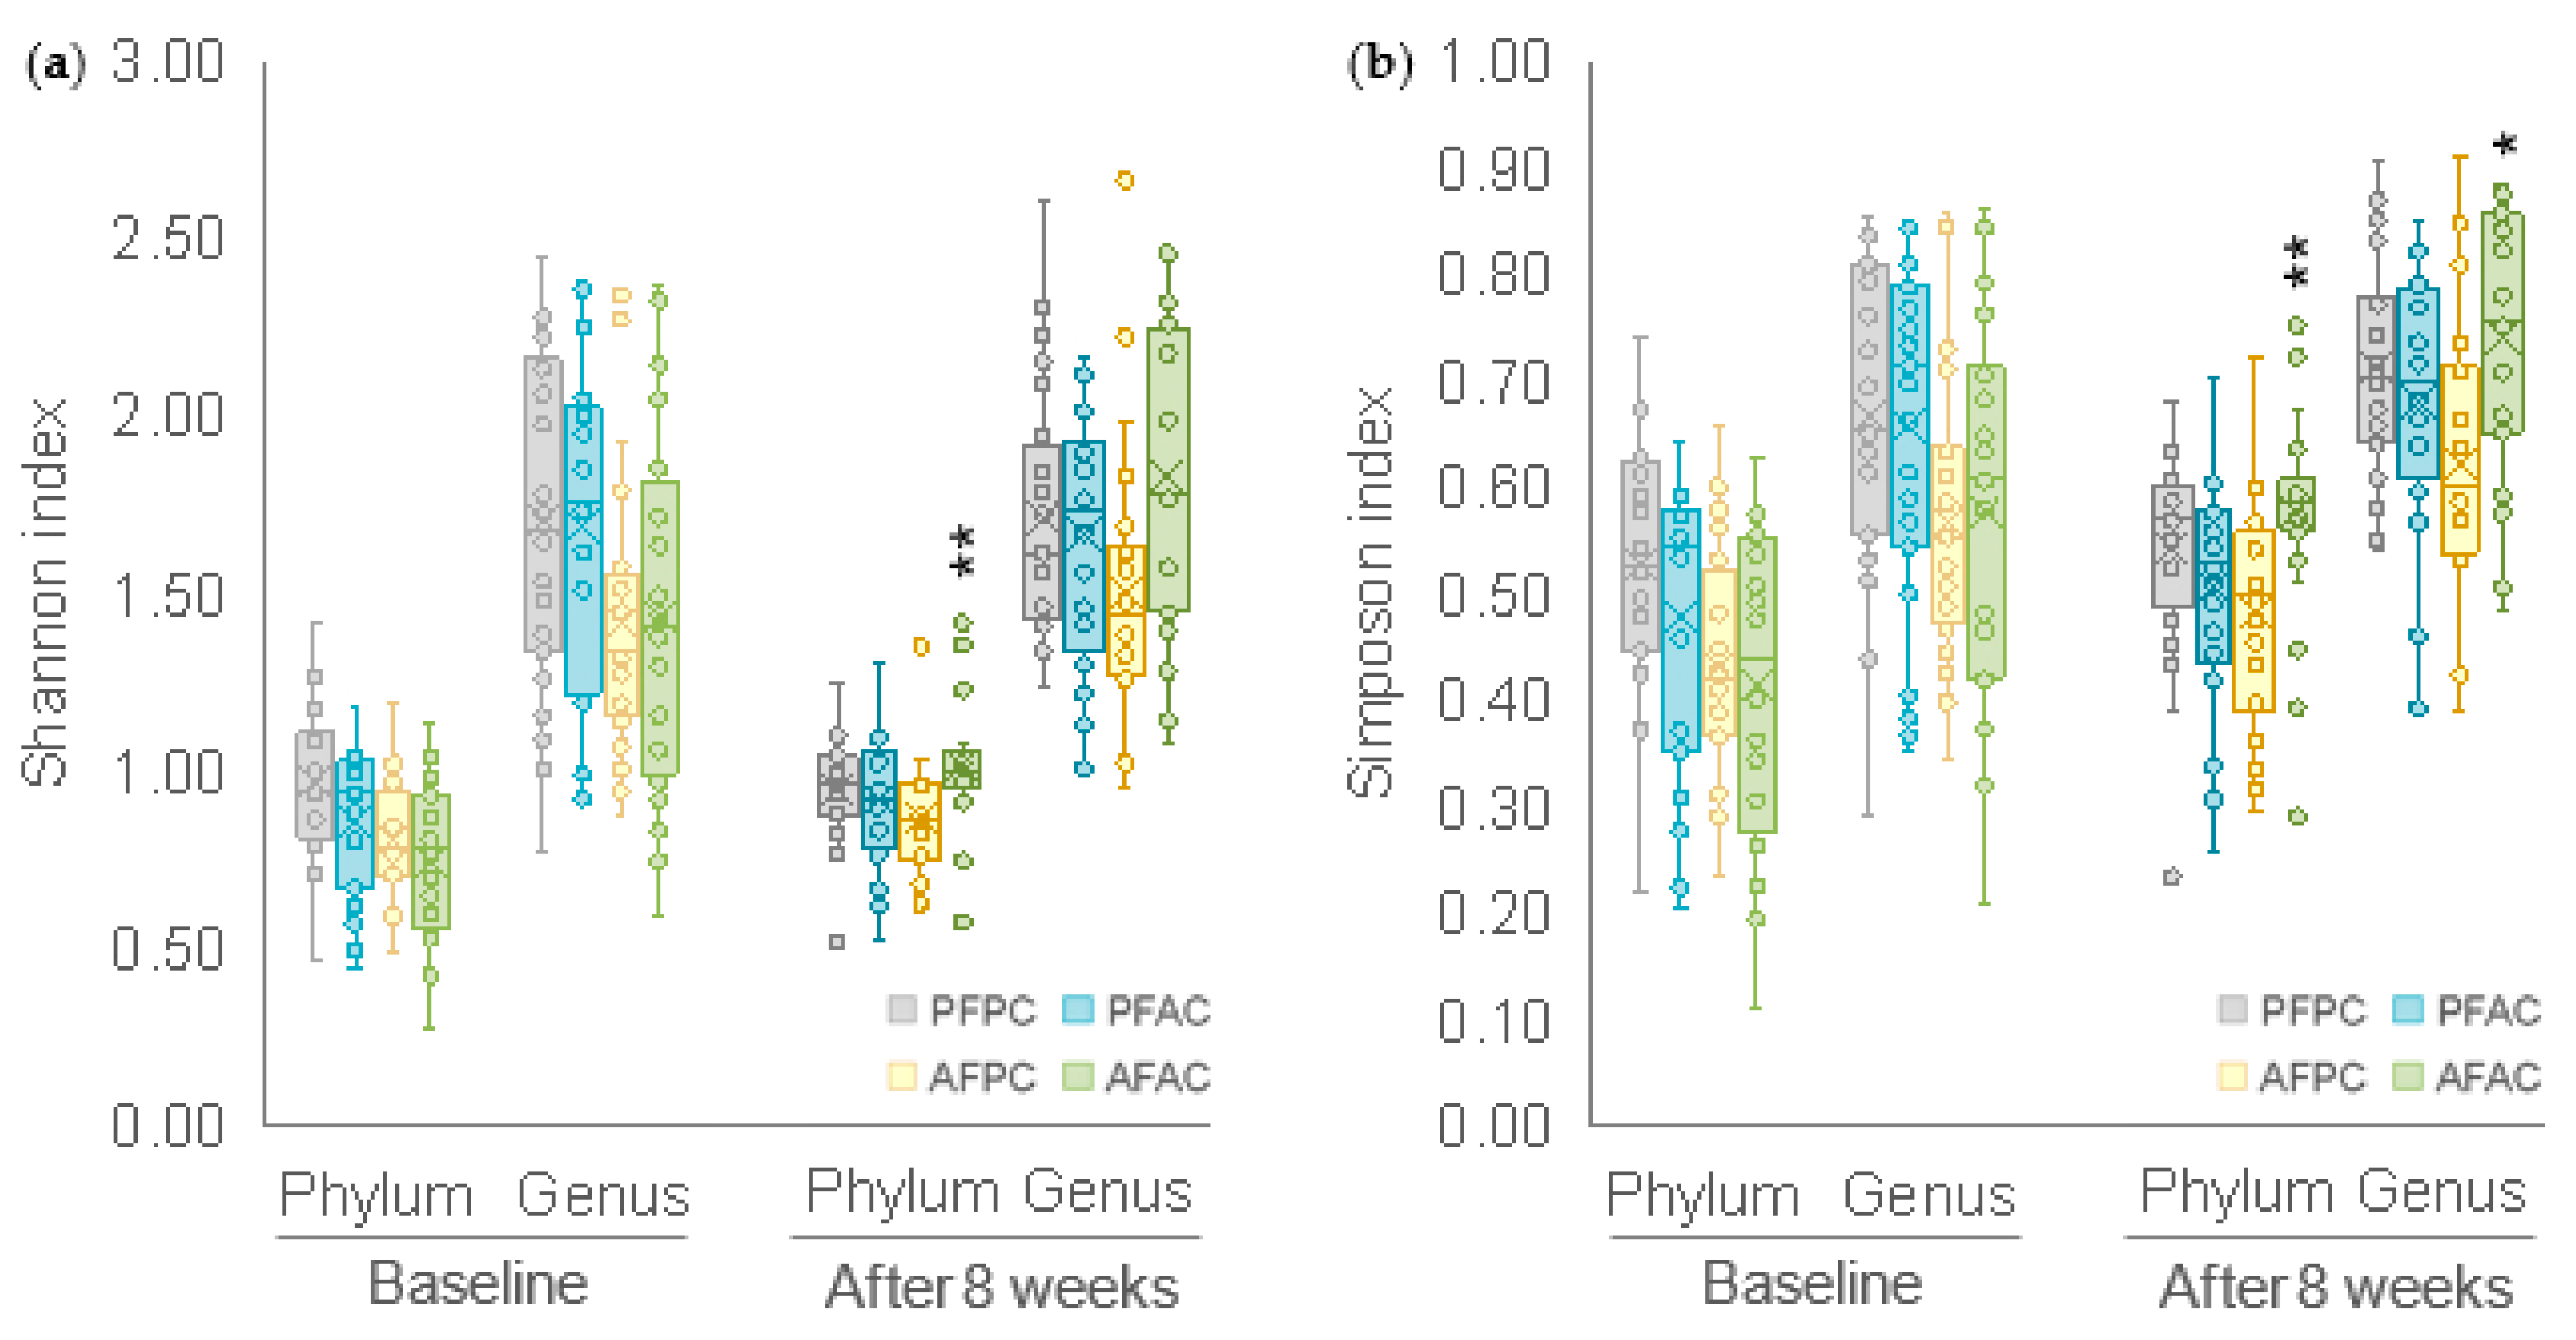

Table 1.
Baseline and demographic characteristics.
| AFPC (n = 24) | PFAC (n = 24) | AFAC (n = 22) | PFPC (n = 24) | Units | |
|---|---|---|---|---|---|
| Age | 55.9 ± 1.1 | 55.4 ± 1.2 | 53.3 ± 1.3 | 56.3 ± 1.3 | Years |
| Sex | |||||
| Male | 8.3% (2) | 4.2% (1) | 4.5% (1) | 8.3% (2) | % (no.) |
| Female | 91.7% (22) | 95.8% (23) | 95.5% (21) | 91.7% (22) | % (no.) |
| Skin sebum content | 83.5 ± 8.3 | 88.8 ± 8.0 | 96.5 ± 11.1 | 88.9 ± 8.2 | μg/cm2 |
| Skin moisturization | 46.0 ± 1.0 | 47.2 ± 1.5 | 47.9 ± 1.3 | 46.5 ± 1.4 | cu |
| Skin profilometry | |||||
| Wrinkle depth | 305.8 ± 24.3 | 300.9 ± 22.7 | 283.2 ± 17.8 | 275.2 ± 14.6 | μm |
| Skin smoothness (Sa) | 34.4 ± 1.7 | 36.0 ± 1.4 | 36.6 ± 2.0 | 33.8 ± 1.6 | μm |
| TEWL | 13.1 ± 0.8 | 13.9 ± 0.8 | 13.7 ± 0.6 | 12.2 ± 0.5 | g×h-1×m-2 |
| Skin elasticity | |||||
| Skin firmness, R0 | 0.3910 ± 0.0119 | 0.3833 ± 0.0103 | 0.3880 ± 0.0096 | 0.3689 ± 0.0102 | mm |
| Overall elasticity, R2 | 0.5975 ± 0.0106 | 0.6135 ± 0.097 | 0.6152 ± 0.086 | 0.6273 ± 0.0084 | au |
| Skin radiance | 10.18 ± 0.45 | 10.25 ± 0.42 | 9.78 ± 0.49 | 10.50 ± 0.44 | au |
| Pores | |||||
| Size | 233.8 ± 3.5 | 222.5 ± 1.9 | 227.6 ± 3.6 | 226.2 ± 4.0 | pixel no. |
| Impurities | 57924.2 ± 12357.7 | 88589 ± 16729.5 | 91527.6 ± 18868.7 | 71706.5 ± 20629.9 | pixel no. |
Continuous data are expressed as mean ± SEM; categorical data are expressed as counts and percentages. cu corneometric units; au arbitrary units.
Table 2.
Primary endpoints. Data are mean ± SEM. The intragroup (vs. baseline) statistical analysis is denoted by the symbol * and is reported near the raw data; while the intergroup (active groups vs. PFPC placebo group) statistical analysis is denoted by the symbol # and is reported near the percentage variation, as follows: * p < 0.05, **/## p < 0.01, ***/### p < 0.001.
| T0 | T4 | T8 | |
|---|---|---|---|
| Skin moisturization (cu) | |||
| AFPC (n = 24) | 46.0 ± 1.0 | 50.7 ± 1.0*** (+10.7%) |
53.4 ± 1.3*** (+17.0%)# |
| PFAC (n = 24) | 47.2 ± 1.5 | 52.8 ± 1.7*** (+12.8%) |
53.6 ± 1.4*** (+14.5%) |
| AFAC (n = 22) | 47.9 ± 1.3 | 55.0 ± 1.3*** (+15.5%)# |
57.9 ± 1.4*** (+21.4%)## |
| PFPC (n = 24) | 46.5 ± 1.4 | 48.9 ± 1.5** (+5.4%) |
49.5 ± 1.4*** (+6.6%) |
| Skin sebum content (μg/cm2) | |||
| AFPC (n = 24) | 83.5 ± 8.3 | 77.2 ± 8.2 (−6.0%) |
76.5 ± 7.6 (−6.2%) |
| PFAC (n = 24) | 88.8 ± 8.0 | 80.6 ± 7.0 (−4.2%) |
81.3 ± 6.5 (−4.0%) |
| AFAC (n = 22) | 96.5 ± 11.1 | 87.7 ± 10.3 (−8.1%) |
77.6 ± 7.2** (−9.7%) |
| PFPC (n = 24) | 88.9 ± 8.2 | 81.4 ± 6.6 (−3.3) |
81.4 ± 6.8 (−4.3) |
AFPC is the active food supplement and the placebo cosmetic products group; PFAC is the placebo food supplement and the active cosmetic products group; AFAC is the active food supplement and the active cosmetic products group; PFPC is the placebo food supplement and placebo cosmetic products group.
Table 3.
Skin profilometry and TEWL. Data are mean ± SEM. The intragroup (vs. baseline) statistical analysis is denoted by the symbol * and is reported near the raw data; while the intergroup (active groups vs. PFPC placebo group) statistical analysis is denoted by the symbol # and is reported near the percentage variation, as follows: * p < 0.05, **/## p < 0.01, ***/### p < 0.001.
| T0 | T4 | T8 | |
|---|---|---|---|
| Wrinkle depth (μm) | |||
| AFPC (n = 24) | 305.8 ± 24.3 | 273.1 ± 20.0** (−9.3%) |
258.4 ± 19.3*** (−13.8%) |
| PFAC (n = 24) | 300.9 ± 22.7 | 271.6 ± 19.3** (−8.1%) |
266.0 ± 19.9** (−9.9%) |
| AFAC (n = 22) | 283.2 ± 17.8 | 253.5 ± 17.6** (−10.3%) |
233.0 ± 15.3*** (−16.5%)# |
| PFPC (n = 24) | 275.2 ± 14.6 | 266.6 ± 14.4 (−2.7%) |
263.8 ± 13.5 (−3.3%) |
| Skin smoothness (μm) | |||
| AFPC (n = 24) | 34.4 ± 1.7 | 32.9 ± 1.3 (−3.0%) |
33.3 ± 1.5 (−2.2%) |
| PFAC (n = 24) | 36.0 ± 1.4 | 34.5 ± 1.2 (−3.6%) |
34.2 ± 1.4 (−4.8%) |
| AFAC (n = 22) | 36.6 ± 2.0 | 34.7 ± 1.9* (−5.1%) |
34.4 ± 2.0** (−5.8%) |
| PFPC (n = 24) | 33.8 ± 1.6 | 34.3 ± 1.7 (+1.9%) |
34.2 ± 1.7* (+1.6%) |
| TEWL (g×h-1×m-2) | |||
| AFPC (n = 24) | 13.1 ± 0.8 | 12.8 ± 0.7 (−1.2%) |
12.1 ± 0.6** (−6.1%) |
| PFAC (n = 24) | 13.9 ± 0.8 | 13.0 ± 0.7* (−5.3%) |
12.7 ± 0.7** (−7.2%) |
| AFAC (n = 22) | 13.7 ± 0.6 | 12.7 ± 0.5** (−6.6%) |
12.2 ± 0.5*** (−10.8%)# |
| PFPC (n = 24) | 12.2 ± 0.5 | 12.3 ± 0.6 (+0.7%) |
11.9 ± 0.5 (−1.9%) |
Table 4.
Skin elasticity. Data are mean ± SEM. The intragroup (vs. baseline) statistical analysis is denoted by the symbol * and is reported near the raw data; while the intergroup (active groups vs. PFPC placebo group) statistical analysis is denoted by the symbol # and is reported near the percentage variation, as follows: * p < 0.05, **/## p < 0.01, ***/### p < 0.001.
| T0 | T4 | T8 | |
|---|---|---|---|
| Skin firmness – R0 (mm) | |||
| AFPC (n = 24) | 0.3910 ± 0.0119 | 0.3816 ± 0.0100* (−2.1%) |
0.3719 ± 0.0110*** (−4.7%) |
| PFAC (n = 24) | 0.3833 ± 0.0103 | 0.3683 ± 0.0108** (−3.9%) |
0.3590 ± 0.0121*** (−6.5%)## |
| AFAC (n = 22) | 0.3880 ± 0.0096 | 0.3679 ± 0.0100*** (−5.1%) |
0.3576 ± 0.0093*** (−7.7%)### |
| PFPC (n = 24) | 0.3689 ± 0.0102 | 0.3660 ± 0.0098 (−0.6%) |
0.3682 ± 0.0113 (−0.2%) |
| Overall elasticity – R2 (au) | |||
| AFPC (n = 24) | 0.5975 ± 0.0106 | 0.6107 ± 0.0088* (+2.4%) |
0.6286 ± 0.0094*** (+5.4%)# |
| PFAC (n = 24) | 0.6135 ± 0.0097 | 0.6295 ± 0.0101* (+2.6%) |
0.6393 ± 0.0117*** (+4.2%) |
| AFAC (n = 22) | 0.6152 ± 0.0086 | 0.6434 ± 0.0077*** (+4.7%)# |
0.6573 ± 0.0066*** (+7.1%)### |
| PFPC (n = 24) | 0.6273 ± 0.0084 | 0.6300 ± 0.0087 (+0.5%) |
0.6345 ± 0.0097 (+1.3%) |
Table 5.
Skin radiance and pores (size and impurities). Data are mean ± SEM. The intragroup (vs. baseline) statistical analysis is denoted by the symbol * and is reported near the raw data; while the intergroup (active groups vs. PFPC placebo group) statistical analysis is denoted by the symbol # and is reported near the percentage variation, as follows: * p < 0.05, **/## p < 0.01, ***/### p < 0.001.
| T0 | T4 | T8 | |
|---|---|---|---|
| Skin radiance (au) | |||
| AFPC (n = 24) | 10.18 ± 0.45 | 11.11 ± 0.41*** (+10.4%) |
11.93 ± 0.43*** (+19.2%) |
| PFAC (n = 24) | 10.25 ± 0.42 | 11.39 ± 0.41** (+12.3%) |
12.46 ± 0.57*** (+22.5%)## |
| AFAC (n = 22) | 9.78 ± 0.49 | 12.18 ± 0.61*** (+26.3%)### |
12.70 ± 0.66*** (+31.5%)### |
| PFPC (n = 24) | 10.50 ± 0.44 | 11.00 ± 0.47* (+5.0%) |
11.09 ± 0.45*** (+6.3%) |
| Pore size (pixel no.) | |||
| AFPC (n = 24) | 233.8 ± 3.5 | 229.6 ± 3.4 (−1.7%) |
231.6 ± 3.8 (−0.8%) |
| PFAC (n = 24) | 222.5 ± 1.9 | 220.7 ± 2.7 (−0.7%) |
229.7 ± 3.5 (+0.9%) |
| AFAC (n = 22) | 227.6 ± 3.6 | 224.4 ± 3.3 (−1.1%) |
225.7 ± 3.1 (−0.4%) |
| PFPC (n = 24) | 226.2 ± 4.0 | 230.4 ± 4.2 (+2.1%) |
226.3 ± 3.4 (+0.3%) |
| Impurities (pixel no.) | |||
| AFPC (n = 24) | 57924.2 ± 12357.7 | 50363.4 ± 8999.1* (−8.7%) |
51013.1 ± 10155.9* (−8.8%) |
| PFAC (n = 24) | 88589.3 ± 16729.5 | 81241.0 ± 14329.2* (−4.9%) |
82071.6 ± 15742.2* (−6.0%) |
| AFAC (n = 22) | 91527.6 ± 18868.7 | 81647.6 ± 17474.8* (−9.6%) |
78297.3 ± 15552.1** (−9.8%) |
| PFPC (n = 23) | 71706.5 ± 20629.9 | 66015.2 ± 18190.0 (−2.8%) |
68071.7 ± 20090.5 (−3.6%) |
Disclaimer/Publisher’s Note: The statements, opinions and data contained in all publications are solely those of the individual author(s) and contributor(s) and not of MDPI and/or the editor(s). MDPI and/or the editor(s) disclaim responsibility for any injury to people or property resulting from any ideas, methods, instructions or products referred to in the content. |
© 2025 by the authors. Licensee MDPI, Basel, Switzerland. This article is an open access article distributed under the terms and conditions of the Creative Commons Attribution (CC BY) license (http://creativecommons.org/licenses/by/4.0/).
Copyright: This open access article is published under a Creative Commons CC BY 4.0 license, which permit the free download, distribution, and reuse, provided that the author and preprint are cited in any reuse.


