1. Introduction
The Rharb Plain, part of a series of Moroccan coastal plains [
1], constitutes the lower portion of the Sebou hydraulic basin. This plain is notable for its size and strategic importance to Moroccan agriculture. Nationally renowned for its agricultural yields, particularly in cereal, vegetable, and irrigated crop production, it plays a vital role in ensuring food security and supporting socio-economic progress. Located in a semi-arid environment [
1] characterized by irregular rainfall, a hot climate, and extended drought periods, the region heavily relies on irrigation to sustain agricultural production and avoid significant economic losses due to water shortages.
The Rharb basin comprises a coarse-grained Plio-Quaternary aquifer, facilitating the circulation of deep groundwater, and a fine-grained Upper Quaternary aquifer, where lower-quality water tends to stagnate. These aquifers are separated by a Quaternary aquitard [
19], limiting direct exchanges between them. The expansion of irrigated areas, totaling approximately 107,000 hectares [
2], disrupts the balance of the deep aquifer in the coastal region, leading to its progressive overexploitation.
In this semi-arid context, excessive extraction of freshwater from deep aquifers has resulted in significant hydrological deficits since the early 1990s, alongside critical qualitative impacts such as contamination by pollutants and seawater intrusion into the coastal aquifers. This phenomenon degrades the water quality available for agriculture and consumption.
To better understand these complex dynamics, transient hydrodynamic and hydrodispersive models have been developed, based on the permanent hydrodynamic model [
3], and supported by the development of a Geographic Information System (GIS) database [
4], this approach enhances analysis and decision-making processes. A transient hydrodynamic model, based on Modflow-GMS, integrates historical pumping [
18] and recharge data while refining the storage coefficients of the Plio-Quaternary aquifer to align with field conditions. This approach enabled a precise analysis of the piezometric decline of the deep aquifer from 1992–1993 to 2006–2007, identifying key factors affecting groundwater availability, including climate change and evolving agricultural practices.
A hydrodispersive model was subsequently developed to monitor water quality changes in both aquifers and the increasing seawater intrusion into the Plio-Quaternary aquifer. Using the MT3DMS tool, the model simulated the spatio-temporal evolution of water concentrations, accounting for seasonal variations and pumping practices. To further study seawater intrusion, the SEAWAT tool was employed to accurately simulate the advance of saline oceanic waters contaminating the deep aquifer in the coastal area. The model highlights the impact of intensive groundwater exploitation on aquifer salinization and serves as a decision-support tool for sustainable management strategies.
These models act as vital tools for informed decision-making, enabling policymakers to implement integrated water resource management strategies. This approach addresses the alarming challenges posed by climate change and overexploitation in the region, ensuring rational and effective interventions to promote sustainable development.
2. Geographical, Geological, and Hydrogeological Framework
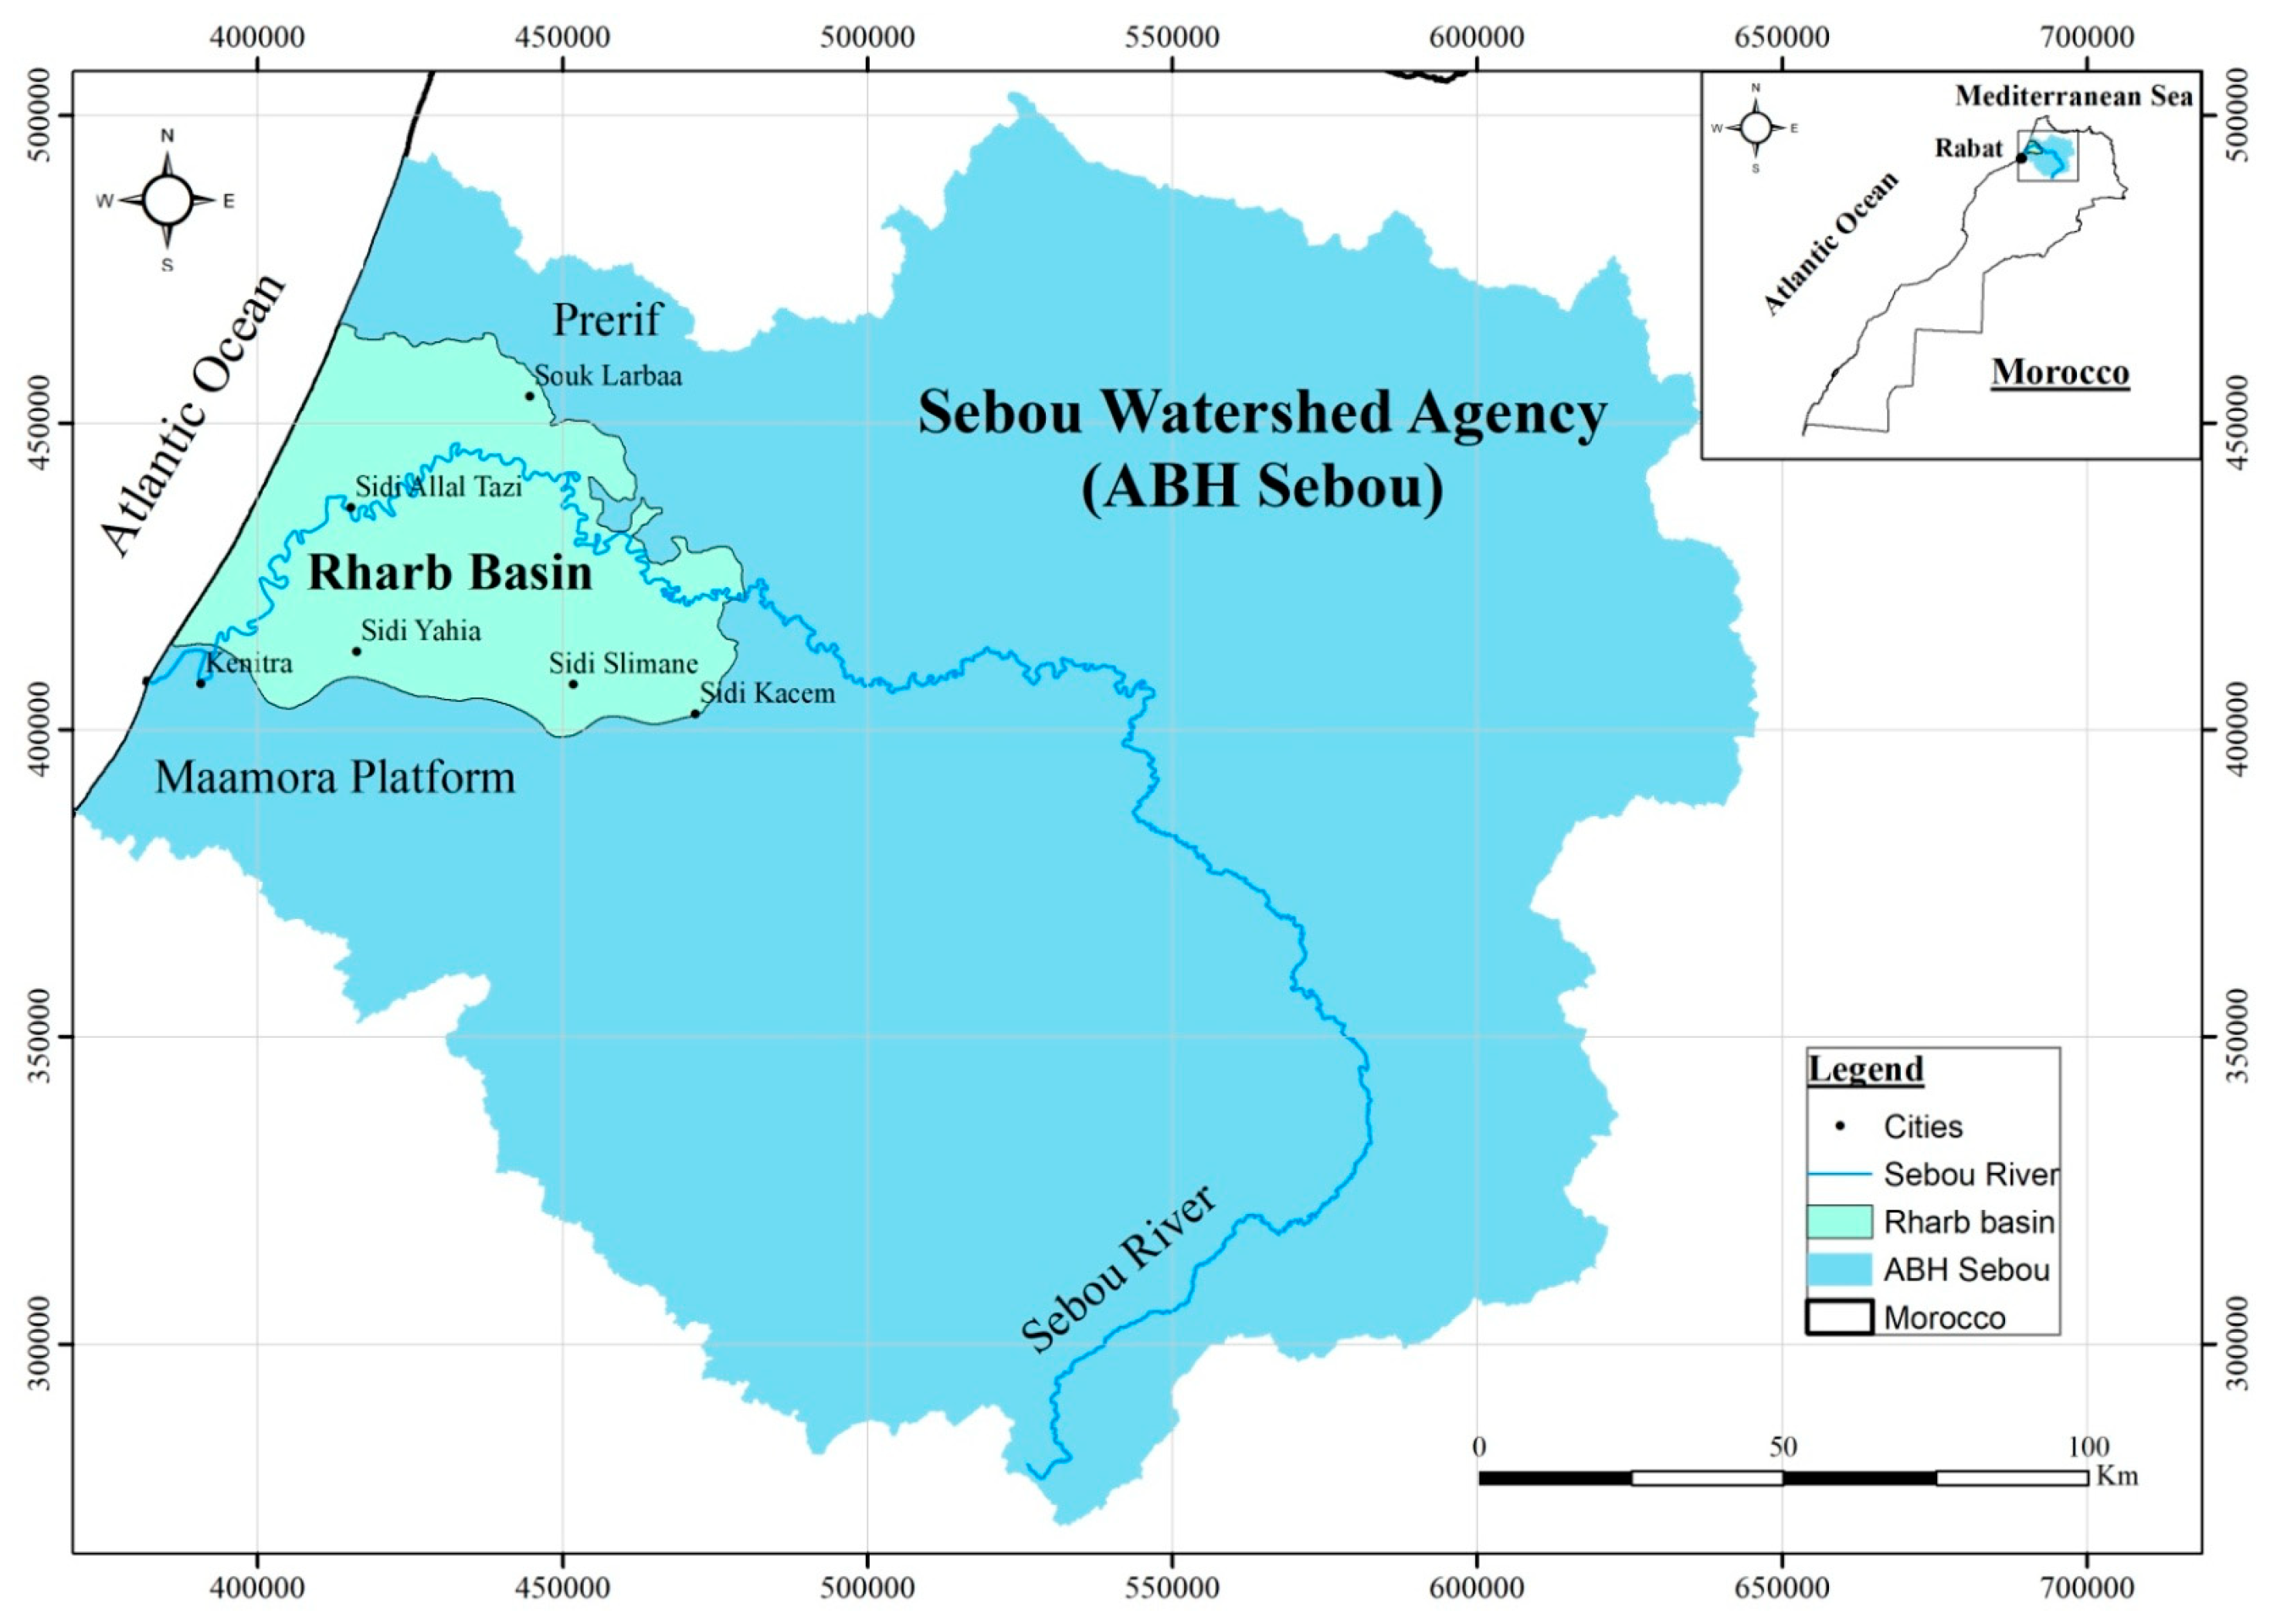
The Rharb Basin is located in the northwest of Morocco and covers an area of 4000 km². It is bordered by the Atlantic Ocean to the west, the Drader-Souier Plain to the north, the hills of the Rif Mountains to the east, and the Maamora Plateau to the south. With elevations ranging between 5 and 25 meters, this area comprises a coastal zone, continental margins, and a central alluvial plain of the lower Sebou (
Figure 1).
Geologically, the Rharb Basin represents the foreland basin of the Rif mountain range, affected by continuous subsidence since the middle Vindobonian (a period during which the pre-Rif thrust sheets were formed). The Rharb, a subsiding basin since the Tortonian, is primarily structured by two main lineaments: the first, to the north, responsible for the structure of Lalla Zohra [
5], and the second, to the south, represented by the Maamora front [
5,
6].
During the Plio-Villafranchian, the relief of the northern, southern, and eastern borders of the plain was uplifted in response to recent phases of Alpine compression, isostatic adjustments, and eustatic falls, compensated by the abundance of coarse continental inputs deposited by significant fluvio-estuarine systems [
7]. In the central part of the basin [
5] highlighted, within the Miocene substratum, three satellite basins that largely controlled the subsequent formation of the aquifers during the Plio-Quaternary period. To the west of the basin, along the coastal deposits of the NW-SE fault corridors, the growth of the Lalla Zahra front to the north and a localized folding structure around the city of Kenitra developed.
Furthermore, field data associated with electrofacies resistivity and high-resolution seismic refraction tomography indicate that this region is tectonically active and subjected to significant horizontal movements with a strike-slip component, as evidenced at the Dhar Doum-Lalla Zahra fault, where faults are associated with anticlines and synclines, and the structural setup resembles “fault-propagation folds” or propagation folds at the front of the Rif chain [
8].
At the regional scale, new interpretations incorporate the Rharb Basin into a dynamic involving the lineaments of the Rif chain, notably the Jebha and Nekour faults [
9,
10]. The position of current seismic epicenters confirms the recent activity of some of these lineaments.
This basin is located between two major structural units that serve as sediment sources: the pre-Rif to the north and the Rifian ridges to the south, while to the south are the Maamora Plain and the Hercynian Meseta [
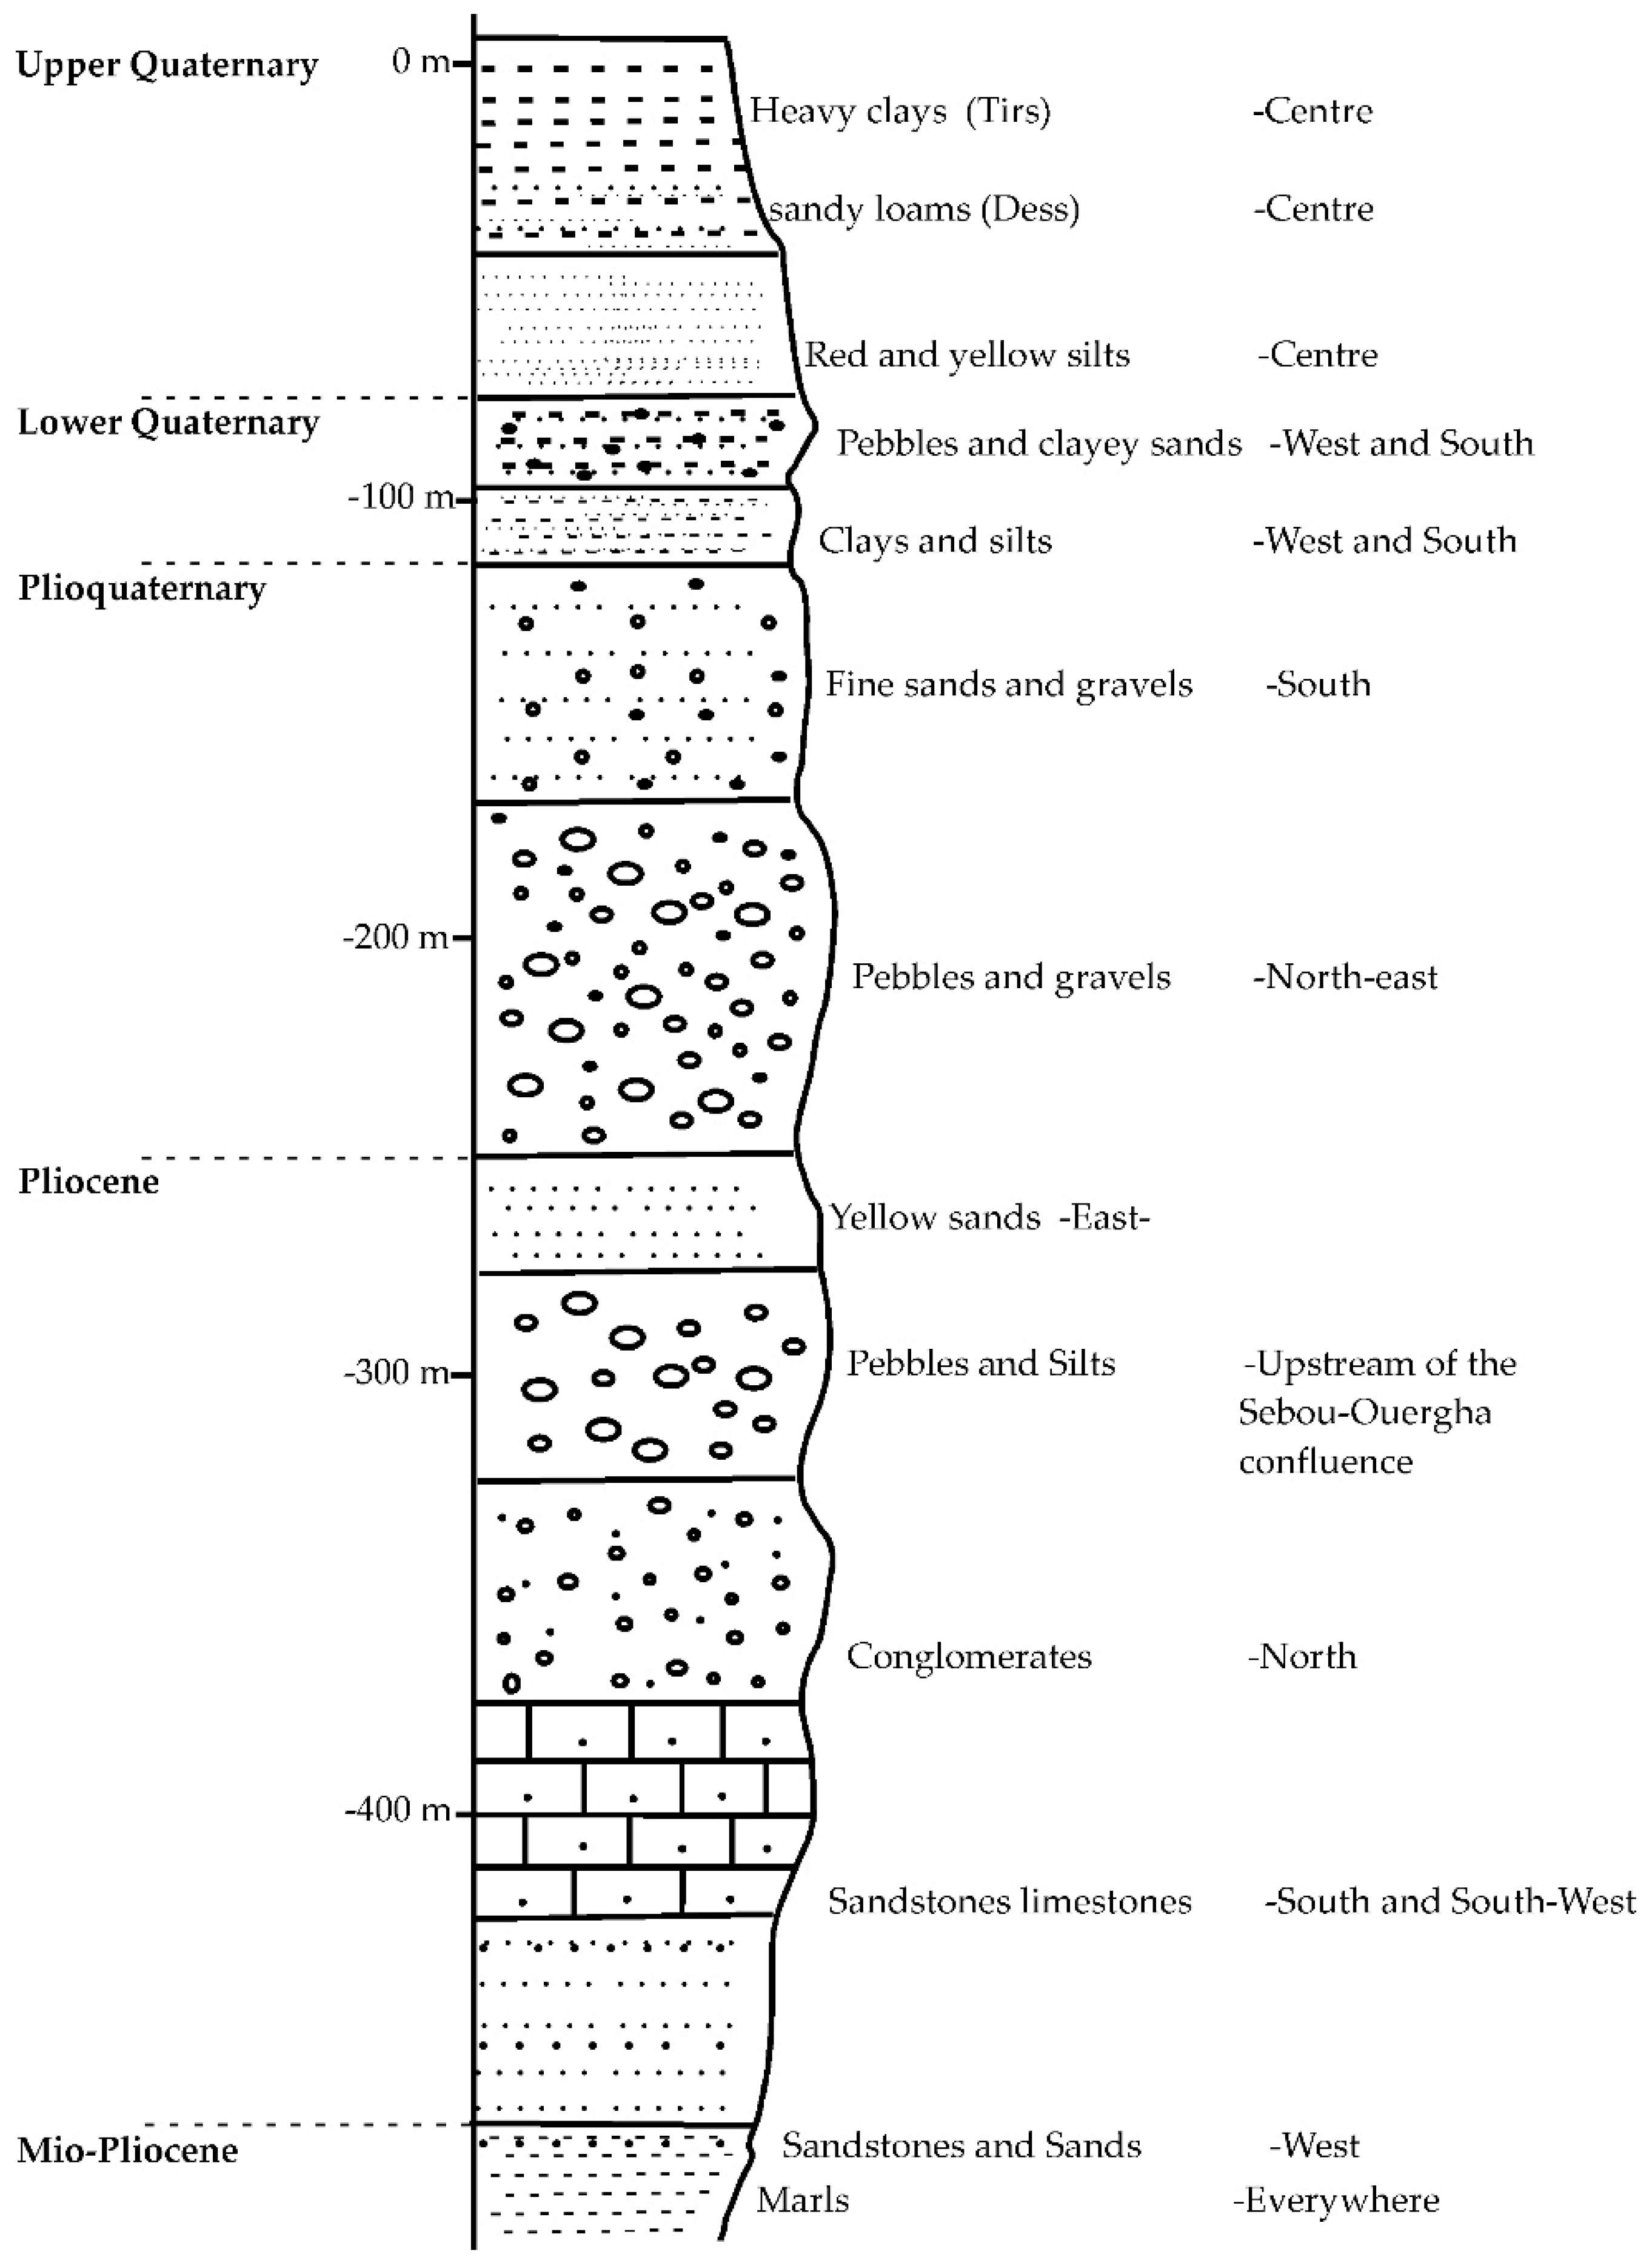
11]. The stratigraphic succession of the basin ranges from the Miocene to the Upper Quaternary (
Figure 2).
During the Lower Quaternary, two distinctive levels are sometimes distinguished within this detrital complex: the Tensiftien, characterized by the reappearance of coarse gravel and more or less clayey sands (up to a maximum thickness of 60 meters), and the Amerian, with sediments consisting of clays and loams with limestone nodules (up to a maximum thickness of 50 meters).
The Villafranchian (Moulouyan-Regreguian-Saletian) and the Lower Quaternary are difficult to distinguish due to similar depositional conditions. They contain significant spreads of pebbles and gravel found beneath the plain and its northern and eastern peripheries. To the south, the fine sands and gravel of the Maamora are connected to them.
The Pliocene is characterized by marine deposits of calcareous sandstones, sandstones, and sands located in the coastal zone. Regressive deposits [
7] and conglomerates identified by their outcrops in the north of the basin, yellow sands in the east, and continental sediments, pebbles, and silts located upstream of the confluence zone of the Sebou and Ouergha rivers. The thickness of this level is low, and its hydrogeological interest is limited.
The Mio-Pliocene is associated with the subsidence and sedimentary infill of the syn-tectonic foreland basin. It is characterized by a thick series, with a thickness that can reach 2000 meters of gray or blue marls. Laterally, these marls transition to discordant molasses of the foreland, displaying chaotic facies where extensive submarine landslides can be observed. This forms the general substrate of the overlying terrains.
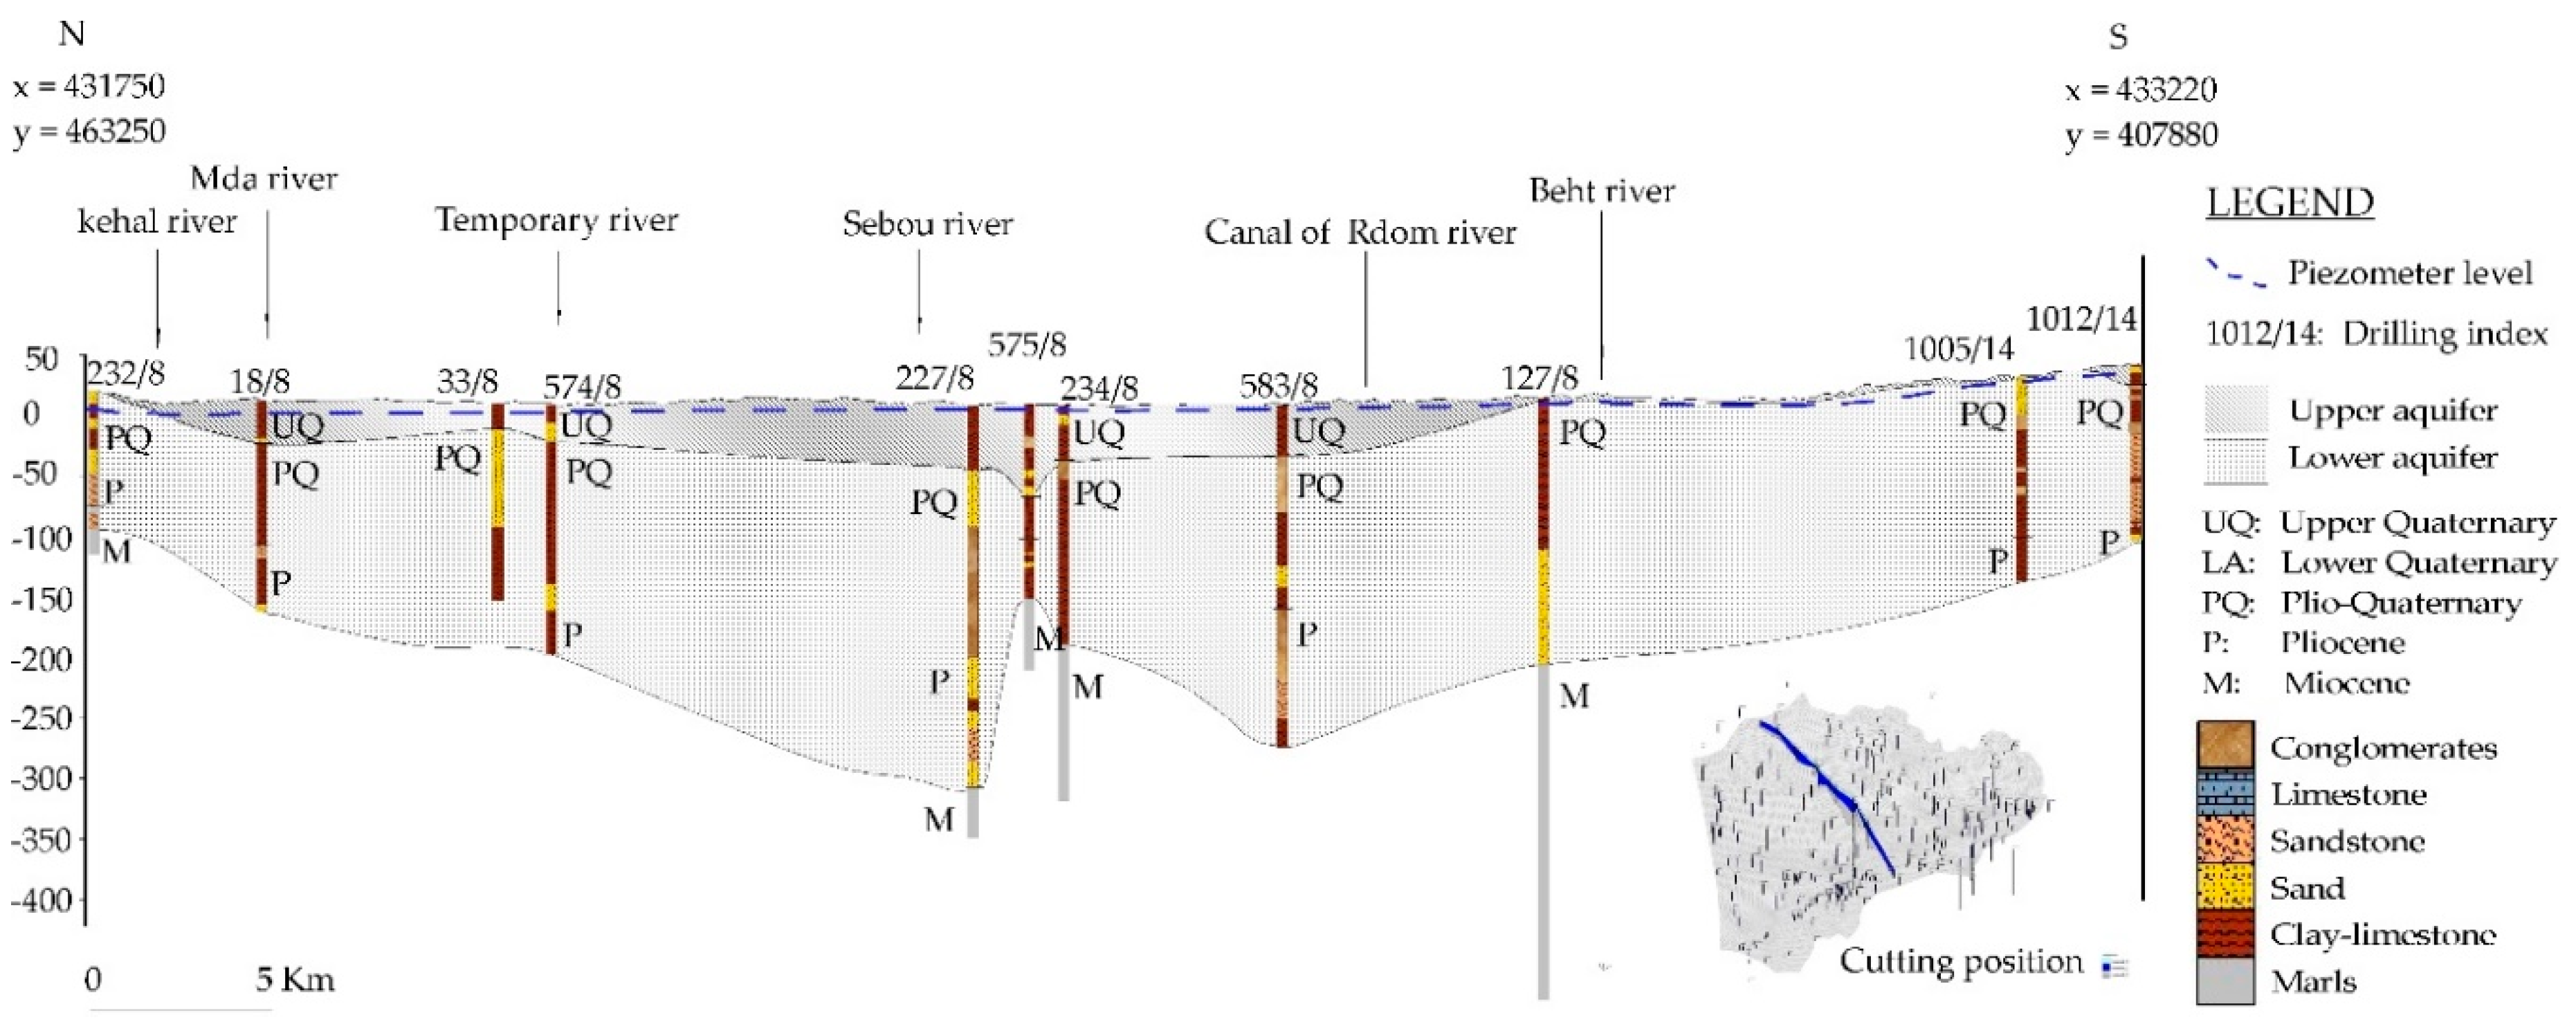
From a hydrogeological perspective, this sedimentary succession includes two aquifers: one aquifer ranging in age from the Pliocene to the Lower Quaternary, composed of coarse sediments through which the waters of the deep aquifer flow, and another aquifer from the Upper Quaternary through which the waters of the shallow groundwater flow. The two aquifers are separated by an aquitard, consisting of compact Lower Quaternary clays, which pressurize the deep waters in the center of the basin. At the outcrops in the north, east, south, and west of the basin, the aquifer becomes unconfined (
Figure 3).
3. Transient Hydrodynamic Model
3.1. Method and Tools
The working method involves using the numerical MODFLOW model, derived from the calibration of permeabilities in the steady-state system [
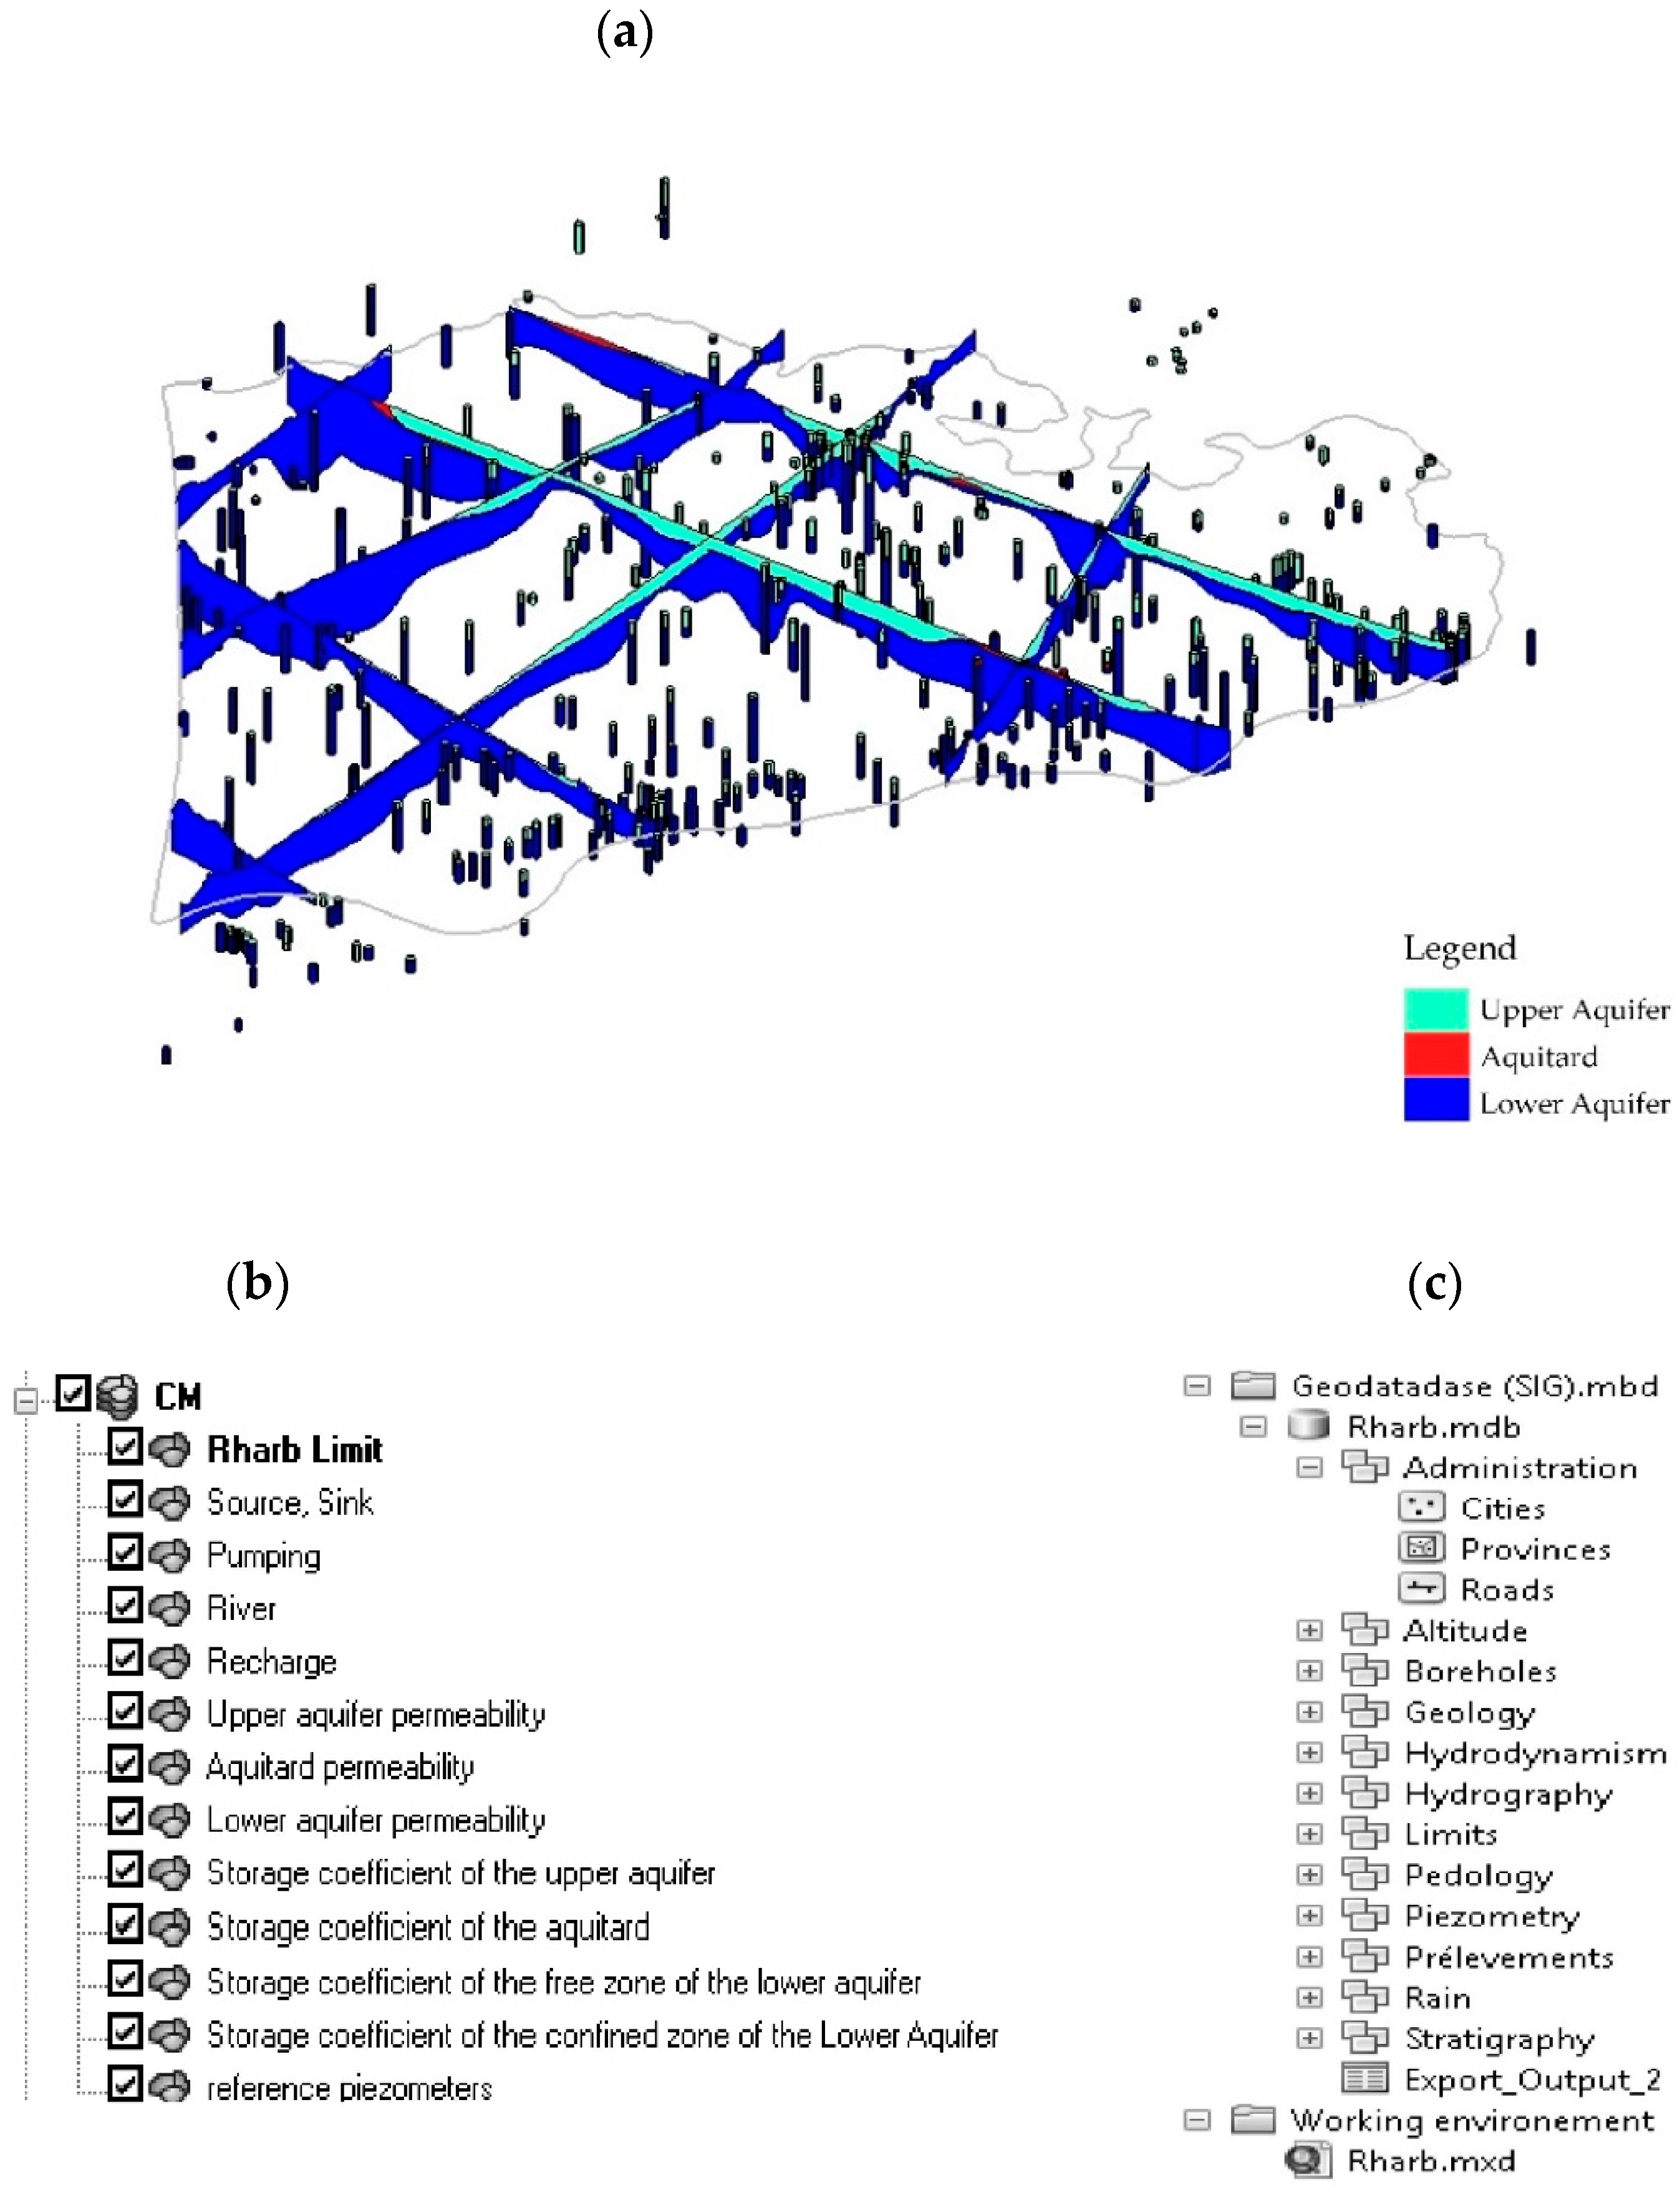
3]. This model consists of a workspace containing the 3D block diagram of the basin (
Figure 4. (a)), built from mechanical boreholes and enhanced by data from geoelectrical profiles, as well as the layers of the conceptual model (
Figure 4. (b)). These data are stored in a geographic database created using ArcGIS (
Figure 4. (c)). New data, including storage coefficients to be calibrated (
Appendix A), piezometric histories, recharge and pumping histories, are input into the transient-state model.
The computational code Modflow, developed in Fortran by the USGS [
12], is based on solving the general partial differential equation of diffusivity for flow, through a combination of the continuity equation and Darcy’s law (Eq. (1)).
With h: hydraulic head [L], K: hydraulic conductivity [L.T−1], Ss: specific storage coefficient [L−1], W: unit outflux [T−1], t: time [T].
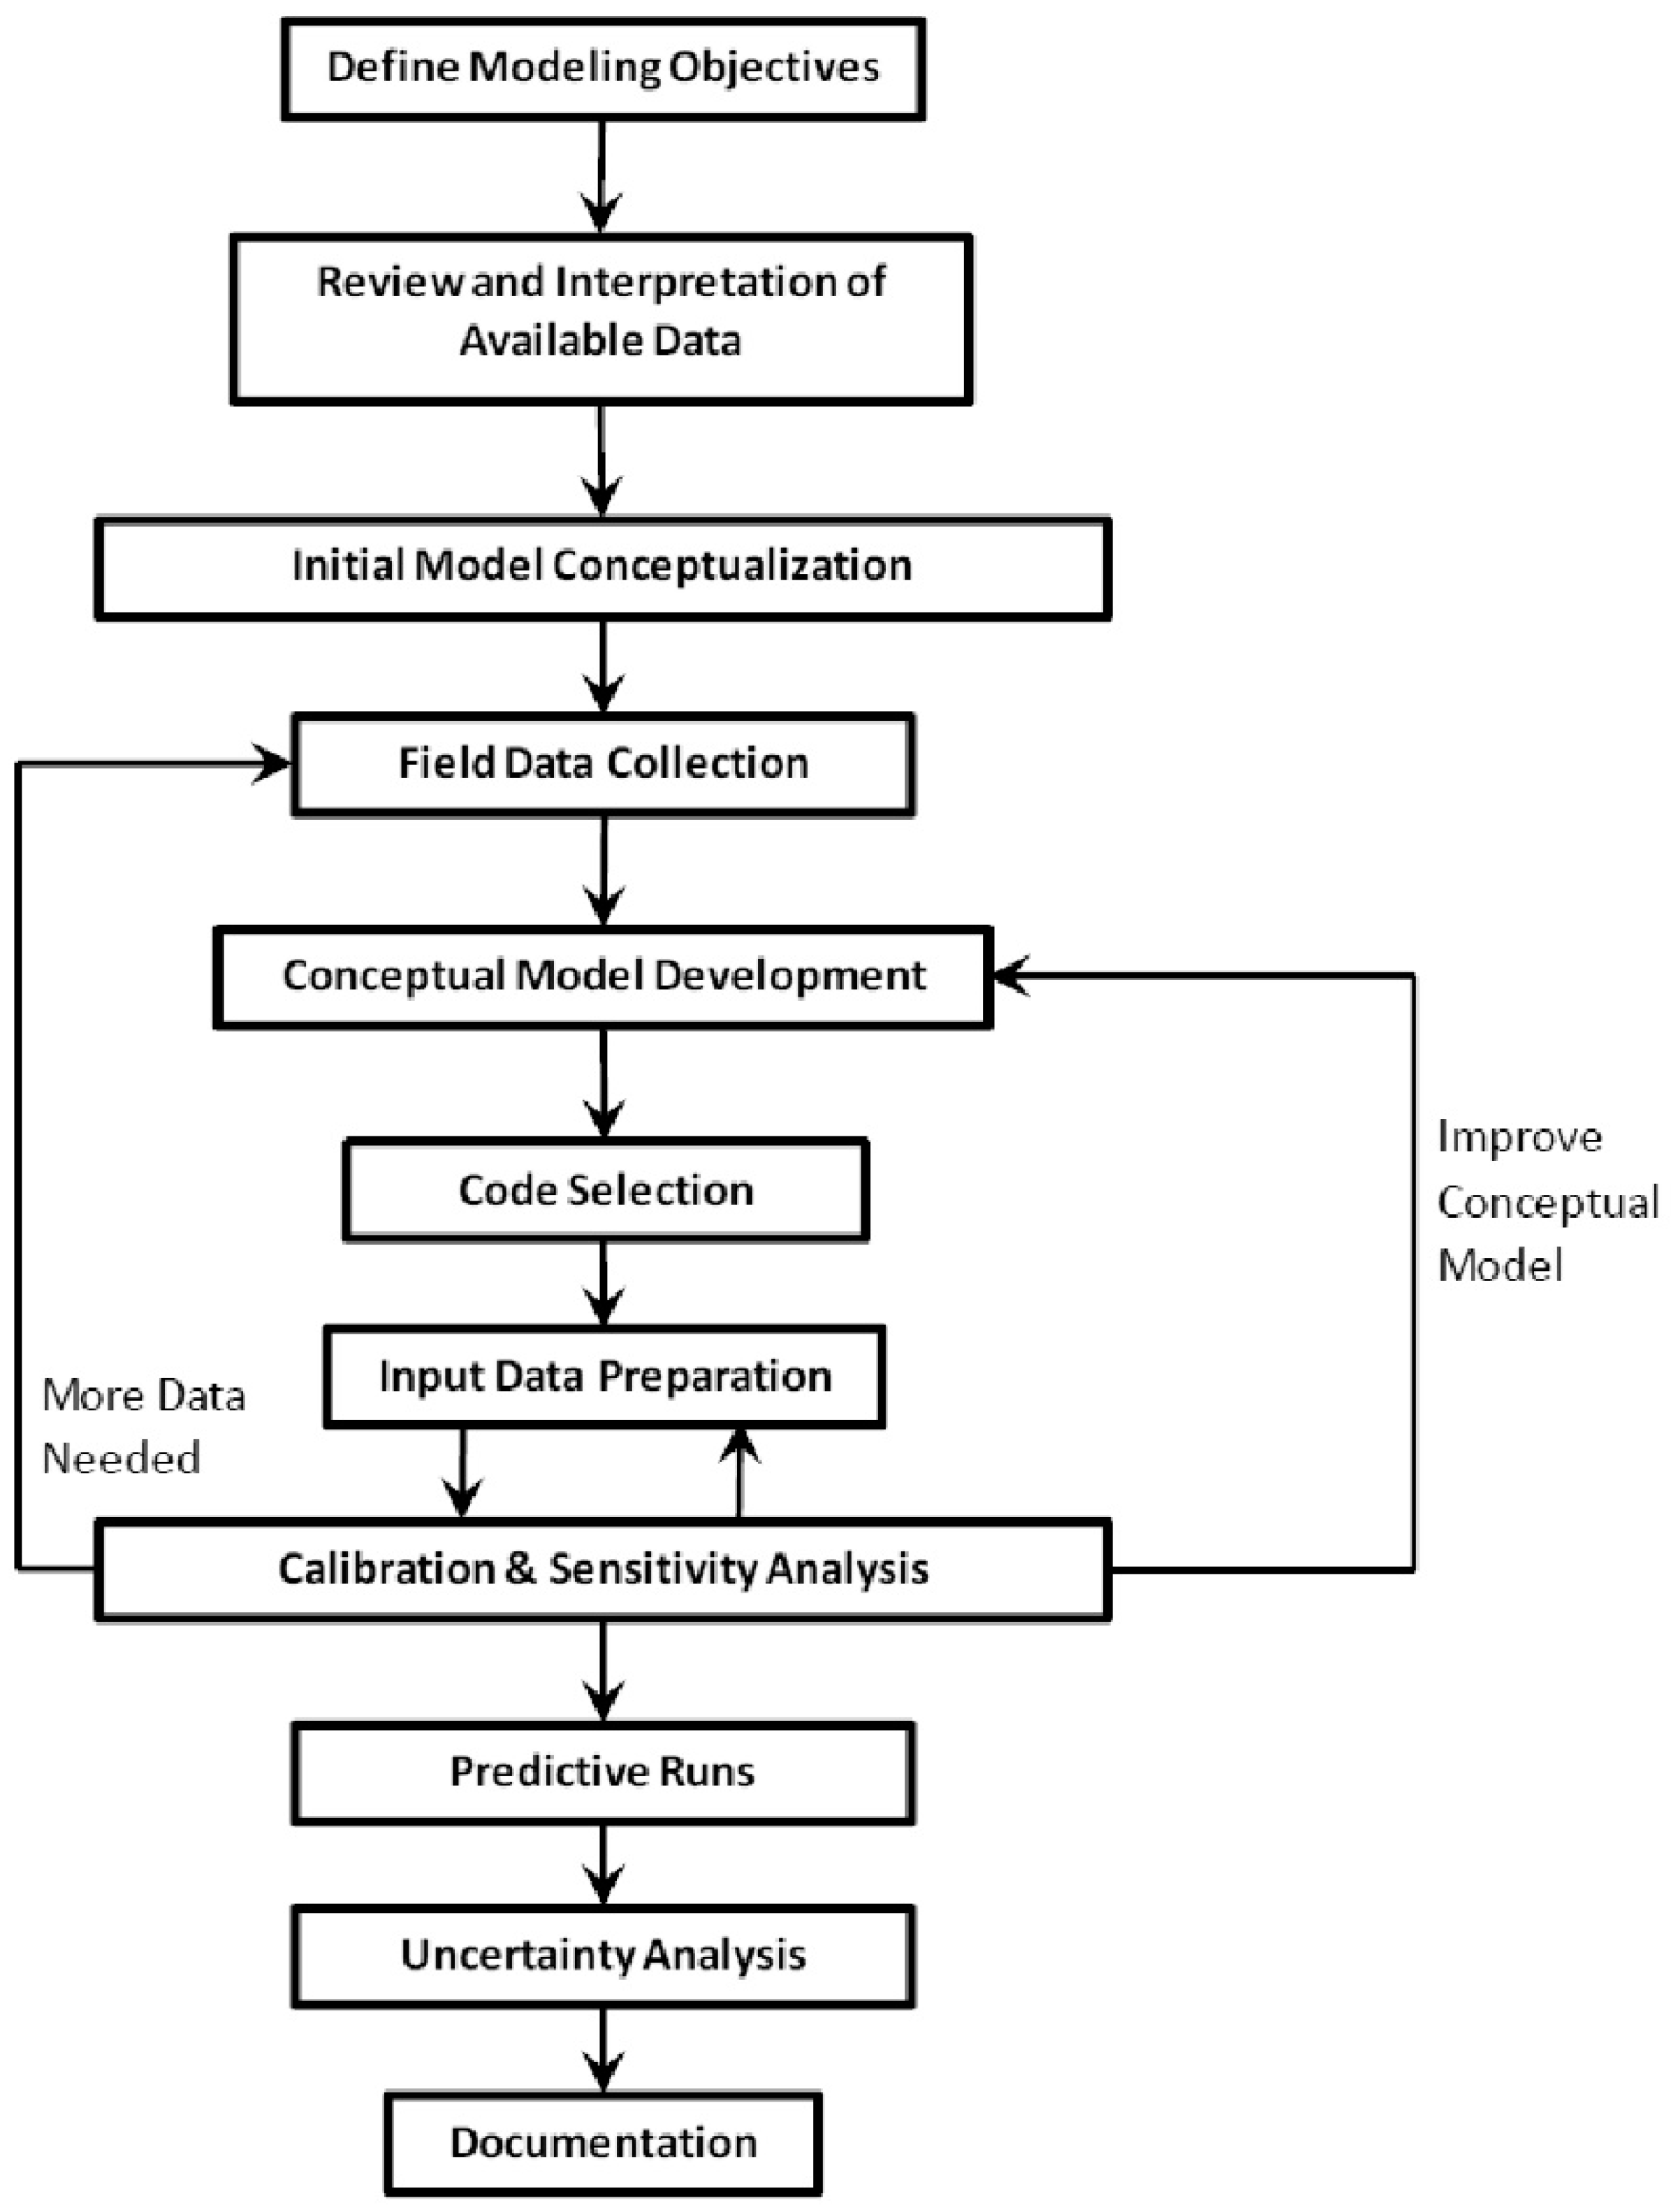
Subsequently, the Modflow calculation parameters are updated in transient mode to account for the temporal evolution of the groundwater system in response to external disturbances, primarily precipitation and abstractions. Similar to the steady-state hydrodynamic model, the development of the transient model follows the model construction process [
13] (
Figure 5).
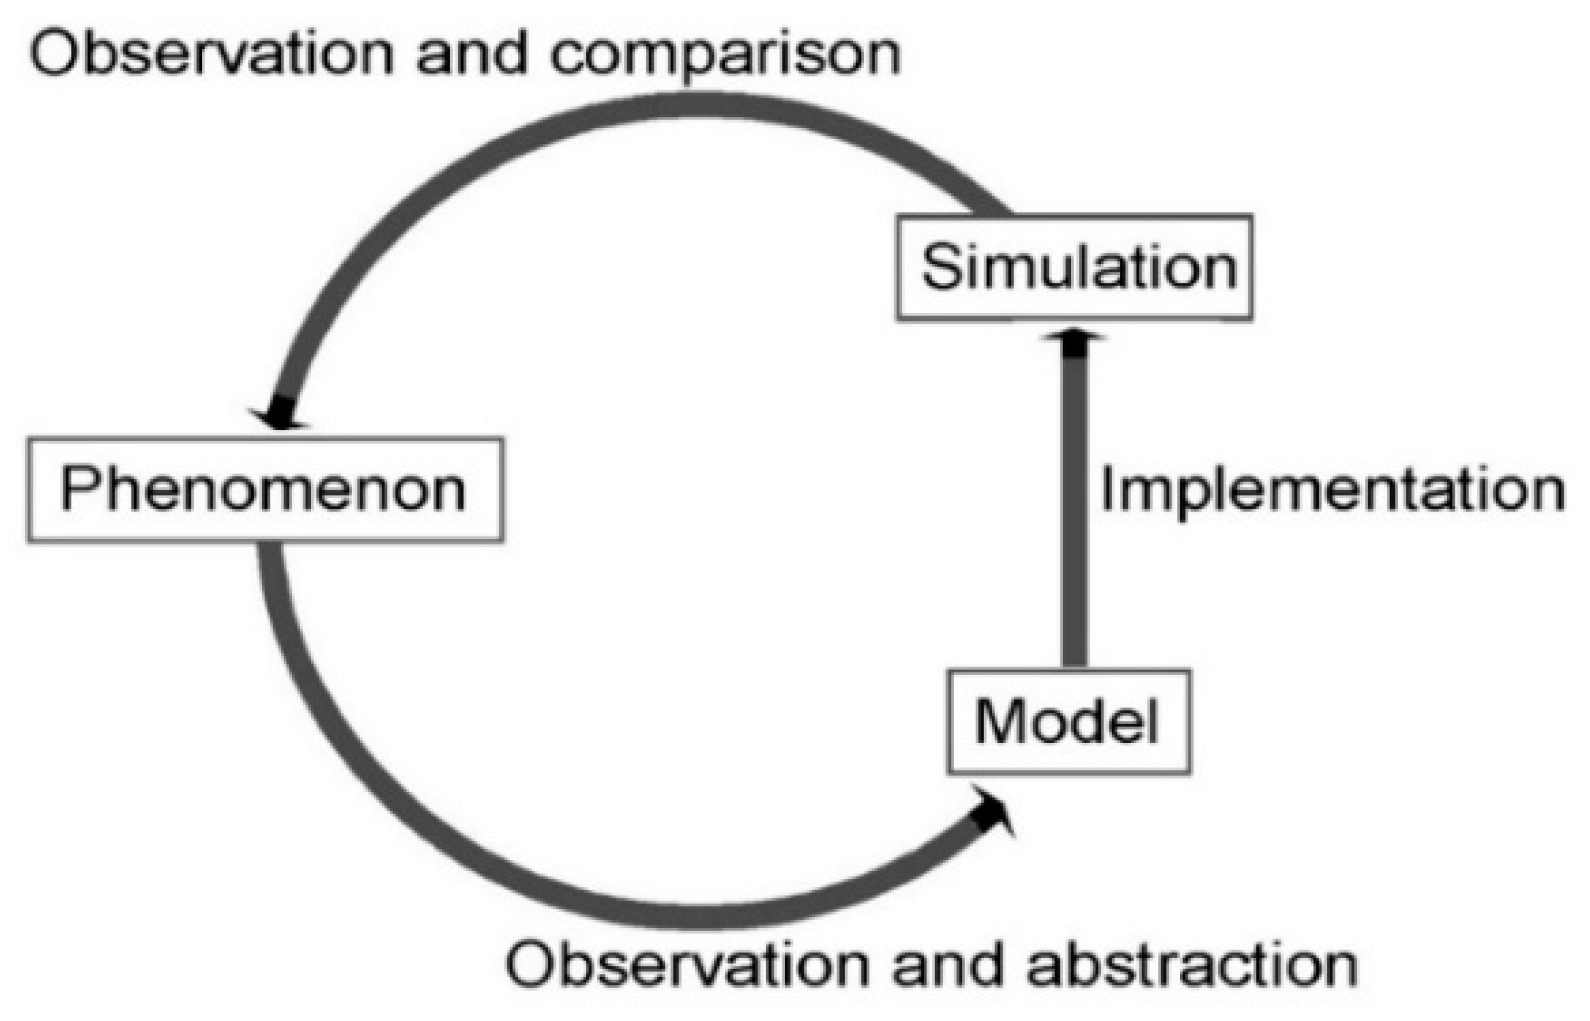
The main adjustments made to the Modflow tool include reconfiguring the model for transient state and defining initial conditions to consider during simulations. The objective of transient modeling is to calibrate the storage coefficients of the Plioquaternary aquifer by comparing the calculated piezometric levels, for each time interval, to measurements from the five pilot piezometers. The available measurements of this coefficient before calibration range from 0.01 to 0.2 for the unconfined aquifer and from 0.0001 to 0.001 for confined aquifers. A series of simulations is initiated with the aim of reducing the gap between calculations and measurements until the stage where the results are deemed satisfactory, while adhering to the modeling cycle [
14] (
Figure 6)).
The resolution of the first-order linear differential system to calculate the piezometric height (H) is done according to the following equation:
With T: transmissivity (L2/T), H: hydraulic head (L), Q: injected or pumped water volume (L3/T), a: surface area of the cell (L2), S: storage coefficient, t: time (T).
Thus, the storage volume ΔV at each cell i, j, k level is expressed as follows :
With ΔV/Δt : variation of storage per unit time during the time step Δt, S i,j,k : storage coefficient of cell i, j, k , ΔRj : distance between neighboring nodes, ΔCi*ΔVk : surface area of the exchange facet, Hmi,j,k Hm-1i,j,k : heads at nodes (i, j, k) and (i, j-1, k) at time step m, tm - tm-1 : time interval separating time steps m and m-1.
3.1.1. Simulation Period, Spatio-Temporal Discretization, and Boundary Conditions
The Rharb aquifer system did not show significant declining trends until the early 1990s. Simulations are conducted from the beginning of this decade, where pumping activities experienced a notable increase, causing disturbance to the aquifer system equilibrium. We have considered a period of 15 intervals from 22/09/1992 to 22/09/2007, based on the availability of historical data on withdrawals for agricultural irrigation purposes. The discretization [
12] of the study air respects the following two conditions: Horizontally, and to better target the most sensitive areas (aquifer-river interfaces, boundary conditions...), we opted for a refined mesh by assigning cell sizes ranging from 6.25 x 10
-2 m
2 to 1 km
2 after utilizing the MODFLOW USG Quadtree Grid. This results in 46748 cells to represent the entire system, with 14252 for the upper aquifer, 12259 for the aquitard, and 20237 for the lower aquifer. Vertically, the model is three-layered, and the cells adhere to the actual thickness of the aquifer formations.
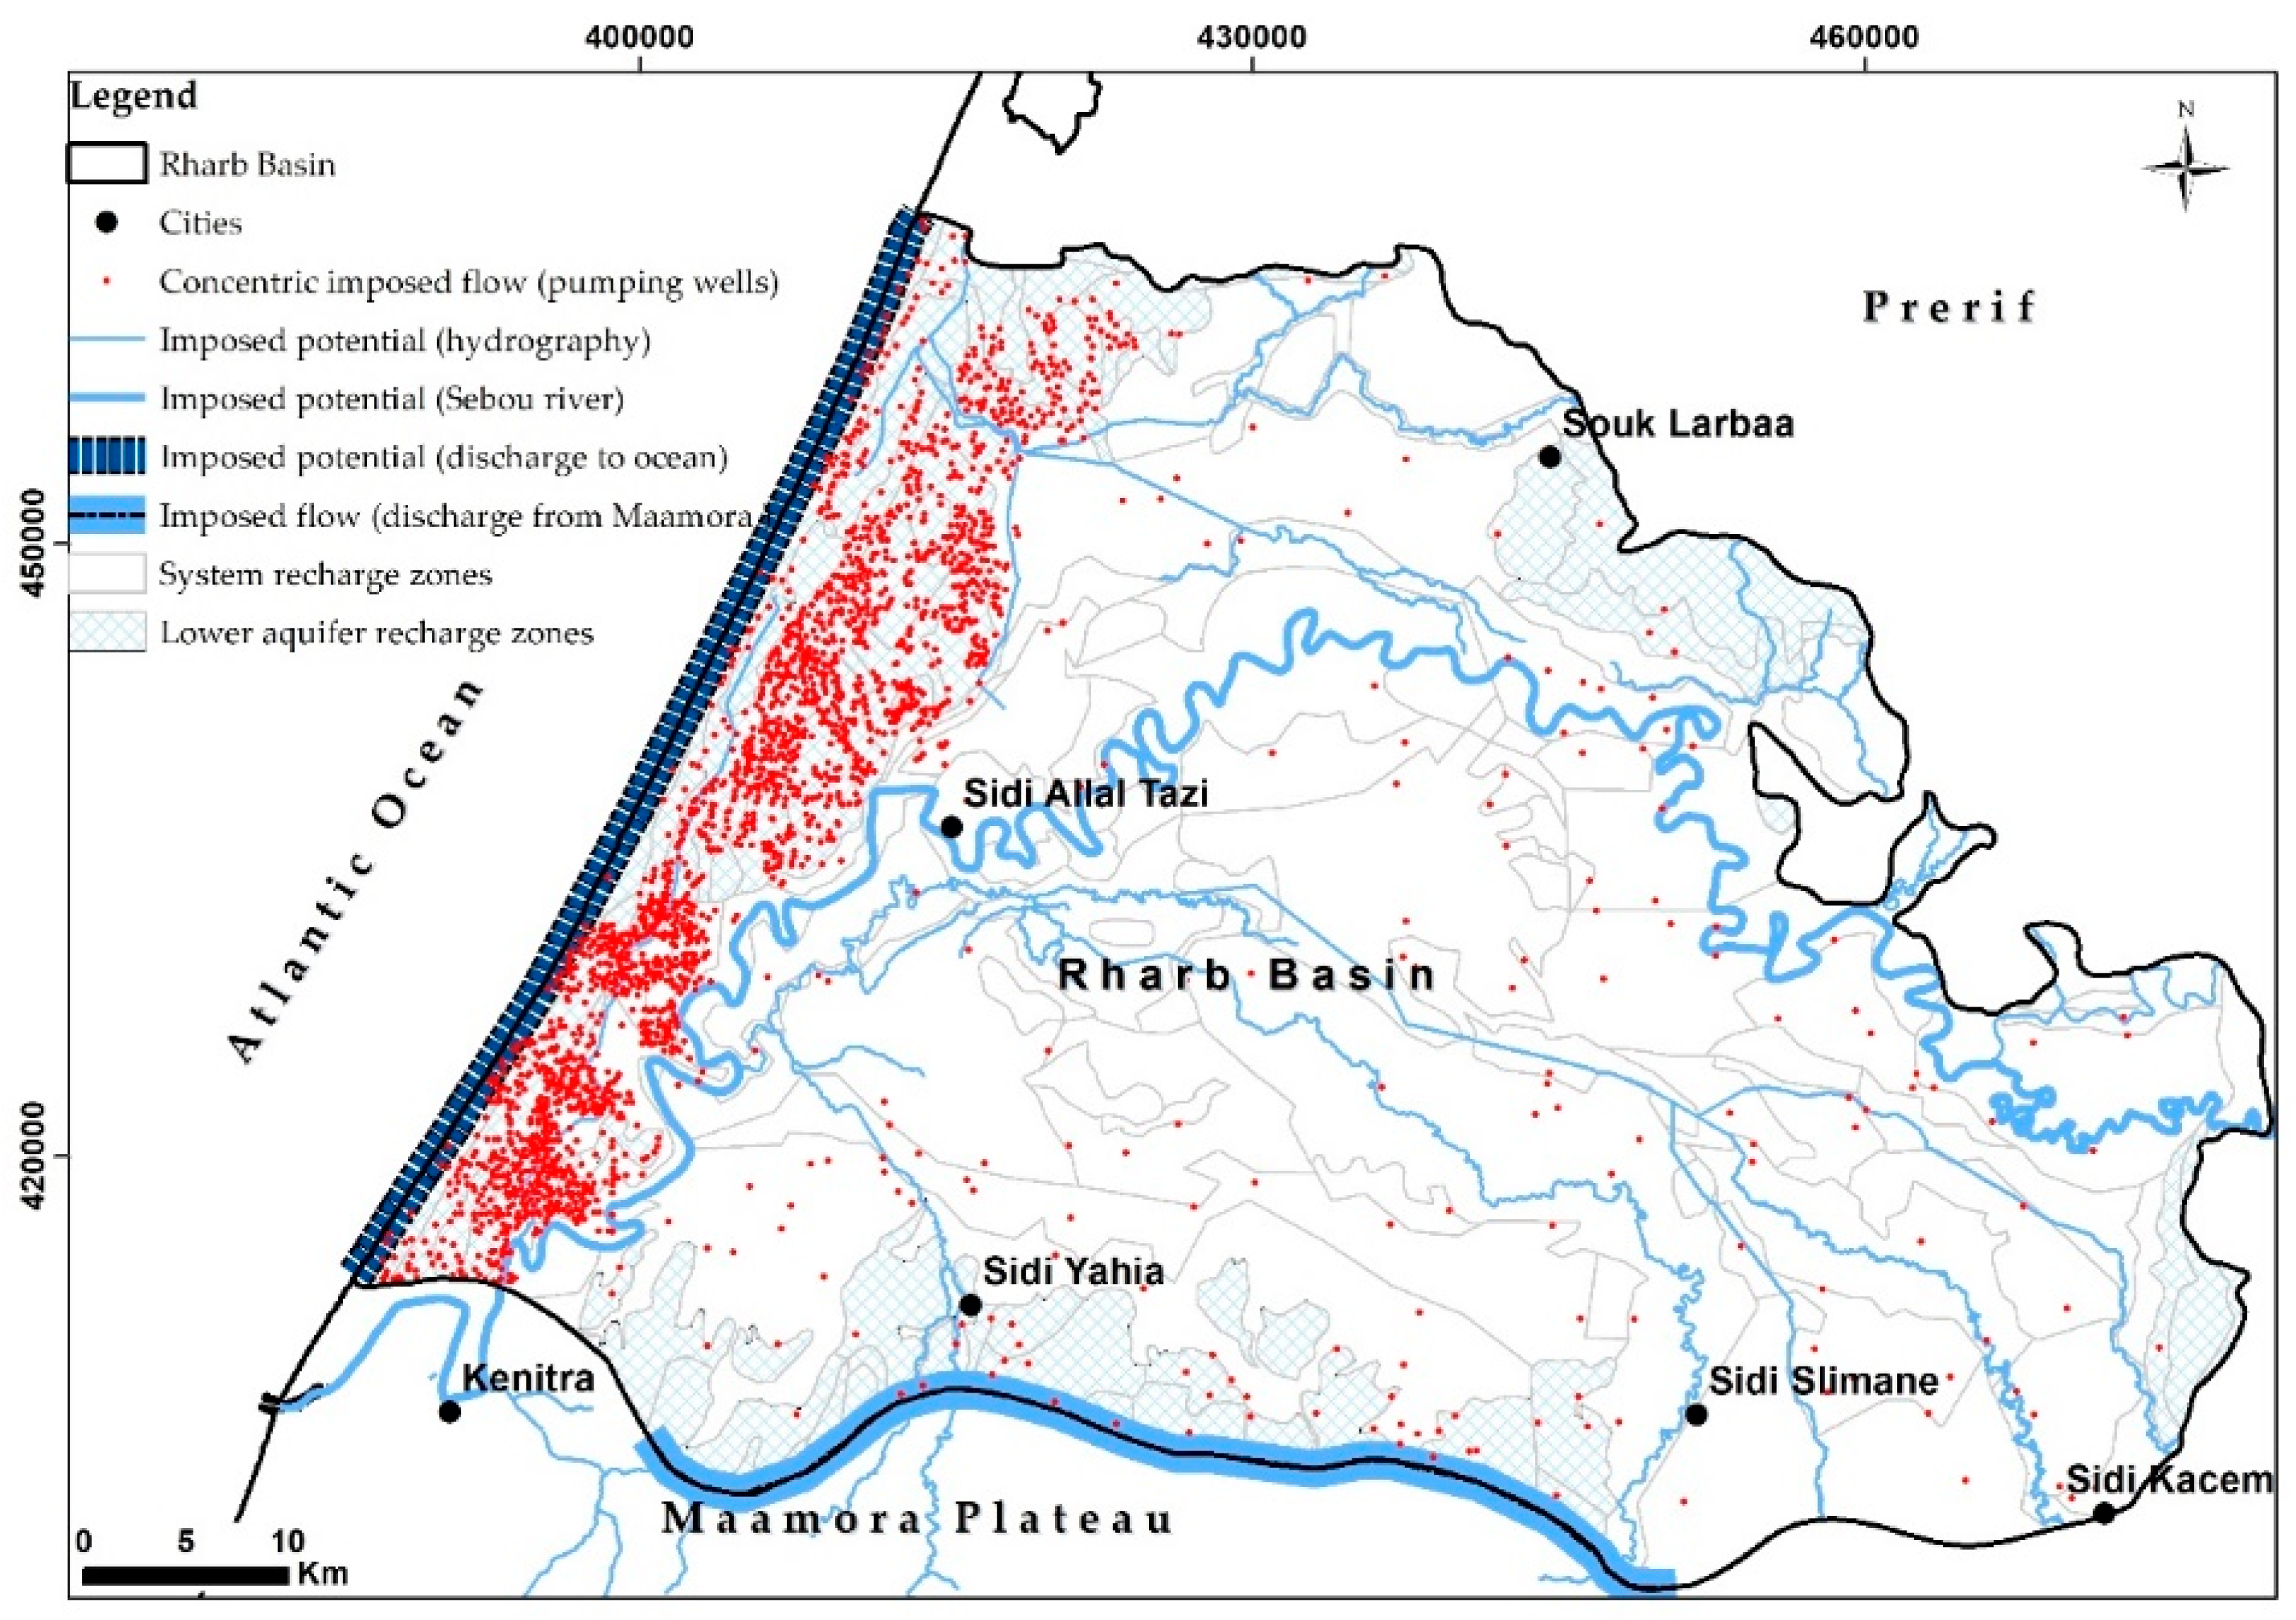
The boundary conditions of the transient model are as follows (
Figure 7).
The southern boundary is a constant head condition represented by the discharge of groundwater from the Maamora aquifer to the Rharb aquifer. The northern boundary is a no-flow condition represented by the divide between surface waters of the Drader-Souier plain and the Rharb plain. The western boundary is an imposed potential condition representing the discharge of groundwater from the Rharb aquifer to the Atlantic Ocean. The eastern, southeast, and southwest boundaries are no-flow conditions defined by the extension limits of the hydrogeological basin. Rivers are represented as boundaries with imposed potential or Dirichlet conditions [
15]. The main infiltration zones include coastal strips, eastern and southern areas where permeable outcrops allow the system to receive an average of 113.4 million cubic meters per year (0.4 mm/day).
3.1.2. Inputs and Outputs of the Transient Model Include
Withdrawals are represented as an imposed flux condition and are incorporated into the model with the indication of the pumping rate. These withdrawals are internal documents consisting of daily historical data from three surveys conducted by COMBE [
16], ENGEAMA (Inquiry 1992), and the Sebou Hydraulic Basin Agency [
1] following the surveys of 2005 and 2008.
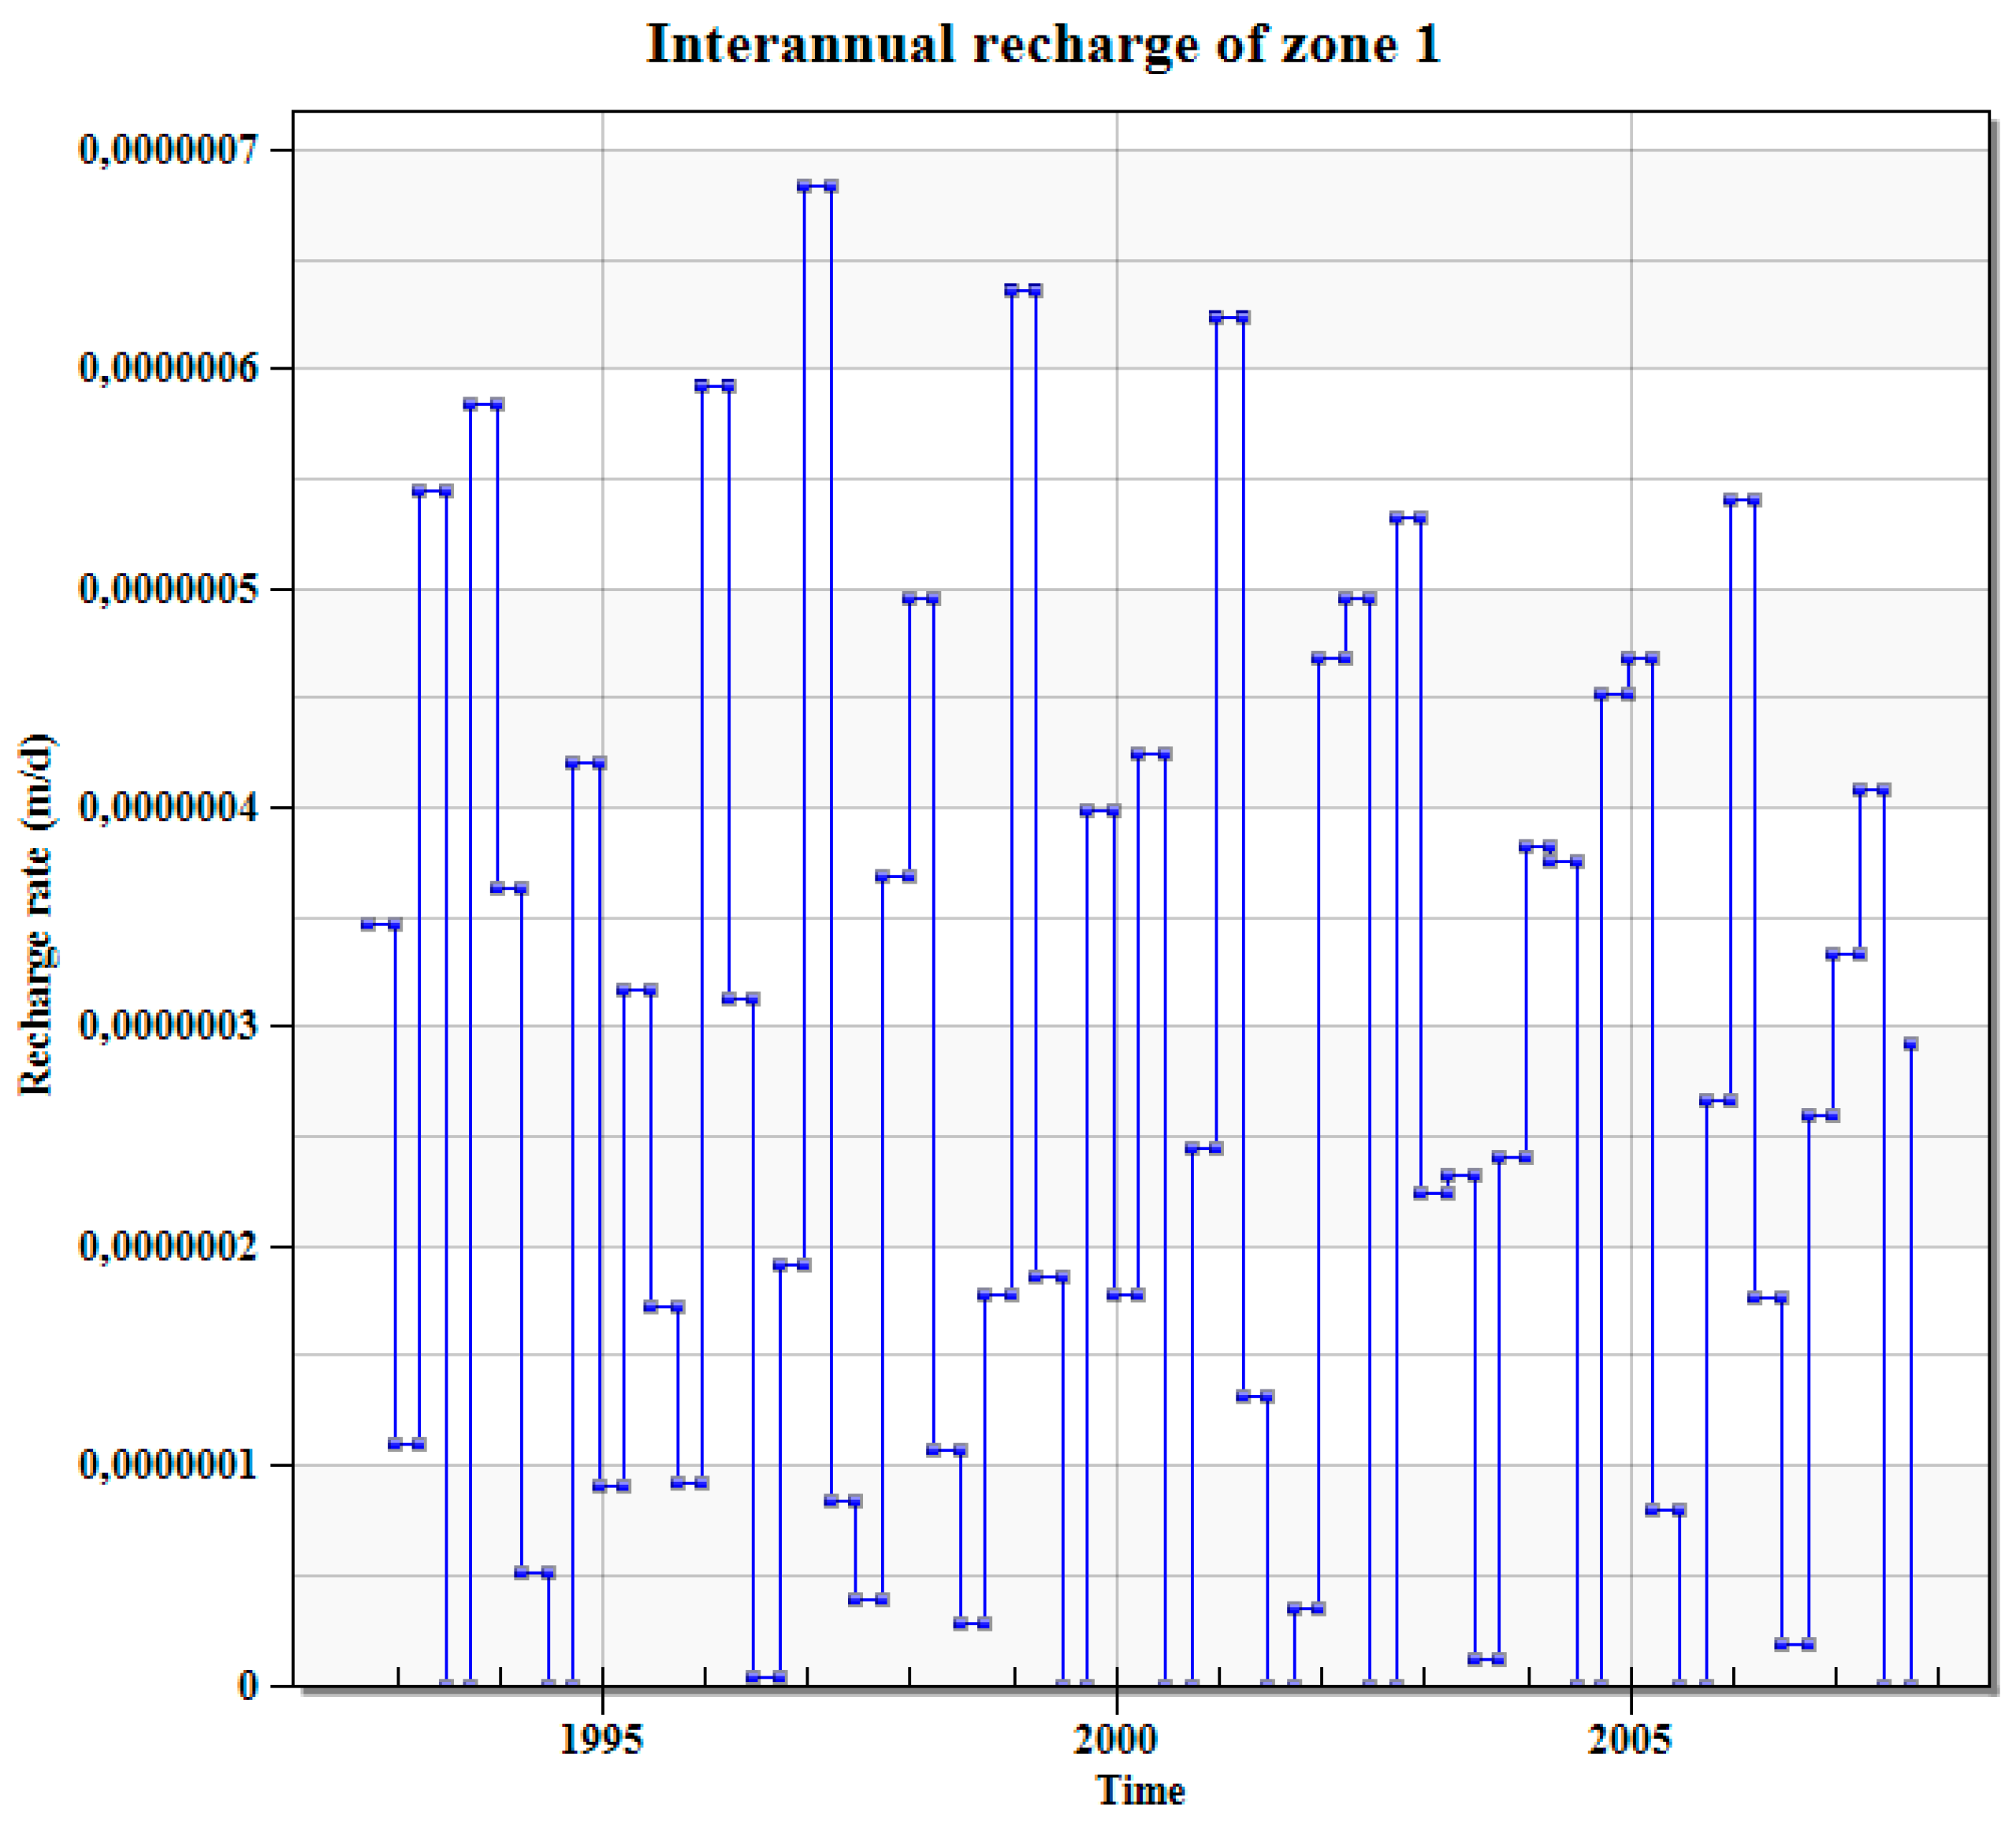
To simplify the task, and since irrigation withdrawals constitute more than 90% of the total withdrawals, we only consider this data. Data on drinking water reserved for consumption and industrial water are not precise, and some information such as coordinates is missing. The return flow from irrigation is also subtracted from the inputs, this time to compensate for the portion of water supply for drinking and industrial purposes as outputs, since their volumes are analogous. Recharge data is inserted based on the division of the Rharb plain into 156 zones derived from the calibration of the steady-state model. Each group of zones (parcels with equal infiltration values) is assigned a series of 60 values corresponding to seasonal distributions of recharge for the entire study period (
Figure 8).
3.2. Results and Discussion
3.2.1. Storage Coefficients of the Plioquaternary Aquifer
Following the comparison of piezometric levels between the model and recordings from pilot piezometers (
Table 2.), adjusting storage coefficients enables a spatial distribution generalized at the basin scale.
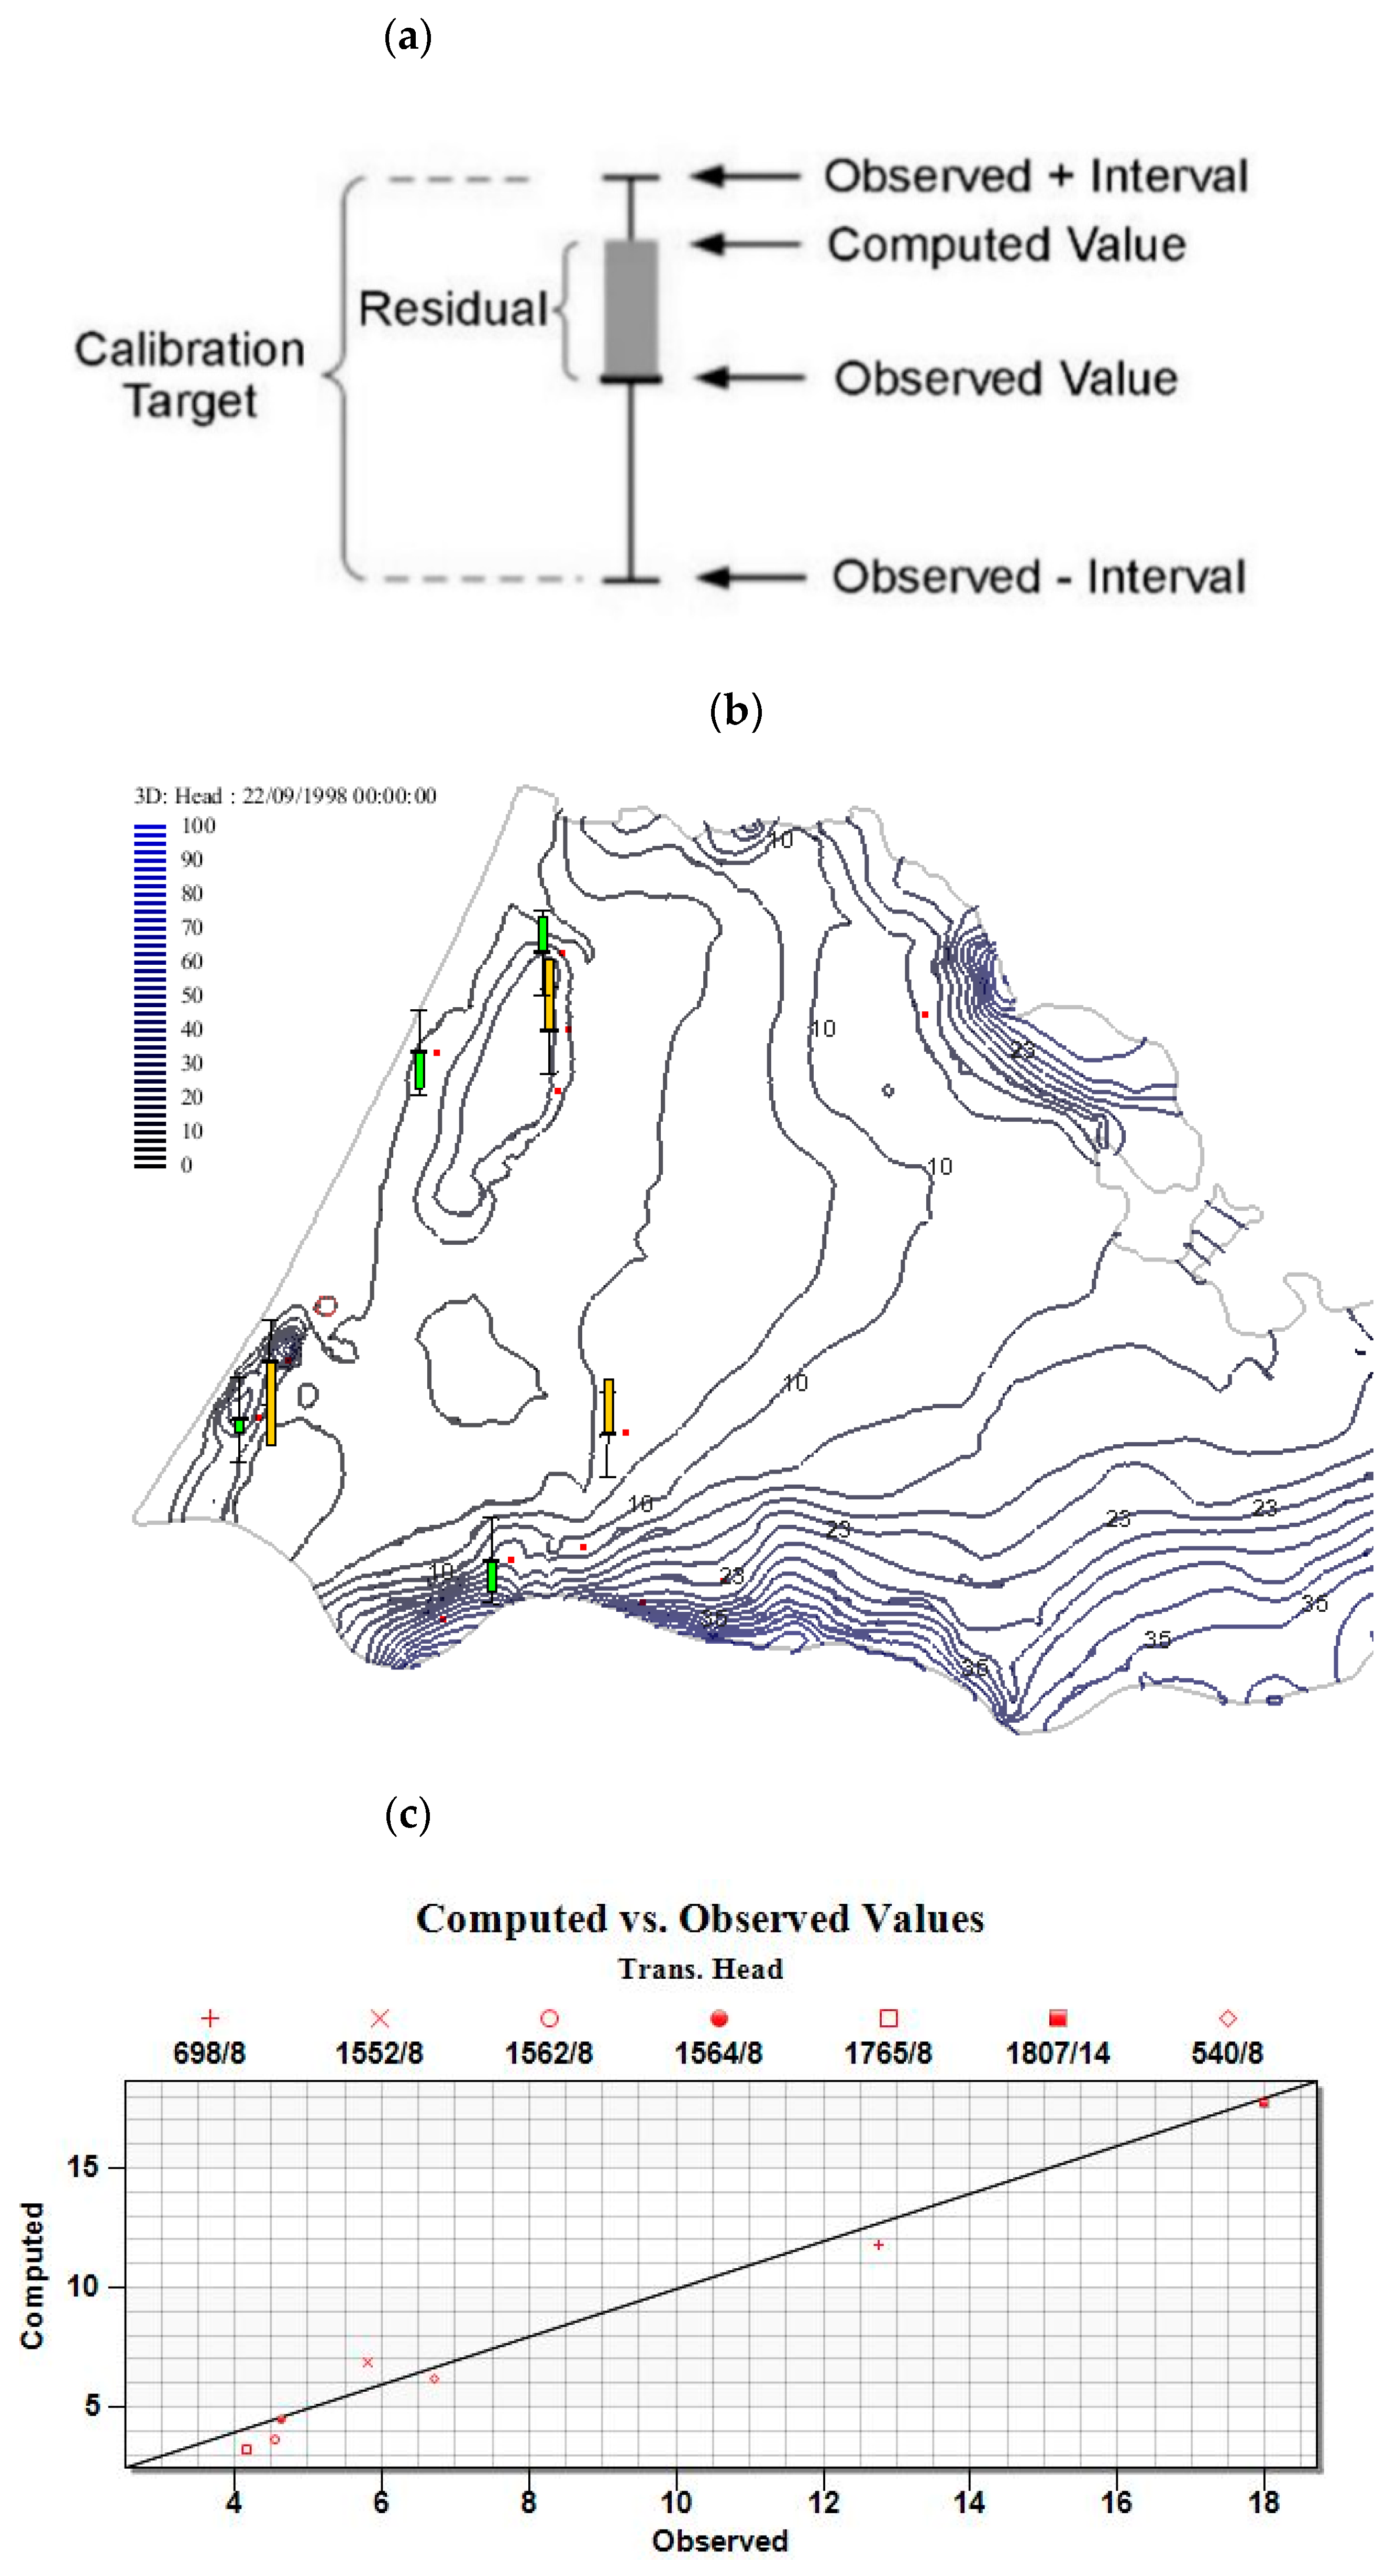
The reliability of the result is assessed through the measurement of the calibration uncertainty of the calculated and measured loads at the monitoring well levels (
Figure 9. (a), (b)), and by establishing a measurement/calculation relationship (
Figure 9. (c)).
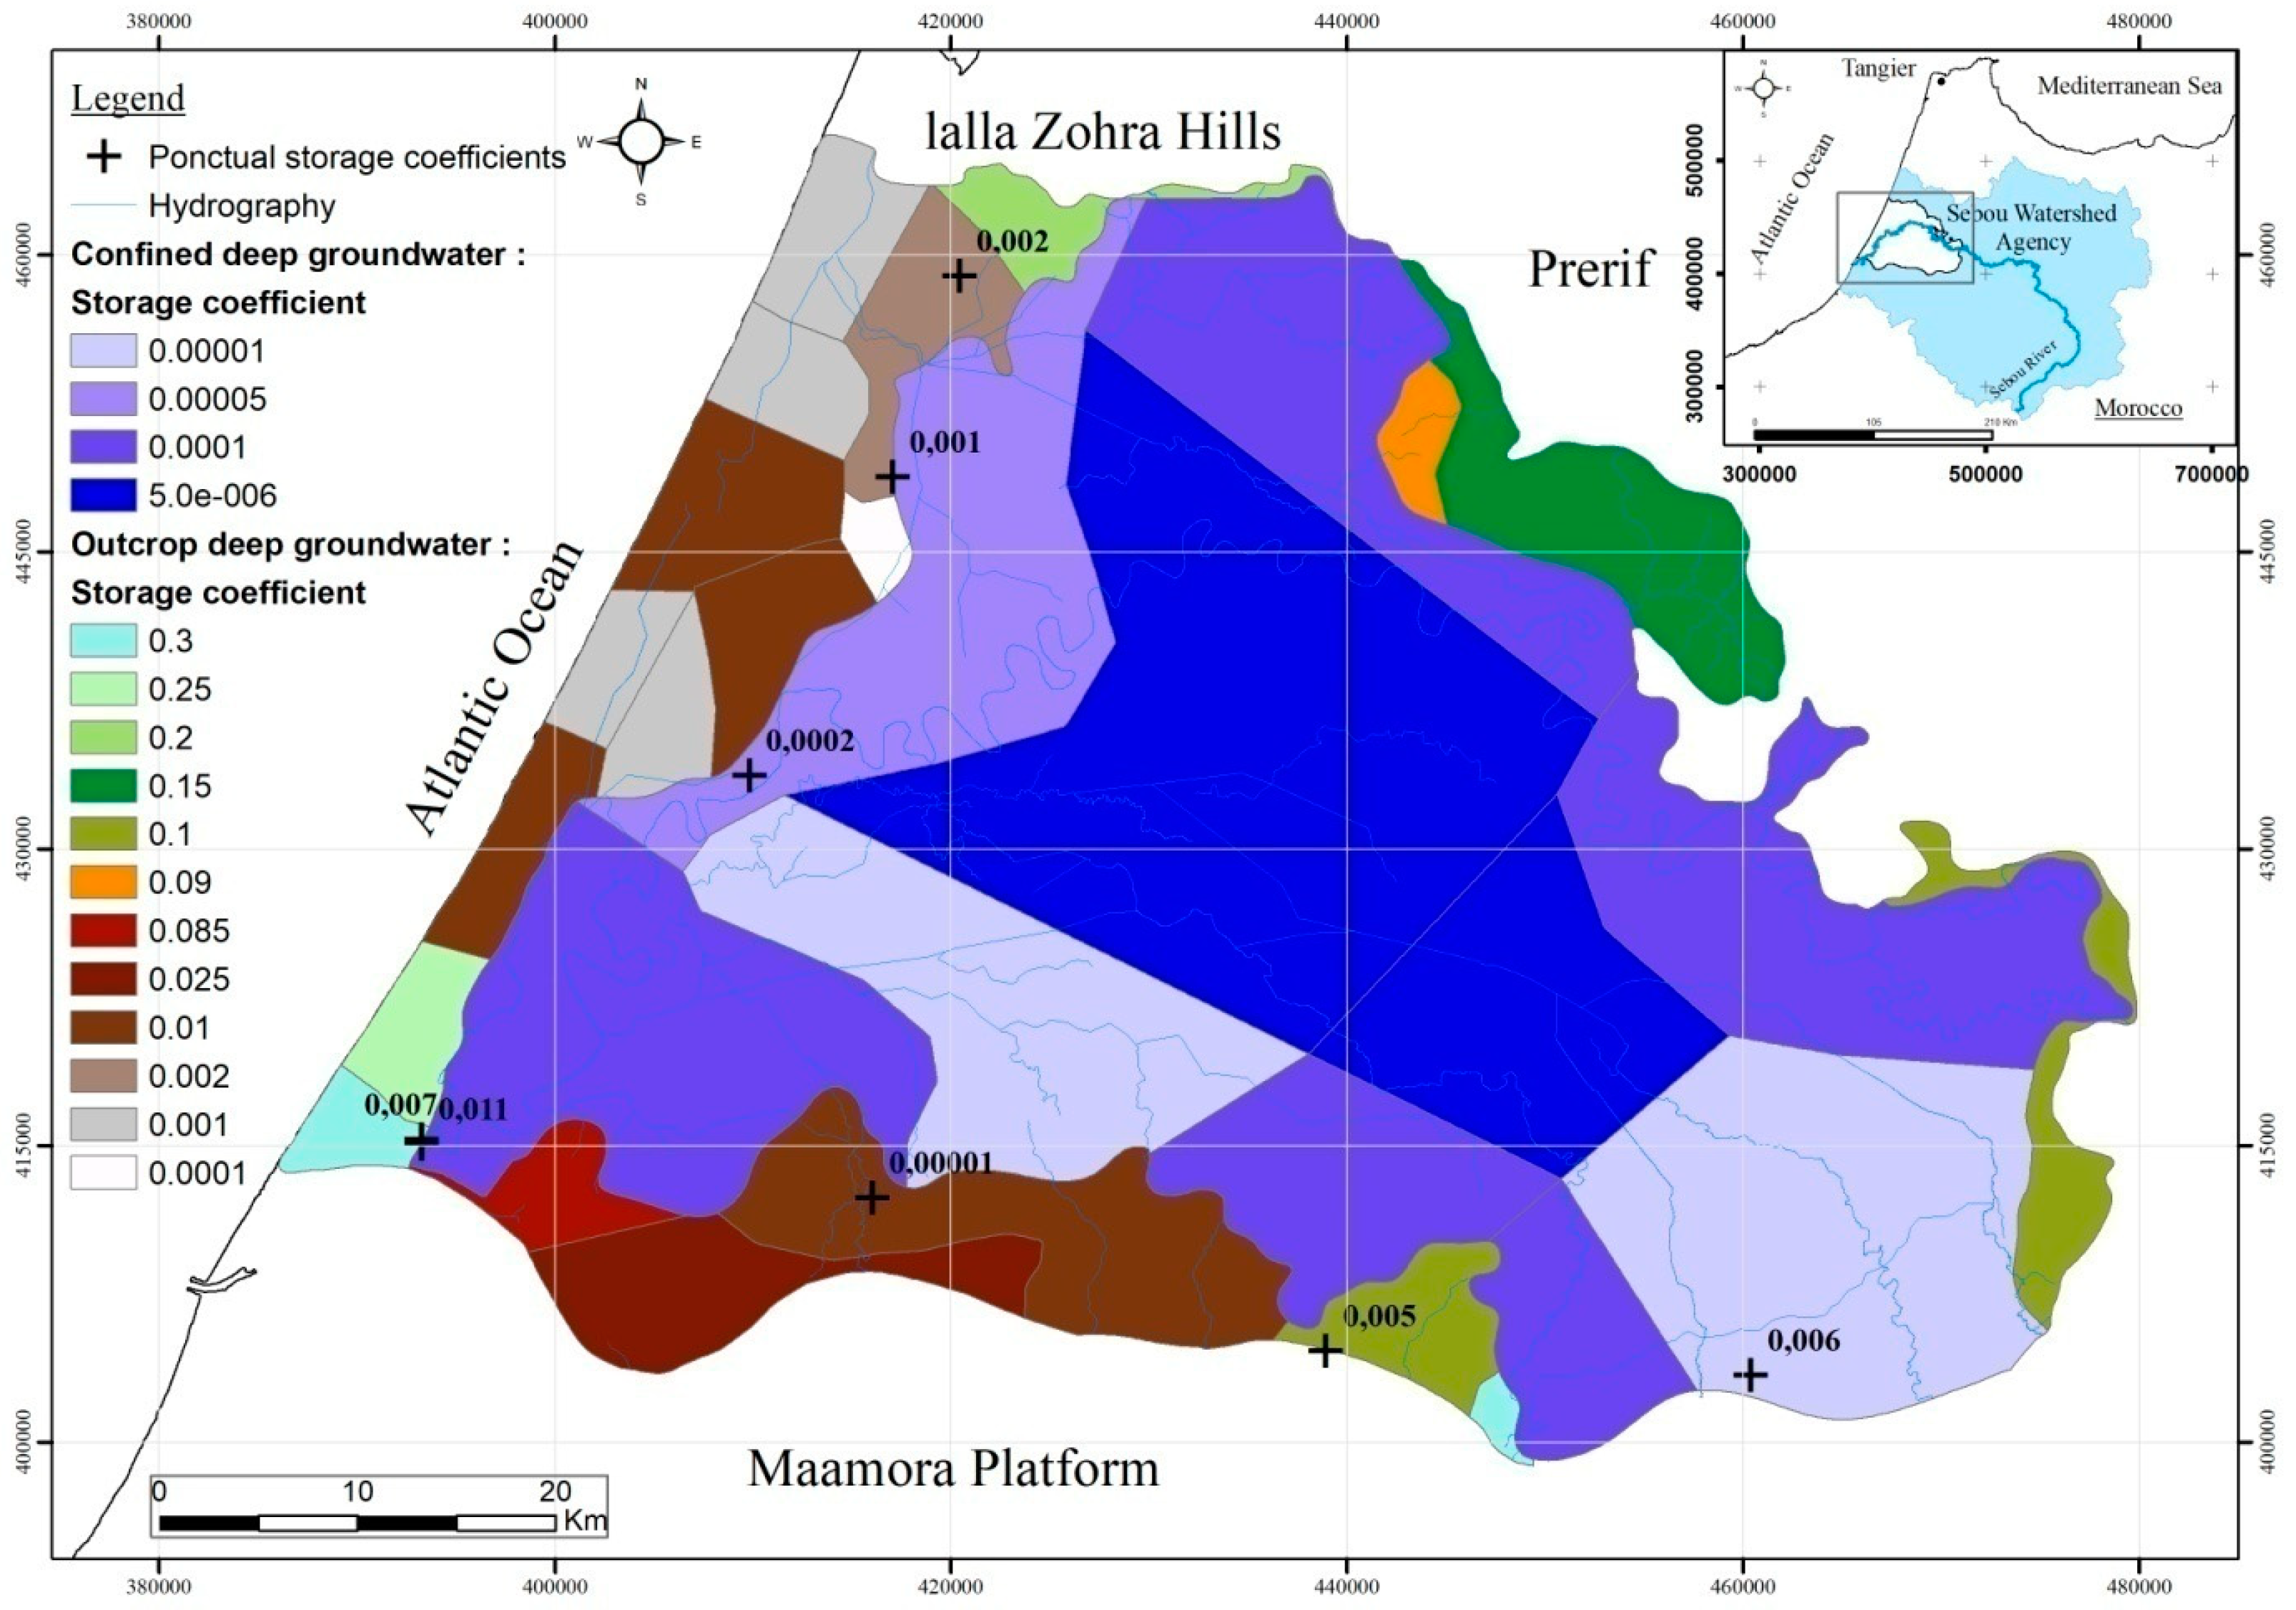
The pilot piezometers are selected based on their positions, which enable them to record piezometric fluctuations in rapid response to changes in recharge/pumping volumes (zones of outcrop in the West and South of the plioquaternary aquifer). The storativity coefficients range from 0.01 to 0.3 along the coastal zone, which is influenced by the marine environment, where Quaternary formations are predominantly sandy. They range from 0.01 to 0.2 along the southern zone near the contact with the Maamora aquifer, an area influenced by continental factors, where formations are predominantly gravelly-sandy. In the outcrop areas of the Southeast and Northeast Plio-Villafranchian basin, where formations consist of coarse materials (pebbles, gravel, etc.), the coefficients range from 0.1 to 0.35.
Sometimes, lithological sequences of the plioquaternary aquifer contain, in certain localities, compact clayey and marly layers ranging in thickness from 1 to 2 meters, which act as impermeable screens (
Appendix B). These clayey stratum put pressure on the waters of the so-called free part of the deep aquifer and reduce the proportion of gravitational waters, resulting in storage coefficients ranging between 0.001 and 0.002, values relatively lower than the standards known for free aquifers.
The storage coefficients range from 5. 10
-6 to 1. 10
-5 in the central zone of the basin, where the deep aquifer is confined due to the impermeable formations of the Amerian and the Soltanian (
Figure 10).
3.2.2. Water Balances
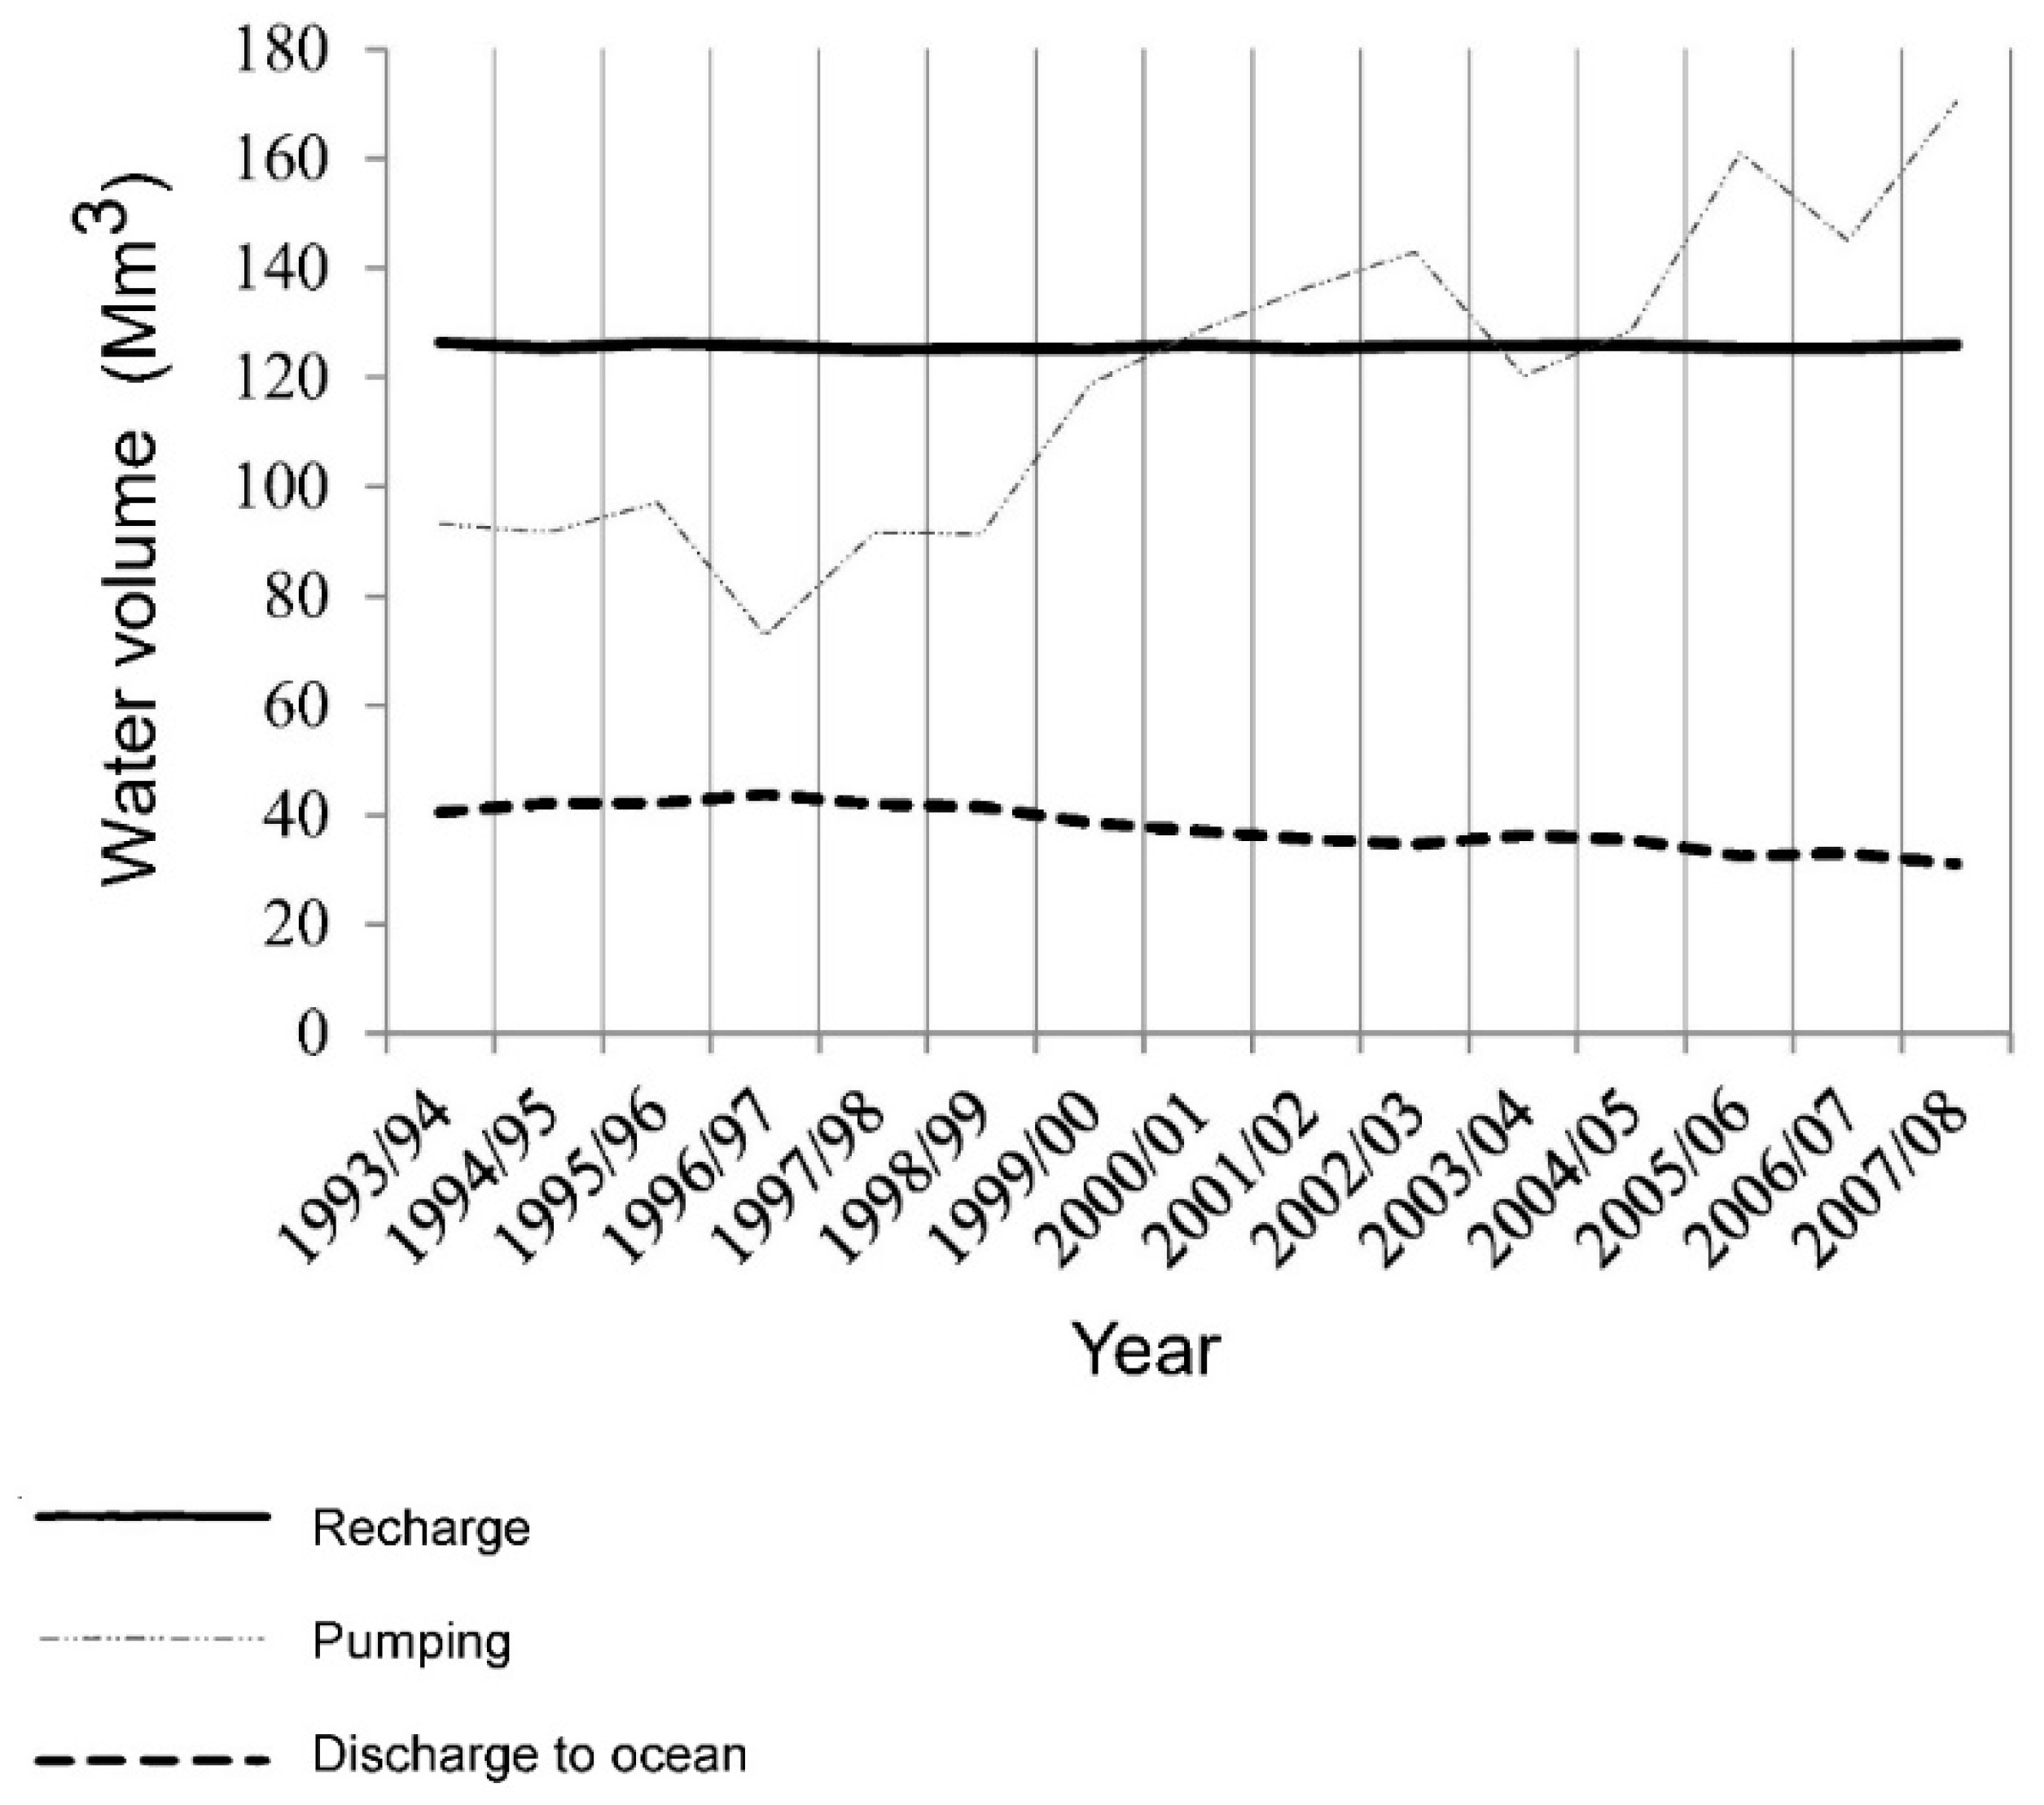
The calibration of the transient model allows for the development of 15 balances relative to the selected intervals. According to the analysis of the balances, the system becomes increasingly deficient, transitioning from -15.4 million m³/year in September 1993 to -36.6 million m³/year in September 2007 (
Table 3).
The volumes discharged to the ocean decrease over time, and the volumes drained by the hydrological network decrease in favor of infiltration (
Figure 11). This is due to the decline in piezometric levels, caused by withdrawals which increased from 93 million cubic meters per year in September 1993 to 170 million cubic meters per year in September 2007. It is noted in this regard that the probable decrease in future precipitation may amplify the effect of exploitation on groundwater reserves, to discuss a combined effect of climate change and overexploitation.
The representation of the evolution of recharge/discharge shows that the fluctuation changes pace from one curve to another (
Figure 11). During the study period, the two curves related to withdrawals and discharge exhibit significant variations compared to the rainfall curve. It is observed that despite rainfall remaining more or less constant over time, overexploitation of deep waters leads to a decrease in volumes discharged to the ocean. This indicates that, despite the volumes of rainfall received by the basin during the study period, it is primarily the pumping of freshwater from the deep aquifer that plays the most impactful role on the Rharb aquifer system.
4. Hydrodispersive Model
4.1. Methodology and Tools
To replicate the history of the saltwater wedge advancement in the plioquaternary aquifer, the MT3DMS module is utilized to study the dispersion of chemical solutes in both aquifer layers of the aquifer system, according to the finite-difference method [
17] (Eq. (4)), while the SAEWAT module is employed to investigate the inland advancement of the freshwater-saltwater interface.
With Ck: dissolved concentration of species k [ML-3], θ: porosity of the subsurface medium [-], t: time [T], xi: distance along the respective Cartesian coordinate axis [L], Dij: hydrodynamic dispersion coefficient tensor [L2T-1]; vi: seepage or linear pore water velocity [LT-1], qs: volumetric flow rate per unit volume of aquifer representing fluid, Csk: concentration of the source or sink flux for species k [ML-3], ΣRn : chemical reaction term [ML-3T-1].
SEAWAT is a 3D groundwater flow modeling application for variable-density flow coupled with multi-species solute transport. SEAWAT builds upon the MODFLOW and MT3DMS interfaces and utilizes them for boundary condition setting and post-processing. At the boundary conditions, SEAWAT integrates flow equations, mass conservation and solute transport equation.
4.1.1. Input for the Hydrodispersive Model
The input data for the hydrodispersive model consists of those from the hydrodynamic model along with data related to water chemistry [
20].
Table 4.
Inventory of hydrodispersif model data of the Rharb basin.
Table 4.
Inventory of hydrodispersif model data of the Rharb basin.
| Data |
Description |
| Geometry |
Stratigraphic trilayer model. |
| Hydrogeological parameters |
Hydraulic conductivities, Porosity, Dispersivity, etc. |
| External stresses and initial conditions |
Initial water concentrations : rain, groundwater, etc. |
| Boundary conditions |
Imposed volumic concentration of the nappe-ocean boundary. |
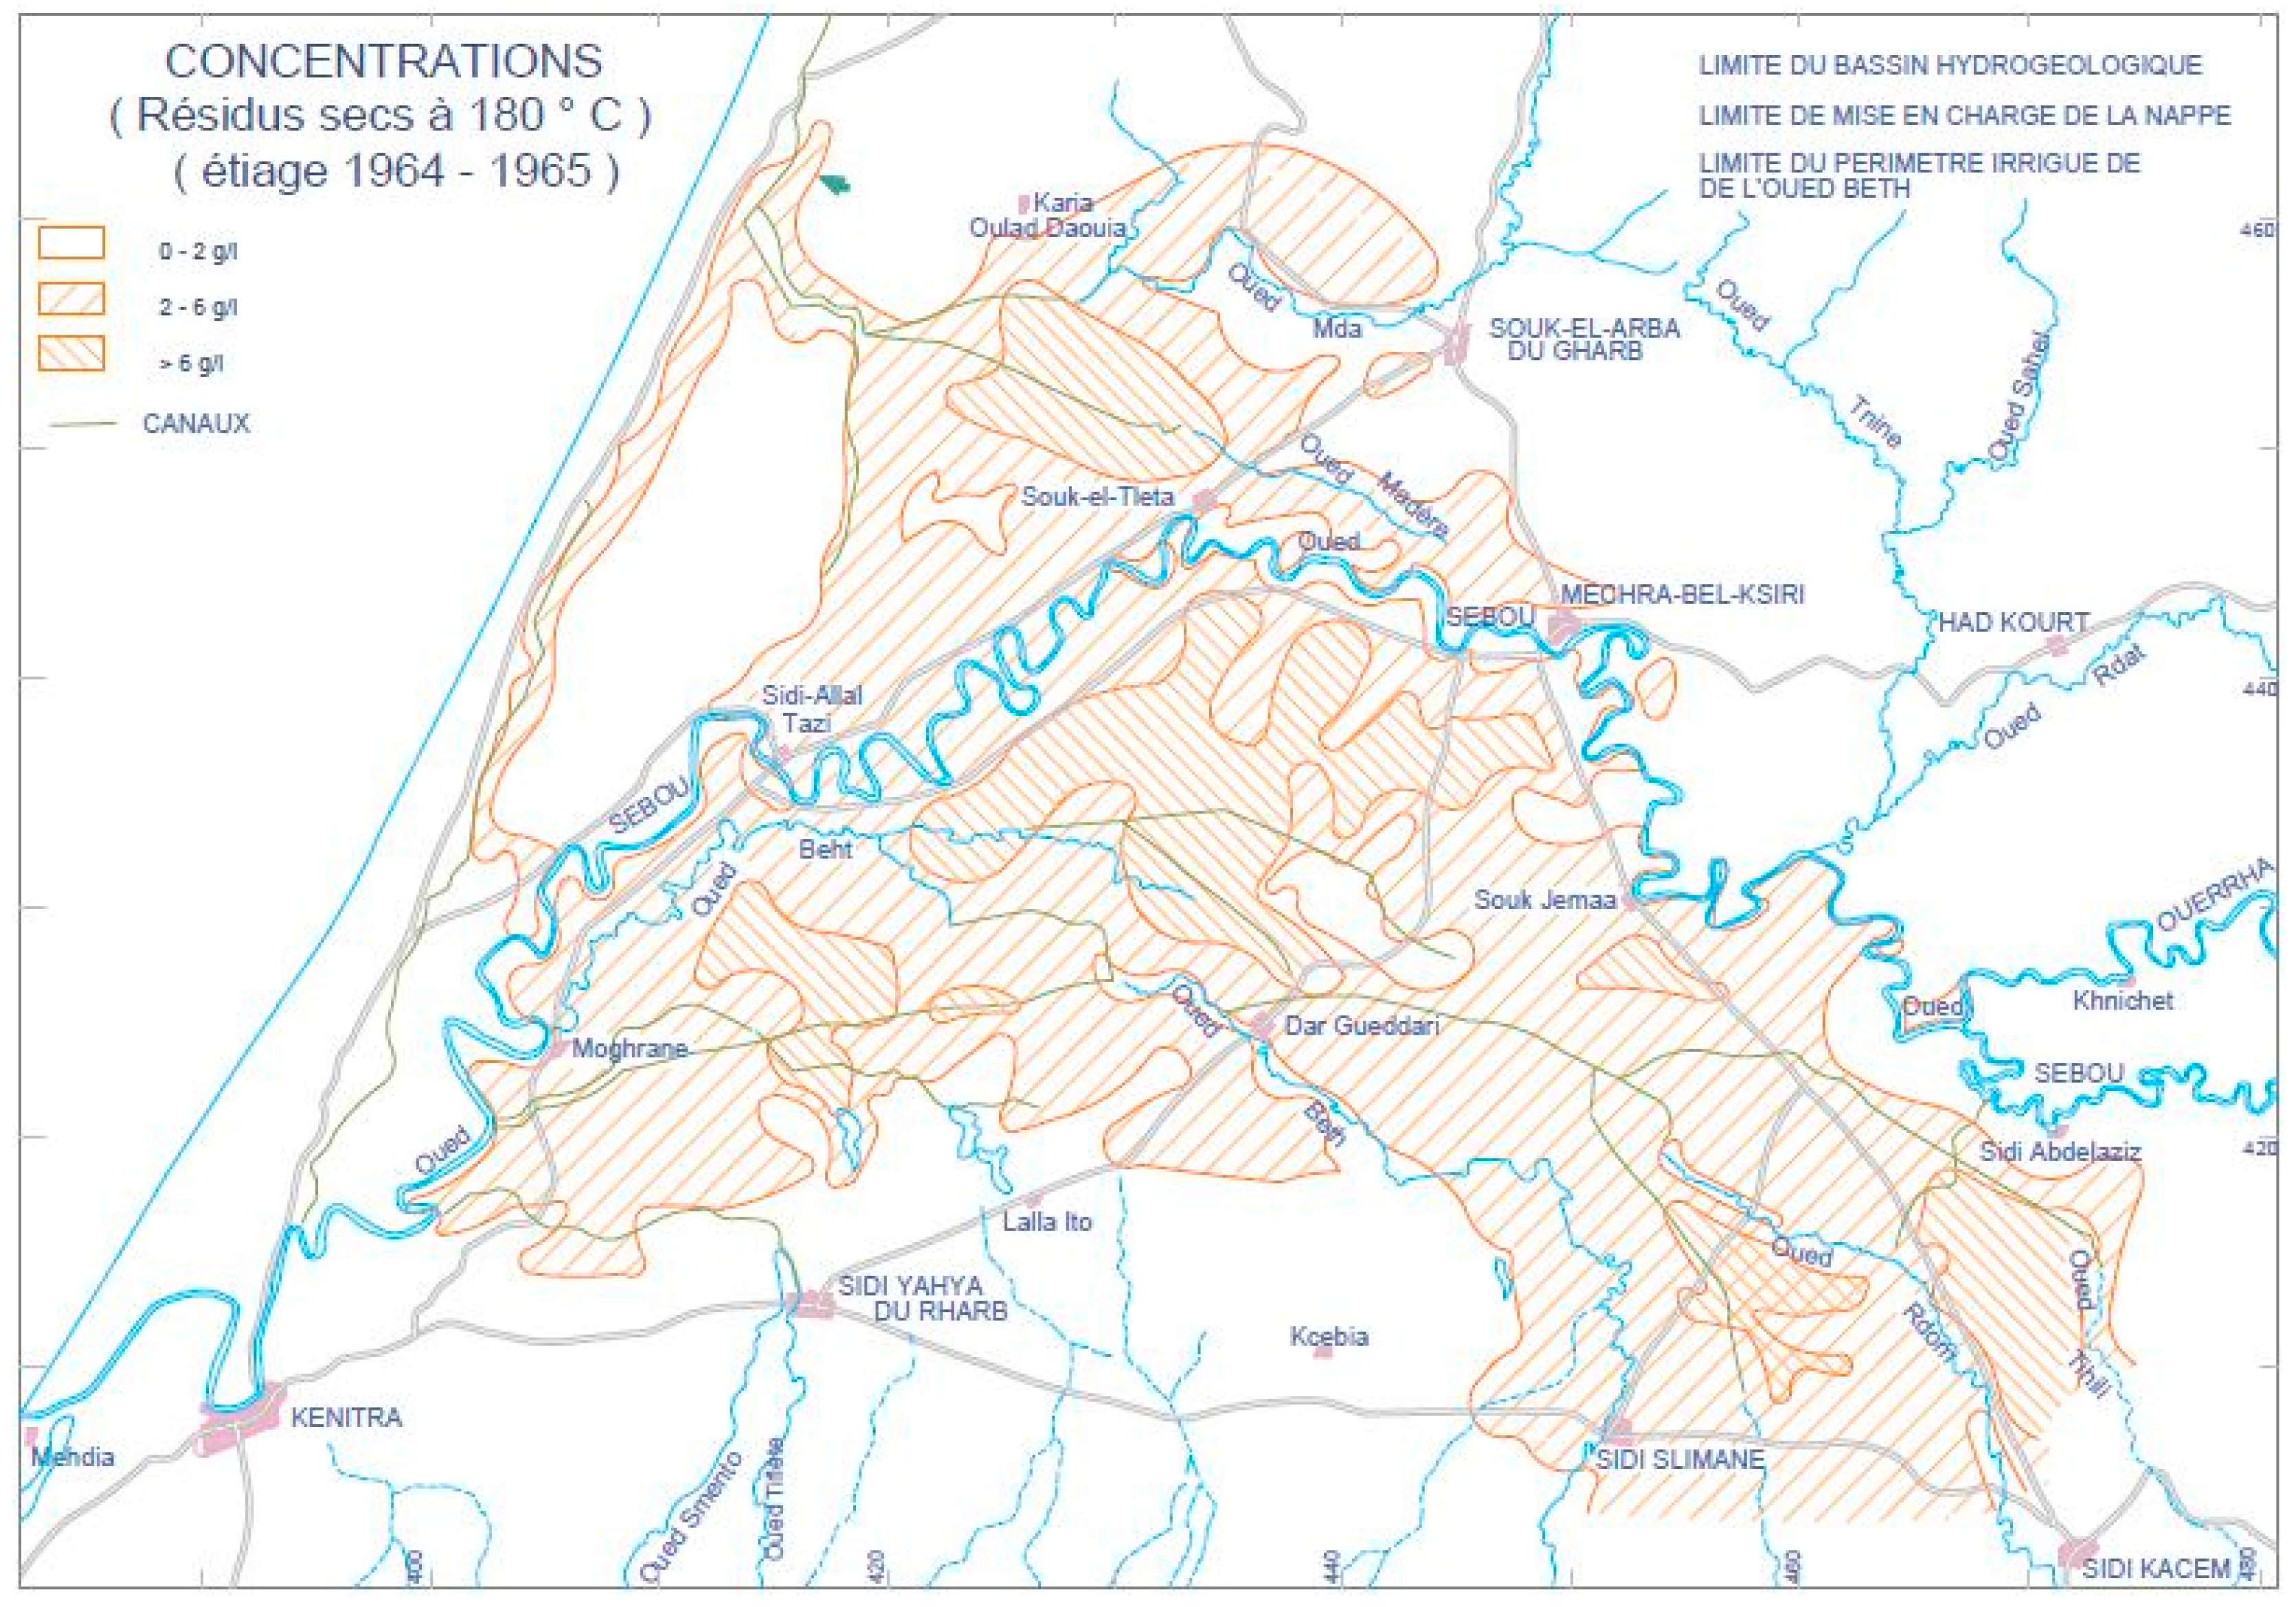
The initial average porosities assigned to the three layers of the model are 0.4 to 0.45 for the upper aquifer, 0.35 to 0.45 for the aquitard, and 0.2 for the lower aquifer. The longitudinal dispersivity is approximately 20 meters for all cells of the model. The groundwater concentration map of the Rharb basin established for the low-water period of 1964/1965 serves as the reference state (
Figure 12). The dry residue at 180°C is approximately 0.7 g/l for the Plioquaternary aquifer and ranges from 1 to over 6 g/l for the phreatic aquifer.
The concentrations of rainwater range from 0.1 to 0.2 g/l and are assigned to recharge zones based on the conceptual model, except where cell-by-cell correction is necessary. The Advection, Dispersion, Sources/Sink Mixing, and Transport Observation packages are used when selecting MT3DMS packages. They facilitate the handling of solute propagation in the aquifer system, thereby adhering to the principles of hydrodispersive modeling and studying solute propagation.
Under SEAWAT, the inputs of the VDF package enable control over density calculations.
Table 5.
Commonly used values for the Variable Density Flow package (Langevin et al. 2007).
Table 5.
Commonly used values for the Variable Density Flow package (Langevin et al. 2007).
| Variable |
Reference Value |
Slope |
| Density |
1,000 kg/m3 |
n/a |
| Salt Concentration |
0 mg/L |
0.714 |
| Temperature |
25 oC |
-0.375 kg/m3 / oC |
| Pressure Head |
0 m |
4.46x10⁻³ kg/m4
|
Given that the concentration of seawater is 35.7 g/l compared to a reference concentration of 0 g/l, and its density is 1025 kg/m³ compared to a reference density of 1000 kg/m³, the DRHODC ratio is expressed as:
The coastline serves as a boundary condition of the imposed potential type. In the context above, this boundary condition sets a constant hydraulic head at 0 meters, representing the natural condition of the groundwater base level. This boundary is considered during hydrodynamic calculations as a quantitative condition. At this stage, a value of 35.7 g/l is assigned to this boundary for qualitative characterization.
4.1.2. Simulation Period and Boundary Conditions
The simulation period and intervals are the same as those for the transient hydrodynamic model, i.e., 15 simulations corresponding to the 15 time intervals, each spanning one year (from September 22, 1992, to September 22, 2007).
4.2. Results and Discussion
4.2.1. Mass Transport Model (MT3DMS)
The concentrations of the phreatic waters did not show remarkable changes between 1992/93 and 2006/07 because the geography of the iso-zones remained practically the same. However, the concentrations of waters evolved in certain areas at the level of the aquitard and the Plioquaternary aquifer.
The quality of phreatic waters deteriorates from the peripheries towards the center of the upper Quaternary aquifer (
Figure 13. (a)), with concentrations ranging from 2 to over 6 g/l. This is attributed to the poor lateral movement of solutes in the sediments of the upper Quaternary. The concentrations of water in the aquitard show an increase during the study period (
Figure 13. (b)). The impermeable aquitard acts as an obstacle that blocks the propagation of solutes towards the deep aquifer. The concentration of deep waters is less than 0.4 g/l in the peripheries of the basin, especially in the Mnasra area, thanks to the natural replenishment of waters during rainy events. This concentration increases from 0.7 g/l (reference value) to 2 g/l in some localities at the center of the basin due to exchanges with mediocre phreatic waters where the aquitard is locally absent (
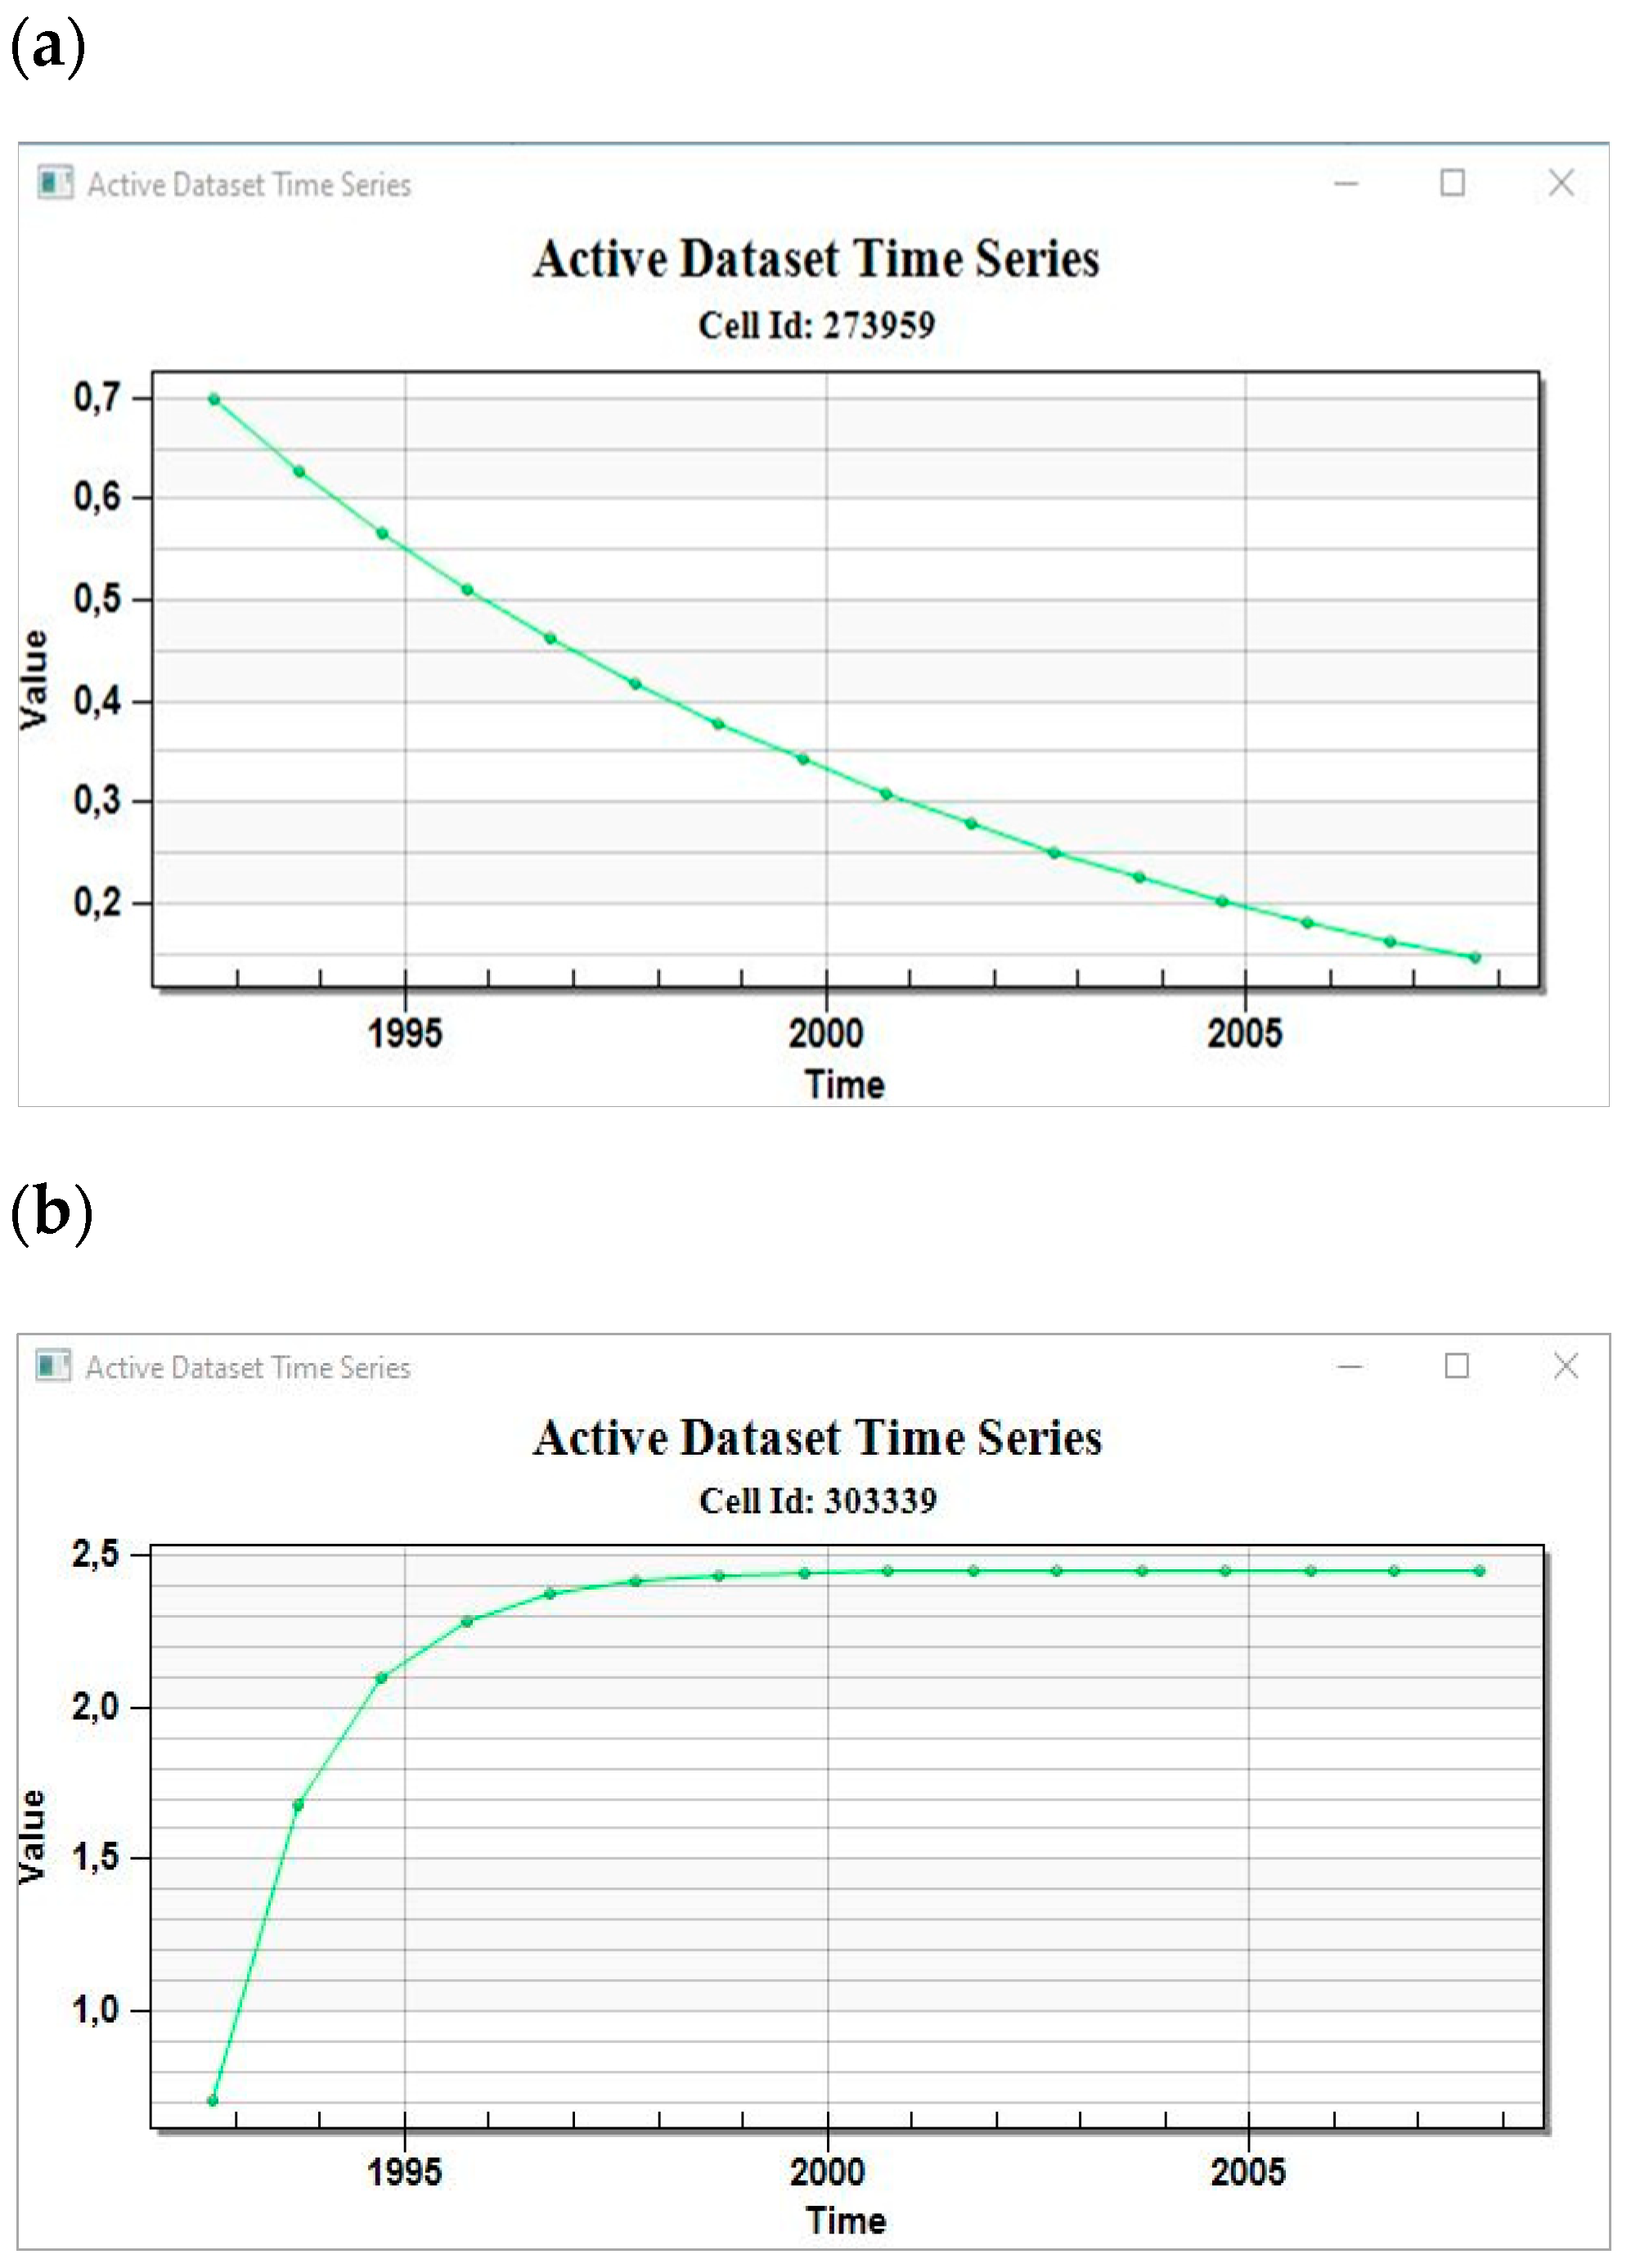
Figure 13. (c)). The curve showing the evolution of salt concentration in the deep aquifer at the outcrops of the plioquaternary aquifer (
Figure 14. (a)) records a decrease, from 0.7 g/l (the initial value assigned to the waters of this aquifer) to 0.35 g/l. This implies that over the years, groundwater tends to reach a chemical equilibrium with values close to those of rainwater, hence the softest waters of the deep aquifer are found near recharge zones. Confined waters may register concentration values of up to 2 g/l in some areas (
Figure 14. (b)) due to exchange by drainage with underlying wet environments.
4.2.2. Variable Density Model (SEAWAT)
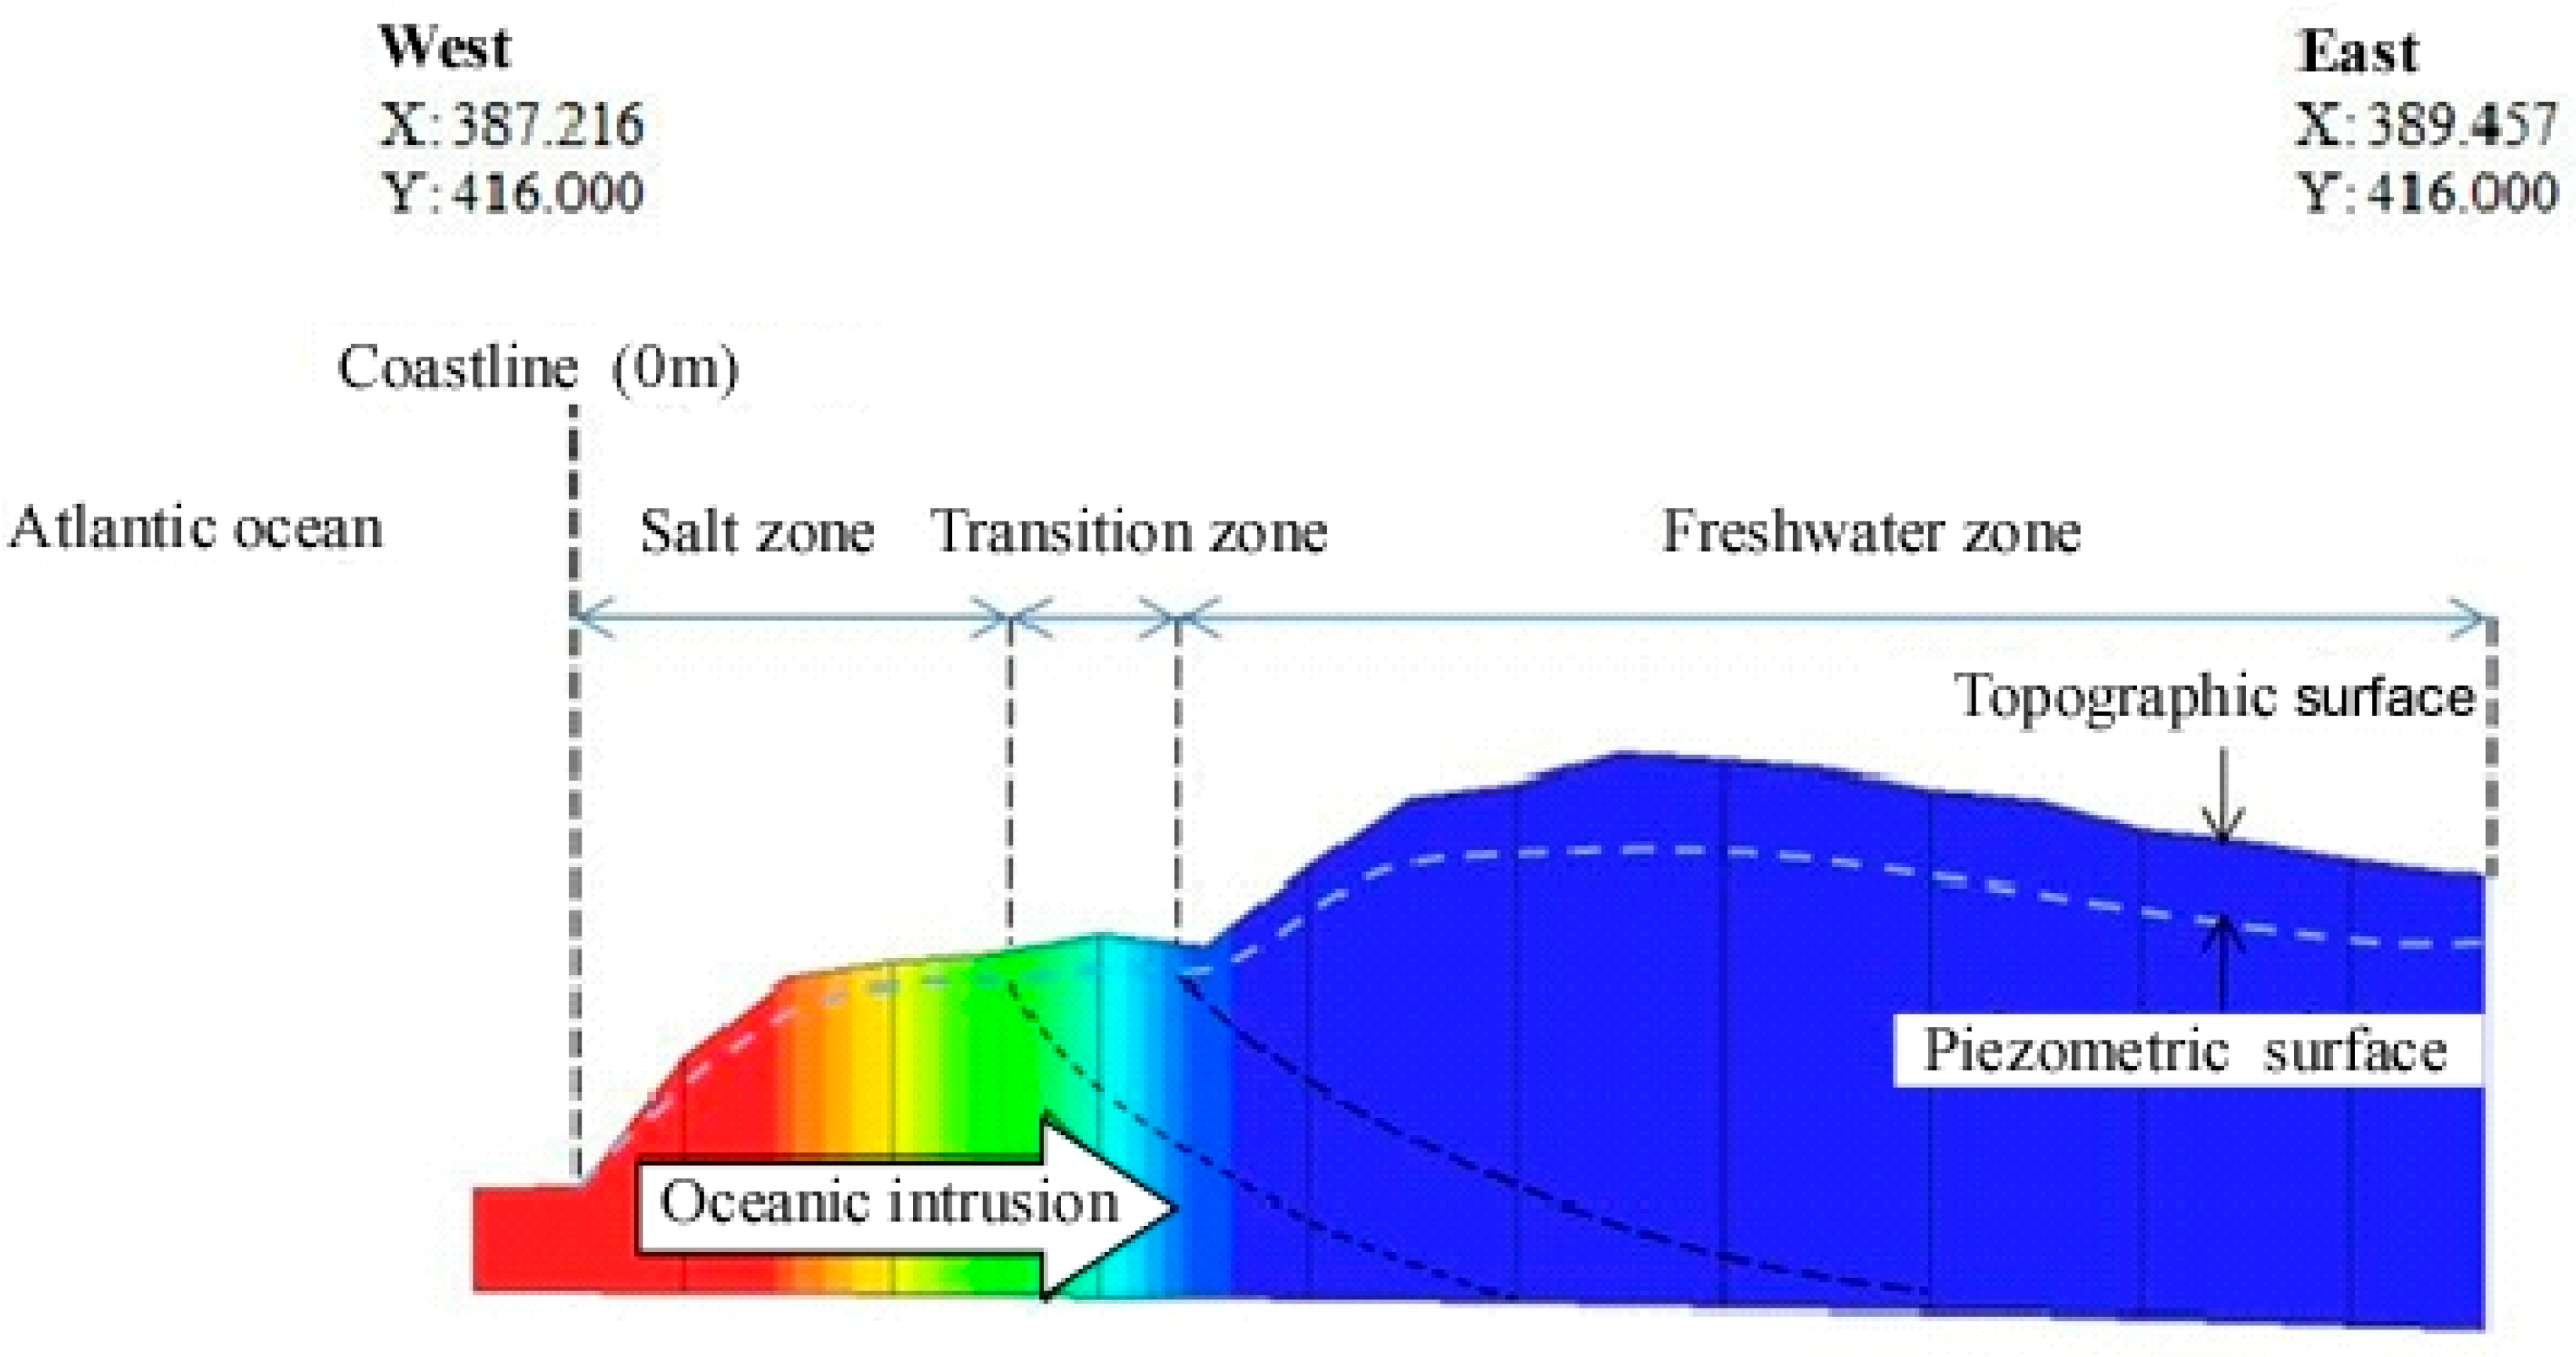
The iso-concentration curves of the water are parallel to the coastline, responding to the advance of oceanic waters due to the lowering of the piezometric level of the Plioquaternary aquifer and the resulting loss of head. The level of contamination of the aquifer by oceanic waters is not the same along the coastal boundary of the basin. In the south at latitude 416.000 m, oceanic waters penetrate more than 500 meters into the aquifer, with a transition zone of 250 meters (total of 750 meters) (
Figure 15). However, in the north, this interface is close to the shore with an average transition zone of 200 meters.
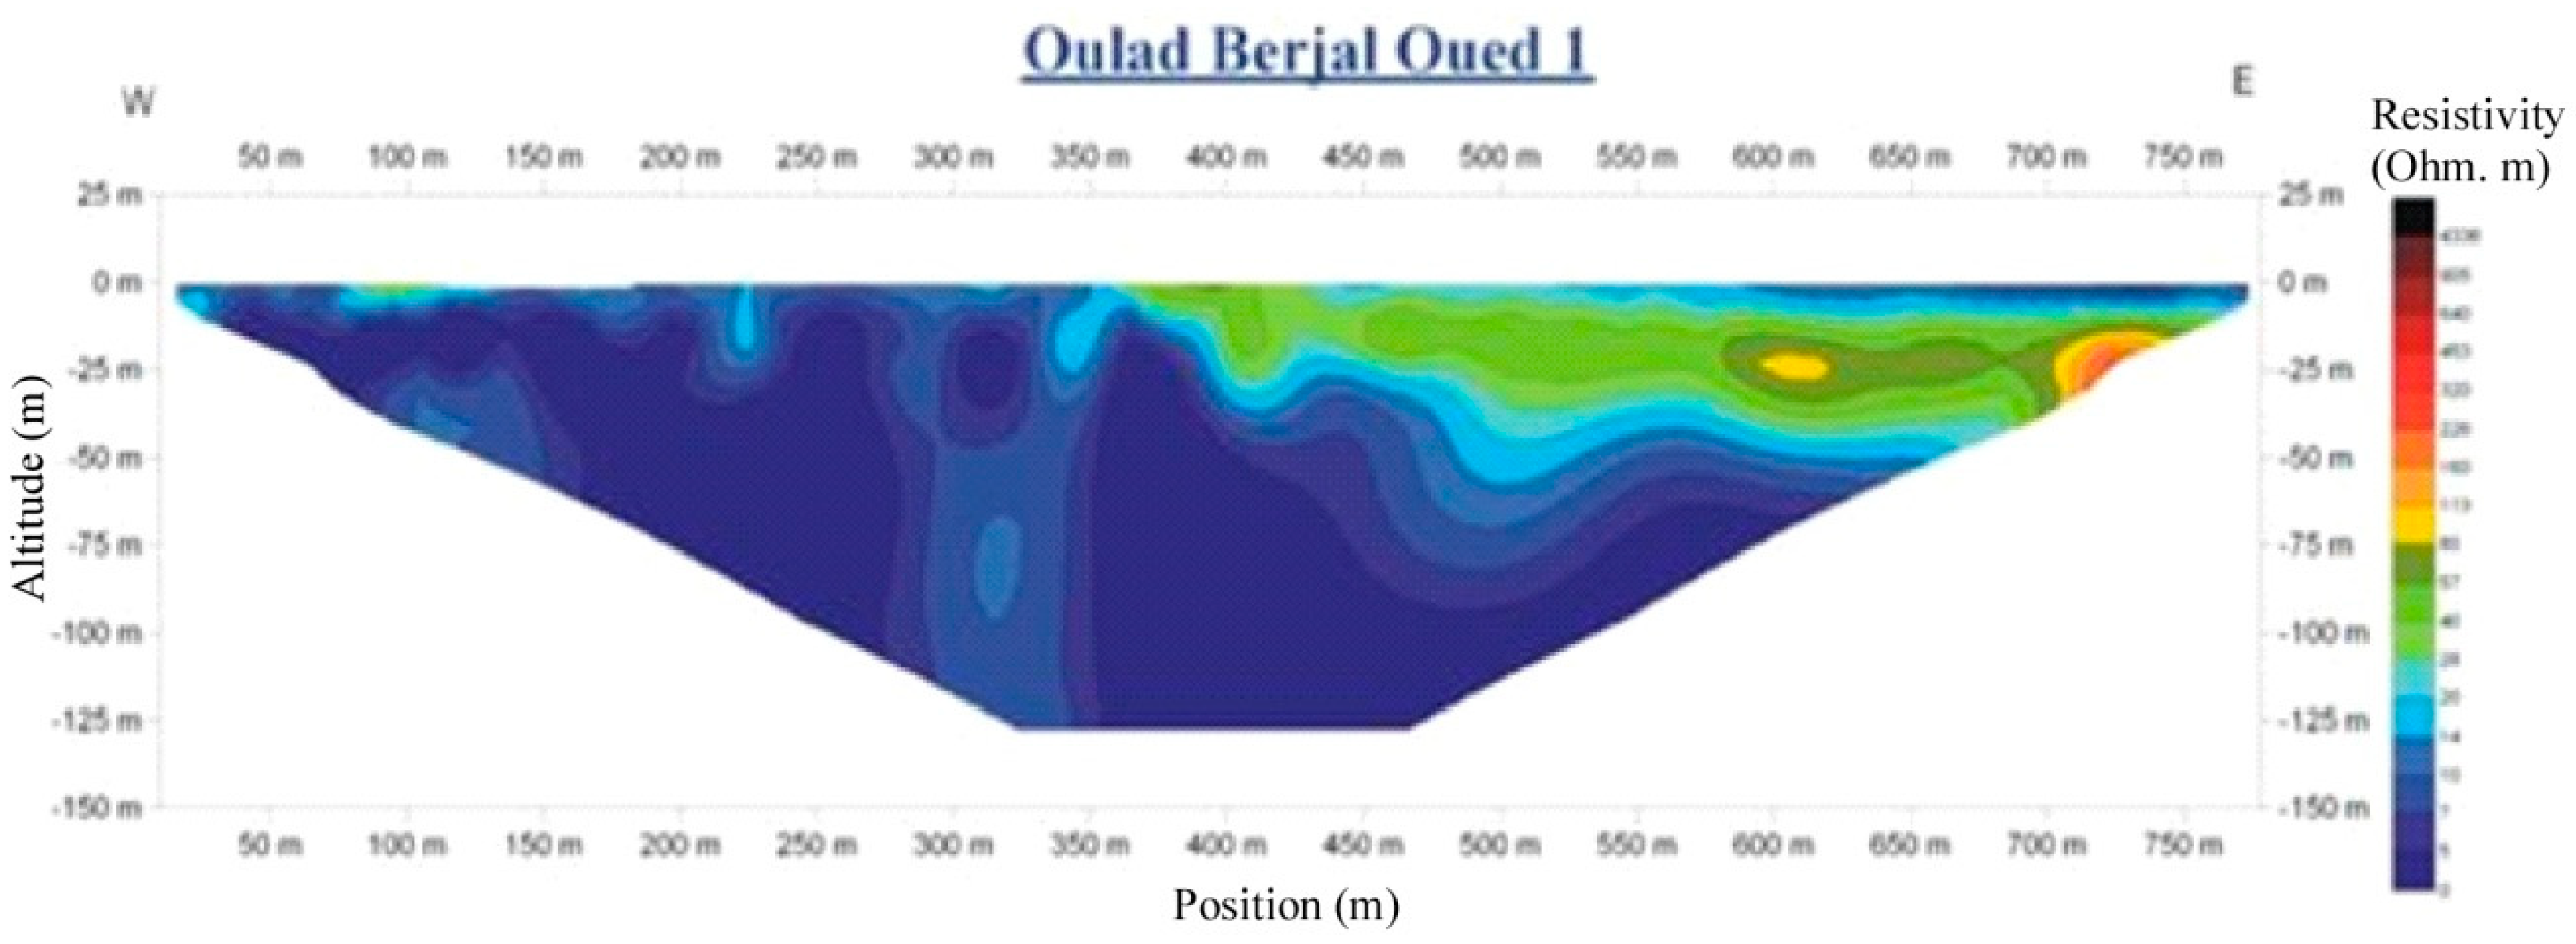
The cross-sectional tomographic profile perpendicular to the coastline at the location ’Ouled Berjal Oued 1’, southwest of the basin (West : X 386.428, Y 414.343, Z 3 (m). East : X 387165, Y 414187, Z 34 (m)), reveals saline waters extending over 350 meters from the shoreline, with electrical resistivities below 10 Ω.m. Between 350 and 500 meters, freshwaters from the Plioquaternary aquifer appear on the profile, giving way subsequently to the mediocre waters of the phreatic aquifer beyond 500 meters from the shoreline (
Figure 16).
4.2.3. Limitation of the Hydrodispersive Model: ‘’The Representation of the Displacement of the Sea Wedge’’
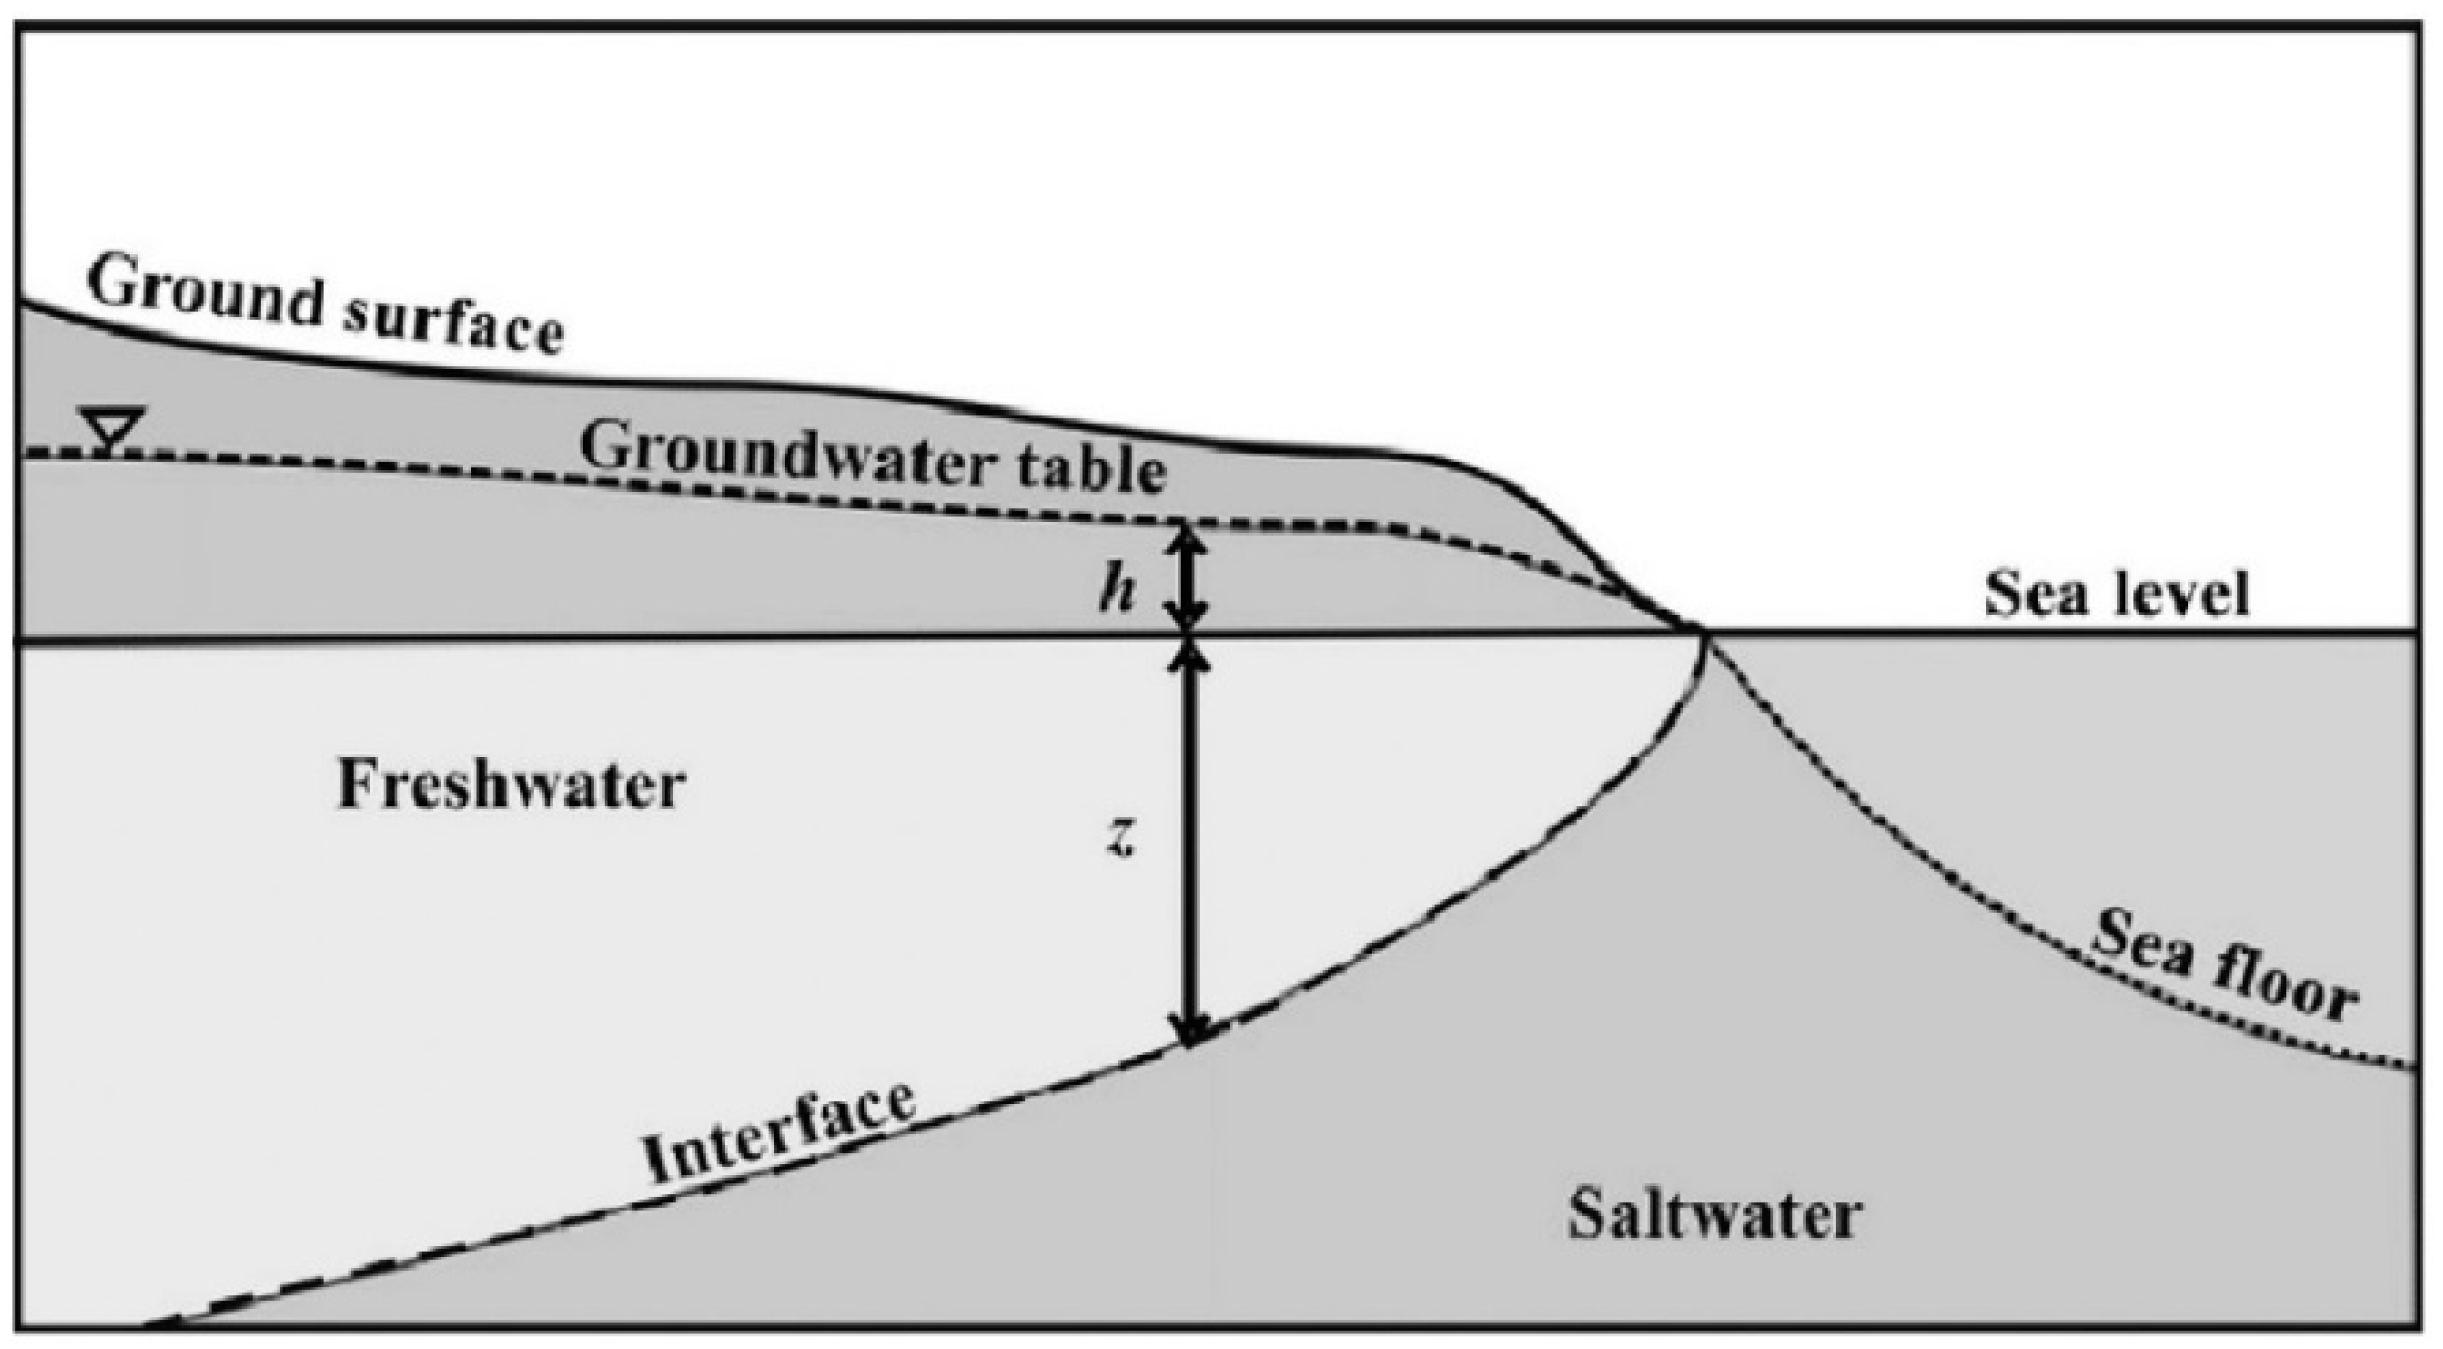
The geometry of the freshwater-saltwater interface along the coastal zone is not vertical as theoretically indicated in the model, but rather inclined from top to bottom toward the onshore direction (
Figure 17).
The model calculates the movement of the saltwater wedge towards the continent, cell by cell (
Figure 15). Each cell maintains the same concentration throughout its entirety (35.7 g/l) just a few meters from the oceanic boundary where saltwater reaches the water table surface. Once the water at the water-table surface becomes fresh, the application of the Ghyben-Herzberg principle (Eq. (6)) becomes the sole means to locate the depth of the freshwater-saltwater interface. SEAWAT provides the location perpendicular to the ocean coastline of this interface, and it’s up to the user to calculate the depth.
With Z: depth of the freshwater-saltwater interface relative to sea level (m), h : piezometric height (m).
5. Conclusion
This study, focusing on the Rharb basin, a region situated within a semi-arid environment, enables the development of a transient hydrodynamic model and a hydrodispersive model using the MODFLOW, MT3DMS, and SEAWAT computational codes. The development of a hydrodynamic model in transient regime, by adjusting the storage coefficients for the period September 1992/ September 2007, reveals a declining water situation marked by increasingly deficit balances, due to irrigation pumpings. The justification of the results through calibration and correlation with the monitoring wells allows for the attribution of a zoning of storage coefficients on the basin scale, ranging from 5.10-6 to 1.10-4 in the deep confined zone and from 1.10-3 to 3,5 .10-1 in the free zones. The development of the hydrodispersive model allows for tracking the spatial distribution of salt concentrations during the same period, taking into account various hydrogeological parameters and the initial concentrations assigned to different layers of the model. The quality of groundwater is poor over the 15 study intervals, with concentrations ranging from 2 to 6 g/l, and the distribution of iso-concentrations has not evolved over time due to poor water circulation in the upper Quaternary aquifer. In the Plioquaternary aquifer, the water quality is generally good (ranging from 0.4 to 2 g/l). In recharge zones, the concentrations of deep groundwater do not exceed 0.4 g/l thanks to water renewal during rainy episodes, while locally in the center of the basin, these values can reach 2 g/l due to exchanges with overlying environments.
The aquiclude acts as a barrier to the chemical contamination of the deep aquifer waters, thanks to the properties of the lower Quaternary clays that slow down the propagation of dissolved elements. The development of the hydrodispersive model also allows for locating the freshwater-saltwater interface in September 2007 at 500 meters from the oceanic shoreline, with a transition zone of 250 meters thickness to the southwest of the basin. This interface gradually approaches the shoreline in a northward direction. Modeling work over a geographical extent of 4000 km2 represents a significant challenge, aimed at providing for the first time a multilayer model of the entire Rharb basin. This model takes into account not only the interaction between the aquifer system of the Rharb and the external environment but also the interaction between the deep aquifer, the aquitard, and the shallow aquifer. Nevertheless, it is recommended to use this work as a preliminary guidance for pumping tests to ensure greater accuracy and provide new data, which in turn can enrich such modeling efforts. In summary, this research highlights the crucial importance of understanding the hydrogeological mechanisms at work in the coastal basin of Rharb. It underscores the need to develop tools and numerical models for sustainable management of groundwater resources, prevent the harmful consequences of overexploitation and ensure a balanced and responsible use of these precious resources for future generations, thus contributing to environmental sustainability.
Author Contributions
Conceptualization: Mohamed Abdelbaset Hessane, Samir Hakimi; In-field work: Samir Hakimi.; Methodology: Samir Hakimi; Software: Samir Hakimi., Formal analysis: Mohammed Bahir, Turki Kh. Faraj; Data interpretation: Mohammed Bahir, Turki Kh. Faraj; Writing—original draft preparation: Samir Hakimi; Writing—review and editing: Samir Hakimi, Mohammed Bahir; Supervision: Mohamed Abdelbaset Hessane, Mohammed Bahir.
Funding
This research was funded by the Researchers Supporting Project at King Saud University, Riyadh, Saudi Arabia, for funding this research project (Fund no. RSP2025R487).
Data Availability Statement
Data are include in the manuscript.
Acknowledgements
The authors would like to thanks the anonymous reviewers, and editors, and to express their sincere gratitude to the Laboratory of “Geodynamics and Natural Resources,” Reception Structure, Faculty of Sciences Dhar Mahraz, Fez, for its assistance through the provision of equipment useful for the work. We also wish to thank the staff of the Directorate of Water Research and Development, Rabat, for their collaboration; the staff of the Water Management and Planning Department at the Sebou Water Basin Agency, Fez, for their support through the provision of available data useful for the work; and the staff of the Western Regional Directorate, “National Office of Electricity and Drinking Water/Water Branch,” Kenitra, for providing relevant data essential to the work.
Conflicts of Interest
The authors declare no conflicts of interest
Appendix A
Storage coefficients (S) of the Plioquaternary aquifer, Rharb basin.
| IRE |
X (m) |
Y (m) |
S |
| 1521 |
417025 |
448800 |
0.001 |
| 1541 |
420400 |
458950 |
0.002 |
| 1716 |
438900 |
404600 |
0.005 |
| 1819 |
409800 |
433700 |
0.0002 |
| 3312 |
460350 |
403350 |
0.006 |
| 3415 |
393270 |
415270 |
0.007 |
| 3416 |
393242 |
415040 |
0.11 |
Appendix B
Lithostratigraphic column from borehole 253/8 (UQ: Upper Quaternary, PQ: Pliquaternary).
| From |
To (m) |
Lithology |
Stratigraphy |
Z (m) |
| 0 |
3 |
Topsoil |
UQ |
5.32 |
| 3 |
9 |
Yellow clayey sand |
PQ |
2.32 |
| 9 |
11 |
Compact clay |
PQ |
-3.68 |
| 11 |
24 |
Yellow sandy clay |
PQ |
-5.68 |
| 24 |
30 |
Yellow clayey sand |
PQ |
-18.68 |
| 30 |
33 |
Sandstone and Yellow Sand |
PQ |
-24.68 |
| 33 |
35 |
Sandy clay |
PQ |
-27.68 |
| 35 |
43 |
Sandstone and Yellow Sand |
PQ |
-29.68 |
| 43 |
45 |
Red sandy clay |
PQ |
-37.68 |
| 45 |
46 |
Compact marl |
PQ |
-39.68 |
| 46 |
54 |
Clay |
PQ |
-40.68 |
| 54 |
61 |
Sandstone and Sand |
PQ |
-48.68 |
| 61 |
73 |
Red Clay and Sand |
PQ |
-55.68 |
| 73 |
76 |
Clay |
PQ |
-67.68 |
| 76 |
81 |
Clay and Sand |
PQ |
-70.68 |
| 81 |
84 |
Yellow clay |
PQ |
-75.68 |
| 84 |
88 |
Yellow sandstone |
PQ |
-78.68 |
| 88 |
94 |
Clay |
PQ |
-82.68 |
| 94 |
118 |
Yellow Sands and Sandstone |
PQ |
-88.68 |
| 118 |
127 |
Red sand |
PQ |
-112.68 |
| 127 |
151 |
Sandstone, Yellow Clay and Sand |
PQ |
-121.68 |
| 151 |
153 |
Compact marl |
PQ |
-145.68 |
| 153 |
164 |
Sandstone and Sand |
PQ |
-147.68 |
| |
|
- |
- |
-158.68 |
References
- ABHS, 2011. Etude d’actualisation du plan directeur d’aménagement intégré des ressources en eau du bassin hydraulique de Sebou. Agence du Bassin Hydraulique de Sebou: Fès, Morocco, p. 103.
- Ormvag, O.R., 1996. Étude pédologique au 1/20 000 de la troisième tranche d’irrigation (TTI). Zone centrale et Zone sud. Office Régional de Mise en Valeur Agricole du Gharb: Kénitra, Morocco, Rapport inédit, 452 p.
- Hakimi, S.; Hessane, M.A.; Lyazidi, R. Elaboration of a steady-state hydrodynamic model: The case of the Gharb basin, Morocco. Comunic. Geol. 2020, 106, 11–27.
- Lyazidi, R.; Hessane, M.A.; Filali, J.M.; Bahir, M.; Ouhamdouch, S. Système d’aide à la décision pour la gestion de la ressource en eau en zones semi-arides - Cas de l’aquifère Gareb-Bouareg (Rif, Maroc). Comunic. Geol. 2017, 104, 43–52. https://www.lneg.pt/iedt/unidades/16/paginas/26/30/247.
- Flinch, J.F. Tectonic evolution of the Gibraltar Arc. Ph.D. Thesis, Rice University: Houston, TX, USA, 1993, p. 212.
- Zouhri, L.; Gorini, C.; Mania, J.; Deffontaines, B.; El, A.; Zerouali, H. Spatial distribution of resistivity in the hydro-geological systems, and identification of the catchment area in the Rharb basin, Morocco. Hydrol. Sci. J. 2004, 49, 3.
- Cirac, P., 1985. Le bassin sud rifain occidental au Néogène supérieur. Evolution de la dynamique sédimentaire et de la Paléographie au cours d’une phase de comblement. Thèse, Doct. d’État, Univ. Bordeaux: Bordeaux, France, p. 285.
- Toto, E.A.; El Miloudi, A.; El Basri, M.; Hafid, L.; Zouhri, L.; El Mouraouah, S.; Benammi, M.; El Mouraouah, A.; Iben-Brahim, A.; Birouk, A.; Kasmi, M. New geophysical and geological evidence for the present-day southernmost active deformational front of the Rif thrust and fold belt and the oceanic accretionary prism of Cadiz: the Dhar Doume Lalla Zahra fault, Northwestern Atlantic Coastal Morocco. Environ. Earth Sci. 2012, 67, 2411–2422.
- Tahayt, A.; Mourabit, T.; Rigo, A.; Feigl, K.L.; Fadil, A.; McClusky, S.; Reilinger, R.; Seroukh, M.; Ouazzani-Touhami, A.; BenSari, D.; Vernant, P. Mouvements actuels des blocs tectoniques dans l’arc Bético-Rifain à partir des mesures GPS entre 1999 et 2005. C.R. Geoscience 2008, 400–413.
- Koulali, A.; Ouazar, D.; Tahayt, A.; King, R.W.; Vernant, P.; Reilinger, R.E.; McClusky, S.; Mourabit, T.; Davila, J.M.; Amraoui, N. New GPS constraints on active deformation along the Africa-Iberia plate boundary. Earth Planet. Sci. Lett. 2011, 308, 1, 211–217. [CrossRef]
- Platt, J.P.; Whitehouse, M.J.; Kelley, S.P.; Carter, A.; Hollick, L. The ultimate arc: Differential displacement, oroclinal bending, and vertical axis rotation in the External Betic-Rif arc. Tectonics 2003, 22, 3.
- McDonald, M.G. A Modular Three-Dimensional Finite-Differences Ground-Water Flow Model. U.S. Geological Survey: Dallas, TX, USA, 1984.
- Wels, C.; Mackie, D.; Scibek, J. Guidelines for Groundwater Modelling to Assess Impacts of Proposed Natural Resource Development Activities. British Columbia Ministry of Environment: Victoria, British Columbia, Canada, 2012, p. 289.
- Tranouez, P. Contribution à la modélisation et à la prise en compte informatique de niveaux de descriptions multiples. Application aux écosystèmes aquatiques. Thèse de Doctorat, Univ. du Havre: Le Havre, France, 2005, p. 191.
- De Marsily, G. Cours d’Hydrogéologie. Université Pierre et Marie Curie: Paris, France, 2004, p. 226.
- Combe, M., 1969. Carte hydrogéologique de la plaine du Gharb au 1/100 000. Notes et Mémoires, Service Géologique du Maroc: Rabat, Morocco, p. 221 bis.
- Zheng, C.; Wang, P. MT3DMS: A Modular Three-Dimensional Multispecies Transport Model for Simulation of Advection, Dispersion, and Chemical Reactions of Contaminants in Groundwater Systems; Documentation and User’s Guide. U.S. Army Corps of Engineers: Washington, D.C., USA, 1999.
- Kili, M.; El Mansouri, B.; Taky, A.; Chao, J. Nouvelle approche d’estimation des prélèvements d’eau d’irrigation à partir des ressources souterraines : Cas de la nappe côtière du Gharb. Bull. Inst. Sci., Rabat, Sci. Terre 2006, 28, 31–39.
- Toto, E.A.; El Miloudi, A.; El Basri, M.; Hafid, L.; Zouhri, L.; El Mouraouah, S.; Benammi, M.; El Mouraouah, A.; Iben-Brahim, A.; Birouk, A.; Kasmi, M. New geophysical and geological evidence for the present-day southernmost active deformational front of the Rif thrust and fold belt and the oceanic accretionary prism of Cadiz: the Dhar Doume Lalla Zahra fault, Northwestern Atlantic Coastal Morocco. Environ. Earth Sci. 2012, 67, 2411–2422.
- Dassargues, A. Modèles mathématiques en hydrogéologie et paramétrisation des aquifères. Revue d’Hydrogéologie 2007, 15, 3, 45-67.
Figure 1.
Location map of the Rharb basin.
Figure 1.
Location map of the Rharb basin.
Figure 2.
Lithostratigraphic log of the Rharb basin.
Figure 2.
Lithostratigraphic log of the Rharb basin.
Figure 3.
Schematic North-South section of the Rharb aquifer system.
Figure 3.
Schematic North-South section of the Rharb aquifer system.
Figure 4.
(a) Stratigraphic model of Rharb basin; (b) Conceptual model layers; (c) GIS Geodatabase.
Figure 4.
(a) Stratigraphic model of Rharb basin; (b) Conceptual model layers; (c) GIS Geodatabase.
Figure 5.
Model construction process.
Figure 5.
Model construction process.
Figure 6.
Modeling cycle.
Figure 6.
Modeling cycle.
Figure 7.
Boundary conditions.
Figure 7.
Boundary conditions.
Figure 8.
Example of recharge data for the Rharb aquifer system - from zone 1.
Figure 8.
Example of recharge data for the Rharb aquifer system - from zone 1.
Figure 9.
(a) Method for measuring calibration uncertainty. (b) Degree of correlation between observed and calculated piezometries. (c) Relationship between measured and calculated piezometric heights at pilot piezometers, September 2007 situation.
Figure 9.
(a) Method for measuring calibration uncertainty. (b) Degree of correlation between observed and calculated piezometries. (c) Relationship between measured and calculated piezometric heights at pilot piezometers, September 2007 situation.
Figure 10.
Spatial distribution of storage coefficients for the plioquaternary reservoir.
Figure 10.
Spatial distribution of storage coefficients for the plioquaternary reservoir.
Figure 11.
Evolution of recharge and discharge volumes.
Figure 11.
Evolution of recharge and discharge volumes.
Figure 12.
Reference map of Gharb groundwater concentrations (Combe 1969).
Figure 12.
Reference map of Gharb groundwater concentrations (Combe 1969).
Figure 13.
Spatial distribution of concentrations (g/l) between 1992-93 and 2006-07. (a) Upper Aquifer on September 22, 1992. (b) Upper Aquifer on September 22, 2007. (c) Aquitard on September 22, 1992. (d) Aquitard on September 22, 2007. € Lower aquifer on September 22, 1992. (f) Lower aquifer on September 22, 2007.
Figure 14.
Examples of changes in water concentrations in the lower aquifer: (a) free zones of the deep aquifer; (b) polution in confined zones of the deep aquifer.
Figure 14.
Examples of changes in water concentrations in the lower aquifer: (a) free zones of the deep aquifer; (b) polution in confined zones of the deep aquifer.
Figure 15.
Salt concentration along a cross-section for the September 2007 situation.
Figure 15.
Salt concentration along a cross-section for the September 2007 situation.
Figure 16.
Example of a freshwater-saltwater contact tomographic profile [
1].
Figure 16.
Example of a freshwater-saltwater contact tomographic profile [
1].
Figure 17.
Geometry of the freshwater-saltwater contact [
15].
Figure 17.
Geometry of the freshwater-saltwater contact [
15].
Table 1.
Inventory of input and output data for the transient model of Rharb basin.
Table 1.
Inventory of input and output data for the transient model of Rharb basin.
| Data |
Infiltration (INPUT) |
Pumping Well (OUTPUT) |
Storage coefficients |
| time series |
22/09/1992 – 22/09/2007 |
- |
| Entity |
156 polygons |
2368 points |
8 points |
| Time (interval) |
seasonal |
annual |
- |
Table 2.
Lambert coordinates of pilot piezometers used to calibrate storage coefficients of Rharb basin.
Table 2.
Lambert coordinates of pilot piezometers used to calibrate storage coefficients of Rharb basin.
| Reference piezometer |
X (m) |
Y (m) |
| 540/8 |
421070 |
420144 |
| 698/8 |
397061 |
425246 |
| 1552/8 |
394915 |
421195 |
| 1562/8 |
416958 |
448815 |
| 1564/8 |
416468 |
454357 |
| 1765/8 |
407665 |
447225 |
| 1807/14 |
412817 |
411091 |
Table 3.
Hydrological balances for the periods 1992/93 and 2006/07 in the Rharb basin.
Table 3.
Hydrological balances for the periods 1992/93 and 2006/07 in the Rharb basin.
| September 1993 |
In (m3/d) |
Out (m3/d) |
September 2007 |
In (m3/d) |
Out (m3/d) |
| Recharge |
346.217 |
0 |
Recharge |
344919 |
0 |
| Maamora |
182.220 |
0 |
Maamora |
176.652 |
0 |
| Ocean |
0 |
-110.654 |
Ocean |
0 |
-84.826 |
| Rivers |
126.829 |
-140.910 |
Rivers |
157.537 |
-148.621 |
| Drains |
0 |
-80.831 |
Drains |
0 |
-66.891 |
| Well |
0 |
-255.249 |
Well |
0 |
-466.723 |
| Storage |
45 |
-109.767 |
Storage |
6.611 |
-18.827 |
| Total |
655.311 |
-697.411 |
Total |
685719 |
-785888 |
| Deficit |
-15.4 Mm3/year |
Deficit |
-36.6 Mm3/year |
|
Disclaimer/Publisher’s Note: The statements, opinions and data contained in all publications are solely those of the individual author(s) and contributor(s) and not of MDPI and/or the editor(s). MDPI and/or the editor(s) disclaim responsibility for any injury to people or property resulting from any ideas, methods, instructions or products referred to in the content. |
© 2025 by the authors. Licensee MDPI, Basel, Switzerland. This article is an open access article distributed under the terms and conditions of the Creative Commons Attribution (CC BY) license (http://creativecommons.org/licenses/by/4.0/).