Introduction
Obesity is becoming more common worldwide and has become a major health threat because of its incidence rate and its role in the mortality of various serious diseases, including metabolic disorders, hypertension, and malignant tumors (1). Overnutrition is the leading cause, in which process the intestinal mucosa plays a pivotal role in the control of additional energy entering the body (2). However, how this barrier lets extra nutrients pass through it remains a mystery, although the villi and epithelium have been intensively studied at the deep molecular level (3).
The column of absorptive epithelial cells (ECs) combines with tight junctions (TJs), adherent junctions (AJ), and desmosomes in the upper areas of the cells to form a hexagonal surface border. Microvilli are formed, with transfer proteins and enzymes located in the membranes. Accordingly, two basic transepithelial-absorption pathways have been proposed: the transcellular and paracellular pathways. The transcellular pathway is the primary basic pattern of absorption; almost all nutrients are absorbed through this pathway. Meanwhile, ions, H2O, and some lipid molecules can be absorbed through the paracellular pathway (4). However, no evidence exists that these two traditional absorption pathways promise rapid or excessive influx of nutrients (absorption efficiency elevation).
“Gut leakage” is widely used in pathological studies and in clinical practice to describe harmful substances and pathogens entering the body through the mucosa intact, not biotransformed by ECs (5). It has been the subject of intense focus in recent years due to the close relationship between gut microbiota and visceral-organ injuries (6–10). Leakage is considered to have three pathways: the normal “paracellular pathway,” which is determined by changes in TJs, AJs, and mitochondrial components, including (1) “pores” and (2) “leakage,” which reflect intestinal permeability and show relatively limited leakage capacity, and (3) the “unrestricted” pathway due to EC apoptosis or extensive epithelial damage (such as erosion or ulcer), which is independent of TJs. “Unrestricted” leakage significantly weakens the mucosal barrier, permitting a large number of proteins and even bacteria to enter the circulation directly and in high volumes (11).
However, unrestricted absorption of potentially excessive nutrients and energy has not been reported under physiological conditions. Starvation also strongly reflects the existence of unrestricted absorption: after short-term fasting, replenishment of the body occurs rapidly after eating (12,13). To prove this hypothesis, we established fasting–refeeding (FaF) and diet-induced obesity (DIO) rat models in which we found histological evidence for the existence of unrestricted villous absorption.
Methods
Animals and Diets
Male Sprague Dawley (SD) rats (Charles River, Beijing, China) (n = 36; body mass [BM], 186.0 ± 20.7 g) were fed a high-fat diet (HFD; 5.58 kcal/g) or a standard chow diet (3.16 kcal/g; KeAo Corp., Beijing, China) for 1 week. Animals were individually housed in a specific-pathogen–free (SPF) environment on a 12:12 h dark–light cycle with water available ad libitum. After 48 h of fasting (08:00–08:00), rats were refed the same diet for 1 h and thereafter killed at various time points, and gut samples were collected. The study protocols complied with the Laboratory Animal—Guidelines for the Ethical Review of Animal Welfare (GB/T 35892—2018) and were approved by the Medical Ethics Committee of Lanzhou University (jcyxy20190302).
For our DIO rat model, we randomly allocated male weaned SD rats (n = 140; BM, 46.0 ± 2.7 g) to chow or HFD (4.98 kcal/g for 8-week growth, followed by 5.58 kcal/g for 12-week obesity induction). HFD rats were provided both HFD and chow diets simultaneously to avoid the influence of dietary preference. At the end of the 20th week, animals were killed, and their small intestines (SIs) collected. We calculated Lee’s index in the rats as 3√BM (g)/naso-anal length (cm) (14). The experimental protocols were approved by the Animal Welfare Committee of Lanzhou University (Lanzhou, China) and Peking University (Beijing, China).
We produced the HFD by mixing chow, egg yolk powder, lard, and sugar as described previously (14). The tracer diet was composed of an HFD containing 5 mL/100 g Chinese ink (Beijing Yi-De-Ge Ink, Beijing, China). Ink particles were 23.57 ± 5.62 nm in diameter as measured by the Persistent Organic Pollutants Lab at the Shenzhen Centre for Disease Control and Prevention (Shenzen, China) using a Hitachi transmission electron microscope (TEM; Hitachi, Tokyo, Japan).
Tissue Preparation
Animals were killed by portal-vein blood drainage after anesthesia by intraperitoneal (i.p.) injection of pentobarbital sodium (5 mg/100 g BM). We collected the entire SI from rats refed after fasting and the jejunum (10 to 20 cm distal to the pyloric sphincter) from rats fed an HFD. Samples were resected and opened longitudinally along the mesenteric border, flattened and then rinsed gently with saline to remove food debris. The mucosa of some tissues was also scraped, fixed with 4% buffered formaldehyde for 48 h, and embedded with OCT, after which it was formed into frozen sections (CM1950, Leica, Germany). Additionally, a part of the jejunum tissues was fixed and subjected to paraffin embedding.
Light Microscopy
Tissues from FaF rats were embedded in Optimal Cutting Temperature (OCT) compound, frozen, and sectioned; those from HFD rats were fixed in 10% buffered paraformaldehyde in phosphate-buffered saline (PBS) for 24 h and embedded in paraffin (Leica ASP200S; Leica, Wetzlar, Germany). The latter involved immersion in neutral-buffered formaldehyde (pH 7.2 PBS + 37% formaldehyde [9:1]) for 40 min, 50% ethanol for 1 h, 70% ethanol for 1 h, 95% ethanol for 40 min, 95% ethanol for 40 min, 2 × 100% ethanol for 30 min, 2 × solvent oil (or xylene) for 20 min, and 3 × paraffin for 20 min at 56–58°C. Sections (4 µm thick) were prepared for hematoxylin and eosin (H&E), periodic acid–silver methenamine (PASM) or Oil Red O staining. We observed the slides under a light microscope (JEOL, Tokyo, Japan).
Electron Microscopy
For scanning electron microscopy (SEM), we fixed jejunal samples in 3% glutaraldehyde for 2 h and then post-fixed them in 1% osmium tetroxide for 2 h at 4°C. Tissues were then dehydrated using a graded series of ethanol concentrations and dried. We coated the specimens with gold–palladium by ion sputtering and examined them under a JEM-1400 or JSM-5600LV/JSM-6700F SEM (JEOL) at 20 kV. TEM was performed as previously reported (14).
Immunofluorescence (IF) and Immunohistochemistry (IHC)
Frozen sections were fixed with 4% buffered formaldehyde for 15 min at room temperature (RT) and then permeabilized with 0.2% Triton X-100 for 20 min. Non-specific antigens were blocked with 3% BSA (A8020, Solarbio, Beijing, China) for 60 min at RT. Tissue slides were reacted with primary antibodies at 4℃ overnight, followed by secondary antibodies for 2 h at RT. The nuclei were counterstained with 4’,6-diamidino-2-phenylindole (DAPI, 1:20, C0065, Solarbio, Beijing, China) for 10 min at RT. After mounting with anti-fluorescence attenuation mountant reagent (S2100, Solarbio, Beijing, China), slides were observed with laser scanning confocal microscope (LSM 900, Zeiss, Germany). The fluorescence intensity of the captured images were analyzed with Image J software (version 6.0). The primary antibodies used were occludin (rabbit poly antibody, Proteintech, 27260-1-AP, 1:400) and ZO-1 (rabbit poly antibody, Proteintech, 21773-1-AP, 1:400). The secondary antibody was CoraLite®594–conjugated goat anti-rabbit IgG (H+L) (Proteintech, SA00013-4, 1:400).
For immunohistochemistry, paraffin sections were deparaffinized with a gradient of alcohol and xylene. After blocking non-specific antigens with 3% BSA, sections were incubated with rabbit Bax polyclonal antibody (Proteintech, 50599-2-Ig, 1:2000) at 4oC overnight. The immuno-complex was amplified with biotin–conjugated goat anti-rabbit IgG (H+L) (SAP-9100) and visualized with diaminobenzidine (SP9001, ZSGB-BIO, Beijing, China). Slides were observed with a Nikon ECLIPSE 80i/ DS-Ri2 (Nikon, Tokyo, Japan).
Statistical Analysis
Data are expressed as the mean ± standard deviation (SD). We performed statistical analysis using SPSS version 21.0 (IBM Corp., Armonk, NY, USA). Single-point measures of Lee’s index, BM, and food and energy intake were analyzed by one-way analysis of variance (ANOVA) and an independent-sample t test. P < 0.05 was considered to represent statistical significance.
Results
Absorption Channel in Villi of Fasted–Refed Rats
Villous-tip openings and subepithelial space in enhanced villous absorption
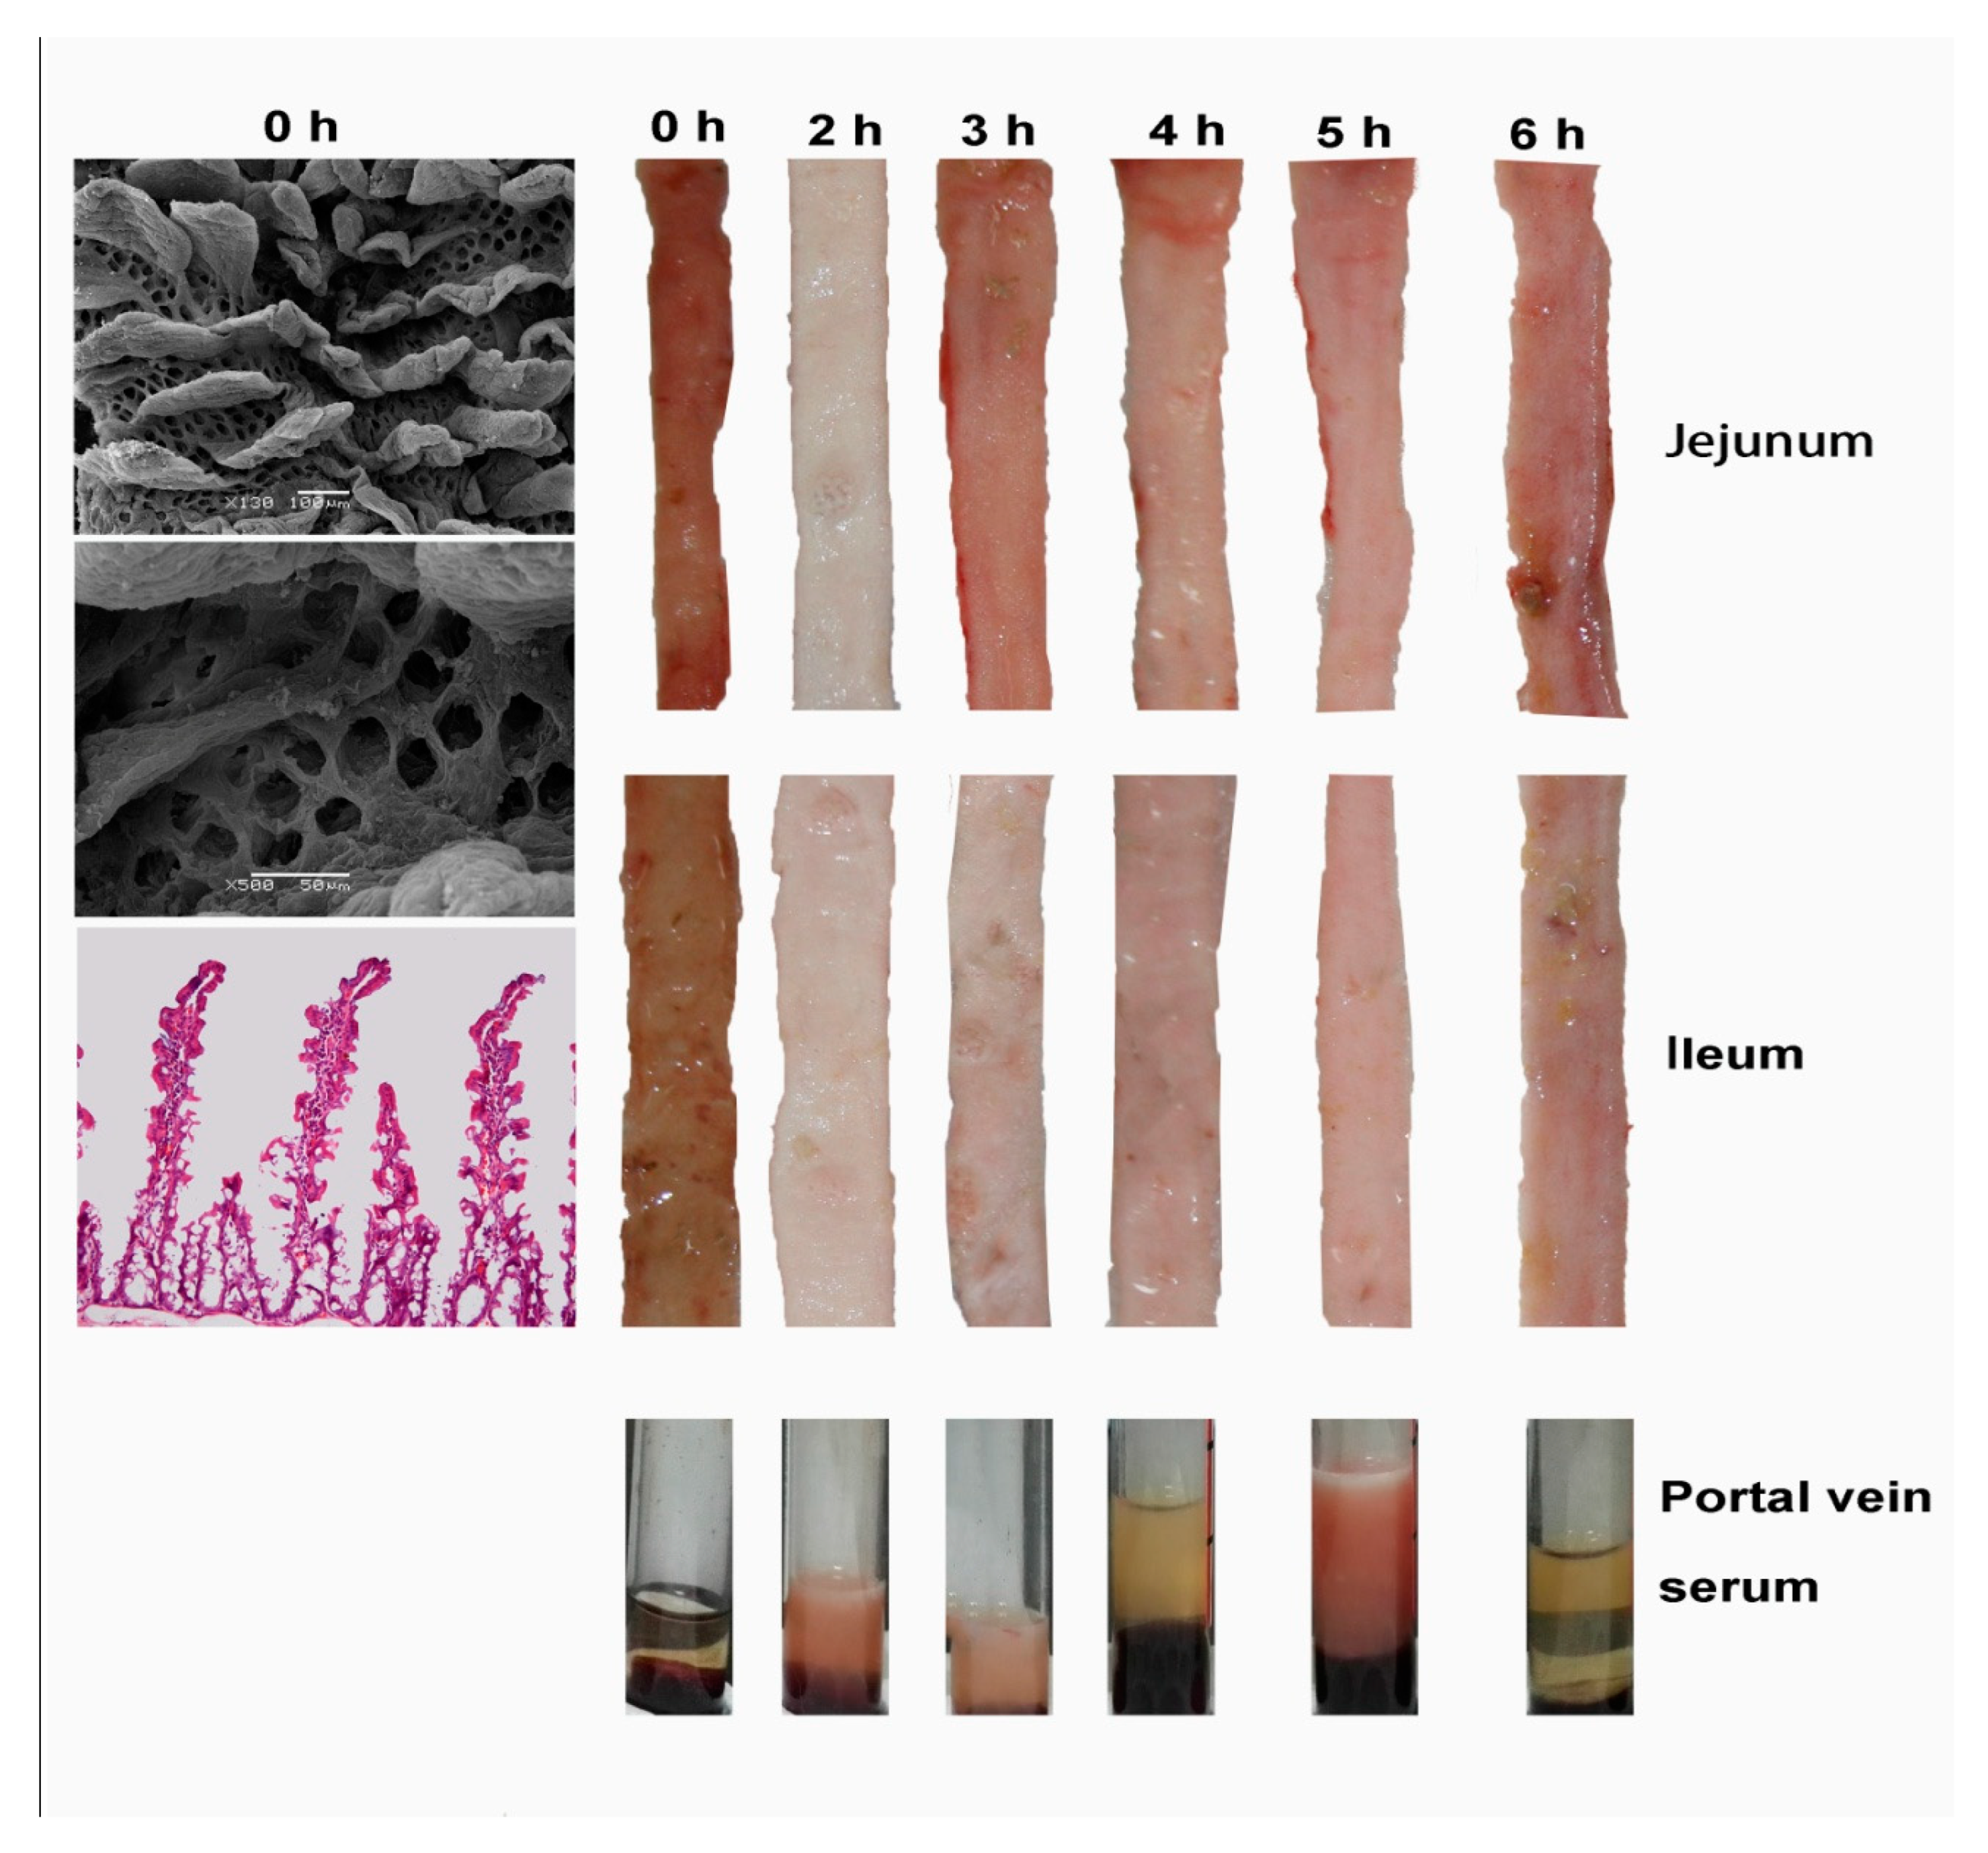
After 48 h of fasting, the villi atrophied, and the space between them increased. These changes made visible the “well-like” crypt mouths, which we identified histologically as opened SI glands (
Figure 1; 0 h). The gut demonstrated enhanced absorption shortly after FaF (2nd hour) and returned to normal over the 3rd to 6th hours (jejunum) or the 4th to 6th hours (ileum;
Figure 1).
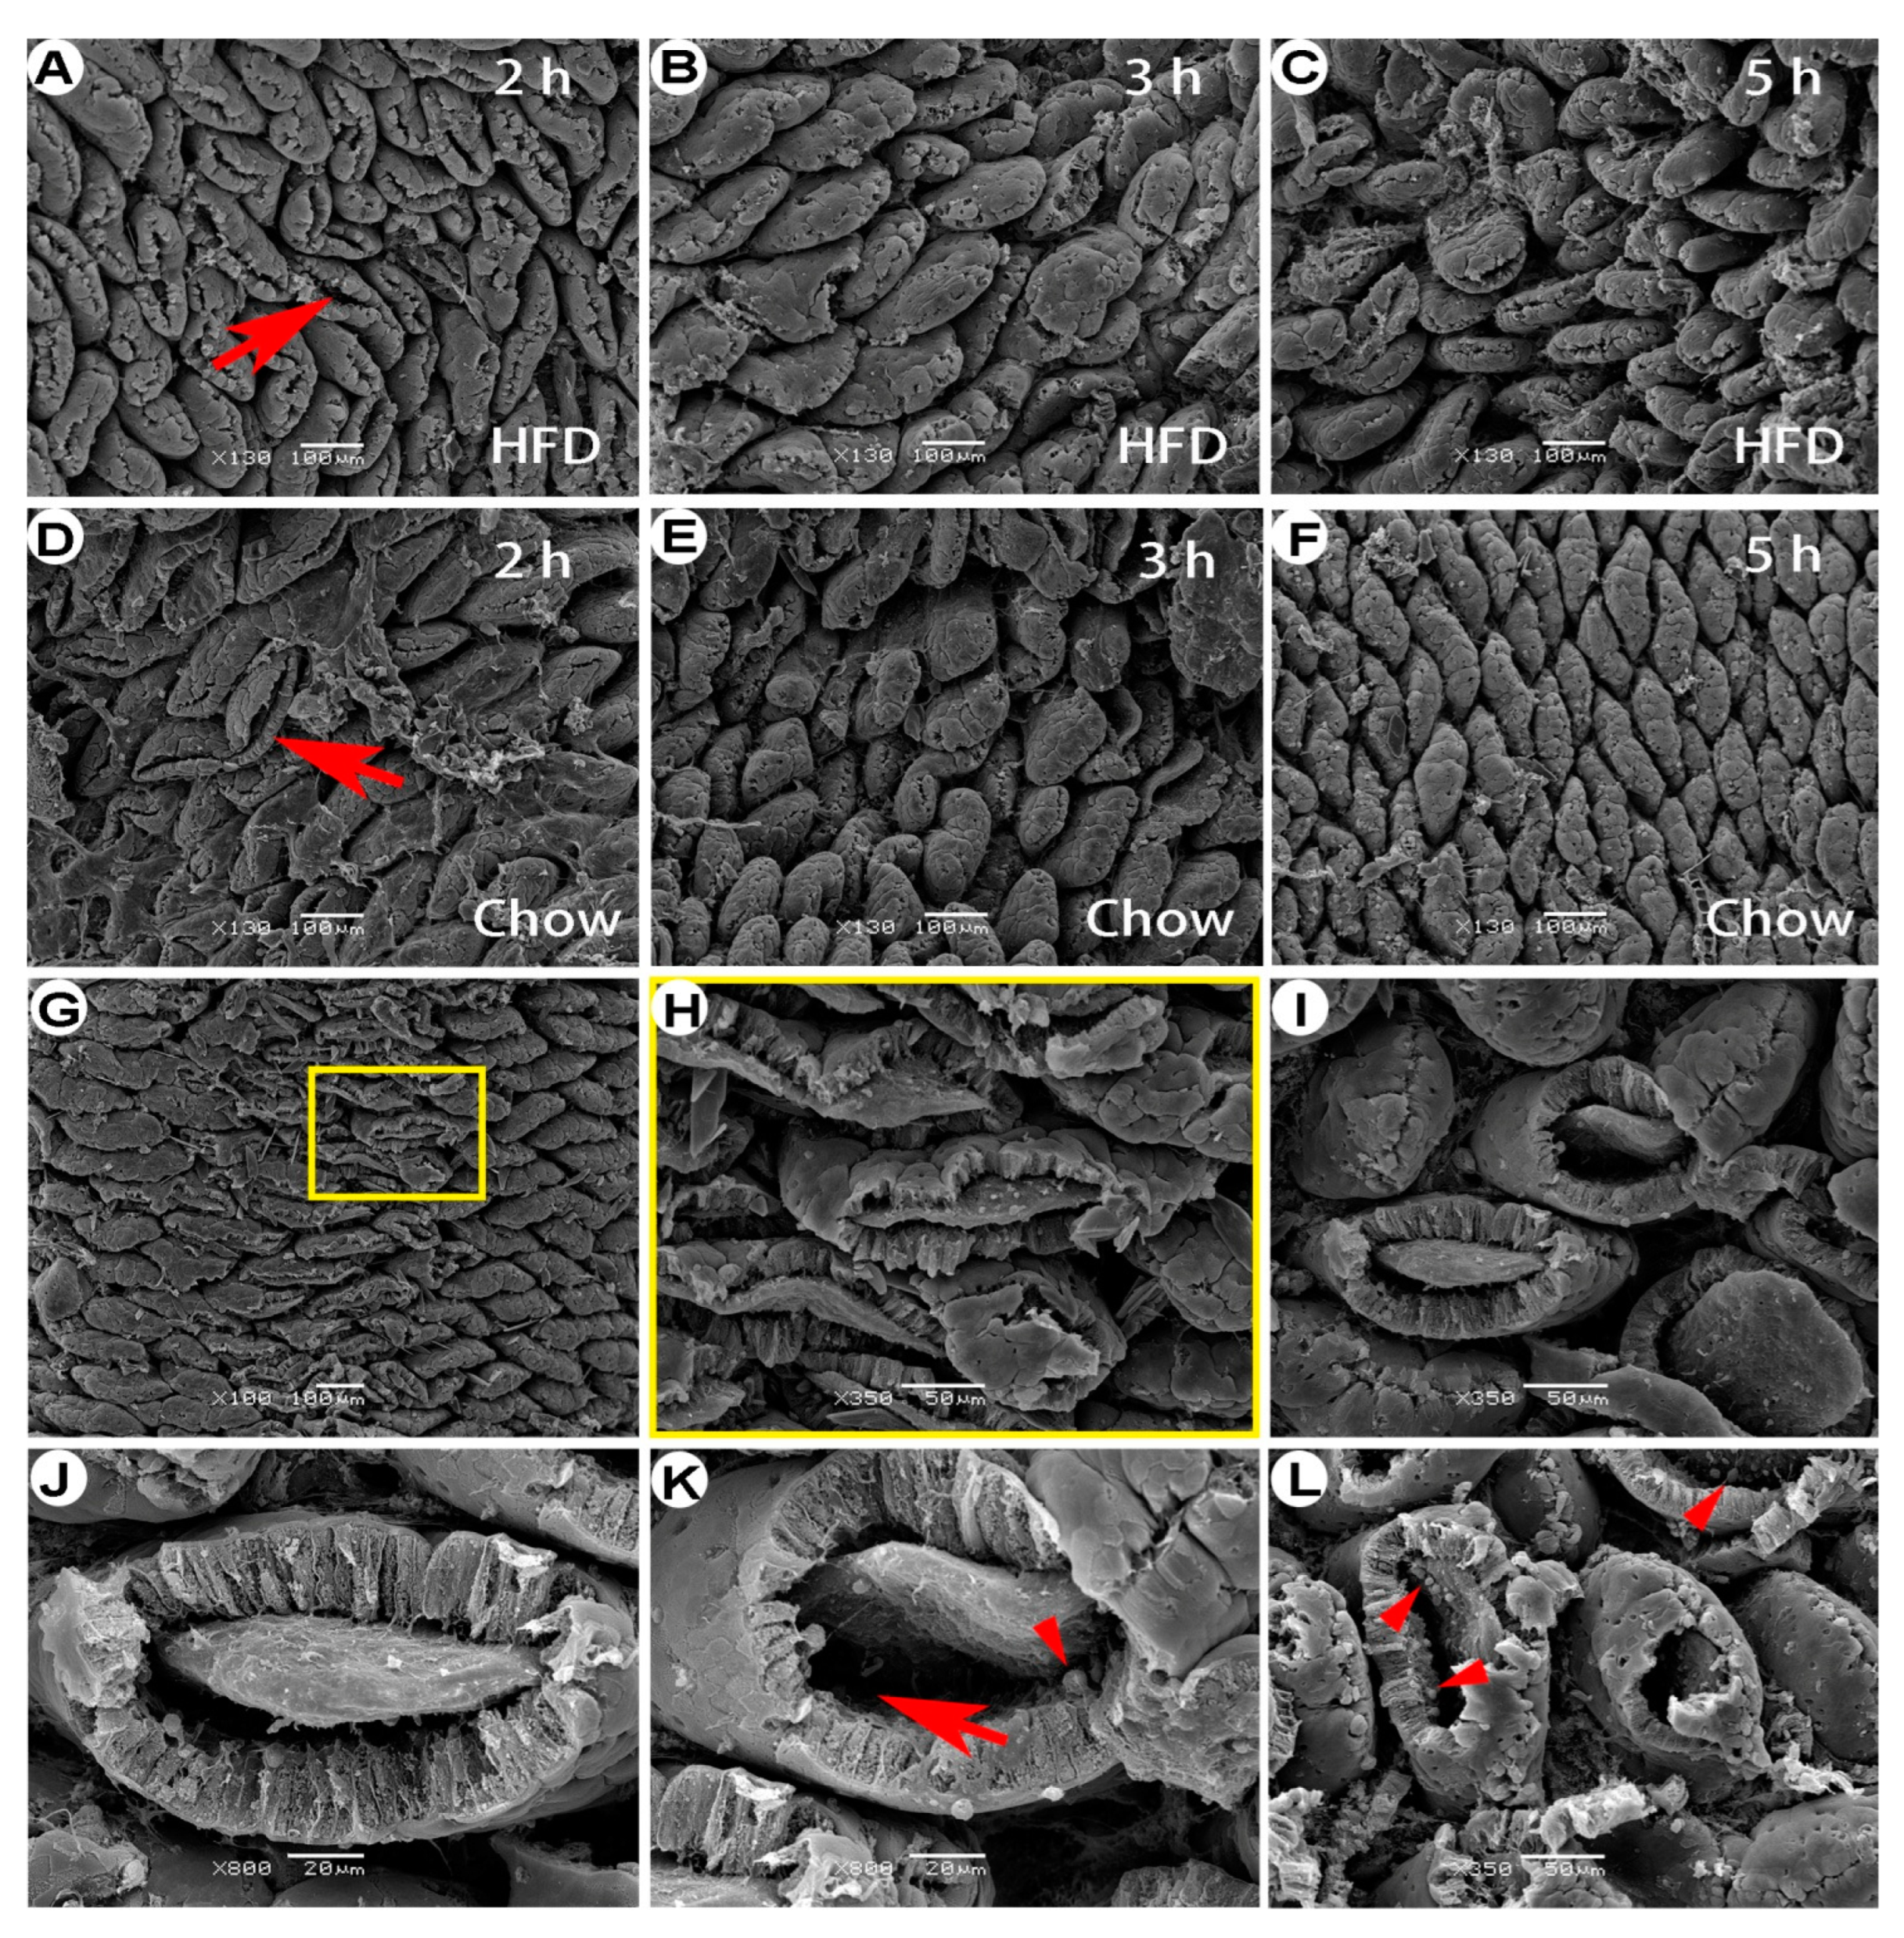
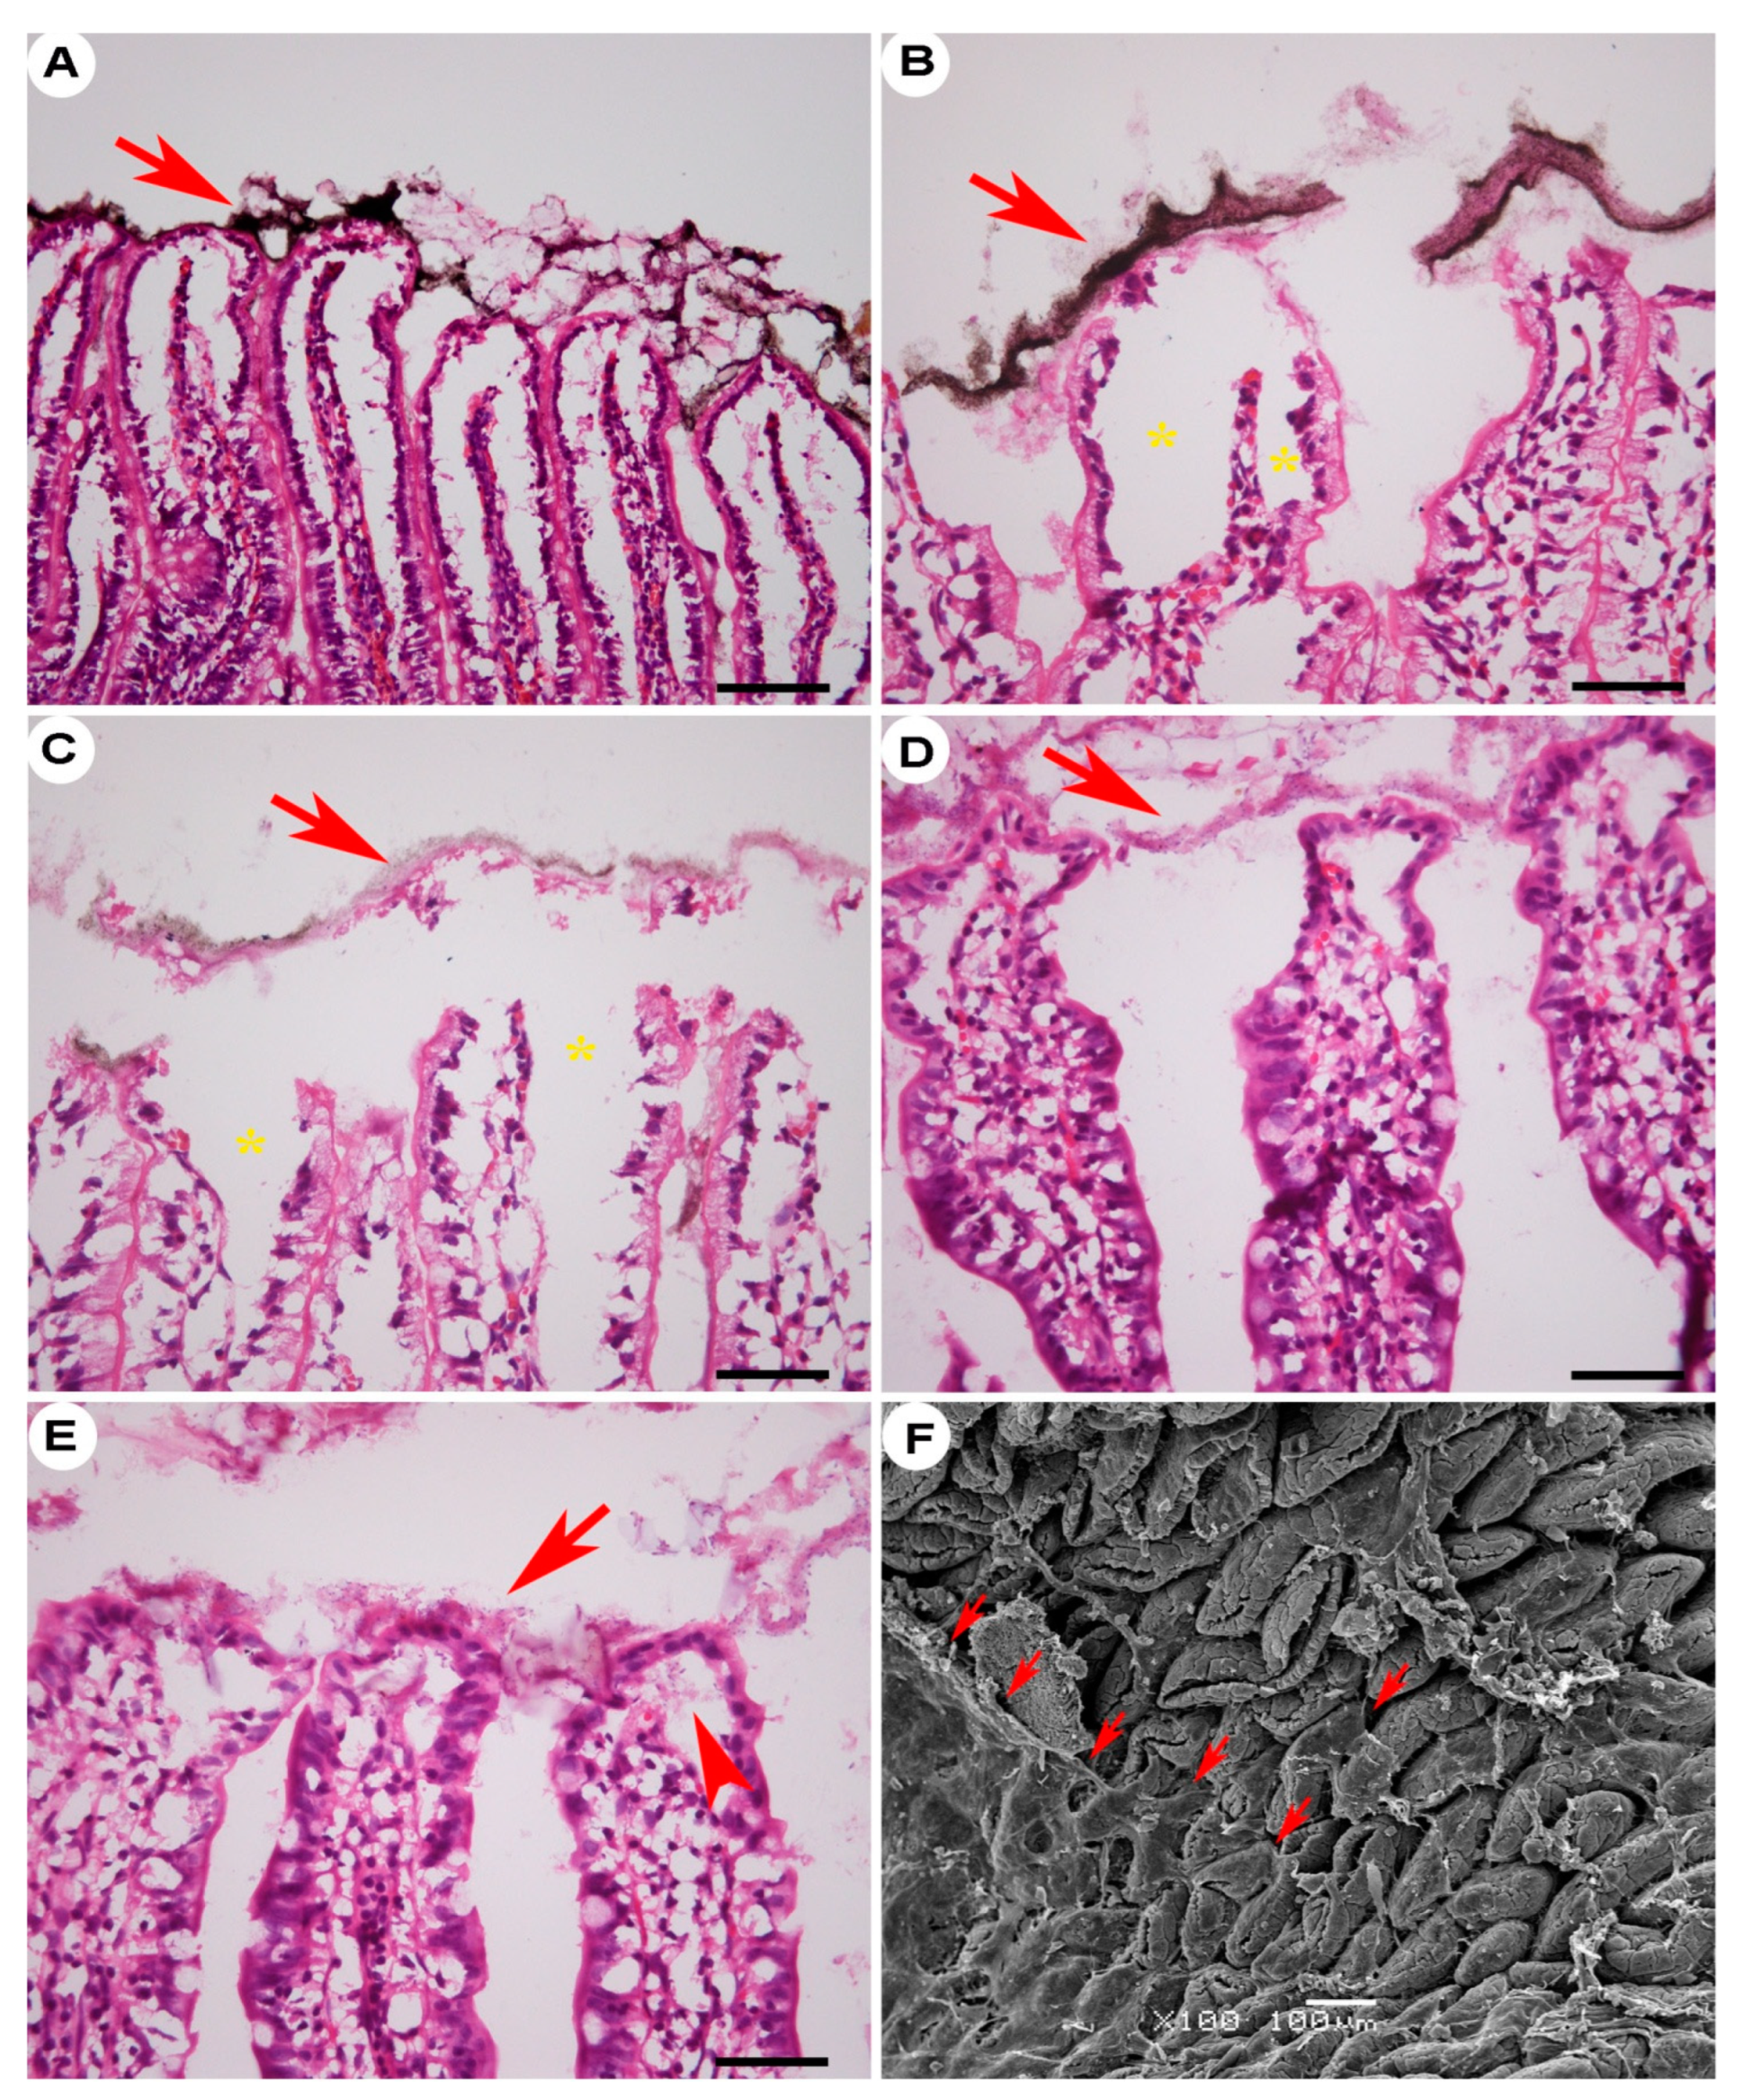
SEM showed wide openings in villous tips throughout the SI (
Figure 2), which were prominent in the early stage of FaF (2nd hour) but nearly disappeared by the late stage. These tip openings were similar in rats refed with either an HFD (
Figure 2A–2C) or chow diet (
Figure 2D–2F), indicating that their tip openings were a fasting- rather than a diet-induced phenomenon. In addition, occasional focal openings caused by the loss of villous caps were also apparent, which left the subepithelium and villous axis exposed (
Figure 2G–2I). The villous epithelium detached from the basement membrane and formed a subepithelial space while the tips were open (
Figure 2H–2L).
Subepithelial Space Extended Down to the Submucosal Lymphatic Sinus of the Villi in Fasted–Refed Rats
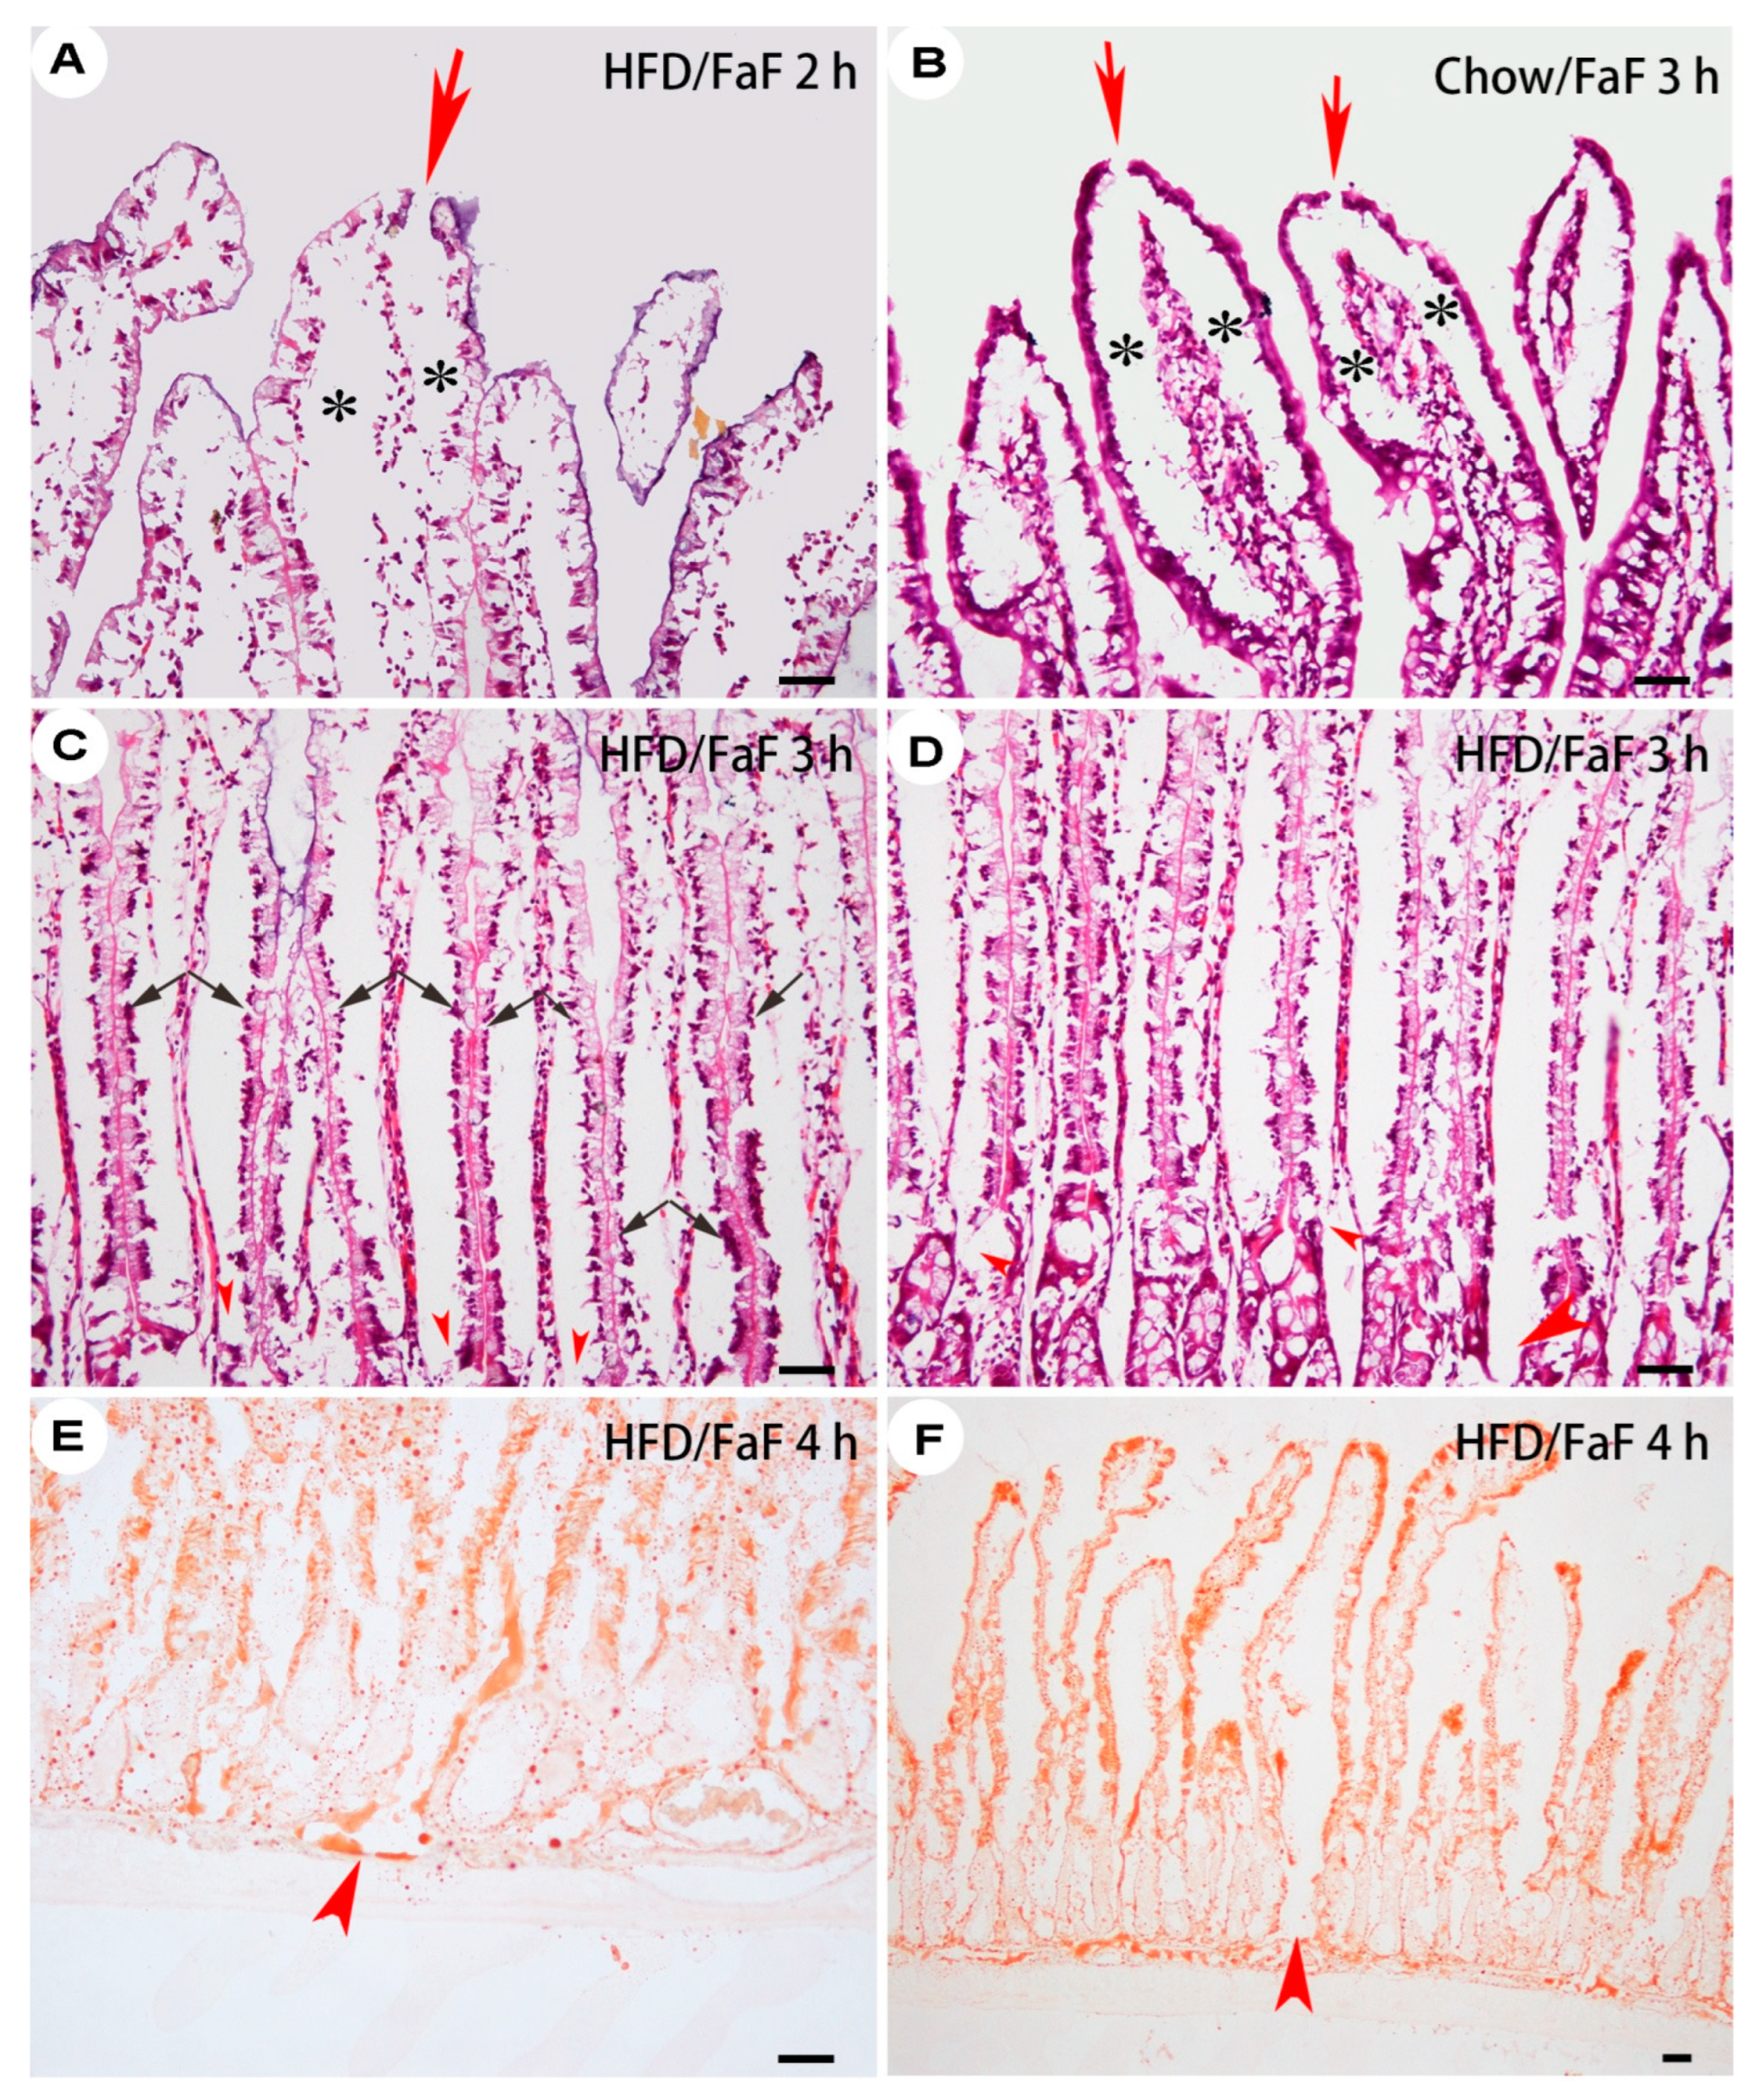
To further investigate the subepithelial space, we studied and observed longitudinal sections of the villi under light microscopy. Villous-tip openings and the subepithelial space were dominant (
Figure 3A–3B). The lamina propria were compressed by the subepithelial space. The space seemed not to be derived from the direct detachment of the base membrane but rather the loss of the lower part of EC cytoplasm (
Figure 3C). Some subepithelial space was confined to the upper part of the villi, while others extended down through the villi and opened into the interrupted lacteals (
Figure 3D) or directly into the submucosal lymphatic sinus (
Figure 3E–3F).
The Mucous Layer Prevented Small Particles from Entering the Absorption Channel
Because wide-open channels in the gut might represent a risk to the internal environment, we fed a tracer diet to a cohort of rats to assess intestinal permeability to particles. High magnification showed that the ink particles were trapped by the mucous layer and therefore prevented from entering the subepithelial space (
Figure 5). The mucous layer thus forms a temporary selective barrier. These results demonstrated that mucus plays an important role in preventing particle influx.
Consumption of an HFD containing ink caused tip openings and subepithelial spaces to develop. However, the ink particles did not appear in these spaces but were trapped by the mucous layer (A–C). This layer was also evident in chow diet–refed rats (D–F), and a mucous micromass was occasionally detected at the upper end of the subepithelial space (E, arrowhead). The mucous layer appeared thin and transparent under SEM (F, arrows). Arrow, mucous layer; asterisk, subepithelial spaces. H&E staining, bar = 50 µm.
Absorption Channel in Villi of Obese Rats
Obesity Modeling
Nutritional obesity was modeled using the method previously reported (14). Briefly, we classified weaned SD rats into HFD (n = 100) and chow (n = 40) groups by initial body weight. HFD rats were provided HFD (5.58 kcal/g) and chow simultaneously to avoid the influence of specific dietary preferences. HFD rats ingested 3.82 ± 2.52 times more HFD than chow diet per day, implying that the HFD was palatable (HFD/chow ratio calculated in 11th–14th weeks). Long-term exposure (16 weeks) to the HFD increased Lee’s index in the rats (0.332 ± 0.009 in HFD rats
vs. 0.317 ± 0.007 in chow-fed rats;
P < 0.05), and HFD rats gained 22% more BM than chow controls (760.9 ± 73.2 g
vs. 626.1 ± 42.4 g, respectively;
P < 0.05;
Table 1). Preference (HFD/chow) for the HFD did not differ among rats with high, intermediate, and low Lee’s indices (
P > 0.05;
Table 2). These results suggested a potent and reliable obesity-inducing effect of this feeding system. According to food and energy intake, rats with high Lee’s indices consumed the same amount of chow diet but a larger quantity of HFD than those with low Lee’s indices (daily intake calculated in the 13th–14th weeks;
P < 0.05;
Table 2) (
Figure 7A).
Absorption Channel in Obese Rats
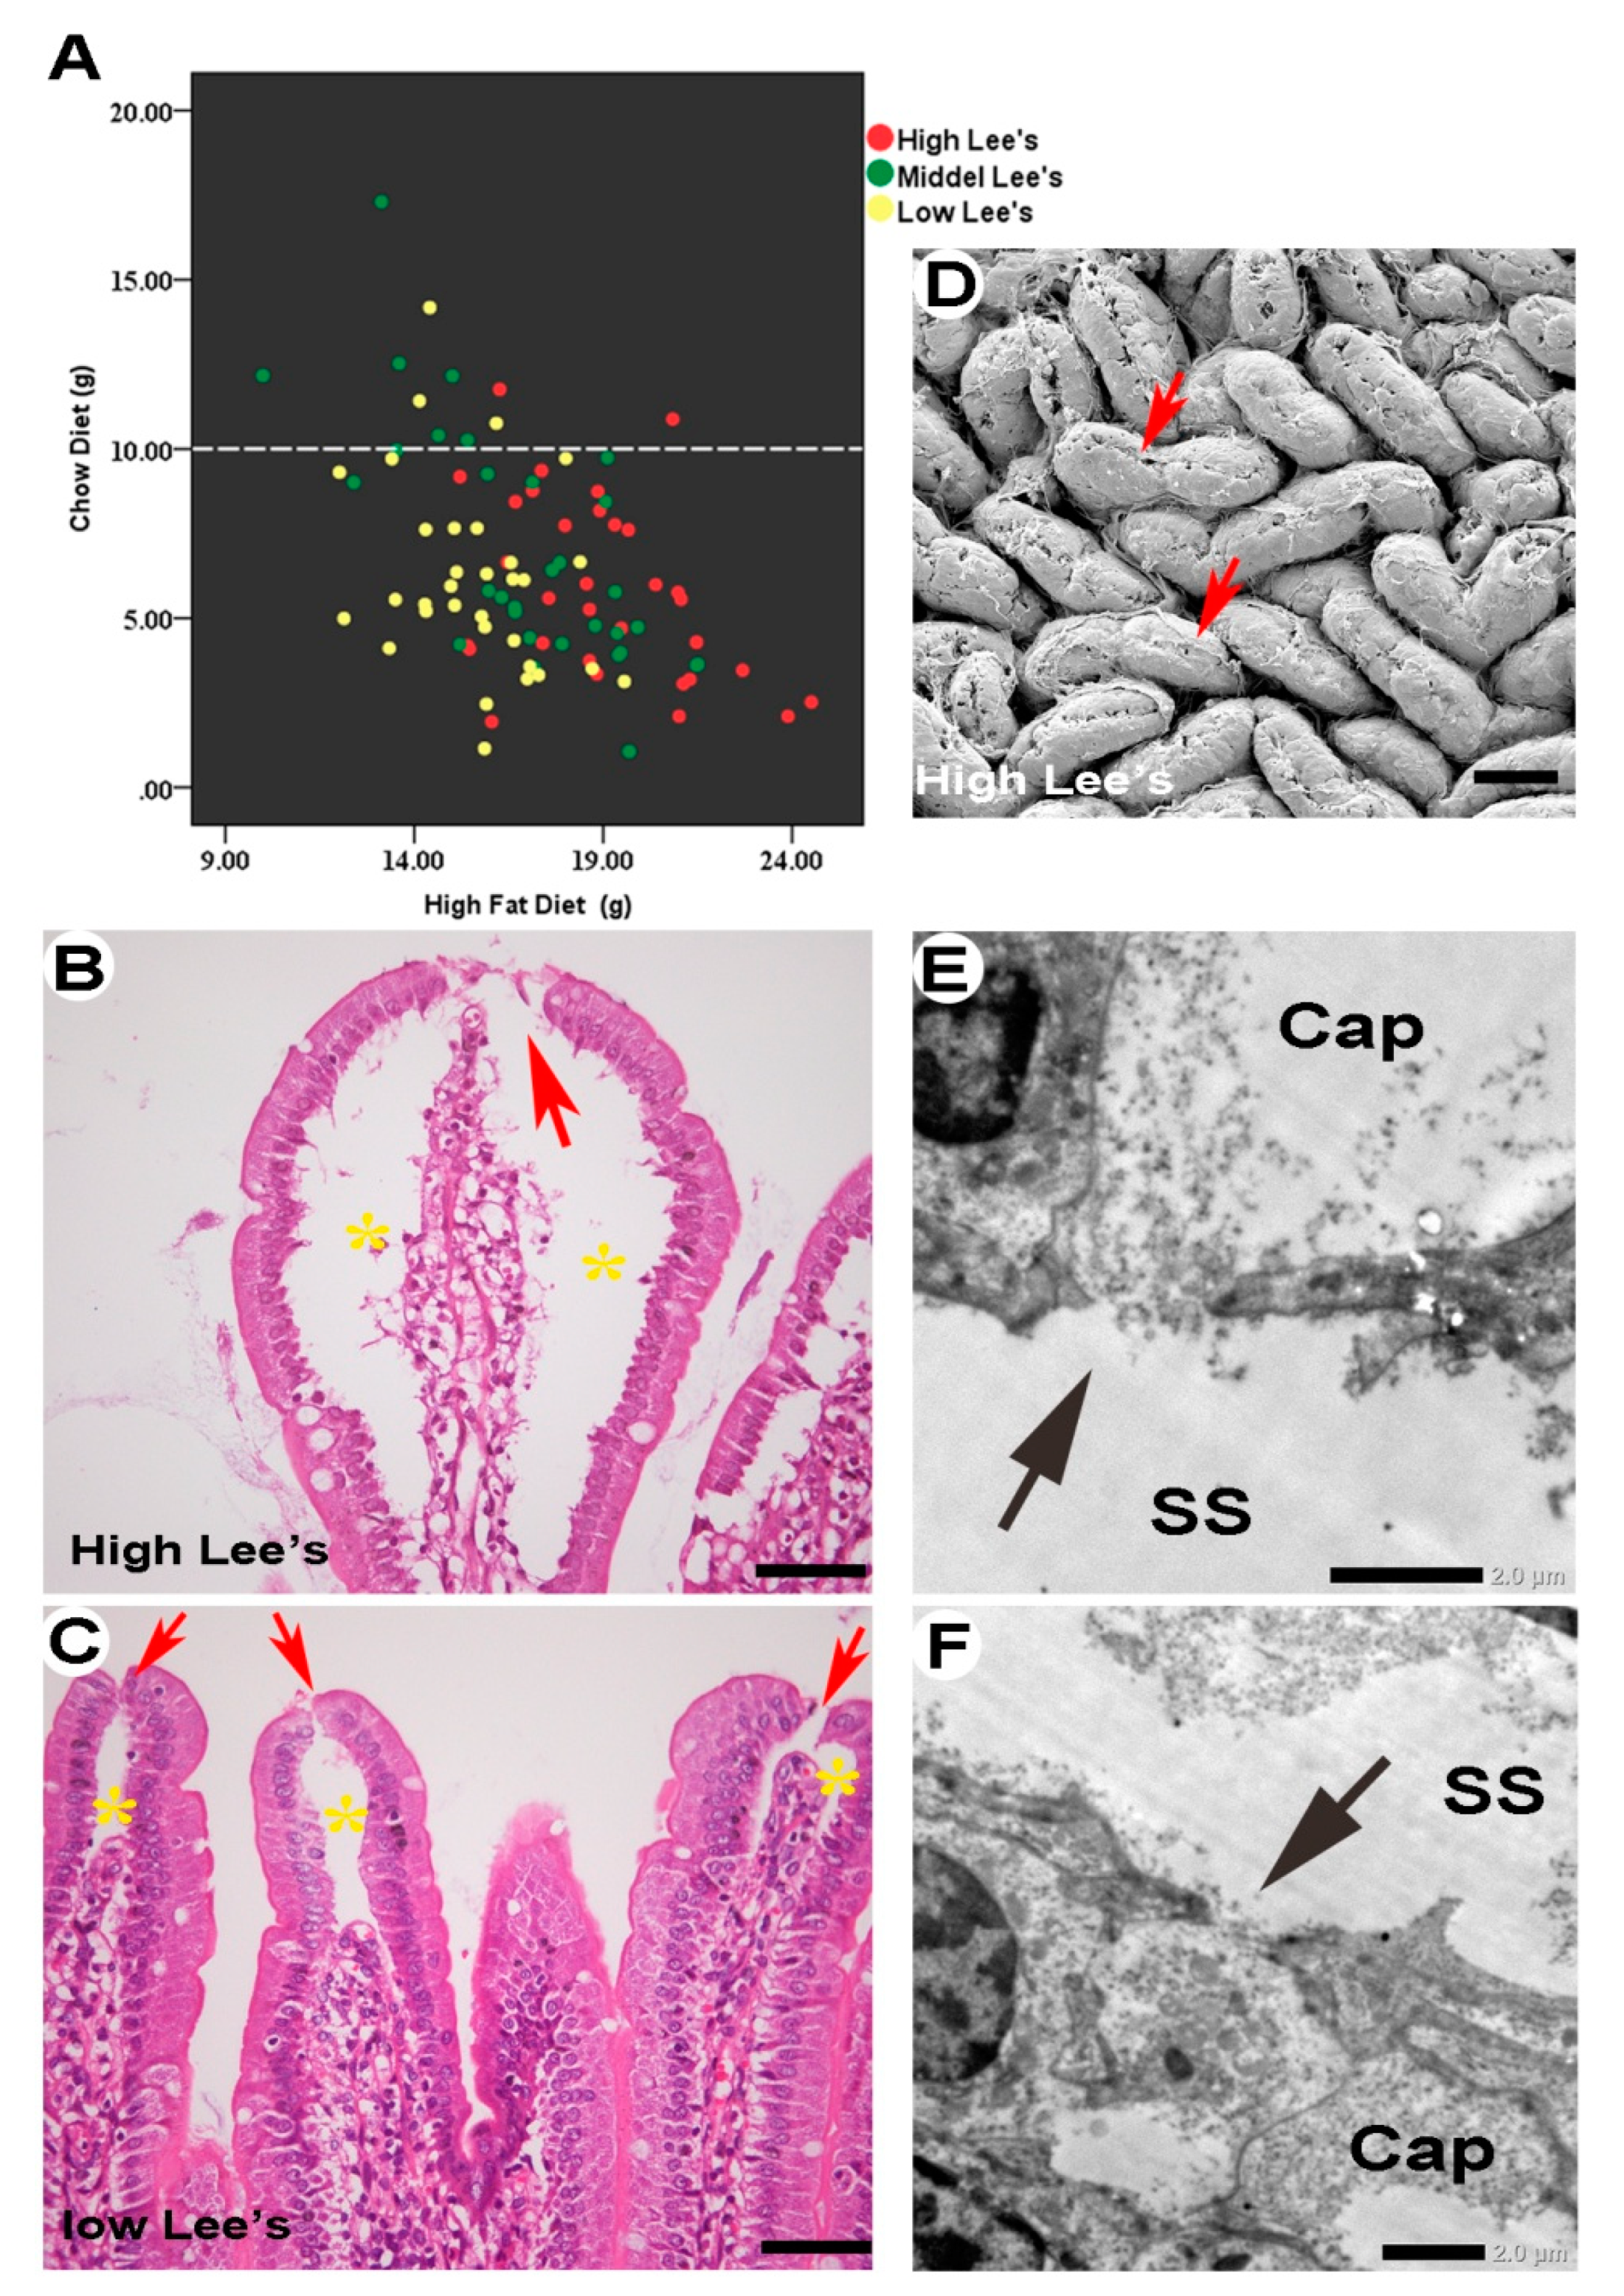
To identify the unrestricted-absorption mechanism in rats with high Lee’s indices and greater HFD ingestion, we randomly selected 25 rats from the high, middle, and lower Lee’s index groups (
Figure 5A) and continued to feed them for 5 weeks. The animals maintained their trend of obesity development: HFD rats gained 25% more BM than chow rats (respectively, BM, 848.1 ± 103.4 g
vs. 680.9 ± 51.0 g; Lee’s index, 0.336 ± 0.011
vs. 0.322 ± 0.008;
P < 0.05).
We observed the jejuna of these rats histologically. Villous-tip openings were less enlarged than in FaF rats but still recognizable (
Figure 7B). Unlike in FaF rats, the subepithelial space was mainly confined to the upper part of the villi rather than extending down to the submucosal lymphatic sinus, and the lamina propria was not remarkably compressed (
Figure 7C). The space was highly expanded in rats with high Lee’s indices (
i.e., obesity prone;
Figure 7C) than in those with low Lee’s indices (
i.e., obesity resistant;
Figure 7D) or in chow rats, in which the space was located mainly around the villous tips and might have been caused by portal-vein blood drainage. Although we did not observe extension of the subepithelial space directly down to the lymphatic sinus, holes 1.0–2.0 μm in diameter were visible in the capillary network, providing a communication pathway with the subepithelial space (
Figure 7E–7F).
Discussion
Intestinal absorption plays an important role in the occurrence and development of nutritional obesity (15). The intestinal mucosa is the valuable final line of defense blocking energy overload of the internal environment from overeating. However, based on our present knowledge of absorption, the strategy of preventing energy overload through intestinal mucosa absorption still lacks targets. The mechanisms by which the body elevates absorptive capacity are still unclear. In this study, we demonstrated a third absorption pathway in fasted–refed rats and obese rats. This pathway started from the “tip openings” of the villi and ended at the porous vessel walls of capillaries and lacteals in the villous lamina propria by way of the subepithelial space and porous basal lamina. It allowed the intestinal contents to flow directly and rapidly into circulation without limitation by epithelial and paracellular junctions.
Clinical and basic ultrastructural research evidence directly or indirectly supports the existence of this pathway. Many clinical studies have reported that exogenous macromolecules, such as disaccharide, bacterial lipopolysaccharide (LPS), polyethylene glycols (PEG 400), toxins, orally administered medicines, gluten (gliadin), plant microRNA, and oral bacterial DNA (5,6,16–21) can exist intact in the circulation and cause allergies, multiple sclerosis, lupus, arthritis, and asthma (7–10). This phenomenon does not seem easily explainable by traditional transepithelial mechanisms.
Ultrastructural research provides additional evidence for this channel: (1) The porous basal lamina and capillaries and the opened lacteals of the villi have been reported. In the 1980s, with the aid of SEM, the porous basal lamina (basement membrane) of ECs was revealed after removal of the epithelium by osmic acid maceration (22–24). The implications of these holes for nutrient passage are obvious. First, these 0.5–5.0-μm fenestrations are richly distributed at a density of 1–2 × 10
4/mm
2 in the upper two-thirds to three-fourths of the villi, except for the tips. In the upper three-fourths of the villi, some of these pores are larger in diameter than those in the lower portions (23,25,26). Second, the fenestrations of the villous epithelial basal lamina were present in all segments of the SI, mostly in the jejunum. Third, the number and size of fenestrations increase in the jejunum after FaF (27) and also after HFD (28) feeding. (2) Apart from the porous basal lamina, according to the initial appearance of intestinal villi under TEM, blood capillaries in the lamina propria are composed of a single layer of flattened delicate ECs, which overlap at their edges and leave crevices 10–15 μm wide between adjacent cells. The endothelial wall consists of pores about 20–50 μm wide that run through its more-attenuated portions. The ECs of the lacteals are occasionally disjointed. The resulting interruption in the coherence of the wall leaves a passage of variable dimensions. Moreover, a definite basement membrane is not always discernible (29). Casley-Smith JR confirmed these findings and provided further evidence of chylomicra and lipoproteins passing through the open junctions of lacteals (30,31). Endothelial holes can be found in weaned, adult, and aged rats, and the number of endothelial holes increases throughout the life cycle from the newborn phase to old age (32). (3) The tip cells of villi are the terminal cells of villous epithelial maturation from crypt stem cells. In normal conditions, they are regularly “exfoliated,” “extruded,” “shed,” or “lost” (33) every 2–6 days (“extrusion zones”) with the replacement of whole ECs. Even though the villous tips receive more arterial-blood supply, there are still aging cells with lower vitality than that of young cells in the villous base, and they easily lose their normal physiological functions under certain detrimental conditions. Hypoxia-induced damage usually occurs later in both intestinal crypts and the basal parts of villi than in the apical areas thereof (32,34). (4) Chiu CJ
et al. has described the subepithelial space (Gruenhagen’s space) in detail. This morphological change is a consistent and reproducible marker of intestinal ischemia in laboratory dogs under superior mesenteric-artery hypoperfusion or clamping. This space cannot be caused by direct detachment of epithelium from basement membrane; rather, it consists of the infranuclear portions of broken-off epithelium, while the function and morphology of the upper part of the epithelium remain normal (35). In this study, animals were killed by portal-vein blood drainage after anesthesia. However, the subepithelial space possibly derived from blood drainage was totally different from the absorptive space, as shown in
Figure 5.
Of course, it must be clearly recognized that all evidence was from laboratory animals. Data from human beings are still lacking. In particular, some research in human specimens has failed to find fenestrations in capillaries and abrupted lacteals (36). We speculated that this channel, especially its formation by shed tip cells and epithelial detachment, might be regulated by neurotransmitters such as serotonin (5-HT), histamine, and cannabinoids, or by leukocytes resident in the lamina propria, and involves regulation of gene expression related to apoptosis, adhesion, and tight junction related processes, as shown in
Figure 7 (31).
Despite these limitations, these findings still hold some significance. First, this morphological channel provided potent structural support for intestinal absorption and leakage. It enriched the absorption pathways, made gut leakage possible in physiological conditions, and provided a reasonable explanation for exogenous harmful substances invading the body intact. An important piece of evidence is that ingested tracers, such as PEG 400, subsequently appear intact in the urine of affected animals (17). Others include the low expression of intestinal-permeability biomarkers, including zonulin, claudin, and junction-adhesive molecules (JAMs), and the low transepithelial electric resistance observed in vitro (37–42). Our study provided direct evidence for the leaky gut. Second, the opening of this channel suggested that the absorption process was not only a passive process triggered by diet and nutrients but also an active process depending on the internal environment. Moreover, our findings also provided valuable significance for tip cell shedding in physiological conditions. The tip cell is like a bottle plug, allowing nutrient fluid to be absorbed into the “bottle.” The regulatory mechanism of tip cell apoptosis and EC detachment should be the first priority for clarification in future studies. Third, the absorptive channel will be a target in the treatment and prevention (especially tip apoptosis and EC detachment) of obesity and might also be one in the treatment of various diseases caused by exogenous pathogens and antigens.
In conclusion, based on previous evidence and our morphological findings, we reported a transient and functional absorption channel in the villi composed of villous-tip openings, subepithelial space, porous basement membrane, and a porous capillary network. It was a dynamic response to FaF or high appetite that could achieve rapid nutritional supplementation and additional energy intake. We also discovered the physiological conditions for the opening of this channel—that is, FaF and a large appetite (especially for a highly palatable high-fat diet). This absorption channel will become important in the fields of absorption and gut leakage, obesity, and various diseases. The regulatory mechanisms of villous-tip cell apoptosis and EC detachment should be clarified; they might be closely related to central regulation of food intake.
Authors Contributions
JGZ and HA contributed to the study concept and design. XWS and JGZ were responsible for data analysis and interpretation and drafted the manuscript. YMH completed the immunohistology detection in situ. All authors contributed to data acquisition and critical revisions of the manuscript. XWS and YMH are co-first authors, and XWS, JGZ, and HA are co-corresponding authors.
Competing interests
The authors declare that they have no competing interests.
Funding
This work was supported by grants from the National Natural Science Foundation of China (NSFC) to HA (No. 30671015) and JGZ (No. 81670776), as well as a grant from the Natural Science Foundation of Gansu Province, China, to XWS (22JR5RA503).
Acknowledgment
This work was supported by grants from the National Natural Science Foundation of China (NSFC) to HA (No. 30671015) and JGZ (No. 81670776), as well as a grant from the Natural Science Foundation of Gansu Province, China, to XWS (22JR5RA503).
References
- Pi-Sunyer X. A clinical view of the obesity problem. Science 2003;299:859-860. [CrossRef]
- Fukui H. Increased intestinal permeability and decreased barrier function: does it really influence the risk of inflammation? Inflamm Intest Dis 2016;1:135-145.
- Brown AL Jr. Microvilli of the human jejunal epithelial cell. J Cell Biol 1962;12:623-627. [CrossRef]
- Tso P, Balint JA. Formation and transport of chylomicrons by enterocytes to the lymphatics. Am J Physiol 1986;250:G715-726. [CrossRef]
- Hollander, D. Intestinal permeability, leaky gut, and intestinal disorders. Curr Gastroenterol Rep 1999;1:410-416.
- Patrakka O, Pienimäki JP, Tuomisto S, et al. Oral bacterial signatures in cerebral thrombi of patients with acute ischemic stroke treated with thrombectomy. J Am Heart Assoc 2019;8:e012330. [CrossRef]
- Samadi N, Klems M, Untersmayr E. The role of gastrointestinal permeability in food allergy. Ann Allergy Asthma Immunol 2018;121:168-173. [CrossRef]
- Yacyshyn B, Meddings J, Sadowski D, Bowen-Yacyshyn MB. Multiple sclerosis patients have peripheral blood CD45RO+ B cells and increased intestinal permeability. Dig Dis Sci 1996;41:2493-2498. [CrossRef]
- Fasano A. Leaky gut and autoimmune diseases. Clin Rev Allergy Immunol 2012;42:71-78.
- Taneja V. Arthritis susceptibility and the gut microbiome. FEBS Lett 2014;588:4244-4249. [CrossRef]
- Camilleri M. Leaky gut: mechanisms, measurement and clinical implications in humans. Gut 2019;68:1516-1526. [CrossRef]
- Hernandez G, Velasco N, Wainstein C, et al. Gut mucosal atrophy after a short enteral fasting period in critically ill patients. J Crit Care 1999;14:73-77. [CrossRef]
- Gorostiza E, Poullain MG, Marche C, et al. Effect of fasting and refeeding on the adaptation of the small intestine in rats. A model for physiopathologic studies. Gastroenterol Clin Biol 1985;9:790-796.
- Zhang JG, Sun XW, Gao P, et al. Food restriction alters villi morphology in obese rats: gut mechanism for weight regain? Exp Biol Med (Maywood) 2012;237:993-999.
- Fasano A. Gut permeability, obesity, and metabolic disorders: who is the chicken and who is the egg? Am J Clin Nutr 2017;105:3-4.
- Maes M, Kubera M, Leunis JC. The gut-brain barrier in major depression: intestinal mucosal dysfunction with an increased translocation of LPS from gram negative enterobacteria (leaky gut) plays a role in the inflammatory pathophysiology of depression. Neuro Endocrinol Lett 2008;29:117-124.
- Chadwick VS, Phillips SF, Hofmann AF. Measurements of intestinal permeability using low molecular weight polyethylene glycols (PEG 400). I. Chemical analysis and biological properties of PEG 400. Gastroenterology 1977;73:241-246. [CrossRef]
- Mathurin P, Deng QG, Keshavarzian A, Choudhary S, Holmes EW, Tsukamoto H. Exacerbation of alcoholic liver injury by enteral endotoxin in rats. Hepatology 2000;32:1008-1017. [CrossRef]
- Koenigsknecht MJ, Baker JR, Wen B, et al. In vivo dissolution and systemic absorption of immediate release ibuprofen in human gastrointestinal tract under fed and fasted conditions. Mol Pharm 2017;14:4295-4304.
- Clemente MG, De Virgiliis S, Kang JS, et al. Early effects of gliadin on enterocyte intracellular signalling involved in intestinal barrier function. Gut 2003;52:218-223. [CrossRef]
- Zhang L, Hou D, Chen X, et al. Exogenous plant MIR168a specifically targets mammalian LDLRAP1: evidence of cross-kingdom regulation by microRNA. Cell Res 2012;22:107-126. [CrossRef]
- Takahashi-Iwanaga H, Fujita T. Lamina propria of intestinal mucosa as a typical reticular tissue. A scanning electron-microscopic study of the rat jejunum. Cell Tissue Res 1985;242:57-66. [CrossRef]
- Komuro T. Fenestrations of the basal lamina of intestinal villi of the rat. Scanning and transmission electron microscopy. Cell Tissue Res 1985;239:183-188. [CrossRef]
- Komuro T, Hashimoto Y. Three-dimensional structure of the rat intestinal wall (mucosa and submucosa). Arch Histol Cytol 1990;53:1-21. [CrossRef]
- Takeuchi T, Gonda T. Distribution of the pores of epithelial basement membrane in the rat small intestine. J Vet Med Sci 2004;66:695-700. [CrossRef]
- Ensari A, Marsh MN. Exploring the villus. Gastroenterol Hepatol Bed Bench 2018 Summer;11:181-190.
- Azumi R, Morita K, Mizutani Y, Hayatsu M, Terai S, Ushiki T. Dynamics of basal lamina fenestrations in the rat intestinal villous epithelium in response to dietary conditions. Biomed Res 2018;39:65-74. [CrossRef]
- Morita K, Azumi R, Sato M, et al. Dynamic changes in basal lamina fenestrations in rat intestinal villous epithelium under high-fat diet condition. Biomed Res 2019;40:57-66. [CrossRef]
- Palay SL, Karlin LJ. An electron microscopic study of the intestinal villus. II. The pathway of fat absorption. J Biophys Biochem Cytol 1959;5:373-84.
- Casley-Smith JR. The identification of chylomicra and lipoproteins in tissue sections and their passage into jejunal lacteals. J Cell Biol 1962;15:259-277.
- Ohtani O. Three-dimensional organization of lymphatics and its relationship to blood vessels in rat small intestine. Cell Tissue Res 1987;248:365-374. [CrossRef]
- Chen YM, Zhang JS, Duan XL. Changes of microvascular architecture, ultrastructure and permeability of rat jejunal villi at different ages. World J Gastroenterol 2003;9:795-799. [CrossRef]
- Williams JM, Duckworth CA, Burkitt MD, Watson AJ, Campbell BJ, Pritchard DM. Epithelial cell shedding and barrier function: a matter of life and death at the small intestinal villus tip. Vet Pathol 2015;52:445-455.
- Morini S, Yacoub W, Rastellini C, Gaudio E, Watkins SC, Cicalese L. Intestinal microvascular patterns during hemorrhagic shock. Dig Dis Sci 2000;45:710-722. [CrossRef]
- Chiu CJ, McArdle AH, Brown R, Scott HJ, Gurd FN. Intestinal mucosal lesion in low-flow states. I. A morphological, hemodynamic, and metabolic reappraisal. Arch Surg 1970;101:478-83. [CrossRef]
- Dixon JB. Mechanisms of chylomicron uptake into lacteals. Ann N Y Acad Sci 2010;1207 Suppl 1(Suppl 1):E52-57.
- Bischoff SC, Barbara G, Buurman W, et al. Intestinal permeability--a new target for disease prevention and therapy. BMC Gastroenterol 2014;14:189. [CrossRef]
- Fasano A. Zonulin and its regulation of intestinal barrier function: the biological door to inflammation, autoimmunity, and cancer. Physiol Rev 2011;91:151-175. [CrossRef]
- Krug SM, Günzel D, Conrad MP, et al. Charge-selective claudin channels. Ann N Y Acad Sci 2012;1257:20-28.
- Garrido-Urbani S, Bradfield PF, Imhof BA. Tight junction dynamics: the role of junctional adhesion molecules (JAMs). Cell Tissue Res 2014;355:701-715. [CrossRef]
- Luissint AC, Nusrat A, Parkos CA. JAM-related proteins in mucosal homeostasis and inflammation. Semin Immunopathol 2014;36:211-226. [CrossRef]
- Man AL, Bertelli E, Rentini S, et al. Age-associated modifications of intestinal permeability and innate immunity in human small intestine. Clin Sci (Lond) 2015;129:515-527. [CrossRef]
Figure 1.
Mucosal and portal-vein serum appearance of the jejunum and ileum in FaF rats. Starvation (0 h) atrophied the villi and exposed the crypt mouths. 0 h: starvation for 48 h; 2 h, 3 h, 4 h, 5 h, 6 h: time intervals of FaF. After feeding, the mucosa exhibited enhanced absorptive ability, peaking at the 2- hour mark (large amount of lipids were absorbed in the mucosa, which appeared white in color, with the thickening of portal-vein serum).
Figure 2.
Aerial view of the jejunal mucosa in FaF rats under scanning electron microscopy. Villous-tip openings (A–F) were dominant, especially during the early stage of refeeding. Some villous tips opened due to loss of the villous cap (G, H); H, local magnification of the box in G. Subepithelial space can be seen in the villi with fallen caps (I–L, arrow). Note the globular cells in the subepithelial space (arrowheads). 2 h, 3 h, 4 h, 5 h, 6 h: time intervals of FaF; HFD: high-fat diet.
Figure 3.
Subepithelial space of villi from FaF rats. Villous-tip openings (arrows) and subepithelial space (asterisks) were remarkable in both HFD (A) and chow (B) rats. The basal portions of lost ECs (arrows) and the lamina propria were compressed by the subepithelial space, which connected the enteric lumen with the disconnected lacteal walls (C, D, arrowheads) or the submucosal lymphatic sinus (E, F, arrows). Jejunum, 8–10 cm or 34–36 cm (D) to pyloric sphincter. A–D: H&E staining; E–F: Oil Red O staining. Bar = 50 µm. HFD, high-fat diet; FaF, fasting–refeeding; 2 h, 3 h, 4 h: time intervals of FaF.
Figure 4.
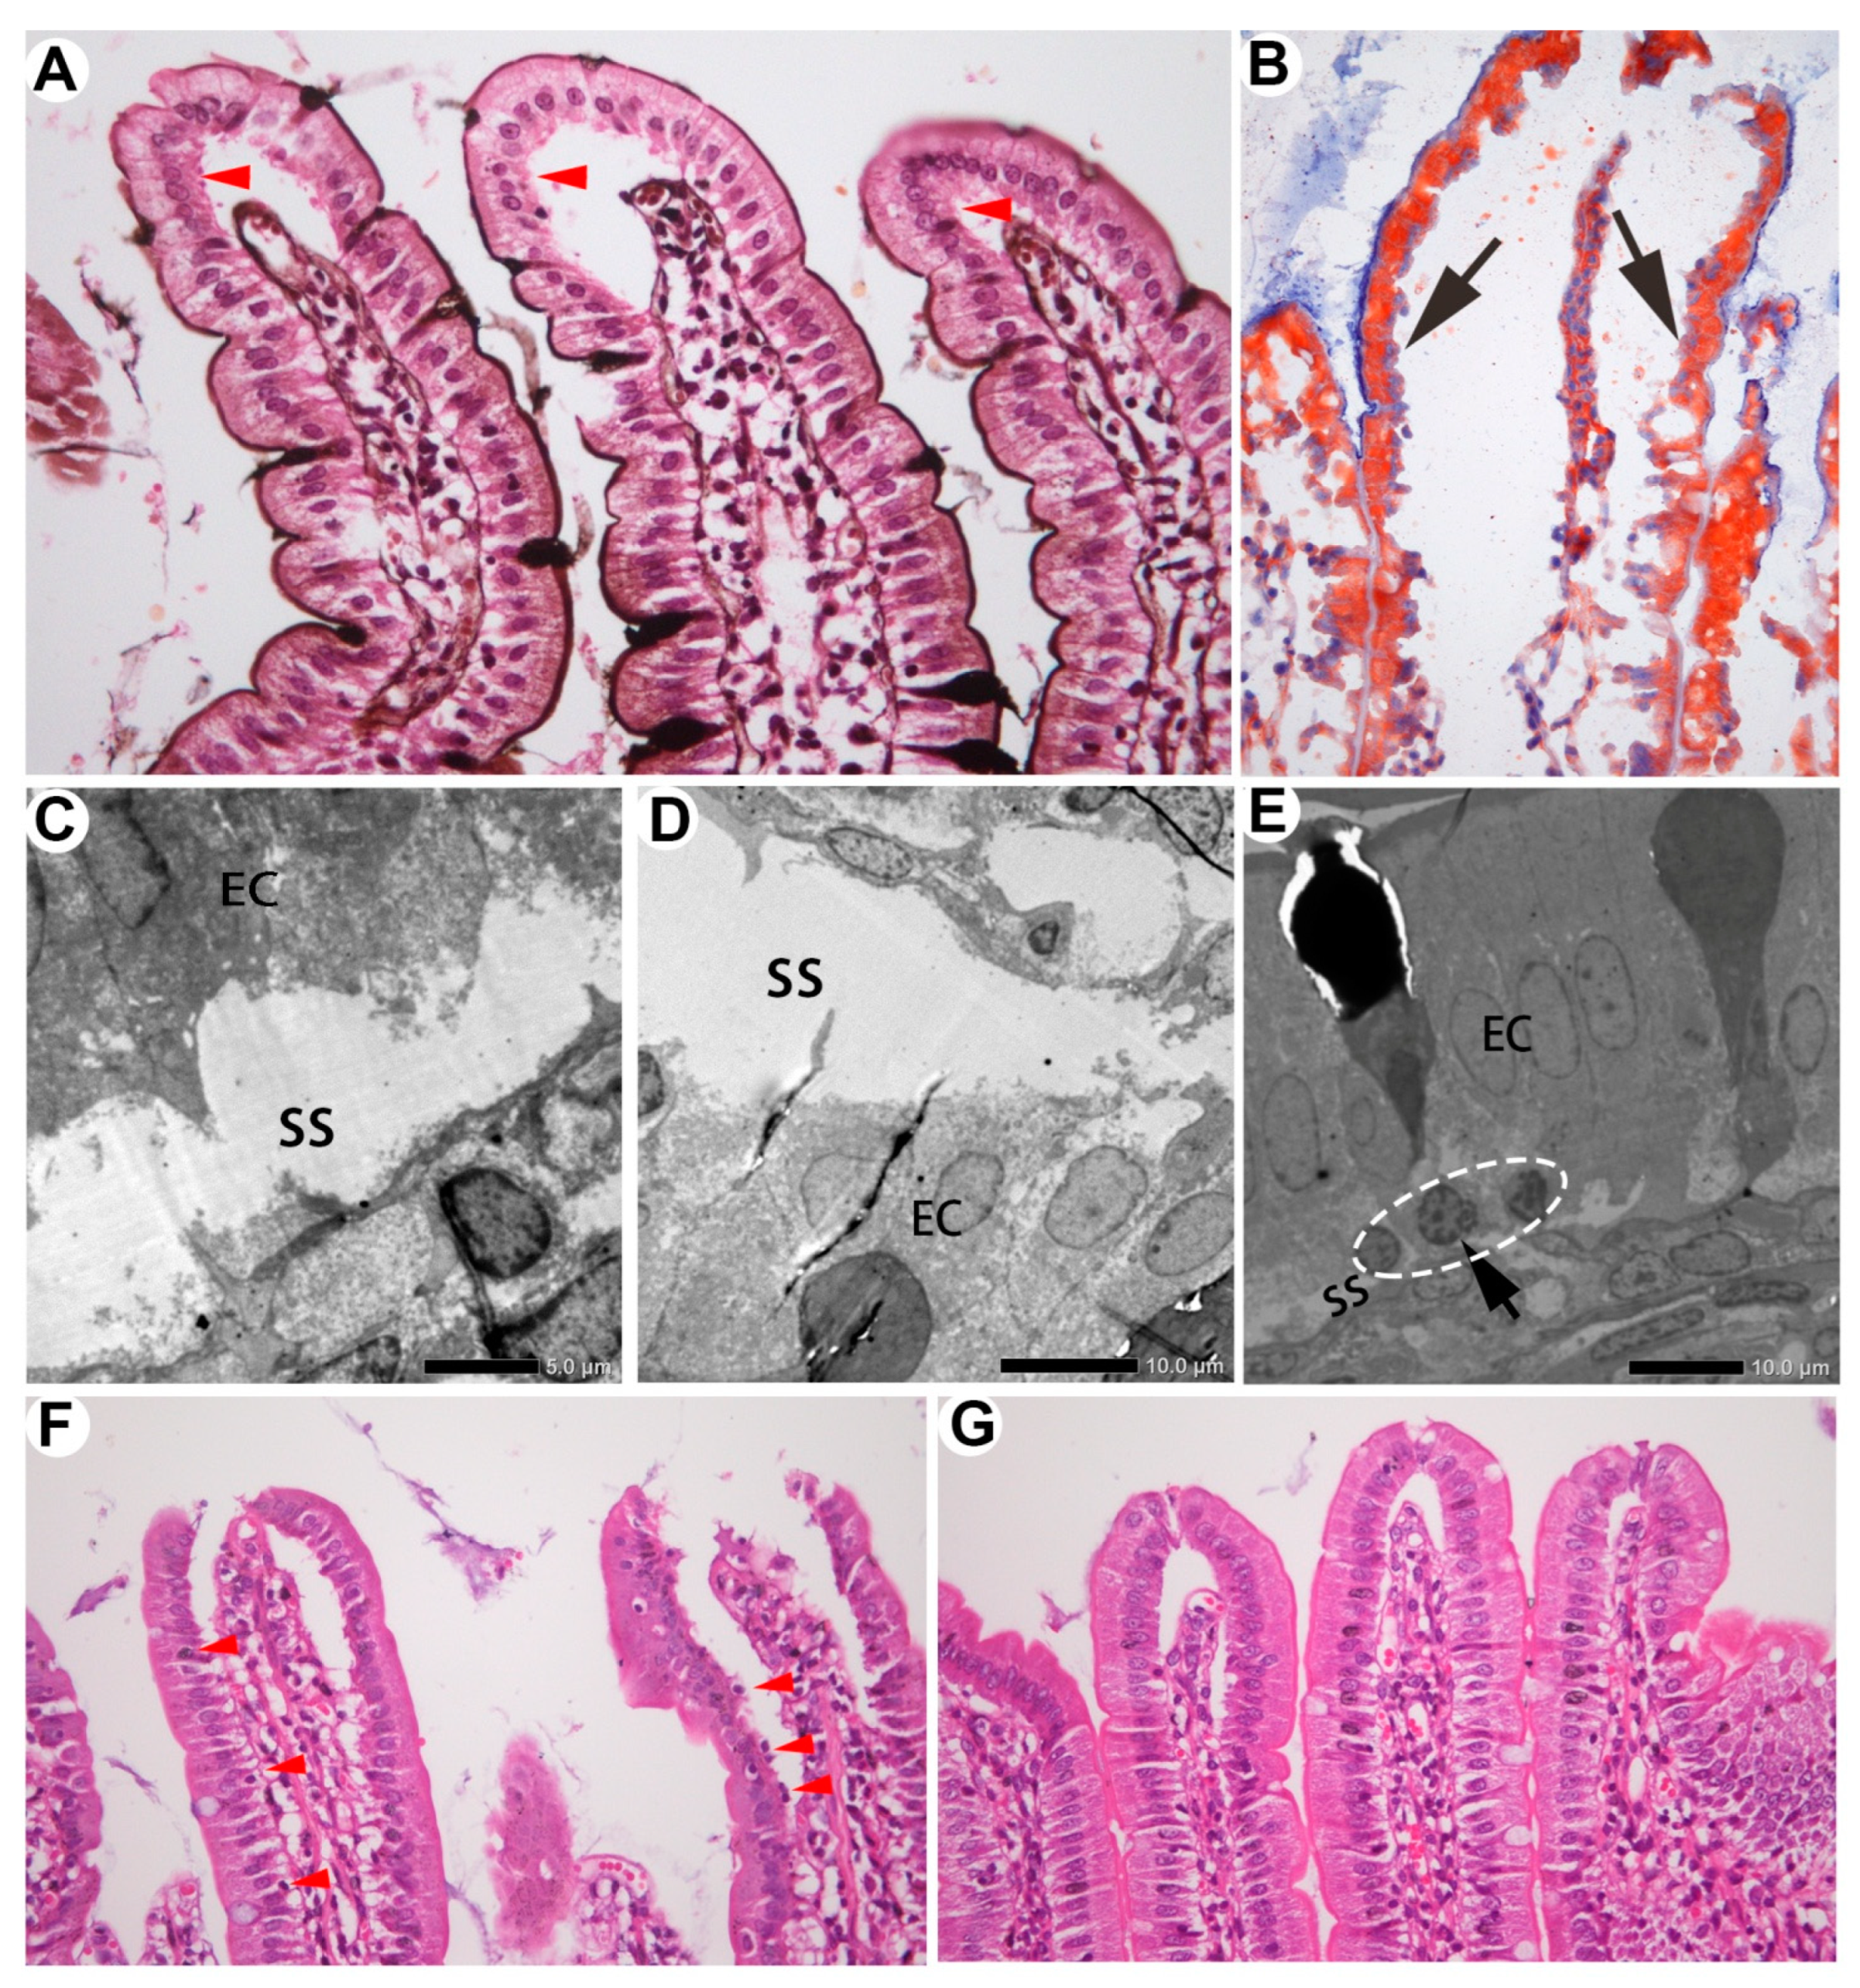
Two kinds of subepithelial space in the villi. The space created by blood drainage was localized around the villous tips, with the lower part of EC cytoplasm intact (A, arrowheads). PASM staining indicates the basement membrane. The space derived from absorption extended throughout the villi, with infranuclear portions of cytoplasm lost (B–D, arrow). Oil Red O tracing (B); TEM (C, D). Subepithelial mononuclear cells were visible in the absorptive space (E, dashed circle; F, arrowheads) but not in the blood drainage space (G).
Figure 4.
Two kinds of subepithelial space in the villi. The space created by blood drainage was localized around the villous tips, with the lower part of EC cytoplasm intact (A, arrowheads). PASM staining indicates the basement membrane. The space derived from absorption extended throughout the villi, with infranuclear portions of cytoplasm lost (B–D, arrow). Oil Red O tracing (B); TEM (C, D). Subepithelial mononuclear cells were visible in the absorptive space (E, dashed circle; F, arrowheads) but not in the blood drainage space (G).
Figure 5.
The mucous layer temporarily prevented potentially harmful substances from entering the absorption channel through the villous tips.
Figure 5.
The mucous layer temporarily prevented potentially harmful substances from entering the absorption channel through the villous tips.
Figure 6.
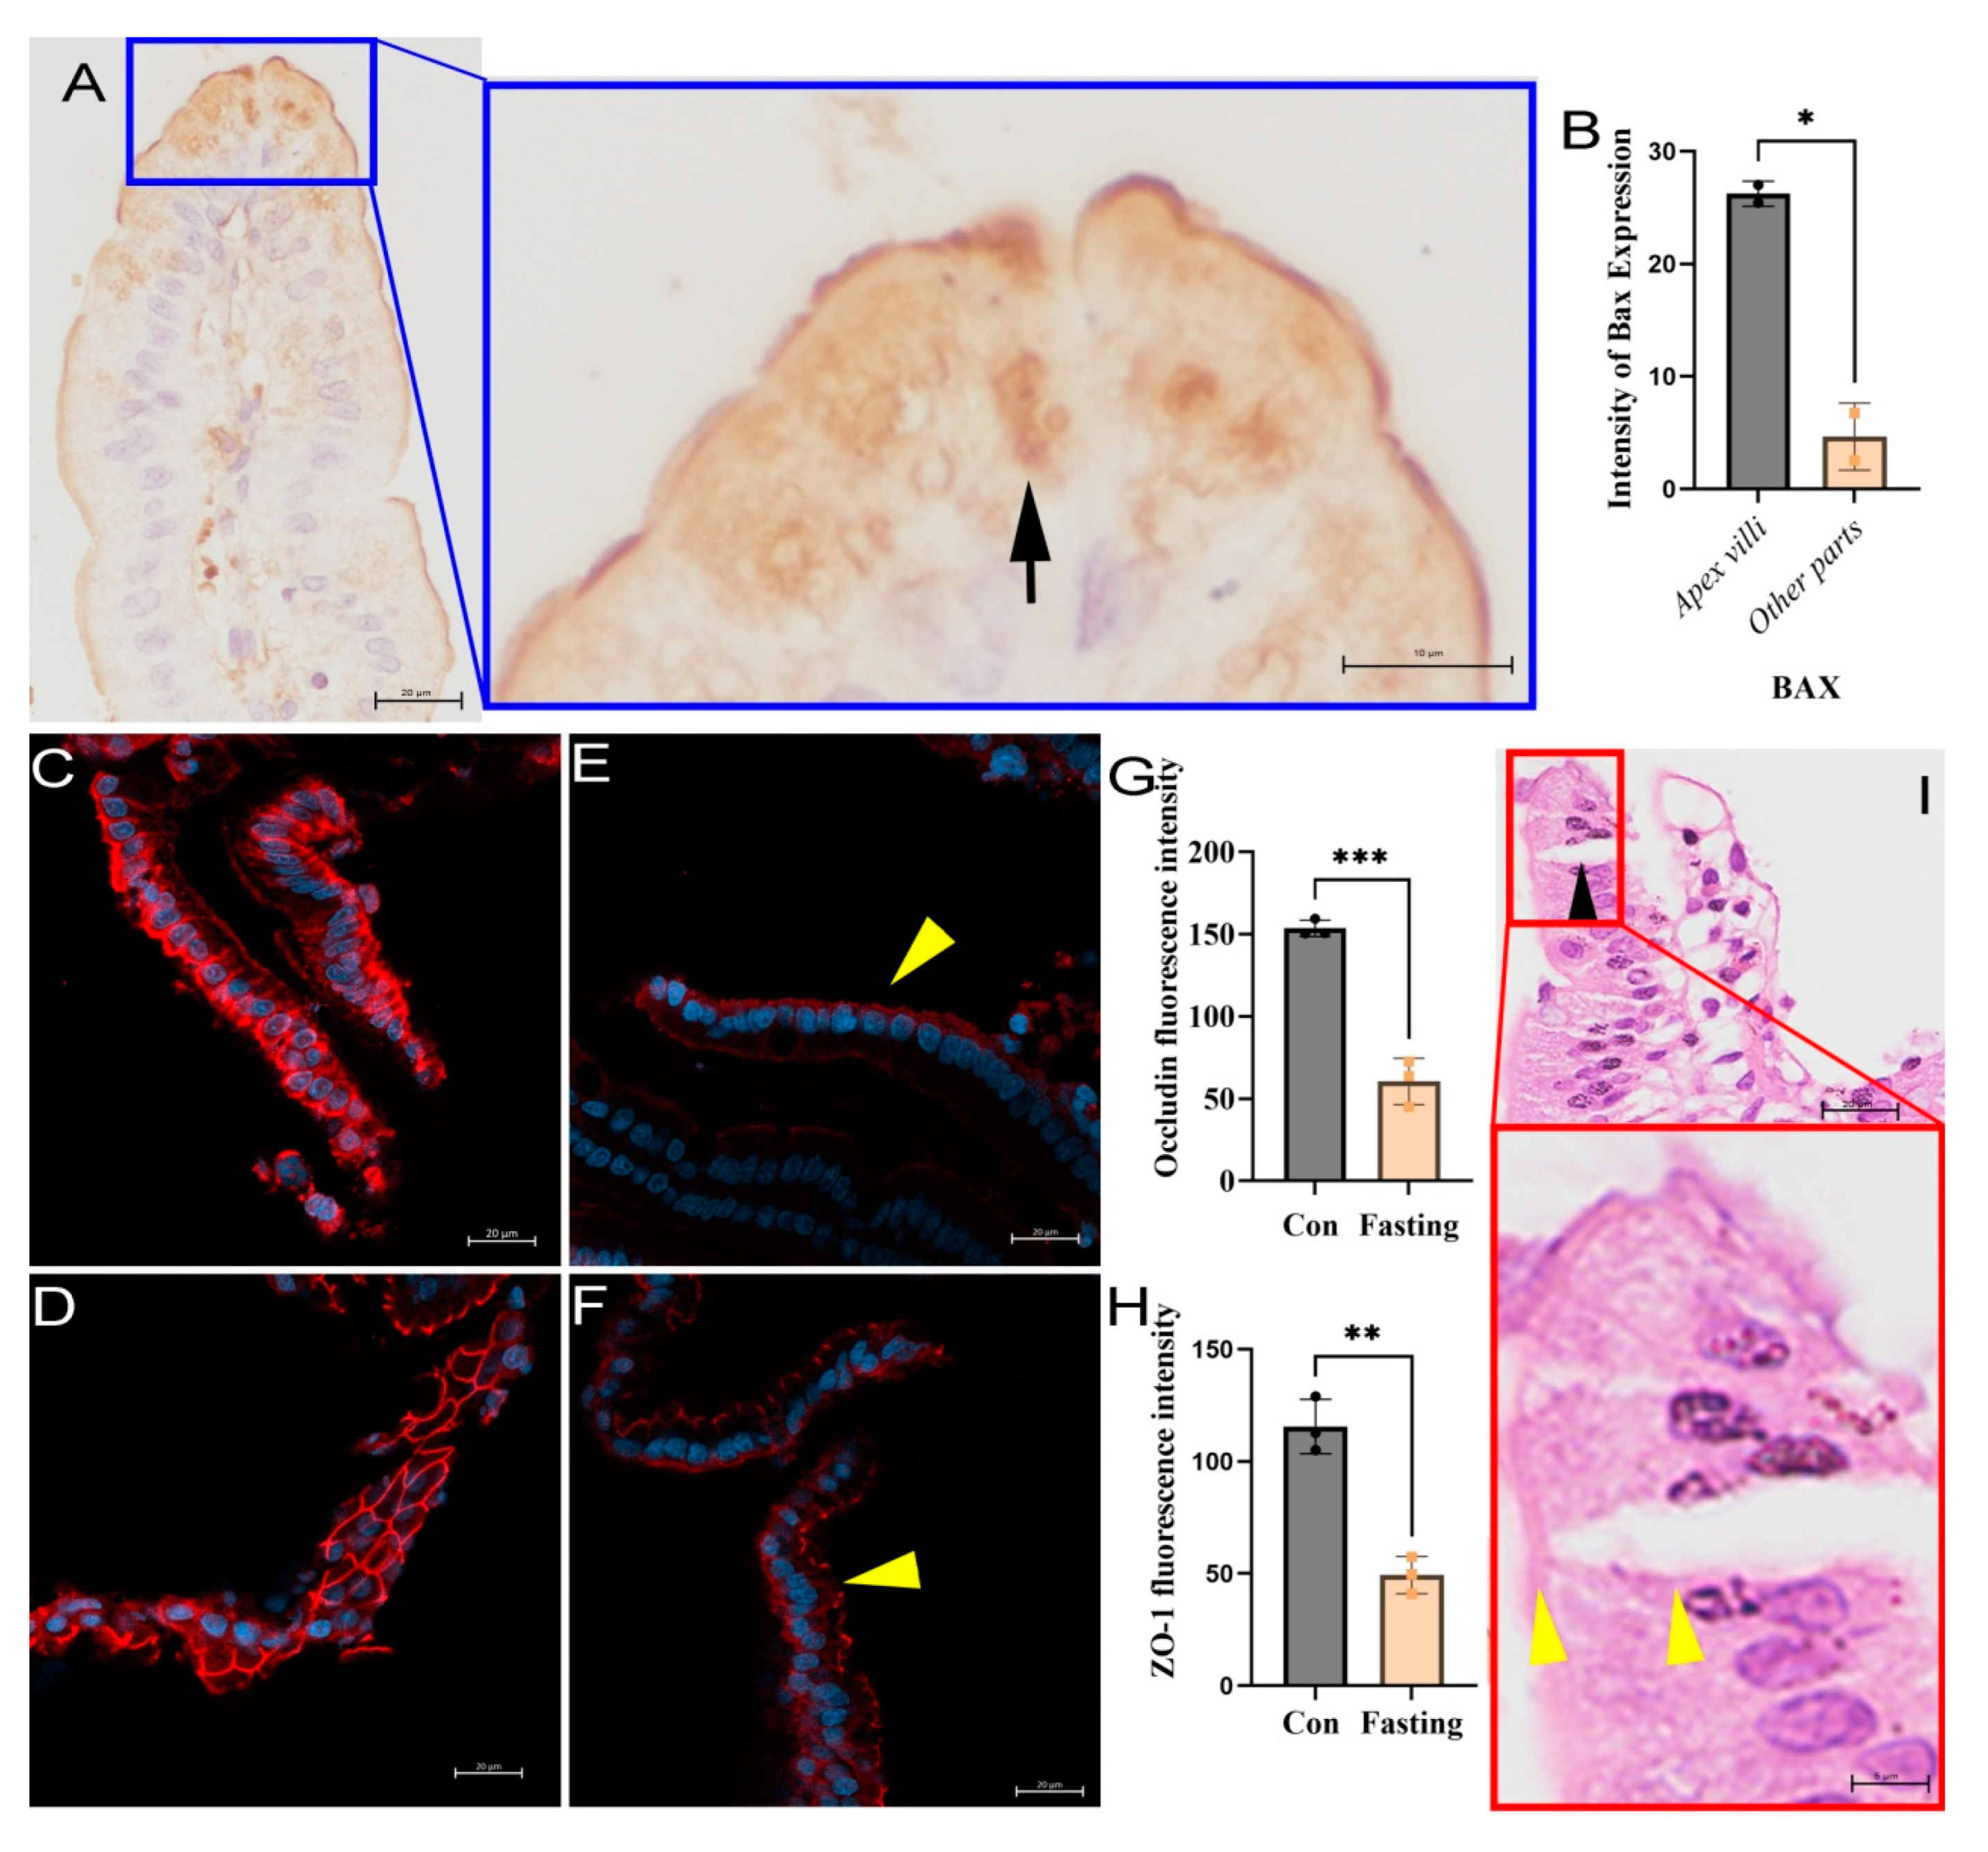
Channel absorption of villi related to apoptosis and tight junctions loss in the epithelium. (A) The expression of Bax protein in the tip cells of the villi was significantly higher than that in other parts of the villi (arrow), P < 0.05. (B) Immunofluorescence staining showed that occludin (C) and ZO-1 (D) were strongly expressed in normal villi epithelial cells, while they were downregulated after 48 h fasting, as shown in the results for occludin (E) and ZO-1 (F), with P < 0.001 for occludin and P < 0.01 for ZO-1 (G and H, respectively). Meanwhile, occludin and ZO-1 were lost on the lateral sides of intestinal cells, and were located mainly at the microvilli of villi (arrowheads in D and E). Nuclei were counterstained with DAPI and observed via confocal observation, scale bar = 20 μm. (I) Hematoxylin & eosin staining showed lateral splitting of the small intestinal villous epithelium in starved rats, with only the microvilli connected (arrowheads).
Figure 6.
Channel absorption of villi related to apoptosis and tight junctions loss in the epithelium. (A) The expression of Bax protein in the tip cells of the villi was significantly higher than that in other parts of the villi (arrow), P < 0.05. (B) Immunofluorescence staining showed that occludin (C) and ZO-1 (D) were strongly expressed in normal villi epithelial cells, while they were downregulated after 48 h fasting, as shown in the results for occludin (E) and ZO-1 (F), with P < 0.001 for occludin and P < 0.01 for ZO-1 (G and H, respectively). Meanwhile, occludin and ZO-1 were lost on the lateral sides of intestinal cells, and were located mainly at the microvilli of villi (arrowheads in D and E). Nuclei were counterstained with DAPI and observed via confocal observation, scale bar = 20 μm. (I) Hematoxylin & eosin staining showed lateral splitting of the small intestinal villous epithelium in starved rats, with only the microvilli connected (arrowheads).
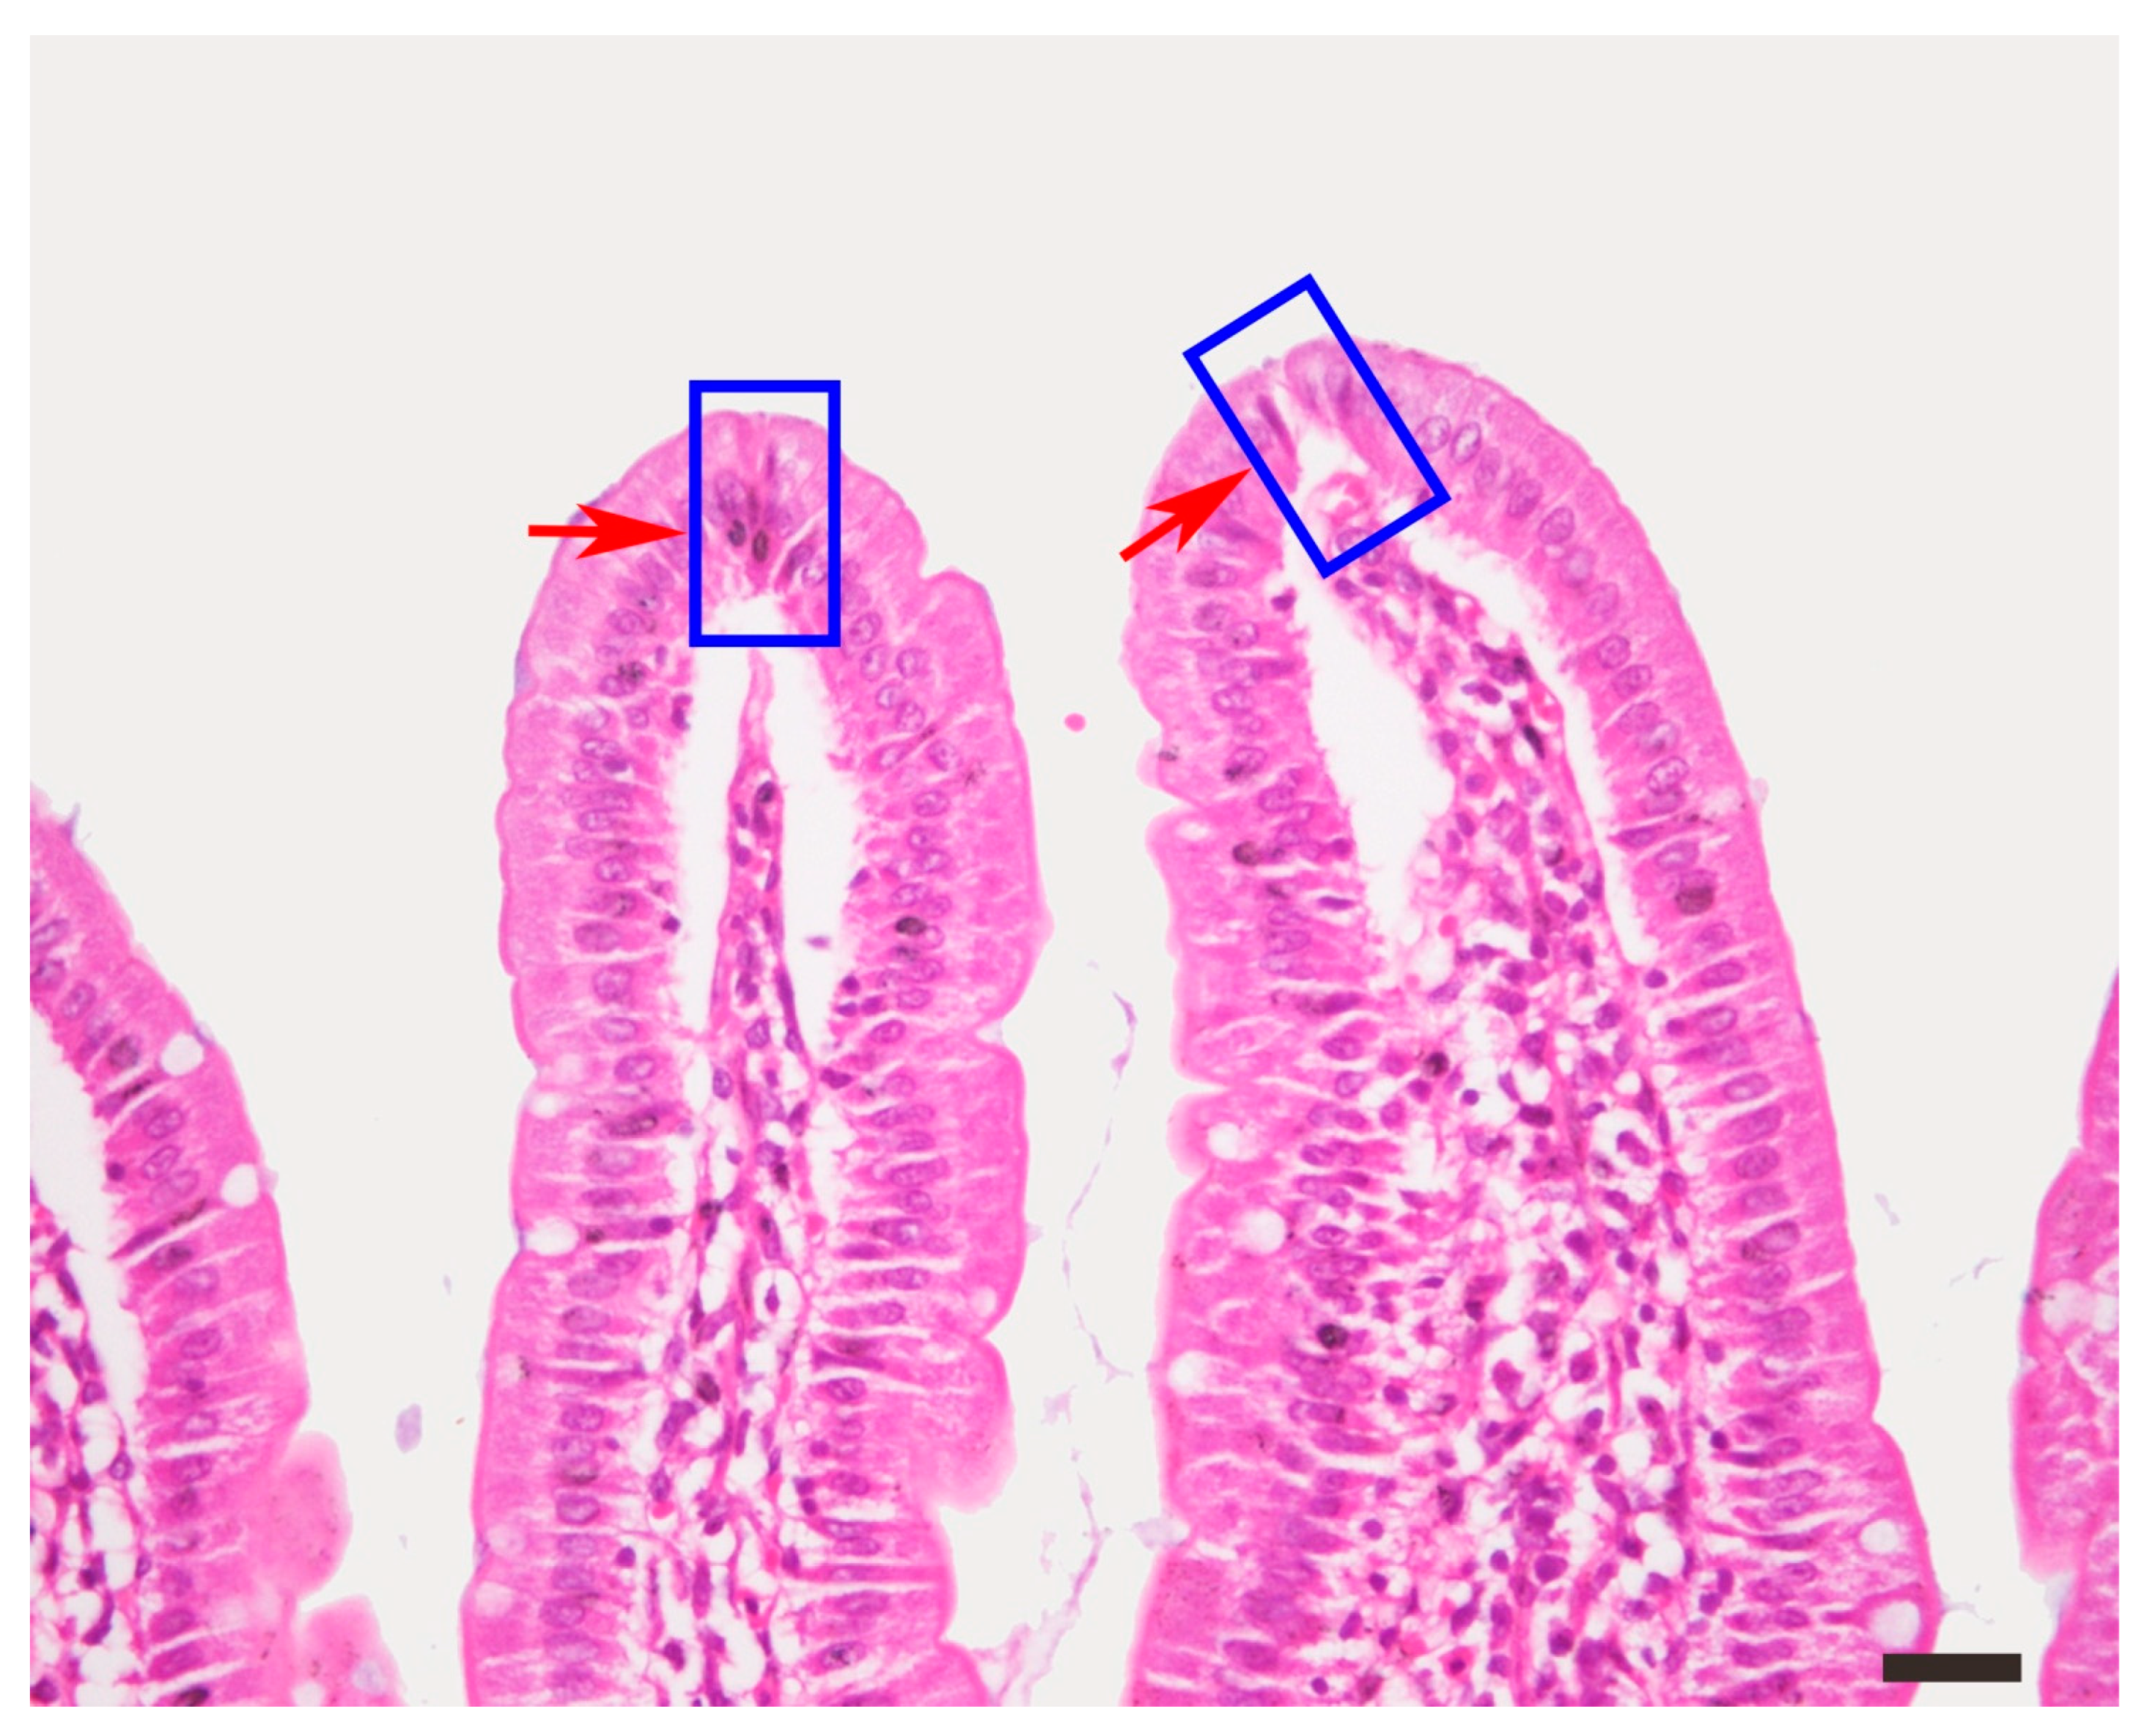
Figure S1.
The tip cells of intestinal villi exhibited apoptosis, a condensed nucleus and cytoplasm, or shedding, as shown within the square frame. HE staining, bar = 50 μm.
Figure S1.
The tip cells of intestinal villi exhibited apoptosis, a condensed nucleus and cytoplasm, or shedding, as shown within the square frame. HE staining, bar = 50 μm.
Figure 7.
Unrestricted channel absorption in obese rats. Animals were grouped into high (defined as obesity), intermediate, and low Lee’s index groups. Obese rats exhibited higher HFD intake (A, red dots). Tip openings were visible (B–D, arrows) and subepithelial space was dominant in individuals with high Lee’s indices compared with those with low Lee’s indices (C, D, asterisks). Porous capillary walls provided communication between the subepithelial space and capillaries (E, F, arrows). Hole diameter was about 1.0–2.0 μm. SS, subepithelial space; cap, capillary.
Table 1.
Modeling of nutritional obesity.
Table 1.
Modeling of nutritional obesity.
| |
N |
Body Weight (g) |
Body Length (cm) |
Lee’s Index |
| Chow |
40 |
626.06 ± 42.39 a
|
26.94 ± 0.63 a
|
0.317 ± 0.007 a
|
| High Lee’s |
15 |
856.97 ± 37.22 b
|
27.55 ± 0.35 b
|
0.345 ± 0.002 b |
| Middle Lee’s |
70 |
759.40 ± 57.85 c
|
27.45 ± 0.69 b
|
0.332 ± 0.006 c |
| Low Lee’s |
15 |
671.97 ± 40.14 d
|
27.53 ± 0.48 b
|
0.318 ± 0.004 d
|
Table 2.
Daily diet and energy intake of HFD rats.
Table 2.
Daily diet and energy intake of HFD rats.
| |
N |
Diet (g/d) |
Energy (kcal/d) |
HFD (g/d) |
Chow (g/d) |
HFD/Chow |
| Chow |
40 |
31.49 ± 2.94 a
|
99.50 ± 9.29 a
|
— |
3.82 ± 2.54 |
— |
| HFD |
100 |
23.64 ± 3.29 b
|
116.64 ± 15.61 b
|
|
|
|
|
High Lee’s
|
15 |
26.06 ± 2.84 †
|
129.06 ± 12.49 †
|
19.30 ± 2.46 †
|
6.76 ± 2.99 †
|
4.27 ± 3.71 †
|
|
Middle Lee’s
|
70 |
23.83 ± 3.09 ‡
|
117.24 ± 14.91 ‡
|
17.33 ± 3.07 ‡
|
6.50 ± 3.10 †
|
3.62 ± 2.67 †
|
|
Low Lee’s
|
15 |
20.36 ± 1.86 §
|
101.44 ± 7.58 §
|
15.33 ± 1.67 §
|
5.04 ± 2.32 †
|
4.51 ± 3.38 †
|
|
Disclaimer/Publisher’s Note: The statements, opinions and data contained in all publications are solely those of the individual author(s) and contributor(s) and not of MDPI and/or the editor(s). MDPI and/or the editor(s) disclaim responsibility for any injury to people or property resulting from any ideas, methods, instructions or products referred to in the content. |
© 2025 by the authors. Licensee MDPI, Basel, Switzerland. This article is an open access article distributed under the terms and conditions of the Creative Commons Attribution (CC BY) license (http://creativecommons.org/licenses/by/4.0/).