Submitted:
03 January 2025
Posted:
06 January 2025
You are already at the latest version
Abstract
Understanding brain oxygen metabolism is crucial for evaluating overall health, par-ticularly in high-stress medical situations such as cardiac arrest and cardiopulmonary resuscitation (CPR). This study focuses on two key indicators of brain oxygen metabo-lism: the cerebral metabolic rate of oxygen (CMRO2) and the oxidation state of redox cytochrome c oxidase (rCCO). Using advanced techniques like hyperspectral near-infrared spectroscopy (hNIRS) and laser doppler flowmetry (LDF), we have con-ducted a comprehensive analysis of their relationship in pigs during and after cardiac arrest and CPR. We investigated both the entire duration of these experiments and specific time intervals, providing a detailed view of how these metrics interact. The data reveals non-linear relationship between rCCO and CMRO2. Our findings contribute to a deeper understanding of how the brain manages oxygen during critical episodes, po-tentially guiding future interventions in neurological care and improving outcomes in emergency medical settings.
Keywords:
near-infrared spectroscopy
; NIRS
; brain
; neuronal activity
; cardiac arrest
; resuscitation
; CPR
; hyperspectral near-infrared spectroscopy
; microvasculature
; laser doppler flowmetry
; diffuse correlation spectroscopy
; cerebral blood flow
; cerebral metabolic rate of oxygen
; redox cytochrome c oxidase
; hemodynamic model
1. Introduction
Out-of-hospital cardiac arrest is a significant medical emergency, affecting more than 350,000 individuals annually in the United States. Despite extensive advancements in emergency care, the survival rates for these events remain low: less than 23% of patients who experience out-of-hospital cardiac arrest survive long enough to be admitted to the hospital, and only about 10% ultimately survive to hospital discharge [1]. Among those who do survive, brain injury remains a leading cause of morbidity and mortality, with over two-thirds of survivors enduring irreversible neurological damage during their hospital stay. These dire outcomes highlight the urgent need for a deeper understanding of the physiological changes in the brain during and after cardiac arrest.
The brain’s vulnerability to oxygen deprivation during cardiac arrest makes it particularly susceptible to ischemic injury. Although the brain comprises only 2% of body weight, it requires 15–20% of total cardiac output to sustain homeostasis [2]. Any disruption in oxygen delivery can lead to severe consequences, including secondary brain injury in conditions such as ischemia, severe traumatic brain injury, and sub-arachnoid hemorrhage [3]. Post-cardiac arrest brain injury is the leading cause of mortality in patients revived from cardiac arrest and the primary cause of long-term disability in survivors [4]. Cardiac arrest (CA) and cardiopulmonary resuscitation (CPR) introduce significant fluctuations in brain oxygen metabolism, posing a severe challenge to preserving cerebral function during these critical events.
Brain function relies heavily on the precise balance between its metabolic needs, the adequate delivery of oxygen and nutrients, and the efficient removal of cellular waste. Achieving this balance necessitates constant regulation of cerebral blood flow (CBF) [5]. Rapid and precise restoration of CBF and oxygenation is crucial for pre-serving brain function, yet the complex interactions between cerebral perfusion, oxygen metabolism, and neuronal survival during these critical moments are not fully understood. Monitoring cerebral perfusion parameters—such as cerebral tissue oxygen saturation, cerebral blood volume, CBF, the cerebral metabolic rate of oxygen (CMRO2), and redox cytochrome c oxidase (rCCO) activity—is essential for improving patient outcomes. These metrics offer vital insights into the brain's oxygen metabolism, a process critical for maintaining cerebral health, especially under the stress conditions of cardiac arrest.
Understanding the relationship between CMRO2, mitochondrial activity, and oxygen delivery is crucial for assessing cerebral health and function. Mitochondrial activity, particularly involving rCCO, plays a key role in oxygen consumption within the electron transport chain, with its oxidation state influenced by factors such as oxygen availability and electron flow [3, 6-8]. This understanding, provides insight into neurovascular coupling and how these processes are altered in pathological conditions. It is a key step in neurocritical care, as it can guide interventions aimed at preserving brain function and reducing neurological damage.
Advancements in measurement techniques have enhanced our ability to quantify rCCO, with hyperspectral near-infrared spectroscopy (hNIRS) providing detailed in-sights into its activity. This advancement is critical for understanding how rCCO activity correlates with oxygen delivery and consumption. However, not everyone has access to these sorts of technologies. To overcome this issue, mathematical models play a huge role. Mathematical models have been employed to study the interactions among CBF, CMRO2, and rCCO, providing a framework to understand these relation-ships more comprehensively. These models help in analyzing how changes in one parameter can affect the others, offering deeper insights into neurovascular coupling and alterations in pathological conditions.
Previous studies have explored the coupling between oxygen consumption, mitochondrial function, and oxygen delivery in the brain. For instance, research utilizing a multimodal NIRS-MRI approach has quantified the interplay between CBF, CMRO2, and the redox state of rCCO in response to physiological challenges such as hypercapnia and varying oxygenation levels [9]. This research has revealed that the relationship between CBF and rCCO oxidation is dynamic and can vary depending on the type of physiological challenge, thereby providing valuable insights into the complex dynamics of neurovascular coupling under different conditions [9].
Some researchers employed advanced imaging techniques to probe these relationships with greater precision. For example, functional MRI (fMRI) studies in macaques have measured laminar ∆CMRO2 in the primary visual cortex during visual stimulation, showing that ∆CMRO2 peaks in the middle cortical layers, which corresponds with autoradiographic measures of metabolism. This study also highlighted a strong relationship between the peak CMRO2 and the highest cytochrome oxidase in-tensity, further refining our understanding of oxygen metabolism in the brain [10].
In addition to these studies, research using an hNIRS-DCS (Diffuse Correlation Spectroscopy) setup has investigated the interdependence of CBF, CMRO2, and rCCO during minor perturbations such as hypoxia [11]. These studies have focused on the brain's responses to less extreme conditions, offering a nuanced understanding of how these critical variables interact in relatively stable environments.
In the present study, we analyze the data obtained invasively from a pig model of cardiac arrest to examine the intricate relationships between rCCO, CMRO2, and CBF during CA and CPR. We used laser doppler flowmetry (LDF) to measure CBF, and intracerebral hNIRS to assess changes in oxyhemoglobin (HbO2), deoxyhemoglobin (HHb), and rCCO. These measurements pro-vided insights into variations in cerebral blood volume (CBV), rCCO, and CMRO2 throughout the critical phases of cardiac arrest and resuscitation. By investigating these relationships in a model that closely mimics the human condition, we aimed to deepen understanding of the brain's metabolic responses to such critical events. Ultimately, the findings of this research could contribute to the development of more effective strategies for managing brain injury in cardiac arrest patients, potentially im-proving survival rates and long-term neurological outcomes.
In our previous work [12], we employed the inverse of a dynamic hemometabolic model (CHS) [13] to analyze hNIRS data collected during cardiac arrest and CPR in a pig model. This study allowed us to measure critical physiological parameters, including the rate of oxygen diffusion from blood to tissue, arteriole and venule volume fractions, and the Fåhraeus factor. By identifying significant differences between baseline and post-cardiac arrest values, we gained insights into the microvascular and metabolic perturbations that occur during these critical events. The findings demonstrated the utility of the hemometabolic model in capturing dynamic changes in cerebral oxygenation and blood flow, reinforcing its relevance for studying cerebral responses to cardiac arrest. Building upon this foundation, the present study delves deeper into the relationships between CMRO2, CBF, and rCCO activity. In this study we continue using the CHS model to calculate the absolute values of CMRO2 and CBF.
2. Materials and Methods
2.1. Cardiac Arrest and CPR Setup
Ten female pigs (6–9 week old, 33–39kg) were selected for this study to eliminate the influence of sex differences in susceptibility to ventricular fibrillation (VF) and because female pigs typically exhibit a higher rate of return of spontaneous circulation (ROSC). The animals were fasted overnight before being sedated with an intramuscular injection of ketamine (20 mg/kg; "Ketalean," Bimeda-MTC Animal Health, Cambridge, ON, Canada). After sedation, the pigs were intubated and maintained under anesthesia with continuous isoflurane (1–3% mixed with oxygen). Ventilation was supported using an Ohmeda ventilator (Ohio Medical Products, Madison, WI, USA) with settings adjusted to stabilize physiological parameters such as pH (7.35–7.45), PCO2 (35–45 mm Hg), and PO2 (>100 mm Hg). To prevent hypovolemia, normal saline (NS) was administered intravenously through a cannulated ear vein at a rate of 2–4 mL/kg/h. Electrocardiogram (ECG) leads were attached, and defibrillation patches (Zoll Medical, Inc., Chelmsford, MA, USA) were applied to monitor the cardiac activity. Aortic and right atrial pressures were continuously monitored via femoral artery catheters (Mikro-Tip Transducer; Millar Instruments, Houston, TX, USA), providing real-time data to detect the onset of cardiac arrest (VF) [14]. Figure 1 shows the experimental setup, including the positioning of the automatic compression device on the left and the hNIRS system on the right.
All experimental protocols adhered to the guidelines for reporting in vivo experiments [15]. Ethical approval was obtained from the Animal Care Committee of St. Michael’s Hospital (Toronto, ON, Canada), and all procedures were conducted in accordance with the Guide for the Care and Use of Laboratory Animals as outlined by the U.S. National Institutes of Health (NIH Publication number 85–23, revised 1996).
2.2. Resuscitation Protocol
Before inducing VF, the administration of anesthetic gases was halted for 15 minutes, and the animals were sedated with propofol and fentanyl to minimize any anti-arrhythmic effects from the anesthetic gases. VF was then induced by burst pacing at a frequency of at least 300 Hz with a 10 mV pulse, using a pacing catheter (AM-2200, AD Instruments, Castle Hill, Australia) inserted into the right ventricle. CPR was initiated after 2 minutes of VF, consisting of chest compressions at a rate of 100 per minute using an automatic piston device (LUCAS; Physio-Control Inc./Jolife AB, Lund, Sweden). Mechanical ventilation was maintained at a rate of 10 breaths per minute with pure oxygen using the Ohmeda ventilator. An intravenous bolus of 0.015 mg/kg of epinephrine in NS (0.1 mg/mL concentration) was administered after 2 minutes of CPR, followed by a 10 mL NS flush, with additional doses given every 4 minutes for a total of three doses. Additionally, a continuous infusion of NS equivalent to the volume of epinephrine was started after 2 minutes of CPR and continued for a total duration of 12 minutes.
2.3. Cerebral hNIRS and LDF Setup and Measurements
We used a custom-built hyperspectral near-infrared spectroscopy (hNIRS) system [16,17] to invasively measure the absolute concentrations of HbO2, HHb, and the differential signal between oxidized and reduced cytochrome c oxidase (ΔrCCO) in the brain tissue. With the hNIRS optodes were placed on the dura mater at a 20 mm interoptode distance/through the holes drilled in the skull. With a differential path length factor (DPF) of 5 and a 20 mm optode spacing, the average optical path length was calculated to be approximately 100 mm, with a penetration depth of about 16 mm [17,18,19], chosen to minimize interference from the dura mater, which is approximately 1 mm thick. The hNIRS system IIed a highly sensitive spectrometer (AvaSpec, Avantes, Lafayette, CO, USA) with a custom 0.5-mm slit that captured spectral data in the 700–1000 nm wavelength range (Figure 1). The hNIRS diffusion model was applied to analyze the data, allowing the determination of changes in cerebral HbO2, HHb, and ΔrCCO [14]. The dynamic changes in chromophore concentrations were extracted using a multi-step data-fitting algorithm, based on an analytical solution to the diffusion equation for a semi-infinite medium, incorporating an extrapolated boundary condition. This algorithm provided tissue concentrations of HbO2, HHb, and ΔrCCO. The total tissue hemoglobin concentration ([tHB]) in μM per liter and tissue oxygen saturation (tSO2) in % were computed using the following equation:
[tHB] = [HbO2] + [HHb],
tSO2 = [HbO2]/ ([tHB]) × 100%.
Cerebral blood flow velocity index (CBFi) was measured using a laser Doppler flowmeter (LDF) (Periflux; Perimed Inc., Ardmore, PA, USA). The LDF probe was placed on the dura mater through a hole drilled in the pig’s skull. Throughout the experiments, mean aortic pressure and right atrial pressure were continuously monitored using catheters equipped with micro-manometer tips.
2.4. Analysis Methods
The data analysis was conducted using MATLAB R2023a (MathWorks, Natick, MA, USA). We analyzed data during periods of cardiac arrest or ventricular fibrillation (VF), CPR, and, in cases where it occurred, ROSC. Each of these phases was examined individually to assess physiological responses under different conditions. Outliers were systematically identified and excluded to ensure the accuracy and reliability of the results.
The analysis included the use of hNIRS diffusion modeling [16-21] to assess cerebral oxygenation, deoxygenation, and rCCO levels.
The absolute values of CBF and the CMRO2were calculated using the nonlinear version of the Coherent Hemodynamic Spectroscopy (CHS) model [22]. This approach integrates experimental data obtained from hNIRS and LDF, allowing for accurate assessment during significant physiological perturbations, such as cardiac arrest and CPR [12].
CBF was derived from the model’s fitted capillary blood flow factor (BFf ) and the cerebral blood flow index (CBFi) measured by LDF. The velocity of capillary blood flow () was calculated as:
Using the capillary cross-sectional area (3.85×10⁻⁷ cm2), the brain tissue density (1.081 g/ml) and the total volume of capillaries in the brain tissue (2.7%), the absolute CBF per 100 g of brain tissue was computed as:
This value falls within accepted ranges reported in similar studies, supporting its validity. However, further validation is part of our ongoing work [23-26].
CMRO2 was calculate using the equation called “the Fick’s principle” [27],:
where Sa and Sv represent the arterial and venous oxygen saturations, respectively and k is a factor describing the amount of O2 bound to hemoglobin when completely saturated (1.39 ml of O2 per g Hb). CMRO2 is expressed in unit of ml O2 ∕100 g∕ min.
Venus’s oxygen saturation was calculated using the CHS model [13]. To do so, the non-linear version of this model was used [12,22]. The results closely matched the equations suggested by the authors [27], as follows:
We investigated possible nonlinearities among the variables of interest, rCCO and CMRO2, rCCO and CBF, and CMRO2 and CBF using the power law:
where k was a scaling factor, α > 0 was the power exponent, X and Y were either the change in CMRO2, CBF or rCCO. In the cases of the nonlinear relationships α was significantly different from 1.
2.5. Statistical Analysis
We applied statistical techniques to ensure the robustness and reliability of identifying relationships among CBF vs. CMRO₂, CBF vs. rCCO, and CMRO₂ vs. rCCO. Correlation coefficients I and p-values were calculated using MATLAB’s fitnlm function, with statistical significance defined as p < 0.05. To evaluate the power-law exponent (α) for each relationship, we conducted a one-sample t-test to determine if the mean value of α was statistically different from 1 or 0. This analysis tested whether the observed relationships deviated from linearity (α = 1) or if the exponent indicated no significant relationship (α = 0). This approach provided valuable insight into the nature of coupling between the variables. A similar method was applied to assess whether the intercept term (a) and the scaling factor (k) were significantly different from 0, further verifying the strength and validity of the fitted models.
3. Results
Figure 2 presents representative time traces of [tHB], rCCO, CMRO2, and CBF for one of the pigs, serving as an example of absolute value calculations as well as normalized CBF, rCCO and CMRO2 in pairs. The top two plots show [tHB] versus CBF, and rCCO versus CMRO2 in absolute values. [tHB] and rCCO values are given in μM, while CBF and CMRO2 are expressed in mL blood/100 g tissue/min and mL O₂/100 g tissue/min, respectively.
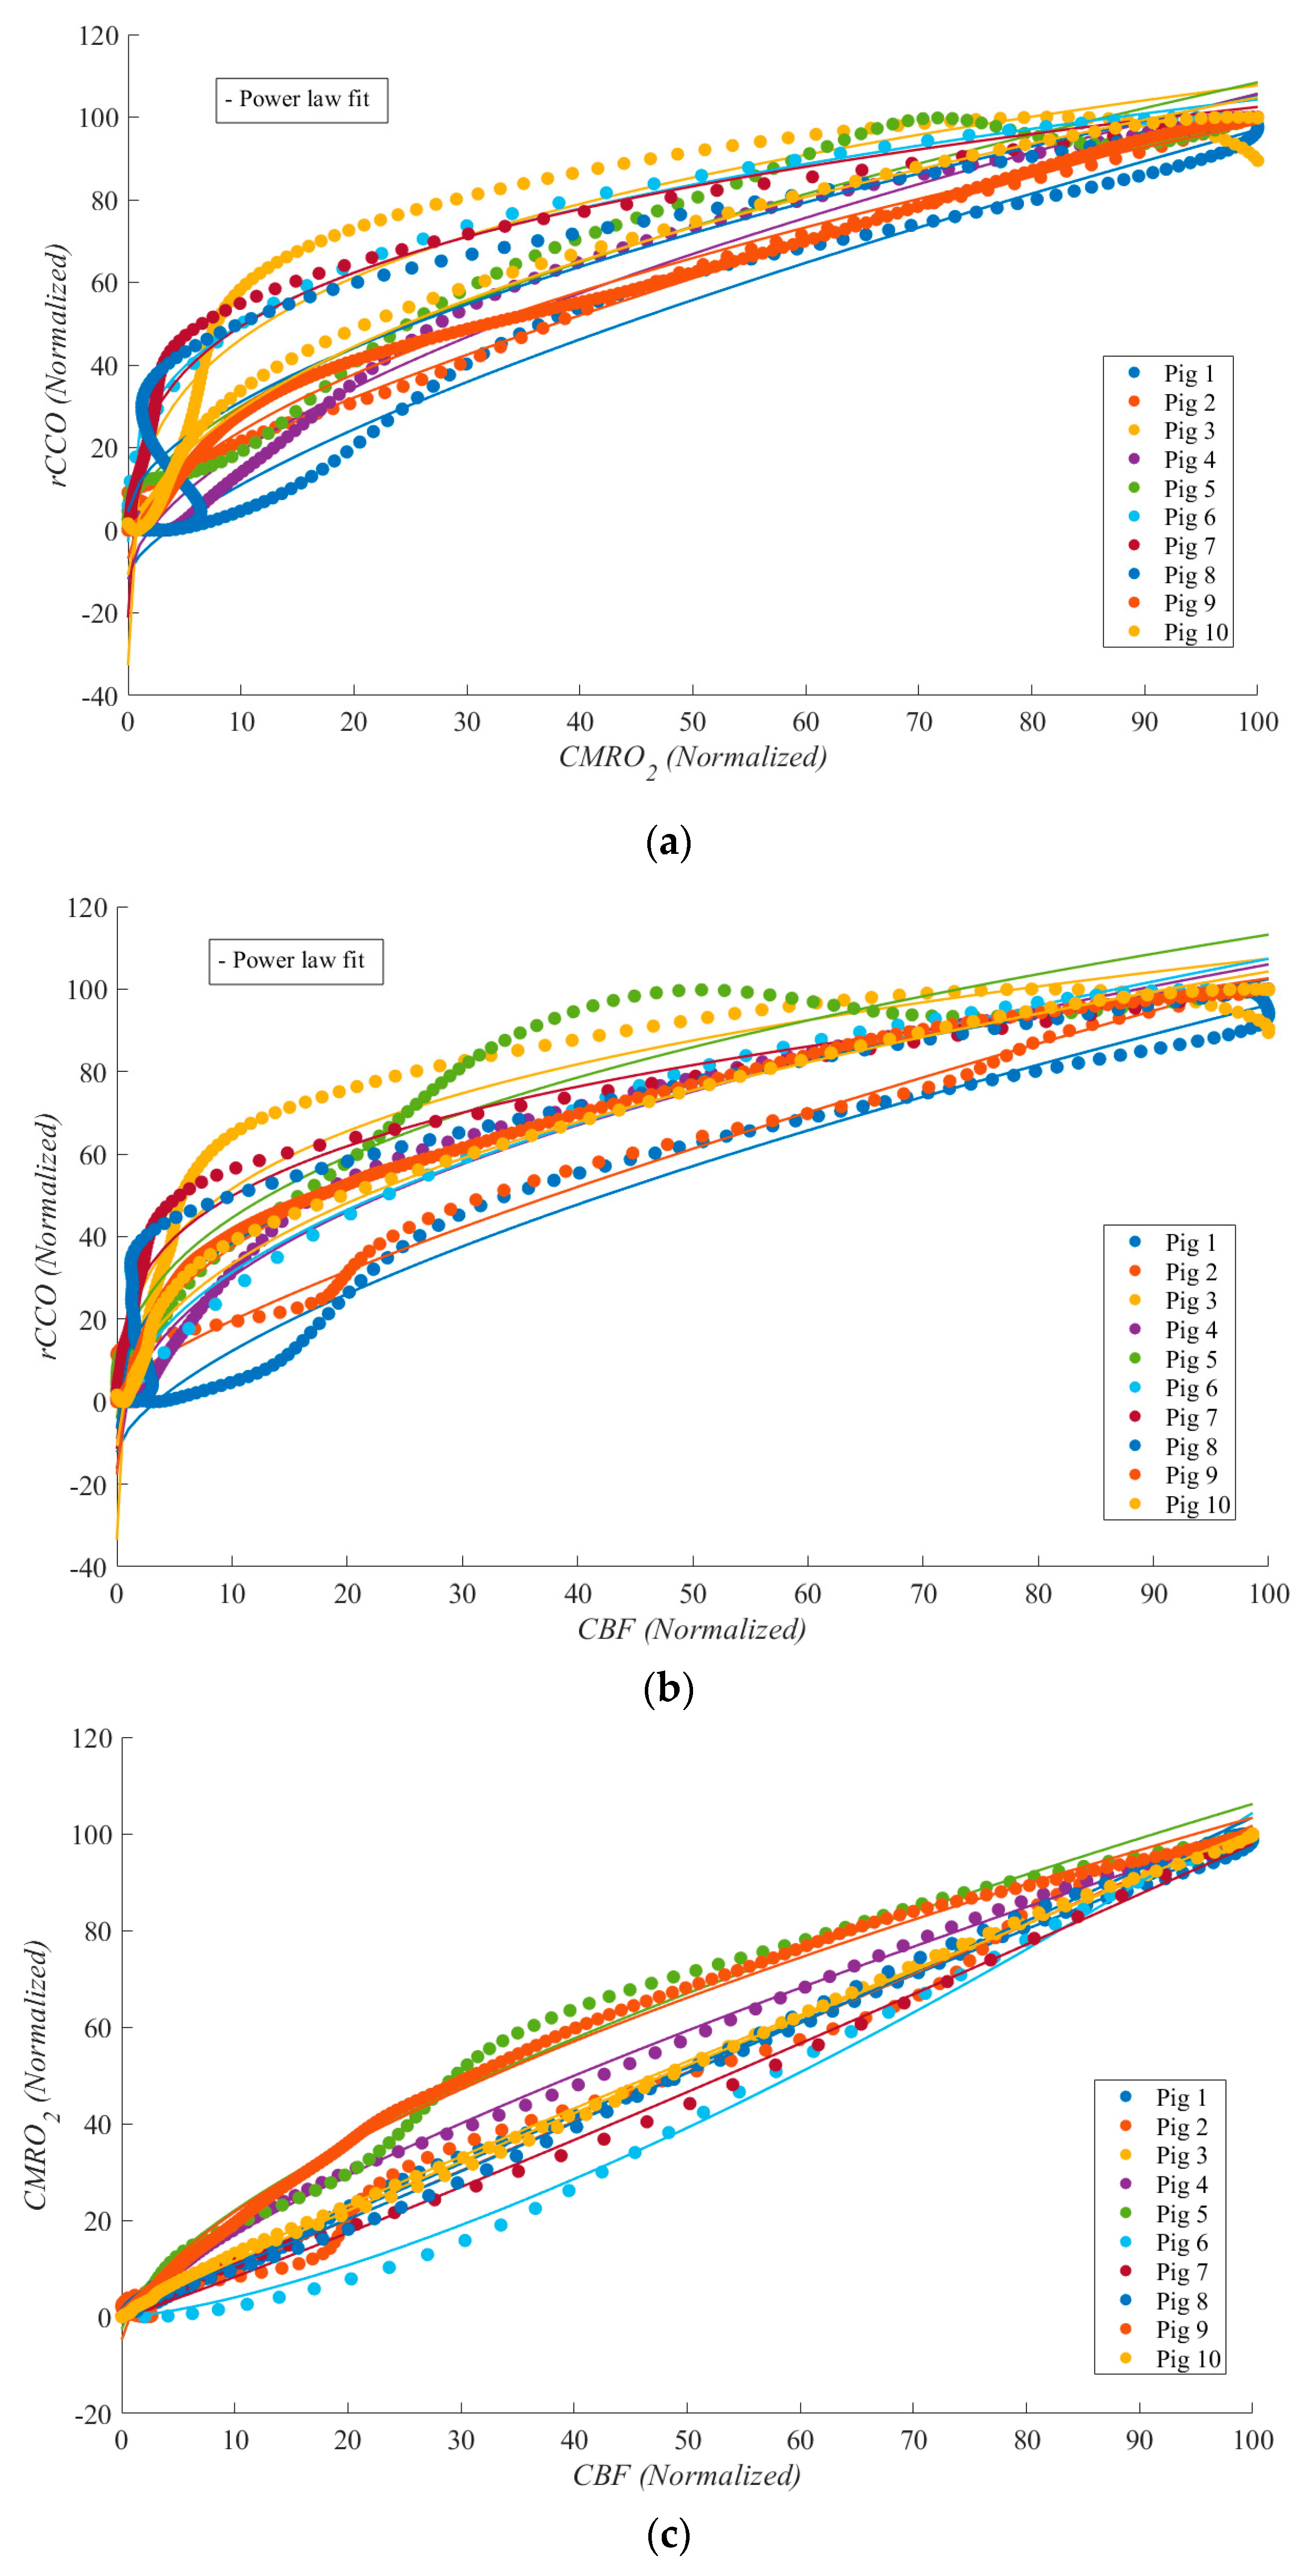
Figure 3 illustrates these relationships during cardiac arrest, with each dataset normalized to its maximum value for comparability. Each relationship is represented by a unique color, with median lines shown as solid lines and data ranges depicted by shaded areas. These plots highlight the linear and non-linear dynamics between rCCO, CMRO2, and CBF under the extreme physiological conditions of cardiac arrest.
To further analyze the data shown in Figure 4 and to compare it to similar studies reporting approximately 70% reductions from baseline, we investigated the data by dividing it into two zones. During cardiac arrest, zone I represents the period from baseline to a 70% drop relative to baseline, while zone II corresponds to a 60% to 100% drop (complete cessation of blood flow). The results indicate that as blood flow approaches zero, the parameters exhibit increasingly random behavior. This is reflected in the standard deviation of the power-law α values, with CMRO2 vs. rCCO showing a standard deviation of 0.388, CBF vs. rCCO at 0.350, and CBF vs. CMRO2 at 0.314. These findings highlight the variability and instability of physiological responses during severe reductions in perfusion. This suggests that during severe ischemia, the relationships between these parameters become less predictable, reflecting the breakdown of normal regulatory mechanisms. While variability at this level is expected under extreme conditions, it highlights the need for careful interpretation and potentially more complex modeling to accurately capture metabolic dynamics during CA. Table 1 provides the median and standard deviation values for α across both zones and for all three relationships.
Figure 2.
Time traces of [tHB], rCCO, CMRO2, and CBF for one pig are shown in pairs: (a), [tHB] vs. CBF; and (b), rCCO vs. CMRO2; [tHB] and rCCO values are in μM, CBF and CMRO2 in .
Figure 2.
Time traces of [tHB], rCCO, CMRO2, and CBF for one pig are shown in pairs: (a), [tHB] vs. CBF; and (b), rCCO vs. CMRO2; [tHB] and rCCO values are in μM, CBF and CMRO2 in .
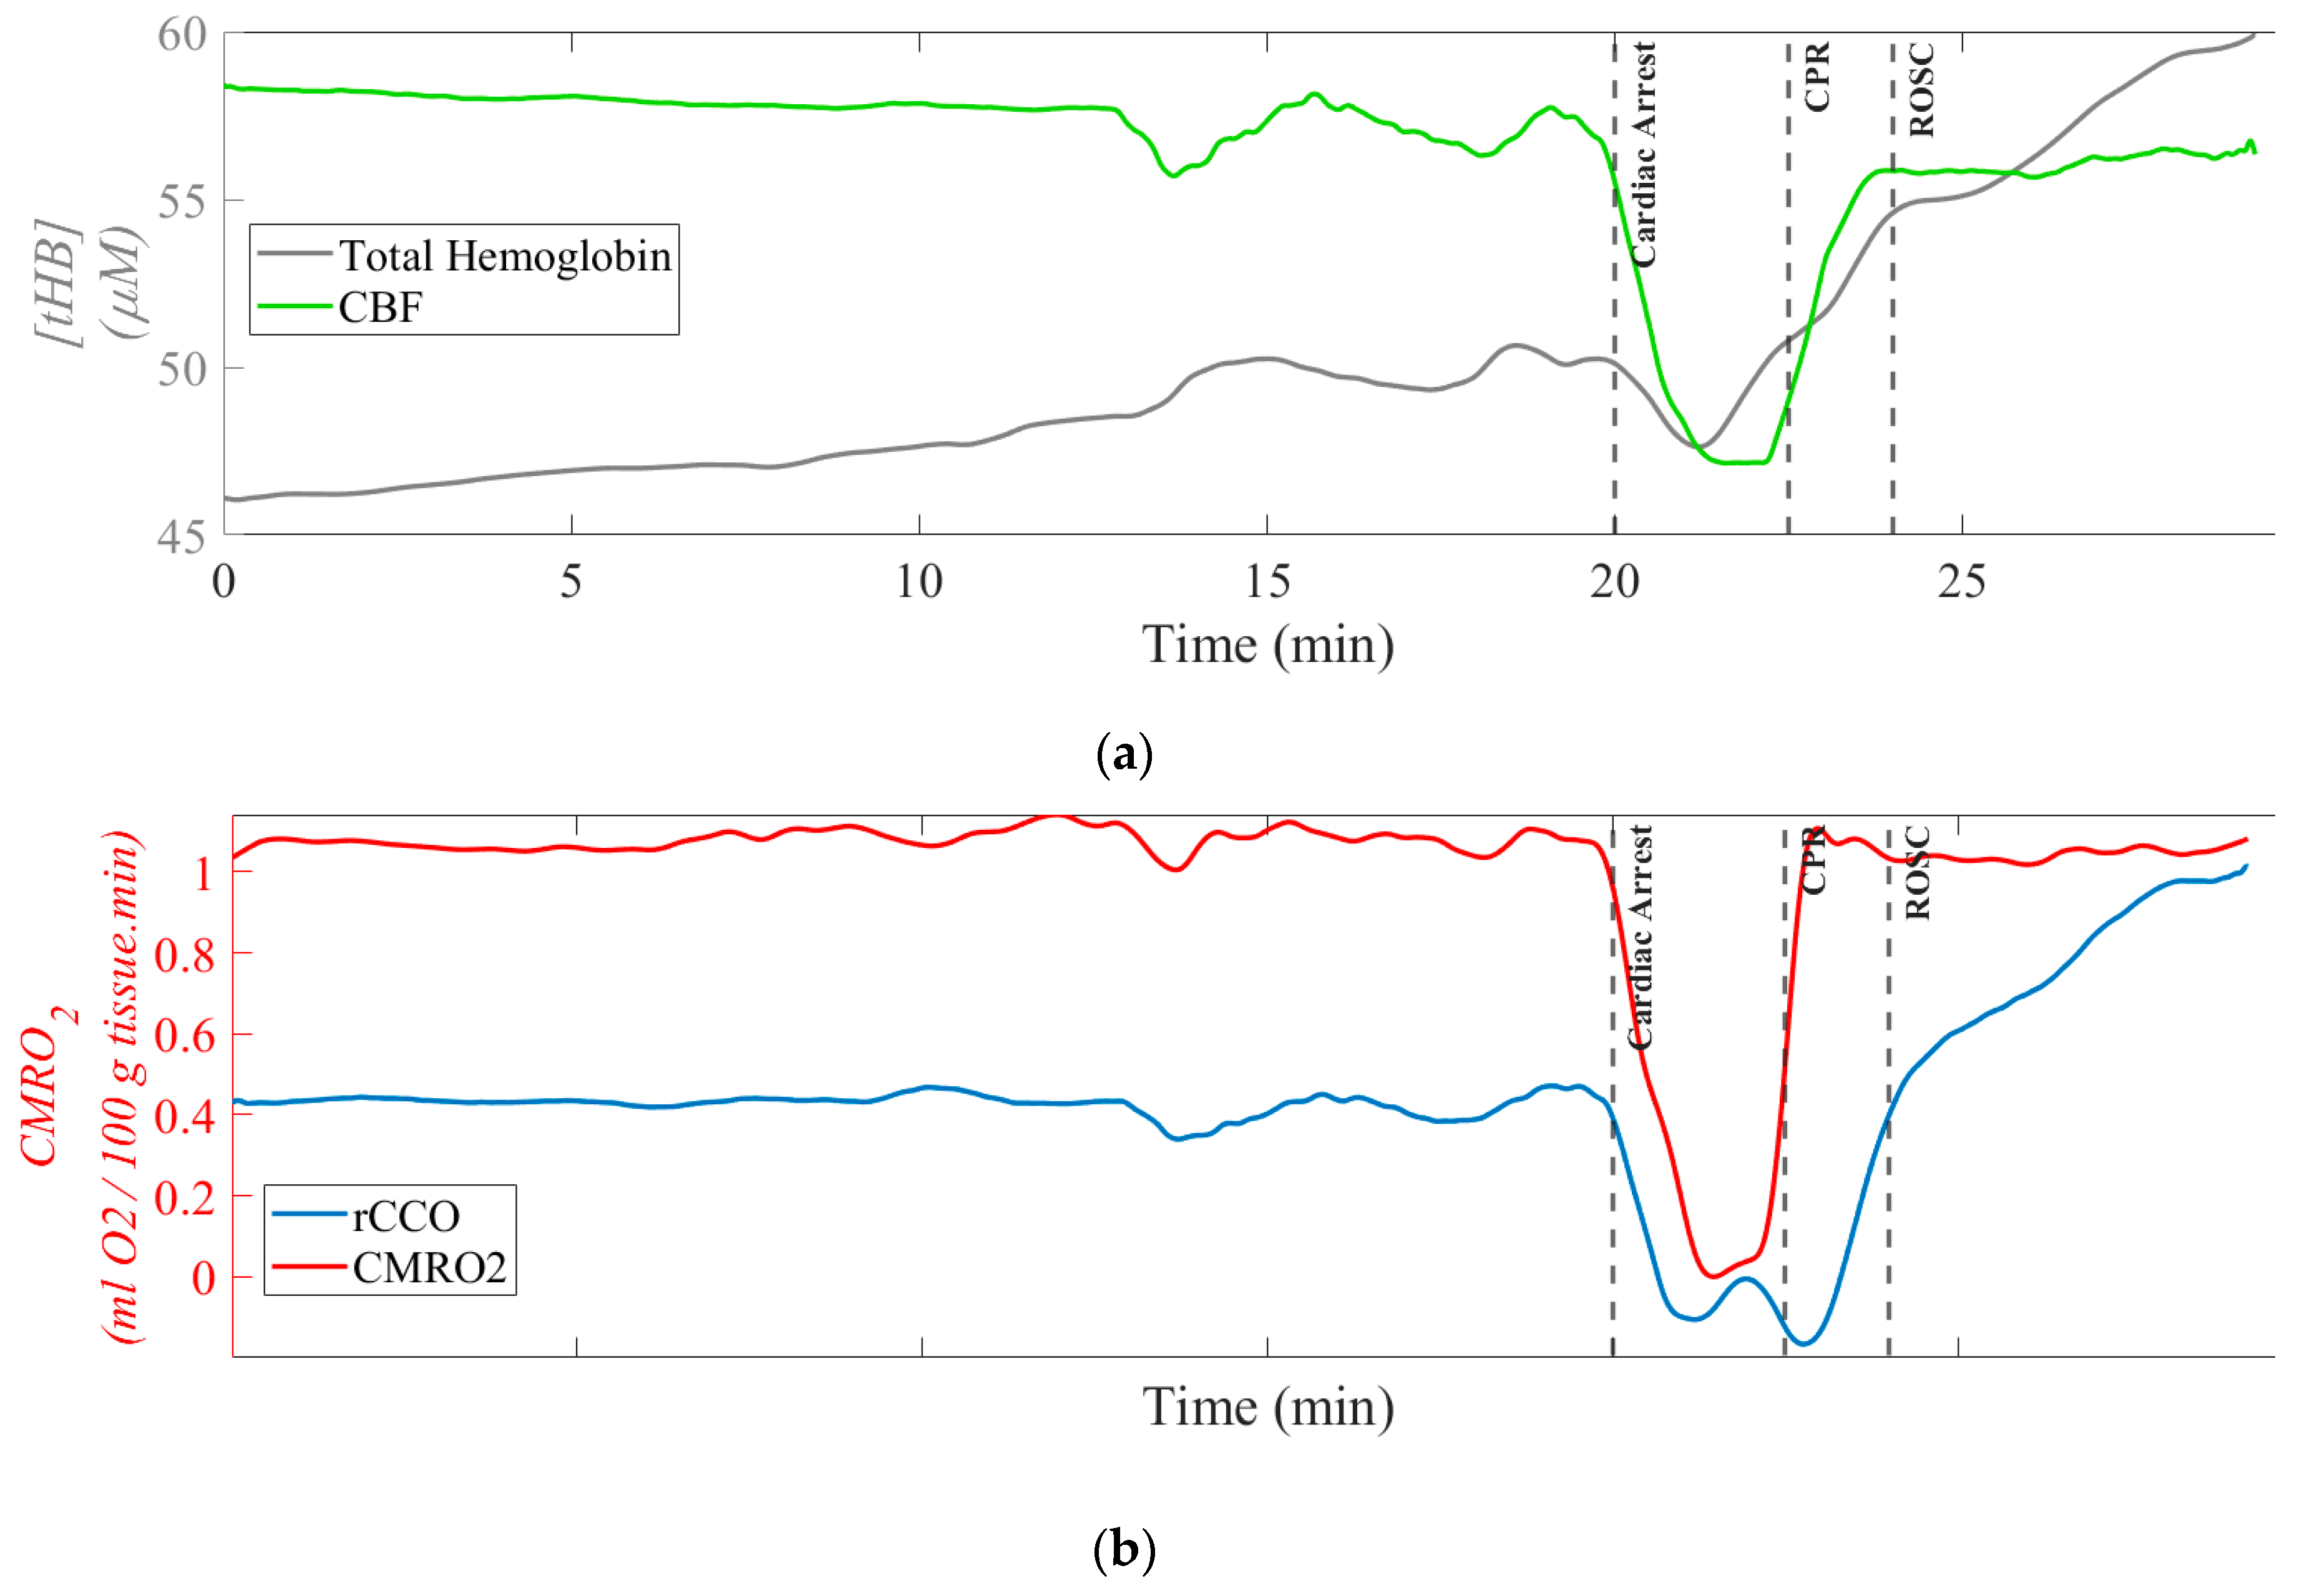
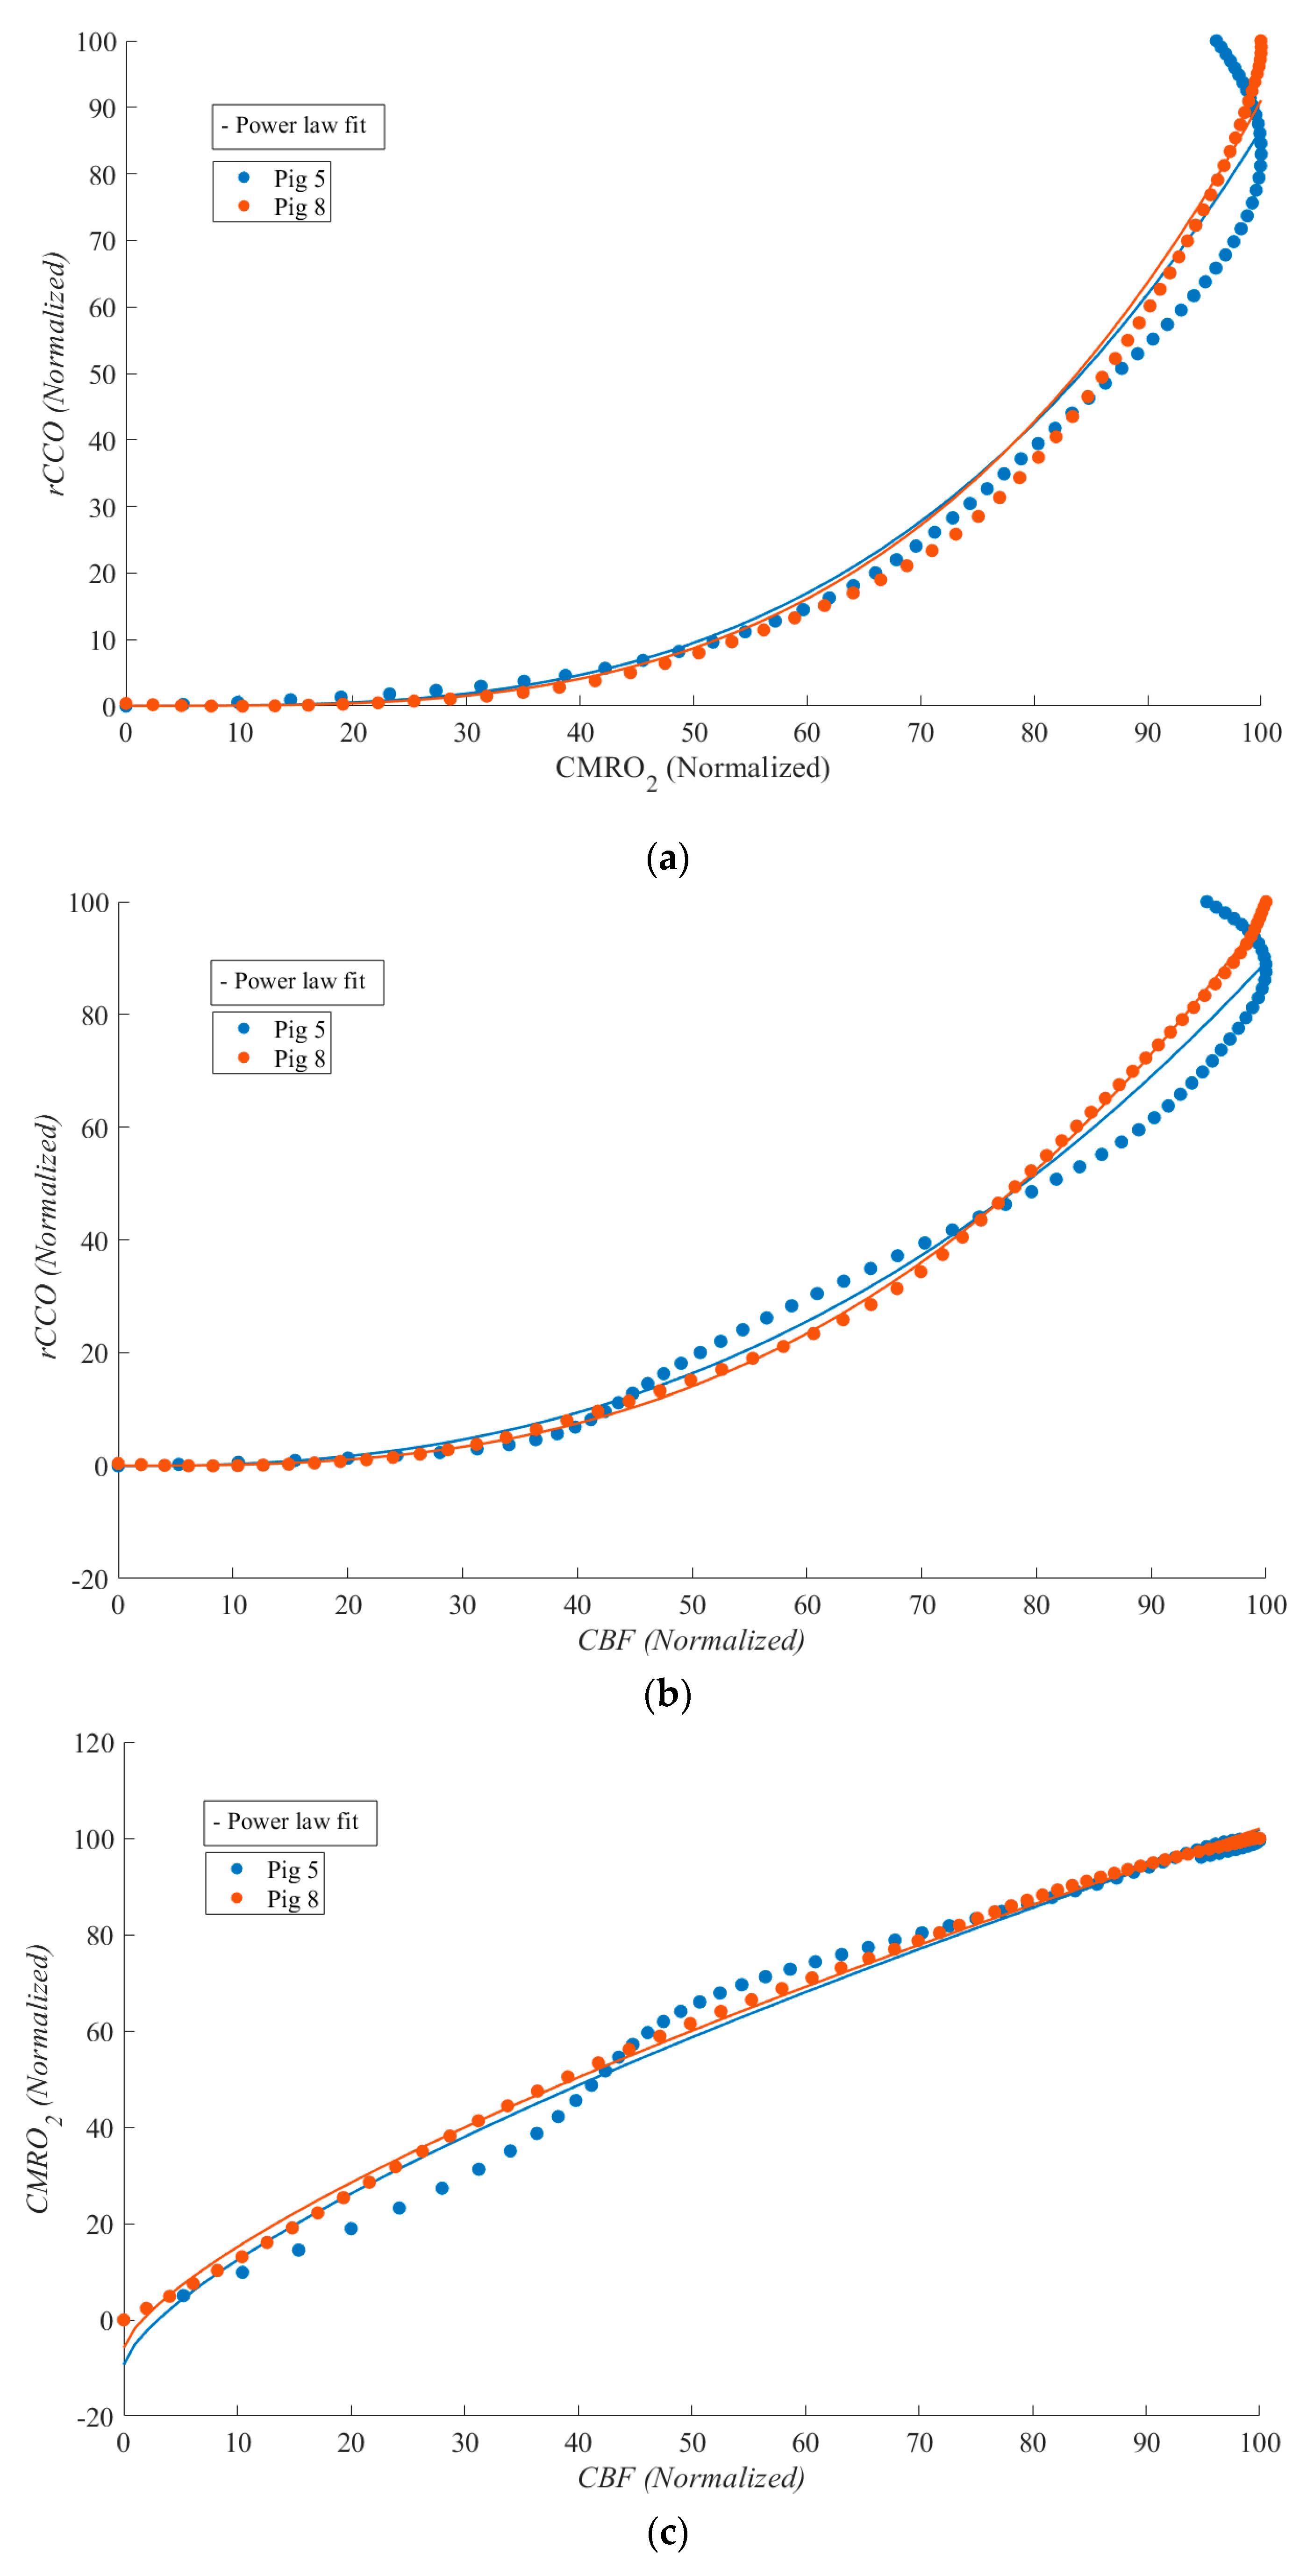
Figure 3.
Scatter plots for all the pigs (each color represents one pig) during cardiac arrest from the correlations between: (a) rCCO vs CMRO2; (b) CBF vs rCCO; c) CBF vs CMRO2.
Figure 3.
Scatter plots for all the pigs (each color represents one pig) during cardiac arrest from the correlations between: (a) rCCO vs CMRO2; (b) CBF vs rCCO; c) CBF vs CMRO2.
Due to the volatile conditions during CPR, characterized by intense movements and mechanical compressions, analyzing physiological markers was challenging compared to stable periods for most experiments. As a result, no clear relationships between rCCO and other variables were observed, and the data appeared random. This is reflected in the low R² values for the power-law fits. Figure 5 shows a scatter plot of CMRO2 vs. rCCO, illustrating this lack of correlation. However, as expected, CBF and CMRO2 maintained a strong linear relationship. In most experiments, MATLAB was unable to fit the power-law model for rCCO-related data, resulting in fewer than 10 pigs being represented in Figure 5. Nonetheless, R² values and the median power-law α, along with their standard deviations, are presented in Table 3.
Table 2 and Table 3 summarize the R² values and power-law α medians with standard deviations for each relationship during cardiac arrest and CPR respectively. The consistently strong relationships underscore the importance of these variables in understanding cerebral metabolism during cardiac arrest and CPR. These findings reveal that while the relationship between CBF and CMRO2 is predominantly linear, the interactions involving rCCO exhibit significant non-linear dynamics, underscoring the complexity of cerebral metabolism during cardiac arrest.
Figure 6 shows CBF vs. CMRO₂, CBF vs. rCCO, and CMRO2 vs. rCCO for two of the experiments, ROSC was achieved, enabling the study of physiological relationships during this phase. Although statistical analysis was not feasible due to the limited sample size, strong non-linear relationships were observed between rCCO and CMRO₂, as well as between rCCO and CBF. Notable differences compared to the cardiac arrest phase included the emergence of a weak non-linear relationship between CBF and CMRO2 and a marked change in curvature for the other two relationships (α shifting from approximately 0.5 during cardiac arrest to around 3 during ROSC).
Figure 4.
Correlation plots for all the pigs (each color represents one relationship) during cardiac arrest divided to two zones, zone I represents the period from baseline to a 70% drop relative to baseline, while zone II corresponds to a 60% to 100% drop (complete cessation of blood flow): (red) CMRO2 vs. rCCO during; (blue) CBF vs. rCCO; (green) CBF vs. CMRO2.
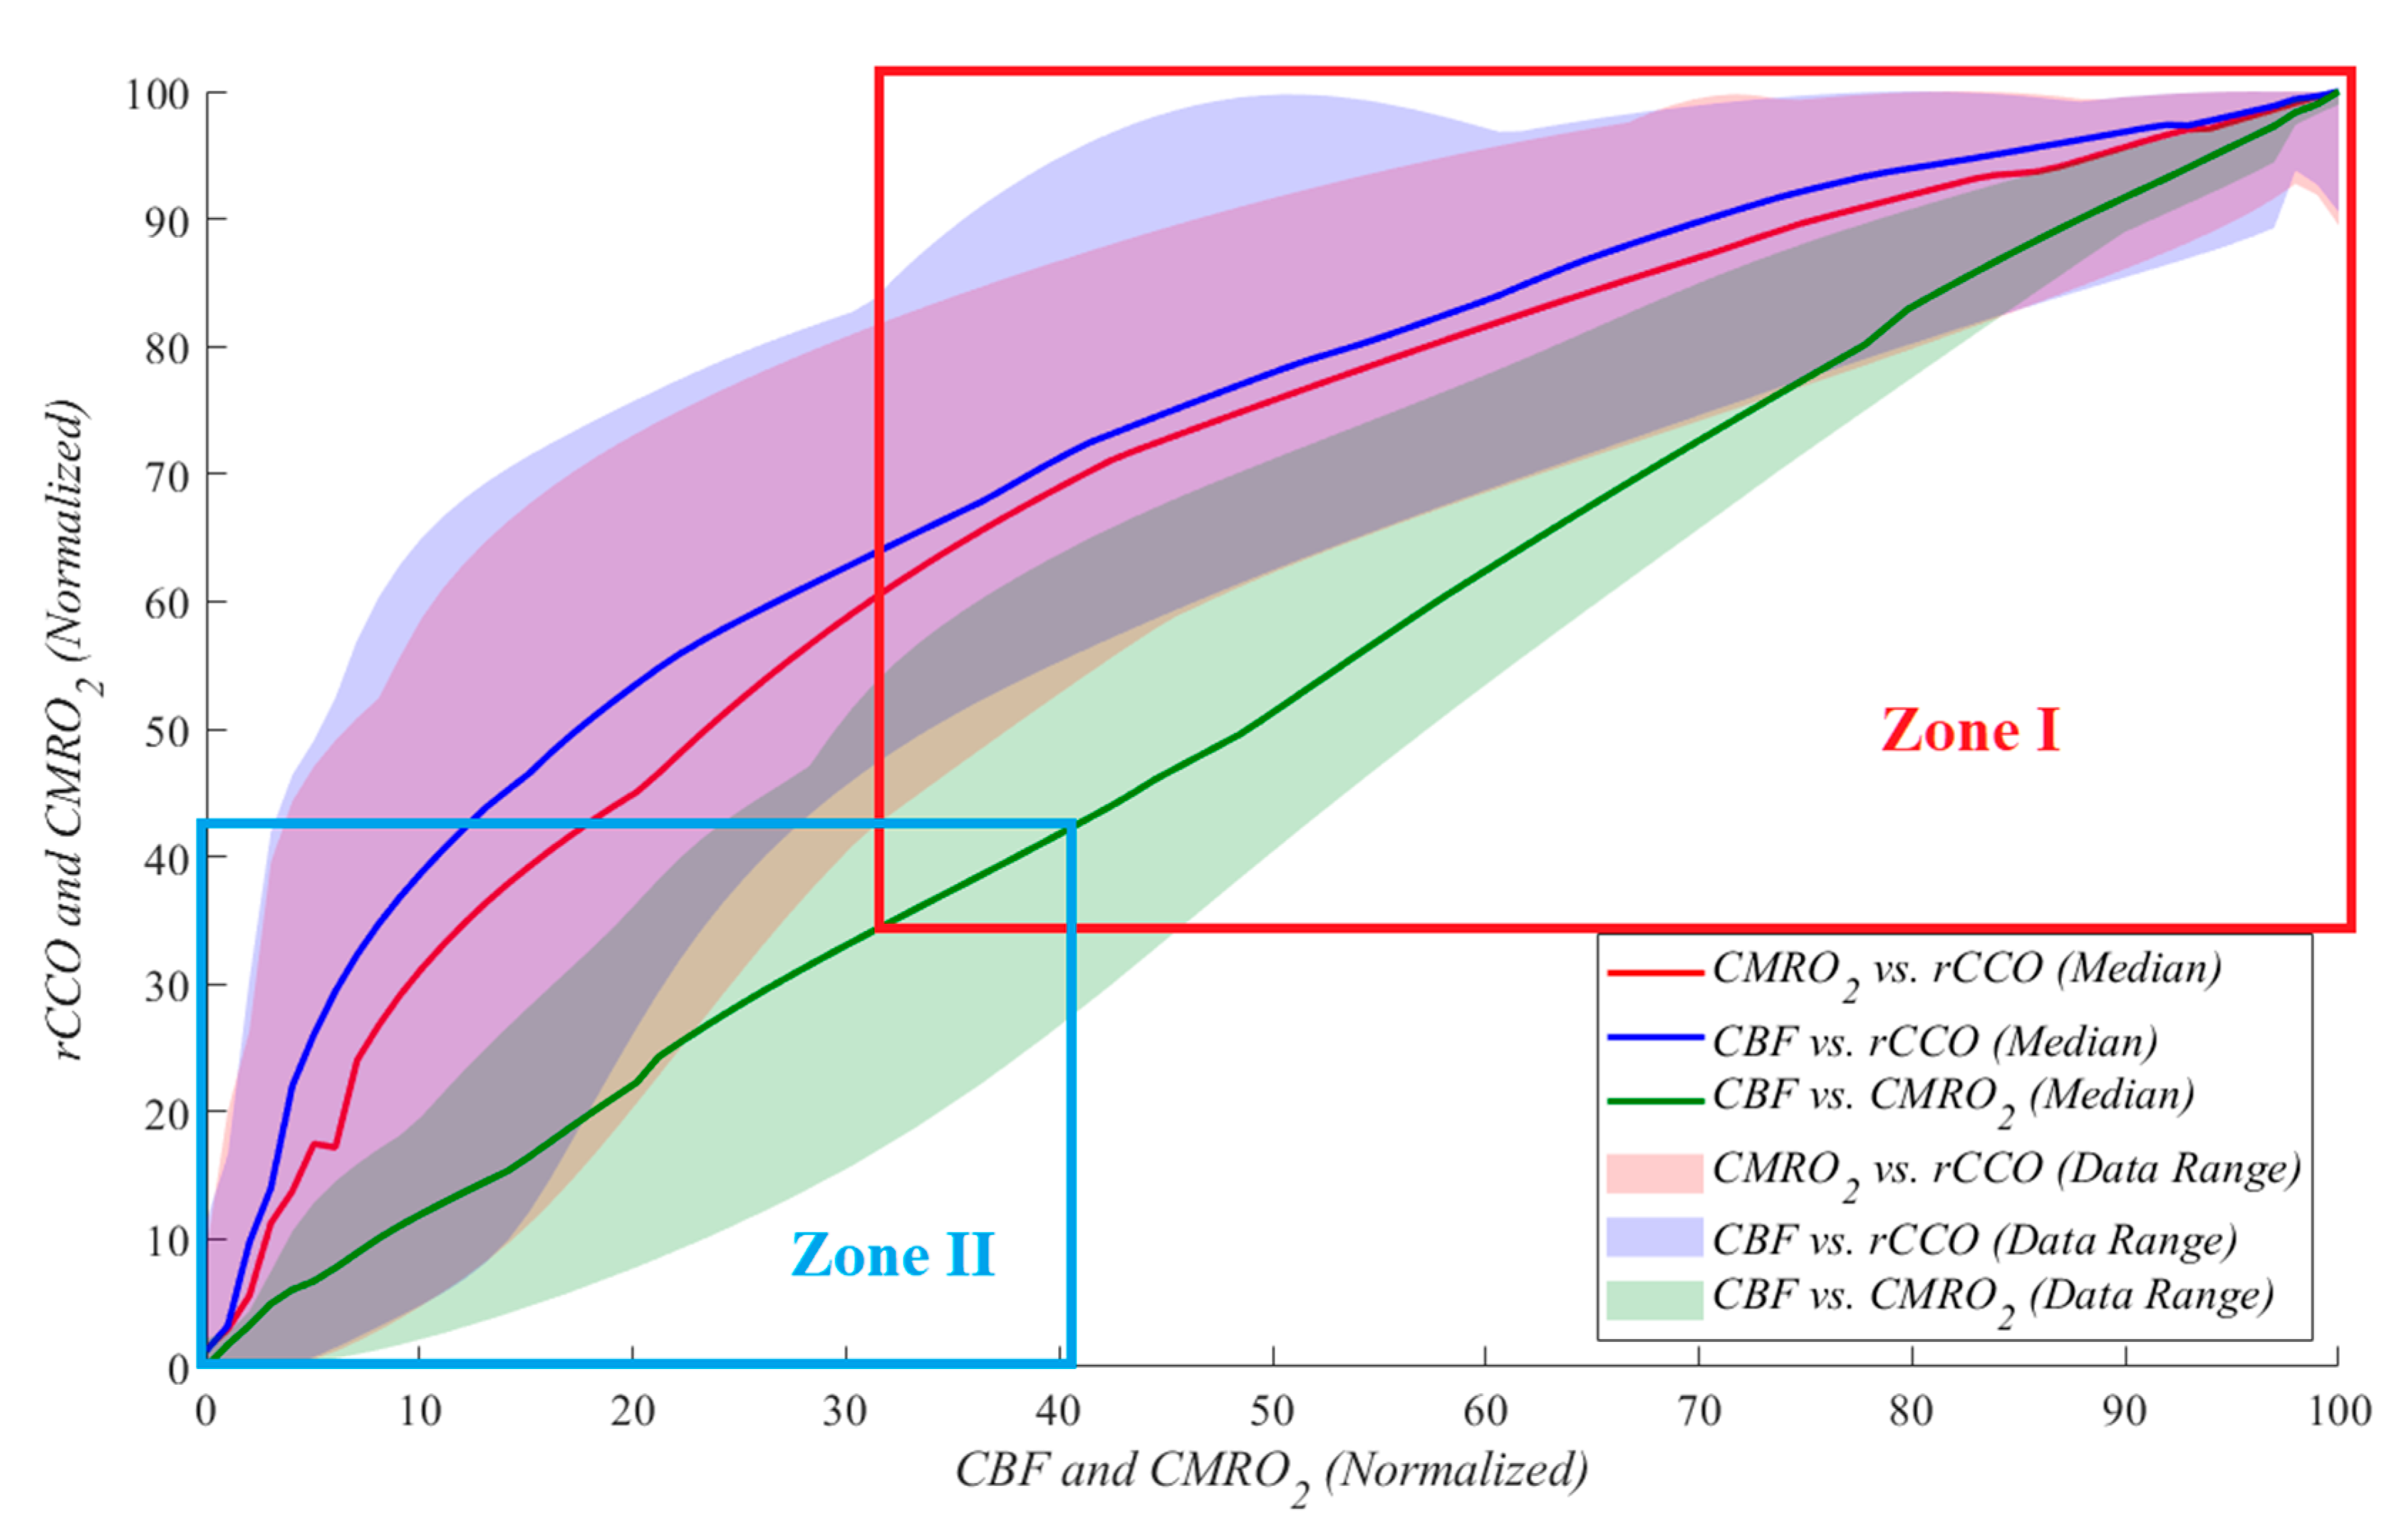

Table 2.
Power-law fit R2 and power law α means ± standard deviations for relationships between rCCO and CMRO2, CBF and CMRO2 as well as rCCO and CBF during Cardiac Arrest.
Table 2.
Power-law fit R2 and power law α means ± standard deviations for relationships between rCCO and CMRO2, CBF and CMRO2 as well as rCCO and CBF during Cardiac Arrest.
| Relationship / Parameter | R2 | α | p-value (α ≠ 1) | p-value (α ≠ 0) |
|---|---|---|---|---|
| CMRO2 vs rCCO | 0.981 ± 0.057 | 0.550 ± 0.169 | 0.000 | 0.000 |
| CBF vs rCCO | 0.980 ± 0.038 | 0.401 ± 0.157 | 0.000 | 0.000 |
| CBF vs CMRO2 | 0.998 ± 0.003 | 0.944 ± 0.222 | 0.428 | 0.000 |
Figure 5.
Scatter plot for 6 pigs (each color represents one pig) from the correlations between CMRO2 and rCCO during CPR.
Figure 5.
Scatter plot for 6 pigs (each color represents one pig) from the correlations between CMRO2 and rCCO during CPR.
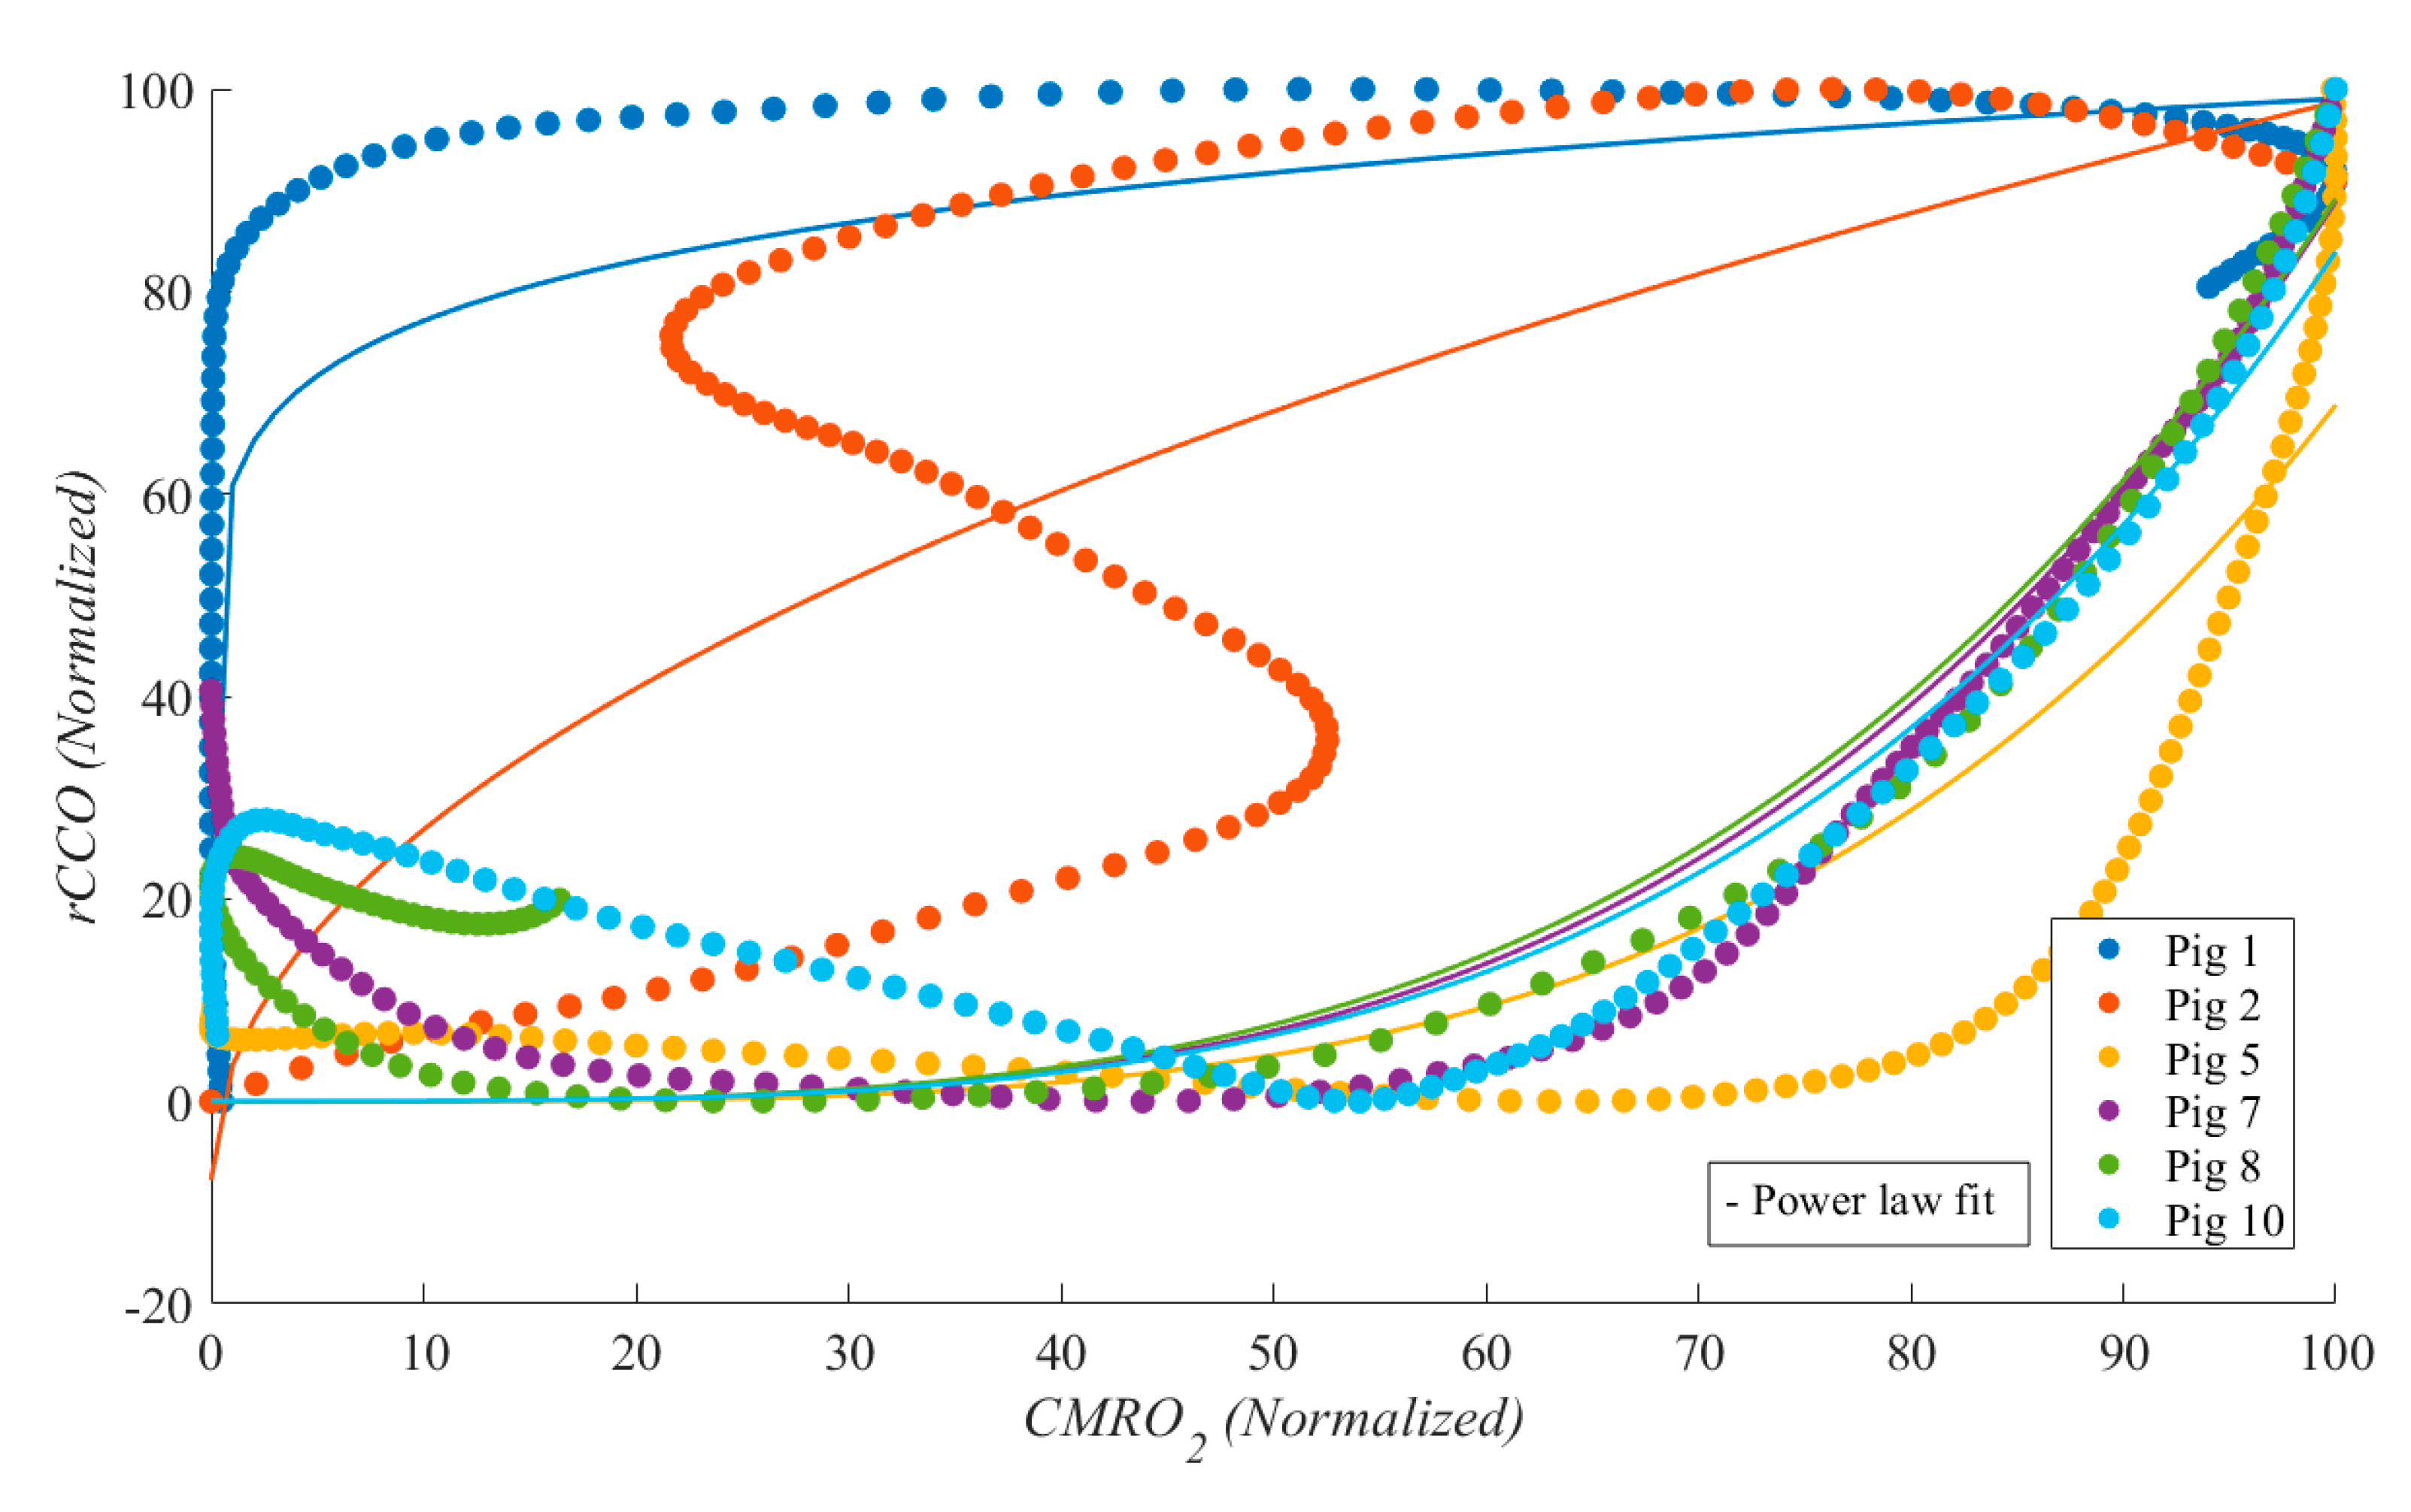
Table 3.
Power law fit R2 and power law α means ± standard deviations for relationships between rCCO and CMRO2, CBF and CMRO2 as well as rCCO and CBF during CPR.
Table 3.
Power law fit R2 and power law α means ± standard deviations for relationships between rCCO and CMRO2, CBF and CMRO2 as well as rCCO and CBF during CPR.
| Relationship / Parameter | R2 | α | p-value (α ≠ 1) | p-value (α ≠ 0) |
|---|---|---|---|---|
| CMRO2 vs rCCO | 0.681± 0.137 | 3.614 ± 1.608 | 0.080 | 0.016 |
| CBF vs rCCO | 0.694 ± 0.204 | 3.531 ± 1.628 | 0.084 | 0.017 |
| CBF vs CMRO2 | 0.996 ± 0.028 | 0.942 ± 0.154 | 0.831 | 0.000 |
In addition to the power-law exponent α, the intercept a and the scaling factor k were calculated for each relationship during cardiac arrest and CPR. A one-sample t-test confirmed that k and α were positive and significantly different from zero (p < 0.05) during cardiac arrest, reflecting strong coupling between CMRO₂, CBF, and rCCO under ischemic conditions. The p-values for α≠1 (non-linearity) and α≠0 (presence of coupling) are presented in Table 2 and Table 3, indicating significant deviations from linearity during cardiac arrest (p < 0.05), except for the CBF vs. CMRO₂ relationship, where α≈1 (p = 0.428), suggesting a predominantly linear flow-metabolism coupling. Conversely, during CPR, a and k were not significantly different from zero (p > 0.05) in the CBF vs. rCCO and CMRO₂ vs. rCCO relationships, underscoring the absence of meaningful coupling. However, k in the CBF vs. CMRO₂ relationship remained significant (p < 0.05), reinforcing that partial linearity persists between flow and metabolism, even under the dynamic and mechanically unstable conditions introduced by chest compressions. These findings highlight the non-linear and disrupted nature of cerebral metabolism during CPR, with select preservation of linear flow-metabolism interactions between CBF and CMRO₂.
Figure 6.
Scatter plots for two pigs (each color represents one pig) during ROSC from the correlations between: (a) CMRO2 and rCCO; (b) CBF and rCCO; (c) CBF and CMRO2. The median R² values for CBF vs. CMRO₂, CBF vs. rCCO, and CMRO₂ vs. rCCO were 0.989, 0.982, and 0.968, respectively. The median α values for these relationships were 0.711, 3.293 and 2.629 respectively.
4. Discussion
Near-infrared spectroscopy (NIRS) has demonstrated the potential to detect cardiac arrest (CA) and monitor tissue oxygenation even in the absence of a pulse waveform. This suggests its application in identifying CA outside hospital settings and continuously monitoring patients until circulation is restored [28]. In this study, we investigated CA and cardiopulmonary resuscitation (CPR) in pigs using hyperspectral NIRS combined with laser Doppler flowmetry (LDF). Broadband NIRS captures the full NIR spectrum at each time point, providing: (1) the ability to detect chromophores beyond HbO2 and HHb, such as cytochrome-c-oxidase (CCO) and water; (2) improved accuracy in chromophore concentration by resolving full spectral features; and (3) the capability to determine pathlength and absolute concentrations using second differential spectral methods [29].
Our study aimed to analyze the relationship between redox cytochrome c oxidase (rCCO), the cerebral metabolic rate of oxygen (CMRO2), and cerebral blood flow (CBF) during CA, CPR, and return of spontaneous circulation (ROSC). Our results obtained invasively directly from the brain reveal distinct patterns of interaction between these variables, shedding light on the non-linear dynamics governing cerebral metabolism under extreme physiological conditions.
The strong linear relationship observed between CBF and CMRO2, with R² values approaching 1.0, aligns with expectations based on Fick’s principle, indicating a robust coupling between oxygen delivery and consumption. This consistency underscores the fundamental role of CBF in sustaining cerebral oxygen metabolism. In contrast, the relationships involving rCCO deviated from linearity, particularly during CA. The power-law fits for CMRO2 vs. rCCO and CBF vs. rCCO exhibited lower R² values and α exponents around 0.5, suggesting that mitochondrial function and oxygen utilization become less predictable as blood flow diminishes. During cardiac arrest, the scaling factor k and power-law exponent α were consistently positive and significant (p < 0.05), reflecting strong coupling between CMRO₂, CBF, and rCCO, while the intercept a was not significant for CBF vs. CMRO₂, suggesting proportional flow-metabolism coupling without a baseline offset. In contrast, during CPR, a and k were not significant for rCCO-related relationships, indicating disrupted mitochondrial coupling, likely due to mechanical chest compressions. However, k remained significant for CBF vs. CMRO₂, highlighting partial preservation of linear flow-metabolism interaction even under unstable conditions. This suggests that while cerebral blood flow and oxygen metabolism coupling persists during CPR, mitochondrial dynamics are more sensitive to resuscitative efforts, emphasizing the need to protect mitochondrial function for better neurological outcomes.
Interestingly, during CPR, the relationships between rCCO and CMRO2 or CBF weakened, likely due to the physical disturbances and hemodynamic fluctuations induced by mechanical chest compressions. The low R² values during CPR reflect the challenges of accurately capturing cerebral metabolism under such turbulent conditions. This finding highlights the need for refined measurement techniques to mitigate motion artifacts and enhance data reliability.
The p-values for α ≠ 1 across the entire cardiac event reveal distinct patterns in the relationships between CMRO2, CBF, and rCCO during CA, CPR, and ROSC. The relationship between CBF and CMRO2 consistently showed p > 0.05 (p = 0.404 during CA and p = 0.391 during CPR), indicating that the coupling between oxygen delivery and consumption persists even during mechanical compressions. Conversely, the relationships involving rCCO demonstrated p < 0.05 for α ≠ 1 during CA and ROSC (p = 0.001 and p = 0.015 respectively), reflecting significant deviations from linearity. This suggests that mitochondrial function follows non-linear behavior under ischemic and reperfusion conditions. During CPR, the relationships between rCCO and CMRO2 or CBF weakened, as indicated by p > 0.05, which may reflect the hemodynamic instability introduced by chest compressions. Despite this, p-values for α ≠ 0 remained highly significant (p < 0.001), highlighting the ongoing metabolic contribution of rCCO even during turbulent periods.
The scaling factor k, which represents the proportional relationship between the variables of interest, was consistently positive and statistically significant across all phases of the study (CA, CPR, and ROSC). This finding aligns with physiological expectations, suggesting that even during severe reductions in cerebral blood flow, a positive relationship between CMRO₂, CBF, and rCCO persists, reflecting the brain's ongoing metabolic activity and mitochondrial function. The significance of k during CPR highlights the resilience of cerebral metabolism, even under the dynamic and mechanically unstable conditions introduced by chest compressions. This reinforces the importance of preserving mitochondrial function during resuscitation efforts, as it may play a critical role in improving neurological outcomes post-ROSC.
To further analyze these relationships, we separated the data during CA in two zones: Zone I (baseline to 70% drop) and Zone II (60% to 100% drop in blood flow). The results revealed increasing randomness in physiological responses as blood flow approached zero, with greater variability in the power-law α values observed in Zone 2. The standard deviations of α for CMRO2 vs. rCCO (0.388), CBF vs. rCCO (0.350), and CBF vs. CMRO2 (0.314) suggest heightened instability in mitochondrial and metabolic responses near complete cessation of perfusion.
The segmentation of the data into Zone I and Zone II enabled a more detailed analysis of metabolic responses. This division allows for direct comparison with prior non-invasive studies in small piglets by Milej et al. [11], which focused on smaller perturbations in CBF from the baseline values. In Zone I, For the CMRO2 vs. rCCO relationship, p = 0.07, suggesting near-linearity. This result corresponds closely to [11], where the relationship between rCCO and CMRO2 was found to be not significantly different from one. The relationship between CMRO2 and CBF remained linear with α = 0.941 ± 0.299 and p = 0.813 for α ≠ 1, indicating that oxygen delivery and consumption are tightly coupled under moderate reductions in blood flow. Interestingly, this result contrasts with the findings of [11], where the same relationship exhibited mild non-linearity (α = 1.39 ± 0.31) during carotid occlusion. One possible explanation for this difference is the nature of the ischemic event. In Milej et al. [11], ischemia was induced gradually under anesthesia, which may have allowed for compensatory mechanisms that introduced non-linearity. In contrast, our study involved CA, characterized by a rapid and complete cessation of blood flow, likely overwhelming autoregulatory mechanisms and preserving a direct linear relationship between CBF and CMRO2 during the initial phase of ischemia.
However, in Zone II, as blood flow approached zero, non-linear responses emerged. The relationships between CMRO2 and rCCO (p = 0.004) and between CBF and rCCO (p = 0.016) showed significant deviations from linearity, reflecting increased variability in mitochondrial responses under severe ischemia. These findings contrast with the linearity observed during moderate occlusion in [11] partially and emphasize the need for non-linear modeling to fully capture metabolic dynamics during extreme reductions in blood flow. The comparison between Zone I and Zone II highlights the shift from linear to non-linear behavior as ischemia deepens. While prior studies concentrated on milder ischemic conditions, our data illustrate the breakdown of linear relationships during extreme drops in blood flow, emphasizing the need for non-linear modeling to fully capture the metabolic dynamics of CA and CPR.
Unfortunately, in our study we had a very limited number of ROSC cases (two ROSC out of ten total). During ROSC, the non-linear relationship between CMRO2 and rCCO persisted but exhibited a significant shift, with α values increasing to approximately 3. This sharp contrast to the α values observed during CA suggests a dynamic change in mitochondrial activity and oxygen utilization as circulation is restored. The observed non-linearity may reflect the brain’s attempt to rapidly restore homeostasis following prolonged ischemia. However, possible differences between CA, CPR, and ROSC phases require further investigations.
Additionally, in this study we focused on the relative changes in rCCO rather than on the absolute values, as we did not have baseline measurements of oxidized and reduced CCO concentrations. This limitation should be considered when interpreting the results, as absolute values would provide a more comprehensive understanding of the physiological changes occurring during CA and CPR. To advance our understanding, leveraging mathematical models presents several advantages. By identifying and quantifying the mathematical relationships between physiological variables, we can predict one variable based on measurements of another. This approach becomes particularly valuable in situations where advanced measurement technologies are unavailable or impractical. Mathematical models can provide meaningful insights and predictions in such contexts.
In our future research we will focus on evaluating the validity and applicability of existing hemometabolic models to describe the mathematical relationships between rCCO, CMRO2, and CBF. A key part of this effort will involve applying the BrainSignal model [30], which provides a comprehensive framework for analyzing these interactions. Unlike CHS, which lacks the capacity to calculate rCCO, BrainSignal incorporates mitochondrial metabolism, allowing for the quantification of rCCO. In this study, the availability of hNIRS enabled us to directly measure rCCO, offering insights into mitochondrial function during CA and CPR.
Moving forward, we aim to leverage the BrainSignal model to mathematically estimate rCCO in contexts where direct measurements are not feasible. By integrating this model with our experimental data, we seek to uncover more precise correlations between rCCO, CMRO2, and CBF under various physiological conditions. This dual approach—combining experimental data from hNIRS with predictive modeling—will not only deepen our understanding of cerebral metabolism but also enhance the development of tools capable of predicting cerebral hemodynamic responses in both clinical and research settings. Ultimately, these efforts could bridge the gap between experimental measurements and real-time predictive monitoring, furthering the potential for non-invasive assessment of brain metabolism in critical care environments.
5. Conclusions
This study provides novel insights into the interactions between CMRO2, rCCO, and CBF during cardiac arrest, CPR, and ROSC. The results confirm a linear relationship between CBF and CMRO2 during CA, reflecting the dependence of oxygen metabolism on cerebral perfusion. In contrast, the relationships involving rCCO exhibited significant non-linearity, highlighting the complex role of mitochondrial function in oxygen utilization under extreme physiological stress.
The division of data into two zones during CA revealed increasing variability in metabolic responses as blood flow declined, with greater randomness observed near complete cessation of perfusion. These findings underscore the importance of studying cerebral metabolism across different phases of cardiac arrest and resuscitation to better understand the mechanisms underlying brain injury. The emergence of non-linear relationships during ROSC suggests dynamic changes in mitochondrial activity as circulation is restored. This highlights the potential for leveraging advanced NIRS technologies and mathematical models to predict cerebral metabolic responses and guide clinical interventions during and after CA.
Future research involving CHS and BrainSignal hemometabolic models should focus on refining measurement techniques to minimize motion artifacts during CPR and validating the observed relationships in larger animal models or clinical settings. By enhancing our understanding of cerebral metabolism under extreme conditions, these efforts may contribute to improved strategies for mitigating brain injury and enhancing patient outcomes during cardiac arrest and resuscitation.
Author Contributions
Methodology, R.M., S.L. and V.T.; Software, N.K.; Investigation, N.K. and V.T.; Data curation, R.M., and N.K..; Writing—original draft, N.K.; Writing—review & editing, NK. and V.T.; Supervision, R.M., S.L. and V.T.; Funding acquisition, S.L. All authors have read and agreed to the published version of the manuscript.
Funding
This study was funded by a ZOLL Foundation grant. O. R. was supported by CREMS (“Comprehensive Research Experience for Medical Students”) Summer Research Program at the University of Toronto’s Temerty Faculty of Medicine.
Institutional Review Board Statement
All animals in the project will receive humane and proper treatment in accordance with the policies formulated by St. Michael’s Hospital Animal Care Committee, the Animals for Research Act 1968-69 and with the recommendations of the Canadian Council on Animal Care. PI accepts responsibility for keeping the foregoing information current especially with respect to methodology. The protocol code is 245ACC #245.
Informed Consent Statement
Not applicable.
Data Availability Statement
The results of this study are available from the corresponding author on reasonable request.
Conflicts of Interest
The authors declare no conflict of interest.
References
- Yan, S.; Gan, Y.; Jiang, N.; Wang, R.; Chen, Y.; Luo, Z.; Zong, Q.; Chen, S.; Lv, C. The global survival rate among adult out-of-hospital cardiac arrest patients who received cardiopulmonary resuscitation: A systematic review and meta-analysis. Crit. Care 2020, 24, 61. [Google Scholar] [CrossRef]
- Buunk G, van der Hoeven JG, Meinders AE. Cerebral blood flow after cardiac arrest. Neth J Med. 2000 Sep;57(3):106-12. [CrossRef] [PubMed]
- Lemiale V, Dumas F, Mongardon N, Giovanetti O, Charpentier J, Chiche JD, Carli P, Mira JP, Nolan J, Cariou A. Intensive care unit mortality after cardiac arrest: the relative contribution of shock and brain injury in a large cohort. Intensive Care Med. 2013 Nov;39(11):1972-80. [CrossRef] [PubMed]
- Claassen JAHR, Thijssen DHJ, Panerai RB, Faraci FM. Regulation of cerebral blood flow in humans: physiology and clinical implications of autoregulation. Physiol Rev. 2021 Oct 1;101(4):1487-1559. [CrossRef] [PubMed] [PubMed Central]
- Rolfe DF, Brown GC. Cellular energy utilization and molecular origin of standard metabolic rate in mammals. Physiol Rev. 1997 Jul;77(3):731-58. [CrossRef] [PubMed]
- Fukuda R, Zhang H, Kim JW, Shimoda L, Dang CV, Semenza GL. HIF-1 regulates cytochrome oxidase subunits to optimize efficiency of respiration in hypoxic cells. Cell. 2007 Apr 6;129(1):111-22. [CrossRef] [PubMed]
- Davidson JO, Gonzalez F, Gressens P, Gunn AJ; Newborn Brain Society Guidelines and Publications Committee. Update on mechanisms of the pathophysiology of neonatal encephalopathy. Semin Fetal Neonatal Med. 2021 Oct;26(5):101267. [CrossRef] [PubMed]
- Sekhon, M.S. , Ainslie, P.N. & Griesdale, D.E. Clinical pathophysiology of hypoxic ischemic brain injury after cardiac arrest: a “two-hit” model. Crit Care 21, 90 (2017). [CrossRef]
- Hashem M, Wu Y, Dunn JF. The relationship between cytochrome c oxidase, CBF and CMRO2 in mouse cortex: A NIRS-MRI study. J Cereb Blood Flow Metab. 2023 Aug;43(8):1351-1364. [CrossRef] [PubMed] [PubMed Central]
- Bohraus Y, Merkle H, Logothetis NK, Goense J. Laminar differences in functional oxygen metabolism in monkey visual cortex measured with calibrated fMRI. Cell Rep. 2023 Nov 28;42(11):113341. [CrossRef] [PubMed]
- Milej D, Rajaram A, Suwalski M, Morrison LB, Shoemaker LN, St Lawrence K. Assessing the relationship between the cerebral metabolic rate of oxygen and the oxidation state of cytochrome-c-oxidase. Neurophotonics. 2022 Jul;9(3):035001. [CrossRef] [PubMed] [PubMed Central]
- Khalifehsoltani, N.; Rennie, O.; Mohindra, R.; Lin, S.; Toronov, V. Tracking Cerebral Microvascular and Metabolic Parameters during Cardiac Arrest and Cardiopulmonary Resuscitation. Appl. Sci. 2023, 13, 12303. [Google Scholar] [CrossRef]
- Fantini, S. Dynamic model for the tissue concentration and oxygen saturation of hemoglobin in relation to blood volume, flow velocity, and oxygen consumption: Implications for functional neuroimaging and coherent hemodynamics spectroscopy (CHS). NeuroImage 2014, 85 Pt 1, 202–221. [Google Scholar] [CrossRef]
- Nosrati, R.; Lin, S.; Mohindra, R.; Ramadeen, A.; Toronov, V.; Dorian, P. Study of the Effects of Epinephrine on Cerebral Oxygenation and Metabolism During Cardiac Arrest and Resuscitation by Hyperspectral Near-Infrared Spectroscopy. Crit. Care Med. 2019, 47, e349–e357. [Google Scholar] [CrossRef] [PubMed]
- McAnally, J.R. The use of animals in research … the views of a young researcher. J. Okla. Dent. Assoc. 1993, 83, 34–35. [Google Scholar]
- Nosrati, R.; Lin, S.; Ramadeen, A.; Monjazebi, D.; Dorian, P.; Toronov, V. Cerebral Hemodynamics and Metabolism During Cardiac Arrest and Cardiopulmonary Resuscitation Using Hyperspectral Near Infrared Spectroscopy. Circ. J. 2017, 81, 879–887. [Google Scholar] [CrossRef] [PubMed]
- Nosrati, R.; Ramadeen, A.; Hu, X.; Woldemichael, E.; Kim, S.; Dorian, P.; Toronov, V. Simultaneous measurement of cerebral and muscle tissue vc during cardiac arrest and cardiopulmonary resuscitation. In Optical Techniques in Neurosurgery, Neurophotonics, and Optogenetics II; SPIE: Bellingham, WA, USA, 2015; Volume 9305, pp. 164–169. [Google Scholar]
- Zhao, H.; Tanikawa, Y.; Gao, F.; Onodera, Y.; Sassaroli, A.; Tanaka, K.; Yamada, Y. Maps of optical differential pathlength factor of human adult forehead, somatosensory motor and occipital regions at multi-wavelengths in NIR. Phys. Med. Biol. 2002, 47, 2075–2093. [Google Scholar] [CrossRef] [PubMed]
- Strangman, G.E.; Li, Z.; Zhang, Q. Depth Sensitivity and Source-Detector Separations for Near Infrared Spectroscopy Based on the Colin27 Brain Template. PLoS ONE 2013, 8, e66319. [Google Scholar] [CrossRef] [PubMed]
- Scholkmann, F.; Wolf, M. General equation for the differential pathlength factor of the frontal human head depending on wavelength and age. J. Biomed. Opt. 2013, 18, 105004–105004. [Google Scholar] [CrossRef]
- Yeganeh, H.Z.; Toronov, V.; Elliott, J.T.; Diop, M.; Lee, T.-Y.; Lawrence, K.S. Broadband continuous-wave technique to measure baseline values and changes in the tissue chromophore concentrations. Biomed. Opt. Express 2012, 3, 2761–2770. [Google Scholar] [CrossRef]
- Sassaroli, A.; Kainerstorfer, J.M.; Fantini, S. Nonlinear extension of a hemodynamic linear model for coherent hemodynamics spectroscopy. J. Theor. Biol. 2016, 389, 132–145. [Google Scholar] [CrossRef] [PubMed]
- Erdener ŞE, Dalkara T. Small vessels are a big problem in neurodegeneration and neuroprotection. Front Neurol; 10. Epub ahead of print 2019. [CrossRef]
- Wong AD, Ye M, Levy AF, et al. The blood-brain barrier: An engineering perspective. Frontiers in Neuroengineering. Epub ahead of print 30 August 2013. [CrossRef]
- Barber TW, Brockway JA, Higgins LS. THE DENSITY OF TISSUES IN AND ABOUT THE HEAD. Acta Neurol Scand 1970; 46: 85–92.
- Cottrell, JE. , Young WL. Cottrell and Young’s neuroanesthesia. Mosby/Elsevier, 2010.
- Hashem M, Zhang Q, Wu Y, Johnson TW, Dunn JF. Using a multimodal near-infrared spectroscopy and MRI to quantify gray matter metabolic rate for oxygen: A hypothermia validation study. Neuroimage. 2020 Feb 1;206:116315. [CrossRef] [PubMed] [PubMed Central]
- Raschdorf, K. , Mohseni, A., Hogle, K. et al. Evaluation of transcutaneous near-infrared spectroscopy for early detection of cardiac arrest in an animal model. Sci Rep 13, 4537 (2023). [CrossRef]
- Ayaz H, Baker WB, Blaney G, Boas DA, Bortfeld H, Brady K, Brake J, Brigadoi S, Buckley EM, Carp SA, Cooper RJ, Cowdrick KR, Culver JP, Dan I, Dehghani H, Devor A, Durduran T, Eggebrecht AT, Emberson LL, Fang Q, Fantini S, Franceschini MA, Fischer JB, Gervain J, Hirsch J, Hong KS, Horstmeyer R, Kainerstorfer JM, Ko TS, Licht DJ, Liebert A, Luke R, Lynch JM, Mesquida J, Mesquita RC, Naseer N, Novi SL, Orihuela-Espina F, O'Sullivan TD, Peterka DS, Pifferi A, Pollonini L, Sassaroli A, Sato JR, Scholkmann F, Spinelli L, Srinivasan VJ, St Lawrence K, Tachtsidis I, Tong Y, Torricelli A, Urner T, Wabnitz H, Wolf M, Wolf U, Xu S, Yang C, Yodh AG, Yücel MA, Zhou W. Optical imaging and spectroscopy for the study of the human brain: status report. Neurophotonics. 2022 Aug;9(Suppl 2):S24001. [CrossRef] [PubMed] [PubMed Central]
- Banaji M, Mallet A, Elwell CE, Nicholls P, Cooper CE. A model of brain circulation and metabolism: NIRS signal changes during physiological challenges. PLoS Comput Biol. 2008 Nov;4(11):e1000212. [CrossRef] [PubMed] [PubMed Central]
Figure 1.
(a) Experiment setup and (b) hNIRS system.
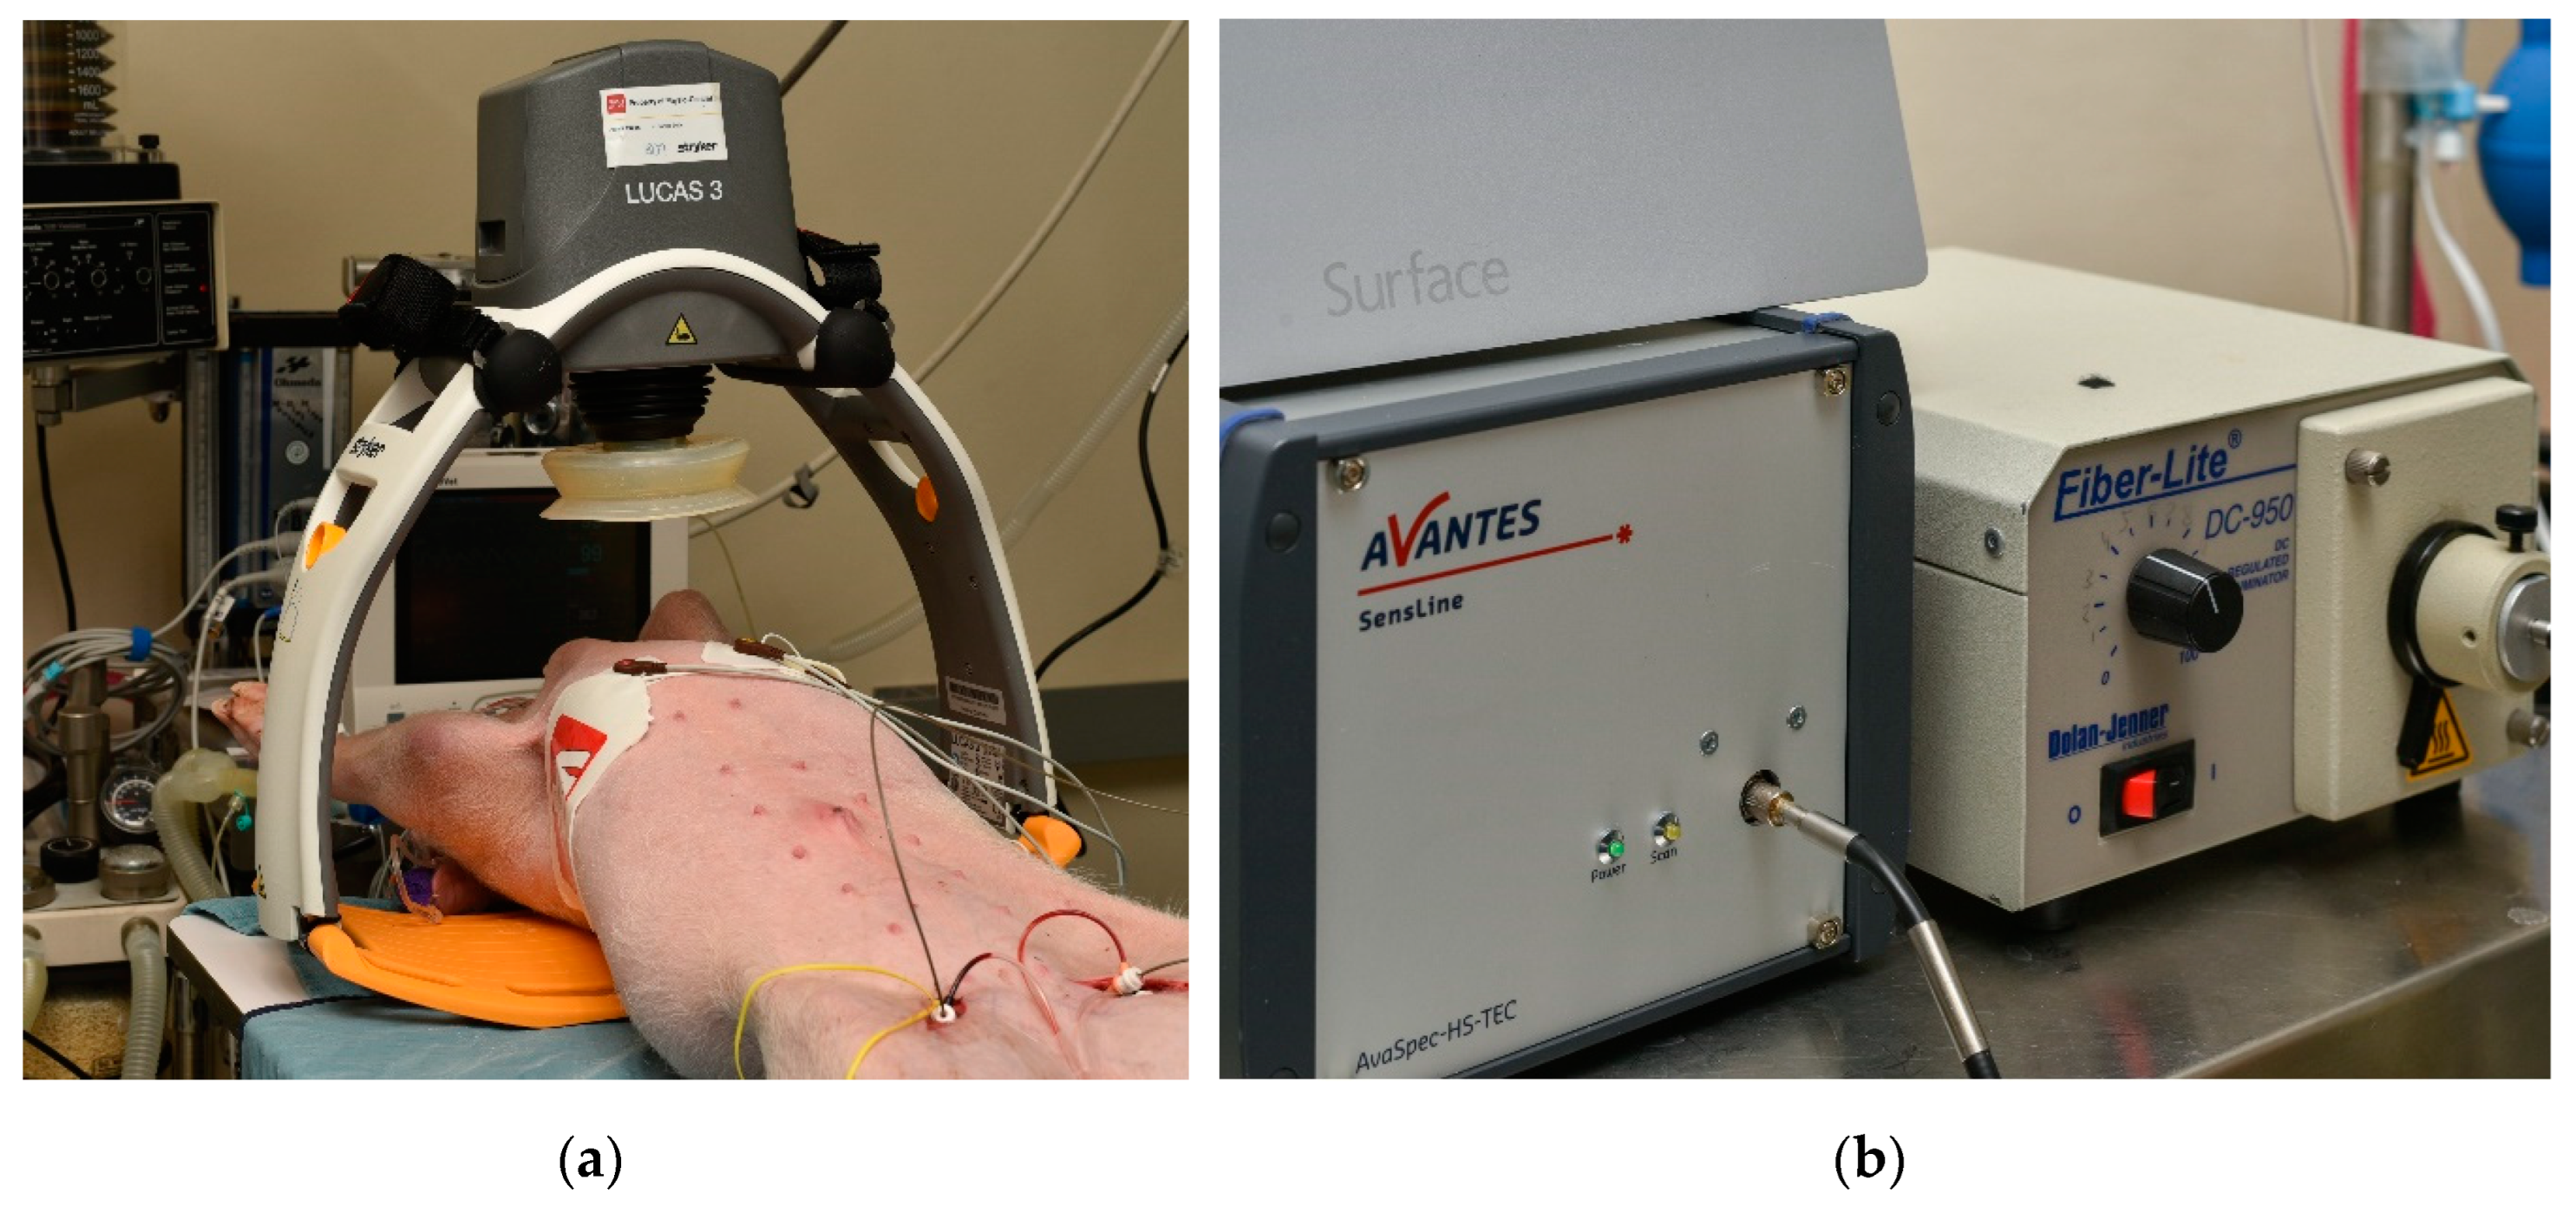
Table 1.
This is a table. Tables should be placed in the main text near to the first time they are cited.
Table 1.
This is a table. Tables should be placed in the main text near to the first time they are cited.
| Relationship / Parameter | R2 | α | p-value (α ≠ 1) | |
|---|---|---|---|---|
| Zone I | CMRO2 vs rCCO | 0.986 ± 0.158 | 0.590 ± 0.277 | 0.003 |
| CBF vs rCCO | 0.989 ± 0.253 | 0.475 ± 0.356 | 0.005 | |
| CBF vs CMRO2 | 0.996 ± 0.005 | 0.909 ± 0.339 | 0.827 | |
| Zone II | CMRO2 vs rCCO | 0.974 ± 0.147 | 0.707 ± 0.388 | 0.135 |
| CBF vs rCCO | 0.961 ± 0.112 | 0.608 ± 0.350 | 0.023 | |
| CBF vs CMRO2 | 0.998 ± 0.011 | 0.888 ± 0.314 | 0.999 |
Disclaimer/Publisher’s Note: The statements, opinions and data contained in all publications are solely those of the individual author(s) and contributor(s) and not of MDPI and/or the editor(s). MDPI and/or the editor(s) disclaim responsibility for any injury to people or property resulting from any ideas, methods, instructions or products referred to in the content. |
© 2025 by the authors. Licensee MDPI, Basel, Switzerland. This article is an open access article distributed under the terms and conditions of the Creative Commons Attribution (CC BY) license (http://creativecommons.org/licenses/by/4.0/).
Copyright: This open access article is published under a Creative Commons CC BY 4.0 license, which permit the free download, distribution, and reuse, provided that the author and preprint are cited in any reuse.


