
Submitted:
18 August 2025
Posted:
19 August 2025
You are already at the latest version
Abstract
Extracorporeal cardiopulmonary resuscitation (ECPR) is increasingly used for refractory cardiac arrest, yet neurologic outcome is often limited by acute brain injury (ABI) secondary to disrupted cerebrovascular autoregulation (CVAR). We established a proof-of-concept porcine model that combines veno-arterial ECMO with dual-mode optical neuromonitoring. After 10 minutes of untreated ventricular fibrillation, ECMO support was initiated, and a cranial window enabled real-time laser speckle contrast imaging (LSCI) of cerebral blood flow (CBF) and intrinsic optical signal (IOS) mapping of cerebral blood volume (CBV). Mean arterial pressure (MAP) was recorded continuously, and vessel-specific hemoglobin-volume index (HVx) was calculated to quantify CVAR. Cortical vessels became pressure-passive—HVx \texorpdfstring{$\geq$}{>=} 0.3, indicating loss of autoregulation—during the initial minutes of reperfusion and again when ECMO pump speed was deliberately reduced to 75\% and 50\% of baseline. The impairment was heterogeneous and reversible, with adjacent vessels showing either intact (HVx \texorpdfstring{$\leq$}{< =} 0) or impaired CVAR in the same epoch. Neither pump flow nor systemic MAP reliably mirrored these microvascular changes: at several time points, CBF rose while pump output and MAP fell, and vice versa. Despite technical challenges (motion artifact, coagulopathy, lack of invasive flow validation), this single-subject study demonstrates the feasibility of simultaneous LSCI and IOS during ECPR.
Keywords:
extracorporeal cardiopulmonary resuscitation
; extracorporeal membrane oxygenation
; laser speckle contrast imaging
; intrinsic optical signal
; cerebrovascular autoregulation
; acute brain injury
1. Introduction
The American Heart Association (AHA) 2023 guidelines report an incidence of cardiac arrest affecting approximately 700,000 people in the United States [1]. Survivors of cardiac arrest (CA) often suffer from diffuse hypoxic-ischemic injury, resulting in devastating neurological outcomes. Extracorporeal cardiopulmonary resuscitation (ECPR) has been shown to reduce the cerebral post-resuscitation hypoperfusion phase, as it immediately restores perfusion upon initiation[2,3]. Non-randomized studies showed that survival and neurologic outcome (Cerebral Performance Category [CPC]: 1-2) at hospital discharge and 3-6 months post-arrest were better in adults who received ECPR compared to conventional CPR [4,5,6]. Early support for ECPR stemmed from observational studies which demonstrated variable rates of overall improved survival ranging from 15 to 50 percent [7,8,9,11]. Current guidelines promote the use of ECPR in select patient populations with refractory cardiac arrest after 10-15 minutes of conventional resuscitation efforts, with the goal of achieving cannulation in less than 60 minutes to reduce low flow states[1,10].
Recent data from randomized controlled trials (RCTs) provide additional insight into implentation of ECPR.Advanced reperfusion strategies for patients with out-of-hospital cardiac arrest and refractory ventricular fibrillation (ARREST) trial demonstrated an overall improved 6 month survival of 43% for those receiving ECPR compared to 7% survival for the standard advanced cardiac life support (ACLS) group. This trial ended prematurely due to early evidence of ECPR superiority[12]. Evidence, however, is not uniform. The Prague trial was a single center RCT which compared ECPR versus standard ACLS in out of hospital cardiac arrest. This study initially found significantly improved survival and neurologic outcomes at 3-months in the ECPR group however failed to maintain significance at their primary endpoint of 6-month survival benefit with CPC 1-2[13]. The INCEPTION trial was a multi-center RCT across 10 institutions with the primary endpoint of 30-day survival with CPC1-2 comparing ECPR versus ACLS. This study also failed to demonstrate primary endpoint significance. Acute brain injury (ABI) was a leading cause of death in all RCTs, ranging from 25-43% in these studies. ABI represents a primary cause for poor outcomes in ECPR, and potentially the reason for failure to meet primary endpoints in the Prague and Inception trials[14,15]. 40% of patients suffer ABI detectable on imaging or neurological examination and severely limit functional recovery[16]. These observations highlight an urgent need to understand and monitor cerebral physiology during ECPR so that post-resuscitation brain injury can be prevented or mitigated.
With the growing use of extracorporeal membrane oxygenation (ECMO) and the broader adoption of ECPR, meticulous neuromonitoring of cerebral physiology has become increasingly imperative as clinical experience continues to accumulate[17,18]. Cerebrovascular autoregulation (CVAR) may be central to the risk of brain injury. After conventional CA, CVAR is frequently absent or right-shifted, rendering cerebral perfusion pressure-passive and serving as an independent predictor of poor neurological outcomes[19,20]. In ECPR, the problem is further amplified: the brain first endures a prolonged period of low-flow ischemia, followed by an abrupt restoration of supra-physiologic cerebral blood flow (CBF). These conditions can overwhelm an already impaired CVAR, triggering reperfusion hyperemia and secondary brain ischemia[21]. However, data on how ECMO pump settings influence CBF, cerebral perfusion and CVAR remain extremely limited in both animal models and human studies. Advancing neurologic outcomes will require a deeper understanding of these dynamic cerebrovascular changes during ECMO support.
While ECPR has been shown to improve neurologic outcome after CA, specific guidelines for post-ECPR is sparse. One guideline by Cho et al suggests individualized blood pressure management in ECMO patients, tailored to dynamic CVAR (i.e permissive hypertension in the setting of ischemic stroke)[22]. It is essential to clarify how brain function, recovery and neurological outcomes depend on the state of CVAR. By maintaining stable CBF across a range of mean arterial pressures (MAP), CVAR serves as a critical safeguard against brain injury during extremes of blood flow. Sundgreen et al. demonstrated an impairment of CVAR after CA in 13 out of 18 patients[23]. Additional studies by Ameloot et al and Pham et al also demonstrated CVAR impairment after CA in 35% and 78% of patients respectively. Their studies found that CVAR impairment is associated with overall decreased survival at 90 and 180 days respectively[20,24]. These aforementioned studies did not include CVAR assessment in patients receiving ECPR. Currently, CVAR function is unknown in ECMO patients when restoration of CBF with continuous ECMO flow occurs after refractory CA. Laser-speckle contrast imaging (LSCI), widely used in retinal and cutaneous microcirculation research, enables real-time, wide-field mapping of CBF. In animal studies, it has been employed to generate full MAP–CBF curves, allowing precise localization of CVAR breakpoints and their loss following anesthesia or ischaemia[25]. These capabilities make LSCI an attractive tool for feasibility testing of CVAR monitoring after ECPR.
In this study, we performed a proof-of-concept experiment in porcine ECPR preparation, integrating LSCI and intrinsic optical signal (IOS) imaging to obtain real-time, wide-field maps of CBF and volume (CBV). We hypothesized that coupling LSCI-derived relative cerebral blood flow (rCBF) with simultaneously recorded MAP would allow construction of an individualized CVAR curve during early reperfusion. The successful acquisition of synchronized rCBF and MAP traces confirms the technical feasibility of this dual-mode approach and supports its potential as a bedside surrogate for CVAR assessment.
2. Materials and Methods
2.1. Experimental Procedure
2.1.1. Anesthesia and Intubation
Adult 30-kg swine were obtained. The timeline of the entire protocol is shown in Figure 1a. Animals were restrained, anesthetized with ketamine 4.5 mg/kg, xylazine 88 mg/kg, and telazol 1.1 mg/kg, endotracheally intubated, and mechanically ventilated with medical air supplemented with oxygen between 0.25 and 0.40 fraction of inspired oxygen. Animals were placed on a heating blanket to maintain core temperature in the physiologic range of 38.5±0.5℃. Peripheral intravenous catheter was inserted into the ear and anesthesia was maintained with intravenous propofol (12–20 mg/kg/hr).
2.1.2. Craniotomy and LSCI
A optical window was prepared to provide optical access to the brain via a 2 cm diameter craniotomy over the left parietal bone. A miniature LSCI microscope (dimensions/manufacturer) was attached to the optical window using bone wax and dental acrylic. A coronal cross-section of the cranial window and laser/camera geometry is illustrated in Figure 1b. Bilateral percutaneous femoral arterial and venous access were obtained for maintenance intravenous fluid therapy (lactated ringers or plasmalyte) and MAP measurements.
2.1.3. Cardiac Arrest
Cardiac arrest was induced via fibrillation. EKG and blood pressure monitoring confirmed a non-perfusing ventricular fibrillation and cardiac arrest. The ventilator was turned off. After 10 minutes of unsupported cardiac arrest, mechanical CPR was conducted for 2 minutes. Subsequently, the pigs were initiated on Venoarterial (VA)-ECMO by which deoxygenated blood was withdrawn from the venous system, oxygenated and pressurized through the machine, and returned to the arterial circulation. We maintained flows at 4L/min and MAP at 60-90 mm Hg. Both MAP and ECMO flow were continuously monitored with commercially available instruments and software (i.e., LabChart). Continuous recording of microvascular scale images of perfusion (CBF) and deoxyhemoglobin concentrations (dHb) in cortical arteries and veins and ECMO flow time series were obtained until 3 hours post-ECMO support.
2.2. Optical Imaging
2.2.1. LSCI Acquisition
Laser illumination was supplied by a 680 nm vertical-cavity surface-emitting diode (VCSEL; Vixar, MN; < 1 nm) mounted in a custom heat-sink on the microscope base. The diode was current-driven at 2.0-2.5 mA, delivering approximately 50 mW of optical power to the cortical surface. A two-element beam expander produced a 3×3 mm, top-hat intensity profile, which entered the craniotomy at a 15° incident angle to limit retro-reflection. The working distance from the final optic to the dura was 75 mm. Back-scattered light was collected through a 4.6 mm aspheric lens and passed through a 510 nm long-pass filter that removed pump reflections and haemoglobin absorption bands. Images were recorded with a 640×640-pixel, 10-bit CMOS sensor (NanEYE-GS, Awaiba; 3.6 m pitch), giving an in-plane spatial resolution of roughly 5 m across the complete 3×3 mm field of view. The camera operated at 15 frames with an exposure of 10 ms during stimulus epochs and 5 ms during continuous monitoring, ensuring speckle decorrelation times remained well below the exposure interval. A coaxial white-light LED was activated only during initial focusing to avoid speckle contrast degradation. Laser power, sensor linearity, and flat-field response were verified at the start of each experiment using a neutral-density ladder and a static diffusing phantom; the session proceeded only if measured speckle contrast matched theoretical predictions (K=0.18 at =5 ms). Raw 10-bit frames were streamed to a dedicated workstation via USB 2.0, with millisecond-resolution hardware time-stamps logged in parallel with physiological channels for later synchronization. Further details could be find in a previous publication[26]. For clarity, the complete acquisition-to-analysis pipeline is illustrated in Figure 1c.
2.2.2. LSCI Processing and ROI Analysis
All raw 10-bit speckle frames were transferred to MATLAB® (R2024a) for off-line processing. 30 successive frames from a 300 ms temporal window were first averaged to enhance signal-to-noise while retaining haemodynamic fluctuations below 3 Hz. Spatial speckle contrast for each averaged image was then calculated with a 5×5-pixel sliding kernel via Equation 1:
rCBF was derived with the standard inverse-square transformation (Equation 2) and normalized to the mean value recorded during a 10-s pre-intervention baseline immediately preceding ventricular fibrillation:
Rigid-body registration, implemented by maximizing cross-correlation with the first baseline frame, was applied to every stack; image sequences displaying residual in-plane motion greater than 0.5 pixel or transient vessel obscuration were discarded. Time-averaged intensity projections were exported to FIJI/ImageJ, where surface-vessel segments were delineated manually with the ROI Manager. ROIs were drawn on individual surface vessels evident in the time-averaged image (Figure 1d). The resulting binary masks were re-imported into MATLAB to extract mean rCBF time-series. Millisecond-resolution hardware triggers provided precise temporal alignment between the 1-Hz rCBF data and simultaneously acquired physiological signals such as MAP. Continuous recordings were parsed into 5-min blocks corresponding to baseline and each ECMO-flow setting. Within every block, MAP-versus-rCBF relationships were analyzed with piece-wise linear regression to estimate individual lower and upper limits of CVAR.
2.2.3. IOS Processing and HVx Calculation
IOS imaging used 570 nm LED illumination (LEDSupply, VT) passed through a 570 ± 5 nm band-pass filter (Thorlabs, NJ). The LED was driven at constant current by a Keithley 2400 source meter (Tektronix, OR) adjusted at the start of each experiment to maximise vessel contrast without saturating the detector. Back-scattered light was collected through a 60 mm f/2.8 macro lens (AF-Micro-Nikkor, Nikon, NY) and focused onto a 12-bit CCD camera (Infinity 3, Lumenera, Canada) operating at 300 ms exposure ( 3.3 fps). This yielded 20 µm in-plane resolution over a 5×7 mm field of view. Custom MATLAB® software triggered the camera, added millisecond time-stamps, and streamed raw images to a dedicated workstation. Focus was checked periodically; if motion degraded sharpness, the lens was readjusted. At 570 nm—an isosbestic wavelength for haemoglobin—the reflected intensity varies inversely with cerebral blood volume (CBV), permitting direct volumetric mapping without additional calibration.
After acquisition, IOS stacks were imported into MATLAB, linearly resampled to 1 Hz, and rigid-body registered to the first baseline frame (StackReg in FIJI/ImageJ)[26,27,28]. Four pial-vessel ROIs were traced manually; mean intensity in each ROI was inverted (1/intensity) and normalised to its 10-s baseline to yield fractional CBV (fCBV). Five-minute epochs corresponding to baseline and each ECMO-flow condition were extracted. MAP was down-sampled to 1 Hz and synchronised with fCBV, and the haemoglobin-volume index (HVx) was computed for every epoch as the Pearson correlation between MAP and fCBV: HVx > 0.3 indicates pressure-passive flow (impaired CVAR), whereas HVx ≤ 0 denotes intact autoregulation.
3. Results
The complete experiment was executed in one of six animals; the remaining five were excluded because of cannulation failure (n=1), fatal thrombosis (n=1), pronounced coagulopathy that obscured the cranial window (n=1), or excessive motion artefact (n=2). In the end, we successfully acquired quality data in one animal.
3.1. Physiology Overview
Figure 2 shows the systemic profile obtained from the successful preparation: pump flow was intentionally stepped from 100 % to 75 %, then to 50 %, and finally back to 75 %. At the outset MAP rose and fell in concert with circuit flow, but by 70 min the two curves diverged-arterial pressure climbed toward 70 mm Hg whereas pump flow stabilised near 80%. This progressive decoupling underscores that circuit settings alone do not predict cerebral perfusion during prolonged VA-ECMO.
3.2. Cerebral Microcirculation and Autoregulation
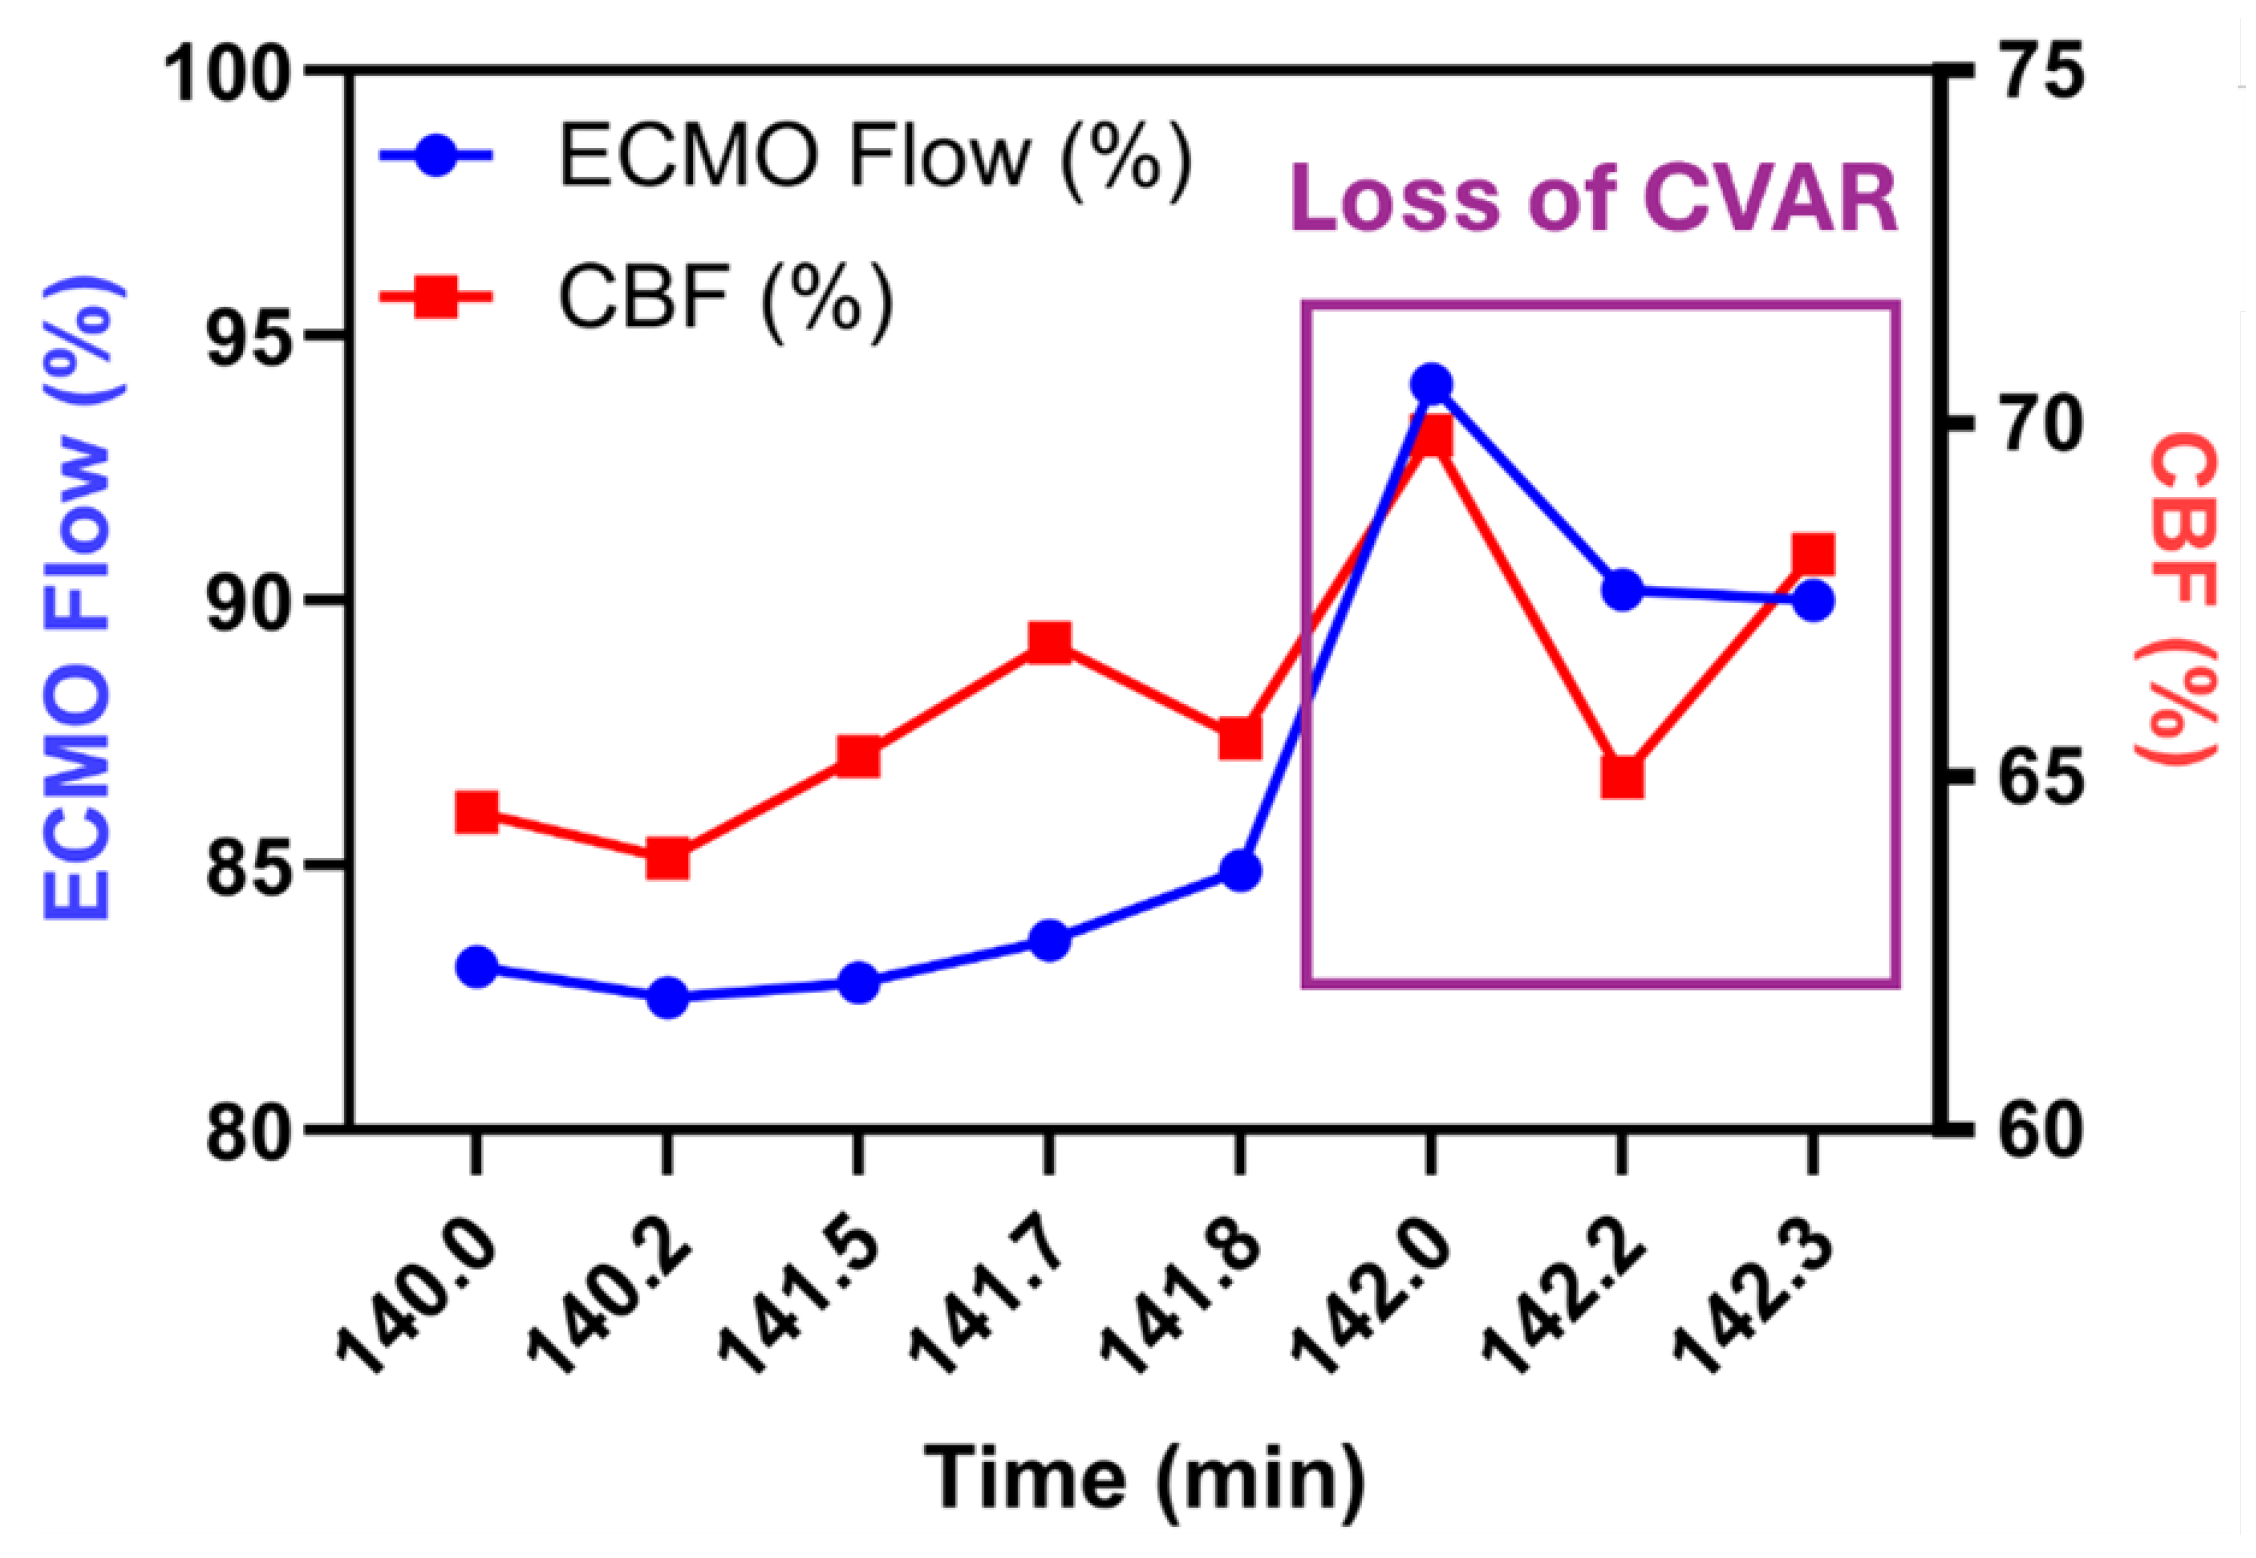
LSCI initially resolved five pial vessel segments (VS1 to VS5; Figure 3b) within the region marked in the cortical overview (Figure 3a), but VS5 was later excluded from the analysis because consecutive data gaps. During the final minutes of full-flow ECMO (100%), rCBF time-series from these vessels behaved heterogeneously (Figure 3f-j): VS1 increased by +19%, VS2 remained unchanged, and VS3 and VS4 drifted downward by 6-9%. When pump speed was reduced to 75% (Figure 3a-e), the pattern inverted. rCBF rose in VS3 to VS4 (+9-12%) but fell in VS1 and VS2 even though MAP declined by only 11 mm Hg (Table 1). Intrinsic-optical-signal analysis of the same epochs yielded HVx values that corroborated these shifts: pressure-passive behaviour (HVx>0.3) appeared in VS3 and VS4 at 75% flow, whereas VS1 and VS2 retained negative or near-zero HVx, indicating preserved autoregulation. Stepping the circuit from 75% down to 50% and back again reproduced the same vessel-by-vessel pattern (Table 1), implying that CVAR impairment in this model is both regional and reversible. A magnified excerpt of the final flow increase is plotted in Figure 4. In VS3, rCBF tracked the step-up in pump output almost one-for-one before separating again as CVAR recovered. Episodes of high MAP-rCBF synchrony (> 0.6) recurred 45-90 min after each ventilator or sweep-gas adjustment, suggesting a delayed cerebrovascular response to systemic PaCO2 and oxygen changes.

Table 1.
Hemoglobin Volume Index (HVx) by Vessel Segment and Experimental Phase.
| Phase | VS 1 | VS 2 | VS 3 | VS 4 | |
|---|---|---|---|---|---|
| Baseline | 0.33 | 0.21 | 0.06 | ||
| Early Injury | 0.06 | ||||
| Late Injury | |||||
| ECMO Flow 75% | 0.78 | 0.85 | |||
| ECMO Flow 75→50% | 0.04 | 0.81 | 0.86 | ||
| ECMO Flow 50→75% | 0.04 | 0.81 | 0.86 | ||
VS1: Large cortical arteriole (diameter located proximal to the anterior branch of the middle cerebral artery. VS2: Medium-sized arteriole in the parietal cortex, ∼600 m medial to VS1. VS3: Post-arteriolar venule draining the inferior aspect of the imaging window. VS4: Small venule immediately adjacent to VS3, selected to assess arterio-venous contrast.
4. Discussion
Collectively, our findings demonstrate that dual-mode optical monitoring is feasible through an acute cranial window during ECPR, that cortical perfusion is not reliably predicted by ECMO flow or systemic pressure alone, and that vessel-level CVAR can fluctuate rapidly in response to modest changes in circuit settings. This study demonstrated the feasibility of a swine ECPR protocol for utilization of LSCI and IOS to measure cerebral blood flow and MAP in pial vasculature on the cerebral cortex during ECPR.
The assessment of baseline CVAR using LSCI-derived rCBF and IOS-based fCBV was validated by the minimal change in these parameters during the pre-arrest phase despite changes in MAP. The resulting near zero HVx further serves as a metric to validate this method as a reliable tool to measure baseline CVAR. These metrics also proved to be successful in assessing for impaired CVAR both in the early reperfusion phase and throughout multiple time points at reduced ECMO flow. These impairments are validated by a change from near zero to positive HVx results, as well as delayed changes to cerebral blood flow during periods of sweep gas flow change. The strength of these findings lie in the potential of these modalities to provide novel insight into cerebral hemodynamics, offering an avenue to monitor physiologic cerebrovascular alterations during ECMO. This study proves it is capable of achieving high quality images and data from LSCI and IOS in a swine model of ECPR. The technical execution of LSCI and IOS in our setup highlights both the potential and the challenges associated with these imaging techniques.
Previously, LSCI has been studied in the retinal vascular network to identify changes in vessel diameter, branching patterns, and blood flow in response to various stimuli or interventions, which is crucial for understanding the pathophysiology of retinal conditions and the efficacy of treatments. IOS has been able to detect subtle changes in blood flow and oxygenation by studying the optical properties of the retina vary across different regions, allowing clinicians to infer aspects of retinal health and function. Thus, by integrating data from both LSCI and IOS, researchers and clinicians could one day utilize this information on blood flow velocities, vascular morphology, tissue oxygenation, and metabolic activity to better understand cerebrovascular changes during ECPR.
This proof-of-concept report rests on one technically successful preparation; all physiological and optical findings must therefore be viewed as anecdotal. Key signals that could validate our autoregulation interpretations are absent: intracranial pressure was not recorded, cerebral venous saturation and arterial blood gases were sampled only intermittently, and no gold-standard flow probe (e.g., Doppler) was placed for cross-calibration. Optical access was confined to a 3×3 mm cortical window, leaving deep and contralateral territories unassessed, and motion artifact still reduced usable data by > 8%. Finally, we did not perform post-mortem histology or MRI, so the physiological surrogates presented here cannot yet be linked to structural brain injury. Future work should include a larger cohort, continuous ICP and blood-gas monitoring, independent CBF validation, wider-field or bilateral imaging, and endpoint neuropathology to establish clinical relevance.
Technically specific challenges included camera stabilization in the setting of bleeding and motion artifact secondary to animal movement and in-experiment position changes. With regard to bleeding, subjects must be heparinized during ECMO and thus bleeding is a frequent complication and leads to an obscured field. This issue can compromise image quality and limit the acquisition of consistent image data and optical signals. Future experiments will require adaptations to ensure hemostasis despite anticoagulation during ECMO to produce reliable images. Similarly, enhancements to protocol design to minimize motion during experiments to limit artifact will be required to ensure data and image integrity are not compromised. This will enhance the ability to discern between physiologic change from artifact. While filtration and normalization techniques were utilized to mitigate the impact of these artifacts, it must be acknowledged that such measures cannot eliminate noise entirely. In further experiments, additional measures must be taken to reduce noise for precise analysis of the results.
5. Conclusions
ECPR remains a critical intervention for refractory cardiac arrest, yet ABI, closely linked to CVAR dysfunction, continues to limit overall outcomes. Clinicians currently lack reliable tools to assess CBF and cerebrovascular dysregulation in real time clinically. This study establishes a feasible swine ECPR protocol and, for the first time, highlights the potential of LSCI and IOS to evaluate CVAR impairment and neurologic injury in the ECMO setting. While these imaging modalities show significant promise for advancing understanding of cerebral vascular responses, technical limitations identified in this pilot study underscore the need for refinement. Future studies should address these challenges, include larger cohorts, and incorporate additional biomarkers to strengthen neuropathologic validation.
Author Contributions
Writing—original draft preparation, Mingfeng Cao and Madison Malfitano; writing—review and editing, Mingfeng Cao, Madison Malfitano, Eric Etchill, and Jessica Briscoe; experiments, Eric Etchill and Kelsey Verdi; conceptualization and design, Risheng Xu; data interpretation, Qihong Wang, Jin Kook Kang, Ifeanyi Chinedozi, Zachary Darby, Nitish Thakor, Romergryko Geocadin, and Glenn Whitman. All authors have read and approved the final manuscript.
Funding
This research was funded by the Johns Hopkins Magic That Matters Foundation and the National Institutes of Health (NIH) under grant numbers 1K23HL157610 and 1R21NS135045 (Sung-Min Cho). The APC was funded by the Johns Hopkins Magic That Matters Foundation.
Institutional Review Board Statement
All experiments were conducted by an approved Johns Hopkins University Animal Care and Use Committee (JHU ACUC) protocol. The Johns Hopkins University animal facility is accredited by the American Association for the Accreditation of Laboratory Animal Care and meets the National Institutes of Health (NIH) standards outlined in the “Guide for the Care and Use of Laboratory Animals.
Data Availability Statement
The data presented in this study are available on request from the corresponding author.
Conflicts of Interest
The authors declare no conflicts of interest.
Abbreviations
The following abbreviations are used in this manuscript:
| ABI | Acute Brain Injury |
| CA | Cardiac Arrest |
| CBF | Cerebral Blood Flow |
| CBV | Cerebral Blood Volume |
| CVAR | Cerebrovascular Autoregulation |
| ECMO | Extracorporeal Membrane Oxygenation |
| ECPR | Extracorporeal Cardiopulmonary Resuscitation |
| fCBV | Fractional Cerebral Blood Volume |
| HVx | Hemoglobin Volume Index |
| ICP | Intracranial Pressure |
| IOS | Intrinsic Optical Signal Imaging |
| LSCI | Laser Speckle Contrast Imaging |
| MAP | Mean Arterial Pressure |
| PaCO2 | Arterial Partial Pressure of Carbon Dioxide |
| ROI | Region of Interest |
| VS | Vessel Segment |
References
- Perman, S.M.; Elmer, J.; Maciel, C.B.; et al. 2023 American Heart Association Focused Update on Adult Advanced Cardiovascular Life Support: An Update to the American Heart Association Guidelines for Cardiopulmonary Resuscitation and Emergency Cardiovascular Care. Circulation 2024, 149. [Google Scholar] [CrossRef] [PubMed]
- Iordanova, B.; Li, L.; Clark, R.S.B.; Manole, M.D. Alterations in Cerebral Blood Flow after Resuscitation from Cardiac Arrest. Front. Pediatr. 2017, 5, 174. [Google Scholar] [CrossRef] [PubMed]
- Conrad, S.A.; Rycus, P.T. Extracorporeal membrane oxygenation for refractory cardiac arrest. Ann. Card. Anaesth. 2017, 20 (Suppl), S4–S10. [Google Scholar] [CrossRef]
- Kim, S.J.; Kim, H.J.; Lee, H.Y.; Ahn, H.S.; Lee, S.W. Comparing extracorporeal cardiopulmonary resuscitation with conventional cardiopulmonary resuscitation: A meta-analysis. Resuscitation 2016, 103, 106–116. [Google Scholar] [CrossRef] [PubMed]
- Beyea, M.M.; Tillmann, B.W.; Iansavichene, A.E.; Randhawa, V.K.; Van Aarsen, K.; Nagpal, A.D. Neurologic outcomes after extracorporeal membrane oxygenation assisted CPR for resuscitation of out-of-hospital cardiac arrest patients: A systematic review. Resuscitation 2018, 130, 146–158. [Google Scholar] [CrossRef] [PubMed]
- Yukawa, T.; Kashiura, M.; Sugiyama, K.; Tanabe, T.; Hamabe, Y. Neurological outcomes and duration from cardiac arrest to the initiation of extracorporeal membrane oxygenation in patients with out-of-hospital cardiac arrest: a retrospective study. Scand. J. Trauma Resusc. Emerg. Med. 2017, 25, 95. [Google Scholar] [CrossRef]
- Stub, D.; Bernard, S.; Pellegrino, V.; et al. Refractory cardiac arrest treated with mechanical CPR, hypothermia, ECMO and early reperfusion (the CHEER trial). Resuscitation 2015, 86, 88–94. [Google Scholar] [CrossRef] [PubMed]
- Chen, Y.S.; Lin, J.W.; Yu, H.Y.; et al. Cardiopulmonary resuscitation with assisted extracorporeal life-support versus conventional cardiopulmonary resuscitation in adults with in-hospital cardiac arrest: an observational study and propensity analysis. Lancet 2008, 372, 554–561. [Google Scholar] [CrossRef]
- Lamhaut, L.; Hutin, A.; Puymirat, E.; et al. A Pre-Hospital Extracorporeal Cardio Pulmonary Resuscitation (ECPR) strategy for treatment of refractory out hospital cardiac arrest: An observational study and propensity analysis. Resuscitation 2017, 117, 109–117. [Google Scholar] [CrossRef]
- Richardson, A.C.; Tonna, J.E.; Nanjayya, V.; et al. Extracorporeal Cardiopulmonary Resuscitation in Adults. Interim Guideline Consensus Statement From the Extracorporeal Life Support Organization. ASAIO J. 2021, 67, 221–228. [Google Scholar] [CrossRef]
- Sakamoto, T.; Morimura, N.; Nagao, K.; et al. Extracorporeal cardiopulmonary resuscitation versus conventional cardiopulmonary resuscitation in adults with out-of-hospital cardiac arrest: A prospective observational study. Resuscitation 2014, 85, 762–768. [Google Scholar] [CrossRef]
- Yannopoulos, D.; Bartos, J.; Raveendran, G.; et al. Advanced reperfusion strategies for patients with out-of-hospital cardiac arrest and refractory ventricular fibrillation (ARREST): a phase 2, single centre, open-label, randomised controlled trial. Lancet 2020, 396, 1807–1816. [Google Scholar] [CrossRef]
- Belohlavek, J.; Smalcova, J.; Rob, D.; et al. Effect of Intra-arrest Transport, Extracorporeal Cardiopulmonary Resuscitation, and Immediate Invasive Assessment and Treatment on Functional Neurologic Outcome in Refractory Out-of-Hospital Cardiac Arrest: A Randomized Clinical Trial. JAMA 2022, 327. [Google Scholar] [CrossRef]
- Cho, S.M.; Ziai, W.; Mayasi, Y.; et al. Noninvasive Neurological Monitoring in Extracorporeal Membrane Oxygenation. ASAIO J. 2020, 66, 388–393. [Google Scholar] [CrossRef] [PubMed]
- Cho, S.M.; Farrokh, S.; Whitman, G.; Bleck, T.P.; Geocadin, R.G. Neurocritical Care for Extracorporeal Membrane Oxygenation Patients. Crit. Care Med. 2019, 47, 1773–1781. [Google Scholar] [CrossRef] [PubMed]
- Suverein, M.M.; Delnoij, T.S.R.; Lorusso, R.; et al. Early Extracorporeal CPR for Refractory Out-of-Hospital Cardiac Arrest. N. Engl. J. Med. 2023, 388, 299–309. [Google Scholar] [CrossRef]
- Richardson, A.S.C.; Schmidt, M.; Bailey, M.; Pellegrino, V.A.; Rycus, P.T.; Pilcher, D.V. ECMO Cardio-Pulmonary Resuscitation (ECPR), trends in survival from an international multicentre cohort study over 12-years. Resuscitation 2017, 112, 34–40. [Google Scholar] [CrossRef]
- McCarthy, F.H.; McDermott, K.M.; Kini, V.; et al. Trends in U.S. Extracorporeal Membrane Oxygenation Use and Outcomes: 2002-2012. Semin. Thorac. Cardiovasc. Surg. 2015, 27, 81–88. [Google Scholar] [CrossRef] [PubMed]
- Petrovčič, R.; Rakusa, M.; Markota, A. Monitoring of Cerebral Blood Flow Autoregulation after Cardiac Arrest. Medicina (Kaunas) 2024, 60. [Google Scholar] [CrossRef]
- Pham, P.; Bindra, J.; Chuan, A.; Jaeger, M.; Aneman, A. Are changes in cerebrovascular autoregulation following cardiac arrest associated with neurological outcome? Results of a pilot study. Resuscitation 2015, 96, 192–198. [Google Scholar] [CrossRef]
- Wilcox, C.; Choi, C.W.; Cho, S.M. Brain injury in extracorporeal cardiopulmonary resuscitation: translational to clinical research. J. Neurocrit. Care 2021, 14, 63–77. [Google Scholar] [CrossRef]
- Cho, S.M.; Hwang, J.; Chiarini, G.; et al. Neurological monitoring and management for adult extracorporeal membrane oxygenation patients: Extracorporeal Life Support Organization consensus guidelines. Crit. Care 2024, 28. [Google Scholar] [CrossRef]
- Sundgreen, C.; Larsen, F.S.; Herzog, T.M.; Knudsen, G.M.; Boesgaard, S.; Aldershvile, J. Autoregulation of cerebral blood flow in patients resuscitated from cardiac arrest. Stroke 2001, 32, 128–132. [Google Scholar] [CrossRef] [PubMed]
- Ameloot, K.; Genbrugge, C.; Meex, I.; et al. An observational near-infrared spectroscopy study on cerebral autoregulation in post-cardiac arrest patients: Time to drop ‘one-size-fits-all’ hemodynamic targets? Resuscitation 2015, 90, 121–126. [Google Scholar] [CrossRef]
- Ayata, C.; Dunn, A.K.; Gursoy-Özdemir, Y.; Huang, Z.; Boas, D.A.; Moskowitz, M.A. Laser Speckle Flowmetry for the Study of Cerebrovascular Physiology in Normal and Ischemic Mouse Cortex. J. Cereb. Blood Flow Metab. 2004, 24, 744–755. [Google Scholar] [CrossRef] [PubMed]
- Senarathna, J.; Yu, H.; Deng, C.; et al. A miniature multi-contrast microscope for functional imaging in freely behaving animals. Nat. Commun. 2019, 10. [Google Scholar] [CrossRef]
- Schindelin, J.; Arganda-Carreras, I.; Frise, E.; et al. Fiji: an open-source platform for biological-image analysis. Nat. Methods 2012, 9, 676–682. [Google Scholar] [CrossRef]
- Schneider, C.A.; Rasband, W.S.; Eliceiri, K.W. NIH Image to ImageJ: 25 years of image analysis. Nat. Methods 2012, 9, 671–675. [Google Scholar] [CrossRef]
Figure 1.
(a) Overview of the porcine extracorporeal cardiopulmonary resuscitation preparation, showing anaesthesia, vascular cannulation, cranial-window placement, baseline recording, ventricular-fibrillation arrest, brief manual CPR, and subsequent veno-arterial ECMO. (b) Coronal cut-away of the acrylic cranial window: the oblique 680 nm laser beam and coaxial camera used for laser-speckle contrast imaging view the intact dura and underlying pial vessels. (c) Data pipeline: camera acquisition → frame averaging/registration → speckle-contrast or intensity conversion to relative CBF or CBV → ROI extraction → synchronisation with MAP for CVAR. (d) Representative time-averaged cortical image obtained with LSCI, illustrating the high-resolution view (scale bar = 5 mm) of the pial arterial and venous network used for ROI selection.
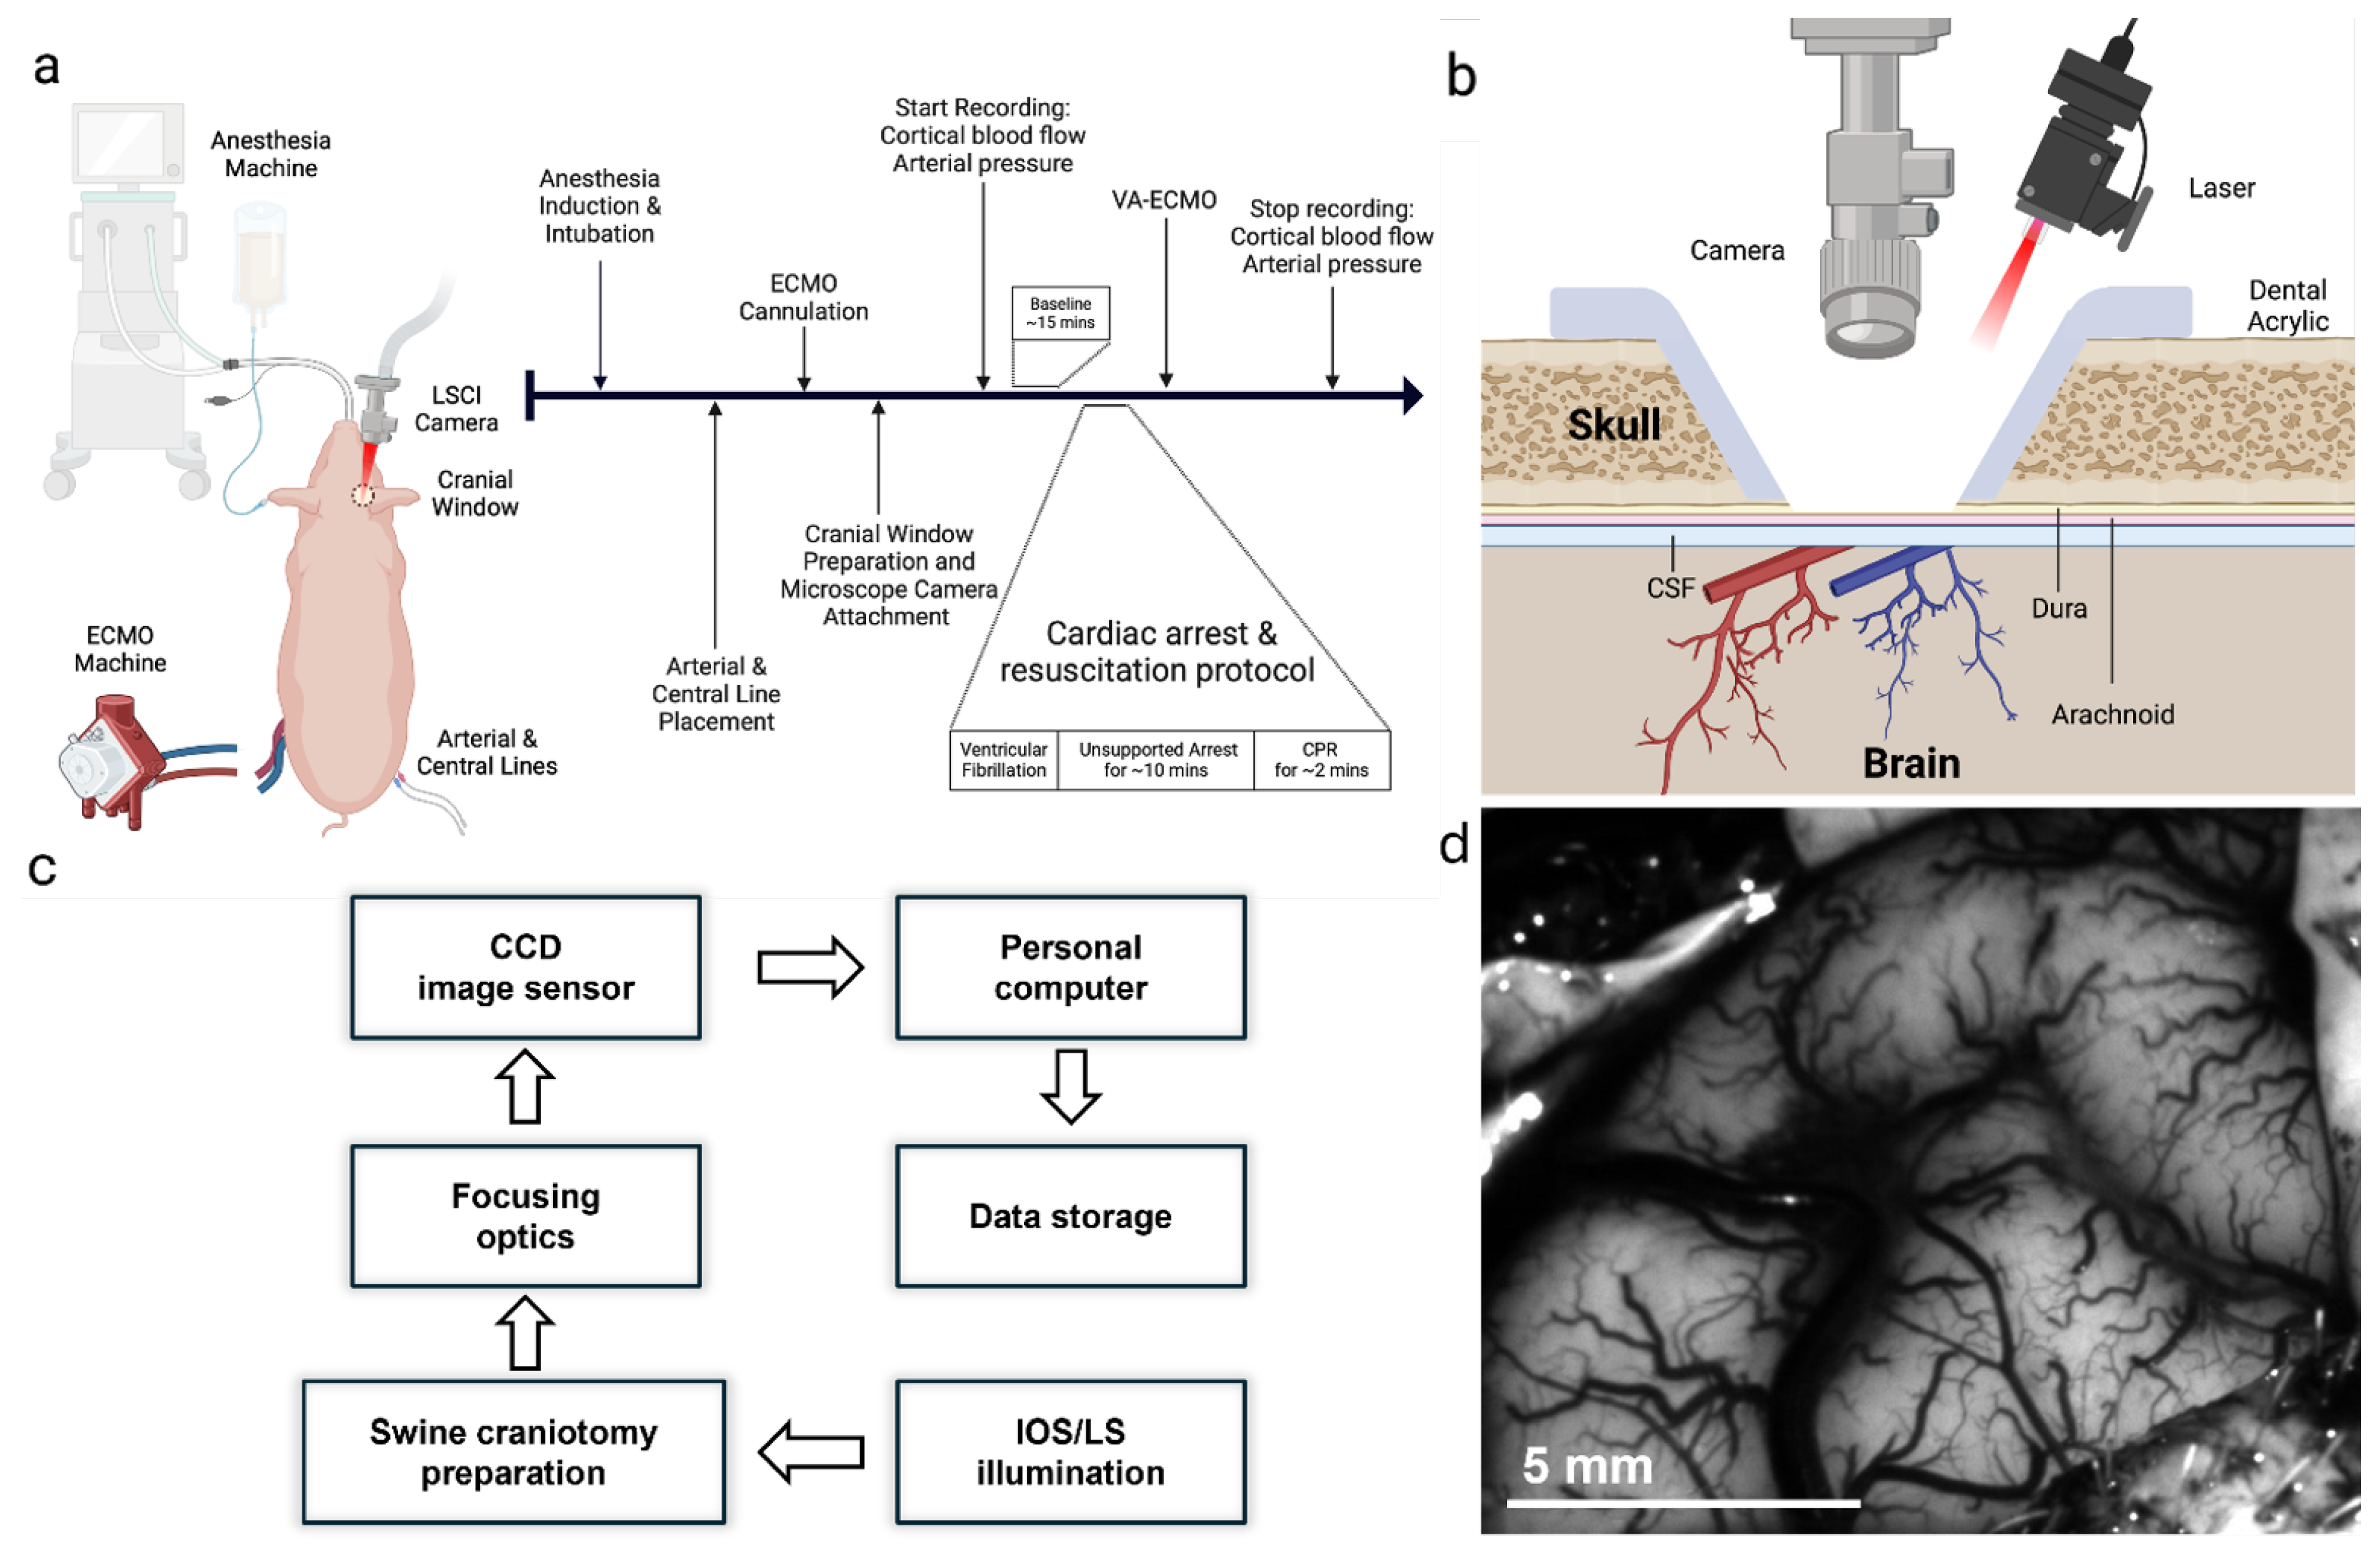
Figure 2.
Normalised ECMO flow (red, left axis) and invasive blood pressure (black, right axis) over a 95-min monitoring period. Yellow blocks mark deliberate step-changes in circuit flow, blue blocks indicate intervals used for ROI-based rCBF analysis, and green blocks denote ventilator or sweep-gas adjustments. Arterial pressure initially follows pump output but progressively recovers and loses synchrony, illustrating the decoupling between systemic haemodynamics and circuit settings.
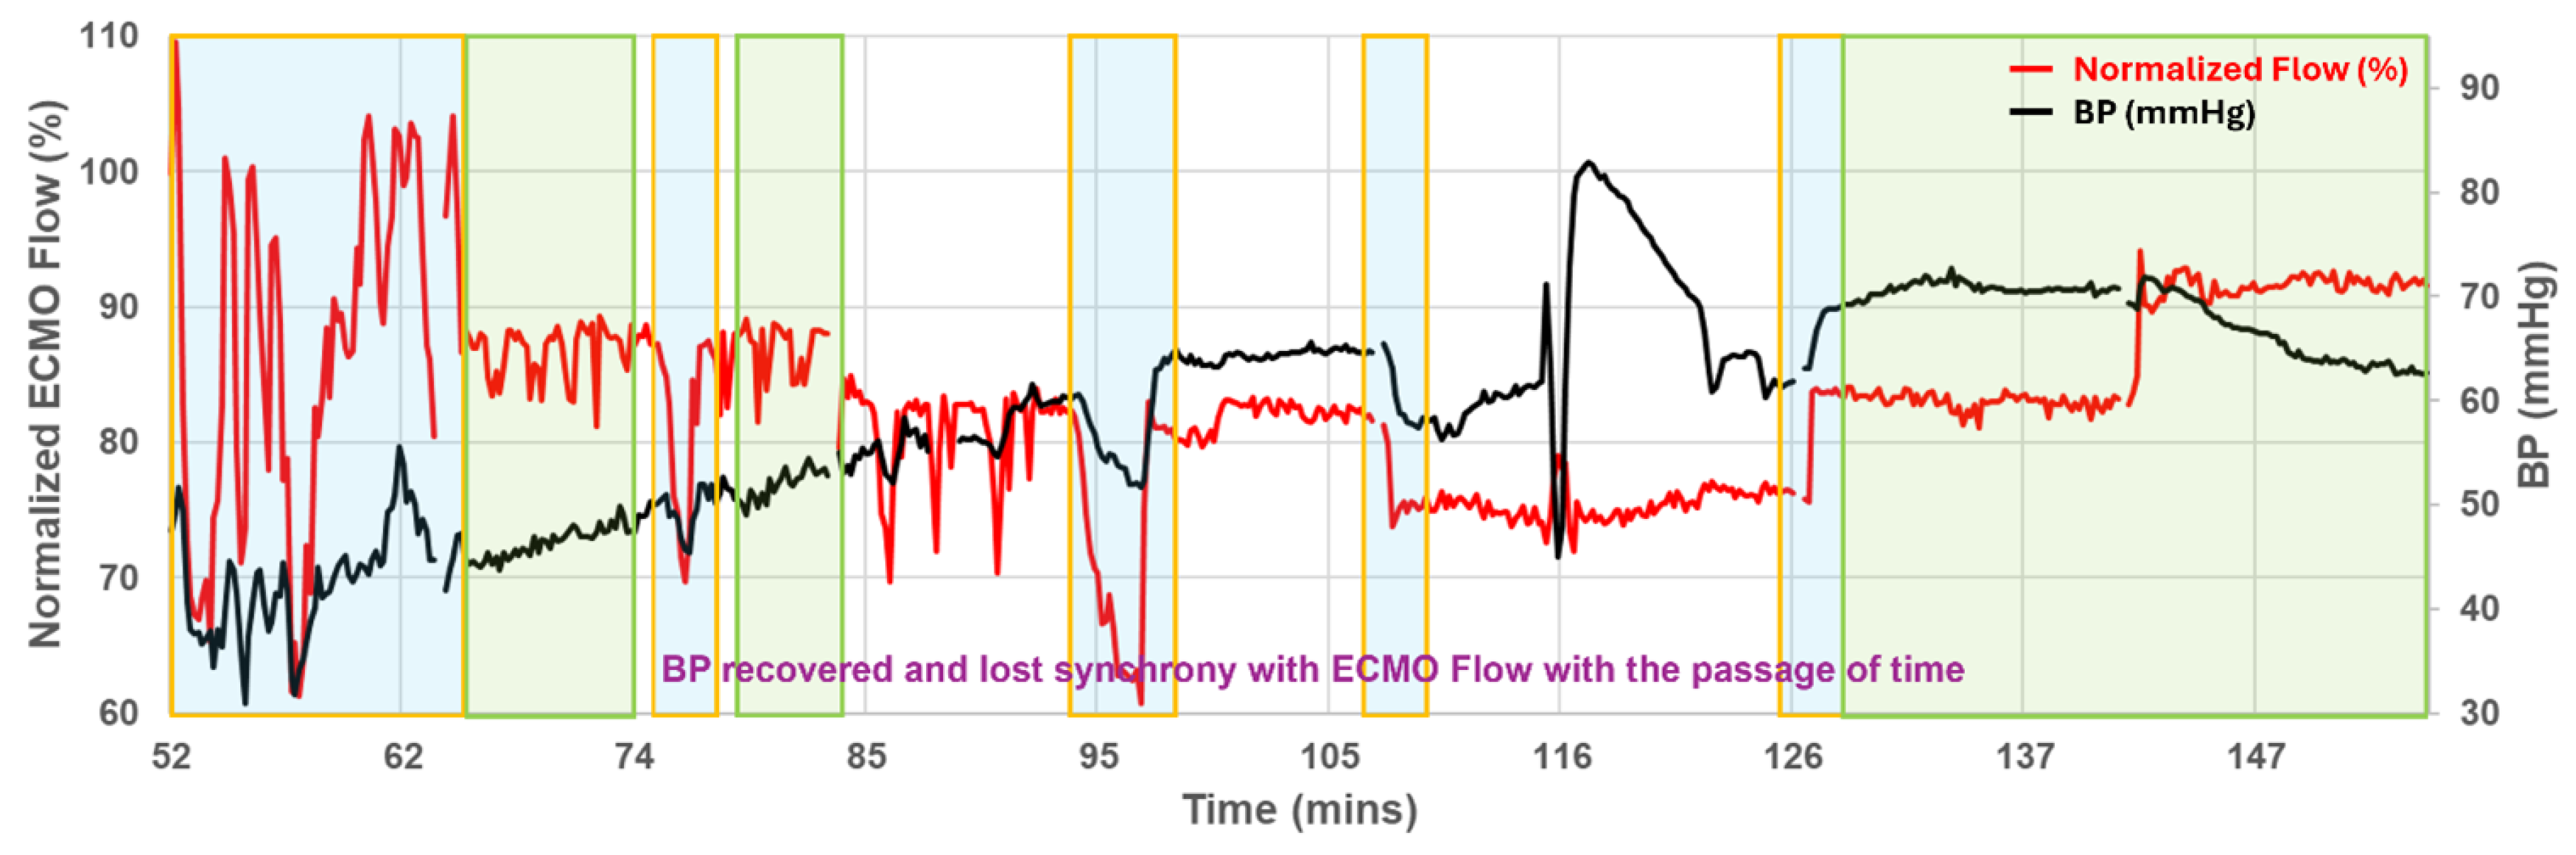
Figure 3.
(a–e) MAP (grey) superimposed on vessel-specific fCBV traces (black) during 75% ECMO flow; HVx values inset. (f–j) Same display for the preceding 100%-flow period. Positive HVx in VS3–VS4 during reduced flow indicates pressure-passive behaviour, whereas VS1 and VS2 retain negative or near-zero HVx, reflecting preserved autoregulation. VS5 was excluded from the analysis because consecutive data gaps. Positive HVx denotes pressure-passive flow (impaired CVAR), whereas negative HVx denotes intact autoregulation.
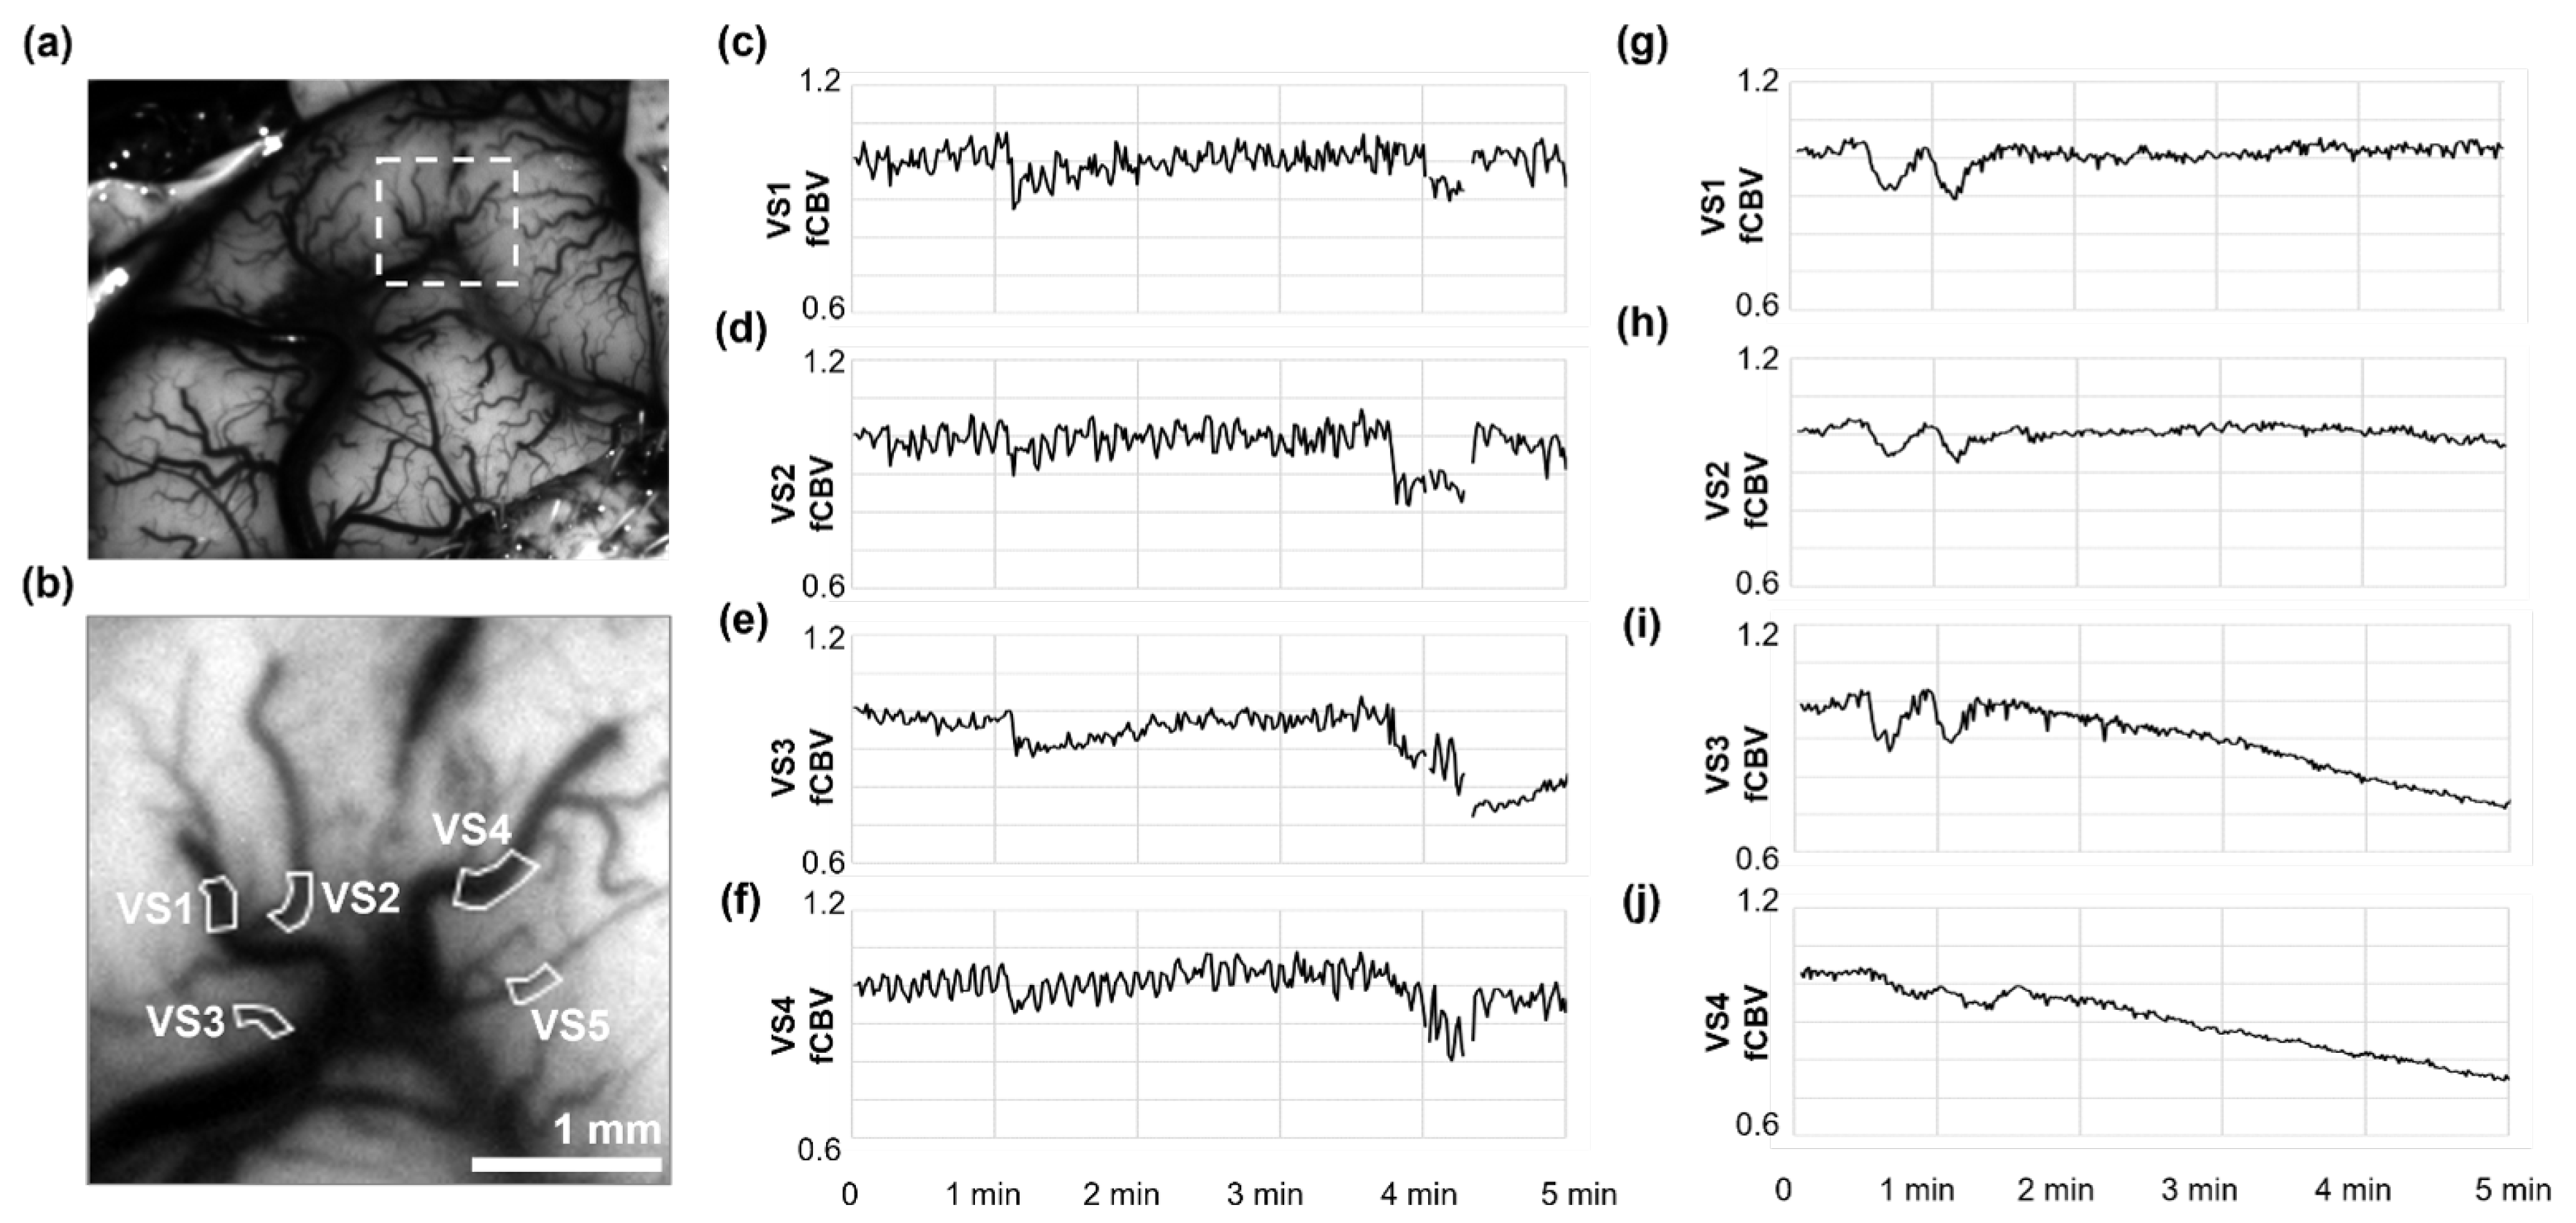
Figure 4.
Zoomed segment from 140.0–142.3 min (data from vessel segment VS3). ECMO flow (blue circles, left axis) increases steadily, while rCBF (red squares, right axis) remains stable until both rise in parallel (purple box), signifying pressure-passive behaviour. The subsequent separation of the curves reflects re-establishment of autoregulatory control.
Disclaimer/Publisher’s Note: The statements, opinions and data contained in all publications are solely those of the individual author(s) and contributor(s) and not of MDPI and/or the editor(s). MDPI and/or the editor(s) disclaim responsibility for any injury to people or property resulting from any ideas, methods, instructions or products referred to in the content. |
© 2025 by the authors. Licensee MDPI, Basel, Switzerland. This article is an open access article distributed under the terms and conditions of the Creative Commons Attribution (CC BY) license (http://creativecommons.org/licenses/by/4.0/).
Copyright: This open access article is published under a Creative Commons CC BY 4.0 license, which permit the free download, distribution, and reuse, provided that the author and preprint are cited in any reuse.


