
Submitted:
02 January 2025
Posted:
07 January 2025
You are already at the latest version
Abstract
Diffusing solar photovoltaic (PV) systems is believed to be a promising solution for energy crises and reducing greenhouse gas emissions. This encourages households, organizations, and enterprises to install solar PV systems. On the contrary, there are many solar PV systems connected to the power distribution grid without required procedures. Power distribution grid operators cannot detect the locations of these solar PV systems. Thus, it is necessary to assess the impact of solar PV systems on the power distribution grid in detail, even though there are multiple economic and environmental advantages associated with installing solar PV systems. This study analyzes the changes in an overloaded power distribution grid's power losses and voltage deviations with solar PV systems. There are two main factors considered for assessing the impact of the solar PV system on the power distribution grid: the total installed capacity of the solar PV systems and the location of the connection. Based on a comparison between the measurement results of three feeders with higher loads in the Ulaanbaatar area, the Dambadarjaa feeder, which has the highest load, was selected. The impact of the solar PV systems on the selected feeder is analyzed by connecting 8 cases of solar PV systems at four different locations. Their total installed capacities vary between 25 and 80 percent of the highest daily load of the selected feeder. The results show that the power loss of the feeder can be greatly reduced when the total installed capacity of the solar PV systems is selected optimally, and the location of the connection is at the end of the power distribution grid.
Keywords:
solar photovoltaic system
; power distribution grid
; power loss
; voltage deviation
1. Introduction
Diffusing solar photovoltaic (PV) systems is considered as a promising solution against energy crises and an effective way to reduce greenhouse gas emissions. The cumulative installed capacity of solar PV systems has significantly increased in the last decade [1]. Equipment-related costs are notably reduced year by year as technological advancements are in place [2]. As a result, solar PV systems and their related legal frameworks are being developed not only in highly developed countries but also in developing nations [3,4,5]. For instance, the regulation on the consumer renewable energy system’s interconnection to the power distribution grid was approved in August 2020 for Mongolia, and this was updated in 2024 [6]. Based on the factors mentioned above, the number of households, organizations, and enterprises interested in installing solar photovoltaic systems is continuously increasing.
However, there may be power quality issues such as voltage fluctuation and reverse power flow when the solar PV system with a high installed capacity is connected to the power distribution grid since the existing power infrastructure is radial and is designed for unidirectional power flow [7]. In addition, the complexity of dispatching the generation of solar PV systems is getting much higher than that of conventional electricity sources [8].
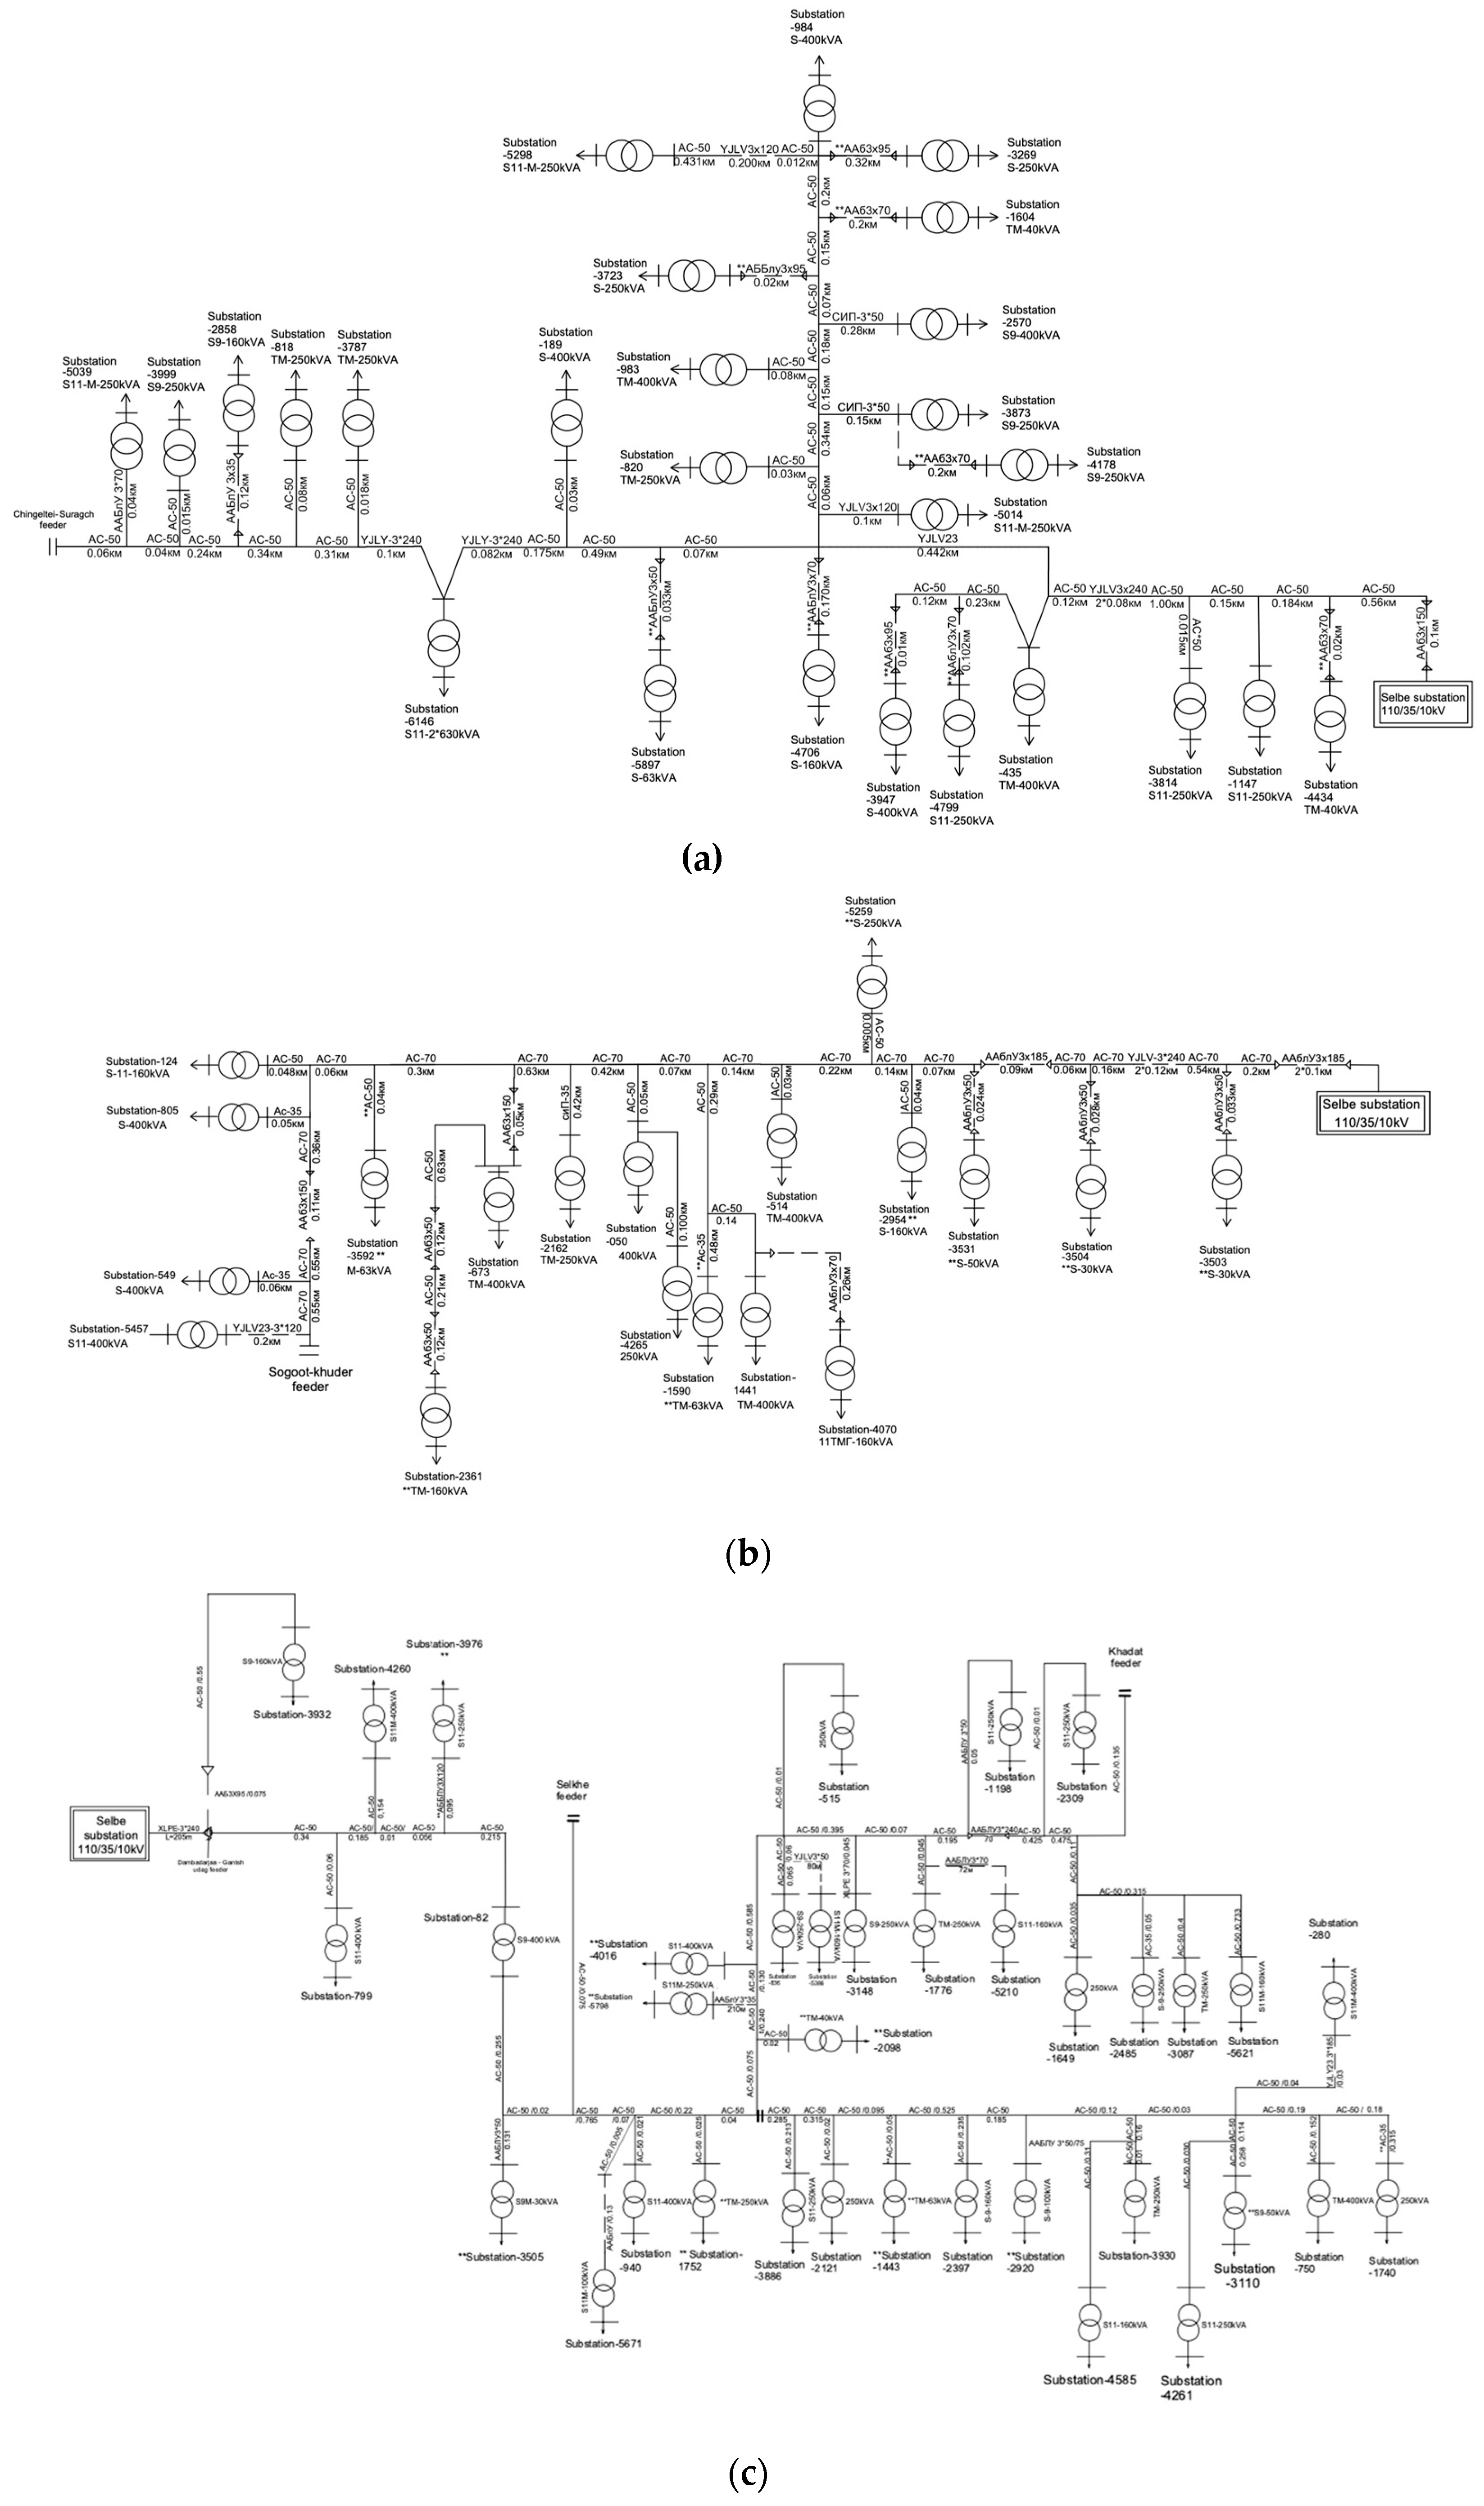
Figure 1.
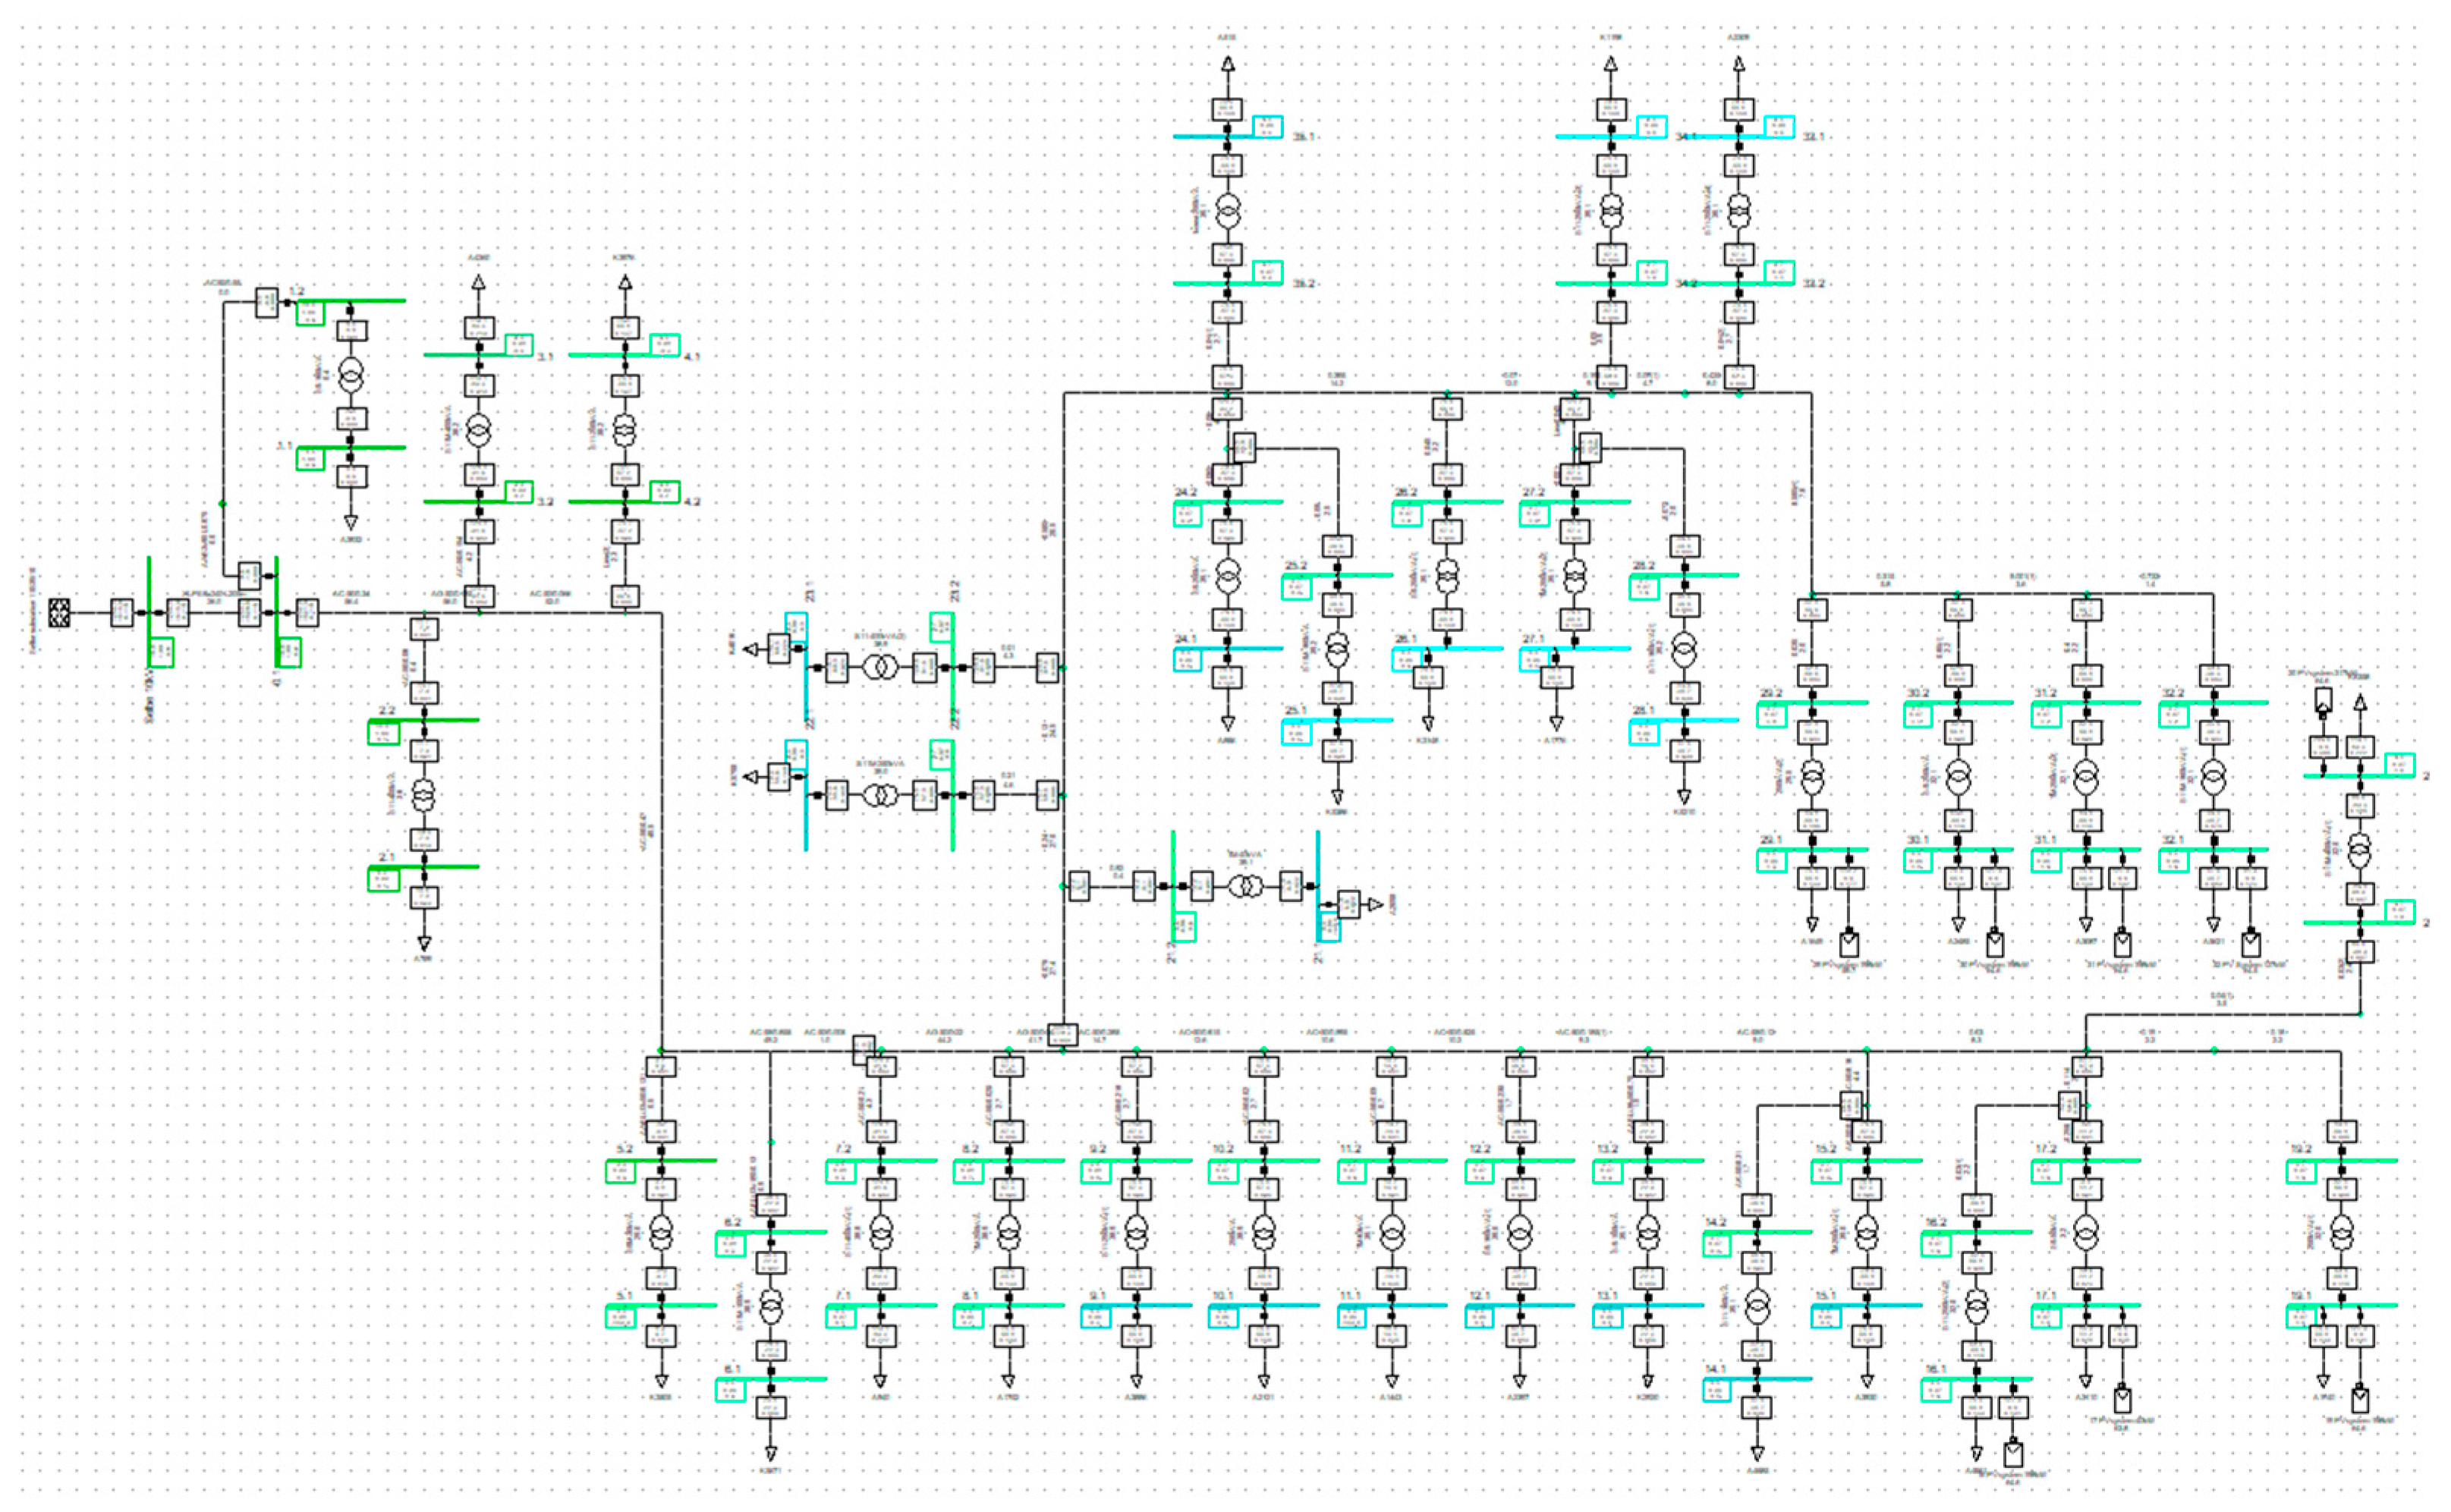
Equivalent schemes of the feeders with the highest loads in 110/35/10 kV Selbe substation (a) Chingeltei feeder; (b) Sogoot feeder; (c) Dambadarjaa feeder.
Figure 1.
Equivalent schemes of the feeders with the highest loads in 110/35/10 kV Selbe substation (a) Chingeltei feeder; (b) Sogoot feeder; (c) Dambadarjaa feeder.
Although there are many economic and environmental advantages associated with installing solar PV systems, their impact on the power distribution grid needs to be studied in detail. This can contribute to resolving the power quality issues occurring in Mongolia, especially in Ulaanbaatar city and other densely populated areas, and to reduce the power and electricity losses on the power distribution lines and substations. Moreover, the appropriate use of small-scale solar PV systems relevant to the regulation to inject energy into the distribution grid from distributed renewable energy sources of consumers can be determined.
This study analyzes the changes in an overloaded power distribution grid's power losses and voltage deviations with solar PV systems installed at different points. There are two main factors considered for assessing the impact of solar PV systems on the power distribution grid: the installed capacity of the solar PV systems and the location of the connection. Based on a comparison between the measurement results of three feeders with higher loads in the Ulaanbaatar area, the Dambadarjaa feeder, which has the highest load, was selected for the analysis. The impact of the solar PV system on the selected feeder is analyzed by connecting 8 cases of solar PV systems at four different locations. Their installed capacities vary between 25 and 80 percent of the highest daily load of the selected feeder. The results show that the power loss of the feeder can be greatly reduced among all the cases when the total installed capacity of the solar PV systems is equal to 75 percent of the highest daily load of the feeder, and the location of the connection is at the end of the power distribution grid.
2. Power Distribution Grid and Solar PV Systems
2.1. Power Distribution Grid
The power distribution grid owned by the Ulaanbaatar Electricity Distribution Network (UBEDN) state-owned company is analyzed for the selection of feeders. The following feeders have the most significant number of consumers connected and show the highest loads based on the load measurement data. This includes:
- Chingeltei feeder
- Sogoot feeder
- Dambadarjaa feeder.
Especially during the high load period in the winter, the Chingeltei, Sogoot, and Dambadarjaa feeders supplied up to 2573 kW, 1934 kW, and 3149 kW, respectively. Figure 1 shows the equivalent schemes of these feeders. Thus, the Dambadarjaa feeder was selected as it has the highest load among the other feeders. Figure 2 shows the measured load of the selected feeder for a year on a monthly basis. It can be seen that the peak load occurred between November and February, varying in a range of 2 MW to 3 MW. The load is reduced between June and August, supplying 0.5 MW to 1.5 MW.
2.2. Generation of Solar PV Systems
The average solar irradiation and ambient temperature data are extracted from the Metronorm [9]. Figure 3 shows Ulaanbaatar City’s monthly solar irradiance and temperature. Solar irradiance and ambient temperature are highly relevant [10]. In addition, the temperature coefficient of the PV module was taken from the manufacturer's datasheet.
The equation for estimating the output power and performance of a PV module is expressed as:
The total and annual energy generation can be calculated by
Figure 2.
Measured loads of the Dambadarjaa feeder shown on a monthly basis.
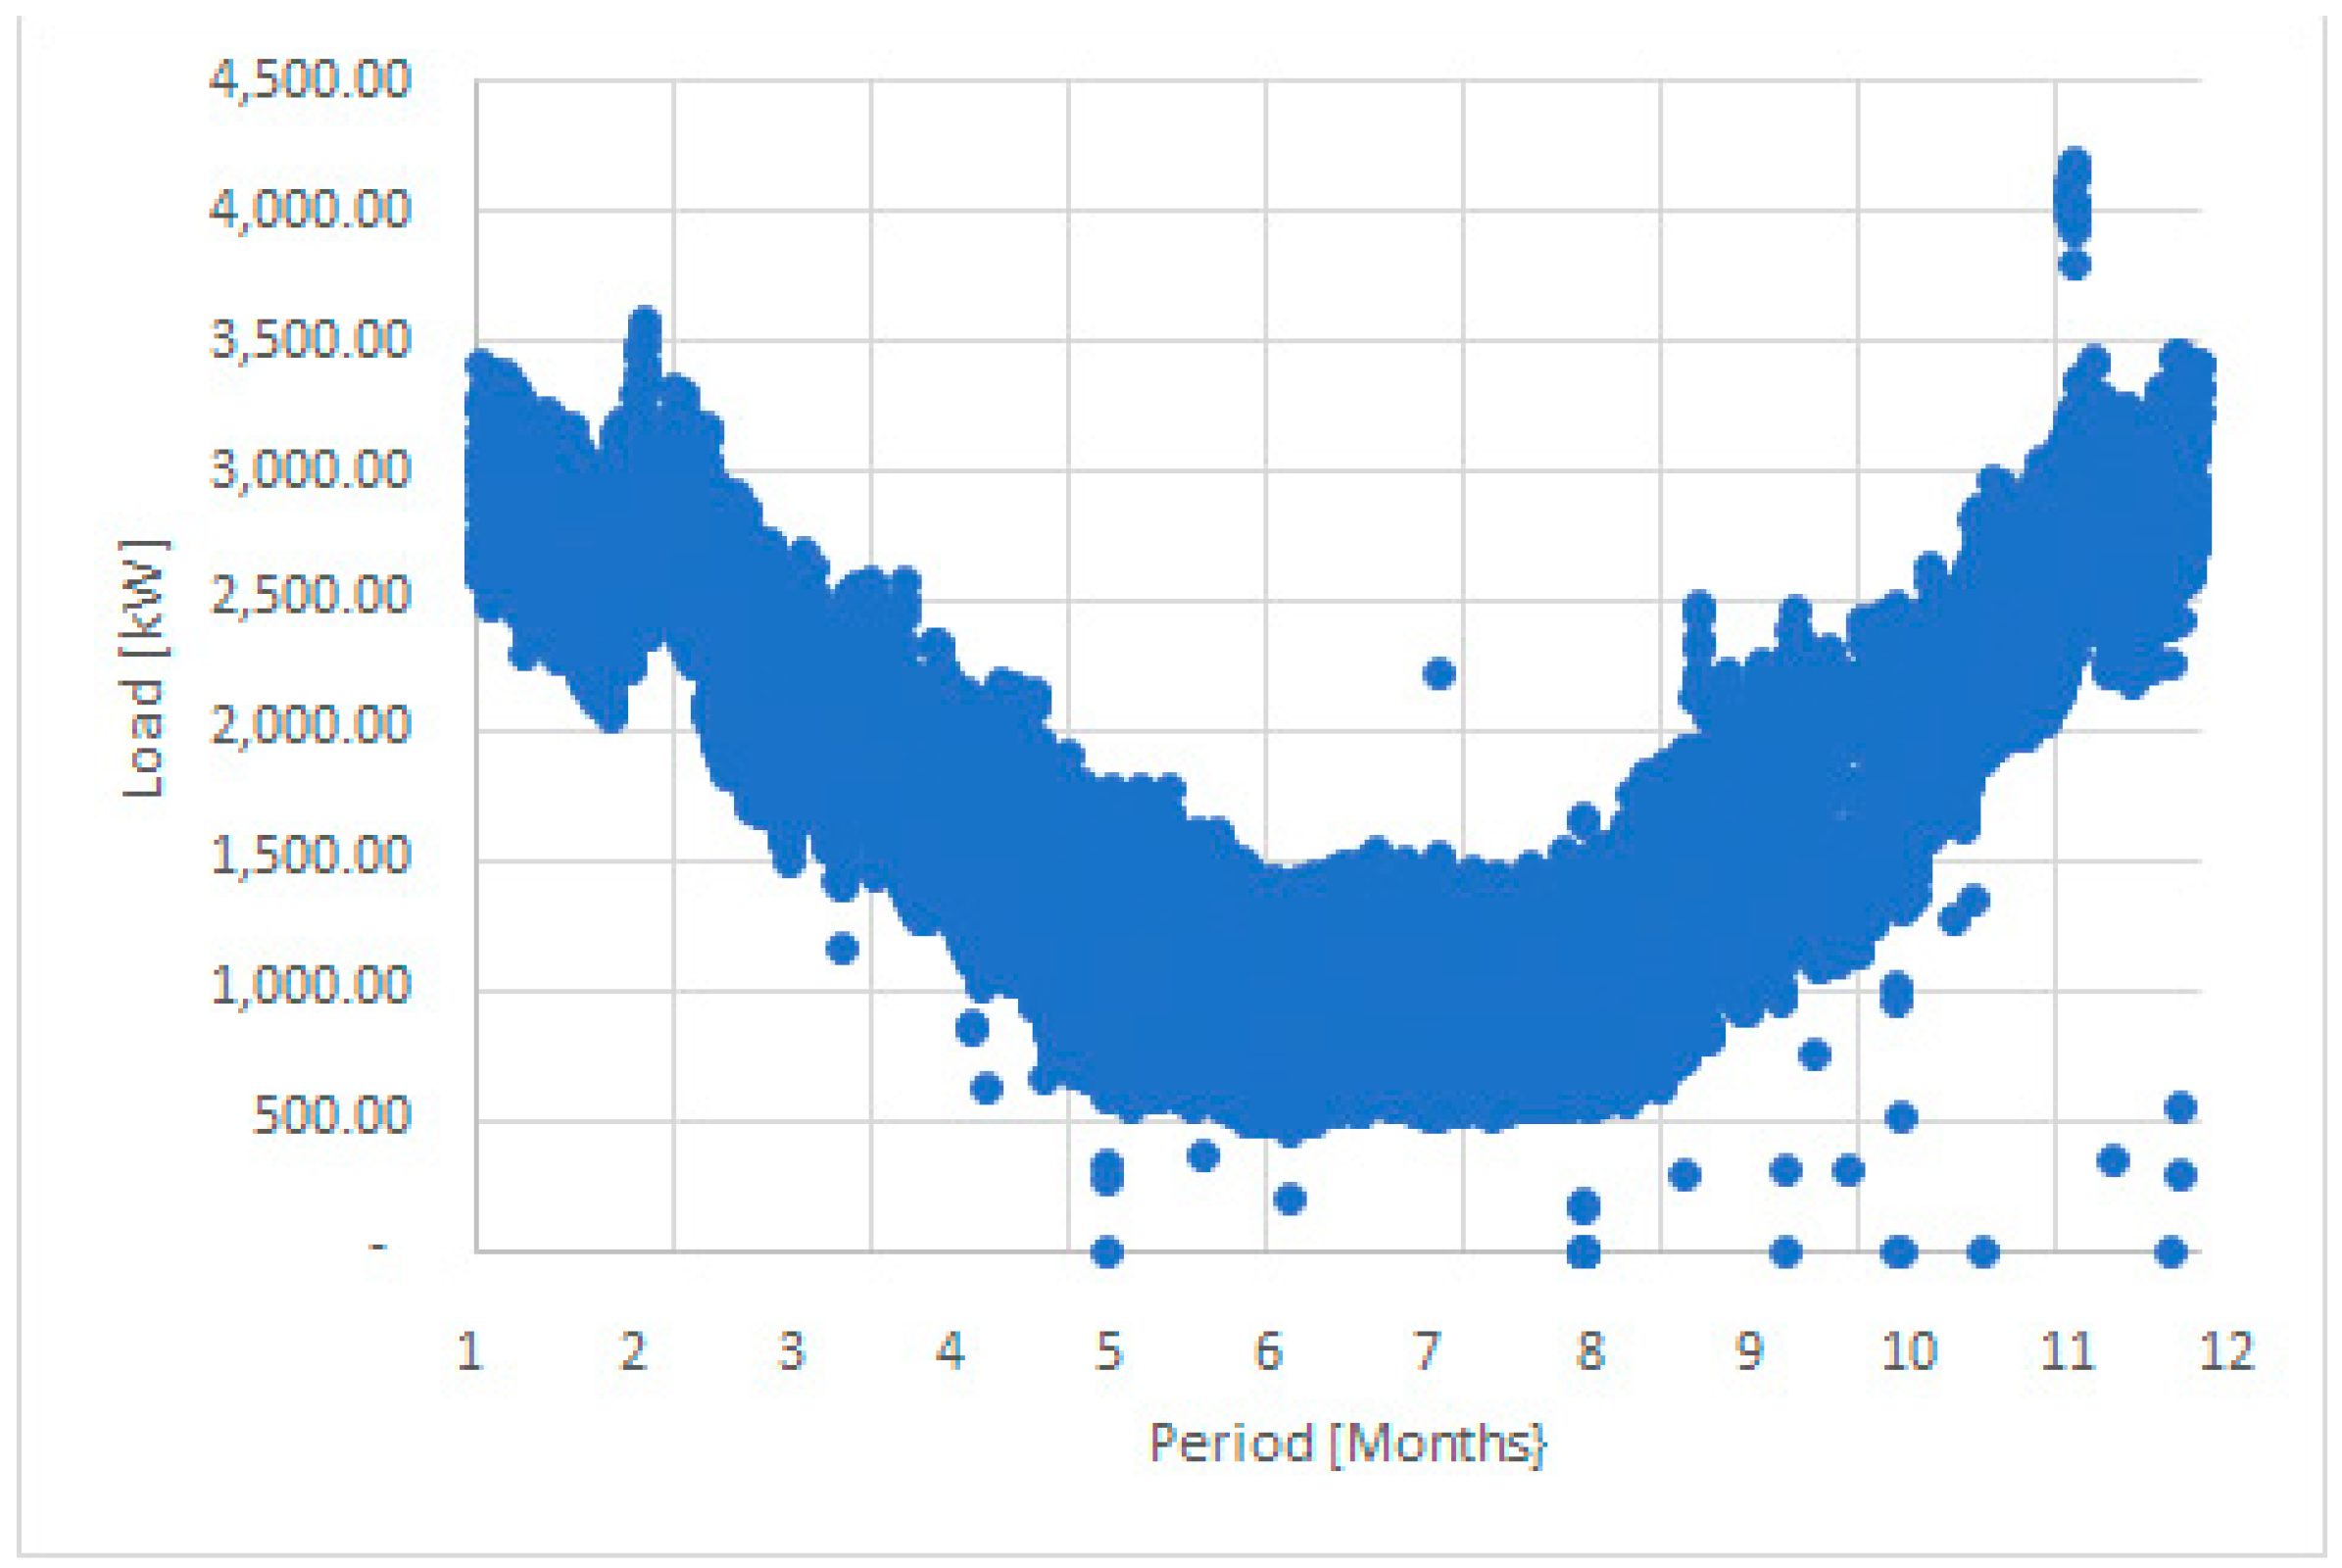
Figure 3.
Solar irradiance and ambient temperature in Ulaanbaatar.
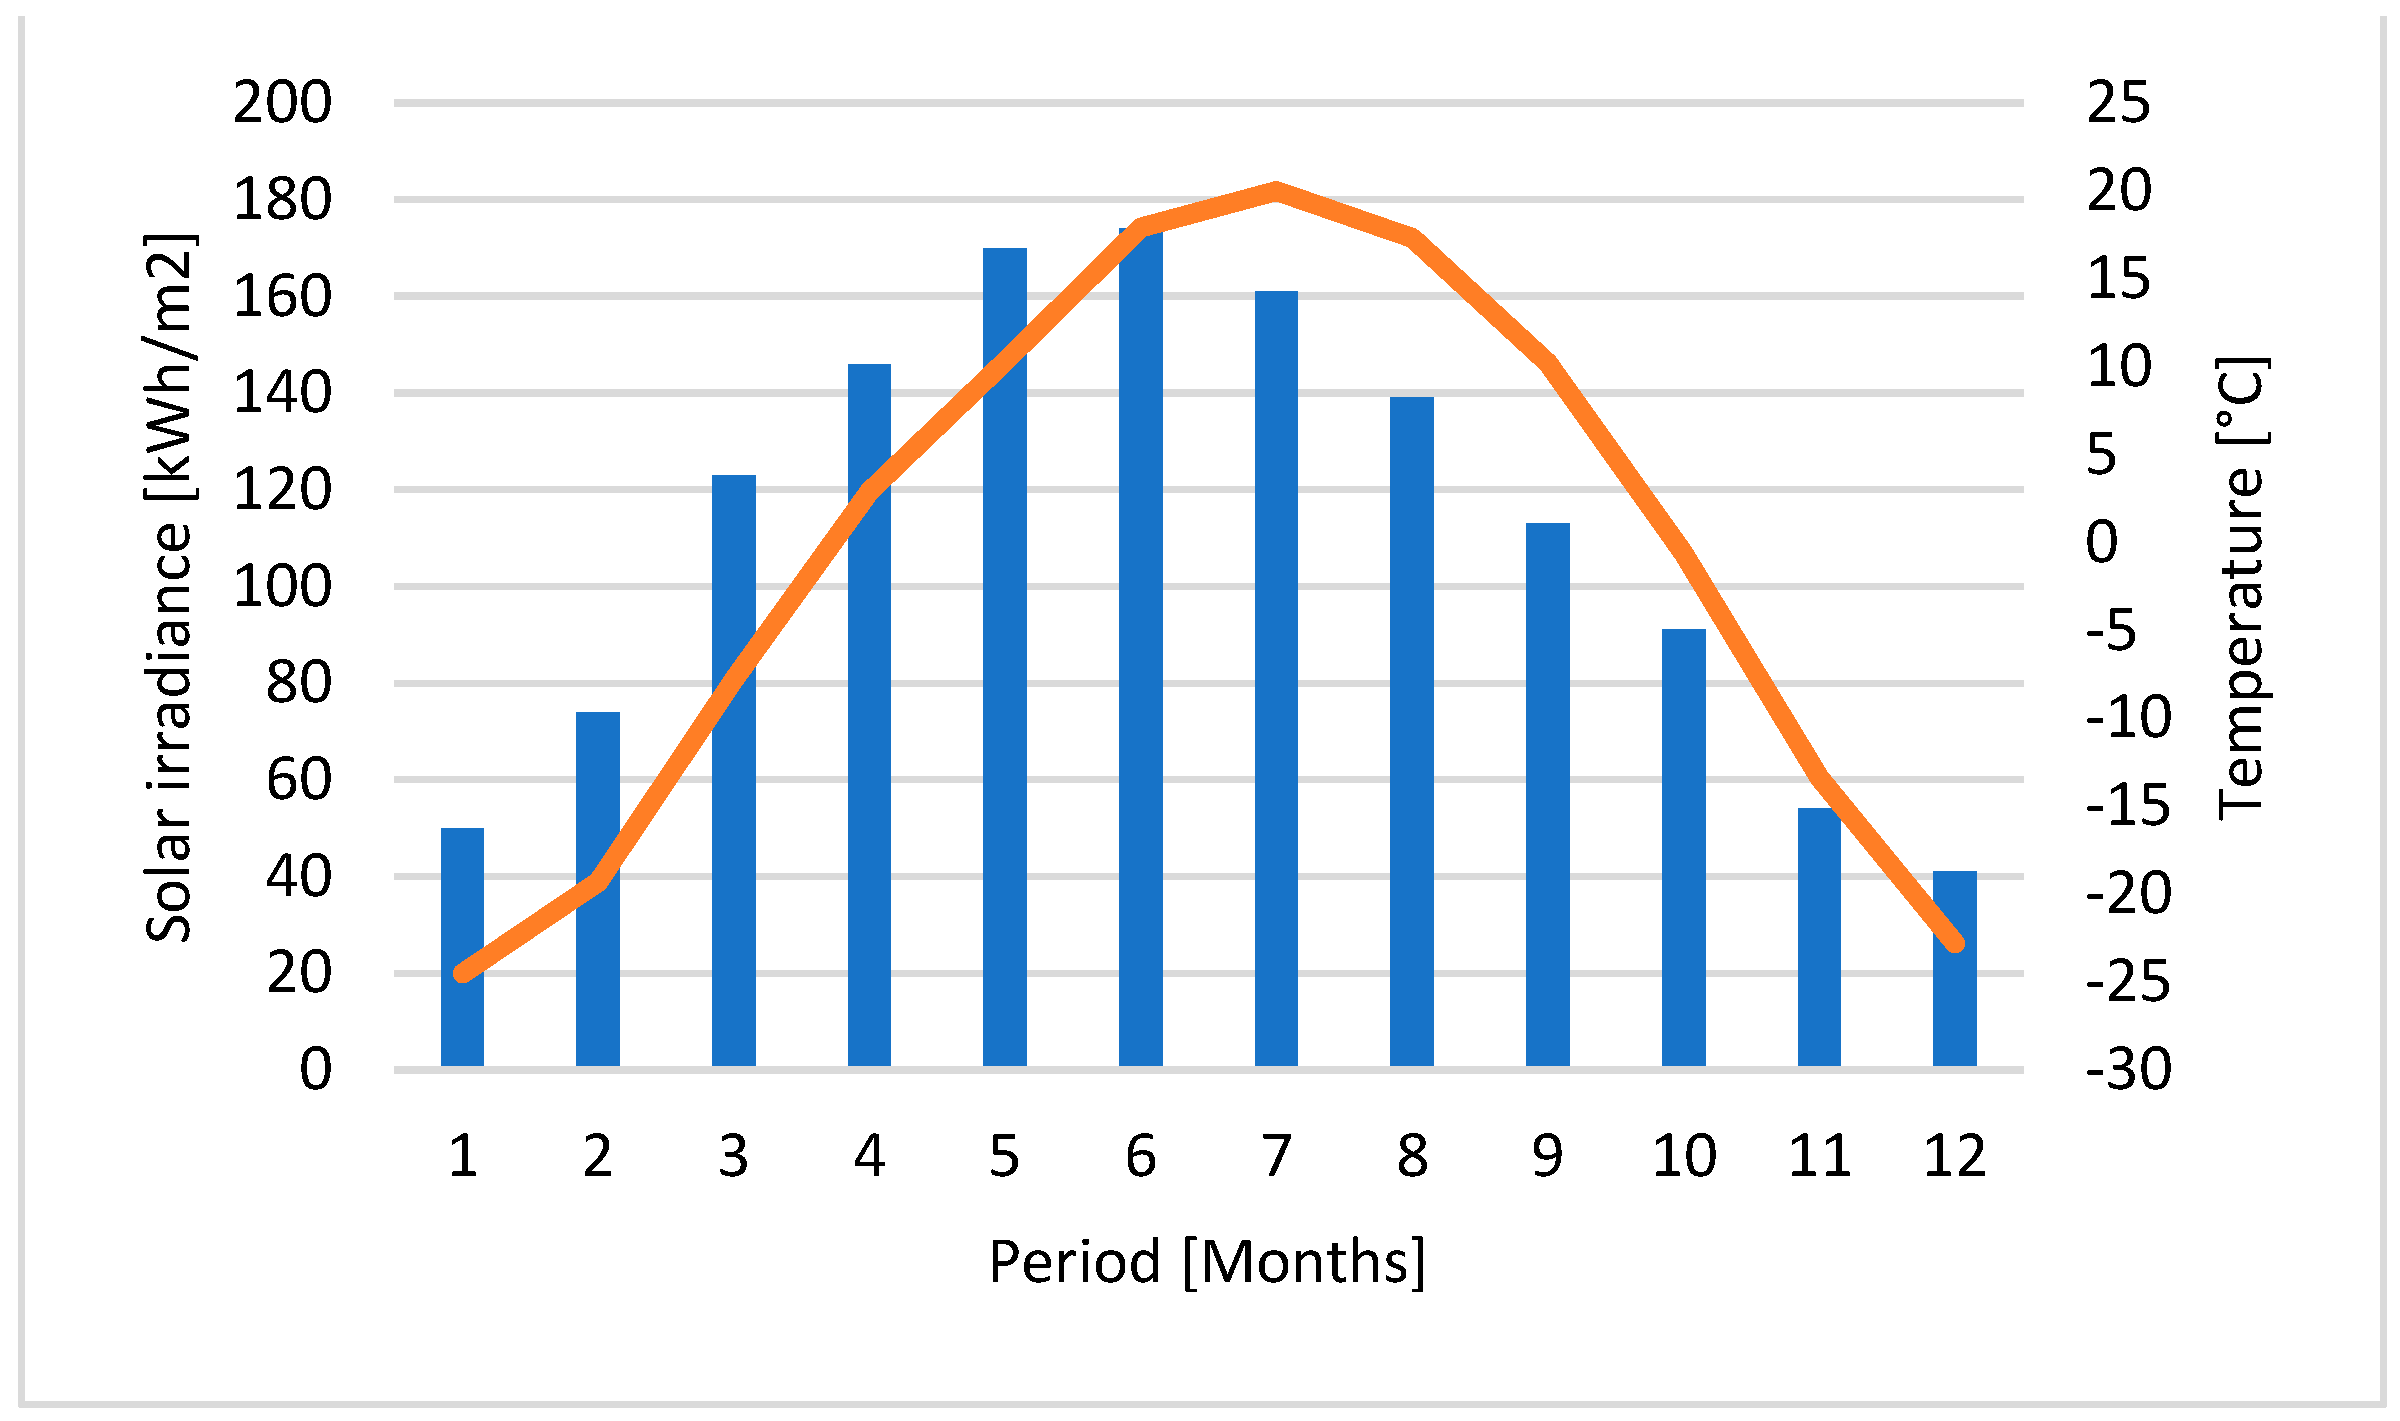
Figure 4.
A developed scheme for the Dambadarjaa feeder using the PowerFactory simulation software.
2.3. Load Flow of Electric Power System
The active power transferred through a power line generates heat in core and windings of a transformer, and the reactive power is used to generate magnetic fields in the transformer and line. The power plant generator or source of power supplies an amount of power that not only meets the load of users but also causes the active and reactive power losses in the system [11]. In order to reduce power losses, solar PV systems should be connected near the users. This can reduce the power transmitted through the line.
The state corresponding to each instant of time of the electric power system is called as a load flow. The calculation to find the load flow parameters of the system is called load flow analysis. Load flow analysis of the transmission line is multi-step, and each iteration consists of 2 main parts: power balance calculation and voltage balance calculation.
3. Solar PV Systems Connected to Power Distribution Line
In order to assess the impact on voltage deviation and transmission losses when solar PV systems are connected to the Dambadarjaa feeder of the Selbe substation, four different connection points of solar PV systems were studied. The impact of connecting solar PV systems with a capacity of 25 to 80 percent of the feeder's daily load was studied at each connection point. PowerFactory simulation software was used in this study.
Figure 4 shows a developed scheme of the Dambadarjaa feeder on the worksheet of the simulation software. The length of the Dambadarjaa feeder line is 6.81 km, and the total length is 11.42 km. In total, 36 units of 10/0.4 kV transformers with different rated powers are connected to the Dambadarjaa feeder. The location of each unit is shown in Figure 5 (a) and specification of each unit is listed in Table 1.
Based on the measurement results, the seasonal load conditions of the selected feeder have been determined. Table 2 shows the seasonal lowest and highest loads of the selected feeders which has the distribution capacity of 2.2 MW. In winter, the lowest and highest loads were equal to 116.89% and 157.47% of the installed capacity of the selected feeder, respectively. It can be seen that the feeder is continuously overloaded during the winter season, resulting in a high temperature and reduced lifetime of the equipment. While the lowest load of the selected feeder was 27.56%, and the highest load was 70.72% in summer. Thus, it can be seen as the load conditions of the power distribution grid has a strong dependency on the season.
3.1. Solar PV Systems Connected at the Beginning of the Power Distribution Line
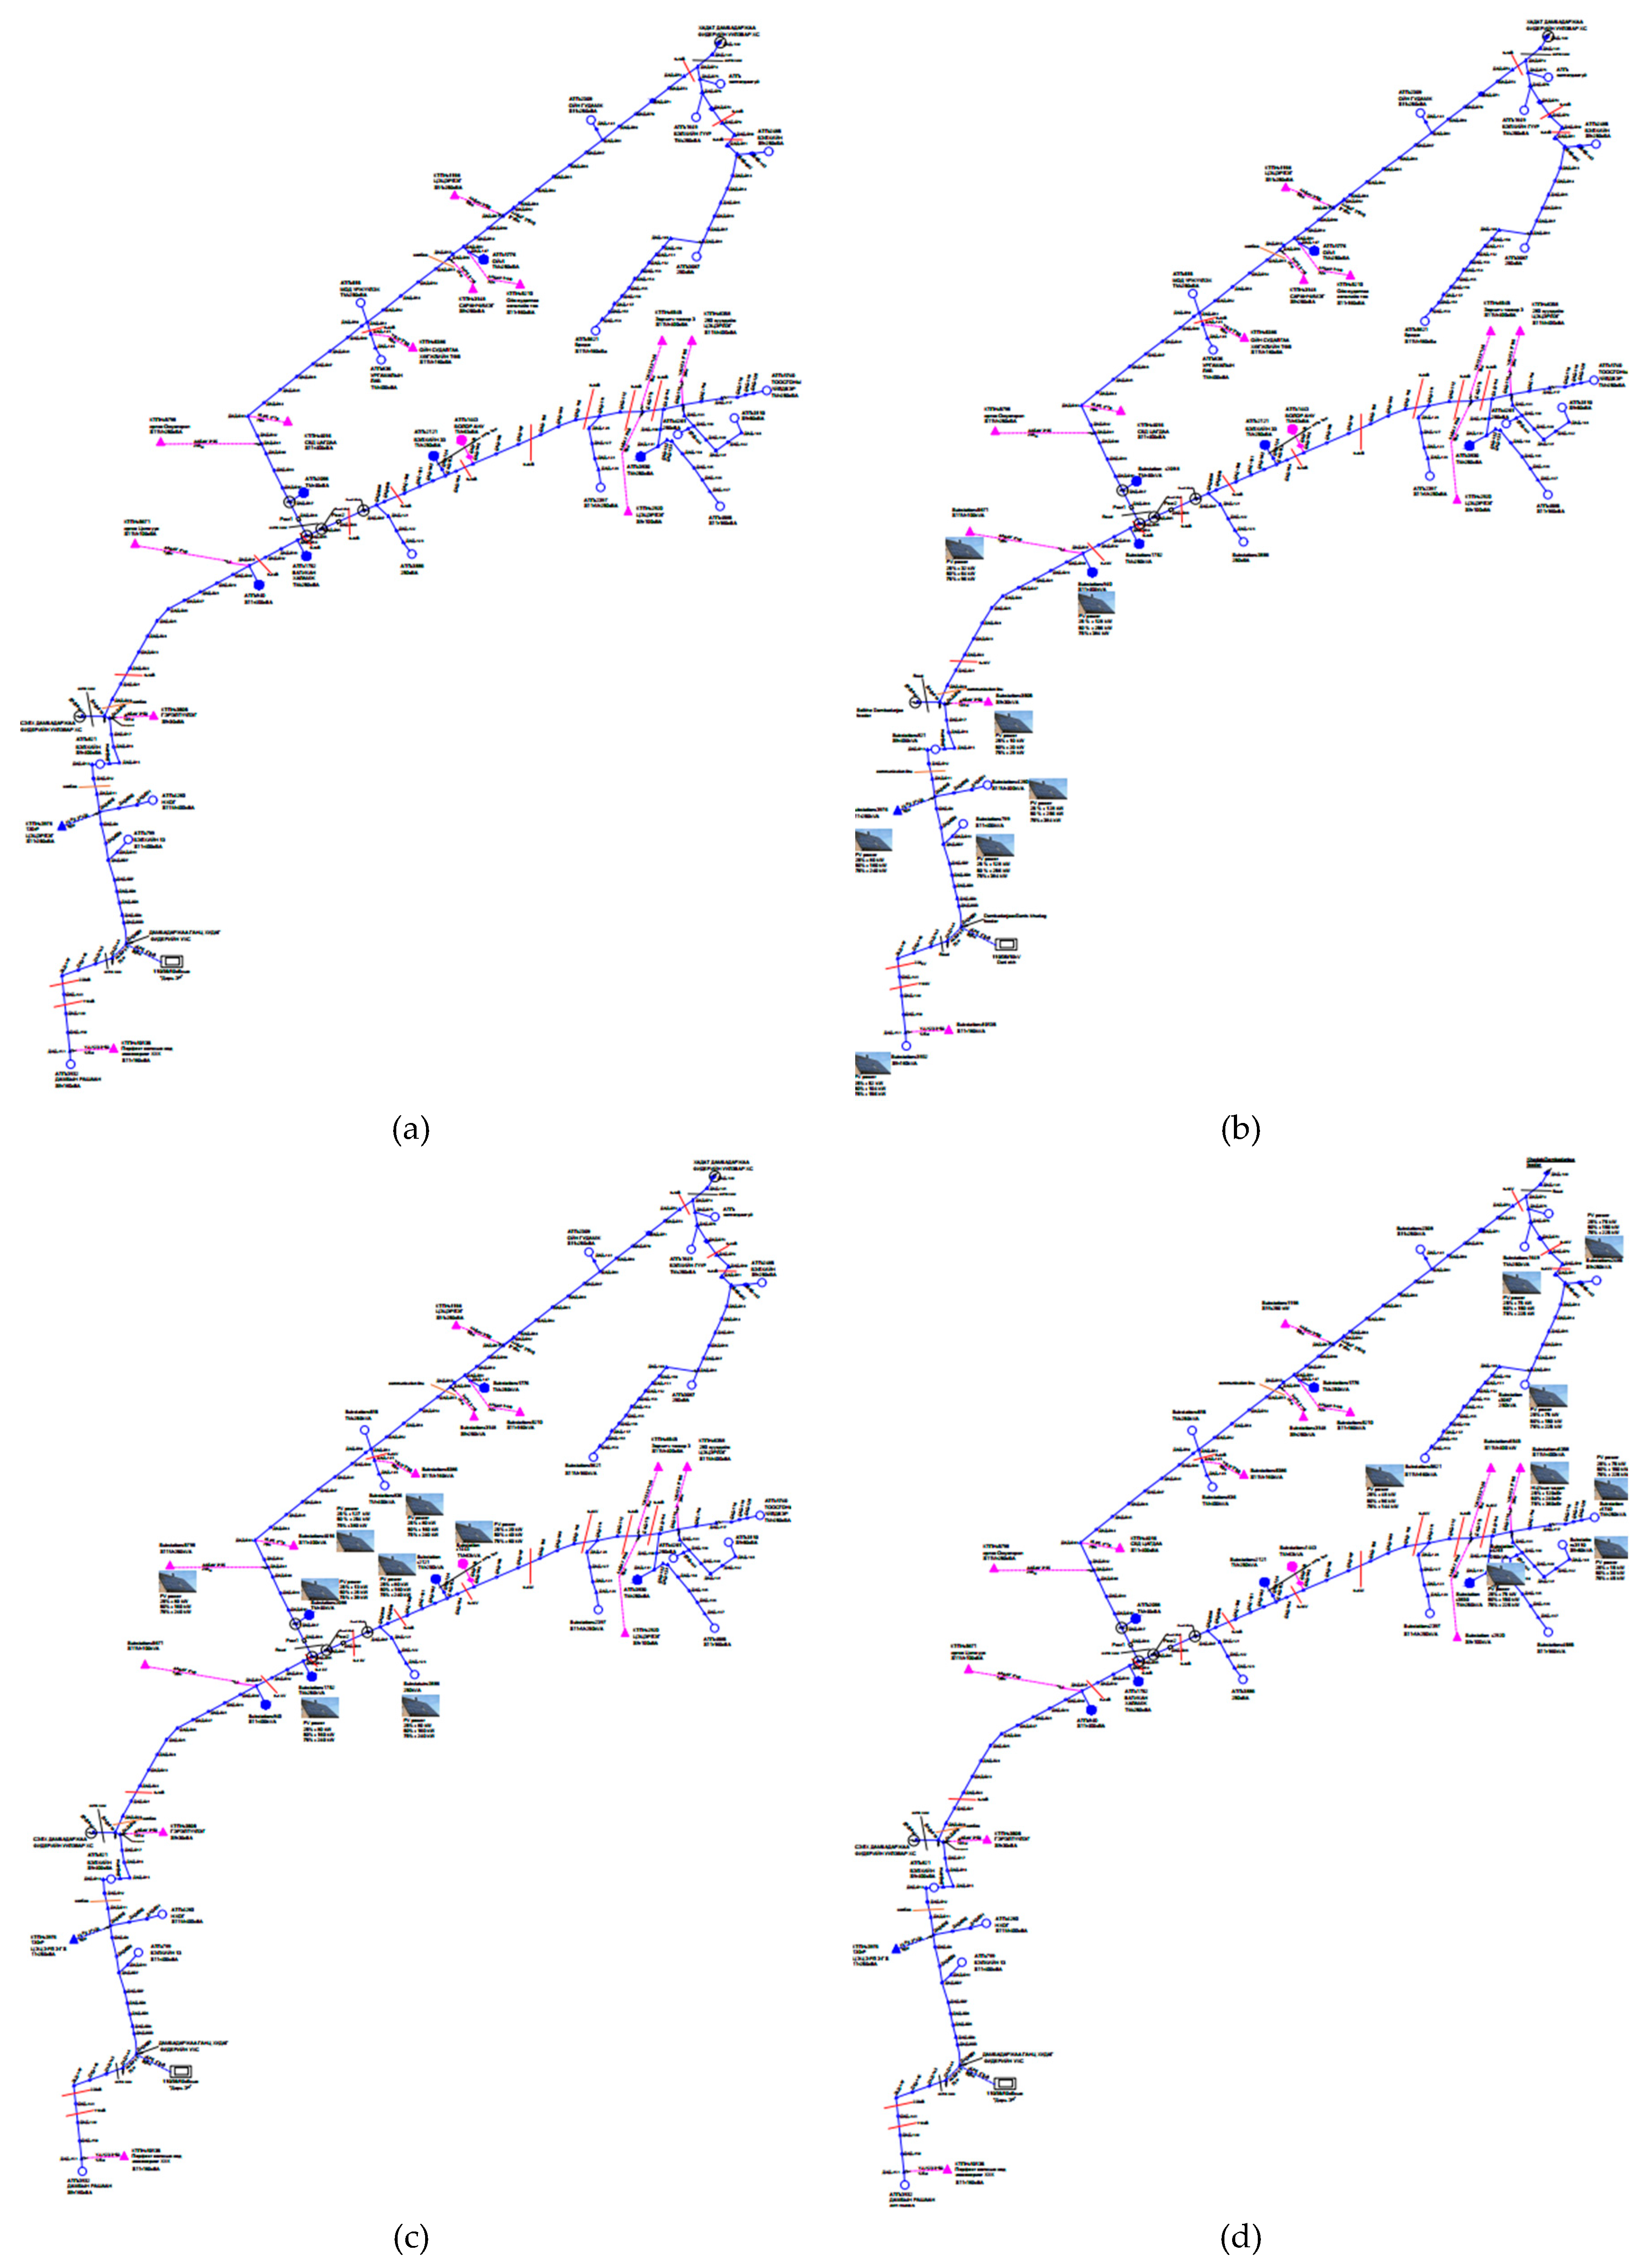
The power distribution line is divided into three sections: beginning, middle, and end. There are seven transformers connected at the beginning of the power distribution line. These transformers have the rated powers of 1x30 kVA, 1x100 kVA, 1x160 kVA, 1x250 kVA, and 3x400 kVA, respectively. The total installed capacity of the solar PV systems is selected to be 25% to 80% of the highest daily load of the feeder, while the installed capacity of each solar PV system is decided to be up to 75% of the highest load measured on the connected transformer. Figure 5 (b) shows the location of each substation and solar PV system connected at the beginning of the power distribution line. According to results obtained from the simulation using the PowerFactory software, the daily power losses of the Dambadarjaa feeder were 4319 kWh when there is no solar PV systems connected. This could be reduced by 90 kWh by installing the solar PV systems at the beginning of the feeder. In this case, the total capacity was equal to 25% of the highest daily load of the feeder. The power loss reduction of 90 kWh accounts for 2% of the daily power losses.
Then, the total capacity of the solar PV systems was increased to 50% and 80% of the feeder's highest daily load. The corresponding energy losses were reduced by 3.5% and 4.1%, respectively.
3.2. Solar PV Systems Connected in the Middle of the Power Distribution Line
There are eight transformers connected in the middle of the power distribution line. Their rated powers are 1x40 kVA, 1x63 kVA, 4x250 kVA, and 2x400 kVA, respectively. The total installed capacity of the solar PV systems is decided in the same way that was used in the previous scenario. Figure 5 (c) shows the location of each transformer and solar PV system connected in the middle of the power distribution line. The losses of the Dambadarjaa feeder were reduced by 224 kWh by installing solar PV systems with a total capacity equal to 25% of the highest daily load of the feeder—the power loss reduction of 224 kWh accounts for 5.1% of the daily power losses.
Like the previous simulation, the total capacity of the solar PV systems was increased to 50% and 80% of the feeder's highest daily load. The corresponding energy losses were reduced by 9.4% and 11.5%, respectively. Thus, it can be seen that the losses could be reduced more when solar PV systems are installed in the middle of the power distribution line.
3.3. Solar PV Systems Connected at the End of the Power Distribution Line
Eight transformers are also connected at the end of the power distribution line. Their rated powers are 1x50 kVA, 1x160 kVA, 5x250 kVA, and 1x400 kVA, respectively. The sizing of the solar PV systems was completed in the same way as the previous two scenarios. Figure 5 (d) shows the location of each substation and solar PV system at the end of the power distribution line. The losses of the Dambadarjaa feeder were reduced by 258 kWh by installing solar PV systems with a total capacity equal to 25% of the highest daily load of the feeder—the loss reduction of 258 kWh accounts for about 6% of the daily power losses.
As with the previous simulation, the total capacity of the solar PV systems was increased to 50% and 80% of the feeder's highest daily load. The corresponding energy losses were reduced by 10.7% and 12.9%, respectively. The reduction rates of power losses were increased while connecting the solar PV systems at the end of the power distribution line.
Figure 5.
Dambadarjaa feeder map from 110/35/10 kV Selbe substation with solar PV systems connected at different points (a) Dambadarjaa feeder map from 110/35/10 kV Selbe substation; (b) Solar PV systems connected at the beginning of the power distribution line; (c) Solar PV systems connected at the middle of the power distribution line; and (d) Solar PV systems connected at the end of the power distribution line.
3.4. Solar PV Systems Evenly Distributed along the Power Distribution Line
To assess the effects based on different connection points, solar PV systems distributed evenly along the power distribution line were also examined. Several transformers were systematically chosen along the line until their total installed capacity reached 80% of the feeder’s highest daily load. Subsequently, the sizing of the solar PV systems was determined for each selected transformer, varying between 25% and 80% of the feeder's peak daily load.
The simulation results from PowerFactory software showed that the daily power losses of the Dambadarjaa feeder were 4319 kWh when no solar PV systems were connected. With this connection scenario, power losses were reduced by 5%, with the total system capacity set to 25% of the feeder's peak load. As the total capacity of the solar PV systems was increased to 50% and 80% of the feeder's highest daily load, energy losses decreased by 9.5% and 13.2%, respectively.
4. Analyses of Energy Loss Reductions and Voltage Deviations
Figure 6 summarizes energy losses on the feeder depending on solar PV systems' total installed capacity and connection points. The vertical axis represents energy losses on the feeder. The horizontal axis indicates the ratio of the total installed capacity of the solar PV system and the feeder load by percentage. In order to clearly show the reduction rates of the energy losses, the scenario with no solar PV systems has been added to the existing four scenarios with different connection points. The energy loss has a constant value of 4319 kWh in the scenario with no solar PV systems shown in the light-blue line. The scenarios with solar PV systems connected at the power distribution line's beginning, middle, and end are shown in orange, grey, and amber, respectively. From the comparison shown in Figure 6, it is clear that the energy losses associated could be reduced by the highest percentage when the solar PV systems were connected at the end of the power
distribution line until the installed capacity reaches 70%. Afterward, the evenly distributed solar PV systems showed fewer energy losses when the total installed capacity exceeded 75% of the feeder’s highest daily load (please see more from the numerical data at the bottom part of Figure 6).
In order to analyze the voltage deviations on the selected feeder, the voltage probes were placed at the beginning, middle, and end of the power distribution line. As a result of the simulation with no solar PV systems, the probed voltages at the beginning, middle, and end of the power distribution line were up to 0.9935 p.u., 0.96368 p.u., and 0.94846 p.u., respectively.
Figure 7 shows the probed voltage deviations at the beginning of the power distribution line depending on the installed location of solar PV systems, where the vertical, primary horizontal, and secondary horizontal axes illustrate the voltage per unit, time in hours, and total installed capacity in the percentage of the highest daily load of the feeder. By installing the solar PV systems at the beginning, middle, end of or evenly distributed through the power distribution line, the voltage could be increased up to 0.99961 p.u., 0.99961 p.u., 0.99962 p.u., and 0.99961 p.u., respectively. In this case, the closest value to the rated voltage can be obtained with the installation of solar PV systems at the end of the power distribution lines.
Figure 8 shows the probed voltage deviations in the middle of the power distribution line depending on the installed location of solar PV systems. The voltage increases to 0.97240 p.u., 0.98481 p.u., 0.98572 p.u., and 0.98158 p.u. when solar PV systems are installed at the beginning, middle, end, or evenly distributed throughout the power distribution line, respectively. In this scenario, the closest value to the rated voltage is achieved when the solar PV systems are also installed at the end of the distribution lines.
Figure 9 shows the probed voltage deviations at the end of the power distribution line depending on the installed location of solar PV systems. In the scenario with solar PV systems connected at the end of the power distribution line, the voltages are increased up to 0.95731 p.u., 0.97254 p.u., 0.98632 p.u., and 0.97393 p.u., respectively.
Overall, the voltage at the beginning of the power distribution line does not have a noticeable increase regarding the installed location of the solar PV systems, whereas there are significant differences in the voltage in the middle and end of the power distribution line due to the installed locations. This can be seen in the voltage at the end of the power distribution line, which was increased with the highest value when the solar PV systems were installed at the end of the power distribution line.
5. Conclusions
In this study, the impact assessment of the grid-connected solar PV systems on the overloaded feeder in Ulaanbaatar ger district was carried out considering the total installed capacity and installation locations. Solar PV systems could show the best effect on the under voltage of the power distribution line when they are connected at the end of the line.
In terms of the loss reduction rate, solar PV systems with a total installed capacity equal to 25% of the daily load of the selected feeder can reduce the associated loss by 2% to 6%, depending on the connection point. The total installed capacity of the solar PV systems was then increased to 50% of the daily load of the selected feeder, resulting in a loss reduction of 3.4% to 9.7%. Afterward, the total installed capacity was increased to 75% of the daily load of the selected feeder. With this capacity specification, the associated loss could be reduced by 4% to 11.4%, suggesting that this scenario is the best one.
Overall, from the scenarios considered in this study, solar PV systems can reduce the losses and voltage deviations by the highest values when they are connected at the end of the power distribution line. A scenario with solar PV systems evenly distributed throughout the power distribution line could show a significant impact on the loss reduction when the total installed capacity exceeds 75% of the highest daily load of the selected feeder. However, the performance on the reduction of the voltage deviation could not overcome the scenario when the solar PV systems are installed at the end of the power distribution line.
It is entirely feasible to address undervoltage and other technical challenges through the integration of battery energy storage systems with solar PV installations. The findings of this study provide a solid foundation for developing a methodology to determine the optimal installed capacity of solar PV systems at any point along the power distribution line. This methodology will be presented in forthcoming research.
Author Contributions
Conceptualization, T.B. and B.D.; methodology, B.D.; software, B.B.; validation, T.B., and B.D.; formal analysis, B.B.; investigation, I.P.; resources, B.B.; data curation, T.B.; writing—original draft preparation, T.B.; writing—review and editing, B.D.; visualization, B.B.; supervision, B.D.; project administration, I.P.; funding acquisition, B.D. All authors have read and agreed to the published version of the manuscript.
Funding
This work was supported by the International Energy Joint R&D Program of the Korea Institute of Energy Technology Evaluation and Planning (KETEP), granted financial resources from the Ministry of Trade, Industry & Energy, Republic of Korea. (No. 20218530050040).
Data Availability Statement
The original data presented in this study are available on request at https://www.tog.mn/en/index.html/ (accessed on 24 December 2024).
Conflicts of Interest
The authors declare no conflicts of interest.
References
- Y. Xue, C. M. Lindkvist, A. T.-Salaj, Barriers and potential solutions to the diffusion of solar photovoltaics from the public-private-people partnership perspective – Case study of Norway, Renewable and Sustainable Energy Reviews, Volume 137, 2021. [CrossRef]
- G. Kavlak, J. McNerney, J. E. Trancik, Evaluating the causes of cost reduction in photovoltaic modules, Energy Policy, Volume 123, 2018, Pages 700-710. [CrossRef]
- Z. Munkhtur, B. Bat-Orshikh, T. Bat-Orgil and B. Dugarjav, "Technical Evaluation of Utility-Interactive Photovoltaic Power Generation System with Energy Storage based on the Experimental Setup," In Proceedings of the 2019 IEEE Transportation Electrification Conference and Expo, Asia-Pacific (ITEC Asia-Pacific), Seogwipo, Korea (South), 2019, pp. 1-5. [CrossRef]
- T.Bat-Orgil, B.Dugarjav, T.Shimizu, Battery Module Equalizer based on State of Charge Observation derived from Overall Voltage Variation, IEEJ Journal of Industry Applications, 2020, Volume 9, Issue 5, Pages 584-596. [CrossRef]
- Battuvshin.B, Turmandakh.B, Park Joon Hyung, Bayasgalan.D, The Study on Development of PV-ES hybrid system for Mongolian Household, The Transactions of The Korean Institute of Electrical Engineers, Volume 66, Issue 12, Pages.1905-1912, 2017. [CrossRef]
- The regulation to inject energy into the distribution grid from distributed renewable energy sources of consumers, Available online: https://legalinfo.mn/mn/detail?lawId=211259&showType=1/ (accessed on 9 April 2024).
- R. Singh, P. Tripathi, K. Yatendra, Impact of Solar Photovoltaic Penetration in Distribution Network, In Proceeding of International Conference on Recent Developments in Control, Automation & Power Engineering (RDCAPE), Noida, India, 2019.
- R. -C. Leou, "An economic analysis model for the energy storage systems in a deregulated market," In Proceedings of 2008 IEEE International Conference on Sustainable Energy Technologies, Singapore, 2008, pp. 744-749. [CrossRef]
- Metrotest, “Meteonorm 6.1”, April 2014.
- A P. H. Tan, C. K. Gan, K. A. Baharin "Techno-Economic Analysis of Rooftop PV System in UTeM Malaysia," in 3rd IET International Conference on Clean Energy and Technology (CEAT), 24-26 Nov. 2014.
- Kh. Tsagaan, M.Khuyagdorj, Electrical energy transmission and distribution, 1st ed., Mongolia, 2017.
Figure 6.
Energy losses depend on the total installed capacity and connection points of solar PV systems with regard to the feeder load.
Figure 6.
Energy losses depend on the total installed capacity and connection points of solar PV systems with regard to the feeder load.
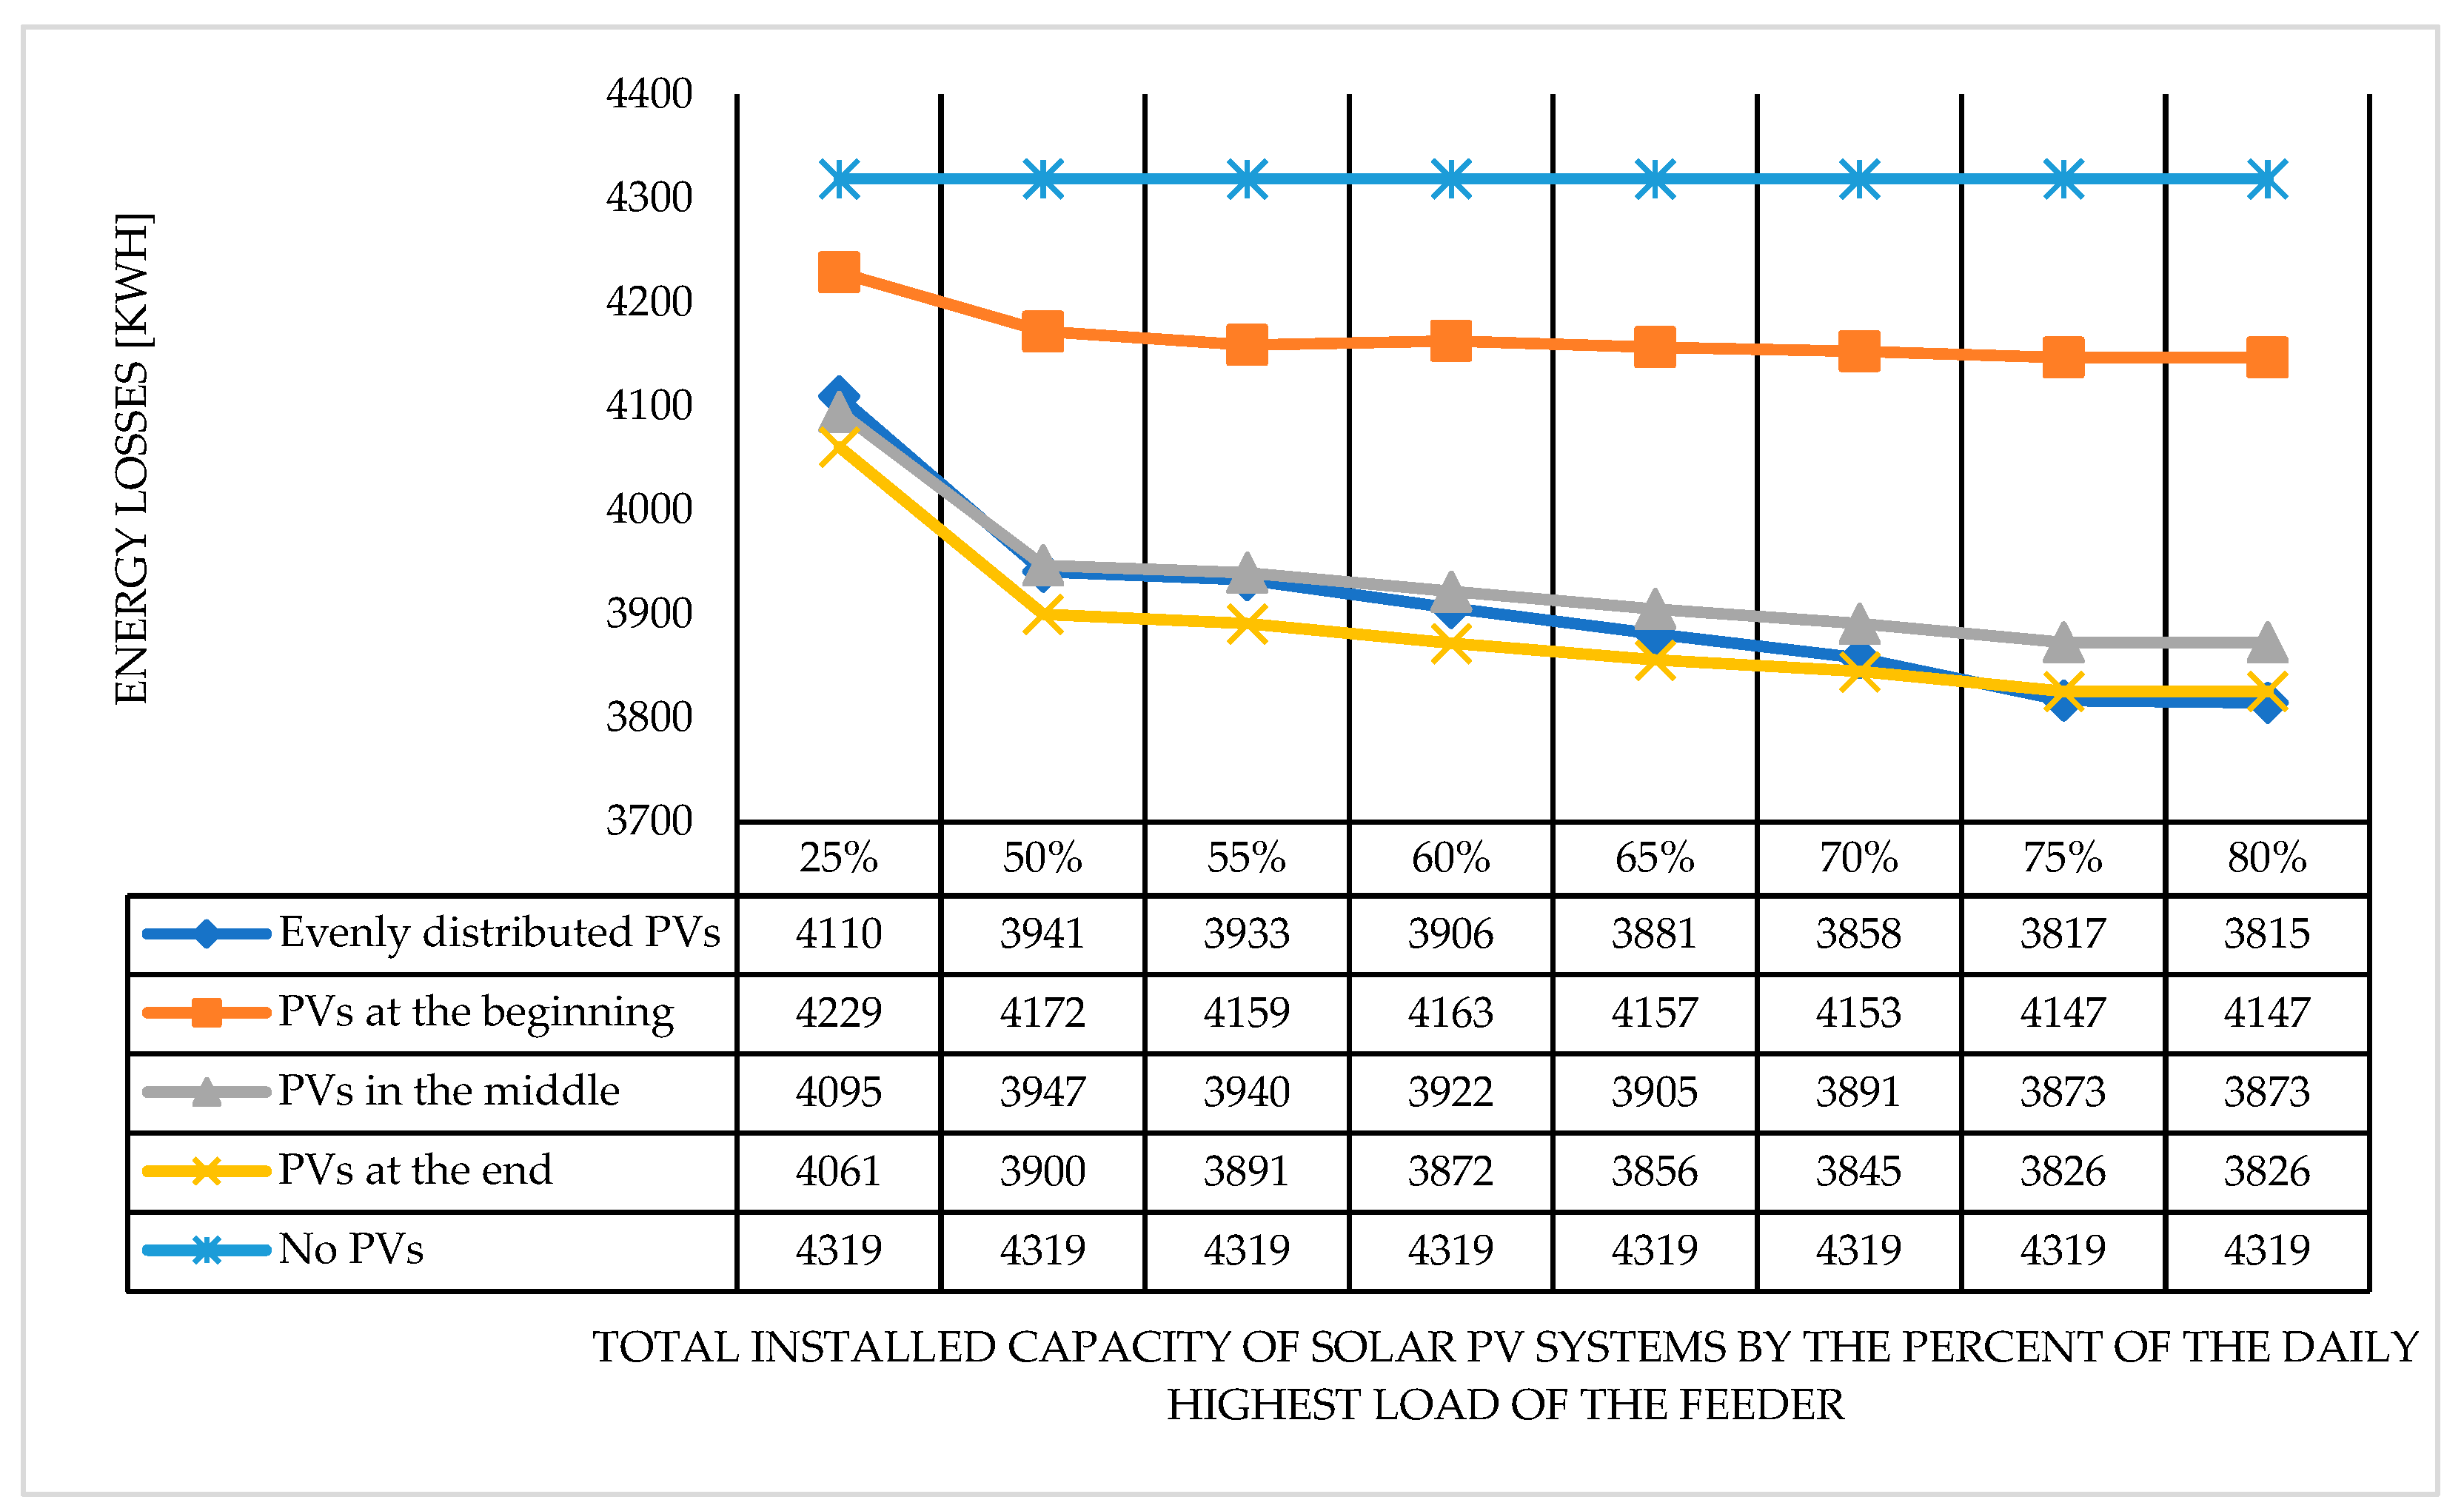
Figure 7.
Probed voltage deviation at the beginning of the power distribution line when the solar PV systems connected (a) at the beginning, (b) in the middle, (c) at the end, and (d) evenly distributed.
Figure 7.
Probed voltage deviation at the beginning of the power distribution line when the solar PV systems connected (a) at the beginning, (b) in the middle, (c) at the end, and (d) evenly distributed.
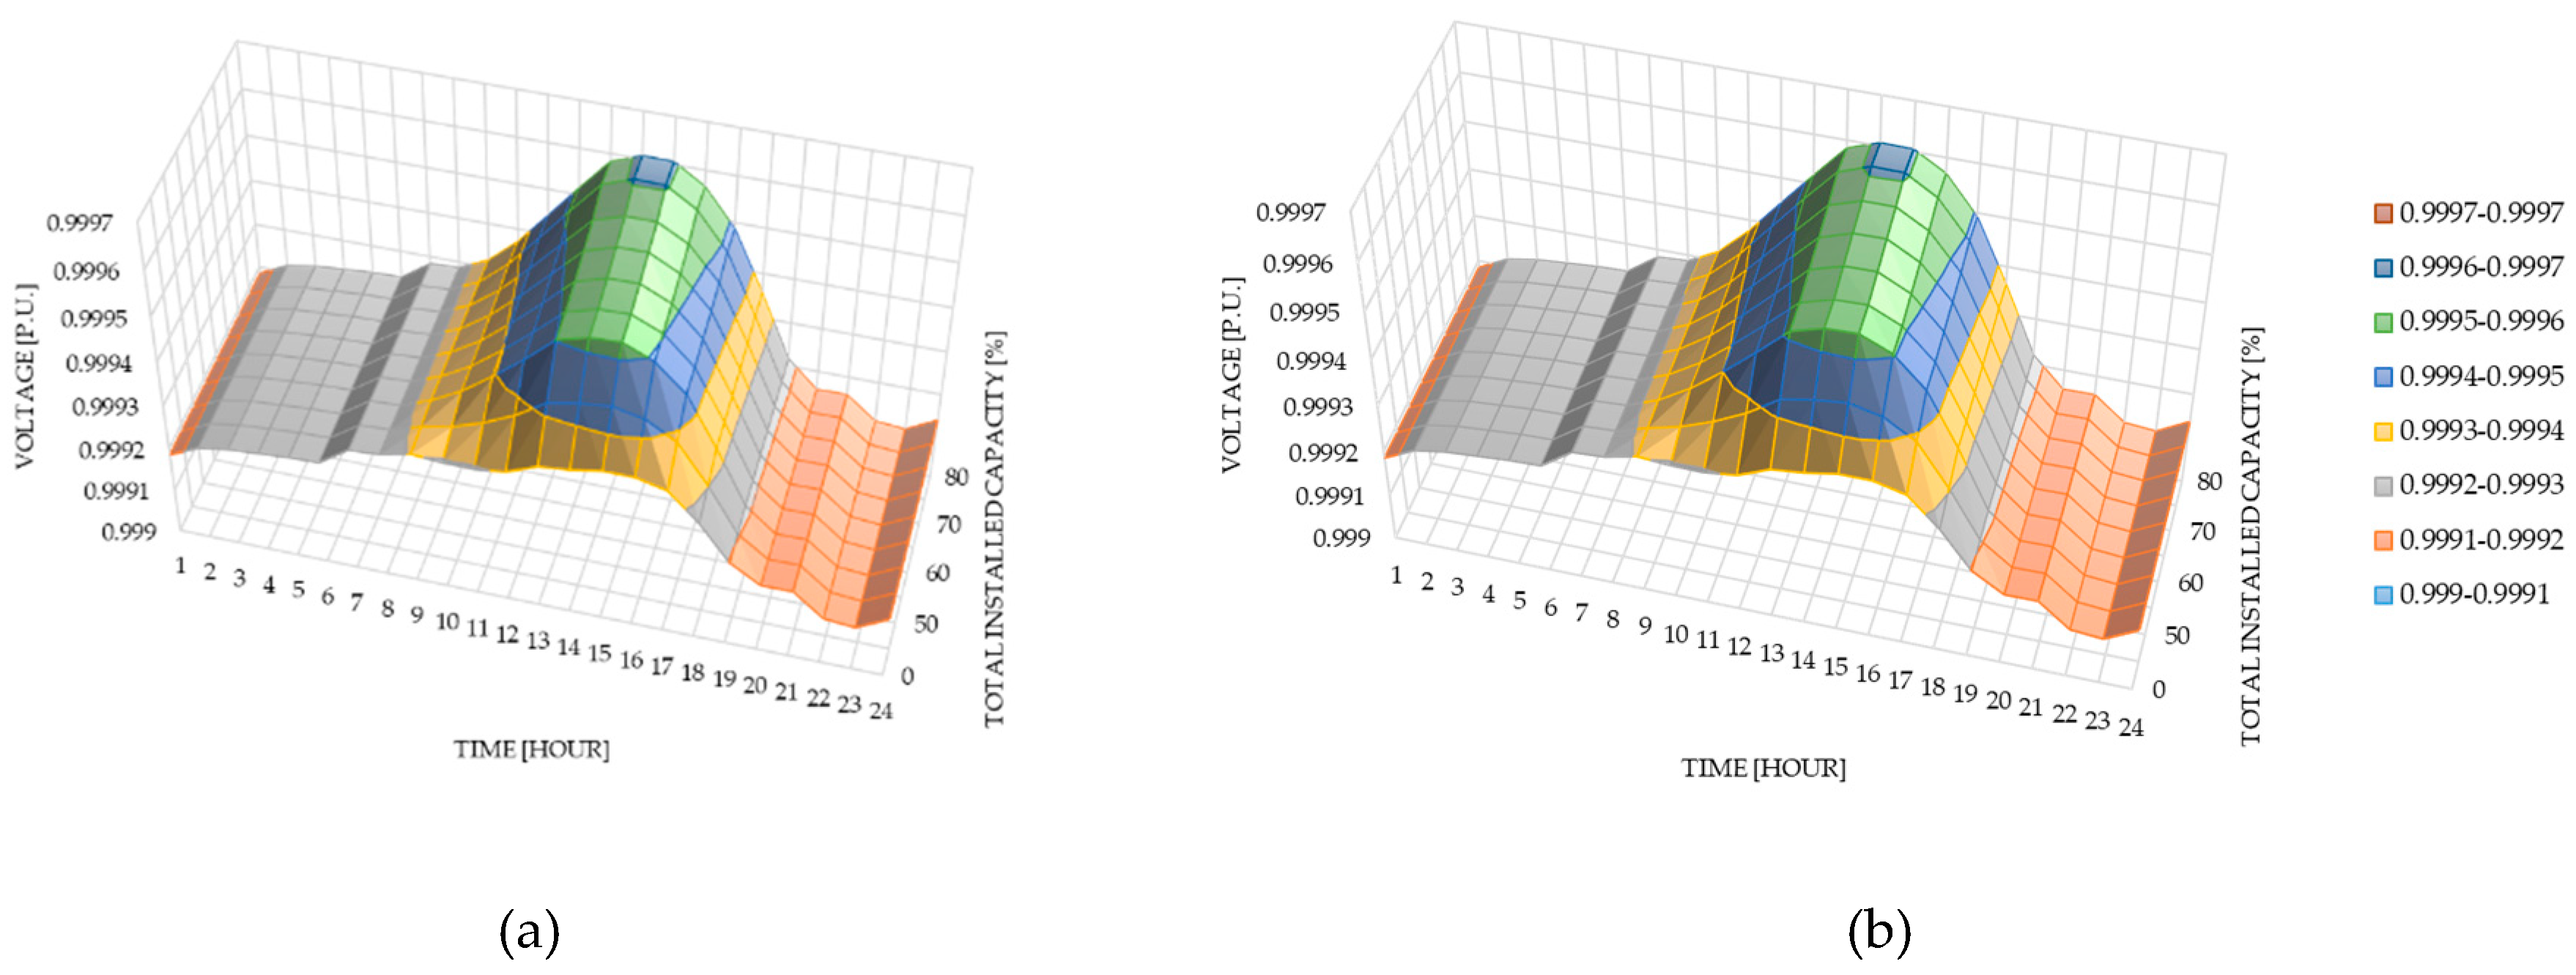
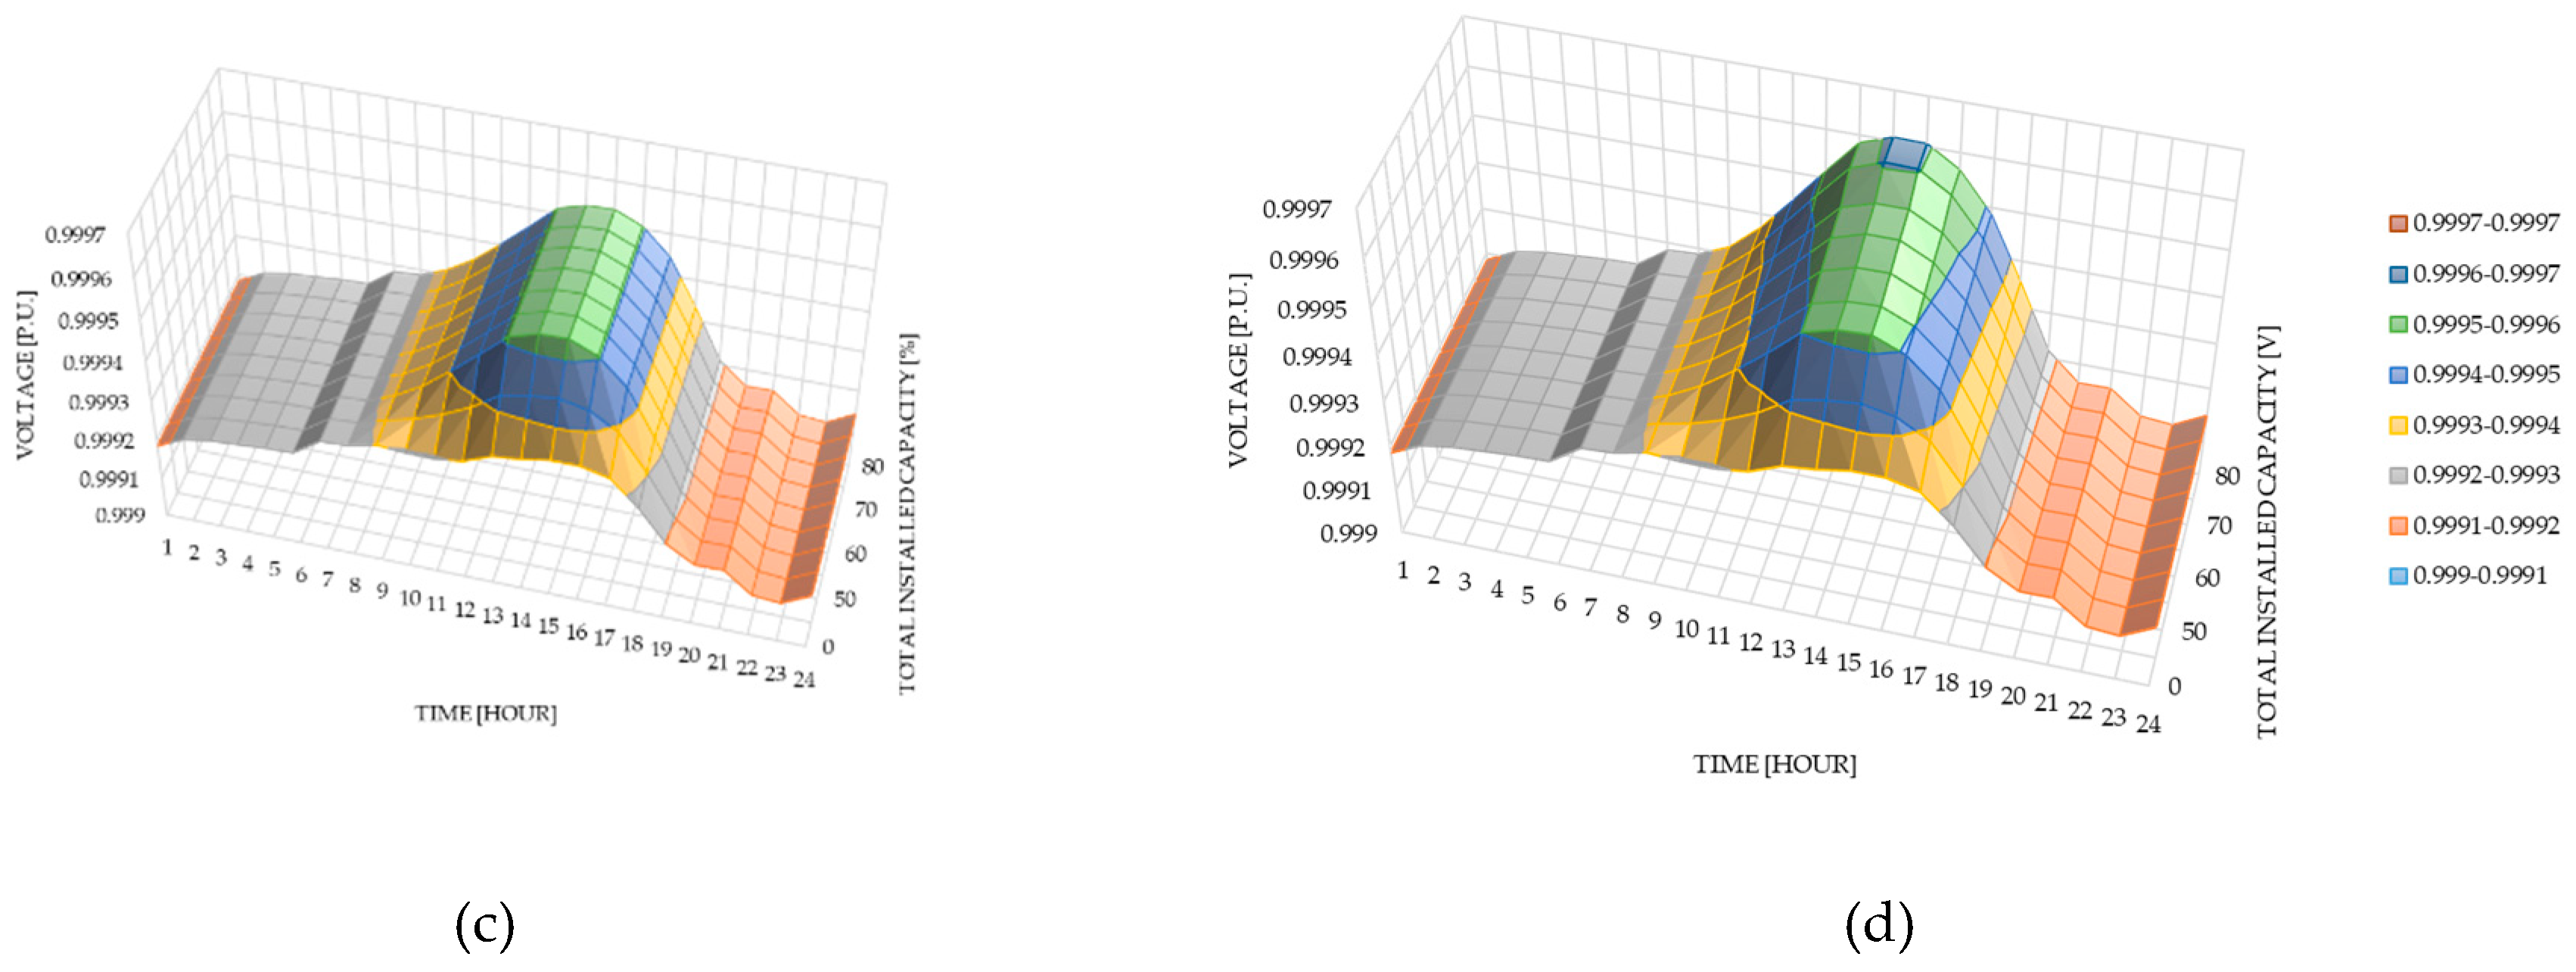
Figure 8.
Probed voltage deviation in the middle of the power distribution line when the solar PV systems are connected (a) at the beginning, (b) in the middle, (c) at the end, and (d) evenly distributed.
Figure 8.
Probed voltage deviation in the middle of the power distribution line when the solar PV systems are connected (a) at the beginning, (b) in the middle, (c) at the end, and (d) evenly distributed.
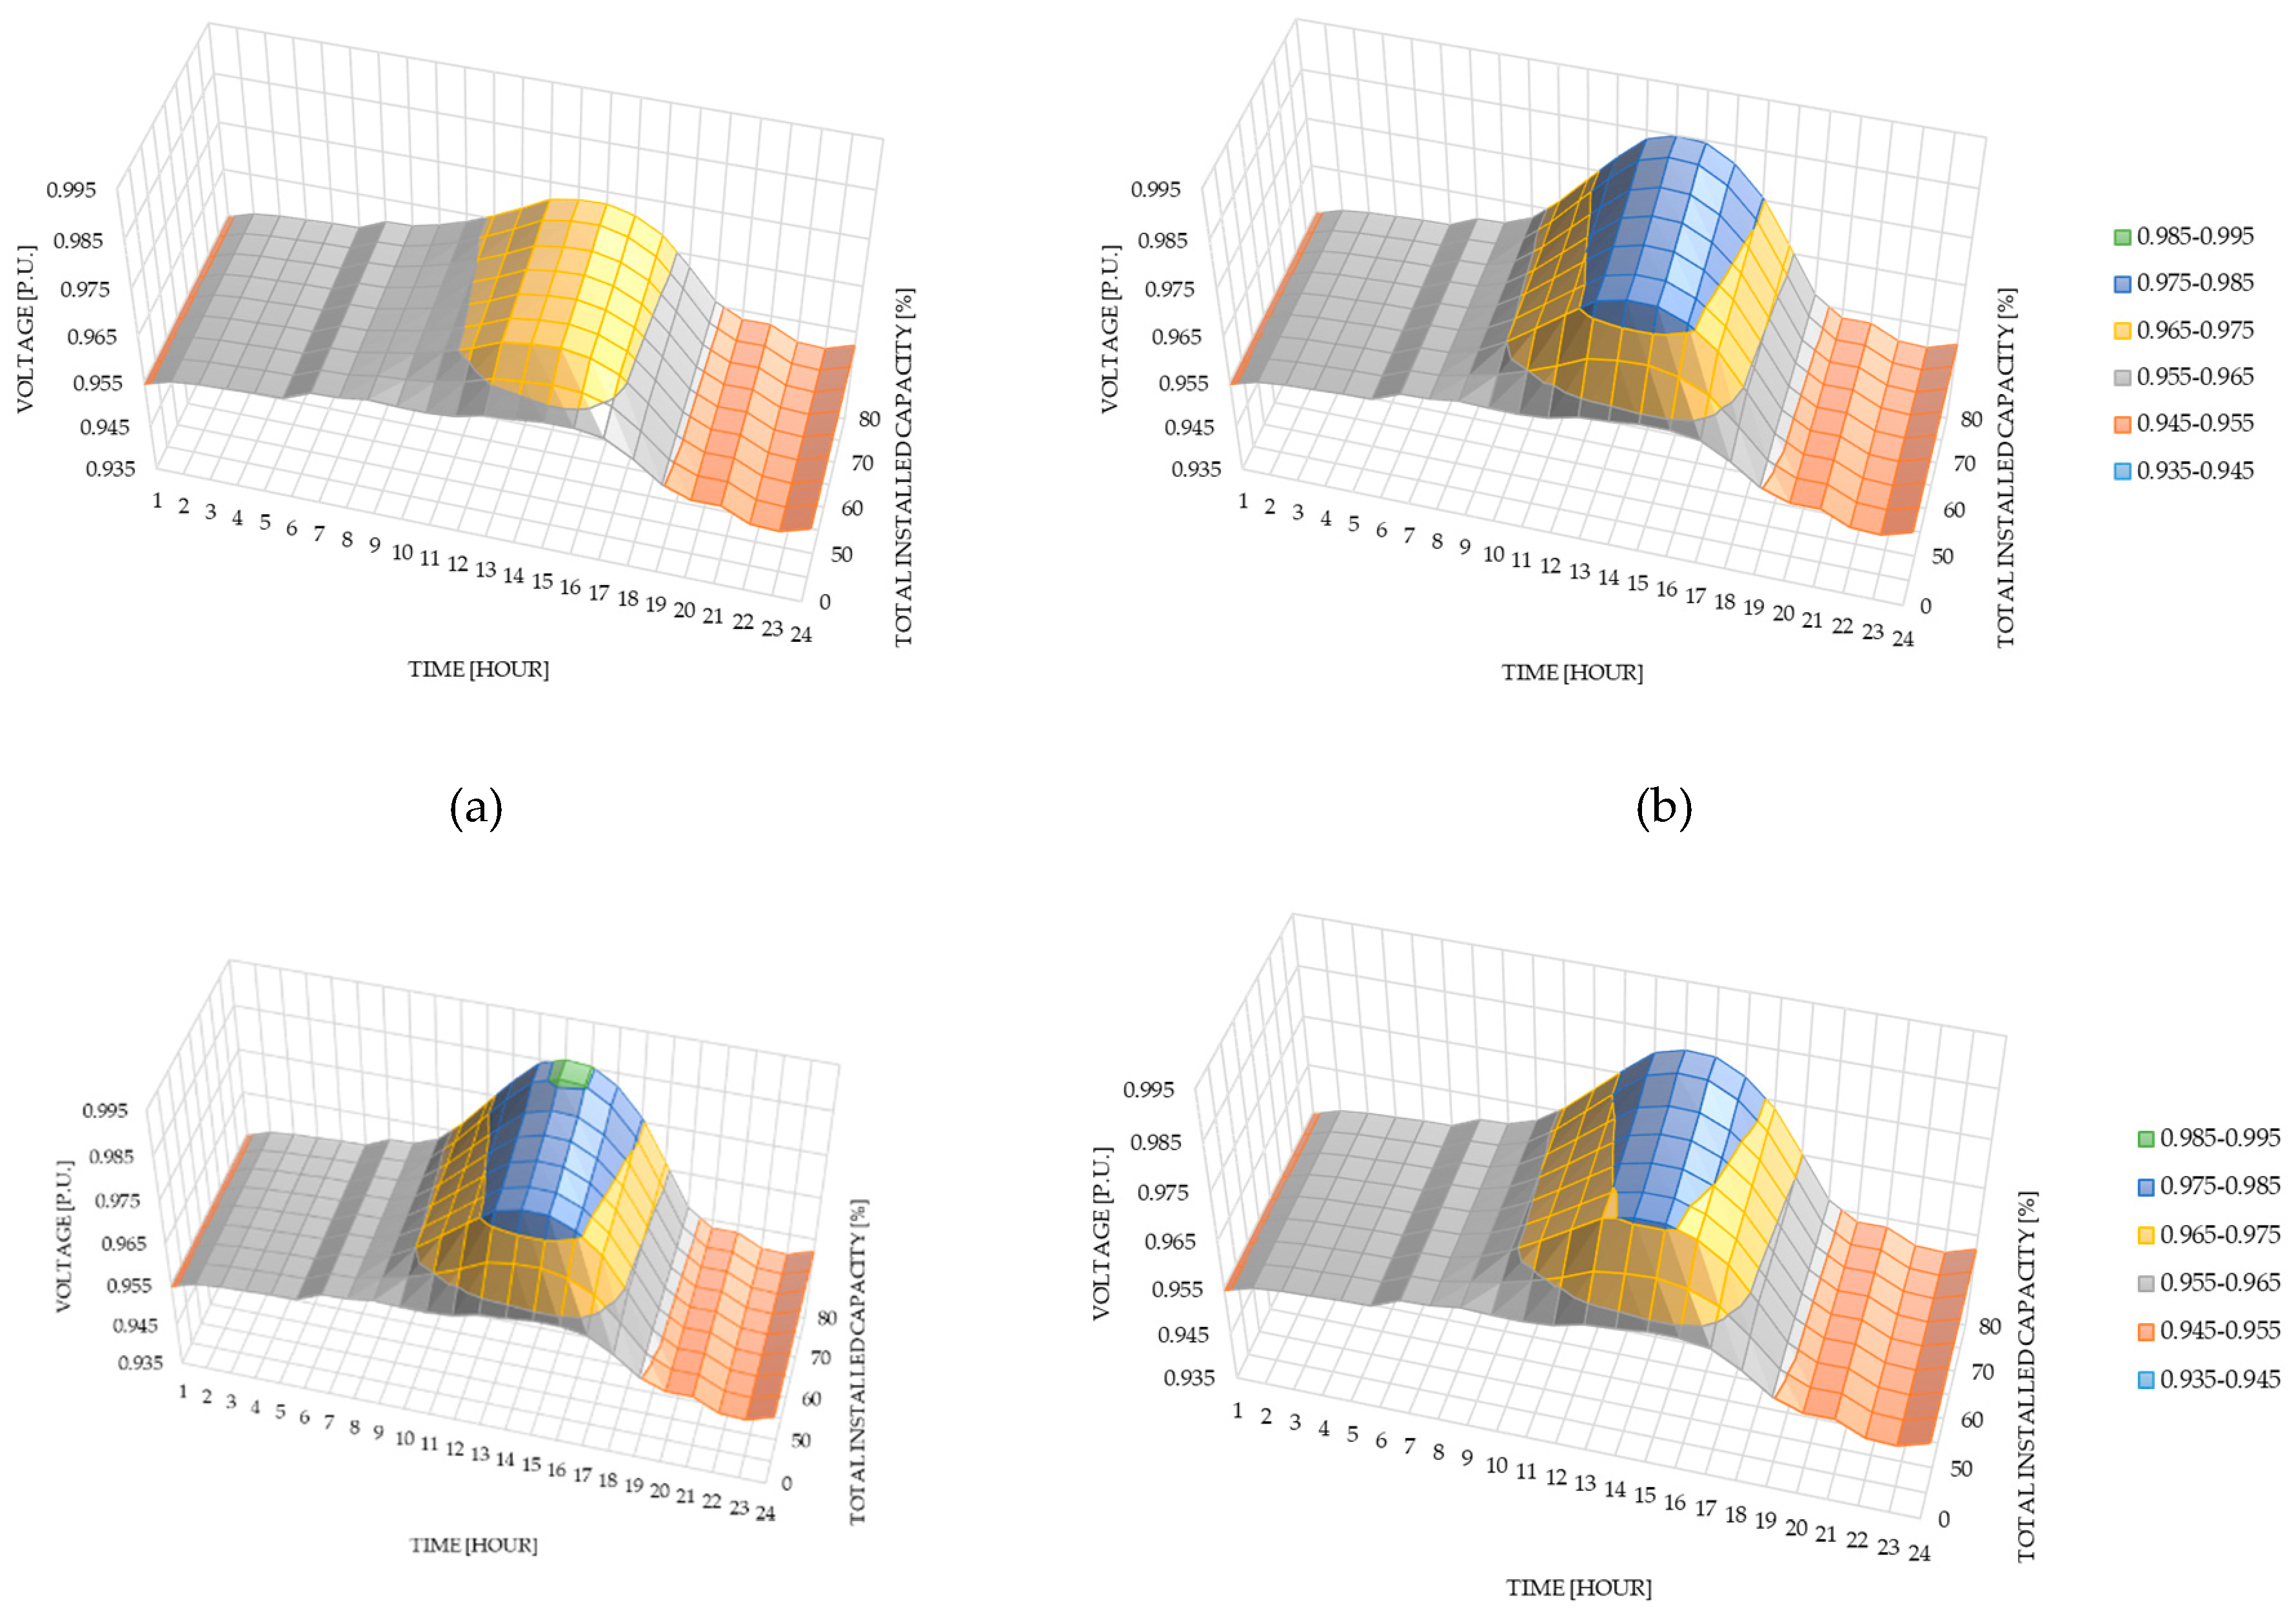
Figure 9.
Probed voltage deviation at the end of the power distribution line when the solar PV systems are connected (a) at the beginning, (b) in the middle, (c) at the end, and (d) evenly distributed.
Figure 9.
Probed voltage deviation at the end of the power distribution line when the solar PV systems are connected (a) at the beginning, (b) in the middle, (c) at the end, and (d) evenly distributed.
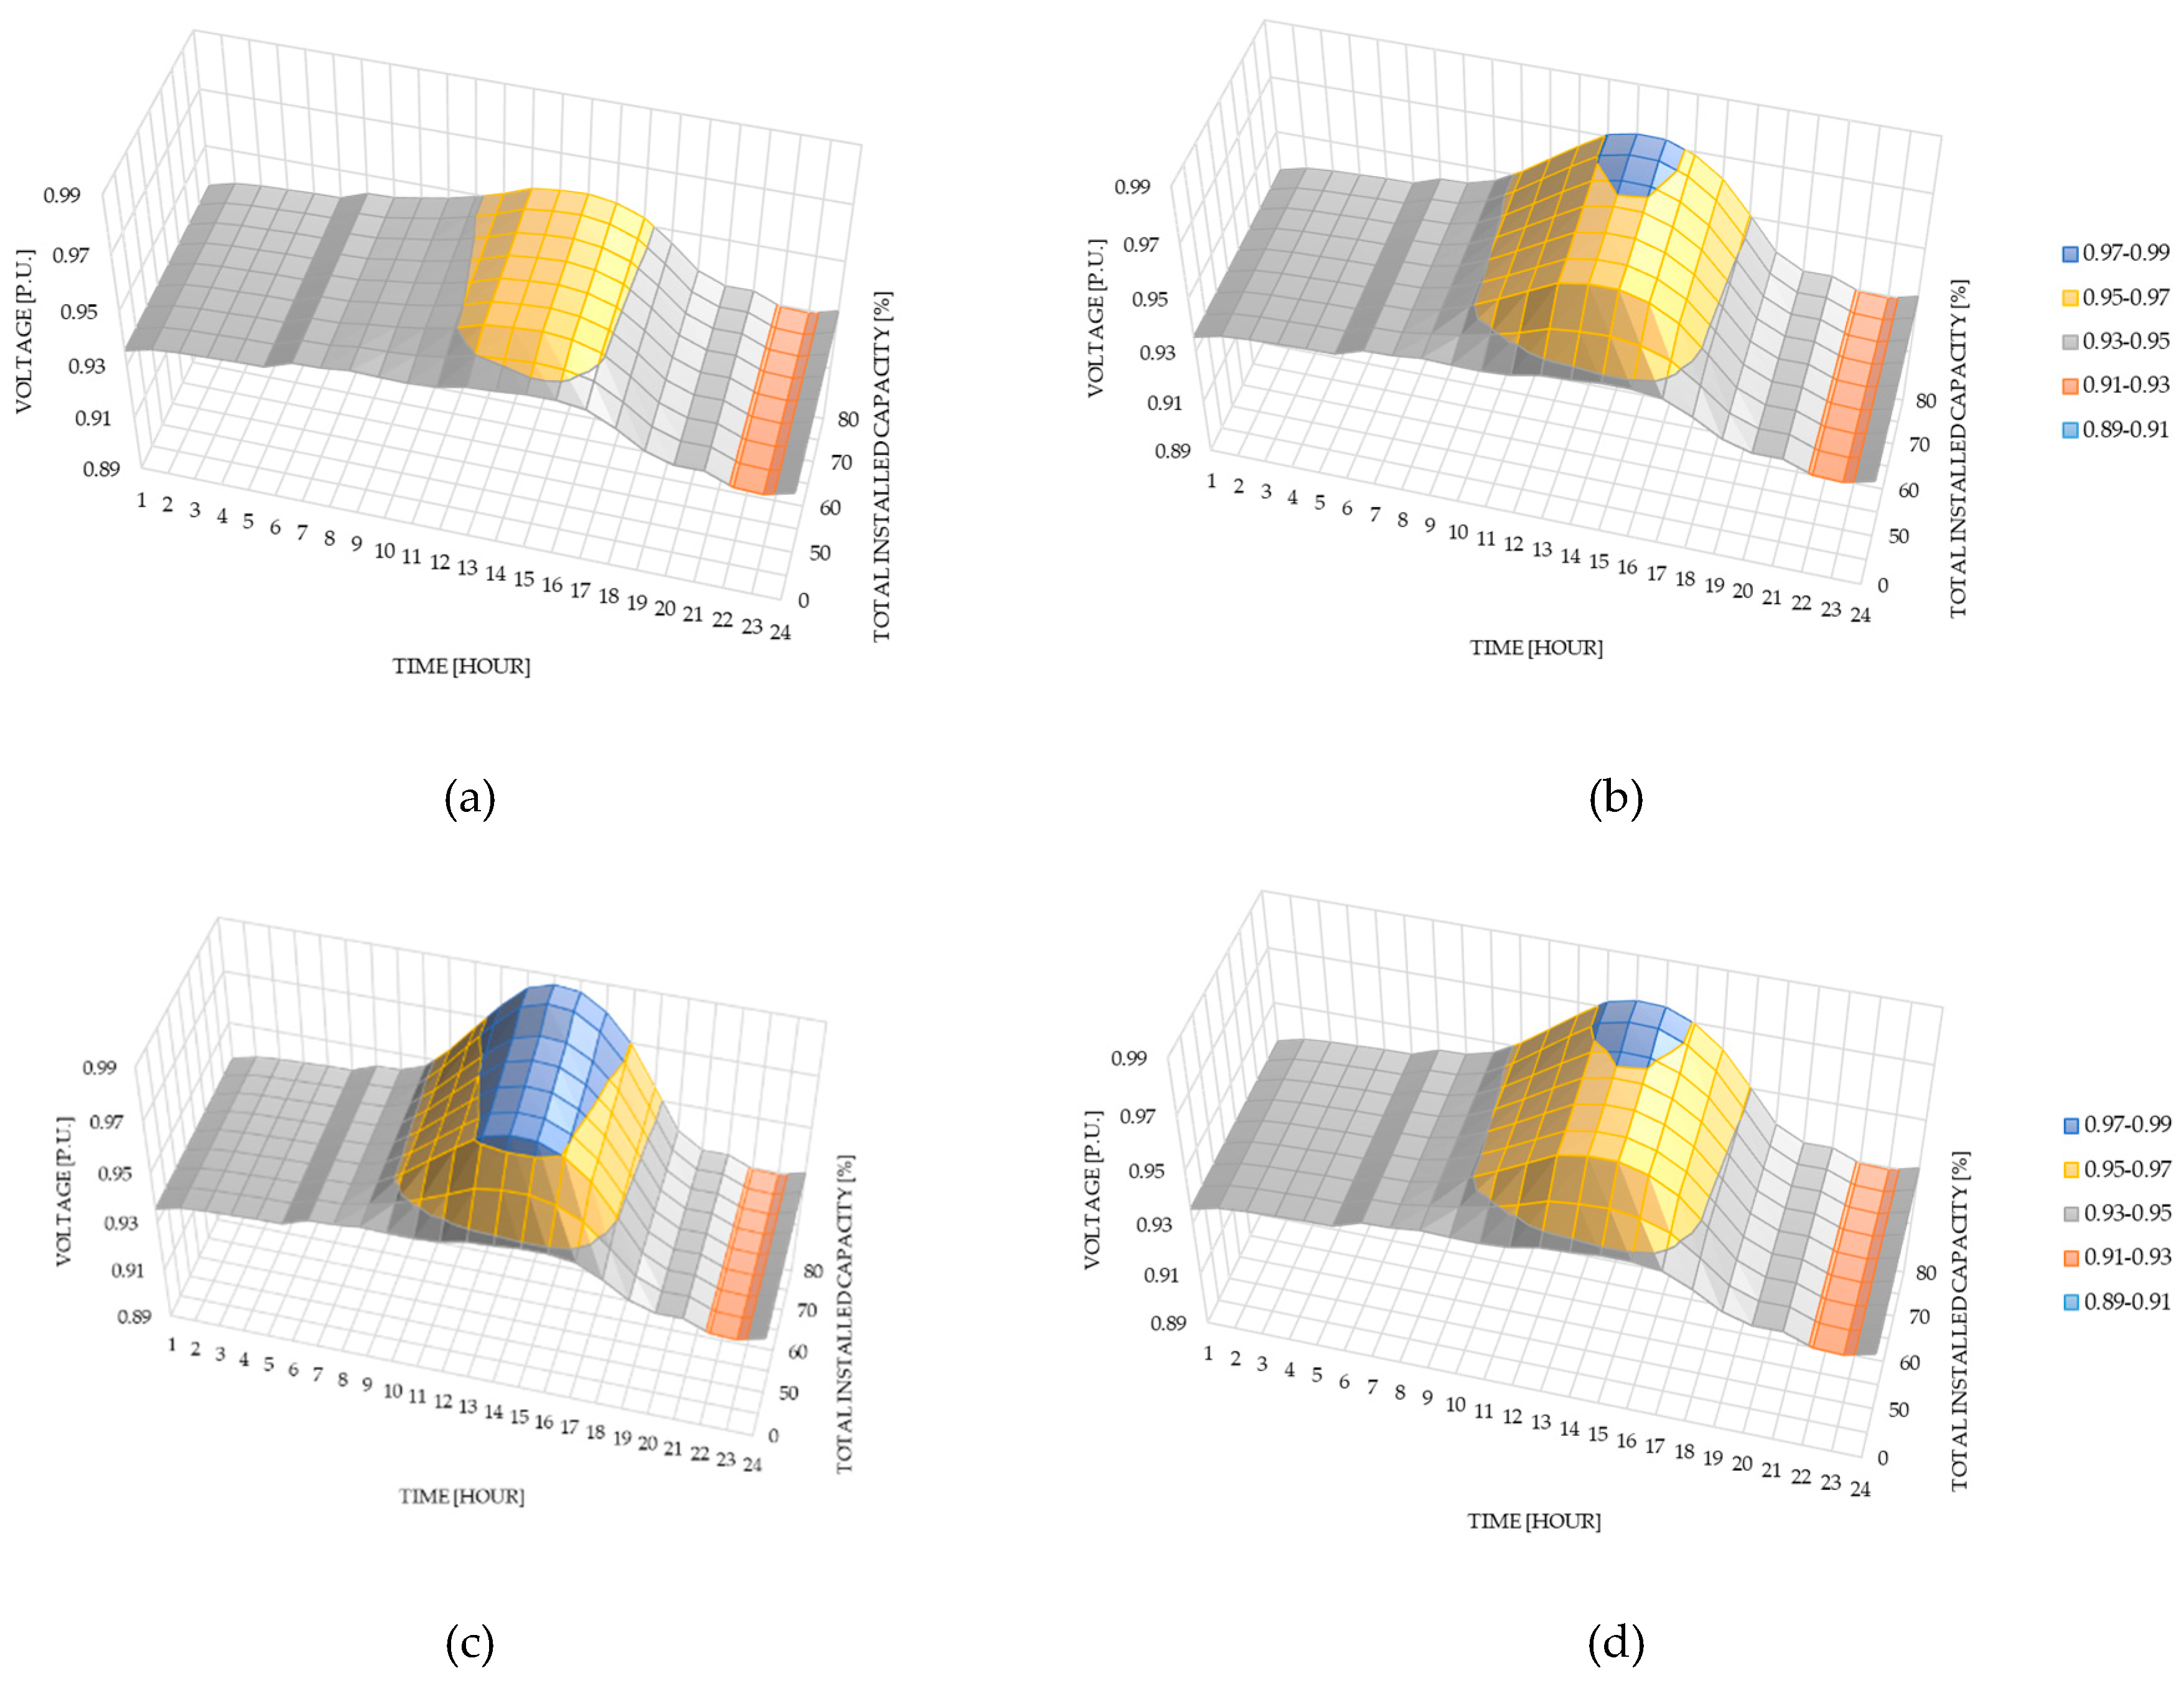

Table 1.
The specifications of each 10/04 kV transformer connected to the Dambadarjaa feeder.
| No. | No. of Transformer | Rated Power [kVA] |
|---|---|---|
| 1 | 1 | 30 |
| 2 | 1 | 40 |
| 3 | 1 | 50 |
| 4 | 1 | 63 |
| 5 | 2 | 100 |
| 6 | 6 | 160 |
| 7 | 17 | 250 |
| 8 | 7 | 400 |
Table 2.
The seasonal lowest and highest loads of the Dambadarjaa feeder.
| Season | Lowest Load [%] | Highest Load [%] |
|---|---|---|
| Winter | 116.89 | 157.47 |
| Spring | 64.13 | 104.96 |
| Summer | 27.56 | 70.72 |
| Autumn | 68.61 | 111.35 |
Disclaimer/Publisher’s Note: The statements, opinions and data contained in all publications are solely those of the individual author(s) and contributor(s) and not of MDPI and/or the editor(s). MDPI and/or the editor(s) disclaim responsibility for any injury to people or property resulting from any ideas, methods, instructions or products referred to in the content. |
© 2025 by the authors. Licensee MDPI, Basel, Switzerland. This article is an open access article distributed under the terms and conditions of the Creative Commons Attribution (CC BY) license (http://creativecommons.org/licenses/by/4.0/).
Copyright: This open access article is published under a Creative Commons CC BY 4.0 license, which permit the free download, distribution, and reuse, provided that the author and preprint are cited in any reuse.


