Submitted:
03 January 2025
Posted:
08 January 2025
You are already at the latest version
Abstract
The article provides a comprehensive analysis of optimizing the component shares in hybrid solar and wind power plants across European countries. The study is based on long-term meteorological data from 1980–2022 with a spatial resolution of 0.25x0.25 degrees. Calculations of gross and net available energy were conducted using daily values of solar radiation, wind speed, and temperature, incorporating technical constraints. Optimal proportions for utilizing various energy sources were determined using Markowitz Portfolio Theory (MPT). Historical daily data on solar radiation, wind speed, and temperature, coupled with Mann-Kendall tests at a 5% significance level, were utilized to assess trends and identify climate variability over time. Statistical models employing Monte Carlo Methods were applied to forecast daily values of solar radiation, wind speed, and temperature over a 10-year horizon. Based on these forecasts, the shares of components in hybrid power plants were re-optimized, enabling an evaluation of the impact of predicted climate changes on the energy mix. To illustrate potential financial implications of these climatic changes, the study calculated variations in revenue from energy sales for a 2 MW hybrid system (1 MW solar, 1 MW wind) across individual countries. The analysis revealed disparities in revenue changes, with losses of up to -150 EUR/day in southern Europe but gains of up to +135 EUR/day in northern and central regions, such as the British Isles and eastern Germany. These findings emphasize the need for tailored energy strategies to mitigate economic risks in vulnerable areas while maximizing opportunities in regions forecasted to benefit from climatic shifts. The results are presented graphically and conclude with a discussion on the implications of climate change for the economic viability of hybrid energy systems. This study highlights the importance of integrating climatic forecasts, advanced modeling techniques, and financial analysis in the strategic planning of renewable energy infrastructure.
Keywords:
hybrid power plants
; WT power plants
; PV power plants
; MPT
; optimization
; RES variability
; Monte Carlo methods
1. Introduction
Climate change represents one of the most significant challenges of our time, serving as a key driver of the global transition towards sustainable energy systems [1,2,3,4]. Achieving carbon neutrality and reducing greenhouse gas emissions requires a shift away from fossil fuels towards renewable energy sources (RES) [2,3,4,5,6,7]. Among the most promising solutions are hybrid power plants that combine photovoltaic (PV) and wind turbine (WT) technologies. These systems leverage the complementary characteristics of solar and wind energy, enhancing stability, efficiency, and reliability in energy production [2,5,6,8,9,10,11].
Europe, as a global leader in energy decarbonization, aims to achieve an 80–95% share of RES in its energy mix by 2050 [12]. However, integrating RES into existing grids faces challenges due to the natural variability of resources like solar radiation and wind speed [13,14,15]. Solar energy production peaks during the day, while wind energy is often more available at night or under low sunlight conditions [16]. This complementarity makes them ideal components of hybrid systems, but their availability is highly dependent on climatic conditions. Climate variability, shaped by long-term changes in temperature, solar radiation, and wind patterns, directly impacts the future potential of PV and WT energy production [4,17,18]. Forecasts suggest a 10–12% decline in solar energy potential in Northern Europe [19], with moderate increases expected in Southern regions, while wind energy exhibits even more complex regional variability [1,20,21,22].
To address these uncertainties, advanced analytical approaches like Monte Carlo simulations are crucial. These probabilistic methods enable modeling of diverse climate scenarios, allowing for a more accurate assessment of long-term RES performance and the optimization of hybrid energy system design [13,23,24]. This study aims to evaluate the impact of climate variability on the optimal shares of PV and WT in hybrid power plants across Europe, providing actionable insights for strategic energy policy and planning [25,26,27]. By incorporating Monte Carlo modeling, this analysis captures the complex interplay between climatic trends and RES resources, offering robust frameworks for maximizing resource utilization and system reliability [28,29,30].
Achieving the ambitious goal of climate neutrality by 2050 requires energy systems resilient to climatic fluctuations. Understanding the variability and complementarity of PV and WT resources is key to developing stable systems capable of maintaining energy supply even under extreme weather conditions [31,32,33,34]. This study supports not only the decarbonization agenda but also strengthens Europe’s energy security by reducing dependence on imported fossil fuels [34]. The application of Monte Carlo methods represents a significant step forward in optimizing hybrid PV-WT systems, ensuring their sustainability and adaptability to future climatic conditions [25,33,35,36,37].
The increasing share of RES in energy systems comes with additional technical challenges, such as ensuring supply stability and minimizing the risk of energy shortages. Production variability necessitates more precise forecasting tools and flexible technologies. Regional integration and optimization of renewable installations play a pivotal role, especially in Europe, where climatic conditions vary significantly. By analyzing an extensive 43-year dataset on temperature, wind speed, and solar radiation across Europe, this study examines the impact of climate variability on the potential for PV and WT energy production. Modern Portfolio Theory (MPT), widely used in finance to optimize risk and return, has been adapted to the energy sector to determine the optimal mix of PV and WT technologies. This approach minimizes production variability while maximizing efficiency, providing valuable guidance for renewable energy planning.
Monte Carlo simulations explore multiple climate scenarios, accounting for uncertainties in long-term forecasts. This approach forms the basis for defining how PV and WT shares may evolve under different climatic conditions. The findings highlight the importance of flexible energy planning to reduce production variability and optimize resource allocation [9,38]. Regional strategies tailored to local climatic conditions are essential for ensuring stable and efficient energy supply. These insights are vital for investors and policymakers, providing a foundation for long-term energy strategies that minimize risks and costs associated with energy shortages.
The application of Markowitz’s model refines these strategies, enabling identification of approaches that maximize efficiency while minimizing risk in hybrid energy systems [20,39,40,41,42]. Flexible and adaptive energy systems are essential for managing local and global climatic changes, promoting efficient resource utilization and strategic energy planning [3,12,26,32,33,37,43,44]. In summary, this study provides practical tools and insights supporting the development of hybrid energy systems resilient to climate variability. The results contribute to achieving climate neutrality goals, ensuring stable and sustainable energy supplies, and solidifying Europe’s leadership in renewable energy integration. Subsequent sections discuss the methodology, results, and implications for the future of Europe’s energy sector.
2. Modern Portfolio Theory
Modern Portfolio Theory (MPT) extends the classical portfolio theory initially introduced in the 1950s by Harry Markowitz, a Nobel laureate in economics [41,40]. Markowitz proposed a methodology for selecting efficient investment portfolios, based on maximizing the expected rate of return while considering the level of risk investors are willing to accept [25]. This theory assumes that investors evaluate investments using two fundamental variables: expected return and variance. According to MPT, risk-averse investors prefer portfolios that offer the maximum expected return for a given level of risk or minimize risk for a set expected return.
The mean-variance model, which forms the foundation of MPT, highlights the benefits of investment diversification, enabling the minimization of risk while maintaining the desired expected return. This approach allows for the identification of the efficient frontier, which represents different investment portfolios in the risk-return space [20,45,46]. Portfolios located on this frontier are considered efficient because they provide the best balance between risk and return. Investors are advised to select portfolios along the efficient frontier, as these offer optimal outcomes based on their individual preferences for risk and return.
The mathematical representation of a portfolio’s expected value and variance is defined by the following equations:
where: – expected return of the portfolio, – expected return of the i-th component of the portfolio, – weight of the i-th component in the portfolio, – Variance of the portfolio, - correlation coefficient between the i-th and j-th components of the portfolio, - standard deviation of the i-th component of the portfolio.
Alternatives for Investment Decision-Making:
- Maximizing the Expected Return for a Given Level of Risk (Equations (1)–(6)):
The investor determines the maximum level of risk they are willing to accept and selects a portfolio that maximizes the expected return within that risk threshold. This corresponds to identifying a portfolio on the efficient frontier that meets the risk tolerance criterion:
- Minimizing Risk for a Given Expected Return (Equations (1), (2) and (7)–(10)):
The investor specifies a desired expected return and chooses a portfolio that minimizes variance (risk) at that return level. In this case, the portfolio on the efficient frontier provides the lowest possible risk for the established expected return:
Amid increasing climate variability and unpredictable weather events, the classical MPT approach requires adaptation to the specifics of the renewable energy sector [47,48]. Fluctuations in temperature, wind speed, and solar radiation intensity make models based solely on historical data insufficient for predicting future energy production conditions. Therefore, more flexible models are necessary to incorporate new risk dynamics and the impact of climate change.
For wind and solar farms, weather variability leads to fluctuations in energy production, increasing the risk of unanticipated losses. Expanding MPT to include climate variables enables more precise investment planning and the development of hybrid systems resilient to climate change. This approach supports the optimization of the energy mix through dynamic adjustments of PV and WT installations based on climate forecasts. The flexibility of this solution reduces risk and ensures energy supply stability over the long term [25,45,40].
Modern Portfolio Theory is increasingly applied in the energy sector, particularly in the strategic planning of electricity generation. MPT facilitates the evaluation of trade-offs between energy production levels and the risks associated with resource unpredictability, such as wind and solar energy [47,48]. In practice, it helps investors and policymakers better manage risk and plan stable energy systems that are resilient to changing climate conditions [25].
3. PV Component
The Sun, acting as a perfect black body, continuously emits radiation, a portion of which reaches the Earth, where it is absorbed or reflected by the atmosphere and clouds. The intensity of this radiation, measured in units of [W/m²], along with the Global Horizontal Irradiance (GHI)—which represents the total radiation reaching the Earth’s surface throughout the day—are key indicators for assessing the photovoltaic potential of a given area. Photovoltaic energy production, which involves converting sunlight into electricity through the photovoltaic effect, takes place in solar power plants. These plants are often integrated with other renewable energy sources, enhancing their flexibility and reliability.
For the purpose of analysis, a photovoltaic farm with an installed capacity of 1 [MWp] was considered. The output power (Equations (11) and (12)) of the panels was calculated using the formula provided below :
where: - output power of the panel [W], =0,85 efficiency factor, – nominal power of the PV panel [W],, =1000 [W/m2] irradiance under Standard Test Conditions (STC), operating temperature [°C], =25 [°C] – reference temperature under Standard Test Conditions (STC), average irradiance on a horizontal surface, [W/m2].
Finally, the following formula was adopted:
– total solar radiation (direct, reflected, and diffuse) [W m-2].
4. Wind Power Plant Component
Wind power plants harness wind energy (the kinetic energy of moving air masses) and convert it into a useful form of energy, typically mechanical or electrical [49]. The devices where this transformation takes place are called wind turbines. Energy conversion occurs when an air stream passes through the area swept by the rotor of a wind turbine. The rotor blades are aerodynamically shaped to move perpendicularly to the air stream, utilizing a portion of the kinetic energy available in the moving wind [49]. The amount of wind energy depends on wind speed and air density. Not all the kinetic energy available in the wind can be converted into another form of energy as it passes through a wind turbine. The ratio of the kinetic energy that can be converted by wind turbines to the kinetic energy available in the wind is known as the power coefficient (). The maximum value of the power coefficient that can be achieved by a wind turbine is 16/27 (59.3%, Betz’s law) of the kinetic energy available in the wind [50].
The output power of a wind turbine (Equations (13) and (14))varies with wind speed according to the following equation [49,50]:
where: - output power [W], - power coefficient, - air density [kg/m3], - area swept by the rotor blades, [m2], - wind speed, [m/s], Wind speed adjusted to a height of 100 [m], with a scaling factor of 1.044.
where: [m/s] – wind speed at height [m] , [m/s] – wind speed at height [m], =0.03 [m] (open agricultural land without fences and hedges; maybe some far apart buildings and very gentle hills.
Both the power coefficient () and the output power depend on wind speed. The efficiency of a wind turbine is generally represented by its power curve, which illustrates the exact output power achievable from a wind turbine for each wind speed value. The cut-in speed is the wind speed at which the wind has enough energy to start moving the rotor blades from their static position. The rated speed is the wind speed at which the turbine achieves its rated output power or maximum power capacity. Beyond this speed, the output power remains constant at the rated power level. At wind speeds above the cut-out speed, the wind turbine must be shut down to prevent damage. The power curve of a wind turbine is typically provided by turbine manufacturers as a representation of its performance [50].
In this model, the air density was additionally determined using the relationship between temperature, pressure, and density (Equations (15) and (16)), employing the following approach [50]:
where:
=1013.25 [hPa]– atmospheric pressure at reference level,
=1.293 [kg m-3] – reference air density,
[kg mol-1] – molar mass of air,
=9.81 [m s-2] – gravitational acceleration,
= 8.314462618 [J mol-1 K-1] – gas constant,
k =Tc +273.15 [°K] – air temperature (Kelvin),
=0.0289 [kg mol-1]– effective molar mass of air,
[kg m-3] – air density,
[m] - elevation above mean sea level, including an additional 100 m for the turbine hub height above ground level.
5. Data Used in the Analysis
The analysis in this article is based on daily data presented in a grid format, sourced from published products by the National Oceanic and Atmospheric Administration (NOAA) and the European Union’s Earth Observation Programme [51,52]. The study covers an area of 5750 km x 4100 km (latitude: -15° to 40° and longitude: 35° to 75°) [53]. A spatial resolution of 0.25° x 0.25° was adopted for the analysis. The grid products are accessible online. The study utilized data characterizing wind energy potential, solar energy potential, and temperature. Terrain elevation information (DEM) was also included in the calculations [53].
6. The Concept of Energy Cooperation—An Example
This example illustrates the application of MPT in energy cooperation analysis. The analysis was conducted for the location of Scourborough, England. For data on solar radiation, temperature, and wind speed at a height of 100 m above ground level, a detailed analysis of the gross energy potential available at the location was performed. The analysis characterized a minimum risk value of 70.09 [W/m²] and an expected available energy value of 120.77 [W/m²] (Figure 1). For the optimal point at minimum risk, the weight coefficients for the energy components are as follows: wind energy component = 0.076 and solar energy component = 0.924. The maximum expected gross energy value available at this location, at a risk level of 381.89 [W/m²], is 257.68 [W/m²]. The weight coefficients for this scenario are: wind energy component (= 1.0) and solar energy component ( = 0).
The introduction of modern technological solutions in the form of a hybrid power plant composed of a photovoltaic (PV) plant and a wind power plant, each with a capacity of 1 [MW], allows the conversion of this gross potential into net electrical energy (Figure 1). However, as a result of implementing these technical solutions, the maximum achievable energy parameters are:
- At minimum risk: 16.53 [W/m²], with an expected value of 30.31 [W/m²]. The weight coefficients are = 0.059) and ( = 0.941).
- The maximum expected net energy value at this location, at a risk level of 108.82 [W/m²], is 97.02 [W/m²]. The weight coefficients for this scenario are ( =1.0) and ( = 0).
The results of the MPT analysis indicate a reduction in the optimal gross energy value to net energy by 75% ((120.77 - 30.31)/120.77 = 75.0%) with a 76% reduction in minimum risk ((70.9 - 16.53)/70.09 = 76%). Consequently, the efficiency of the net electrical energy obtained from PV and wind power plants reached approximately 43.2% (30.31 [W/m²]/120.77 [W/m²]) relative to the available potential.
For the concept of a 2 MW energy mix, the following parameters were assumed:
- PV power plant: 1 MWp capacity with a PV cell rated at 225 [W/m²] (STC),
- Wind power plant: a 1 [MW] turbine by LM Glasfiber with an active blade area of 2290 [m²].
7. Climate Change
Ongoing climate change, driven by both natural processes and anthropogenic factors, underscores the growing need for carefully designed hybrid systems that are resilient to increasingly pronounced and varied extreme weather conditions. Climate change amplifies the polarization of extreme events, resulting in a higher frequency and intensity of phenomena such as droughts, storms, heatwaves, and strong winds [54]. These extreme conditions directly affect key parameters for renewable energy production: temperature, solar radiation, and wind speed.
Higher temperatures can reduce the efficiency of photovoltaic (PV) panels, while changes in solar radiation intensity—caused by cloud cover or irregular sunshine—affect the stability of solar systems. Similarly, wind speed, a critical factor for wind energy production, is becoming increasingly unpredictable, complicating energy supply planning and stability [13,16]. Variability in these parameters increases the risk of mismatches between energy production and demand, necessitating more flexible approaches to energy system design [55].
This study analyzes the impact of climate change on the optimal energy mix over the next decade. Climate variability leads to significant fluctuations in production potential, particularly for wind and solar systems, requiring dynamic adjustments to their proportions based on local conditions [56]. In regions with high seasonal variability, the shares of PV and wind energy can differ significantly depending on the time of year.
Findings based on Modern Portfolio Theory (MPT) provide valuable insights for strategic planning of investments in hybrid energy systems. The choice of location and technology should account for changing climate conditions and the resulting uncertainties. Flexible strategies that dynamically adjust the shares of wind and solar energy in the energy mix can minimize financial risks and enhance the stability of energy infrastructure [7].
The introduction of advanced methods, such as Monte Carlo simulations, enables better prediction of extreme weather impacts and improved management of risks related to energy supply disruptions. Such analyses support the design of more resilient hybrid systems that can adapt to climate variability and ensure long-term energy stability.
Regions with high seasonal variability, such as southern Europe, require more adaptive approaches to energy mix planning, including compensating for seasonal deficits of one source with another. More stable regions can implement less complex strategies, but they still need to account for potential future climate changes.
Creating regional energy strategies allows for better resource utilization and minimizes the risk of supply disruptions. Aligning energy production with local weather conditions increases system stability and reduces operational risks. Advanced climate models are essential for effective planning and management of these systems.
The synergy between PV and wind turbine (WT) systems, supported by energy storage solutions, is a key component of modern hybrid energy systems. Wind energy can compensate for solar energy shortages during prolonged cloudy periods, while PV systems provide energy during windless periods. The integration of energy storage further enhances this synergy by enabling surplus energy produced during periods of high resource availability, such as sunny or windy days, to be stored and used during times of lower production. This increases the stability and reliability of the entire system.
Energy storage plays a crucial role in minimizing supply disruptions and optimizing the use of renewable resources. This is particularly important in regions with high seasonal variability, where the ability to store energy helps compensate for seasonal deficits of one energy source with another, enabling more stable and predictable operation of energy systems. Additionally, the integration of energy storage allows for the creation of localized strategies tailored to specific climatic and operational requirements, enhancing the efficiency and flexibility of hybrid systems [7].
Regular adjustments to the proportions of PV and WT installations, combined with energy storage capabilities, allow for effective responses to changing climate conditions. This flexibility is essential not only for ensuring continuity of energy supply but also for better resource utilization, increasing energy efficiency, and reducing operational risks. As a result, hybrid energy systems supported by energy storage become more resilient to climate variability and better prepared for future challenges.
Advanced forecasting tools and dynamic management strategies are indispensable for energy systems to flexibly respond to changing weather patterns. MPT-based analyses support the development of more resilient hybrid systems, maximizing energy efficiency and reducing risks associated with climate variability. This approach not only enables better use of available resources but also prepares energy systems for future challenges.
8. Application of Monte Carlo Methods for Climate Forecasting
Modeling climate processes is essential for designing hybrid energy systems, particularly given the increasing variability and unpredictability of weather conditions [13,22,57]. Without accounting for dynamic climate changes, these systems may struggle to cope with extreme events, risking energy supply disruptions. Variability in parameters such as solar radiation, temperature, and wind speed necessitates the use of advanced modeling methods to ensure the resilience and adaptability of energy infrastructure [49,58].
Monte Carlo simulations enable the generation of numerous climate scenarios, providing better forecasts of how changing conditions might impact energy systems [49]. Integrating these simulations with modern techniques, such as artificial intelligence (AI) and deep learning, significantly enhances predictive accuracy. Algorithms like recurrent neural networks (RNN) and long short-term memory networks (LSTM) analyze historical and real-time weather data, identifying complex patterns and trends. This allows systems to dynamically adjust the balance between wind and solar energy based on actual and forecasted conditions [20,59].
This study applied Monte Carlo simulations to analyze climate change over a ten-year horizon. Using historical data and seasonal trends, a population of daily values for temperature, solar radiation, and wind speed was generated. The results indicate how changing conditions can influence the optimal proportions of energy sources in hybrid systems, improving their resilience.
In this study, the Monte Carlo method was employed to model climatic variability, enabling the simulation of numerous potential scenarios [49]. This approach provides insights into how changing conditions may influence the optimal proportions of energy sources, enhancing the robustness of energy system design. Monte Carlo modeling is particularly valuable for integrating uncertainty and risk, ensuring energy systems remain reliable and adaptable over long operational periods [49,58].
The forecasting model was based on the normal distribution. Anderson-Darling tests were conducted for all datasets to assess the suitability of using a normal distribution. Across the analyzed European region, for daily data on solar radiation, temperature, and wind speed, the normal distribution assumption was confirmed at a 5% significance level [60,61].
The next modeling step involved determining seasonal trend values. Monthly trends, based on daily historical data, were selected. Calculations for trends in temperature, wind speed, and solar radiation changes were performed using the non-parametric Mann-Kendall statistical test at a 5% significance level [54,62]. In areas where the use of Sen’s slope was confirmed, the calculated trend value was adopted [63]. For areas where Sen’s slope was not applicable, a zero trend value was assumed. For daily values, Monte Carlo simulations generated 1,000 iterations of solar radiation, temperature, or wind speed (Equations (16)–(18)). The mean value of these random iterations was adopted as the final result. Statistical modeling of climate variability factors was performed using the following mathematical model.
The climate variability modeling relied on the following equations:
where:
– number of years since the beginning of the forecast,,
– geographic coordinates (latitude, longitude) for a 0.25° x 0.25° grid area,
– indicators for solar radiation, temperature, and wind speed data, respectively,
– daily forecasted values of solar radiation, temperature, or wind speed at time ,
, - mean values for solar radiation, temperature, or wind speed for a given month based on historical data,
- standard deviation values for solar radiation, temperature, or wind speed for a given month based on historical data,
– random value drawn from a normal distribution with a mean of 0 and a standard deviation of 1,
- climatic trends (linear regression slopes) representing changes in solar radiation, temperature, or wind speed over time.
This approach enabled the generation of daily values for temperature, wind speed, and solar radiation over the projected decade. The results serve as a basis for analyzing the anticipated impact of climate change on the performance of hybrid energy mixes
9. Discussion of Research Results
The analysis conducted for Europe includes spatial distributions of optimal gross and net power at minimal risk, based on both historical and forecasted data. The results also account for maximum gross and net power values, providing insights into the energy mix potential of solar and wind power plants. Comparing historical data with forecasts enables the proposal of strategies to minimize losses, improve efficiency, and adapt systems to changing climatic conditions. Spatial power maps for the entire continent support the regionalization of energy strategies for the coming decade. The scenarios are detailed in a table, considering climate changes, implications for the energy mix, the development of adaptive technologies, infrastructure planning, and recommendations for improving system efficiency and stability.
Figure 2 illustrates the spatial distribution of the optimal expected values of available gross power density (at minimal risk) from the solar and wind power plant energy mix based on historical data. The maximum values of optimal available power reach 127 W/m², while the minimum values are 16 W/m². The highest values are located in the northern parts of Central and Eastern Europe, including England, France, Germany, Poland, southeastern Romania, northern Bulgaria, the Czech Republic, eastern Austria, northwestern Hungary, and western Slovakia (in the range of 70 to 100 [W/m²]). In contrast, the northern coast of Norway, eastern Spain, and southern Italy exhibit significantly lower values of available power. The distribution patterns of optimal expected power density from hybrid solar and wind energy systems, as illustrated in Figure 2, align with broader climate-driven forecasts. The observed gradient, where northern and central European regions exhibit higher densities compared to southern or coastal regions, reflects anticipated shifts in climatic conditions affecting solar irradiance and wind patterns. These findings support the notion from attached data that future renewable energy systems will likely exhibit greater stability and adaptability due to advances in modeling and infrastructure. However, the regional disparities emphasize the importance of tailored energy strategies, leveraging both climate models and emerging technologies like AI and deep learning for optimized resource utilization and risk management.
The spatial distribution of optimal expected net power values at minimal risk, achievable from the solar and wind power plant energy mix based on historical data, is shown in Figure 3. The maximum power values reach 34 [W/m²], while the minimum values are 4 [W/m²]. The maximum values are located in similar regions as the gross power values. The spatial distribution of net power values, as shown in Figure 3, reflects the reduction from gross values due to efficiency losses, aligning closely with regional trends observed for gross power densities. The higher net power densities in northern and central European regions emphasize their favorable climatic conditions for hybrid solar and wind systems, while lower values in southern and coastal areas highlight efficiency challenges tied to variability in resources. This aligns with observations from the uploaded dataset, which suggests that efficiency factors and regional climatic variations must be carefully integrated into energy planning to maximize reliability. These findings further underline the importance of combining advanced predictive tools and tailored regional strategies to enhance hybrid energy system performance and minimize operational risks.
Figure 4 illustrates the spatial distribution of maximum expected values of available gross power density from the solar and wind power plant energy mix based on historical data. The maximum values of available optimal power reach 343 [W/m²], while the minimum values are 75 [W/m²]. The highest values are located in England and eastern Ireland, as well as in the latitude band up to the 45° parallel. This is primarily associated with high levels of solar radiation intensity. The maximum expected values of gross power density, as depicted in Figure 4, emphasize the significant influence of solar radiation intensity on hybrid energy potential, particularly in regions like England, eastern Ireland, and areas up to the 45° parallel. These observations align with insights from the uploaded data, which stress the role of latitude and regional climatic conditions in optimizing energy mix outputs. This spatial variability underscores the importance of tailoring hybrid energy system designs to specific regional strengths, leveraging both solar and wind resources for maximum efficiency and resilience.
The spatial distribution of maximum expected net power values achievable from the solar and wind power plant energy mix based on historical data is shown in Figure 5. The maximum power values reach 102 [W/m²], while the minimum values are 17 [W/m²]. The highest values are located in southern and central Spain, Turkey, northern regions of France, Germany, Belgium, and the Netherlands, as well as Denmark and the British Isles. The spatial distribution of maximum net power values in Figure 5 highlights the influence of regional climatic conditions and resource efficiency, with notable peaks in southern Spain, Turkey, and northern parts of central Europe. This pattern, supported by the data, underscores the importance of integrating both solar and wind resources in regions with complementary resource availability. It also demonstrates that strategic planning in these high-potential areas can optimize energy outputs while addressing variability and maximizing system reliability.
Figure 6 illustrates the spatial distribution of optimal share coefficients for solar and wind power plants in the energy mix for gross power values. The maximum optimal shares of the solar component are located in England, eastern Ireland, northern France, Belgium, the Netherlands, Germany, Denmark, northern Poland, and northern Norway. The spatial distribution in Figure 6 highlights regions where solar energy achieves a dominant share in the optimal energy mix, particularly across northern and central Europe. This trend aligns with observations, which emphasize the importance of solar contributions in areas where consistent sunlight complements reduced wind variability. The data further suggest that balancing solar and wind shares in these regions can enhance system resilience and maximize gross power output under diverse climatic conditions.
Figure 7 illustrates the spatial distribution of optimal share coefficients for solar and wind power plants in the energy mix for net power values. The distribution corresponds to the gross shares for the solar component. The spatial distribution in Figure 7 indicates that the optimal net shares for solar power closely mirror the gross shares, highlighting the consistency of solar’s contribution to the energy mix across regions. As noted in the efficiency factors affecting net power values minimally alter the regional dominance of solar energy in areas with favorable solar irradiance. This alignment underscores the robustness of solar’s role in the energy mix, emphasizing the need for targeted optimization to leverage its full potential alongside wind resources.
Figure 8 illustrates the spatial distribution of optimal expected values of available gross power density (at minimal risk) from the solar and wind power plant energy mix based on forecasted data. The maximum values of available optimal power reach 122 [W/m²], while the minimum values are 16 [W/m²]. The highest values are located in the northern part of Central and Eastern Europe, including England, France, Germany, Belgium, the Netherlands, and Poland. The spatial distribution in Figure 8 demonstrates that forecasted data maintain a similar trend to historical observations, with the highest gross power densities concentrated in northern and central European regions. This highlights the consistent potential of these areas for hybrid solar and wind systems, further supported by their favorable climatic conditions and resource availability.
Figure 9 illustrates the spatial distribution of the difference between forecasted and historical calculated optimal expected gross power values from the solar power plant energy mix. The maximum values of available optimal power reach 6 [W/m²], while the minimum values are -32 [W/m²]. Positive values, indicating an improvement in optimal gross power values over the next decade, are observed in northern France, Germany, Belgium, the Netherlands, Denmark, Turkey, Portugal, Finland, Latvia, Lithuania, Estonia, and Sweden. In other areas, a decline in optimal power values is expected. The spatial distribution in Figure 9 highlights regional disparities in the forecasted changes to gross power values for solar power, with notable improvements in northern and central Europe, including countries like France, Germany, and the Netherlands. The observed declines in other regions emphasize the importance of adaptive energy strategies to mitigate potential reductions in solar efficiency and to capitalize on areas with forecasted growth.
Figure 10 illustrates the spatial distribution of optimal expected values of available net power density (at minimal risk) from the solar and wind power plant energy mix based on forecasted data. The maximum values of available optimal power reach 33 [W/m²], while the minimum values are 4 [W/m²]. The highest values are located in the northern part of Central and Eastern Europe, including England, France, Germany, Belgium, the Netherlands, Poland, and western Spain. The spatial distribution in Figure 10 shows that forecasted optimal net power densities remain highest in northern and central Europe, particularly in regions like England, Germany, and the Netherlands, reflecting their robust hybrid energy potential. These findings emphasize the importance of these areas for future energy infrastructure development, leveraging their favorable climatic conditions to optimize the solar and wind energy mix.
Figure 11 illustrates the spatial distribution of the difference between forecasted and historical calculated optimal expected net power values from the solar power plant energy mix. The maximum values of available optimal power reach 6 [W/m²], while the minimum values are -7 [W/m²]. Positive values, indicating an improvement in optimal net power values over the next decade, are observed in northern France, Germany, Belgium, the Netherlands, Denmark, Turkey, Portugal, Finland, Latvia, Lithuania, Estonia, southern Sweden, and northern Norway. In other areas, a decline in optimal power values is expected. The spatial distribution in Figure 11 highlights regional shifts in forecasted net power values for solar energy, with positive trends observed in northern and central Europe, including Germany, the Netherlands, and southern Sweden, suggesting increasing solar efficiency in these areas. Conversely, declines in other regions underscore the need for targeted adaptation strategies to address potential reductions and optimize energy production where improvements are forecasted.
Figure 12 illustrates the spatial distribution of maximum expected values of available gross power density from the solar and wind power plant energy mix for the forecasted data. The maximum values of available optimal power reach 200 [W/m²], while the minimum values are 50 [W/m²]. The highest values are located in the latitude band up to the 45° parallel, primarily due to high solar radiation intensity. The spatial distribution in Figure 12 underscores the significance of regions within the 45° latitude band for hybrid energy systems, where solar radiation intensity plays a dominant role in driving maximum gross power density. This distribution highlights the importance of focusing renewable energy investments in these areas to capitalize on their strong solar potential and ensure efficient energy generation under forecasted conditions.
Figure 13 illustrates the spatial distribution of the difference between forecasted and historical calculated maximum expected gross power values from the solar power plant energy mix. The maximum values of available optimal power reach 20 [W/m²], while the minimum values are -183 [W/m²]. Negative values, indicating a decline in maximum gross power values over the next decade, are observed along the northern coasts of France, Germany, Belgium, and the Netherlands, as well as in the British Isles. In other areas, an improvement in optimal power values is expect. The spatial distribution, Germany, and the British Isles, likely linked to reduced solar intensity or increasing variability. Conversely, areas with positive changes highlight opportunities for strategic investments and technological adaptations to optimize solar energy potential in regions expected to see improvement.
Figure 14 illustrates the spatial distribution of maximum expected values of available net power density (at minimal risk) from the solar and wind power plant energy mix for forecasted data. The maximum values of available optimal power reach 111 [W/m²], while the minimum values are 14 [W/m²]. The highest values are located in the northern part of Central Europe, including England, France, Germany, Belgium, the Netherlands, central and southern Spain, as well as Portugal and Turkey. The spatial distribution in Figure 14 emphasizes the continued dominance of northern and central Europe in achieving high net power densities, reflecting their favorable conditions for hybrid solar and wind energy systems. Additionally, the inclusion of regions like central and southern Spain, Portugal, and Turkey highlights the potential for broader geographic diversification of renewable energy investments under forecasted conditions.
Figure 15 illustrates the spatial distribution of the difference between forecasted and historical calculated maximum expected net power values from the solar power plant energy mix. The maximum values of available maximum power reach 20 [W/m²], while the minimum values are -10 [W/m²]. An improvement, indicating an increase in maximum net power values over the next decade, is expected along the northern coasts of France, Germany, Belgium, and the Netherlands, as well as in Denmark, the British Isles, western Sweden, and Norway. The spatial distribution in Figure 15 highlights promising improvements in maximum net power values for regions like northern France, Germany, and the British Isles, suggesting enhanced solar efficiency and better resource utilization in these areas over the next decade. This positive trend underscores the potential for strategic expansion of renewable energy infrastructure in these regions, particularly to leverage their increasing solar power contributions alongside existing wind energy potential.
Analyzing the maps of wind energy share coefficients (Figure 16 and Figure 17), it is important to note that the solar energy share coefficients will complement these to a total of 1. The greatest potential for wind energy is concentrated in the areas of the British Isles, Ireland, Spain, and the northern coasts of France, Belgium, the Netherlands, as well as the entire area of Denmark and the northeastern region of Germany. Central Europe is less endowed with wind energy resources.
Figure 16 illustrates the spatial distribution of changes in the optimal share coefficients for the wind energy component under forecasted gross energy mix conditions compared to historical conditions. An increase in the wind energy share is observed in Poland, the southern regions of Germany and France, as well as in Romania, Bulgaria, Albania, and Serbia. A decrease in the wind energy share is noticeable in the British Isles and Portugal.
Figure 17 illustrates the spatial distribution of changes in the optimal share coefficients for the wind energy component under forecasted net energy mix conditions compared to historical conditions. An increase in the wind energy share is observed in Switzerland, Austria, the Czech Republic, Slovakia, Slovenia, Serbia, Albania, Romania, Bulgaria, and northern Italy.
The spatial distribution in Figure 16 and Figure 17 highlight the dynamic shifts in the spatial distribution of wind energy share coefficients under forecasted conditions for both gross and net energy mixes. While regions traditionally strong in wind energy, such as the British Isles and Portugal, show a decline in wind energy share, areas like Poland, southern Germany, and parts of the Balkans experience notable increases. The rise in wind energy share in Central and Eastern Europe, including Austria, the Czech Republic, and northern Italy, emphasizes the growing importance of these regions in the future renewable energy landscape. These shifts underline the need for adaptive energy strategies that account for regional potential and forecasted changes, ensuring optimal integration of wind and solar energy to maintain balance and efficiency in the energy mix.
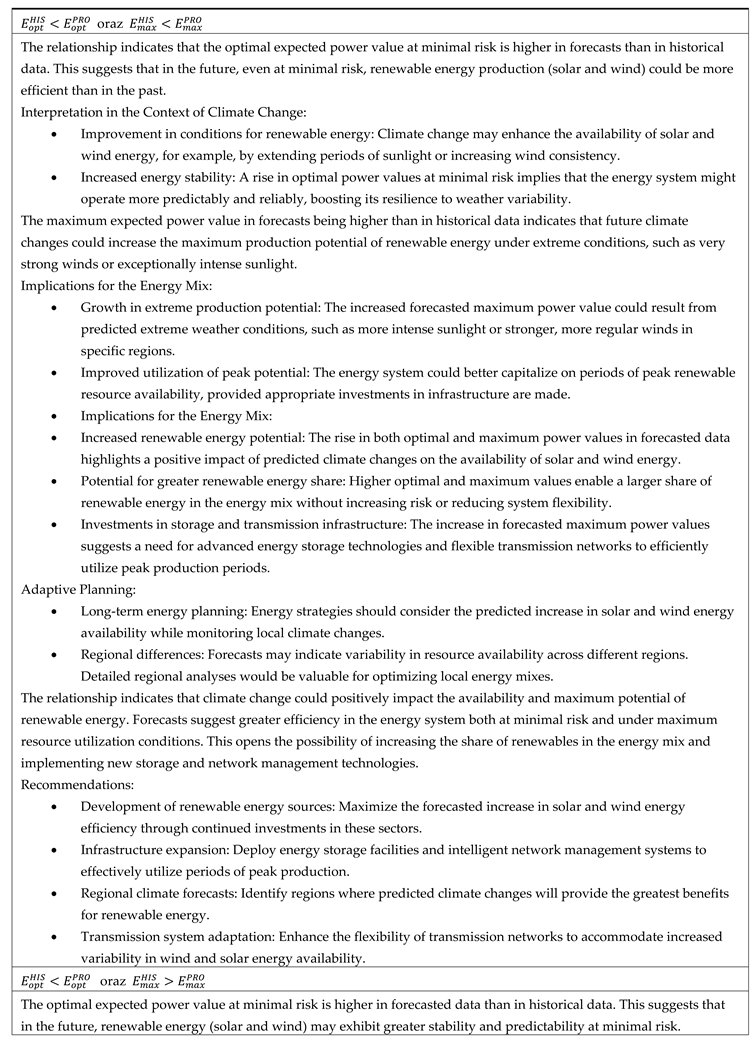
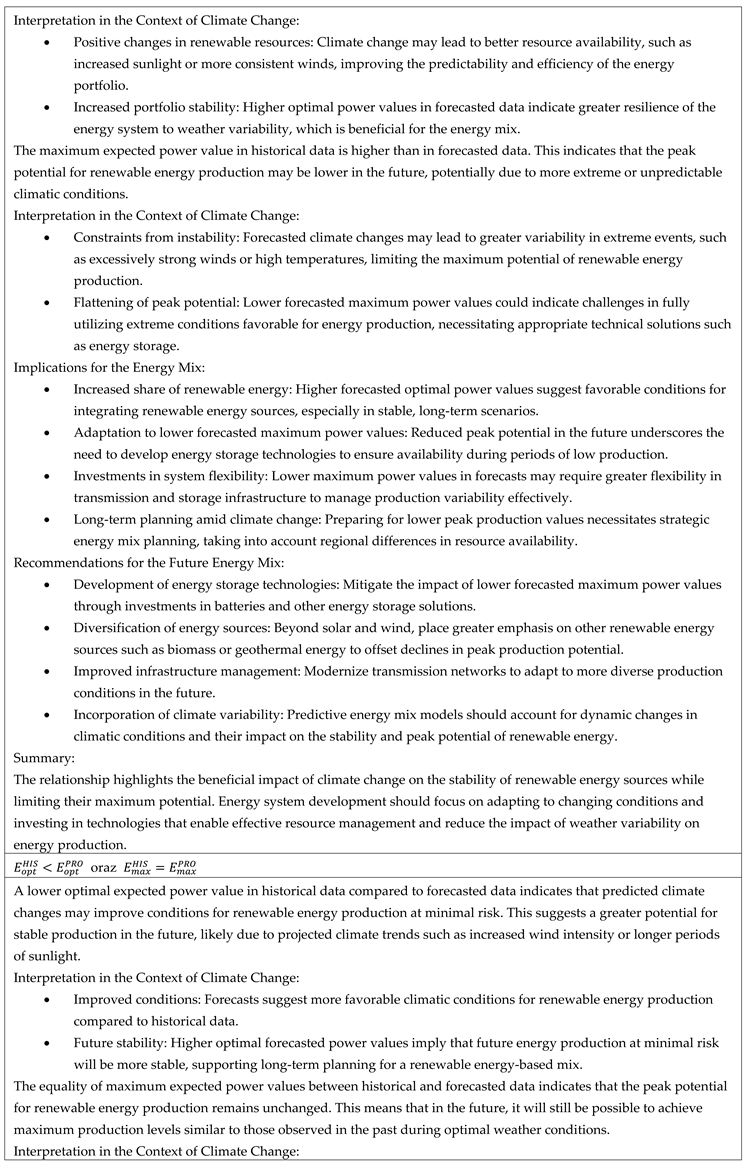
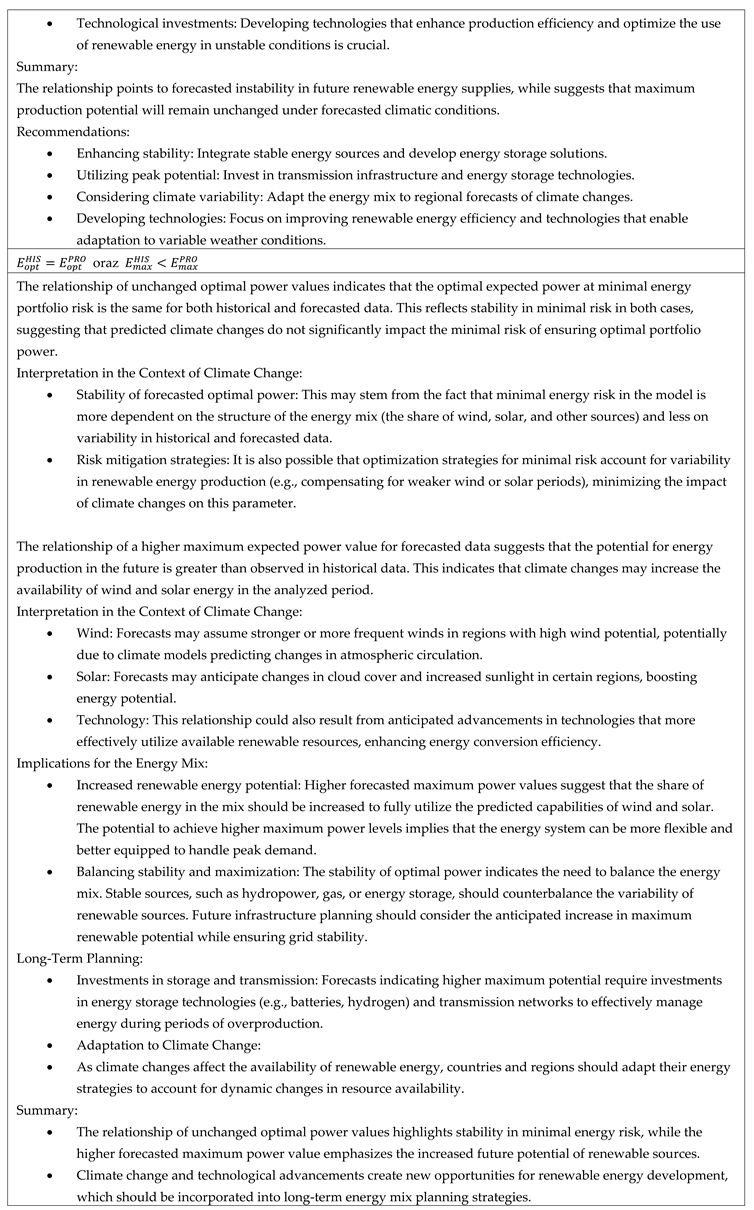
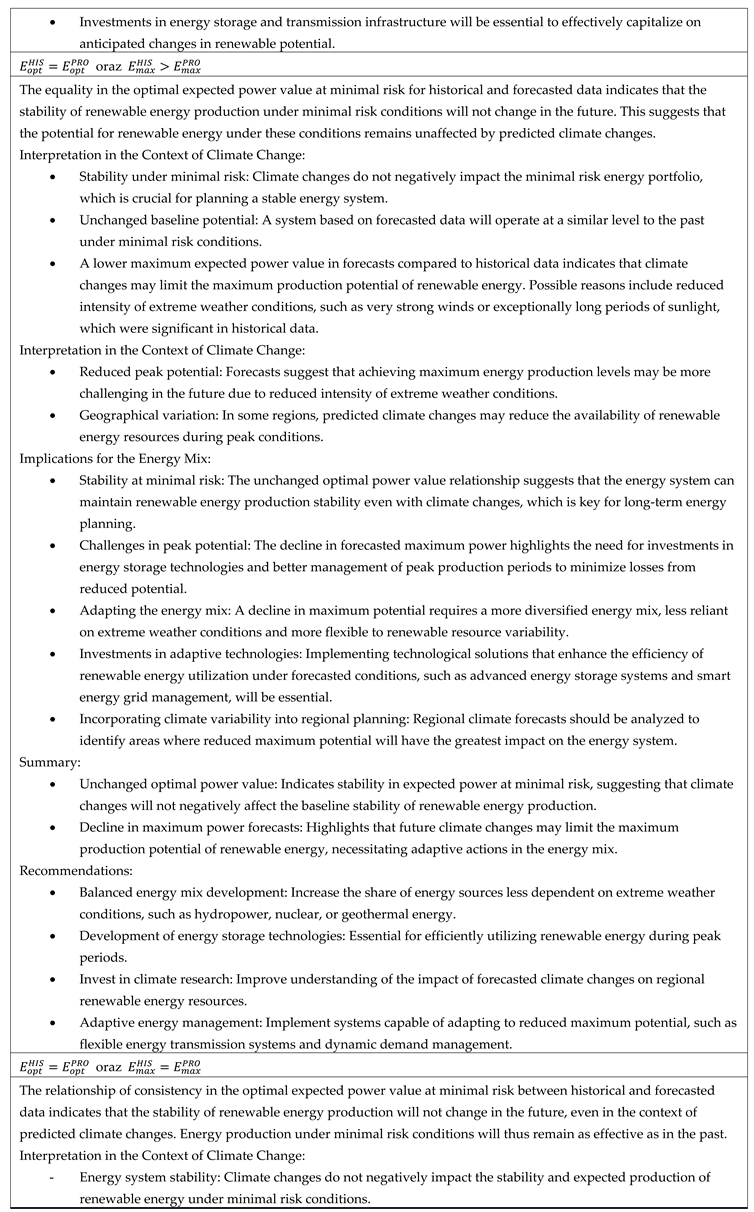
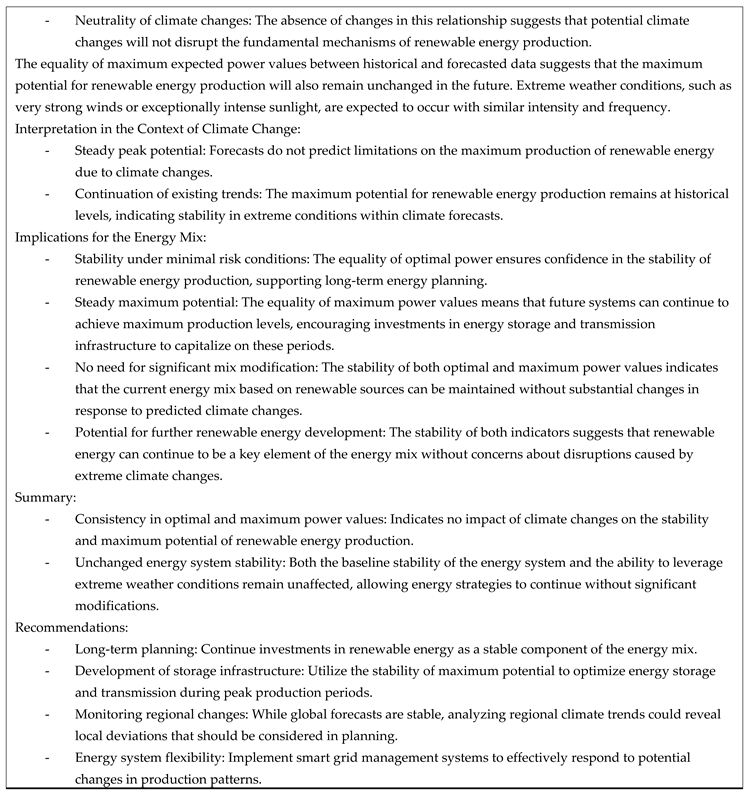
From the MPT analysis for the solar and wind power plant/potential energy mix, the optimal expected power value at minimal energy portfolio risk was obtained. Additionally, for the upper branch of Markowitz’s parabola, the maximum expected power value was determined. Analyses were conducted for both historical and forecasted data. Table 1 summarizes the characteristics of the relationships between optimal and maximum net power values.
Across the analyzed European region, various cases of relationships between optimal and maximum expected energy values, gross and net risks, were identified in both historical and forecasted dimensions. The study describes all possible cases of relationships between optimal expected power values at minimal risk and maximum expected power values for both historical and forecasted data. An effort was made to standardize and characterize these possible relationships in terms of:
Interpretation of relationships from the perspective of climate change,
- Implications for the energy mix,
- Diversification of the energy portfolio,
- Adaptability of energy infrastructure,
- Climate policy and regulations,
- Short-term and long-term planning.
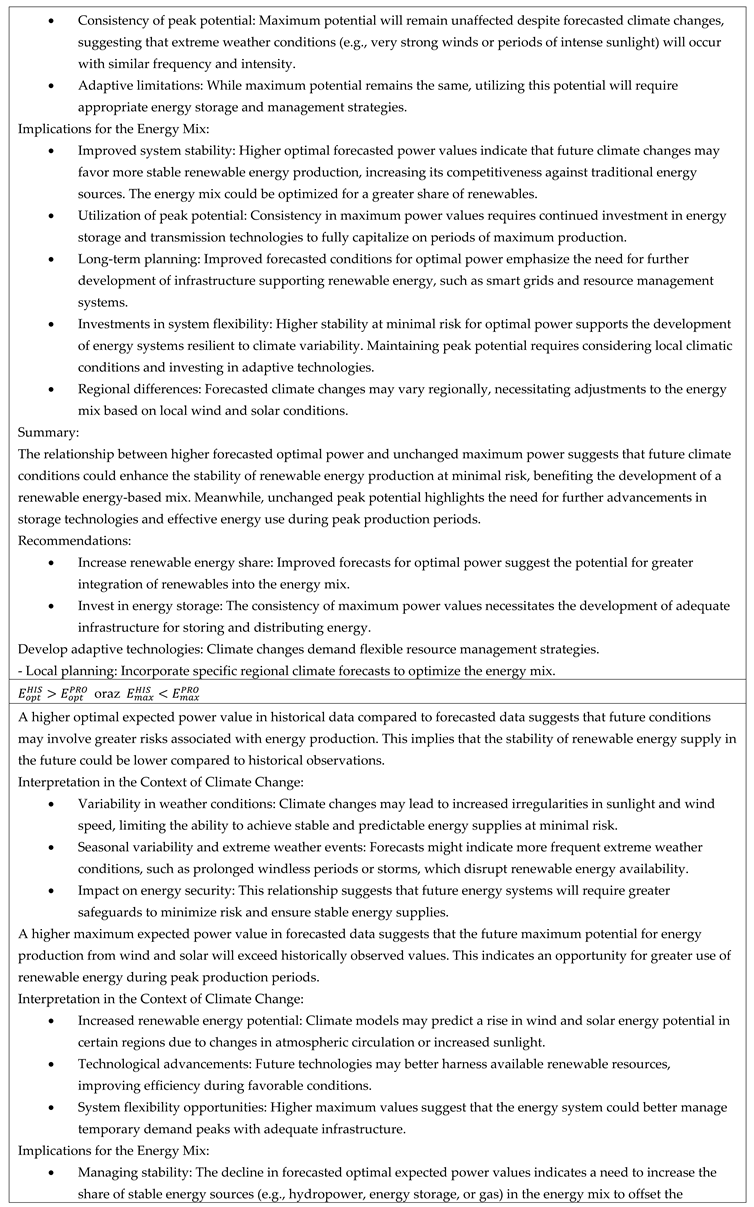
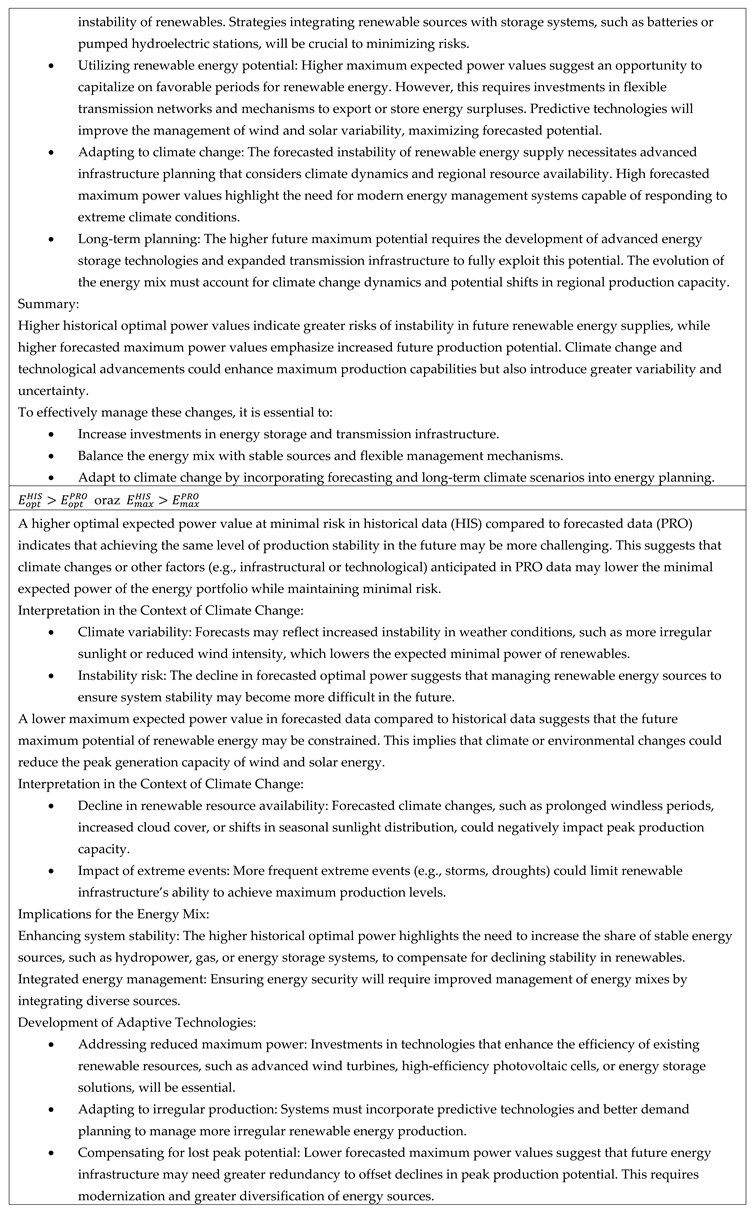
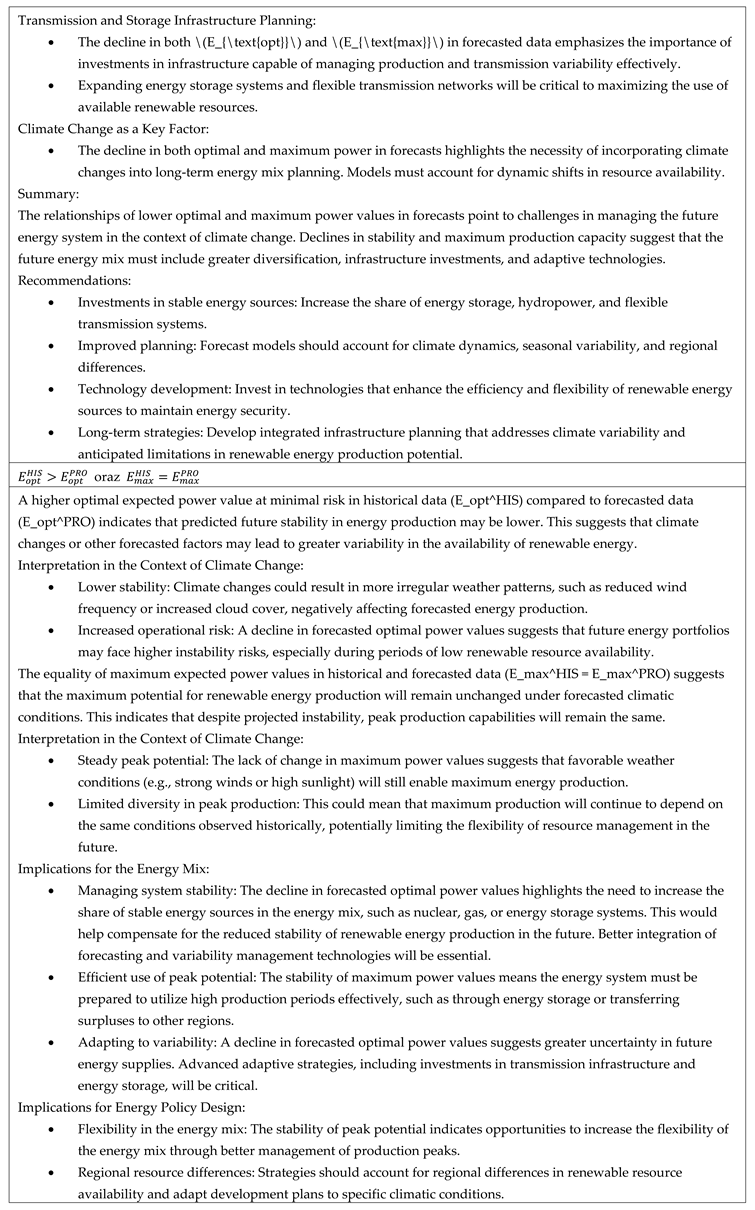
The corresponding cases are indicated in Table 1:
- [W/m2] – Optimal power value from the solar and wind power plant energy mix calculated based on historical data,
- [W/m2] – Optimal power value from the solar and wind power plant energy mix calculated based on forecasted data,
- [W/m2] – Maximum power value from the solar and wind power plant energy mix calculated based on historical data,
- [W/m2] – Maximum power value from the solar and wind power plant energy mix calculated based on forecasted data.
To illustrate potential financial changes resulting from climatic conditions, revenue fluctuations from energy sales were calculated based on optimal and maximum power values. The analysis focused on an energy mix of 2 MW (1 MW from solar power plants and 1 MW from wind power plants), with results expressed in [EURO/day]. Local energy prices converted to euros were used, assuming the current economic and energy policy conditions in individual European countries.
Key Findings:
- Revenue changes due to differences in optimal power (forecasted vs. historical, Figure 18): Fluctuations range from -150 to +40 EURO/day. The largest declines are observed in western and northern Spain, southern France, Italy, Switzerland, and southern Germany. Increases are anticipated in the British Isles, northern France, Belgium, and the Netherlands.
- Revenue changes due to differences in maximum power (forecasted vs. historical, Figure 19): Fluctuations range from -44 to +135 EURO/day. The largest increases are expected in the British Isles, eastern Germany, Spain, and Portugal, while declines are anticipated in northeastern Sweden and northern Finland.
Regional Differences:
- Optimal Power (Figure 18): Regions such as western Spain, southern France, and Italy are more exposed to losses, while northern France and the British Isles may benefit from revenue increases.
- Maximum Power (Figure 19): The British Isles, eastern Germany, and Portugal show positive financial prospects, highlighting their adaptive potential.
Recommendations:
The analysis emphasizes the need for localized energy strategies that:
- Minimize losses in regions vulnerable to adverse climatic changes.
- Maximize benefits in regions with improving conditions.
- Ensure a balanced economic impact at the regional level, supporting adaptation to evolving climatic conditions.
10. Summary
The analysis conducted for the European region considered differences in the optimal and maximum gross and net power values based on historical and forecasted data. Using daily data allowed for modeling climate variability and planning adaptive strategies for hybrid energy systems. Climate variability leads to significant fluctuations in the production potential of solar and wind energy, requiring adjustments to the proportions of these technologies based on seasonal and annual changes. The results of the analysis, based on Monte Carlo methods, highlight the critical role of flexibility in planning investments in hybrid power plants. Dynamically adjusting the shares of PV and wind energy enables a response to changing climatic conditions, which is essential for both existing and planned systems. Addressing risks and uncertainties arising from climate forecasts supports long-term planning.
The high-resolution data reveals regional differences across Europe, emphasizing the importance of local climatic conditions in shaping the optimal shares of PV and wind technologies. The results can serve as a foundation for developing adaptive strategies tailored to specific regional conditions and potential changes in the availability of renewable energy sources.
The analysis provides valuable insights for policymakers, supporting the development of decarbonization and energy mix diversification policies. Scenarios accounting for climate changes aid in planning the sustainable development of the energy sector. The application of Modern Portfolio Theory (MPT) promotes a flexible approach to planning, fostering the creation of efficient and resilient energy systems capable of meeting future challenges.
Funding
This research received no external funding.
Data Availability Statement
Dataset available on request from the authors.
Conflicts of Interest
The authors declare no conflicts of interest.
References
- Jaiswal, K.K.; Chowdhury, C.R.; Yadav, D.; Verma, R.; Dutta, S.; Jaiswal, K.S.; SangmeshB; Karuppasamy, K.S.K. Renewable and Sustainable Clean Energy Development and Impact on Social, Economic, and Environmental Health. Energy Nexus 2022, 7, 100118. [CrossRef]
- Matos, S.; Viardot, E.; Sovacool, B.K.; Geels, F.W.; Xiong, Y. Innovation and Climate Change: A Review and Introduction to the Special Issue. Technovation 2022, 117. [CrossRef]
- Owusu, P.A.; Asumadu-Sarkodie, S. A Review of Renewable Energy Sources, Sustainability Issues and Climate Change Mitigation. Cogent Eng. 2016, 3. [CrossRef]
- Jiang, H.; Lu, N.; Yao, L.; Qin, J.; Liu, T. Impact of Climate Changes on the Stability of Solar Energy: Evidence from Observations and Reanalysis. Renew. Energy 2023, 208, 726–736. [CrossRef]
- World Meteorological Organization Guide to Climatological Practices 2018 Edition; 2018; ISBN 9789263101006.
- Costoya, X.; deCastro, M.; Carvalho, D.; Gómez-Gesteira, M. Assessing the Complementarity of Future Hybrid Wind and Solar Photovoltaic Energy Resources for North America. Renew. Sustain. Energy Rev. 2023, 173. [CrossRef]
- Pan, T.; Ocłoń, P.; He, L.; Van Fan, Y.; Zhang, S.; Wang, B.; Nowak-Ocłoń, M.; Tóth, Á.; Varbanov, P.S. Strategic Integration of Residential Electricity: An Optimisation Model for Solar Energy Utilisation and Carbon Reduction. Energy 2024, 310, 133227. [CrossRef]
- Hassan, Q.; Viktor, P.; J. Al-Musawi, T.; Mahmood Ali, B.; Algburi, S.; Alzoubi, H.M.; Khudhair Al-Jiboory, A.; Zuhair Sameen, A.; Salman, H.M.; Jaszczur, M. The Renewable Energy Role in the Global Energy Transformations. Renew. Energy Focus 2024, 48, 100545. [CrossRef]
- López Prol, J.; de Llano Paz, F.; Calvo-Silvosa, A.; Pfenninger, S.; Staffell, I. Wind-Solar Technological, Spatial and Temporal Complementarities in Europe: A Portfolio Approach. Energy 2024, 292. [CrossRef]
- Kara, T.; Şahin, A.D. Implications of Climate Change on Wind Energy Potential. Sustain. 2023, 15. [CrossRef]
- Rekioua, D. Energy Storage Systems for Photovoltaic and Wind Systems: A Review. Energies 2023, 16. [CrossRef]
- Hassan, Q.; Algburi, S.; Sameen, A.Z.; Salman, H.M.; Jaszczur, M. A Review of Hybrid Renewable Energy Systems: Solar and Wind-Powered Solutions: Challenges, Opportunities, and Policy Implications. Results Eng. 2023, 20. [CrossRef]
- Russo, M.A.; Carvalho, D.; Martins, N.; Monteiro, A. Forecasting the Inevitable: A Review on the Impacts of Climate Change on Renewable Energy Resources. Sustain. Energy Technol. Assessments 2022, 52, 102283. [CrossRef]
- Osman, A.I.; Chen, L.; Yang, M.; Msigwa, G.; Farghali, M.; Fawzy, S.; Rooney, D.W.; Yap, P.S. Cost, Environmental Impact, and Resilience of Renewable Energy under a Changing Climate: A Review. Environ. Chem. Lett. 2023, 21, 741–764. [CrossRef]
- Bhuiyan, M.R.A. Overcome the Future Environmental Challenges through Sustainable and Renewable Energy Resources. Micro Nano Lett. 2022, 17, 402–416. [CrossRef]
- Pryor, S.C.; Barthelmie, R.J. Climate Change Impacts on Wind Energy: A Review. Renew. Sustain. Energy Rev. 2010, 14, 430–437. [CrossRef]
- Oliver Schmidt, I.S. Monetizing Energy Storage: A Toolkit to Assess Future Cost and Value. 2015, 6.
- Schindler, D.; Behr, H.D.; Jung, C. On the Spatiotemporal Variability and Potential of Complementarity of Wind and Solar Resources. Energy Convers. Manag. 2020, 218, 113016. [CrossRef]
- Jerez, S.; Tobin, I.; Vautard, R.; Montávez, J.P.; López-Romero, J.M.; Thais, F.; Bartok, B.; Christensen, O.B.; Colette, A.; Déqué, M.; et al. The Impact of Climate Change on Photovoltaic Power Generation in Europe. Nat. Commun. 2015, 6. [CrossRef]
- Gökgöz, F.; Atmaca, M.E. Financial Optimization in the Turkish Electricity Market: Markowitz’s Mean-Variance Approach. Renew. Sustain. Energy Rev. 2012, 16, 357–368. [CrossRef]
- Muñoz, J.I.; Sánchez de la Nieta, A.A.; Contreras, J.; Bernal-Agustín, J.L. Optimal Investment Portfolio in Renewable Energy: The Spanish Case. Energy Policy 2009, 37, 5273–5284. [CrossRef]
- Russo, M.A.; Carvalho, D.; Martins, N.; Monteiro, A. Future Perspectives for Wind and Solar Electricity Production under High-Resolution Climate Change Scenarios. J. Clean. Prod. 2023, 404, 136997. [CrossRef]
- Rawat, A.; Kumar, D.; Khati, B.S. A Review on Climate Change Impacts, Models, and Its Consequences on Different Sectors: A Systematic Approach. J. Water Clim. Chang. 2024, 15, 104–126. [CrossRef]
- Alshahrani, A.; Omer, S.; Su, Y.; Mohamed, E.; Alotaibi, S. The Technical Challenges Facing the Integration of Small-Scale and Large-Scale PV Systems into the Grid: A Critical Review. Electron. 2019, 8. [CrossRef]
- deLlano-Paz, F.; Cartelle-Barros, J.J.; Martínez-Fernández, P. Application of Modern Portfolio Theory to the European Electricity Mix: An Assessment of Environmentally Optimal Scenarios. Environ. Dev. Sustain. 2024, 26, 15001–15029. [CrossRef]
- Juma, D.; Munda, J.; Kabiri, C. Power-System Flexibility: A Necessary Complement to Variable Renewable Energy Optimal Capacity Configuration. Energies 2023, 16, 1–24. [CrossRef]
- Elaziz, M.A.; Nikoo, M.R.; Gandomi, A.H. Wind, Solar, and Photovoltaic Renewable Energy Systems with Advanced Machine Learning and Deep Learning Techniques. Energies 2022, 15, 1–26.
- Agajie, T.F.; Fopah-Lele, A.; Amoussou, I.; Ali, A.; Khan, B.; Mahela, O.P.; Nuvvula, R.S.S.; Ngwashi, D.K.; Soriano Flores, E.; Tanyi, E. Techno-Economic Analysis and Optimization of Hybrid Renewable Energy System with Energy Storage under Two Operational Modes. Sustain. 2023, 15. [CrossRef]
- Ross, K.; Matuszewska, D.; Olczak, P. Analysis of Using Hybrid 1 MWp PV-Farm with Energy Storage in Poland. Energies 2023, 16. [CrossRef]
- Bošnjaković, M.; Santa, R.; Crnac, Z.; Bošnjaković, T. Environmental Impact of PV Power Systems. Sustain. 2023, 15, 1–26. [CrossRef]
- Alexis, T.; Marc, S.; Philippe, D.; Jordi, B.; Silvia, C.; Anna, C.; Claudia, D.; Dimitri, T.; Peter, T. Impact of Climate Variability on Optimal Wind-Solar Energy Mixes - The Italian Case. 2018.
- Labriet, M.; Espegren, K.; Giannakidis, G.; Ó Gallachóir, B. Aligning the Energy Transition with the Sustainable Development Goals: Key Insights from Energy System Modelling; 2024; Vol. 101; ISBN 978-3-031-58896-9.
- Tu, Y.X.; Kubatko, O.; Piven, V.; Sotnyk, I.; Kurbatova, T. Determinants of Renewable Energy Development: Evidence from the EU Countries. Energies 2022, 15, 1–14. [CrossRef]
- Nižetić, S.; Ocłoń, P.; Tsoutsos, T. Progress in Smart and Sustainable Technologies. J. Clean. Prod. 2022, 337, 130450. [CrossRef]
- Kim, S.; Hur, J. A Probabilistic Modeling Based on Monte Carlo Simulation of Wind Powered Ev Charging Stations for Steady-States Security Analysis. Energies 2020, 13. [CrossRef]
- Bhattarai, H. Renewable Energy and Energy Storage Systems. Energy Convers. Methods, Technol. Futur. Dir. 2022, 269–289. [CrossRef]
- Strielkowski, W.; Tarkhanova, E.; Tvaronaviˇ, M.; Petrenko, Y. Renewable Energy in the Sustainable Development of Electrical. Energies 2021, 14, 1–24.
- Zhang, S.; Zhao, T.; Xie, B.C. What Is the Optimal Power Generation Mix of China? An Empirical Analysis Using Portfolio Theory. Appl. Energy 2018, 229, 522–536. [CrossRef]
- Marling, H.; Emanuelsson, S. The Markowitz Portfolio Theory; 2012;
- Castro, G.M.; Klöckl, C.; Regner, P.; Schmidt, J.; Pereira, A.O. Improvements to Modern Portfolio Theory Based Models Applied to Electricity Systems. Energy Econ. 2022, 111, 1–25. [CrossRef]
- Awerbuch, S.; Yang, S. Efficient Electricity Generating Portfolios for Europe: Maximizing Energy Security and Climate Change Mitigation. Anal. Methods Energy Divers. Secur. 2008, 85–115. [CrossRef]
- Twaróg, B. Optimization of the Conditions of Cooperation of Hybrid Solutions of Wind Farms and Solar Farms for the Area of Poland. Tech. Trans. 2024, 121. [CrossRef]
- López, M.; Rodríguez, N.; Iglesias, G. Combined Floating Offshore Wind and Solar PV. J. Mar. Sci. Eng. 2020, 8. [CrossRef]
- Nyenah, E.; Sterl, S.; Thiery, W. Pieces of a Puzzle: Solar-Wind Power Synergies on Seasonal and Diurnal Timescales Tend to Be Excellent Worldwide. Environ. Res. Commun. 2022, 4. [CrossRef]
- Ferreira, P.; Cunha, J. On the Use of MPT to Derive Optimal RES Electricity Generation Mixes. Proc. 25th Int. Conf. Effic. Cost, Optim. Simul. Energy Convers. Syst. Process. ECOS 2012 2012, 8, 164–178.
- Hu, J.; Harmsen, R.; Crijns-Graus, W.; Worrell, E. Geographical Optimization of Variable Renewable Energy Capacity in China Using Modern Portfolio Theory. Appl. Energy 2019, 253, 113614. [CrossRef]
- Nolan, S.; Burke, D.; Qazi, H.W.; Flynn, D.; O’Malley, M.; Kiviluoma, J.; Kirby, B.; Hummon, M.; Milligan, M. Synergies between Wind and Solar Generation and Demand Response An IEA Task 25 Collaboration. 14th Wind Integr. Work. 2014. [CrossRef]
- Faia, R.; Pinto, T.; Vale, Z.; Corchado, J.M. Portfolio Optimization of Electricity Markets Participation Using Forecasting Error in Risk Formulation. Int. J. Electr. Power Energy Syst. 2021, 129, 106739. [CrossRef]
- Zhou, J.; Abdel-Khalik, H.; Talbot, P.; Rabiti, C. A Hybrid Energy Systemworkflow for Energy Portfolio Optimization. Energies 2021, 14, 1–28. [CrossRef]
- Patel, M.R. Wind and Solar Power Systems; 1999; ISBN N 0-8493-1605-7.
- Menne, M.J.; Durre, I.; Vose, R.S.; Gleason, B.E.; Houston, T.G. An Overview of the Global Historical Climatology Network-Daily Database. J. Atmos. Ocean. Technol. 2012, 29, 897–910. [CrossRef]
- Smith, T.M.; Reynolds, R.W.; Peterson, T.C.; Lawrimore, J. Improvements to NOAA’s Historical Merged Land-Ocean Surface Temperature Analysis (1880-2006). J. Clim. 2008, 21, 2283–2296. [CrossRef]
- Cornes, R.C.; van der Schrier, G.; van den Besselaar, E.J.M.; Jones, P.D. An Ensemble Version of the E-OBS Temperature and Precipitation Data Sets. J. Geophys. Res. Atmos. 2018, 123, 9391–9409. [CrossRef]
- Twaróg, B.S. Assessing the Polarization of Climate Phenomena Based on Long-Term Precipitation and Temperature Sequences. 2024.
- Garcia, R.C.; González, V.; Contreras, J.; Custodio, J.E.S.C.S.C. Applying Modern Portfolio Theory for a Dynamic Energy Portfolio Allocation in Electricity Markets. Electr. Power Syst. Res. 2017, 150, 11–23. [CrossRef]
- Chomac-Pierzecka, E..; Sobczak, A.. U. RES Market Development and Public Awareness of the Economic and Environmental Dimension of the Energy Transformation in Poland and Lithuania. 2022, 1–18.
- Scala, A.; Facchini, A.; Perna, U.; Basosi, R. Portfolio Analysis and Geographical Allocation of Renewable Sources: A Stochastic Approach. Energy Policy 2019, 125, 154–159. [CrossRef]
- Niemiro, W.; Warszawski, U.; Krzyżanowski, P.; Dąbrowski, R. Symulacje Stochastyczne i Metody Monte Carlo. 2013.
- Shafi, I.; Khan, H.; Farooq, M.S.; Diez, I. de la T.; Miró, Y.; Galán, J.C.; Ashraf, I. An Artificial Neural Network-Based Approach for Real-Time Hybrid Wind–Solar Resource Assessment and Power Estimation. Energies 2023, 16, 1–18. [CrossRef]
- Twaróg, B. Application of Shannon Entropy in Assessing Changes in Precipitation Conditions and Temperature Based on Long-Term Sequences Using the Bootstrap Method. Atmosphere (Basel). 2024, 15. [CrossRef]
- De Michele, C.; Avanzi, F. Superstatistical Distribution of Daily Precipitation Extremes: A Worldwide Assessment. Sci. Rep. 2018, 8, 1–11. [CrossRef]
- Mann, H.B. Nonparametric Tests Against Trend. Econometrica 1945, 13, 245–259. [CrossRef]
- Sen, P.K. Estimates of the Regression Coefficient Based on Kendall’s Tau. J. Am. Stat. Assoc. 1968, 63, 1379–1389. [CrossRef]
Figure 1.
Shift in the location of the optimal point after implementing technological solutions compared to solar and wind energy potential, geographical coordinates (54°17′, 0°24′), historical data, Scarborough, England.
Figure 1.
Shift in the location of the optimal point after implementing technological solutions compared to solar and wind energy potential, geographical coordinates (54°17′, 0°24′), historical data, Scarborough, England.
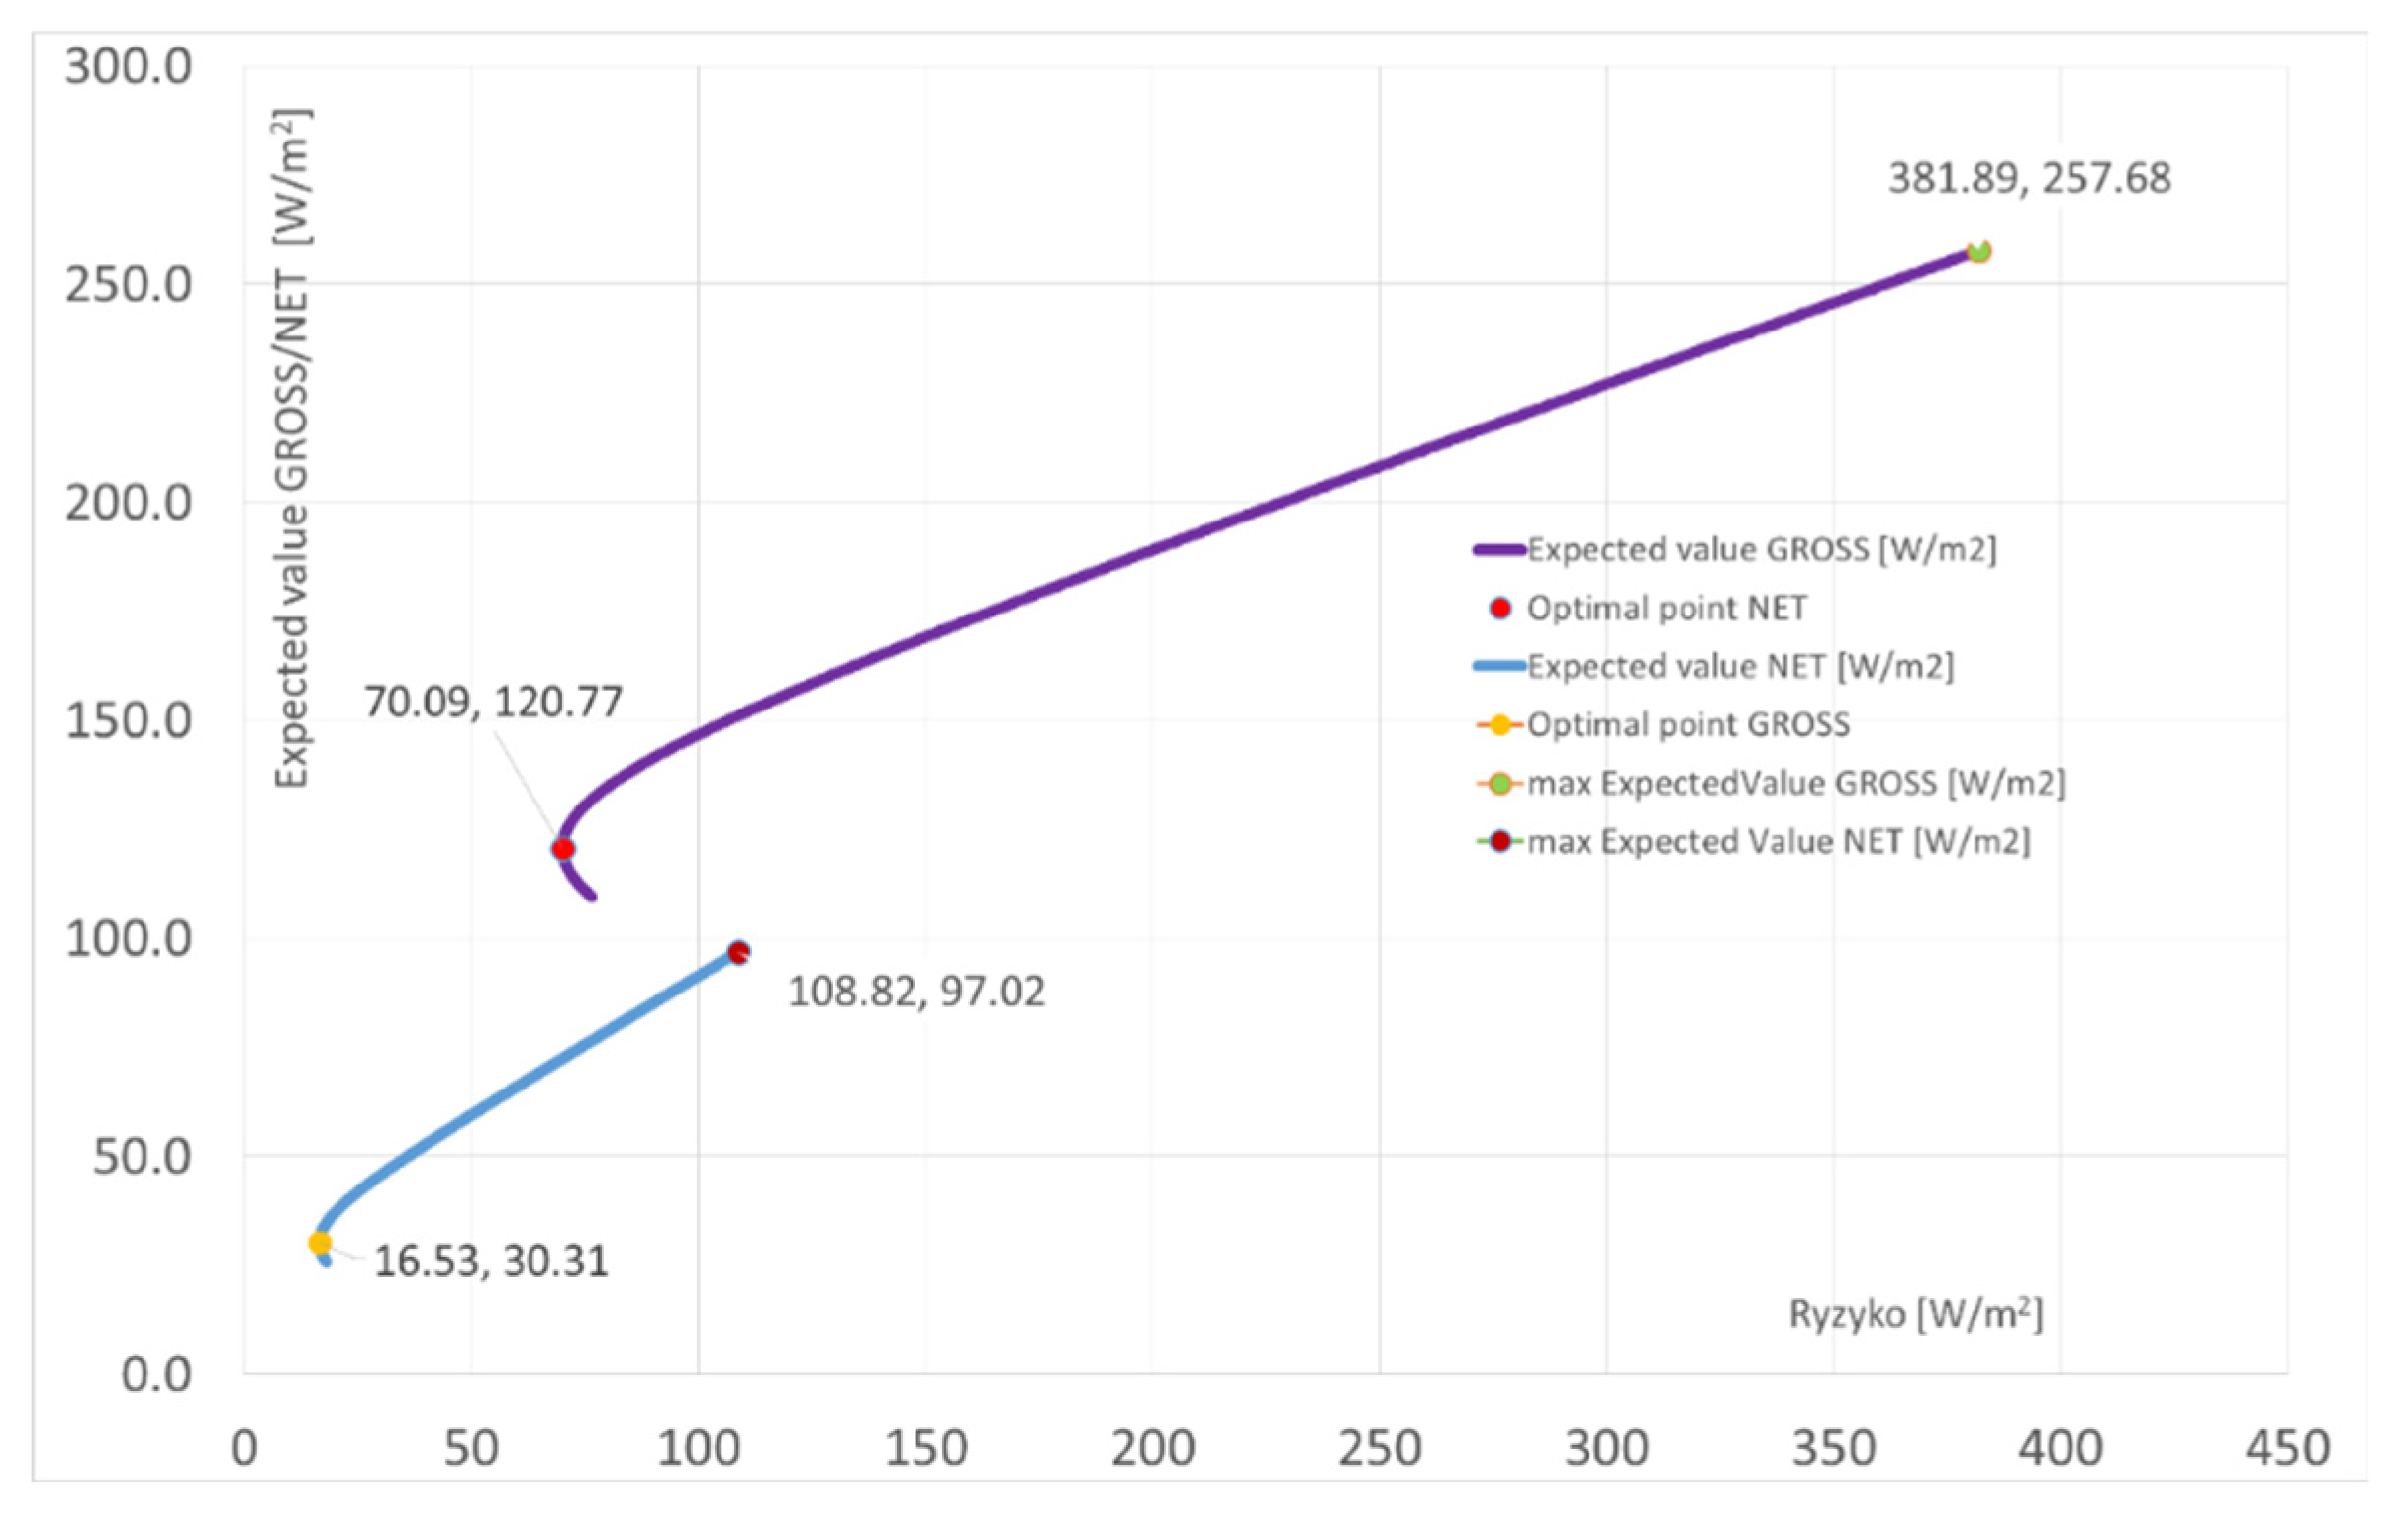
Figure 2.
Optimal expected values of gross power density (at minimal risk) from the energy mix [W/m2].
Figure 2.
Optimal expected values of gross power density (at minimal risk) from the energy mix [W/m2].
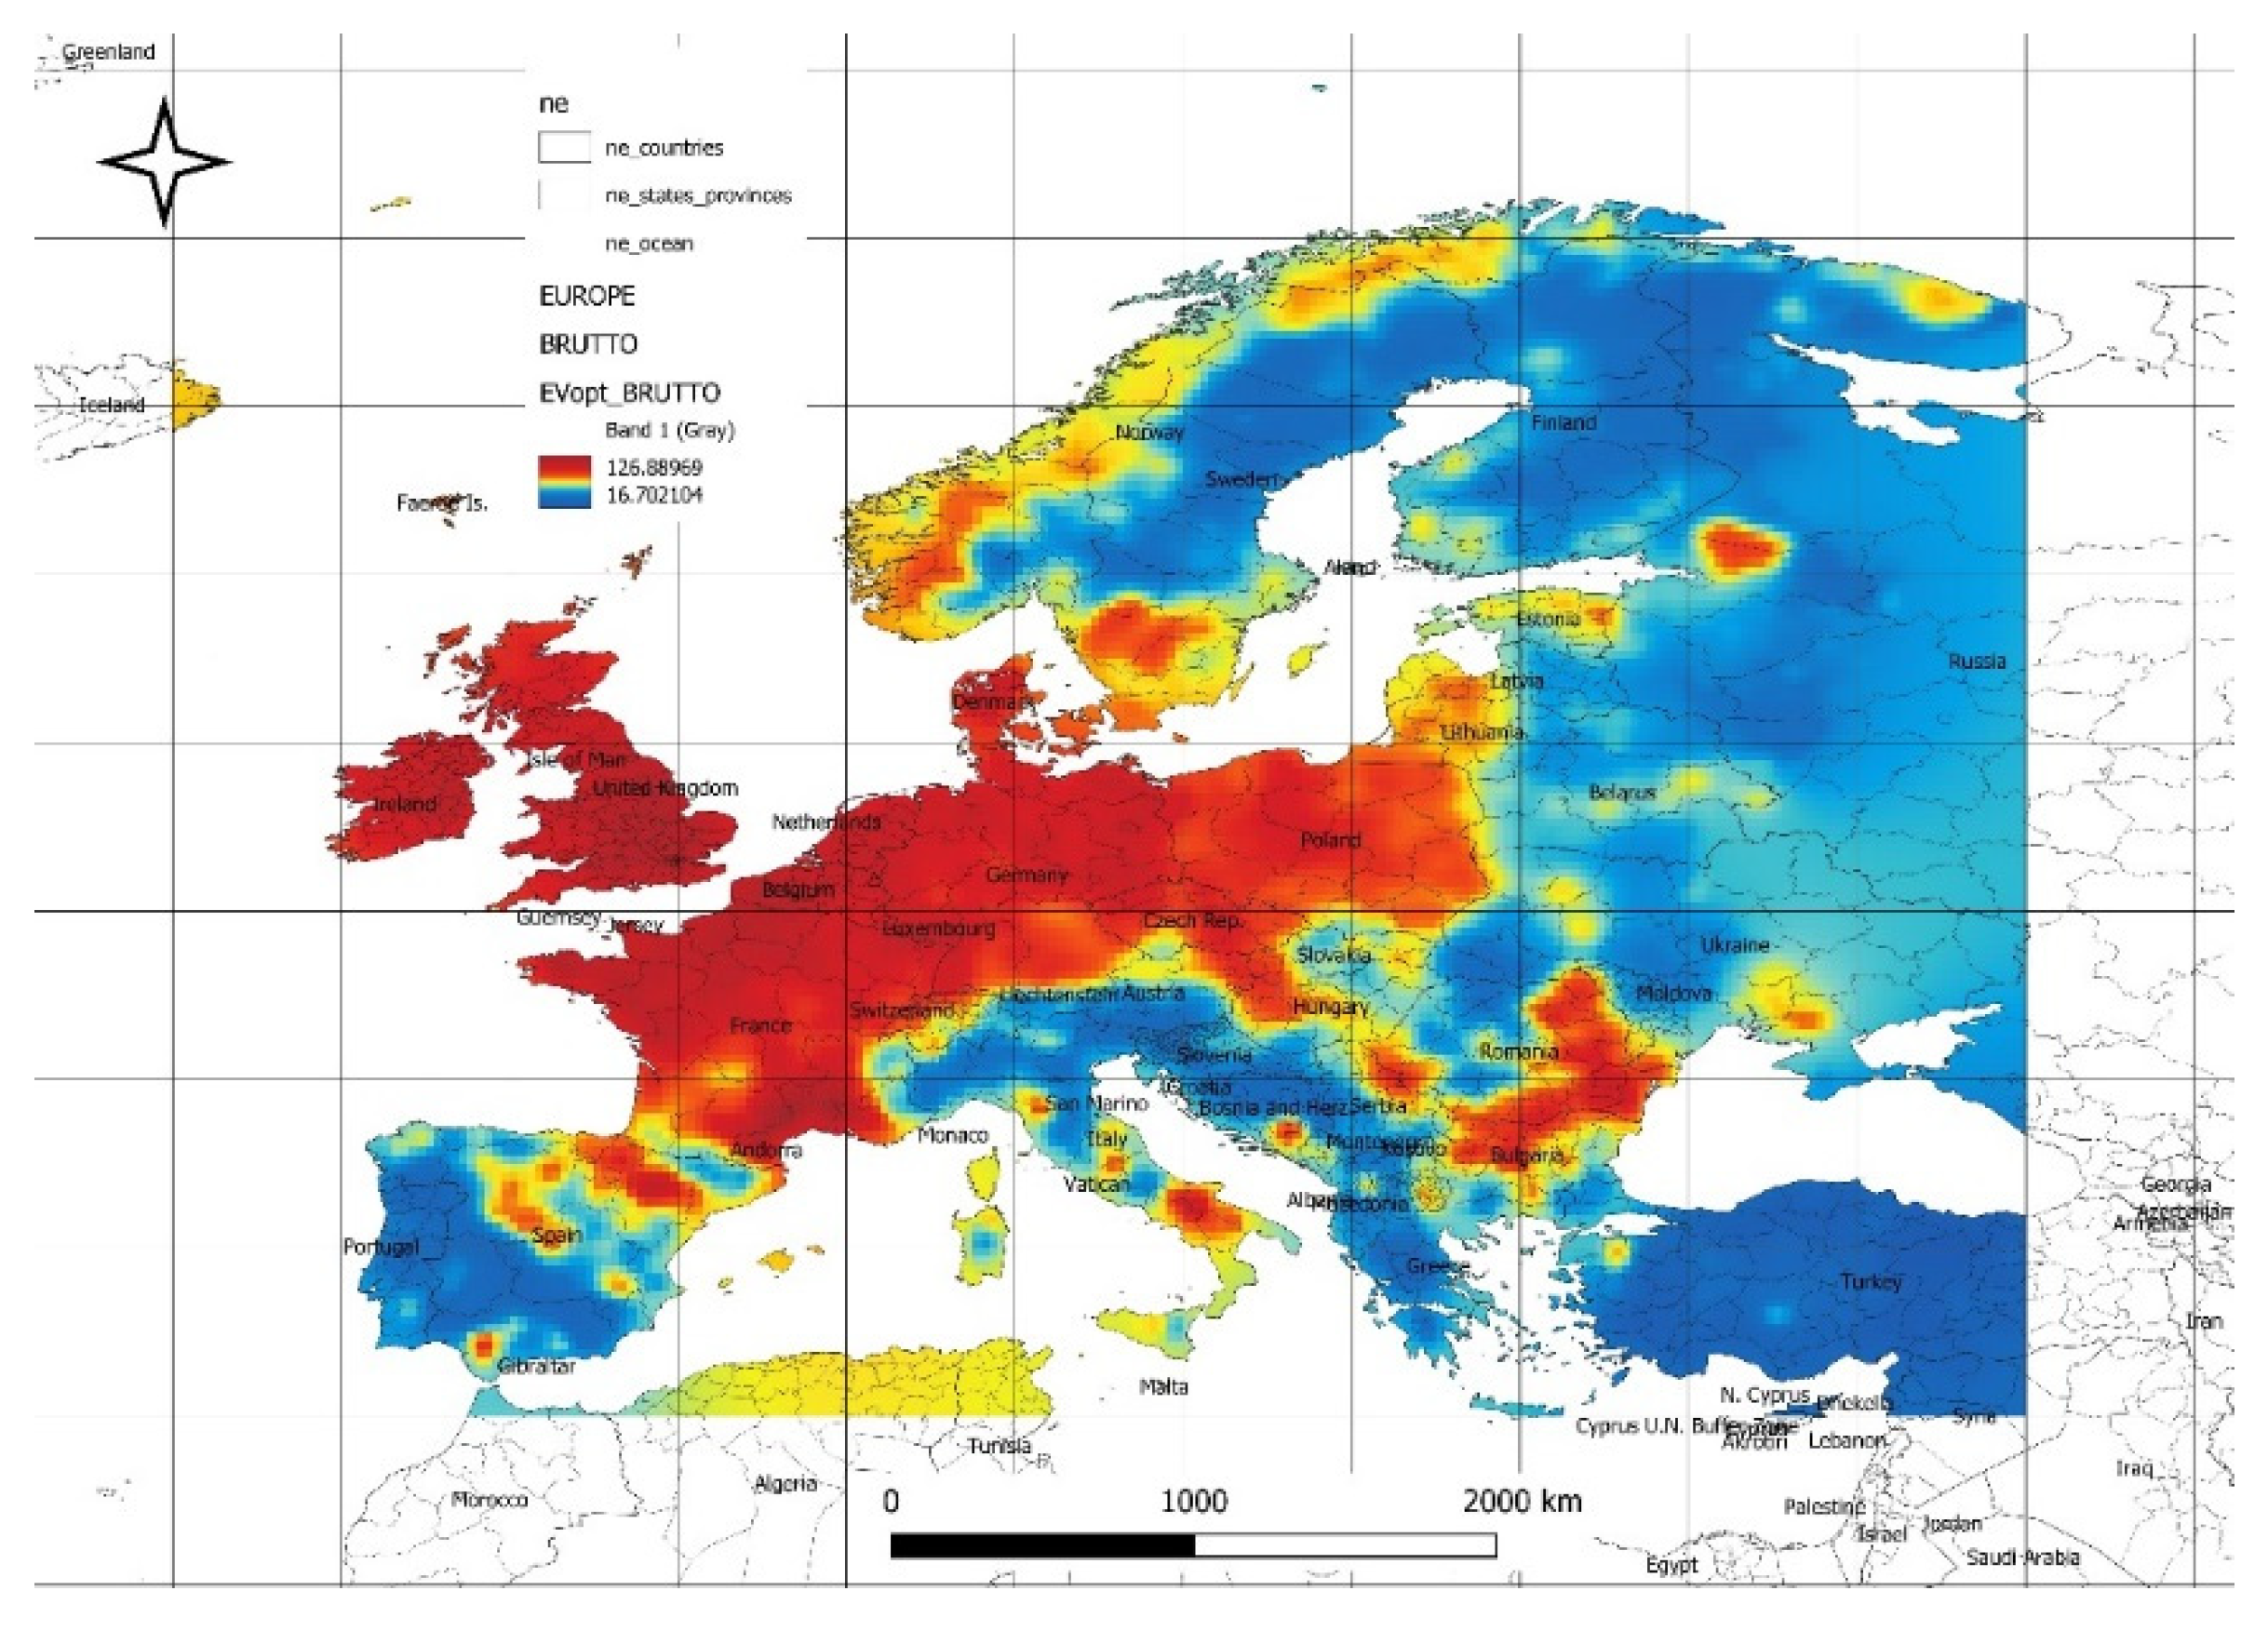
Figure 3.
Optimal expected values of net power density (at minimal risk) from the energy mix [W/m2].
Figure 3.
Optimal expected values of net power density (at minimal risk) from the energy mix [W/m2].
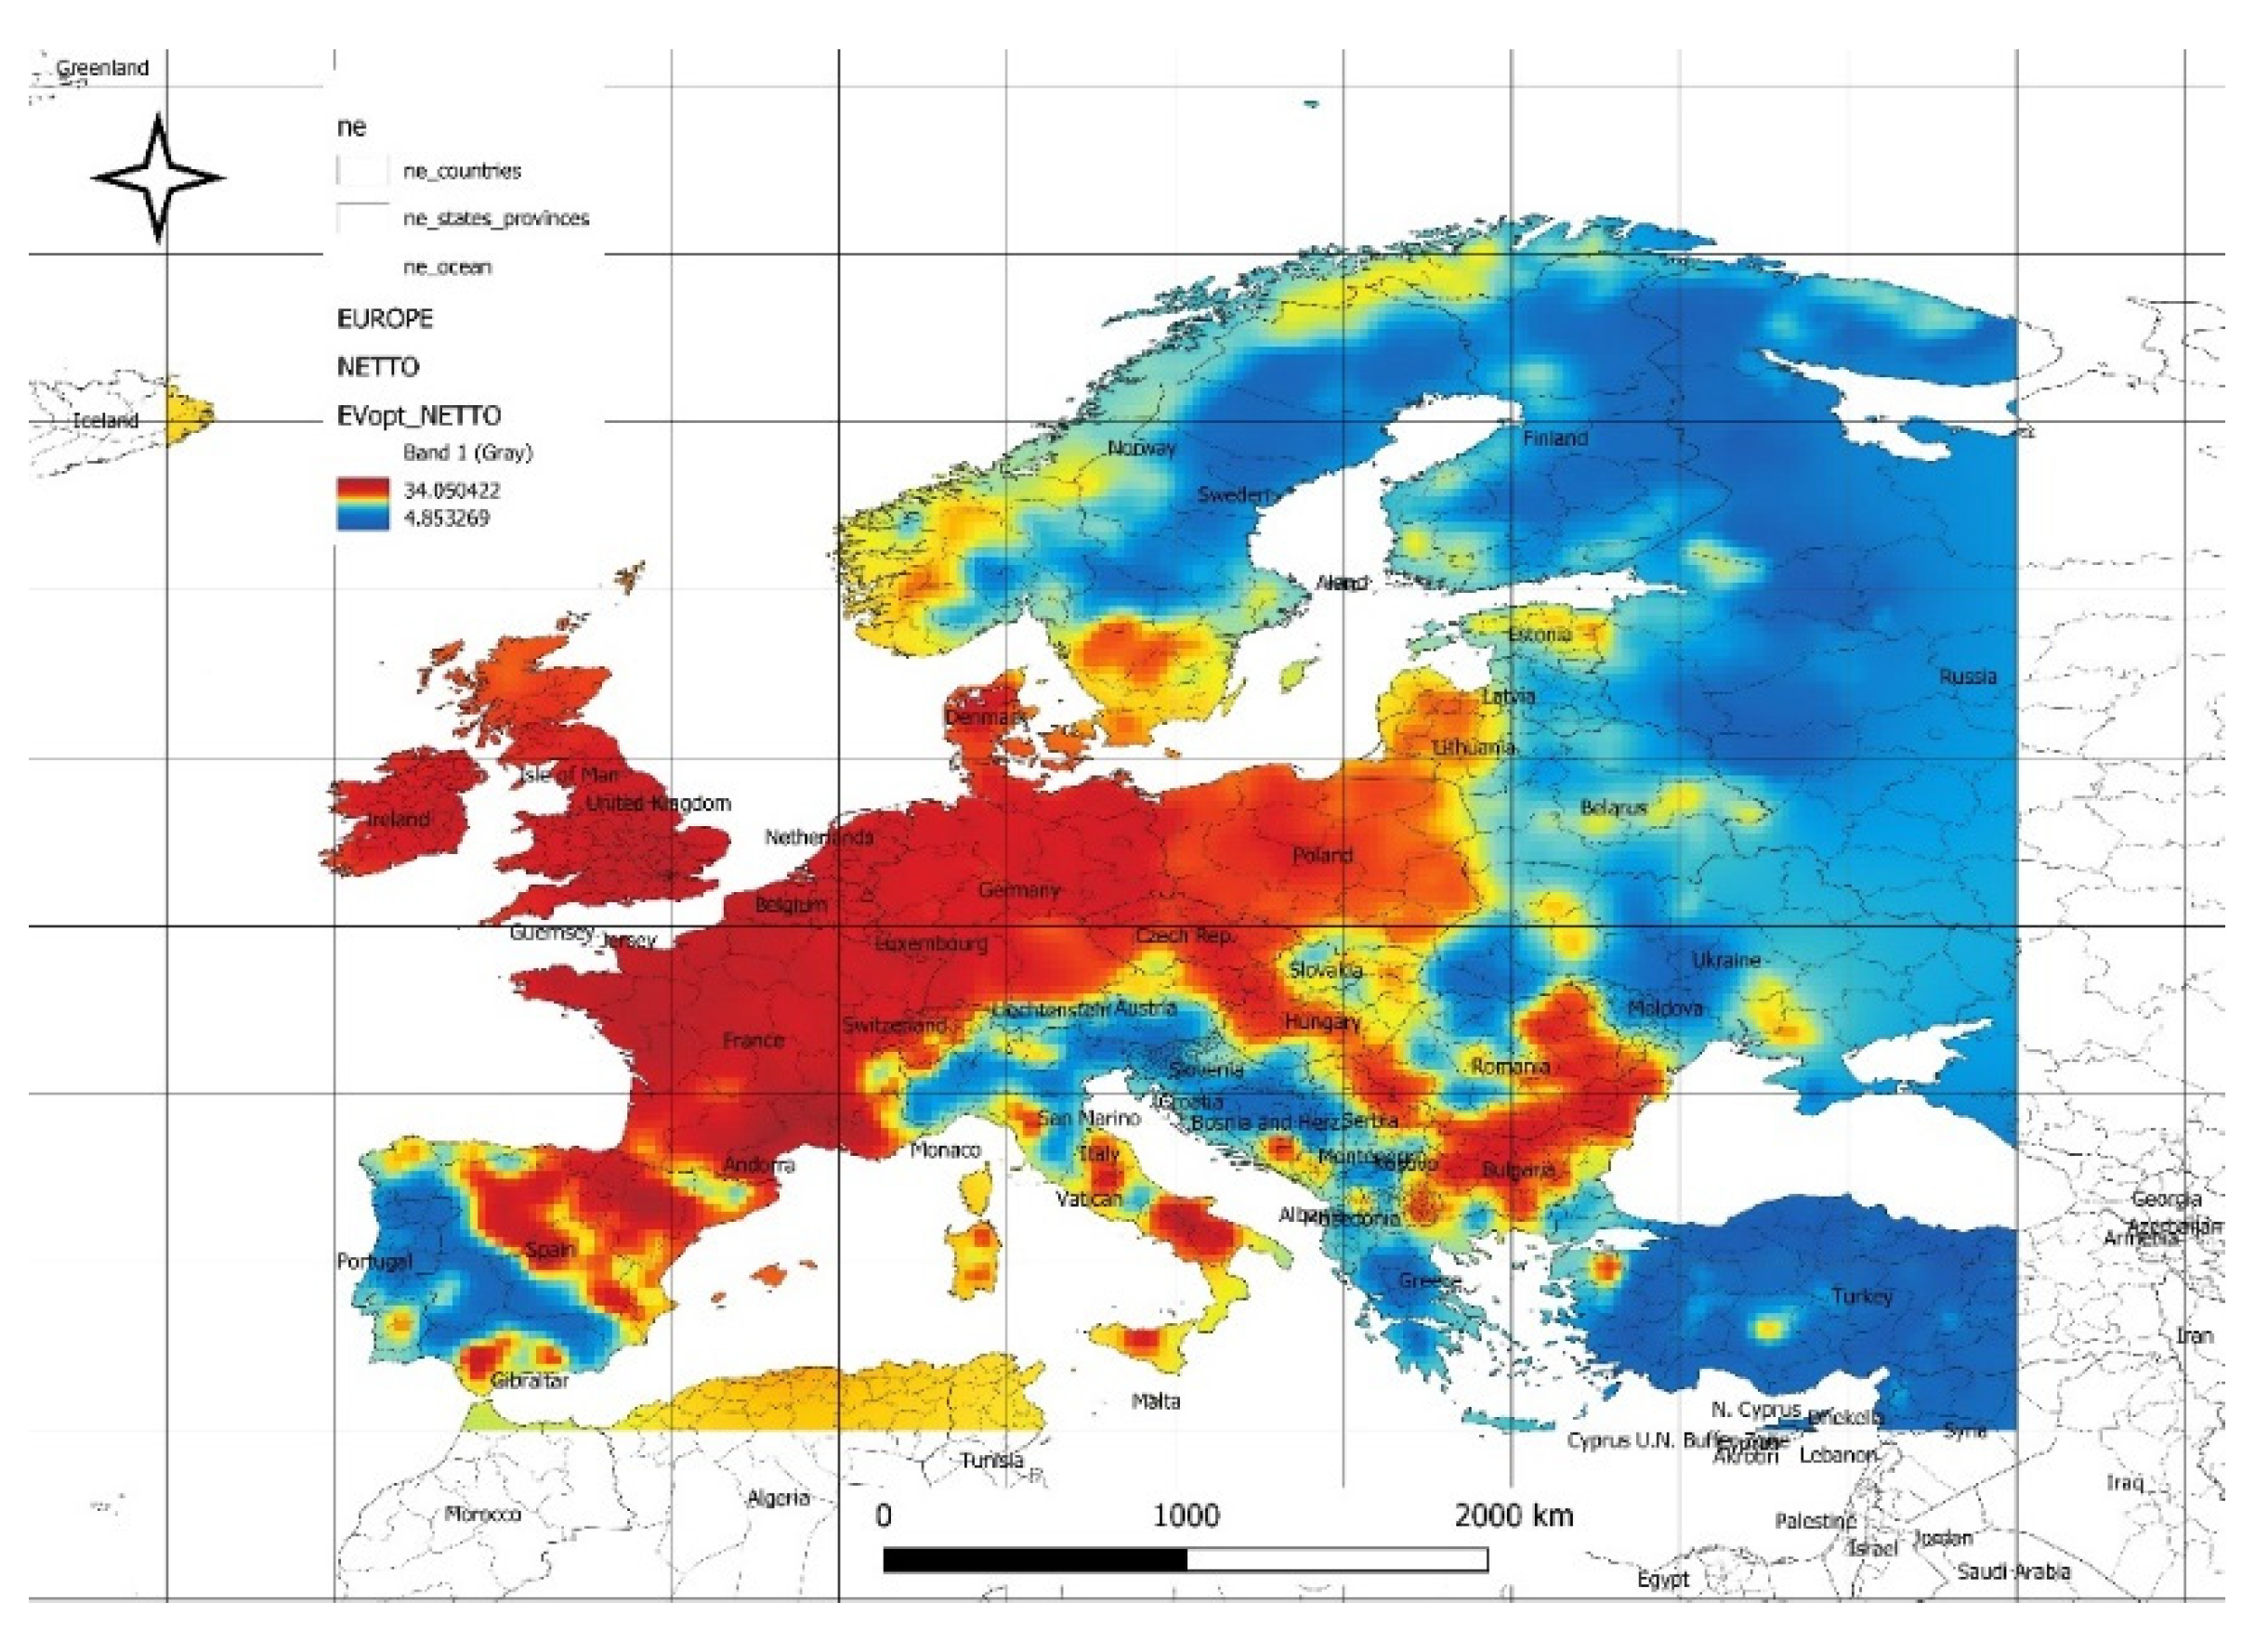
Figure 4.
Maximum expected values of gross power density from the energy mix [W/m2].
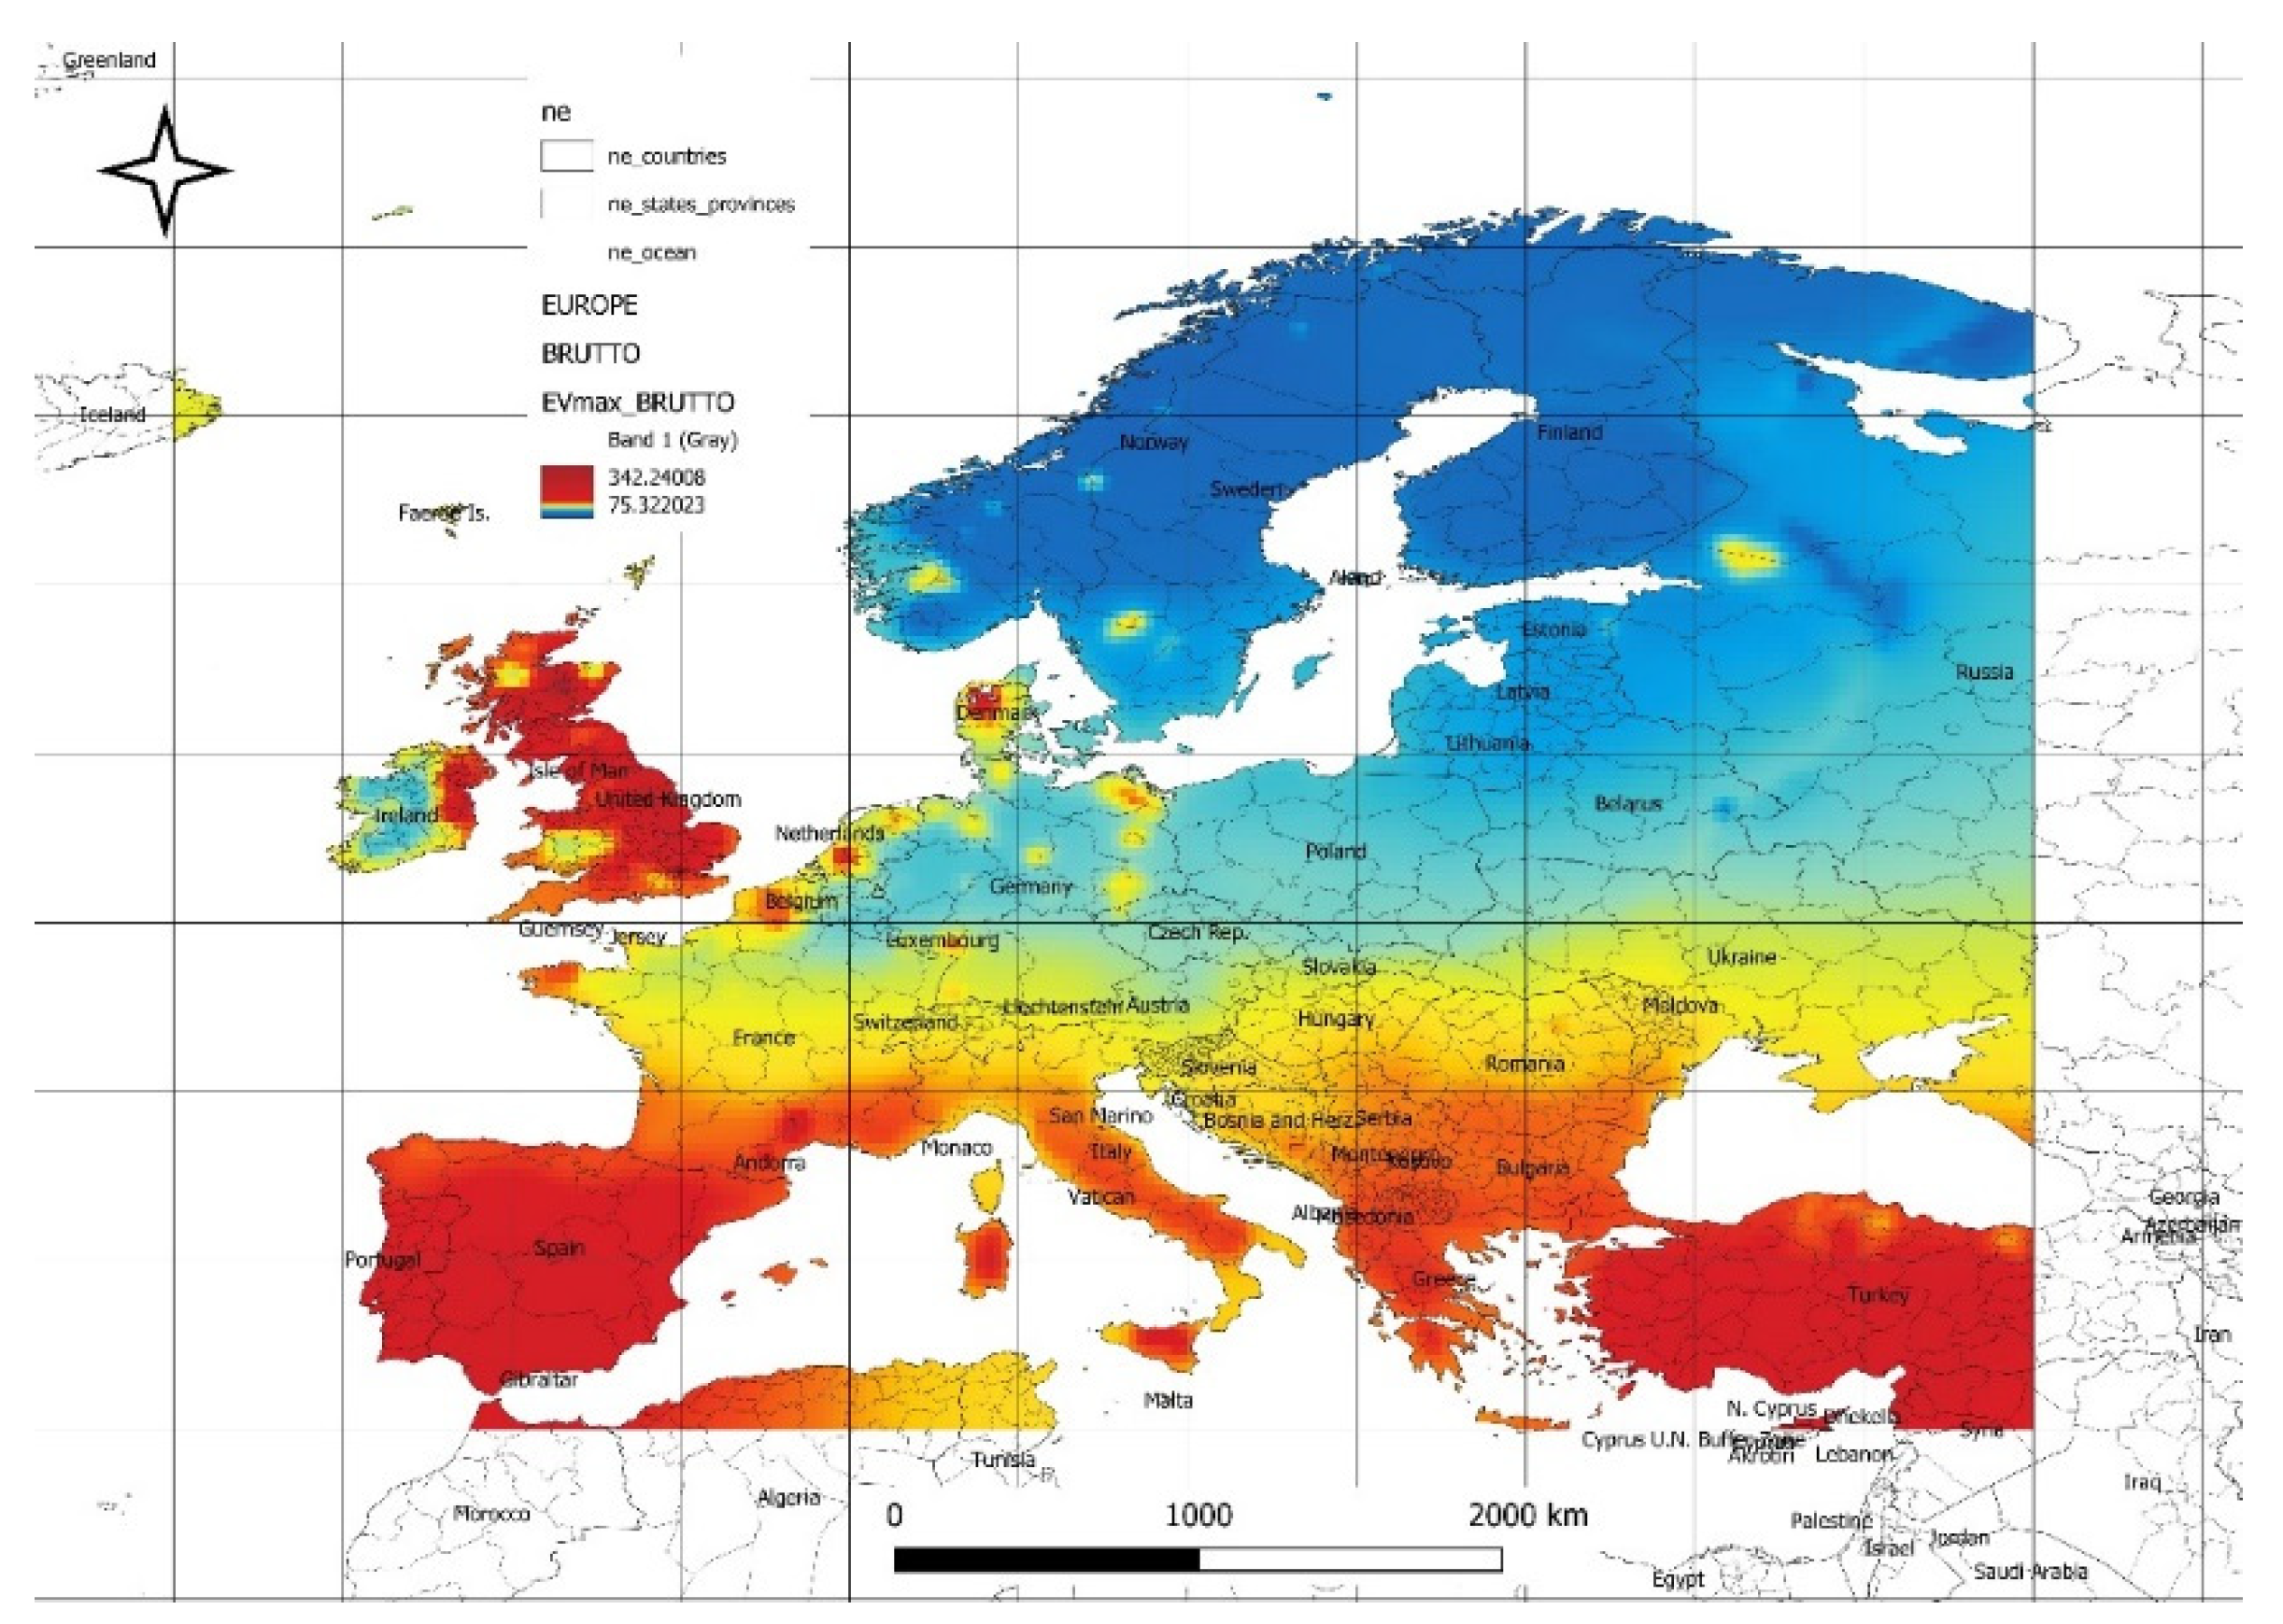
Figure 5.
Maximum expected values of net power density from the energy mix [W/m2].
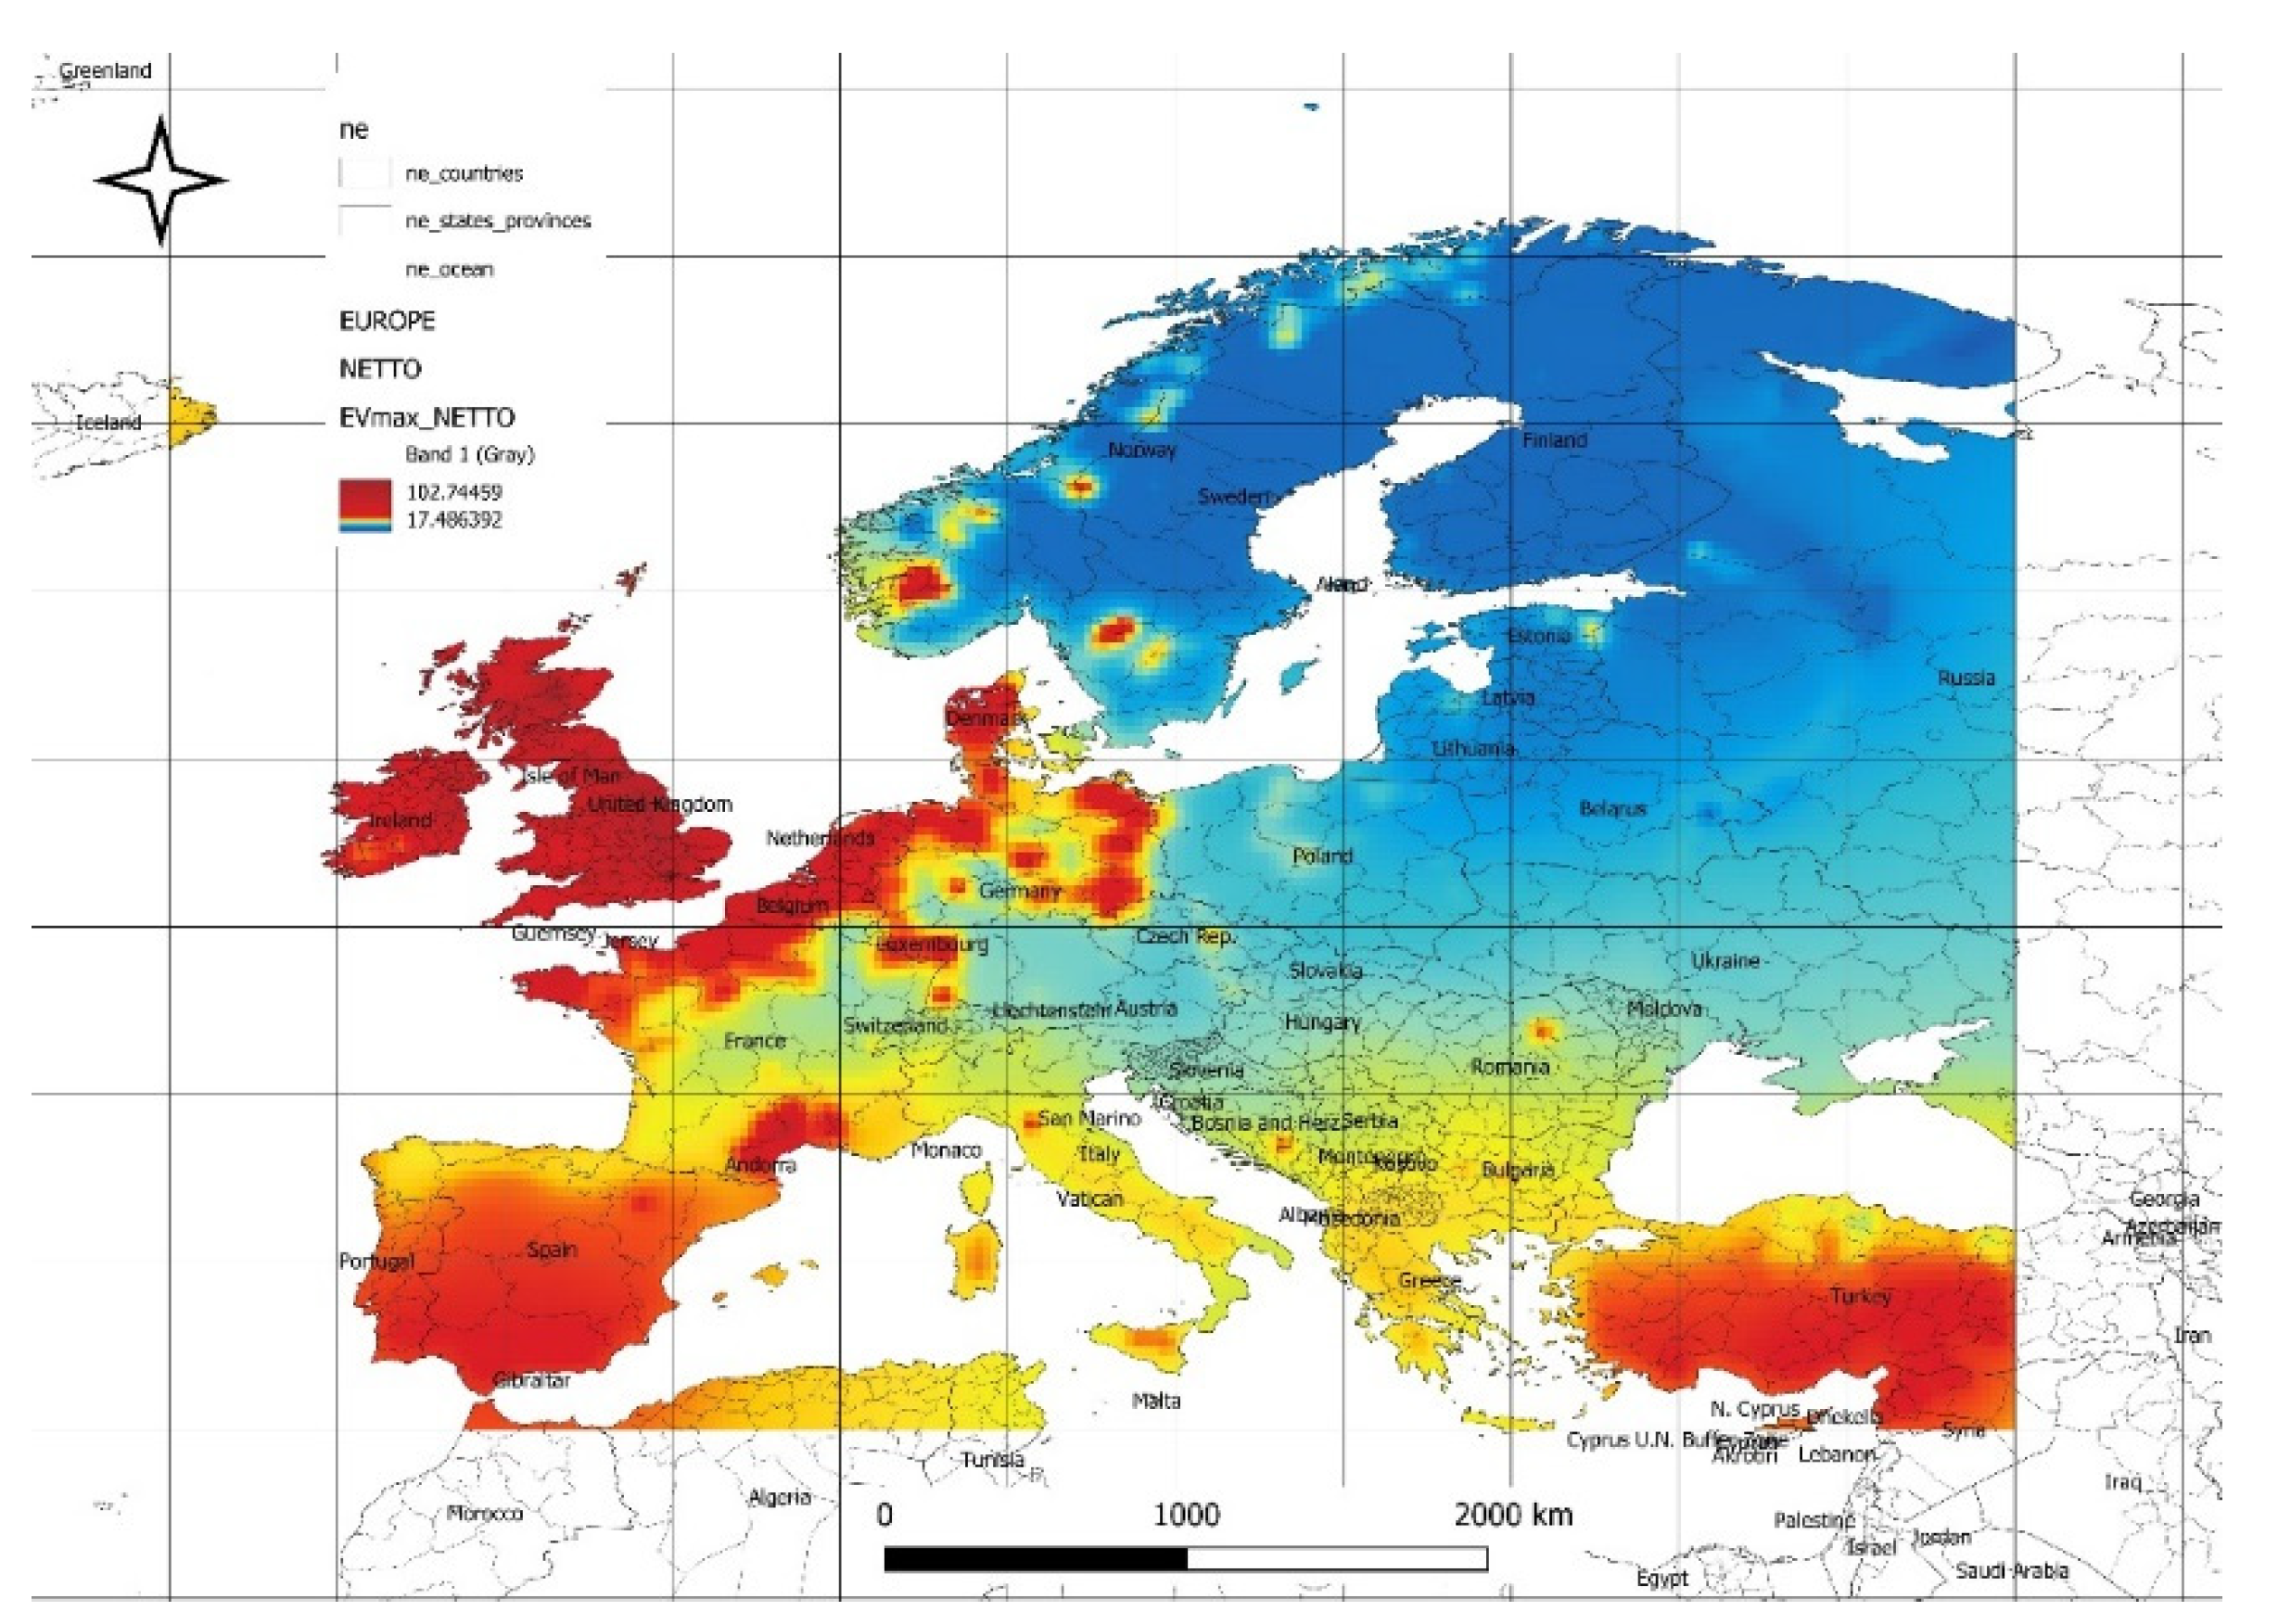
Figure 6.
The value of optimal share coefficients for the gross wind energy component in the energy mix.
Figure 6.
The value of optimal share coefficients for the gross wind energy component in the energy mix.
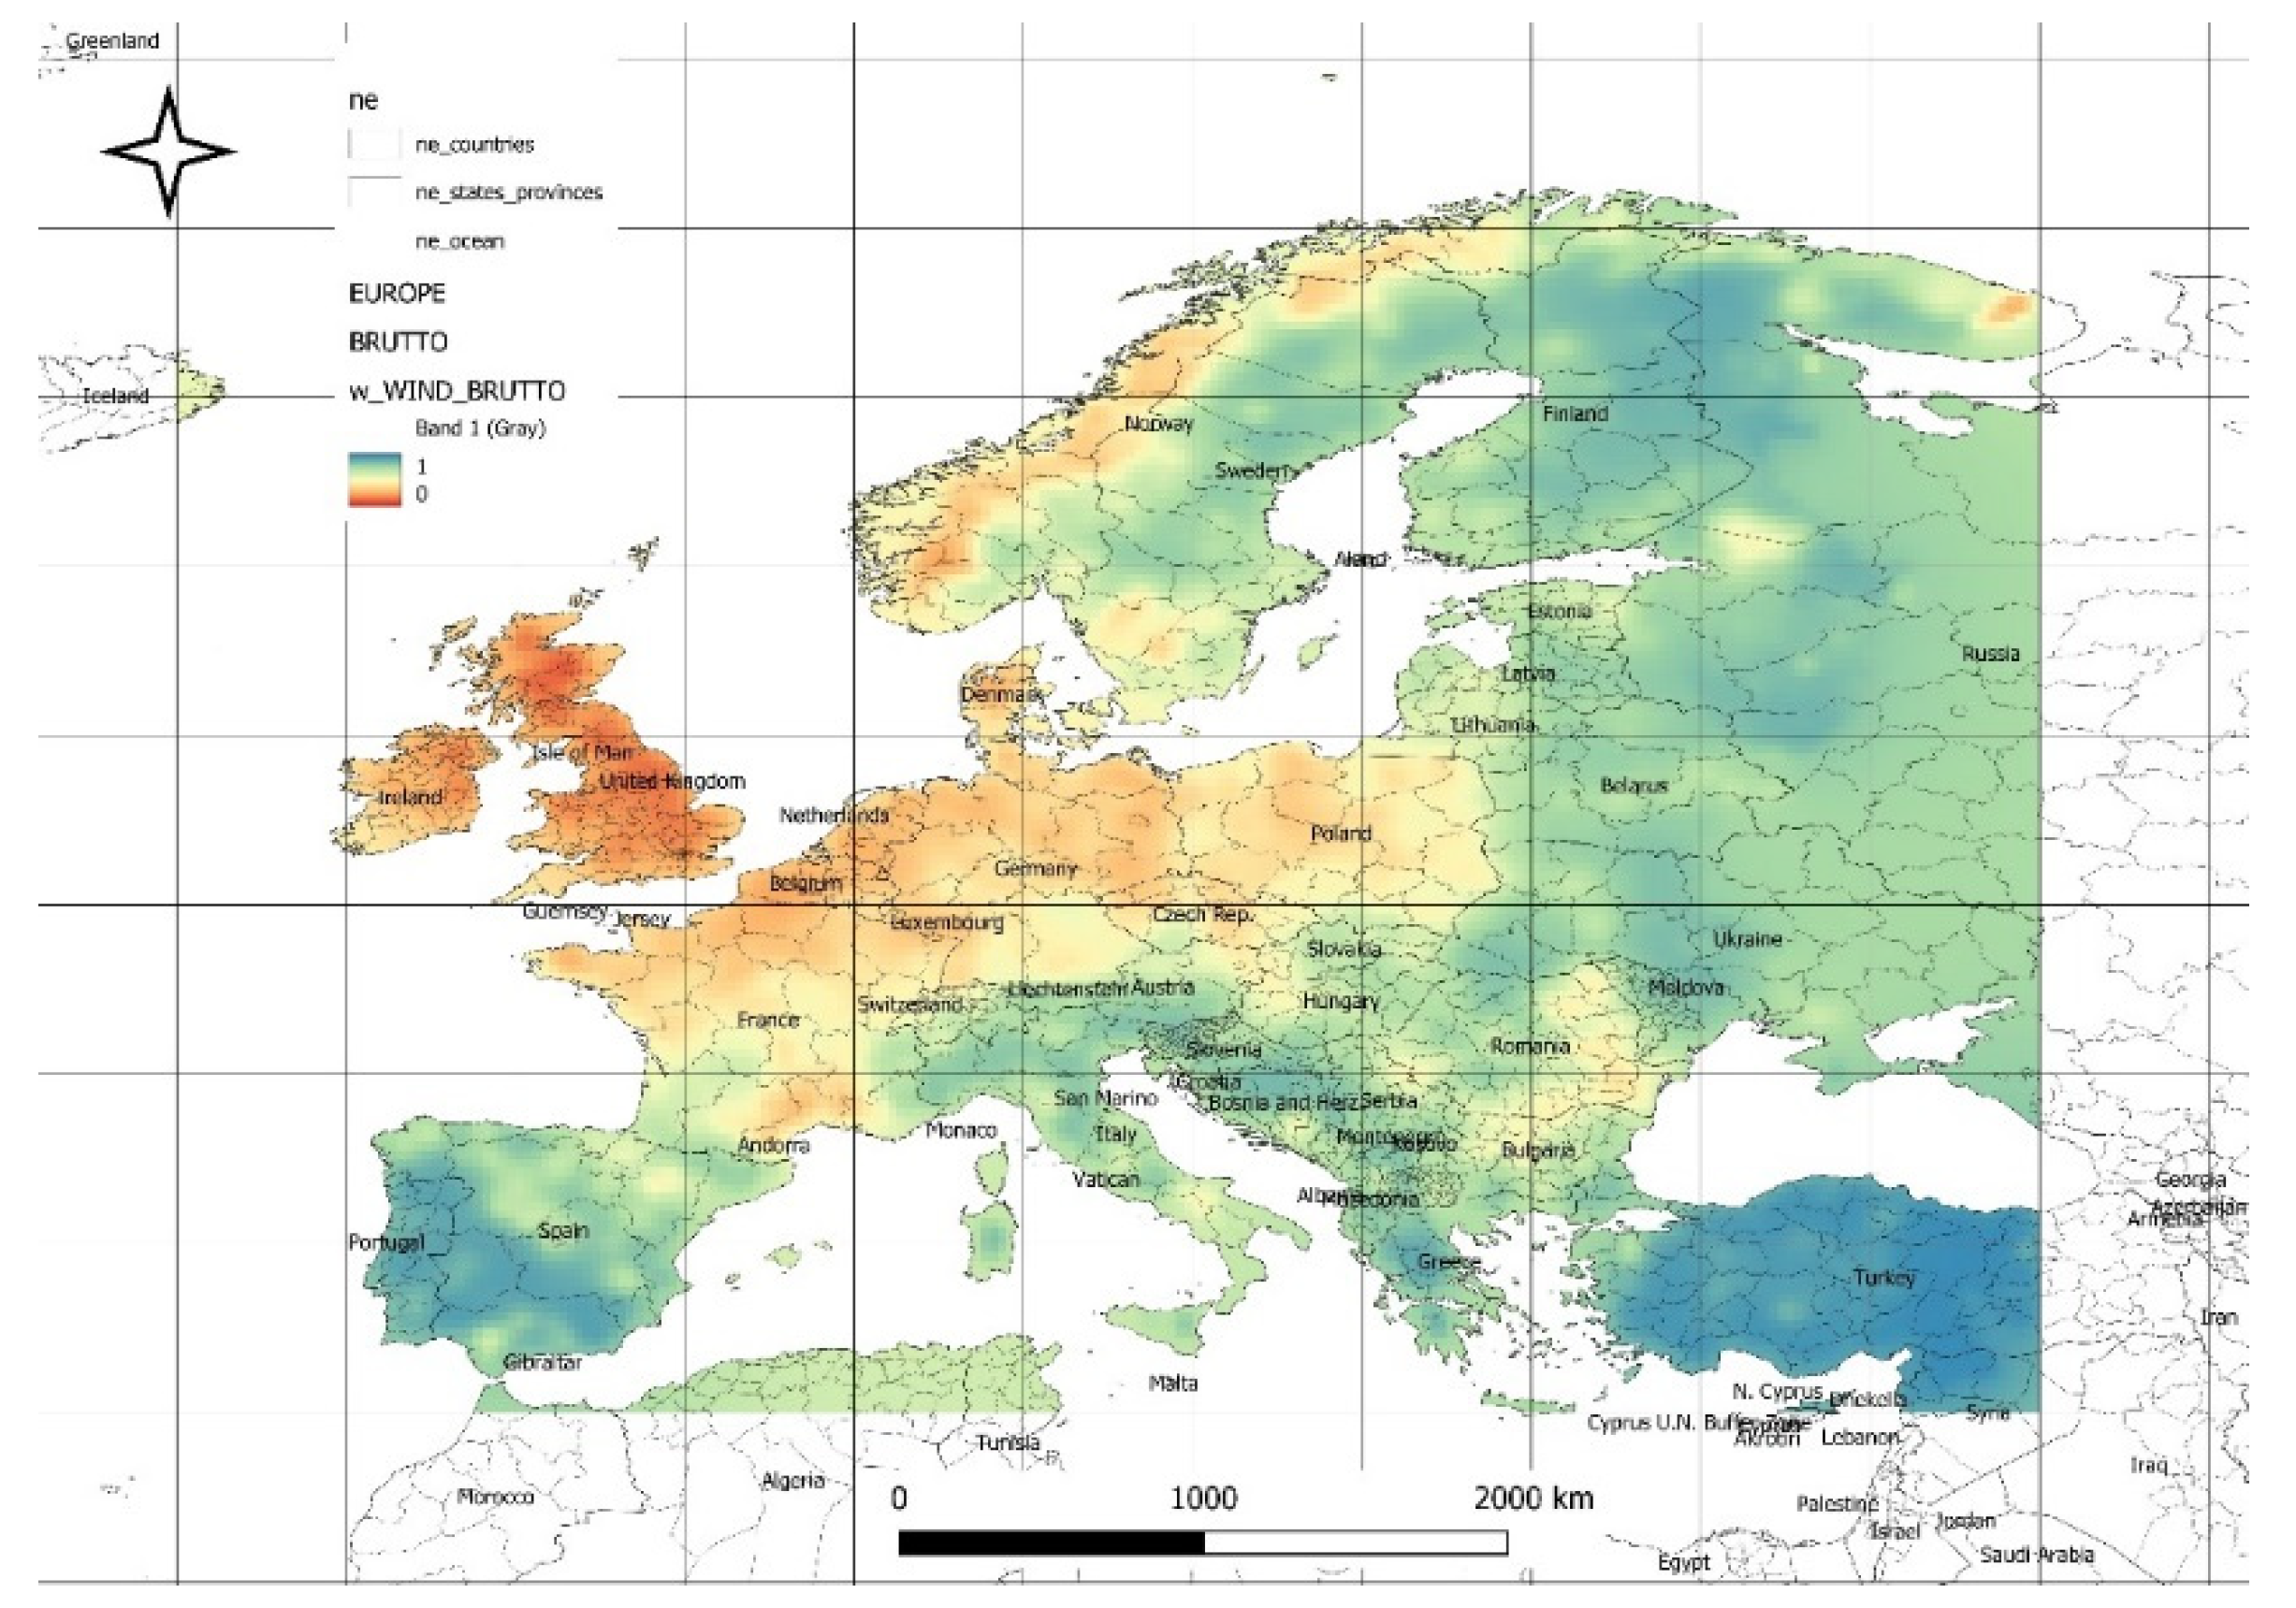
Figure 7.
The value of optimal share coefficients for the net wind energy component in the energy mix.
Figure 7.
The value of optimal share coefficients for the net wind energy component in the energy mix.
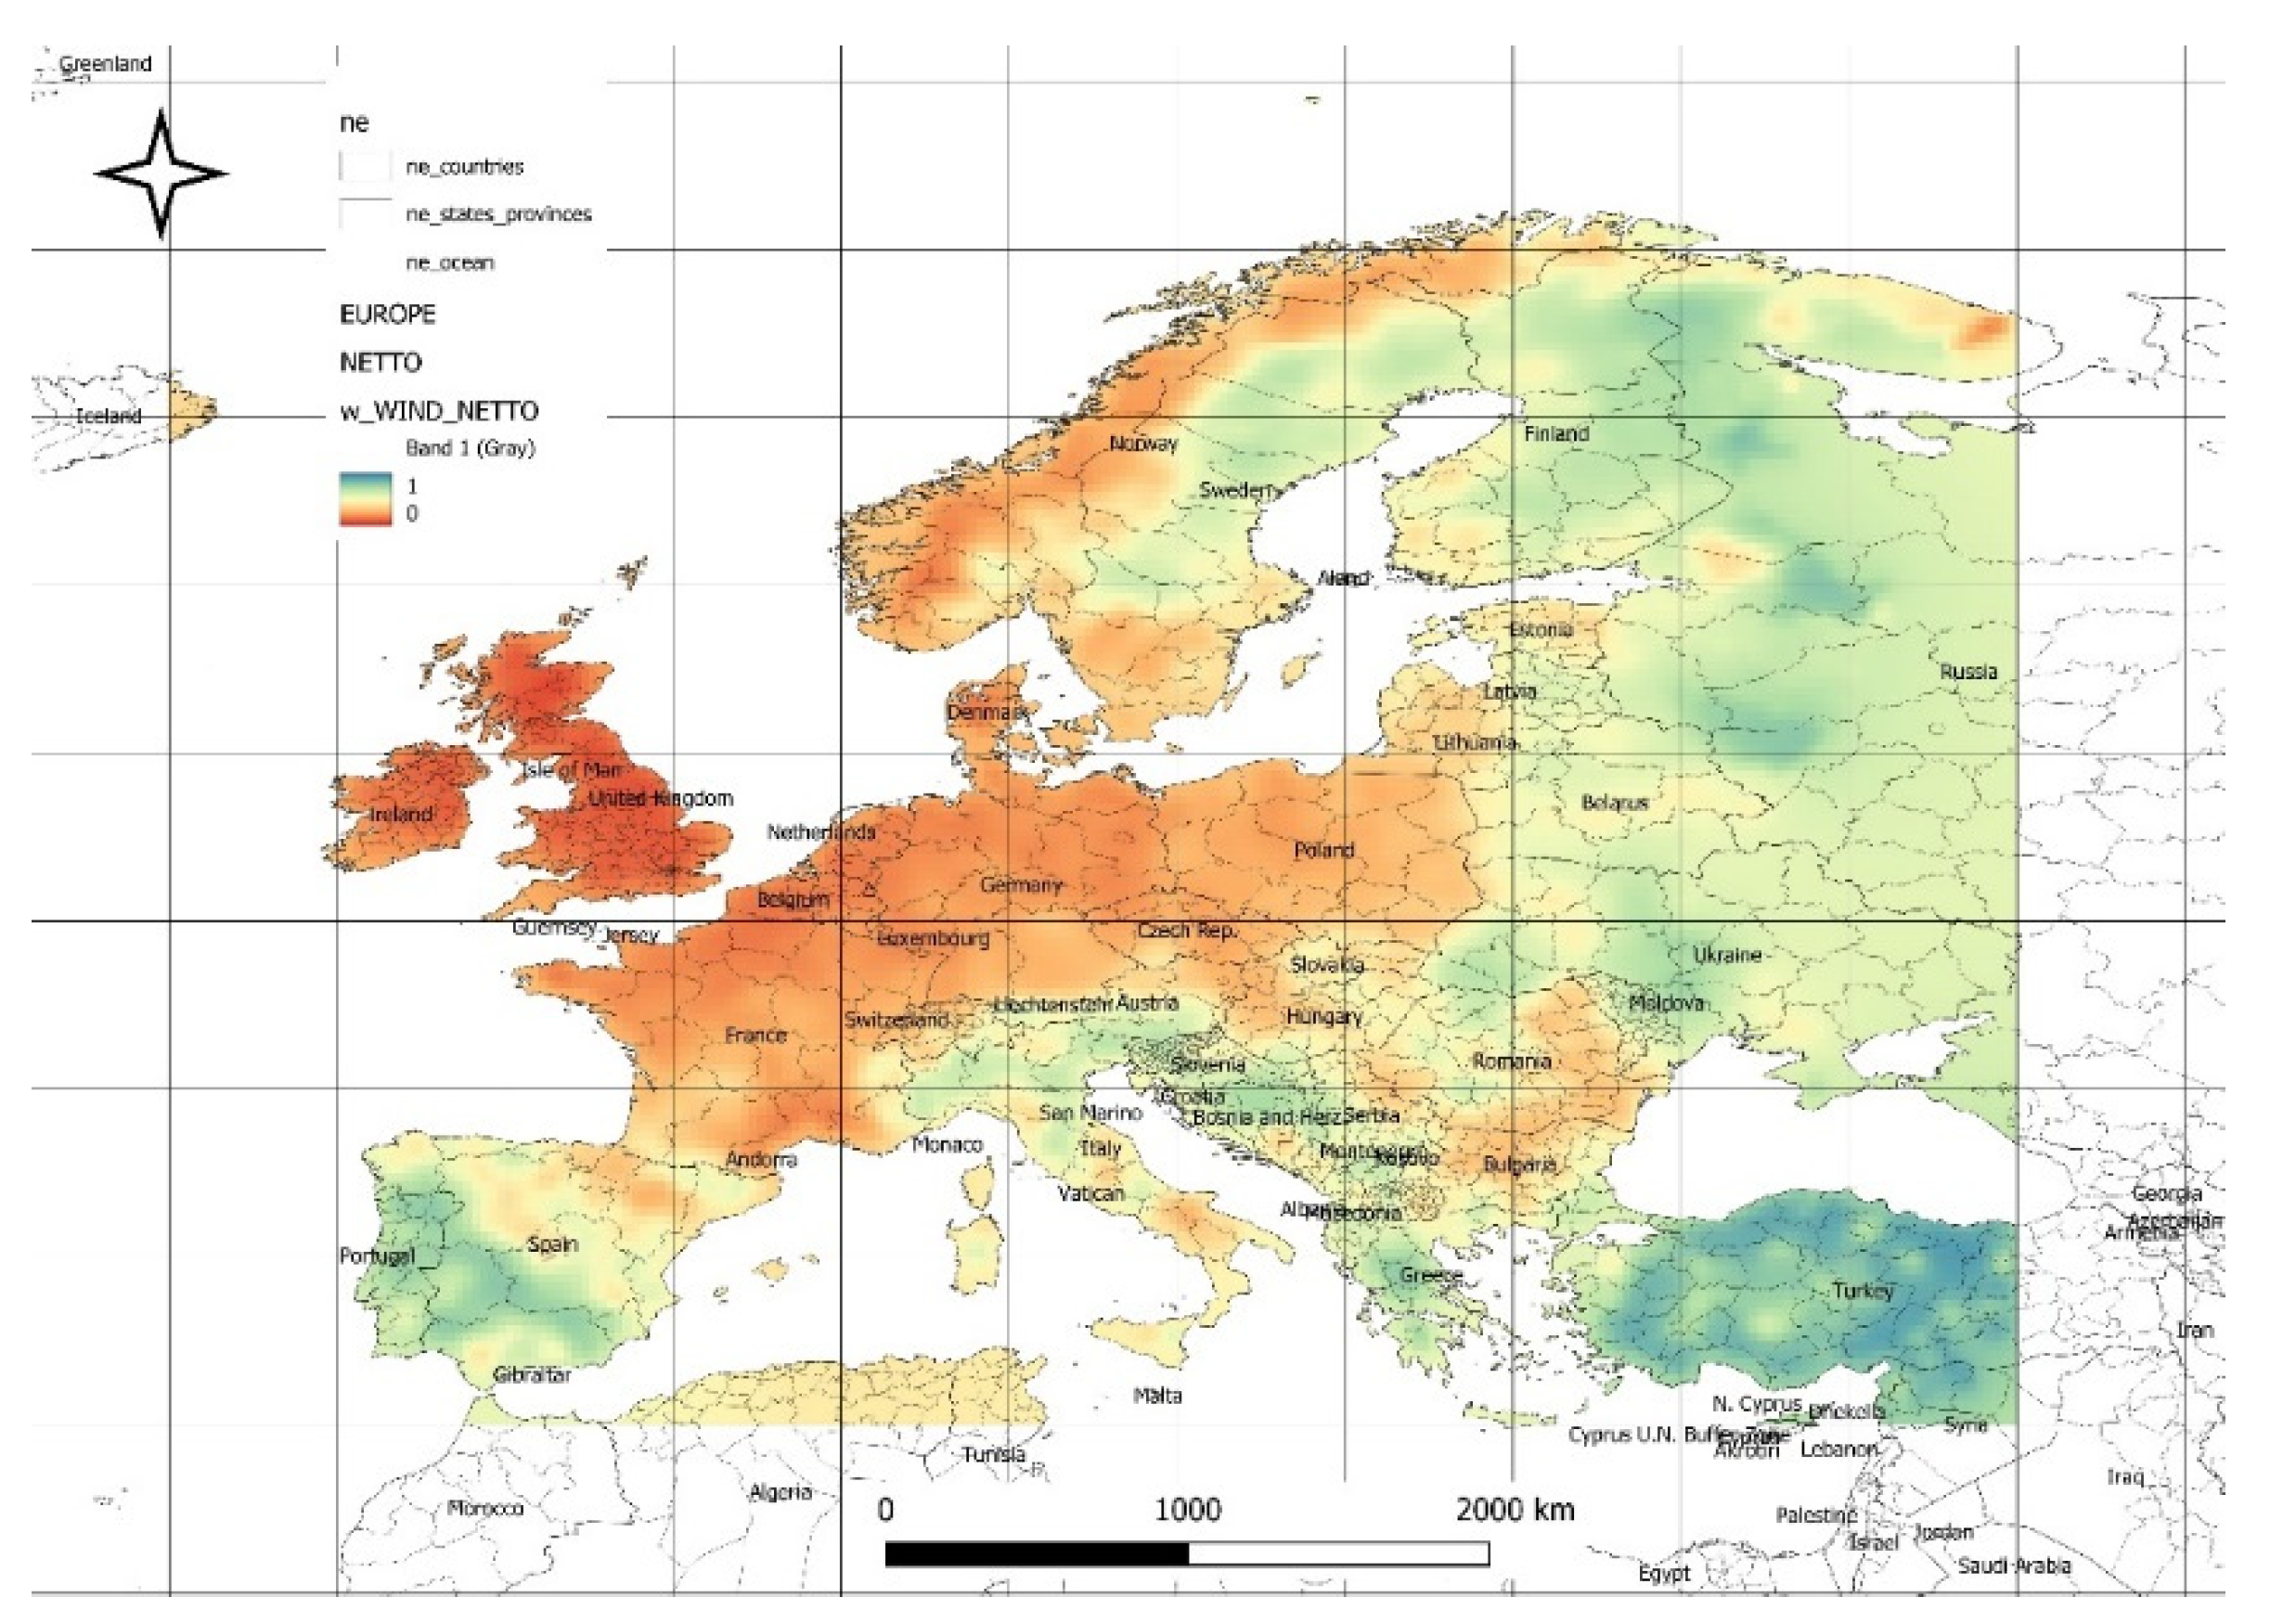
Figure 8.
The value of optimal expected forecasted gross power values (at minimal risk) from the energy mix [W/m2].
Figure 8.
The value of optimal expected forecasted gross power values (at minimal risk) from the energy mix [W/m2].
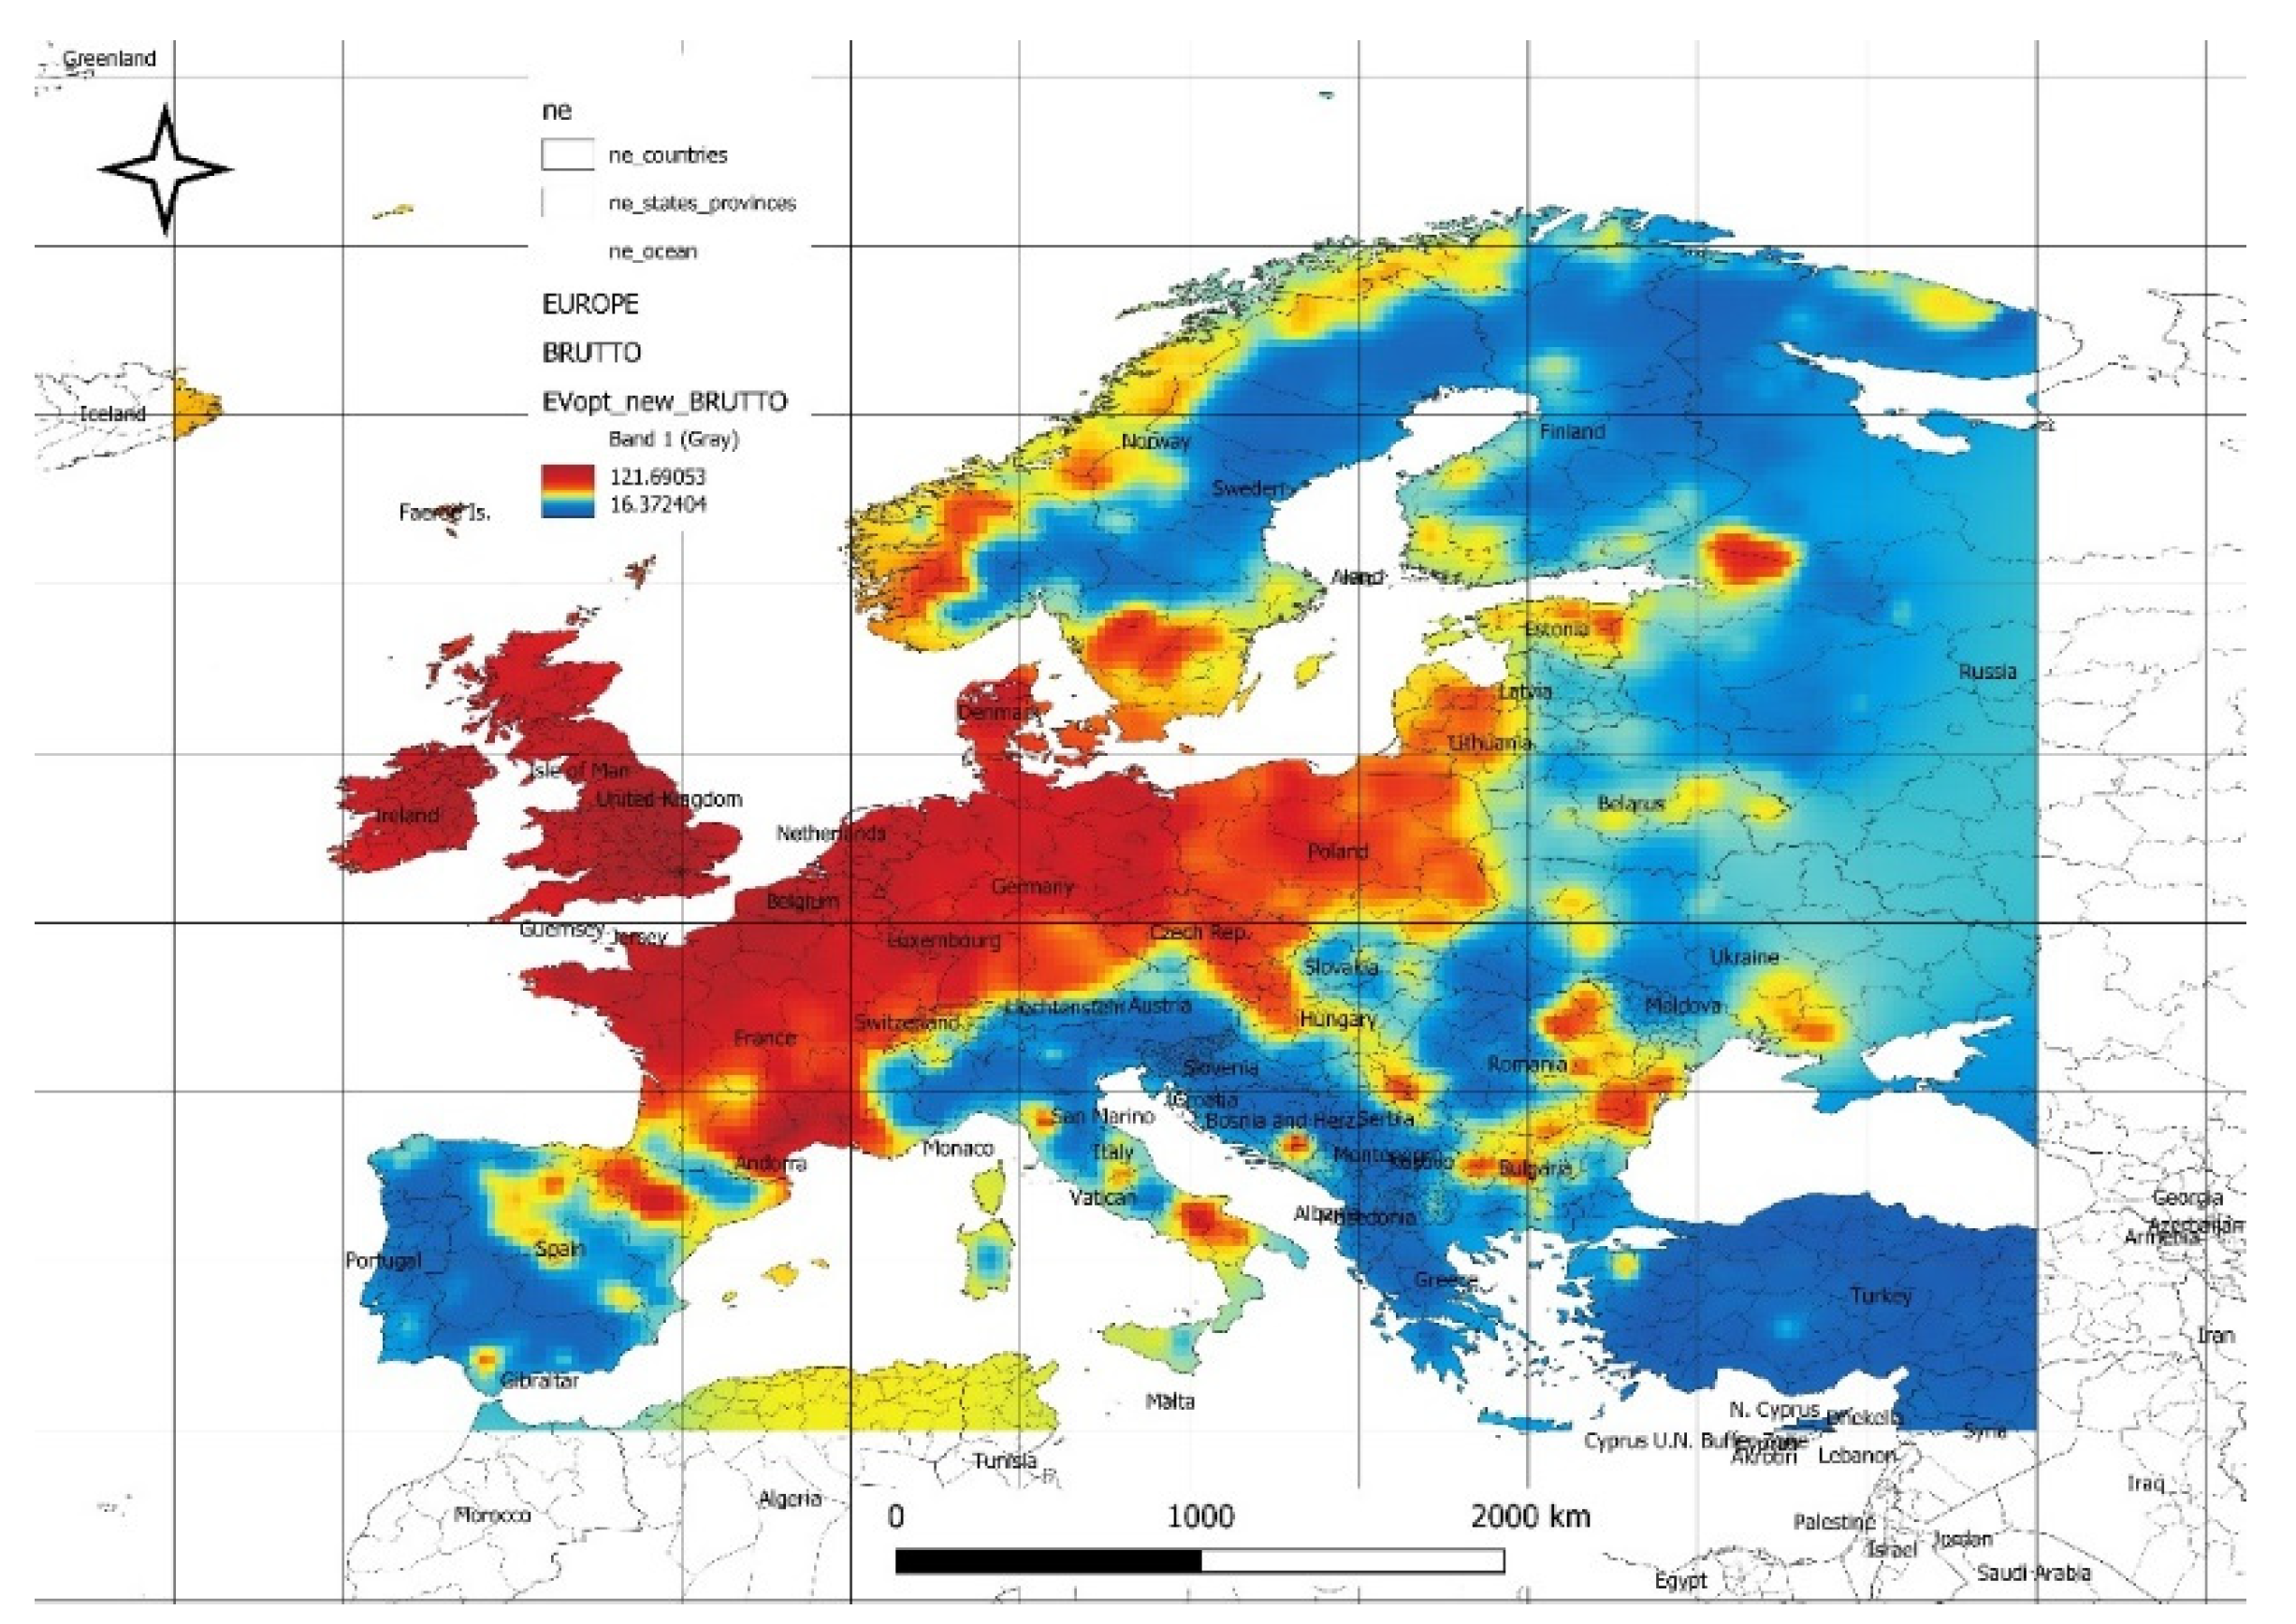
Figure 9.
The difference between forecasted and historical calculated optimal expected gross power values [W/m2].
Figure 9.
The difference between forecasted and historical calculated optimal expected gross power values [W/m2].
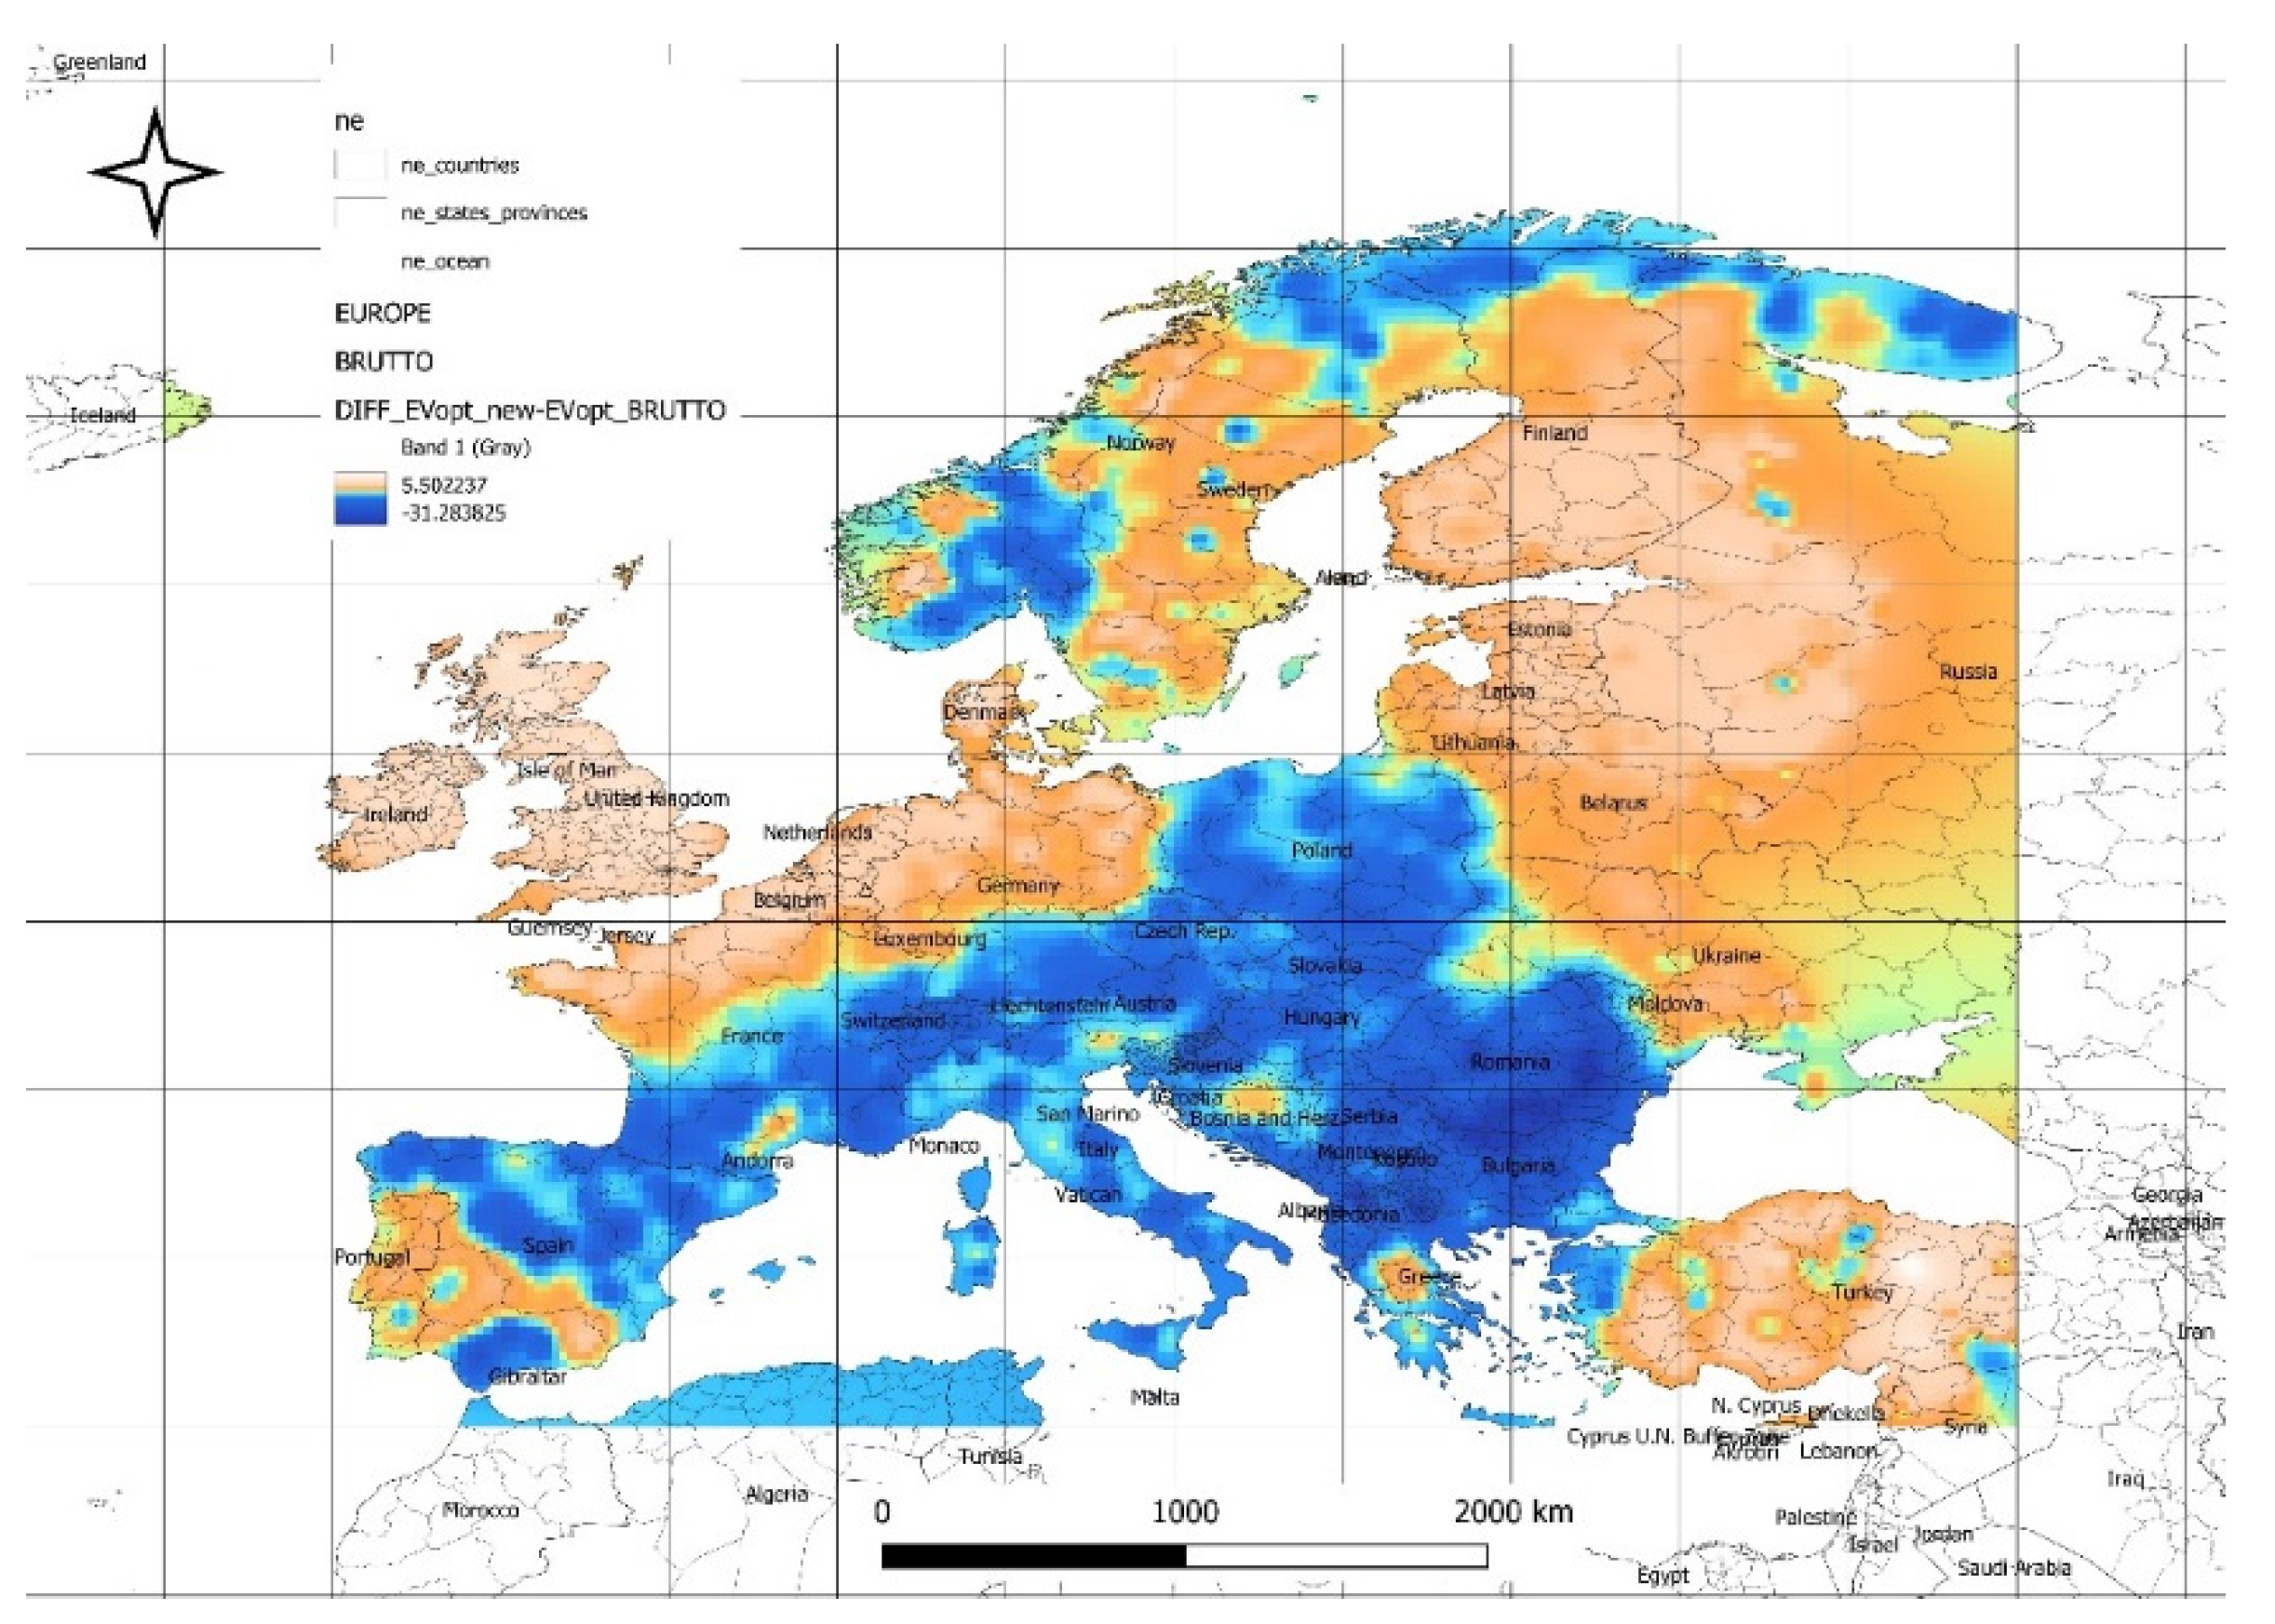
Figure 10.
The value of optimal expected forecasted net power values (at minimal risk) from the energy mix [W/m2].
Figure 10.
The value of optimal expected forecasted net power values (at minimal risk) from the energy mix [W/m2].
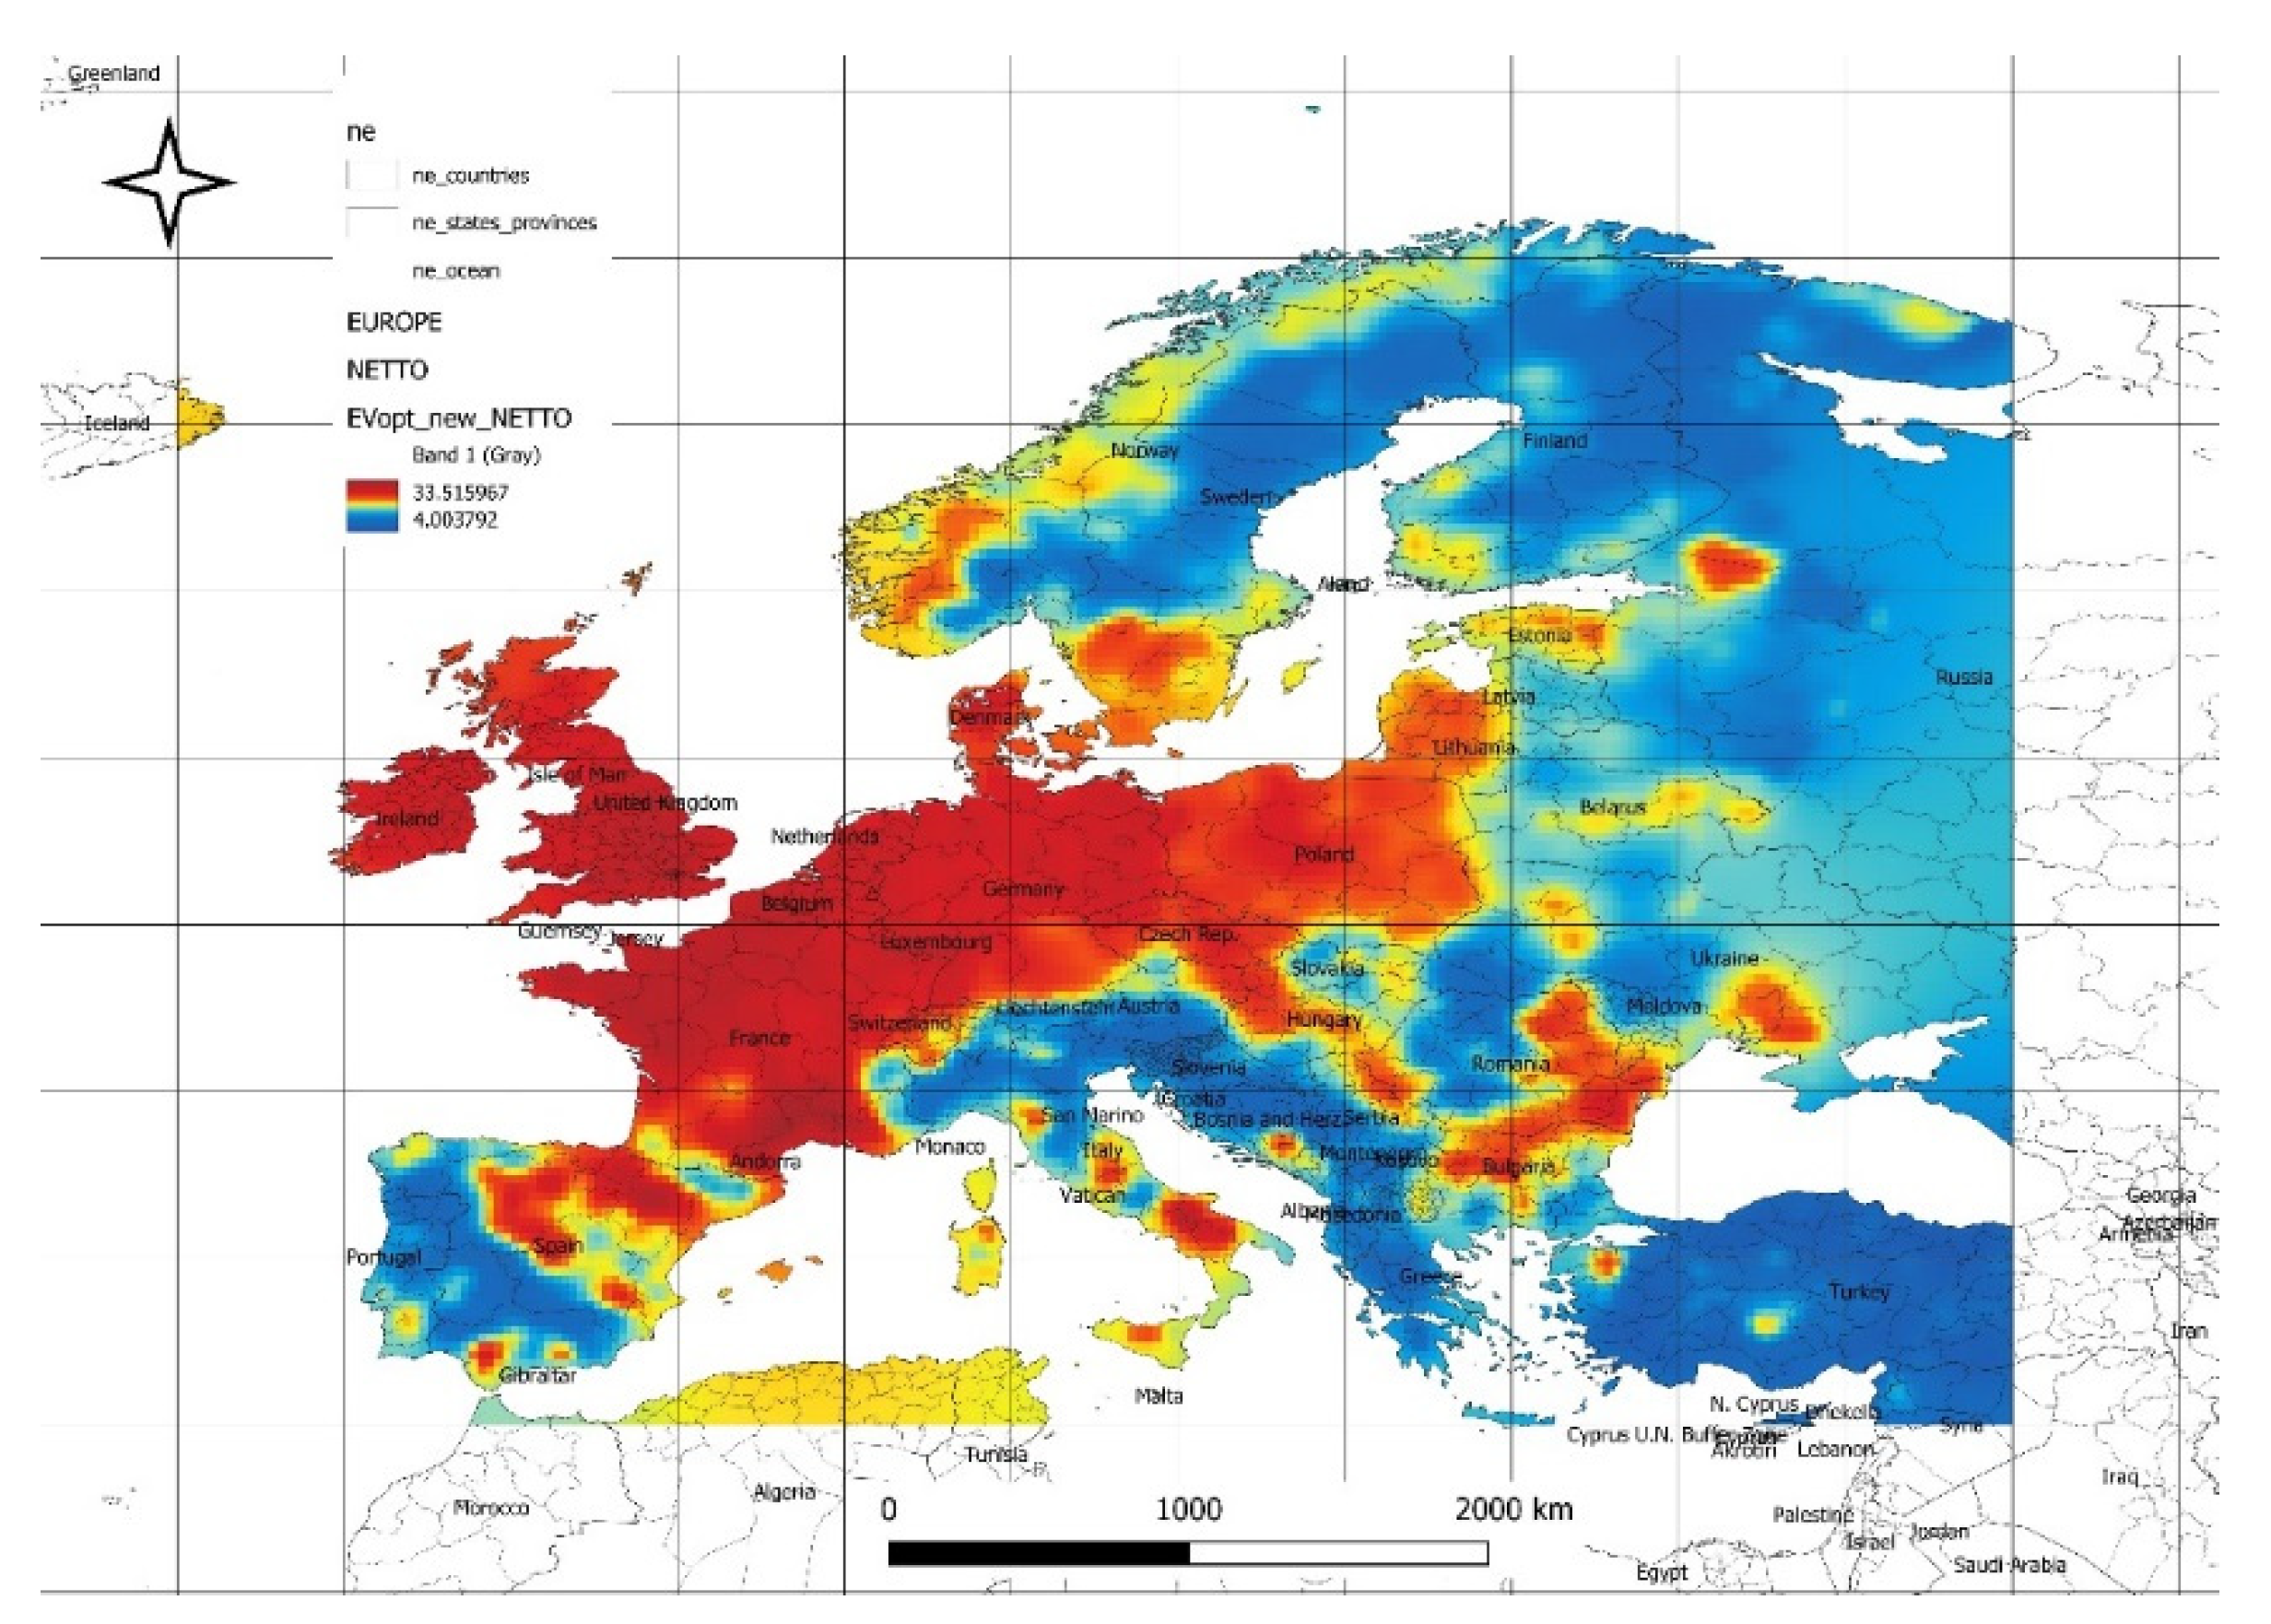
Figure 11.
The difference between forecasted and historical calculated optimal expected gross power values [W/m2].
Figure 11.
The difference between forecasted and historical calculated optimal expected gross power values [W/m2].
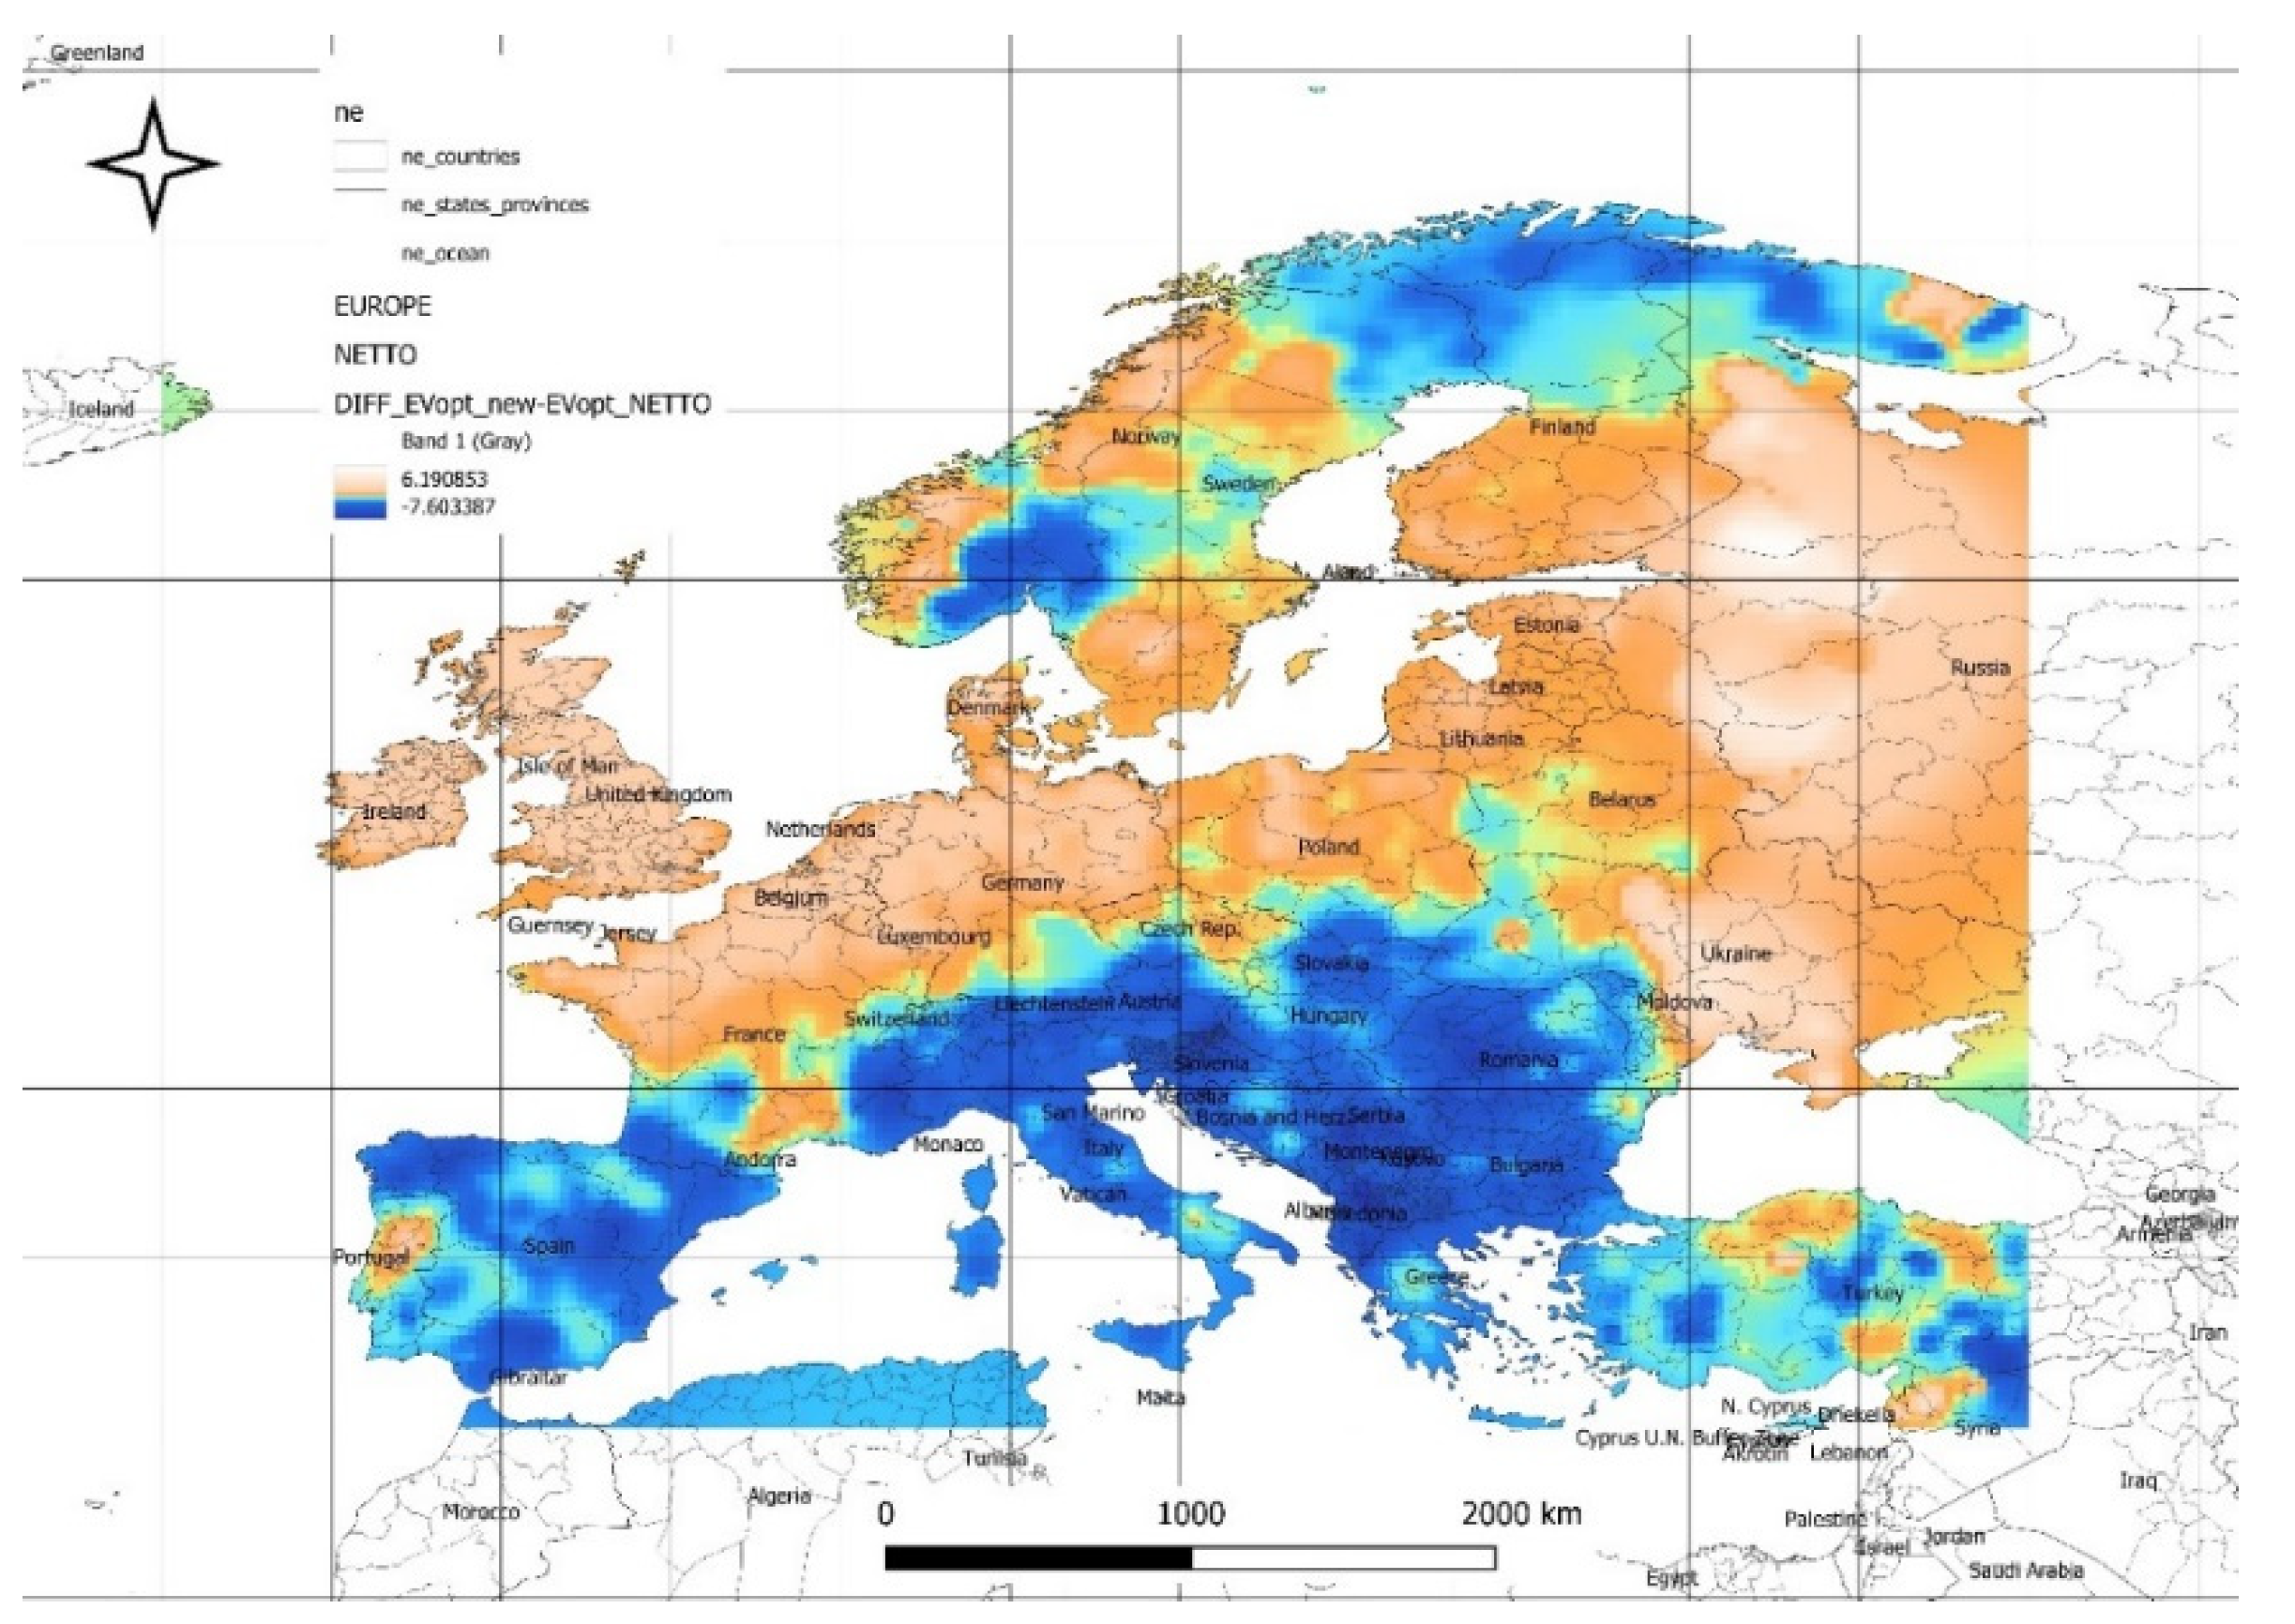
Figure 12.
The value of maximum expected forecasted gross power values (at minimal risk) from the energy mix [W/m2].
Figure 12.
The value of maximum expected forecasted gross power values (at minimal risk) from the energy mix [W/m2].
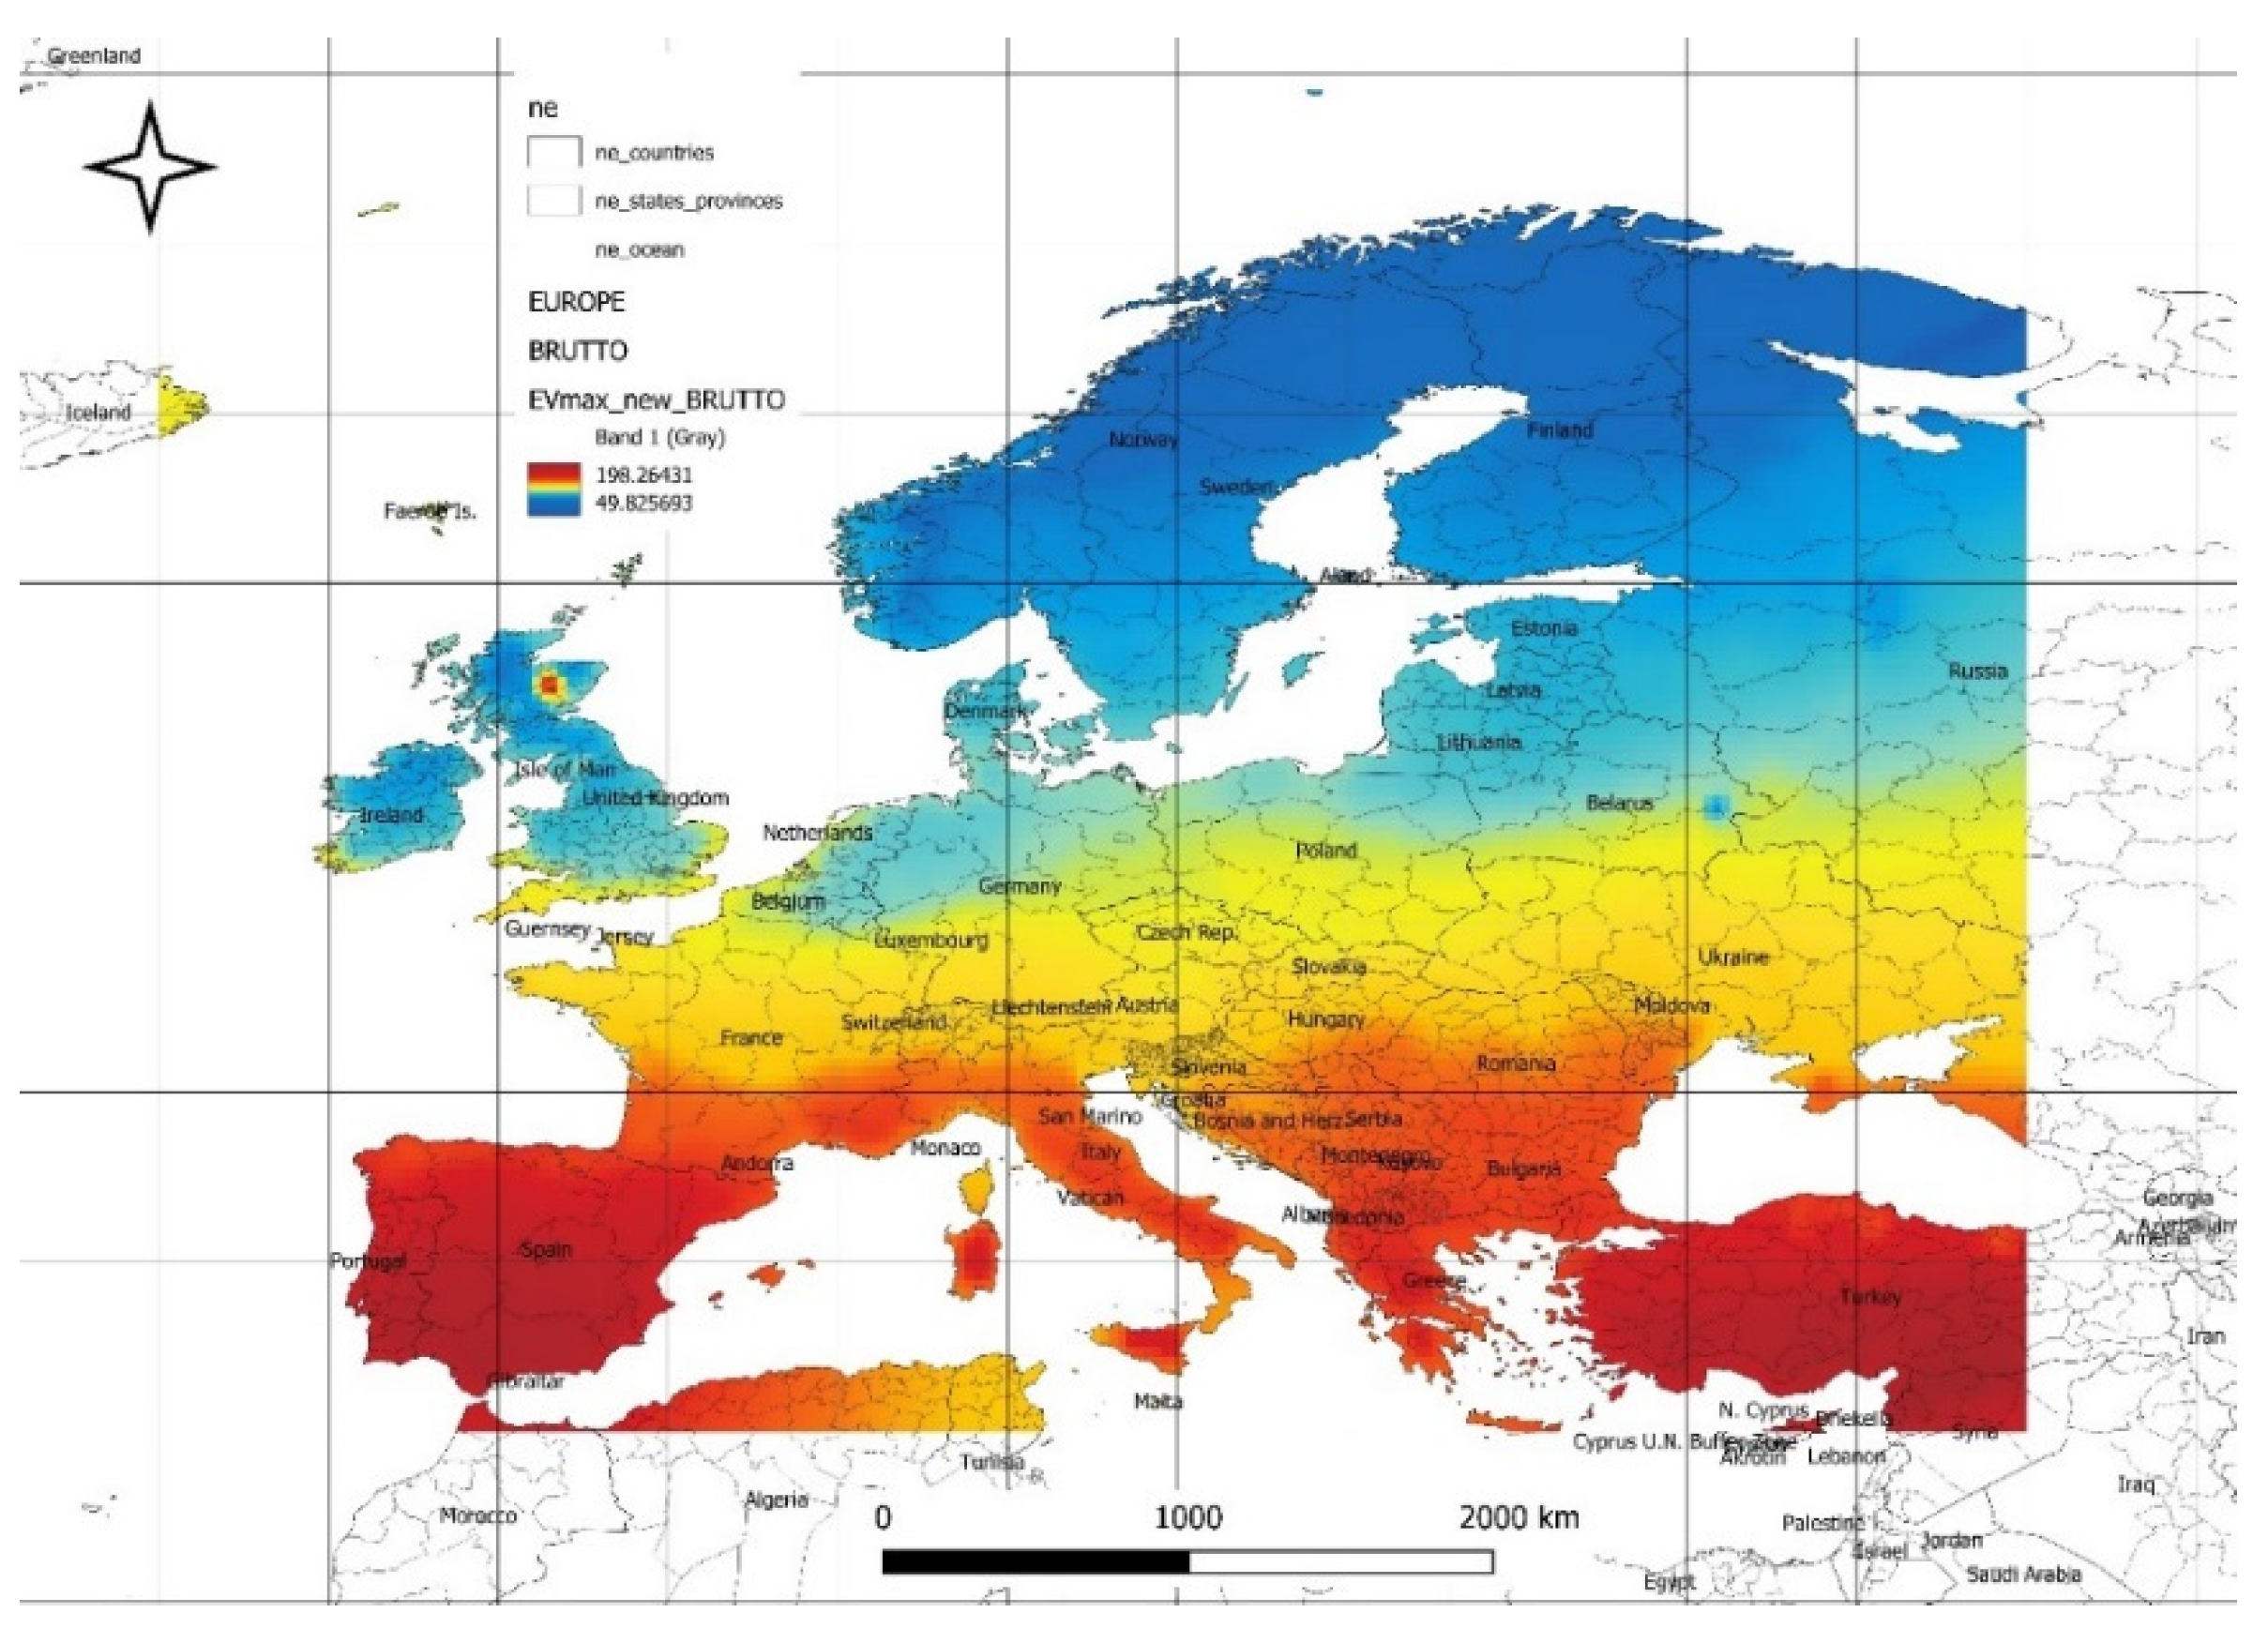
Figure 13.
The difference between forecasted and historical calculated maximum expected gross power values [W/m2].
Figure 13.
The difference between forecasted and historical calculated maximum expected gross power values [W/m2].
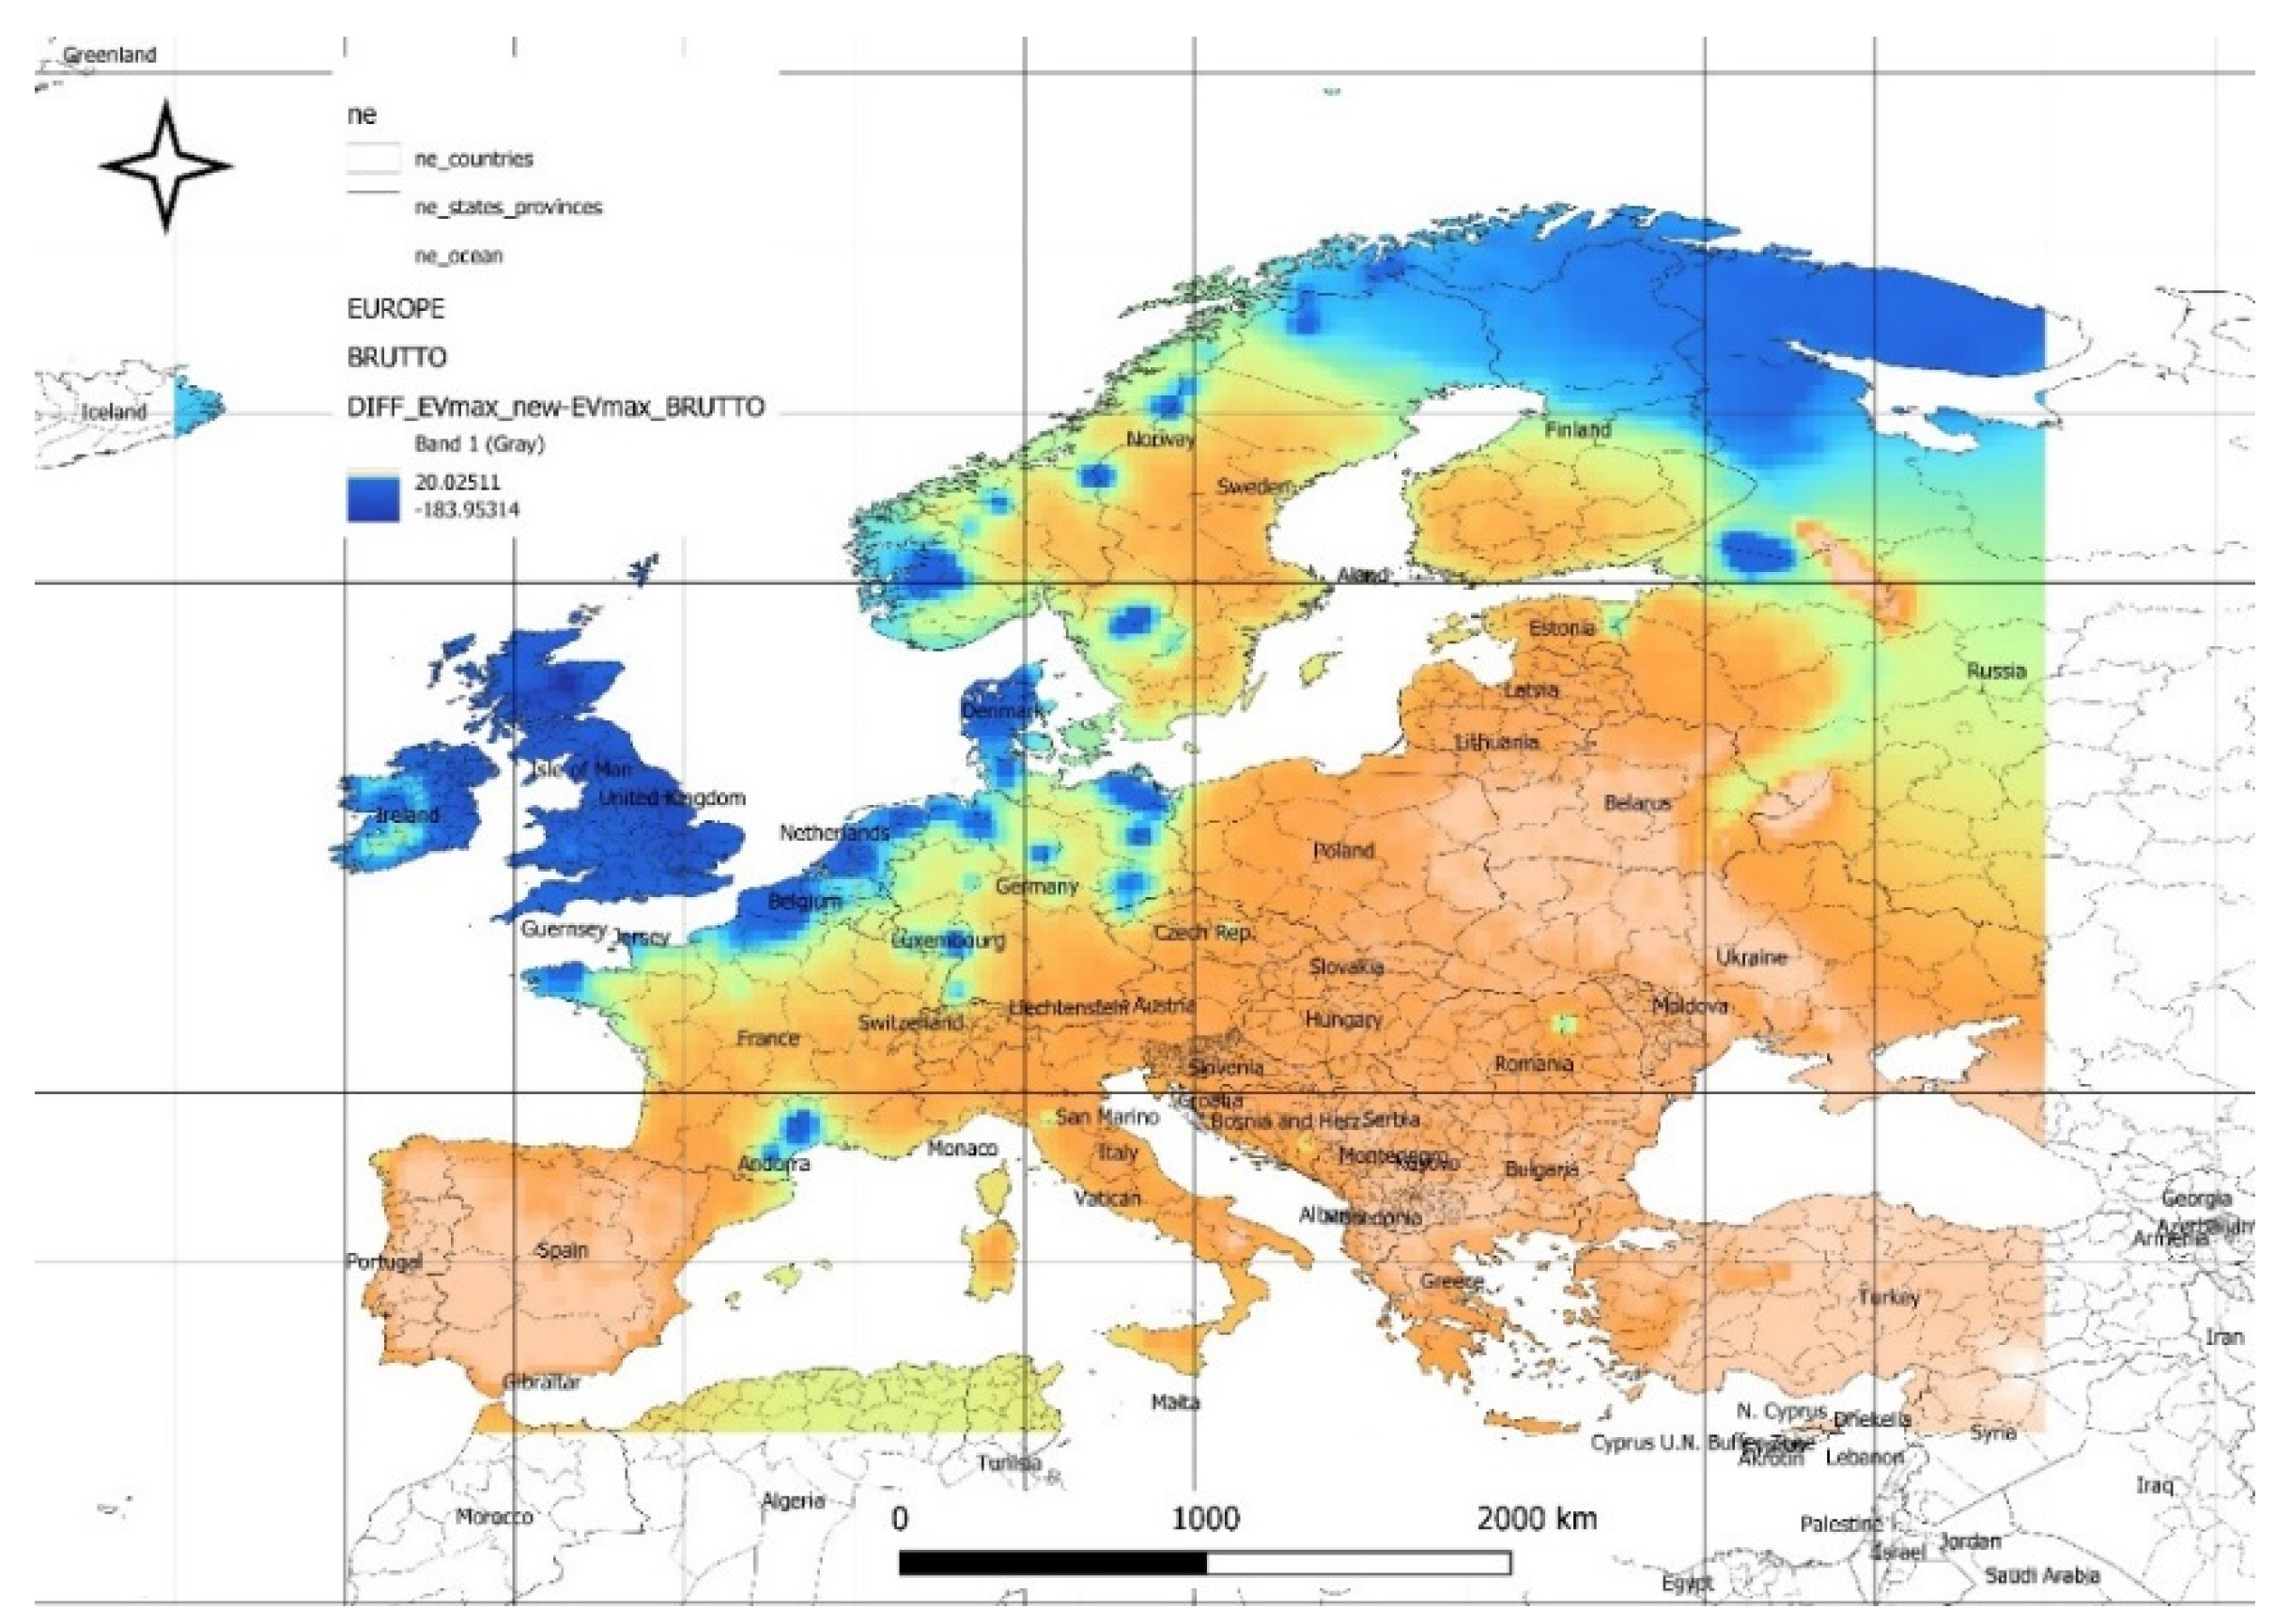
Figure 14.
The value of maximum expected forecasted net power values (at minimal risk) from the energy mix [W/m2].
Figure 14.
The value of maximum expected forecasted net power values (at minimal risk) from the energy mix [W/m2].
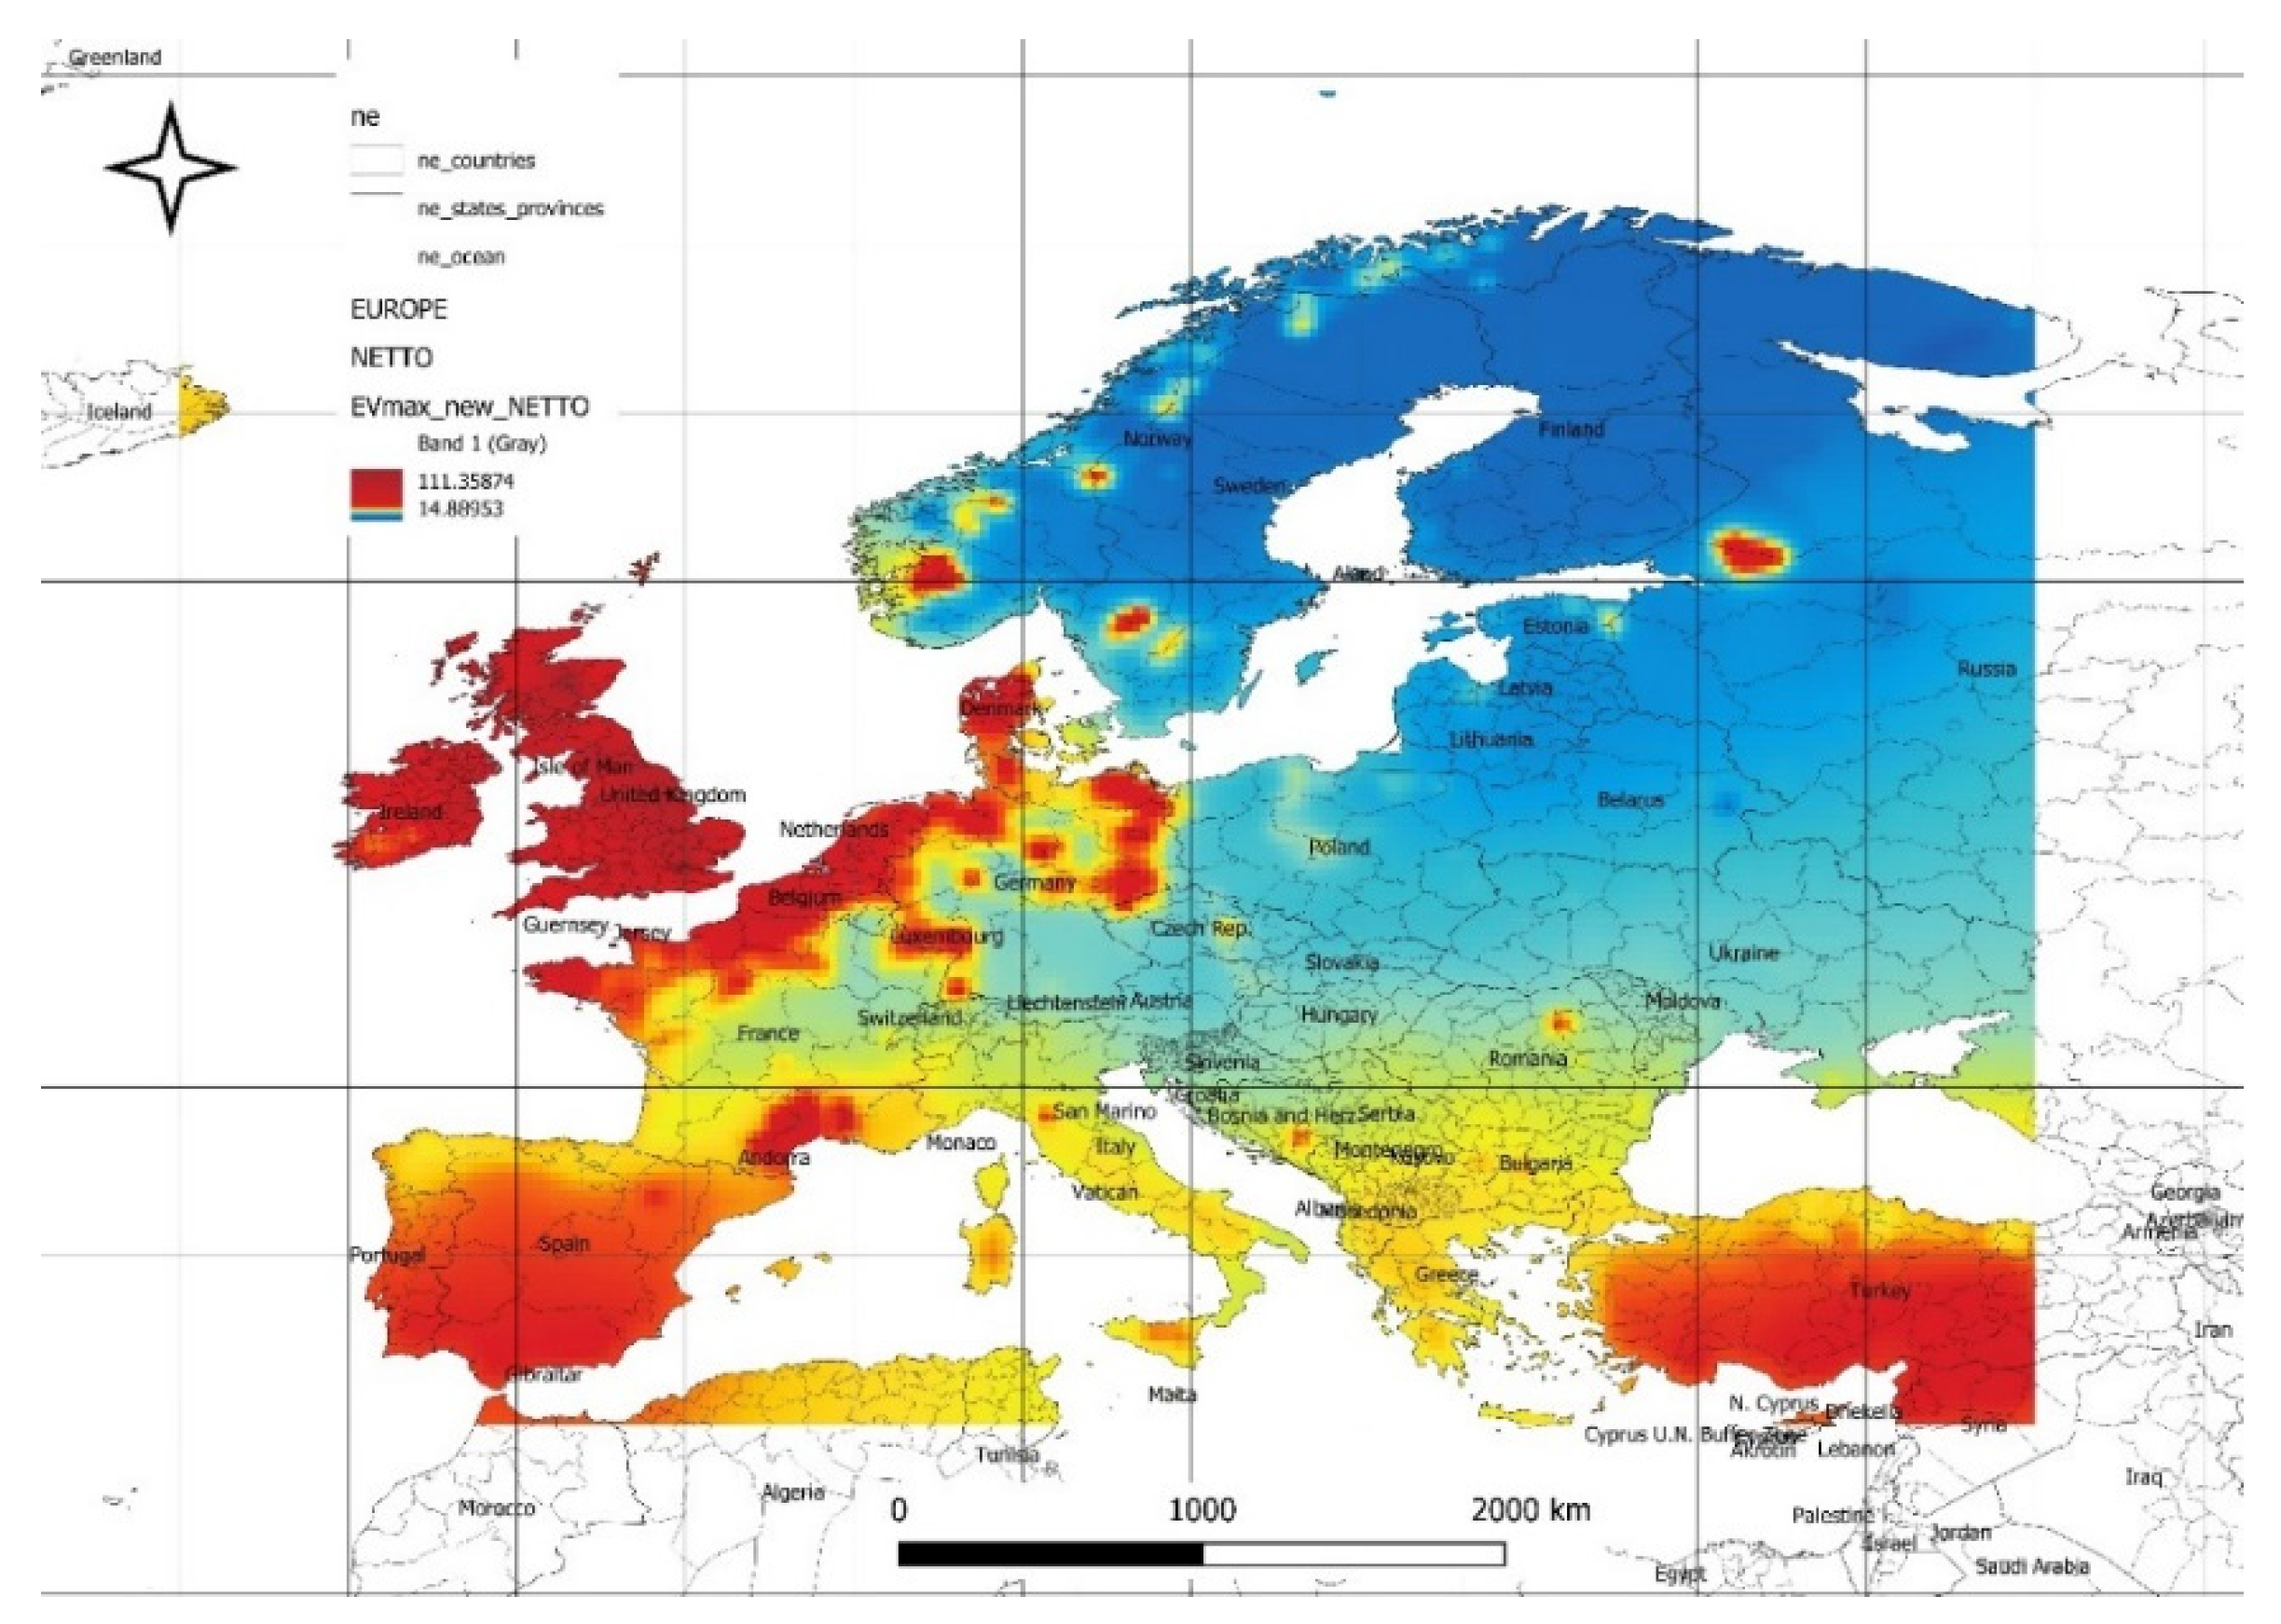
Figure 15.
The difference between forecasted and historical calculated maximum expected net power values [W/m2].
Figure 15.
The difference between forecasted and historical calculated maximum expected net power values [W/m2].
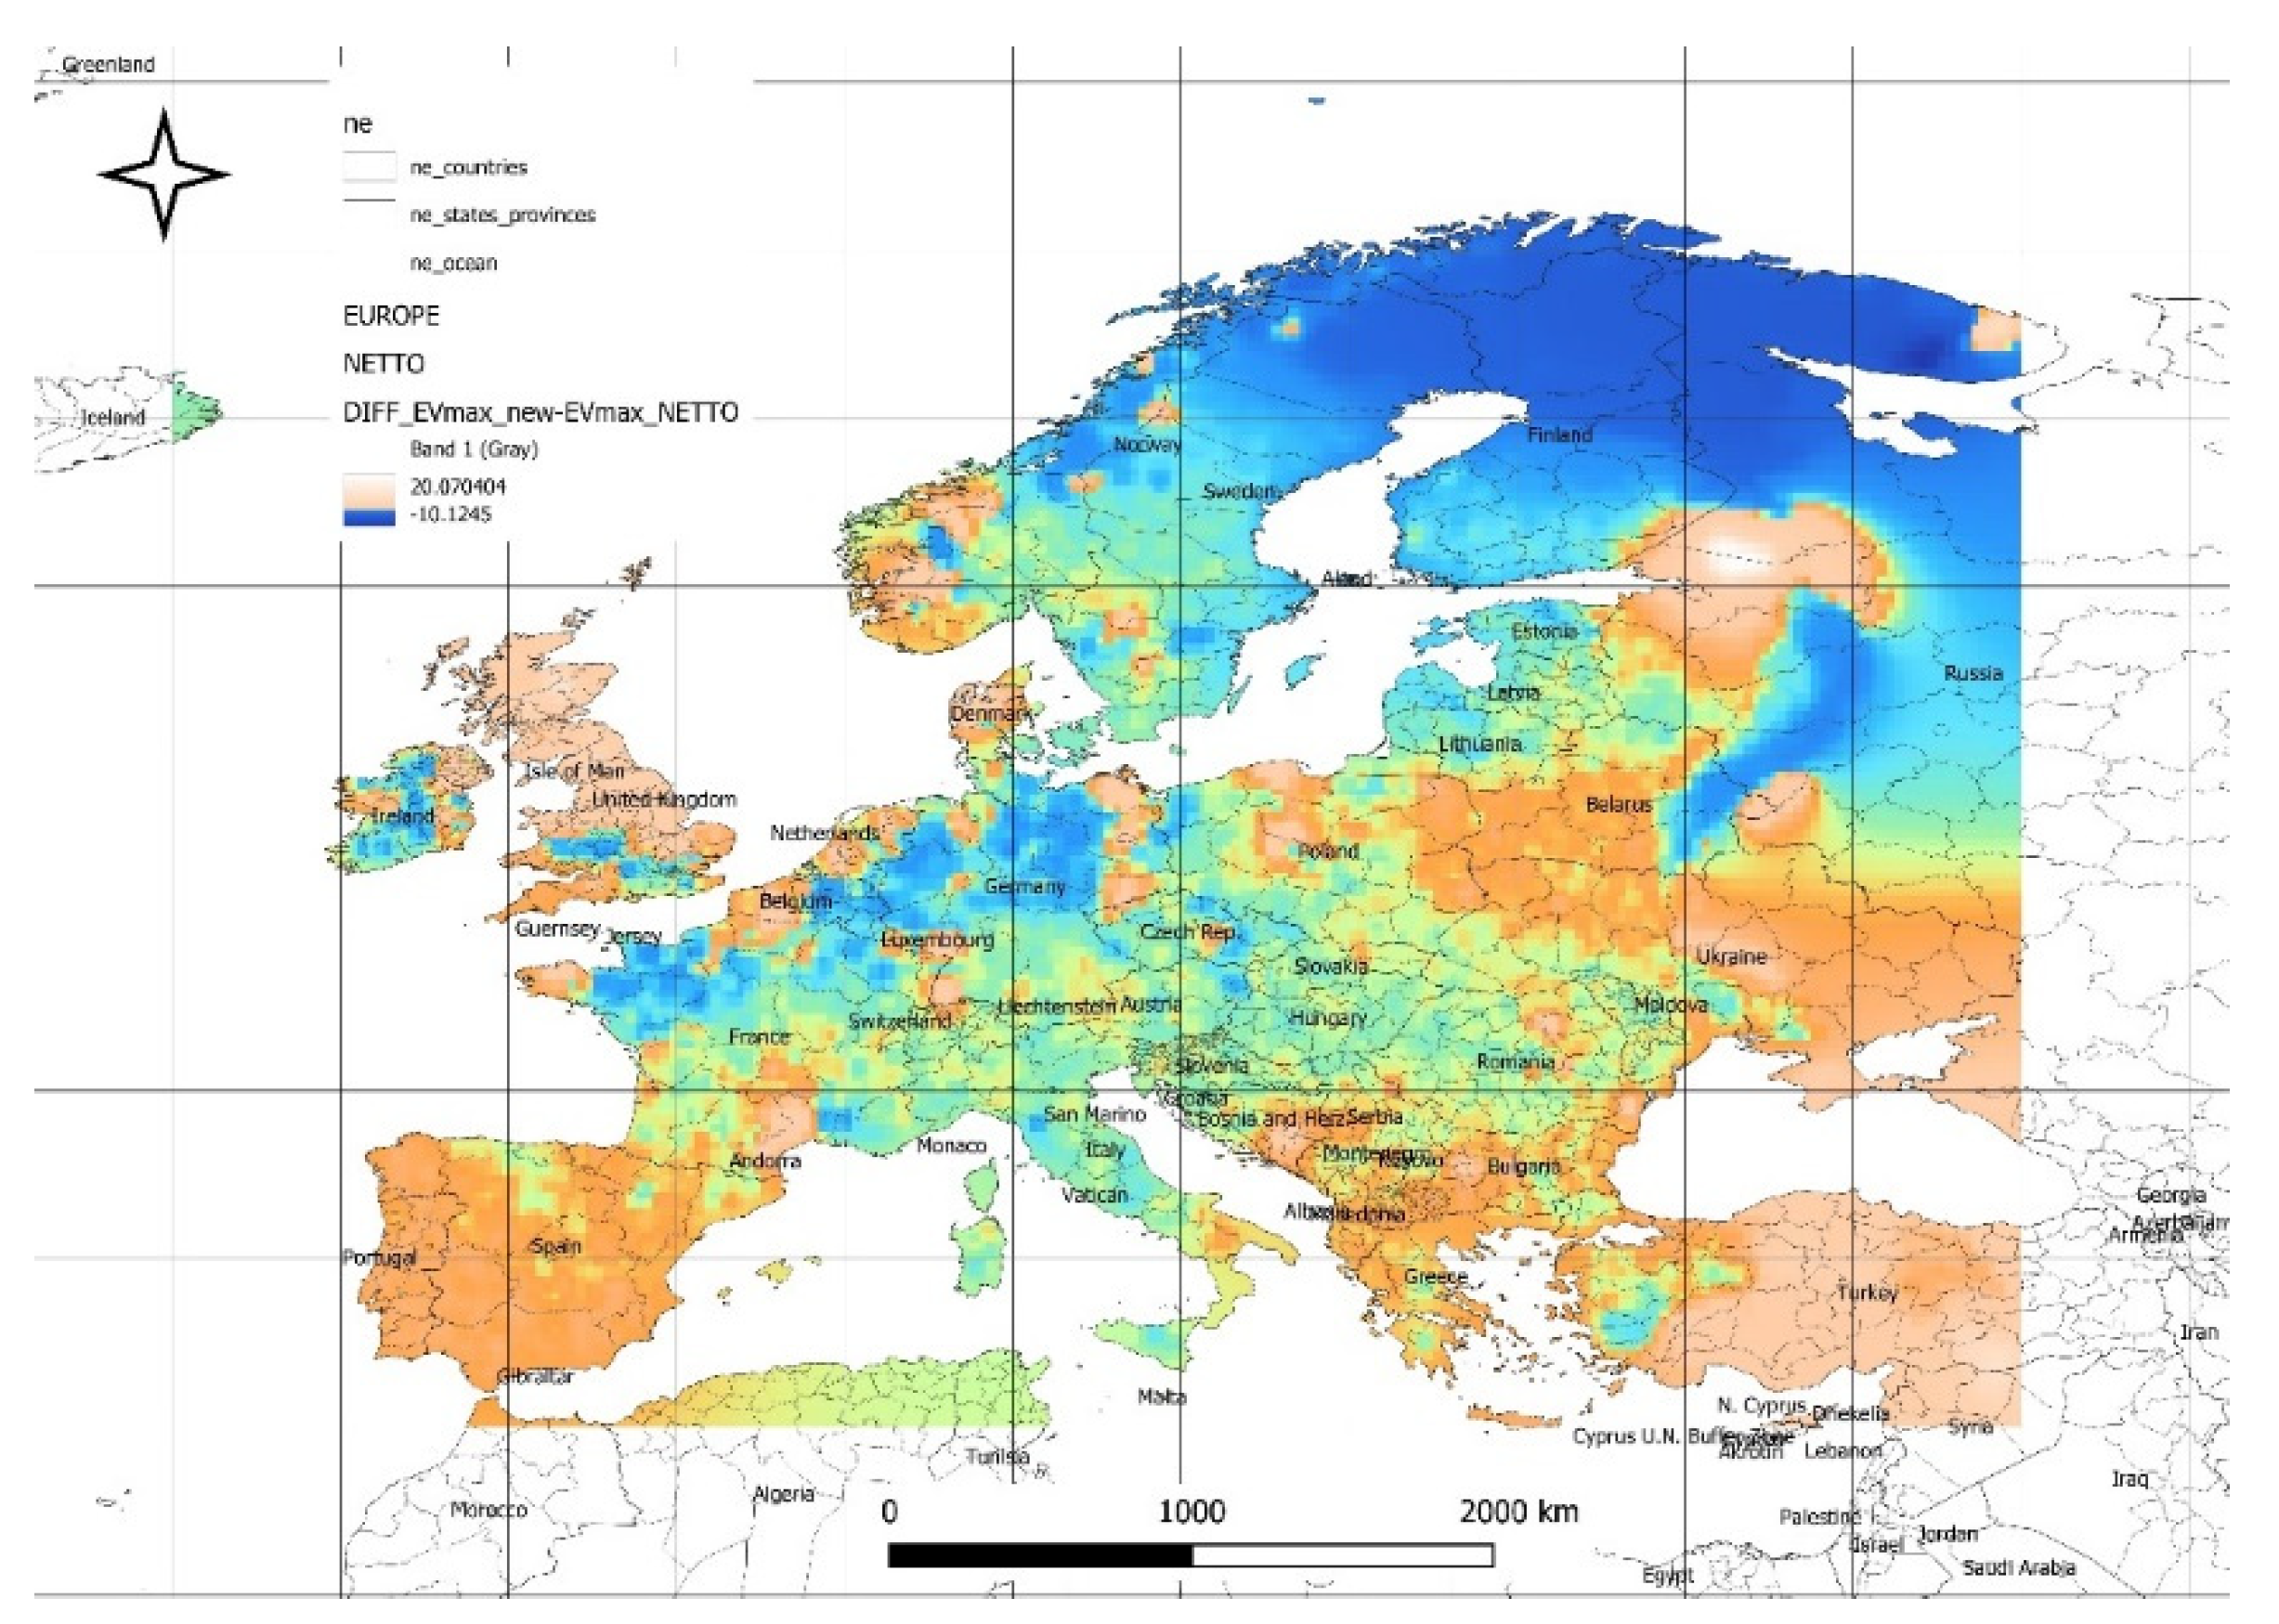
Figure 16.
Change in the optimal share coefficients of the wind energy component under forecasted gross energy mix conditions compared to historical conditions.
Figure 16.
Change in the optimal share coefficients of the wind energy component under forecasted gross energy mix conditions compared to historical conditions.
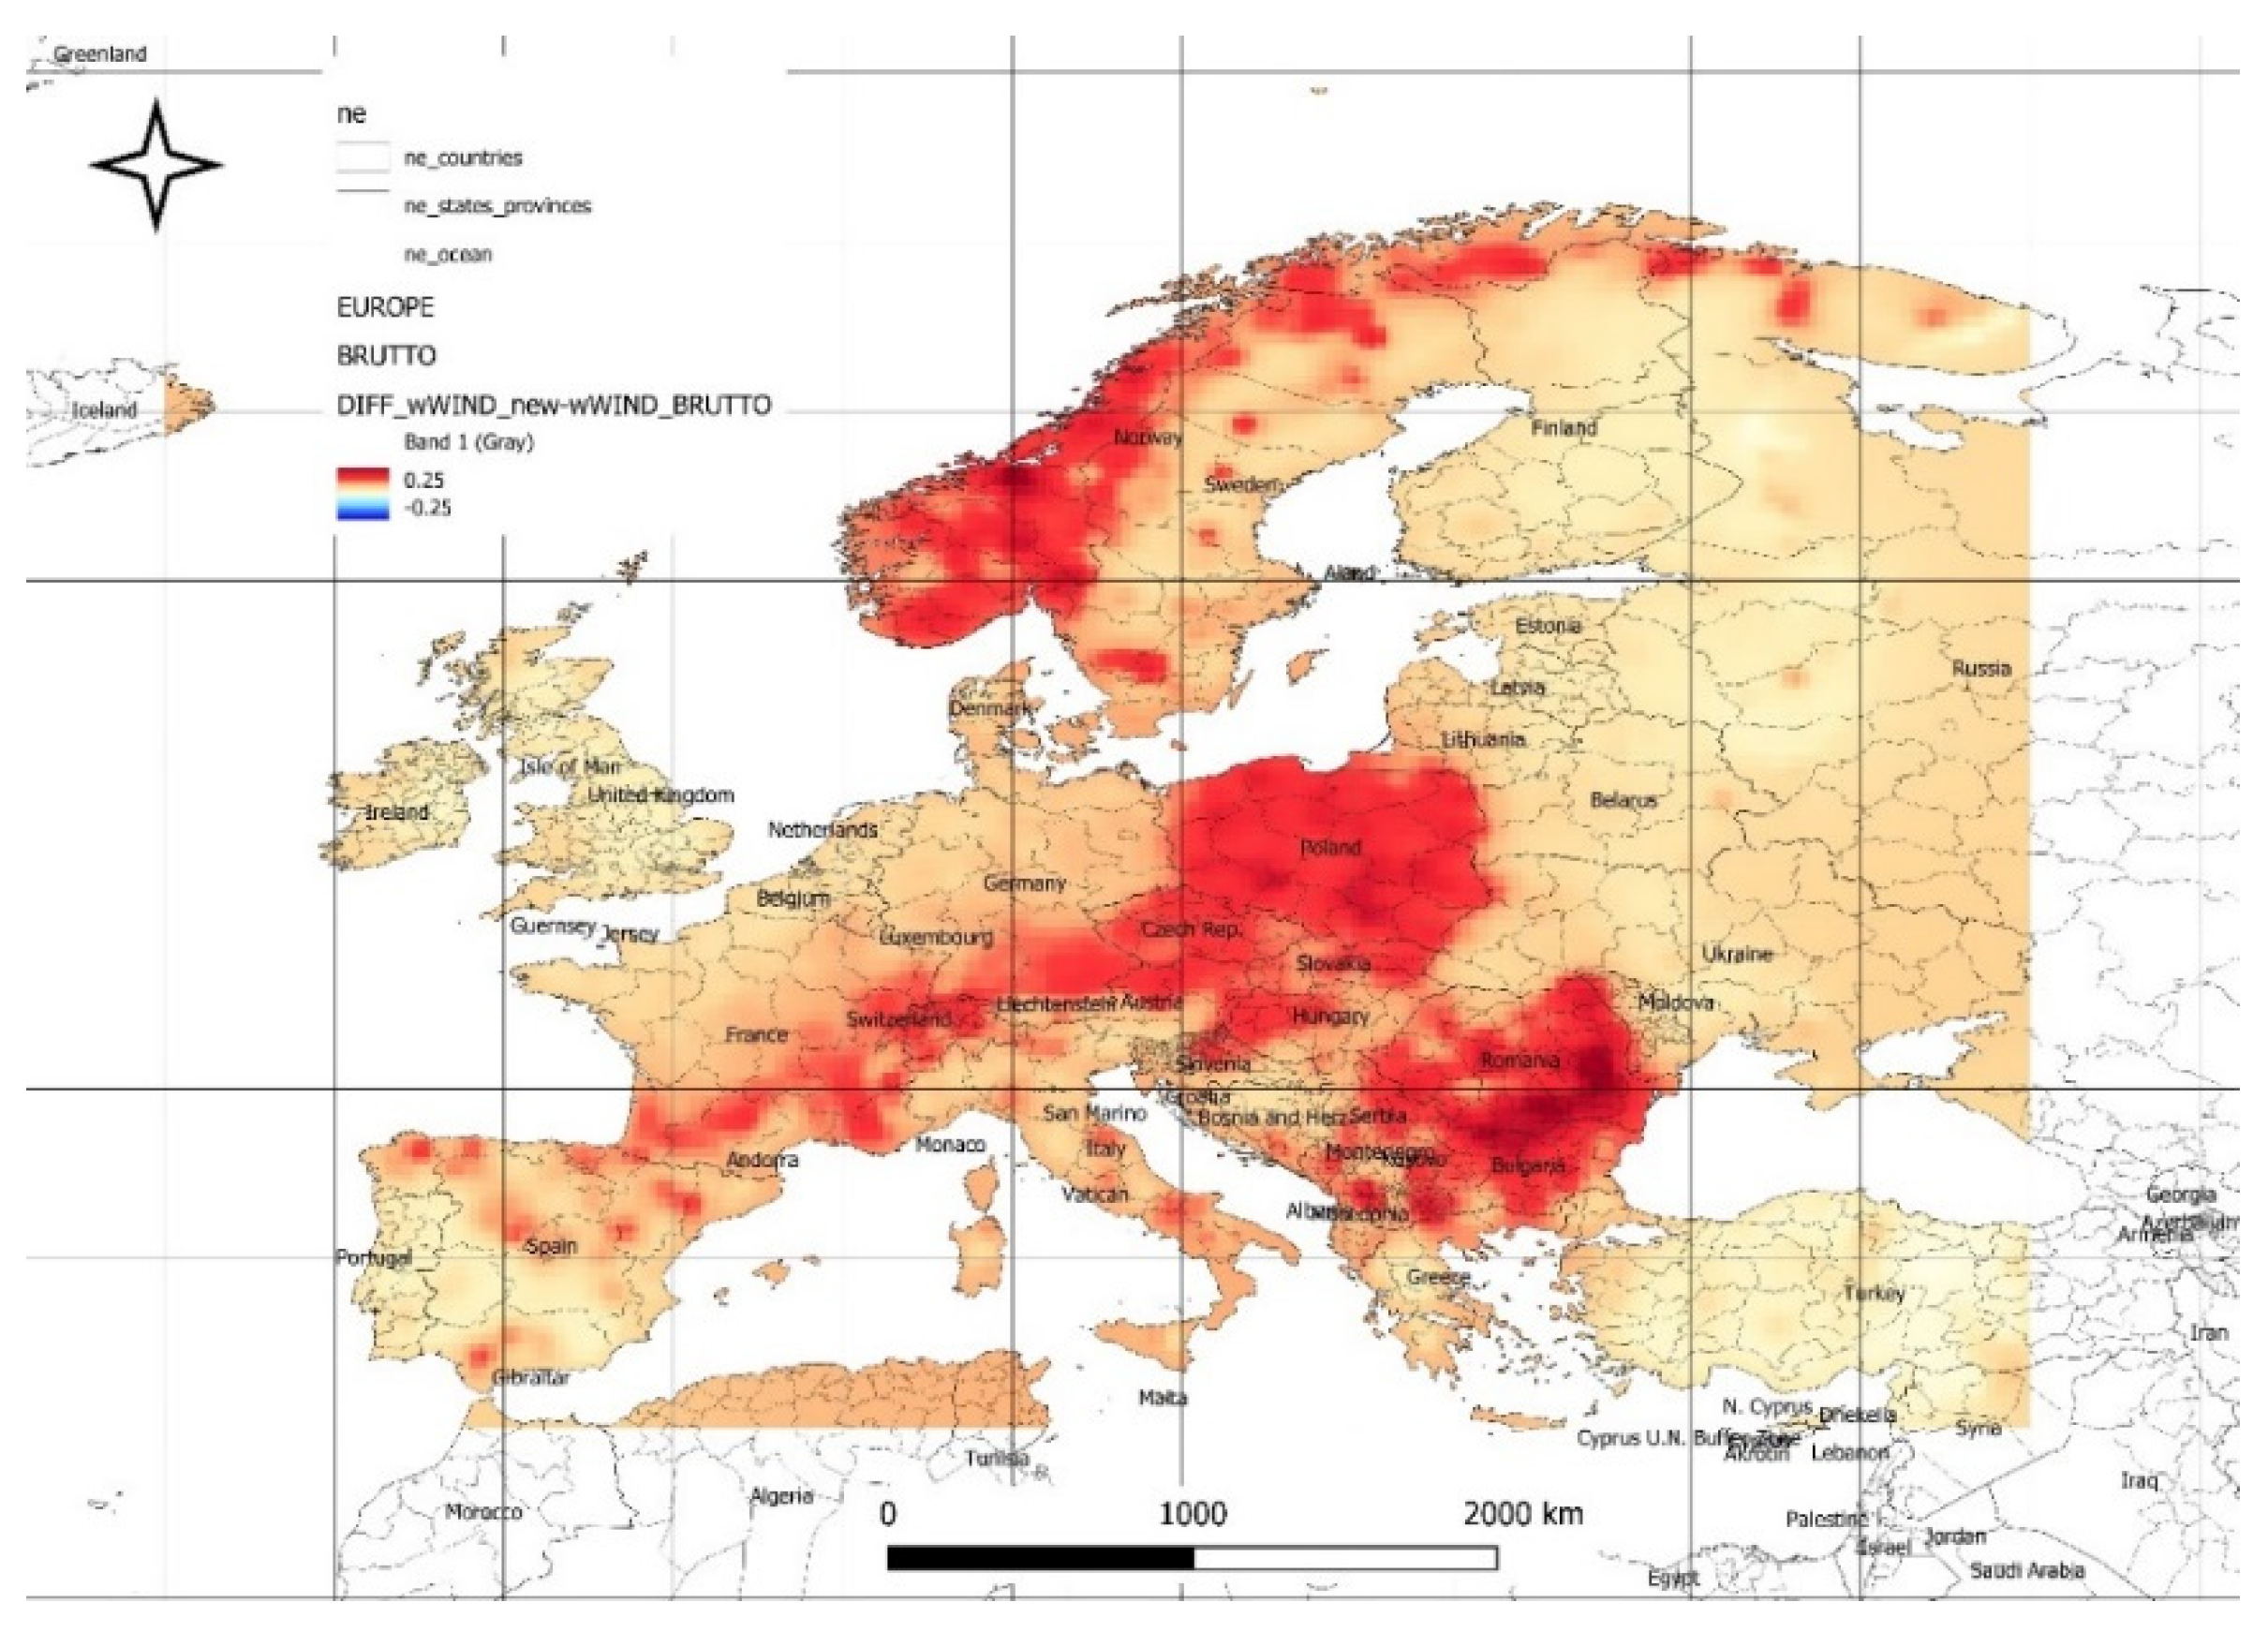
Figure 17.
Change in the optimal share coefficients of the wind energy component under forecasted net energy mix conditions compared to historical conditions.
Figure 17.
Change in the optimal share coefficients of the wind energy component under forecasted net energy mix conditions compared to historical conditions.
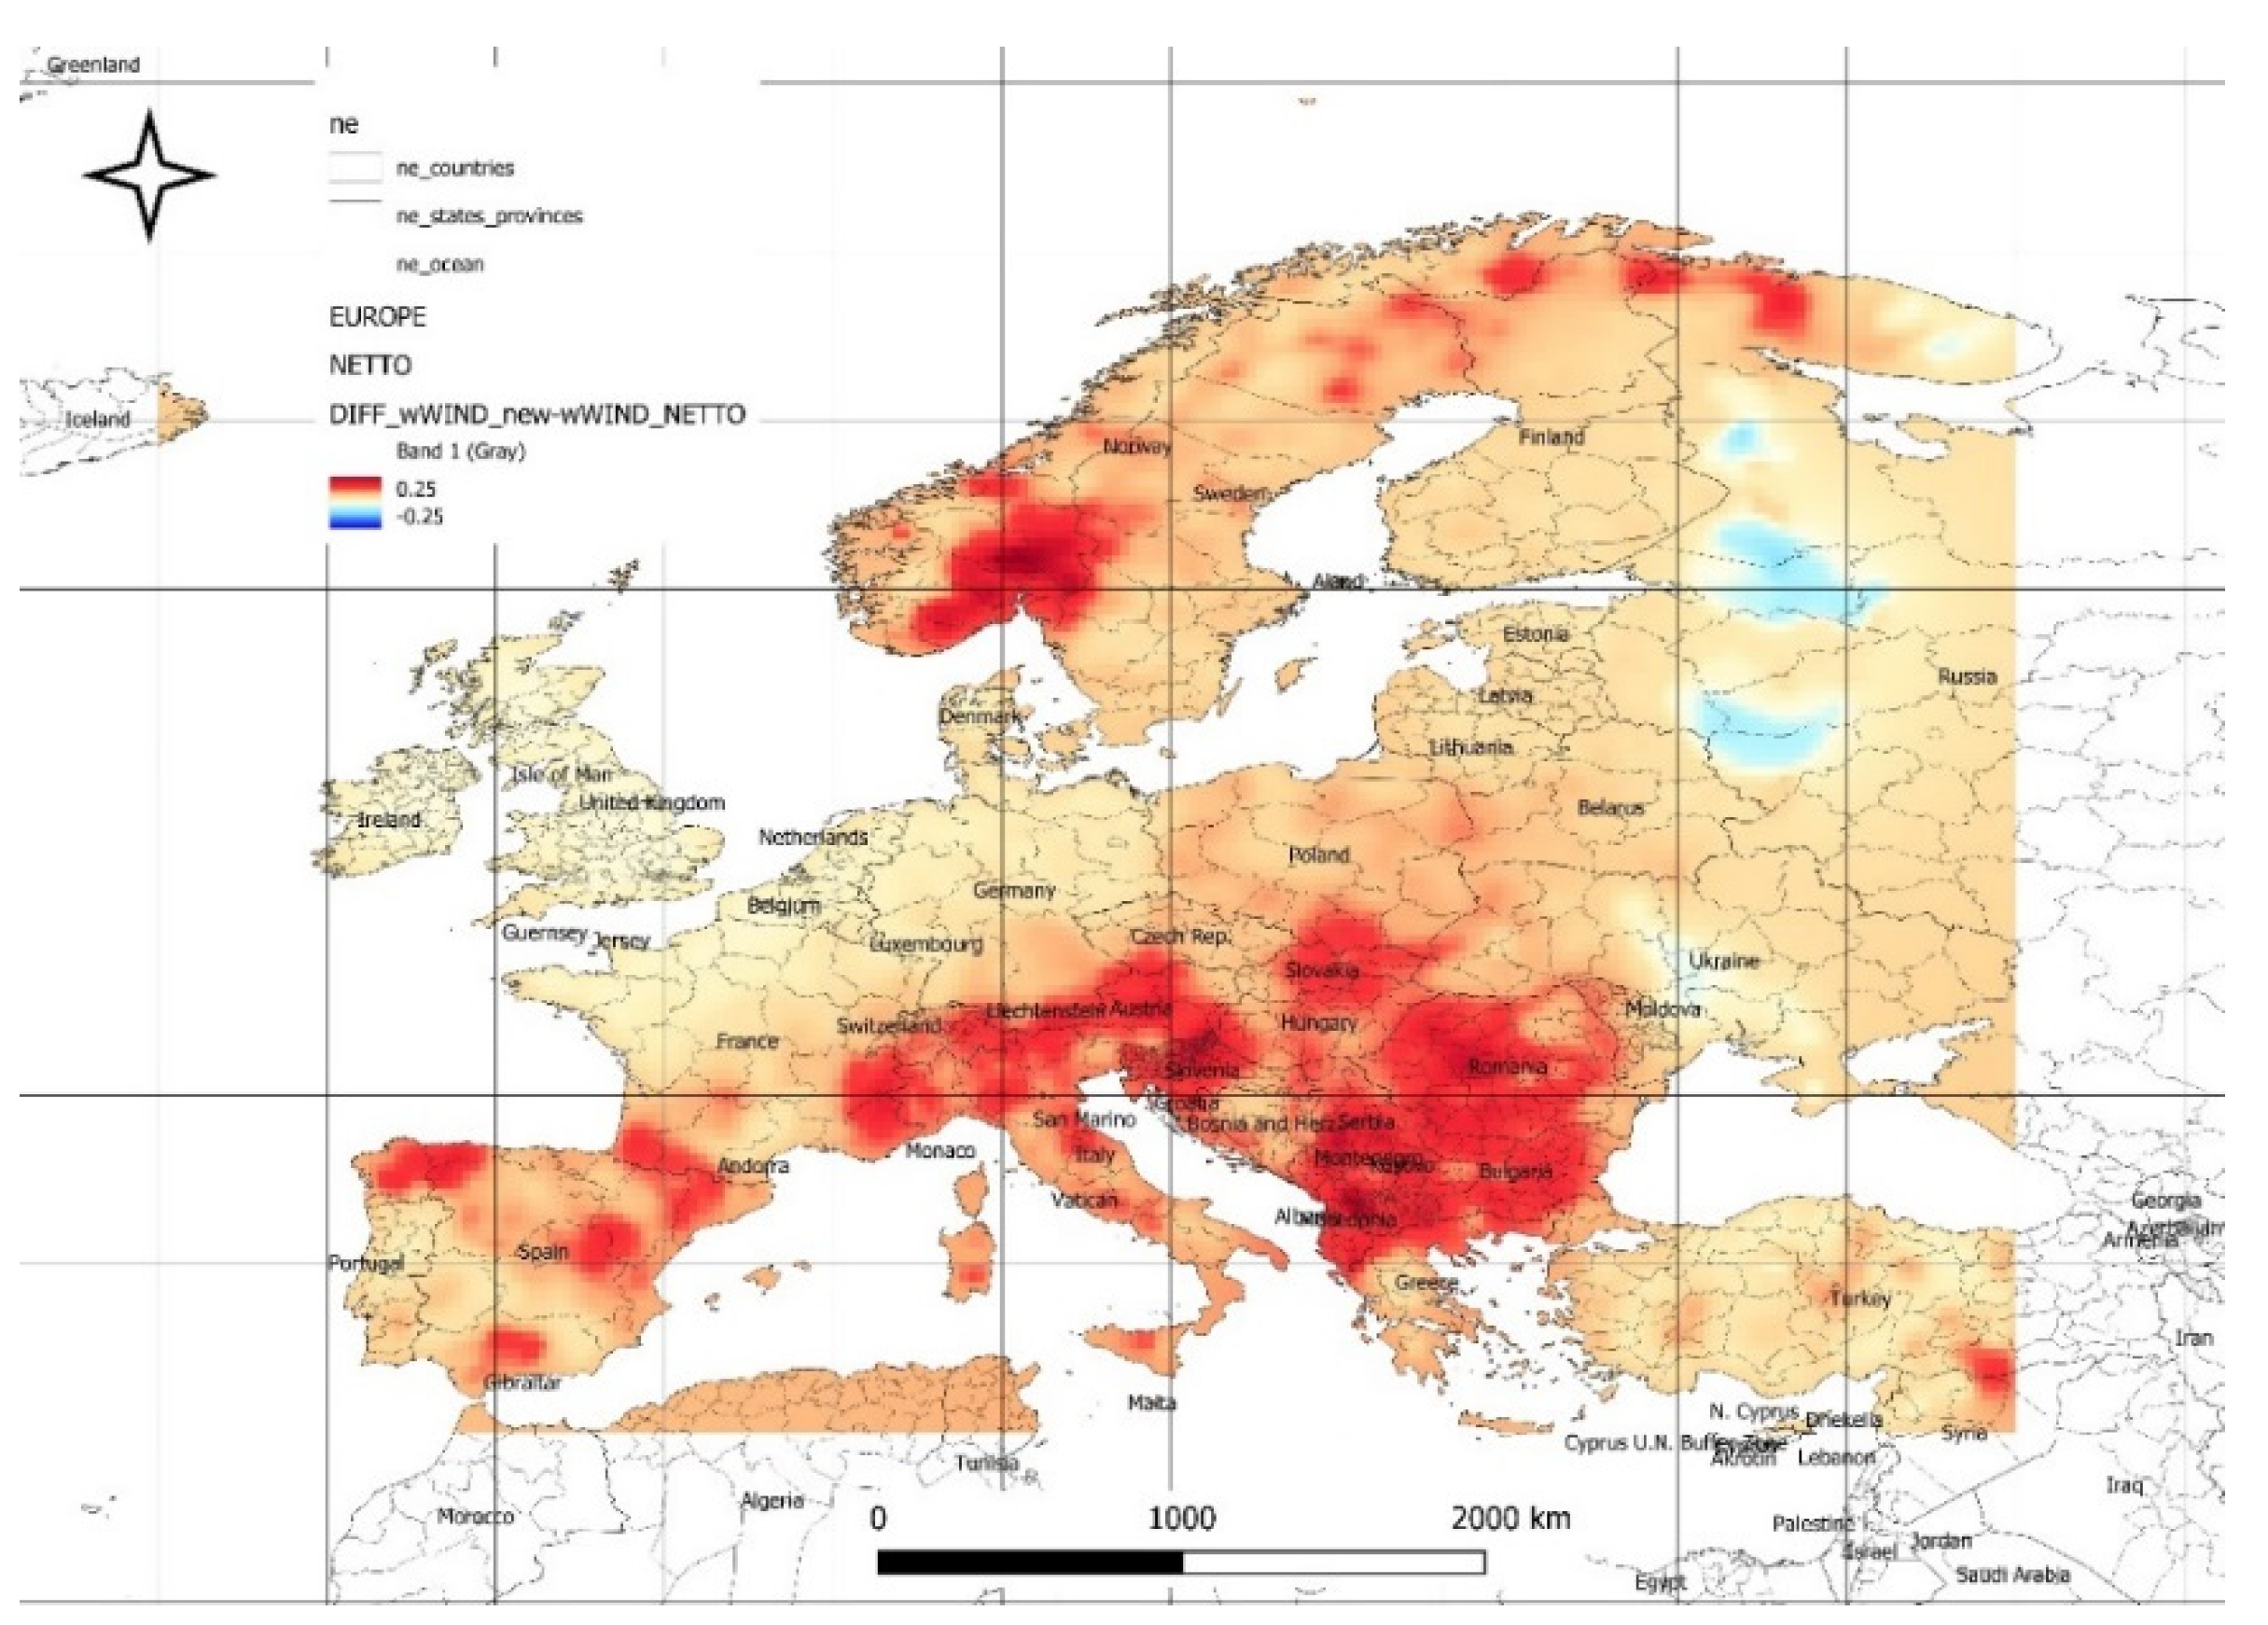
Figure 18.
Changes in EUR/day resulting from climate condition variations at the level of optimal expected net power density values for the minimum risk level.
Figure 18.
Changes in EUR/day resulting from climate condition variations at the level of optimal expected net power density values for the minimum risk level.
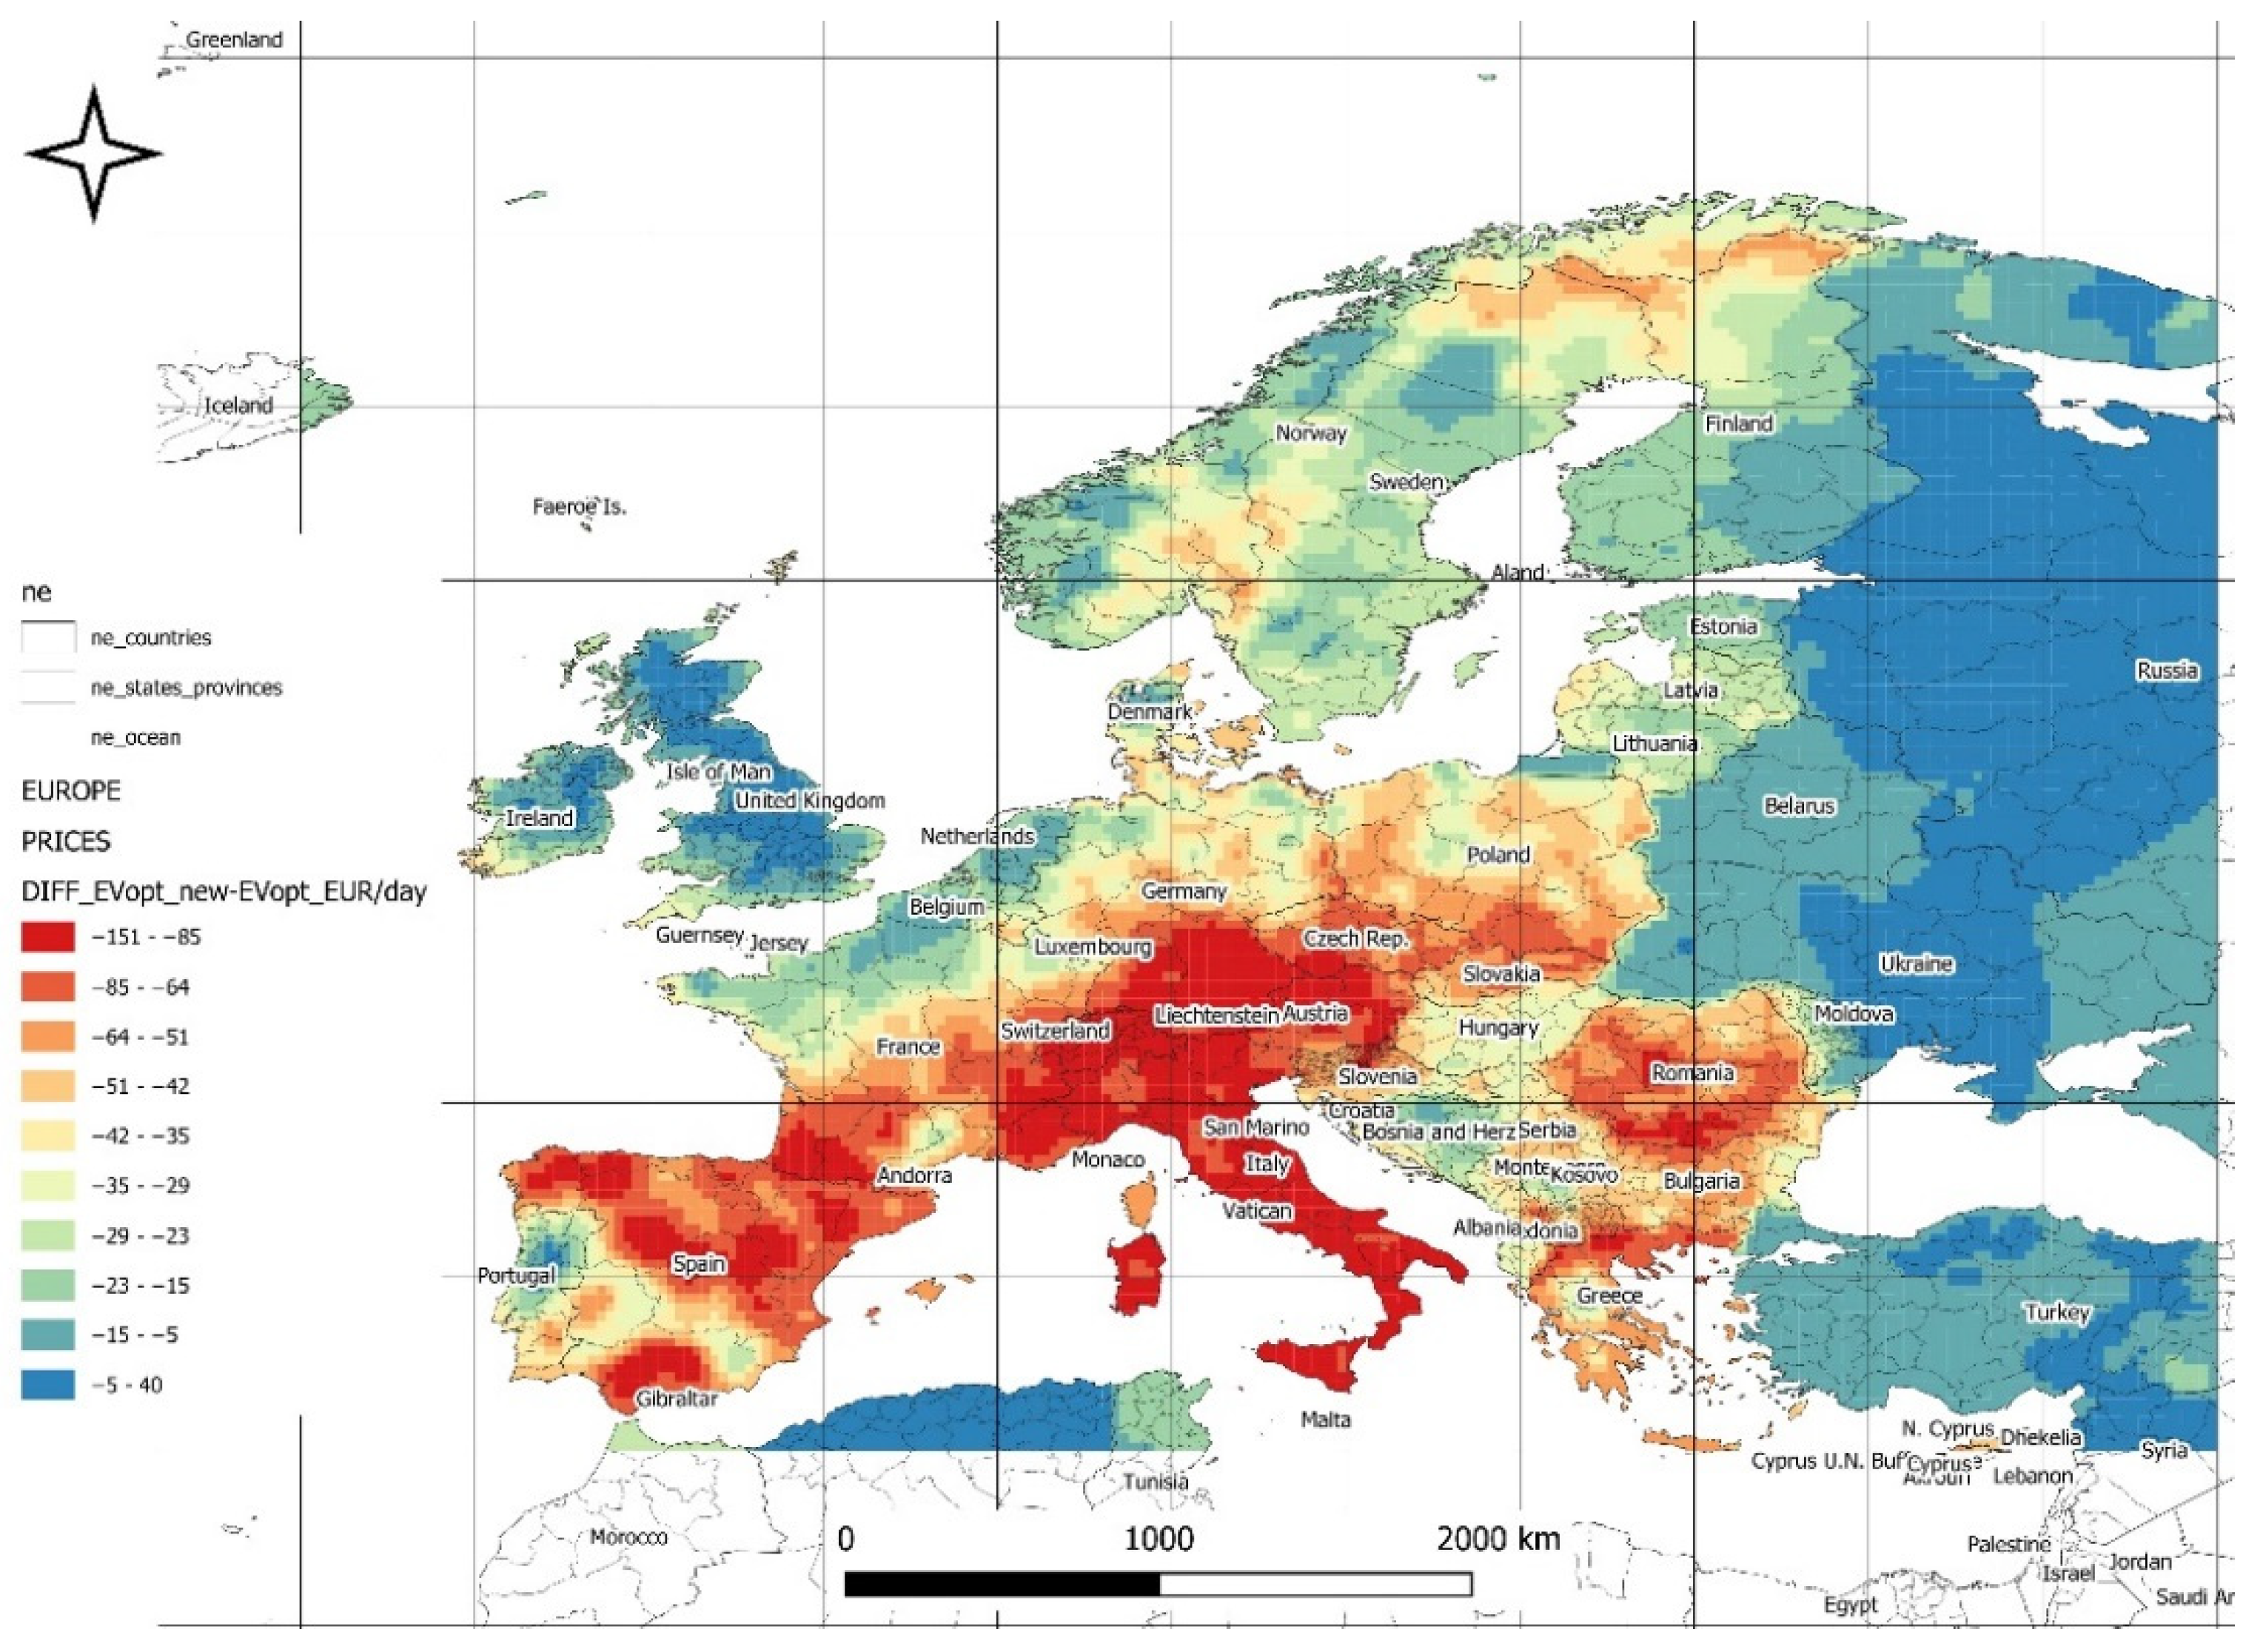
Figure 19.
Changes in EUR/day resulting from climate condition variations at the level of maximum expected net power density values.
Figure 19.
Changes in EUR/day resulting from climate condition variations at the level of maximum expected net power density values.
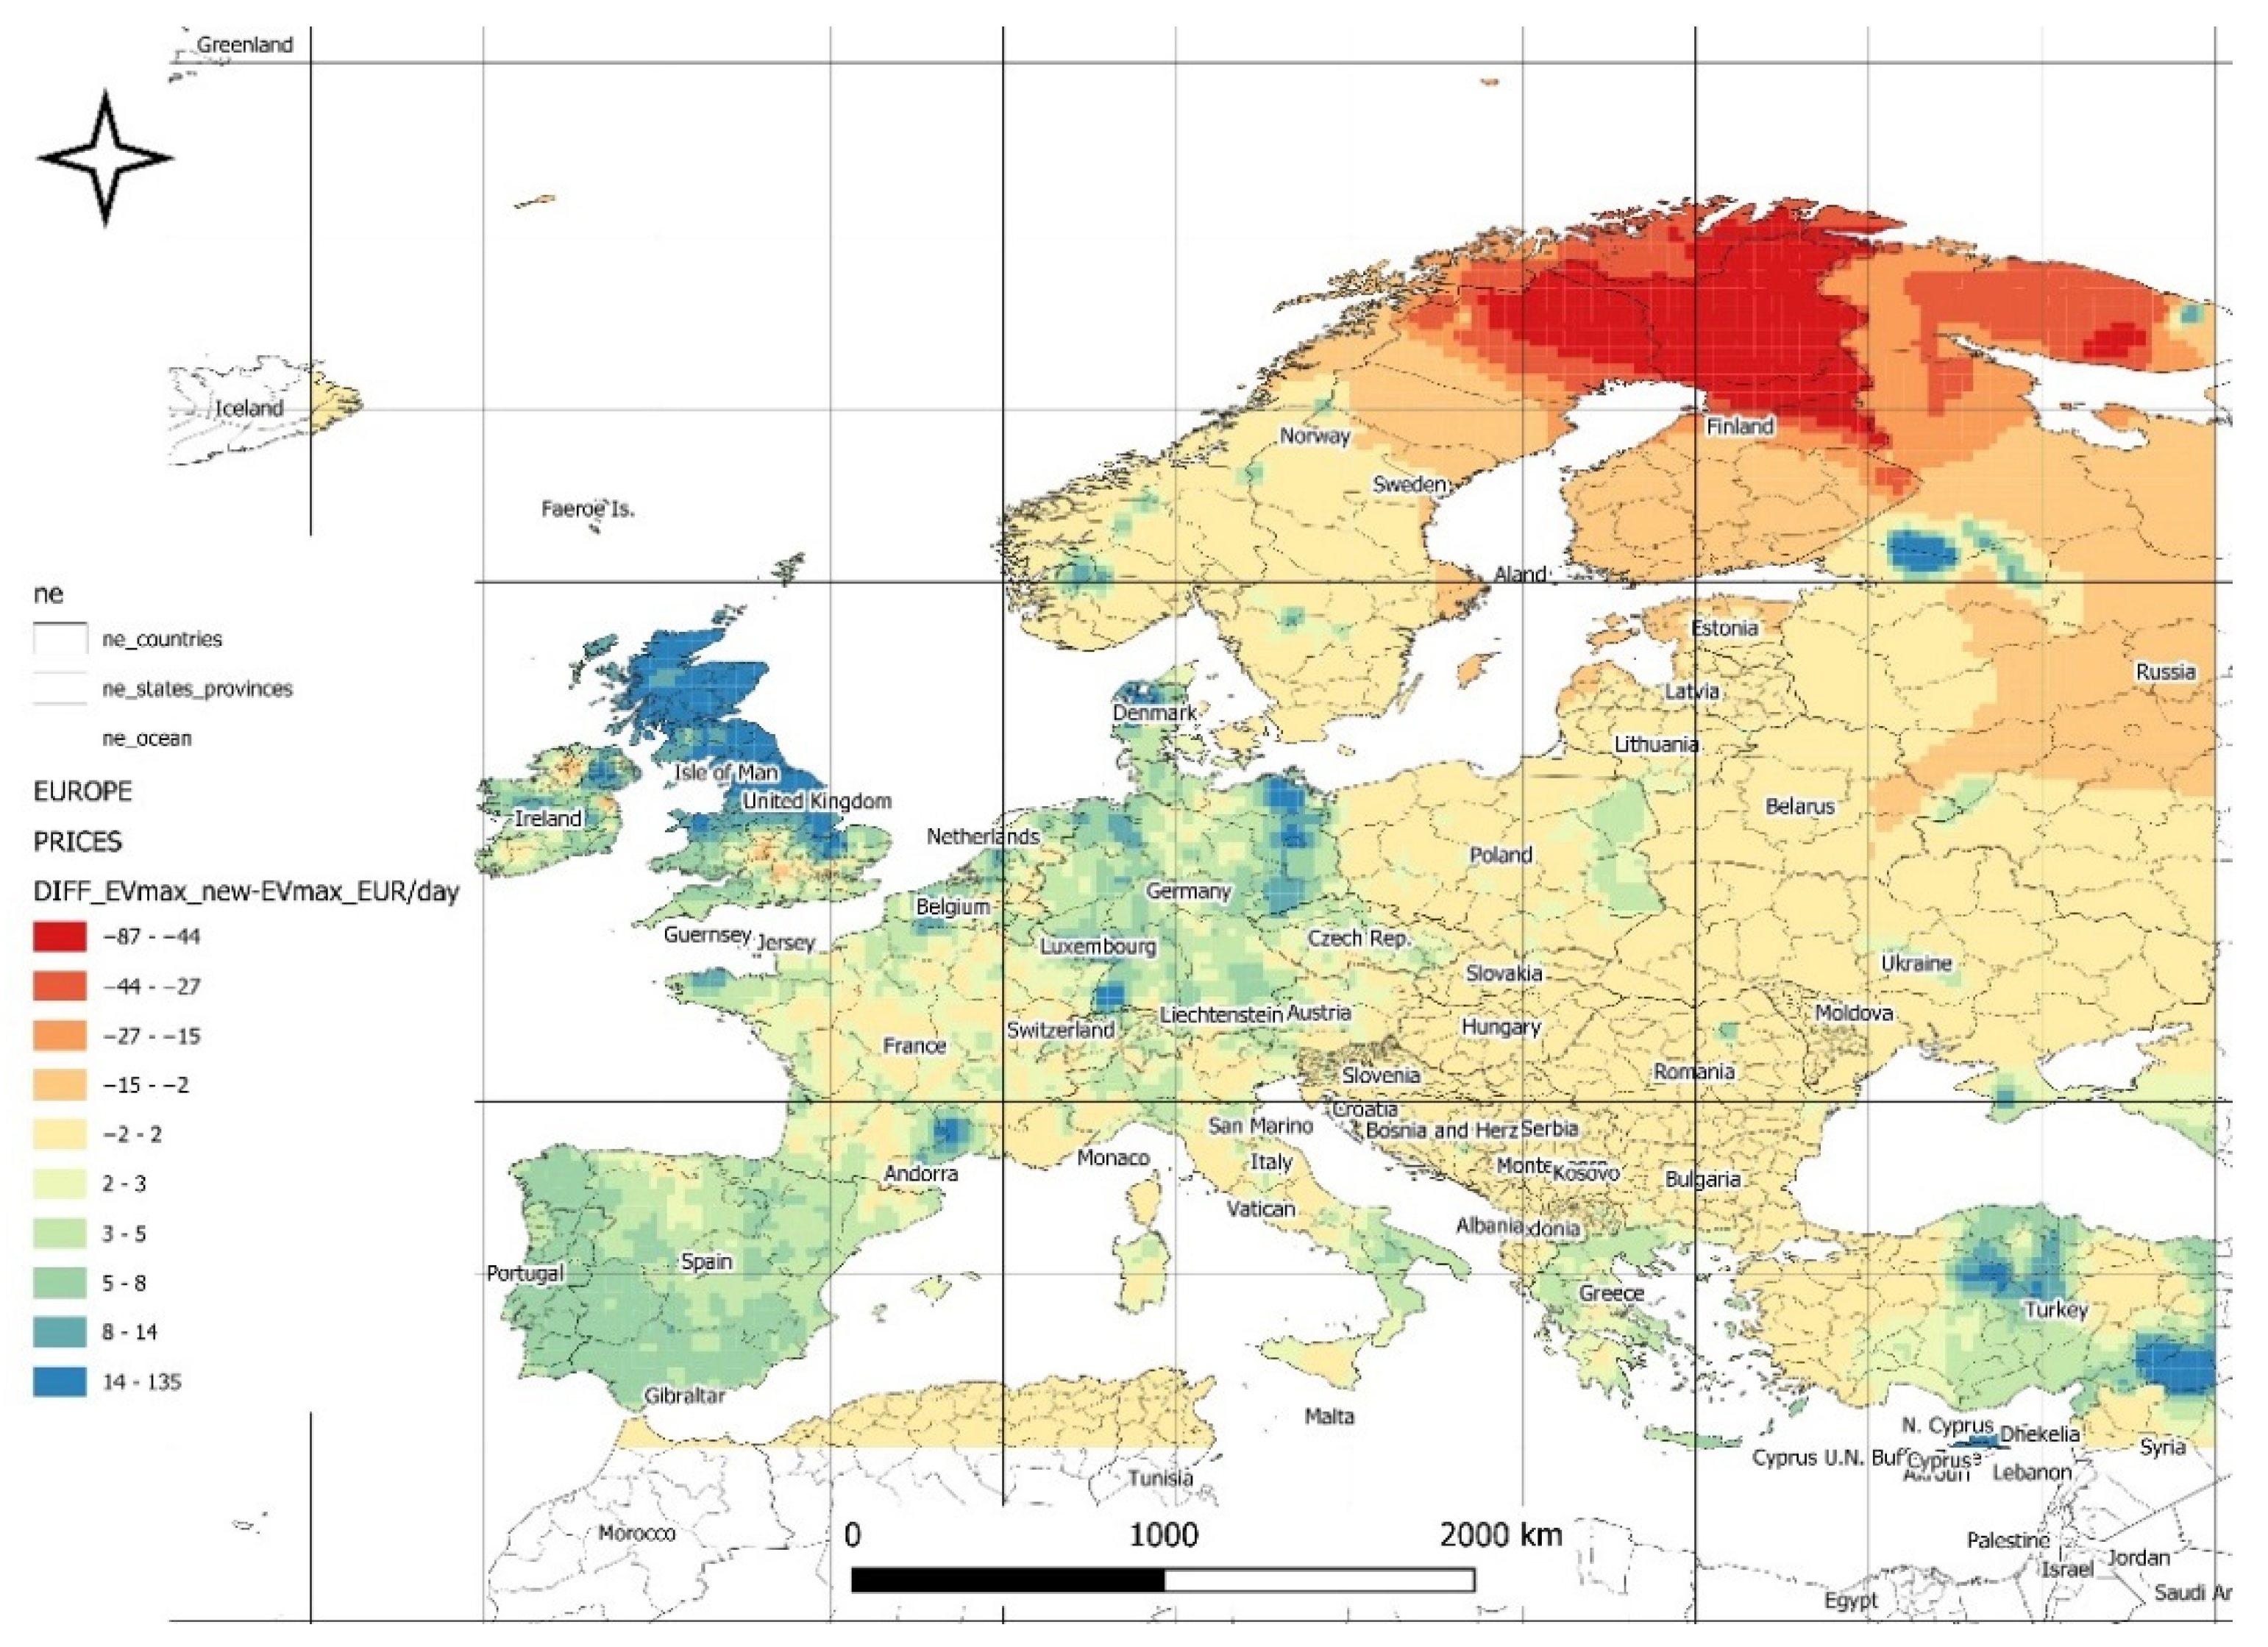

Table 1.
Analysis of Relationships and Their Implications for the Energy Mix in the Context of Climate Change.
Table 1.
Analysis of Relationships and Their Implications for the Energy Mix in the Context of Climate Change.
Disclaimer/Publisher’s Note: The statements, opinions and data contained in all publications are solely those of the individual author(s) and contributor(s) and not of MDPI and/or the editor(s). MDPI and/or the editor(s) disclaim responsibility for any injury to people or property resulting from any ideas, methods, instructions or products referred to in the content. |
© 2025 by the authors. Licensee MDPI, Basel, Switzerland. This article is an open access article distributed under the terms and conditions of the Creative Commons Attribution (CC BY) license (http://creativecommons.org/licenses/by/4.0/).
Copyright: This open access article is published under a Creative Commons CC BY 4.0 license, which permit the free download, distribution, and reuse, provided that the author and preprint are cited in any reuse.


