
Submitted:
03 January 2025
Posted:
04 January 2025
You are already at the latest version
Abstract
Mobile map landmark symbols are pivotal in conveying spatial semantics and enhancing users' perception of digital maps. This study employs a three-factor hybrid experimental design to investigate the effects of different landmark symbol types and their color associations with annotations on search performance using eye-tracking methods. Utilizing the Tobii X2-60 eye tracker, 40 participants engaged in a visual search task across three symbol types (icons, indexes, and symbols) and two color conditions (consistent and inconsistent). The study also examines the impact of gender on search performance. Results indicate that INDEX symbols, emphasizing landmarks' functions and key features, most effectively improve search accuracy and efficiency while demanding the least cognitive effort. In contrast, SYMBOL type characters, with clear semantics and minimal information, require less visual attention, facilitating faster preliminary processing. Additionally, cognitive style differences between genders affect these symbols' effectiveness in visual search. Careful selection of symbol types and color combinations can significantly enhance user interaction with mobile maps.
Keywords:
mobile map
; landmark symbols
; searching performance
; eye-tracking
Introduction
Mobile maps have become indispensable tools for modern navigation and spatial awareness, functioning as repositories of spatial knowledge and conduits for route information [1, 2]. Within this framework, map symbols play a pivotal role, serving as the critical link between the geographical representation on the map, the physical environment, and the user's cognitive spatial understanding [3]. Landmarks act as external reference points within the human-oriented psychospatial model. Extensive prior research has highlighted the crucial role that landmark information plays in enhancing the construction of cognitive maps, especially in unfamiliar environments where landmarks serve as primary orientation and navigation points due to their distinctive features [4-8].
While the significance of landmarks in spatial tasks such as wayfinding and navigation is widely acknowledged [9-12], the field of visual landmark symbol design in mobile maps remains underexplored [12]. Current research has primarily focused on the physical attributes of urban objects [10] or the visual contrasts within the environment [11]. Although various levels of abstraction and design guidelines for landmark visualization have been proposed [12], these approaches often lack empirical support, particularly when it comes to designing individual landmark symbols for mobile applications [13]. This gap is particularly evident on mobile screens, where limited screen real estate can lead to clutter if too much landmark information is displayed, potentially negatively impacting user experience and satisfaction [14].
In light of this, our research seeks to address the dearth of empirical studies on the visual design of landmark symbols in mobile maps. We focus on the color consistency between symbol types, landmark symbols, and text annotations, and examine their influence on search performance. By integrating semiotic theories with eye-tracking techniques, we aim to quantitatively assess the impact of these design elements on users' interactions with mobile maps.
This study aspires to provide innovative insights into optimizing mobile map design by meticulously analyzing how users interpret and engage with visual symbols. In doing so, we strive to bridge the gap between traditional cartographic practices and user-centric design, offering evidence-based recommendations to enhance the usability of mobile maps.
The Influence of map Landmark Symbols Types on Search Performance
Lynch's urban image theory believes that the comprehensive perception and im-pression of the city are established through the observation of the urban morphology[8]. The spatial cognition of urban morphology includes five basic elements, namely, path, edge, neighborhood, node and landmark[8]. And landmarks are important point-like markers and are the most basic and valuable spatial cognitive elements[4, 8]. In wayfinding behaviors, landmark navigation is the most commonly used navigation tool and plays a key role in daily spatial tasks[6, 15-19]. Numerous studies have shown the positive effects of landmark settings during wayfinding on navigation and cognitive representation of space[10, 20, 21]. Therefore, landmarks should be the focus of map information visualization.
However, empirical studies on the connotative meaning of map symbols are still relatively limited. The semantic differences of map symbols are often ignored in the applied research of cartography and semiotics[22]. As Keates et al. emphasized, although there are a large number of articles on cartographic strategies, few people analyze map symbols and the relationship between map symbols and semiotic theory in detail[23]. Therefore, the difference between the meaning of map symbols and the meaning they represent becomes blurred[1], and there are still different understandings on how visual variables are used to encode information[24].
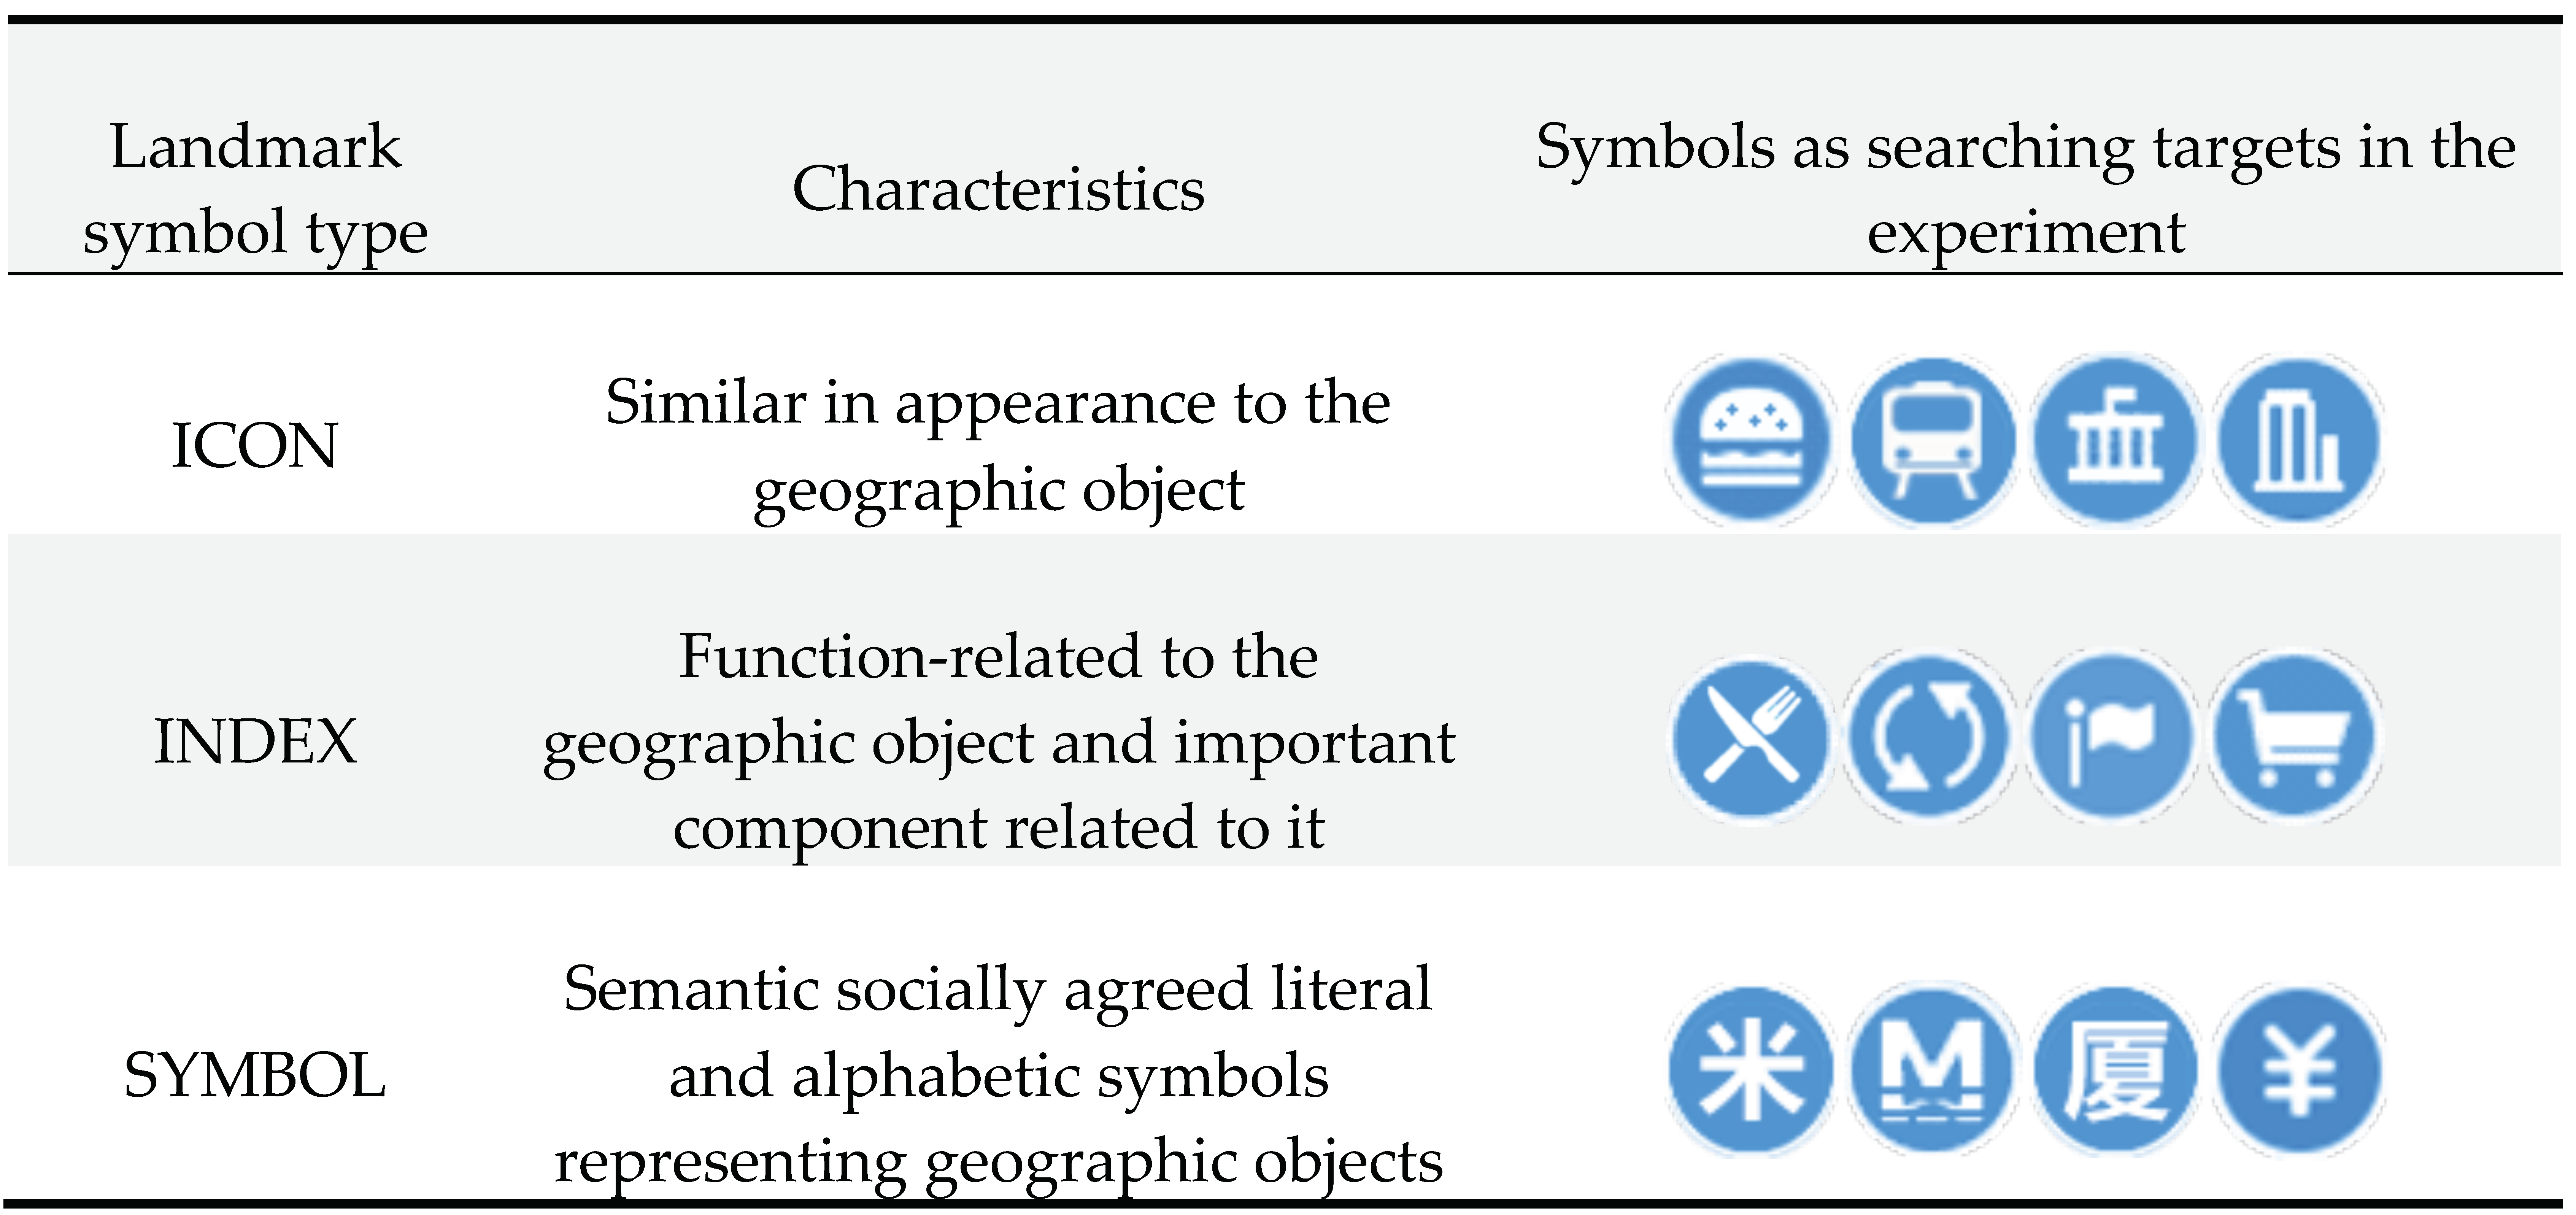
Regarding to the semantic indication of differences in symbol-function relationships, Peirce's taxonomy of symbols classifies symbols into three types: icon symbols (ICON), index symbols (INDEX), and symbols (SYMBOL)[25, 26], and their definitions are as follows.
Icon symbols indicate objects through similarity or analogy of symbols in physical properties, i.e., similarity in visual images[26].
Index symbols refer to objects by logical proximity (cause and effect) or functional association, i.e., by "a realistic correspondence"[26].
Symbolic relationships are based on social conventions and may vary due to local cultural influences.[26].
It is evident that the essence of creating these three types of symbols is the designer's transformation of specific goals or concepts into intuitive visual "symbols" in the form of metaphor, while users interpret these visual "symbols" through their own knowledge and experience to complete the cognition of the symbols[27, 28]. This difference in cognitive distance from the reference object is likely a key factor affecting user cognition[27]. To better understand the role of different symbol types in conveying map information, this study draws on Peirce's symbolic classification and hypothesizes that there is a significant effect of mobile map landmark symbol type on search performance. Due to the emphasis of INDEX symbols on the core functions or essential elements of the original object, aligning with human behavior and logical thinking, it is hypothesized that among the three types of symbols, INDEX symbols can more accurately establish a referential relationship.
- Hypothesis 1: The map landmark symbol type has a significant impact on the search performance.
The Influence of Map Vision on Search Performance
The basic language of maps is symbols, and the natural language used in maps is notation[29]. Map symbols and annotations are the two most important components of maps; map symbols are used to locate geographic information, while annotations describe the relevant properties of features and express geographic information qualitatively and quantitatively.[29]. The annotation has the functions of ex-pressing object relationship, describing object attributes, and identifying map objects, etc. It is generally expressed by texts, numbers or a combination of the two[30]. In us-ability evaluation, electronic map annotations design needs to evaluate some elements, namely, the font, font color, font size, font column, and font spacing of the annotations, as well as their coordination with symbols, colors, and other factors[31].
Among them, the color is a visual variable with selectivity[32]. Map color can help users to distinguish geographical locations and also sort locations[32]. The color design of landmarks plays a role in aiding selection. Williams[33] found that most eye fixations during the searching process falls on objects of the same color as the searching target. This shows that in the searching task, clutter mainly comes from similar colored symbols. This suggests that in the search task, clutter comes mainly from symbols of similar colors. The idea that visual clutter occurs primarily between symbols of similar size and color is supported by research on instant visual memory. [34]. On the basis of Bertin’s systematic exposition of the color variables of map symbols in graphic semiotics, many scholars have carried out empirical to explore the influence of symbol color on map reading, such as the hue of color[33, 35, 36], brightness of color[36], color relationship with background[37, 38]. However, as a whole of landmark in-formation transmission, the different color relationships between symbols and their annotations also affect the user's overall perception of landmarks on one map. There is also no more systematic research on how the different color relationships between symbols and their annotations affects the reading of maps, so the following hypothesis is proposed in this study.
- Hypothesis 2: Consistent map landmark symbols and annotations are more likely to improve search performance than inconsistent map landmark symbols and annotations.
The Influence of Gender on Search Performance
Individual cognitive difference is an important factor in the field of spatial cognition and cartography, and gender difference is an important dimension of individual cognitive difference[39, 40]. Research on spatial cognition shows that men perform better in quantitative problem solving and spatial ability tasks, while women perform better in language tasks[40]. The advantages of men in visual spatial ability include drawing figures from models or memories, reasoning spatial relationships between objects, and reading and following maps; The spatial advantages of women lie in object location memory[41] and finding roads with landmarks[42]. There are also differences between men and women in processing accuracy, processing methods and processing strategies[43, 44]. The results show that men are more sensitive to spatial relationships, while women are more sensitive to element annotation, shape, location and spatial area[45].
At the same time, a large number of cognitive psychology studies have also proved that men and women have cognitive differences in cognitive styles and mental models[46-48]. Relative to females, males have a lower awareness of the presence of risk in unfamiliar things, while females perceive unfamiliar things as riskier[47, 48]. Women have strong simulation ability and perceptual thinking, so women are more inclined to perceive certain fixed patterns and natural objects than men[46]. And different gender groups also have different abilities in visual perception, speech, situational memory, face and other image recognition[49-51].Based on cognitive and behavioral evidence, it is suggested that men may prefer logical icons such as INDEX symbols in visual searches, while women may prefer symbolic icons such as ICON symbols in visual searches.
This study attempts to explore whether there are significant differences in the search performance of map landmarks among participants of different genders, and whether different symbol types affect the map landmark search process of participants of different genders. Based on this, the following assumptions are pro-posed:
- Hypothesis 3: There is a significant gender difference in map landmark searching performance, and the interaction effect between gender and symbol type on map landmark searching performance is significant.
Eye movement Research in Cartography
Eye tracking research is an important part of modern cartography. Spatial information is largely acquired through vision. The study of visual attention and its relationship with cognitive processes has been of interest to many research efforts for many years, in spatial cognition. Recent technological developments have led to the growing popularity of eye tracking methods for investigating relevant research questions: spatial cognition, geographic information science (GIScience), and cartography. Since maps are visual media, eye tracking seems obvious, and an appropriate approach to support cartographers in the design process. Early work on the use of eye tracking in cartography dates back to the 1970s and 1980s [71]. In the past ten years, the eye movement research of cartography has made many achievements in both theoretical research and practical application. At present, cartographic eye movement research can be divided into two different types: usability engineering (UE) oriented and psychology oriented[52]. UE oriented research mainly focuses on real map design to evaluate users' performance (effectiveness and efficiency) in using real maps and their satisfaction with tasks[53, 54]. Psychologically oriented research aims to achieve maximum experimental control by manipulating visual variable stimuli, so it can explain the reasons for experimental results[52]. For example, eye movement experiments were used to evaluate the perception difference between 2D and 3D terrain visualization[55], the influence of symbol style types on their learnability, accessibility and memorization of map information[56], and the influence of color distance and font size on map readability[57]. These studies provide strong support for the quantitative and empirical research of map visual cognition.
Methods and Experiments
Experiment Design
A three-factor mixed experimental design was used in this study, 3 (landmark symbol types: icon, index, symbol) × 2 (gender: male, female) × 2 (consistency of symbol and text notation color: consistent, inconsistent), where symbol type was a within-subject variable and gender and color consistency of symbol and text notation were between-subject variables.
The experiment adopted visual search paradigm. Visual search is the ability to find a specific target from many things by observing and using visual information, and it is one of the key abilities for the survival of humans and animals. The study of the process and cognitive mechanism of visual search is helpful to discover the factors that affect the efficiency of search, so as to improve the accuracy and speed of search. In the experiment, the subjects were required to find the location of the landmark in the designated map interface according to the text of "landmark type name", and clicked the symbol with the mouse. The target area of interest (AOI) in this study delineated the area around the target landmark symbol to include all fixation points. Based on expert interviews, we determined that the correctness of the search task (validity) and the time to first mouse click (efficiency) were measured as the dependent variables of behavioral indicators, and the three eye movement parameters of time to first fix, duration and count were analyzed as dependent variables. The specific meanings of dependent variable indica-tors are shown in Table 1. At the same time, we also analyzed some intuitive conclusions through eye movement heat map.
Participants
The experiment recruited 40 participants from China University of Geosciences (Wuhan). Due to the prerequisite that participants must be proficient in using mobile maps, the age range was set between 20 and 30 years old. Additionally, in order to investigate the impact of gender on search results as mentioned in hypothesis 3, the participants were evenly divided with 20 males and 20 females. All participants claimed to have normal or corrected visual acuity and have 2 to 3 years of mobile map use experience. All participants voluntarily took part in the experiment, signed an informed consent form, and received a compensation of 10 Chinese yuan for their time spent in the experiment.
Experimental Equipment
The TobiiX2-60 eye-tracking device and a personal computer connected to it were used in this study to experiment. The sampling rate is 60 Hz, accuracy 0.4°, and precision 0.2°. It mainly uses an infrared capture device to collect data from both eyes, and its built-in camera can capture the subject's head position in real-time, and the motion compensation algorithm can automatically compensate for the error caused by the subject's head motion. This allows experiments to be conducted in a more natural environment without the need for head fixation, thus ensuring the validity of the results. The experimental material was presented on a display with a resolution of 1366 x 768 pixels. Reaction time and eye movements of subjects performing visual searching tasks were recorded using the oculography program. Eye movement data were exported and statistically analyzed using Tobii Studio software.
Experimental MaterialsAcquisition of landmark Symbol Materials
To ensure the reliability of the experimental results, this study extensively collected symbol styles designed by domestic mobile map service operators such as Baidu and Gaode as experimental materials (as shown in Table 2). The research focuses on commonly used life scenario categories, including residential environment, work environment, educational environment, shopping and entertainment environment, transportation environment, public service environment, medical and health environment, cultural and religious environment, etc., to obtain map landmark point symbols. A total of 46 commonly used symbols were collected. To maintain consistency in the experimental materials, the symbol size was standardized to 22×22 pixels with a resolution of 300 dpi.
We invited five design experts (three design teachers from the School of Art and Communication of China University of Geosciences, one drawing teacher from the School of Information Engineering, and one art design teacher from Hubei University of Fine Arts) to conduct in-depth exploration, lay a solid theoretical foundation for Peirce's semiotic theoretical framework and application, and carried out in-depth and detailed discussions based on the characteristics of icons. According to Pierce's semiotics theory, the 46 map landmarks symbols in the original data can be classified into three categories: ICON, INDEX, and SYMBOL.
In order to test the cognitive familiarity of landmark symbol materials and maintain the balance between materials, 42 college students were tested in the form of questionnaires from the aspects of cultural influence of landmark symbols, the function of activity centers, and the characteristics of urban locations, and the original materials were selected according to the test results. Forty-two college students (21 females and 21 males) completed the questionnaire in-dependently (there was no crossover with the subjects in the formal experiment). In the questionnaire, we showed the pictures of 46 symbols, and asked the subjects to choose the corresponding meanings of symbols from 10 options.
To improve experimental accuracy, icons with good symbol recognition efficiency and clear semantics were further selected through importance ranking based on questionnaire results. Ultimately, 12 samples were chosen, with 4 symbols from each type.The results of symbol type classification are shown in Table 2.
To avoid the influence of the emotional effect and familiarity of "landmark type name" on the search task, the common words in daily life were screened according to the meaning and context of the words, the frequency and scope of the words, and the choice of emotions, purposes and styles expressed. The "landmark type names" used for the search in the experiment were all selected from common words used in daily life [58]. The chi-square test showed that χ2=4.198, P=0.123, and P >0.05 were obtained, indicating that the familiarity of the selected symbols was consistent.
In order to test the effectiveness of symbol typing, we invited a jury of 12 user interface designers and interaction designers. The selection criteria are 3-5 years of work experience and the age of 28-35 years. They scored the above twelve iconic symbols according to the semiotic concept and design practice experience, and the results were chi-square test, χ2=198.390, P<0.001. The results show that there are significant differences between the three types of grouping, and the classification of landmark symbol types is effective.
Experimental Map Design
To control the level of complexity, the same simplified static map was used as the base map for each experimental material, and the consistency requirements were made in terms of map use, terrain conditions, accuracy requirements, production budget, use environment, and scale, with a size of 776*436 pixels and a resolution of 300 dpi. Each map contained 24 dotted symbols, of which only one was the searching target landmark symbol and 23 were the interference symbols. In this experiment, the target markers were randomly distributed around the periphery of the frame, avoiding placement at the center of the page. Since each type of symbol stimulus was presented four times in the experiment, this study designed four groups of interference symbols (including three types, 23 in each group), so that the four target search symbols of each type were matched with the four groups of interference symbols respectively, so as to ensure that the complexity of each type of symbol matching base map was consistent.
According to the statistics of mobile map colors of existing mobile phones, blue is the color of choice for the most map signs, so the icon color is blue (RGB, 0,102,204), and the text note color is blue (RGB, 0,102,204) or black (RGB, 102,102,102), as shown in Figure 2. A total of 24 experimental maps are designed, and the experimental materials were pseudo-randomly presented to eliminate the location and order effect, as shown in Figure 1.
Experimental Procedure
Researchers first introduced the participants to the objectives, procedures, and precautions of the experiment (e.g., participants were advised not to move their heads excessively during the experiment). After calibrating and adjusting the eye-tracking device, participants began to familiarize themselves with the experimental procedures and completed a practice task. The actual experiment commenced. Participants were prompted to read and memorize generic landmark type names, such as "subway station" and "shopping mall". (It should be noted that these landmark type names are generic descriptors and do not represent specific subway station or mall names. Hence, there would be no overlap with specific names in the subsequent map. For instance, if the landmark type name was "subway station", the target symbol on the following map might correspond to a name like "Hancheng East Road".) After memorization, participants would click to proceed to a visual adjustment page. A crosshair icon would appear at the center of this page for 0.5 seconds, serving as a visual cue to help participants adapt to the expected response speed. Finally, participants would be directed to a map where they would identify and click on symbols representing the memorized landmarks. After completing one task, the screen would transition to the next generic landmark type name, and the search task would be repeated. This continued until all 12 search tasks were completed.
Results
After collecting all the data, the researchers conducted validity tests on the experimental results. They distributed questionnaires to the 40 participants involved in the experiment, recorded and examined them to ensure the reliability of the results. In terms of map symbol memory, reaction speed, and eye movement aggregation, the experimental results of all 40 participants were valid. Statistical Product and Service Solutions (SPSS) Version 20.0 was used to process all experimental data. Repeat-ed measures ANOVA was used to process the quantized data. And we also analyzed the subjects' eye movement heat map.
Repeated measures ANOVA is a design of experiments technique that performs repeated measures of the same dependent variable. This method belongs to the category of ANOVA [59].When the number of repeated measures of the pre- and post-measurement design is 3 or more, this method is usually used to explore the relationship between the map symbol of the independent variable and the experimenter's reaction speed of the dependent variable [59].The results of ANOVA include mean (M), standard deviation (SD), standard error (SE), F-statistic (F), and P-value (P). The difference is significant at the level of 0.05. The threshold level is set to a P-value less than 0.05. [59]. If the main effect of landmark symbol type or gender is significant in the analysis of variance, the differences among each group are further analyzed by post-hoc. If there is a significant interaction effect between landmark symbol type and gender, simple effect tests are further conducted.
Symbol Validity
This study examined the overall validity of three landmark symbol types based on whether the subjects clicked on the target symbols correctly, and used repeated-measures ANOVA on the correctness of subjects' searching targets, results shown in Table 3.
The main effect of map landmark symbol type is significant (F (2,70) =7.800, p=0.001). The results of paired comparison and analysis of the accuracy of landmark symbol types show that the correctness rates of searching ICON and INDEX symbols are significantly higher than that of SYMBOL P<0.05). In general, INDEX symbols is the most effective and SYMBOL is the worst effective in the searching tasks. Gender and consistency of symbol and text notation color show no significant difference in searching correctness (F (2,70) =0.894, P=0.414).
Searching Efficiency
Searching efficiency is measured using the time to first mouse click during searching tasks, i.e., the time from the presentation of the experimental material to the first mouse click to identify the target. The results of the experiment were performed using repeated measures ANOVA, and the first mouse click showed a significant difference in reaction time, as shown in Table 4.
The main effect of landmark symbol type is significant (F (2,70) =9.335,P=0.001). The interaction effect of landmark symbol type and gender is significant (F (2,70) =5.654,P=0.009). Results of paired comparison of landmark symbol type analysis on time to first mouse click is shown in Table 5. The time to first mouse clicks for ICON (M=16.1359, SD=7.642) and SYMBOL (M=15.088, SD=9.754) differs significantly (P<0.05) from INDEX (M=9.7539, SD=3.721).
Interaction Effect Between Landmark Types and Gender
The results of searching efficiency (refer to Figure 3) show a significant interaction effect between landmark symbol type and gender (F (2,70) =5.654,P=0.009). A simple effect test was done to investigate at what level the two factors differed. The results of the test shows that for SYMBOL, the first mouse click time is significantly higher for males (M=11.850, SD=6.990) than for females (M=18.866, SD=11.274) (P<0.05). For ICON and INDEX symbols, there is no significant difference in searching efficiency between genders.
Since the reaction time in the previous article includes visual access time, decision-making judgment time and key reaction time, these times are negligible.[60]. The reaction time cannot accurately determine the differences in perception of the three landmarks by the participants. To further investigate the reasons for the above phenomenon, this study analyzed the first gaze time, gaze duration, and gaze frequency. All the three eye-tracking parameters could reflect the allocation of visual attention at different stages of the experiment. The duration of the freeze frame within the region of interest is a measure of the difficulty of symbolic cognition and can be used to describe the amount of resources invested in the overall cognitive process.
Firstly, descriptive statistics were conducted for the initial fixation time, fixed intervals, and fixed counts corresponding to the three landmark symbols. The results are shown in Table 6.
The symbols in order of the first fixation time from longest to shortest are: ICON (M=0.212, SD=0.131) >INDEX (M=0.185, SD=0.090) > SYMBOL (M=0.158, SD=0.074). The symbols in order of fixation duration from longest to shortest are: ICON (M=1.365, SD=0.717) > SYMBOL (M=1.163, SD=0.906) >INDEX (M=1.013, SD=0.670). The number of fixation counts using ICON (M=5.879, SD=2.157) is highest, followed by SYMBOL (M=5.130, SD=2.742).
Repeated measures ANOVA was used for the first fixation time, fixation duration and fixation counts, and the results are shown in Table 7. The results indicate that the type of landmark symbol has a significant main effect on all eye movement parameters (P<0.05). A main effect of gender on the fixation counts is significant. There is a significant interaction effect of landmark symbol type*gender on fixation duration and fixation counts. Due to the significant main effect of landmark symbol type, pairwise comparisons of the three symbol types were performed and the results are shown in Table 8.
ICON symbols and SYMBOL show significant differences in the first fixation time. In terms of fixation duration and fixation counts, INDEX symbols shows a significant difference with ICON and SYMBOL, and there is no significant difference between ICON symbols and SYMBOL. The fixation counts are significantly lower for INDEX and SYMBOL than for ICON symbols.
The interaction between landmark symbol type and gender is significant for fixation duration (F (2, 70) =10.778, P=0.000, P<0.05) and fixation counts (F (2, 70) =6.748, P=0.002, P<0.05), and to investigate at what level the two factors differed, a simple effects test was used, as the results shown in Table 9 and Table 10.
Figure 5.
Mean value diagram of Symbol type and fixation duration.
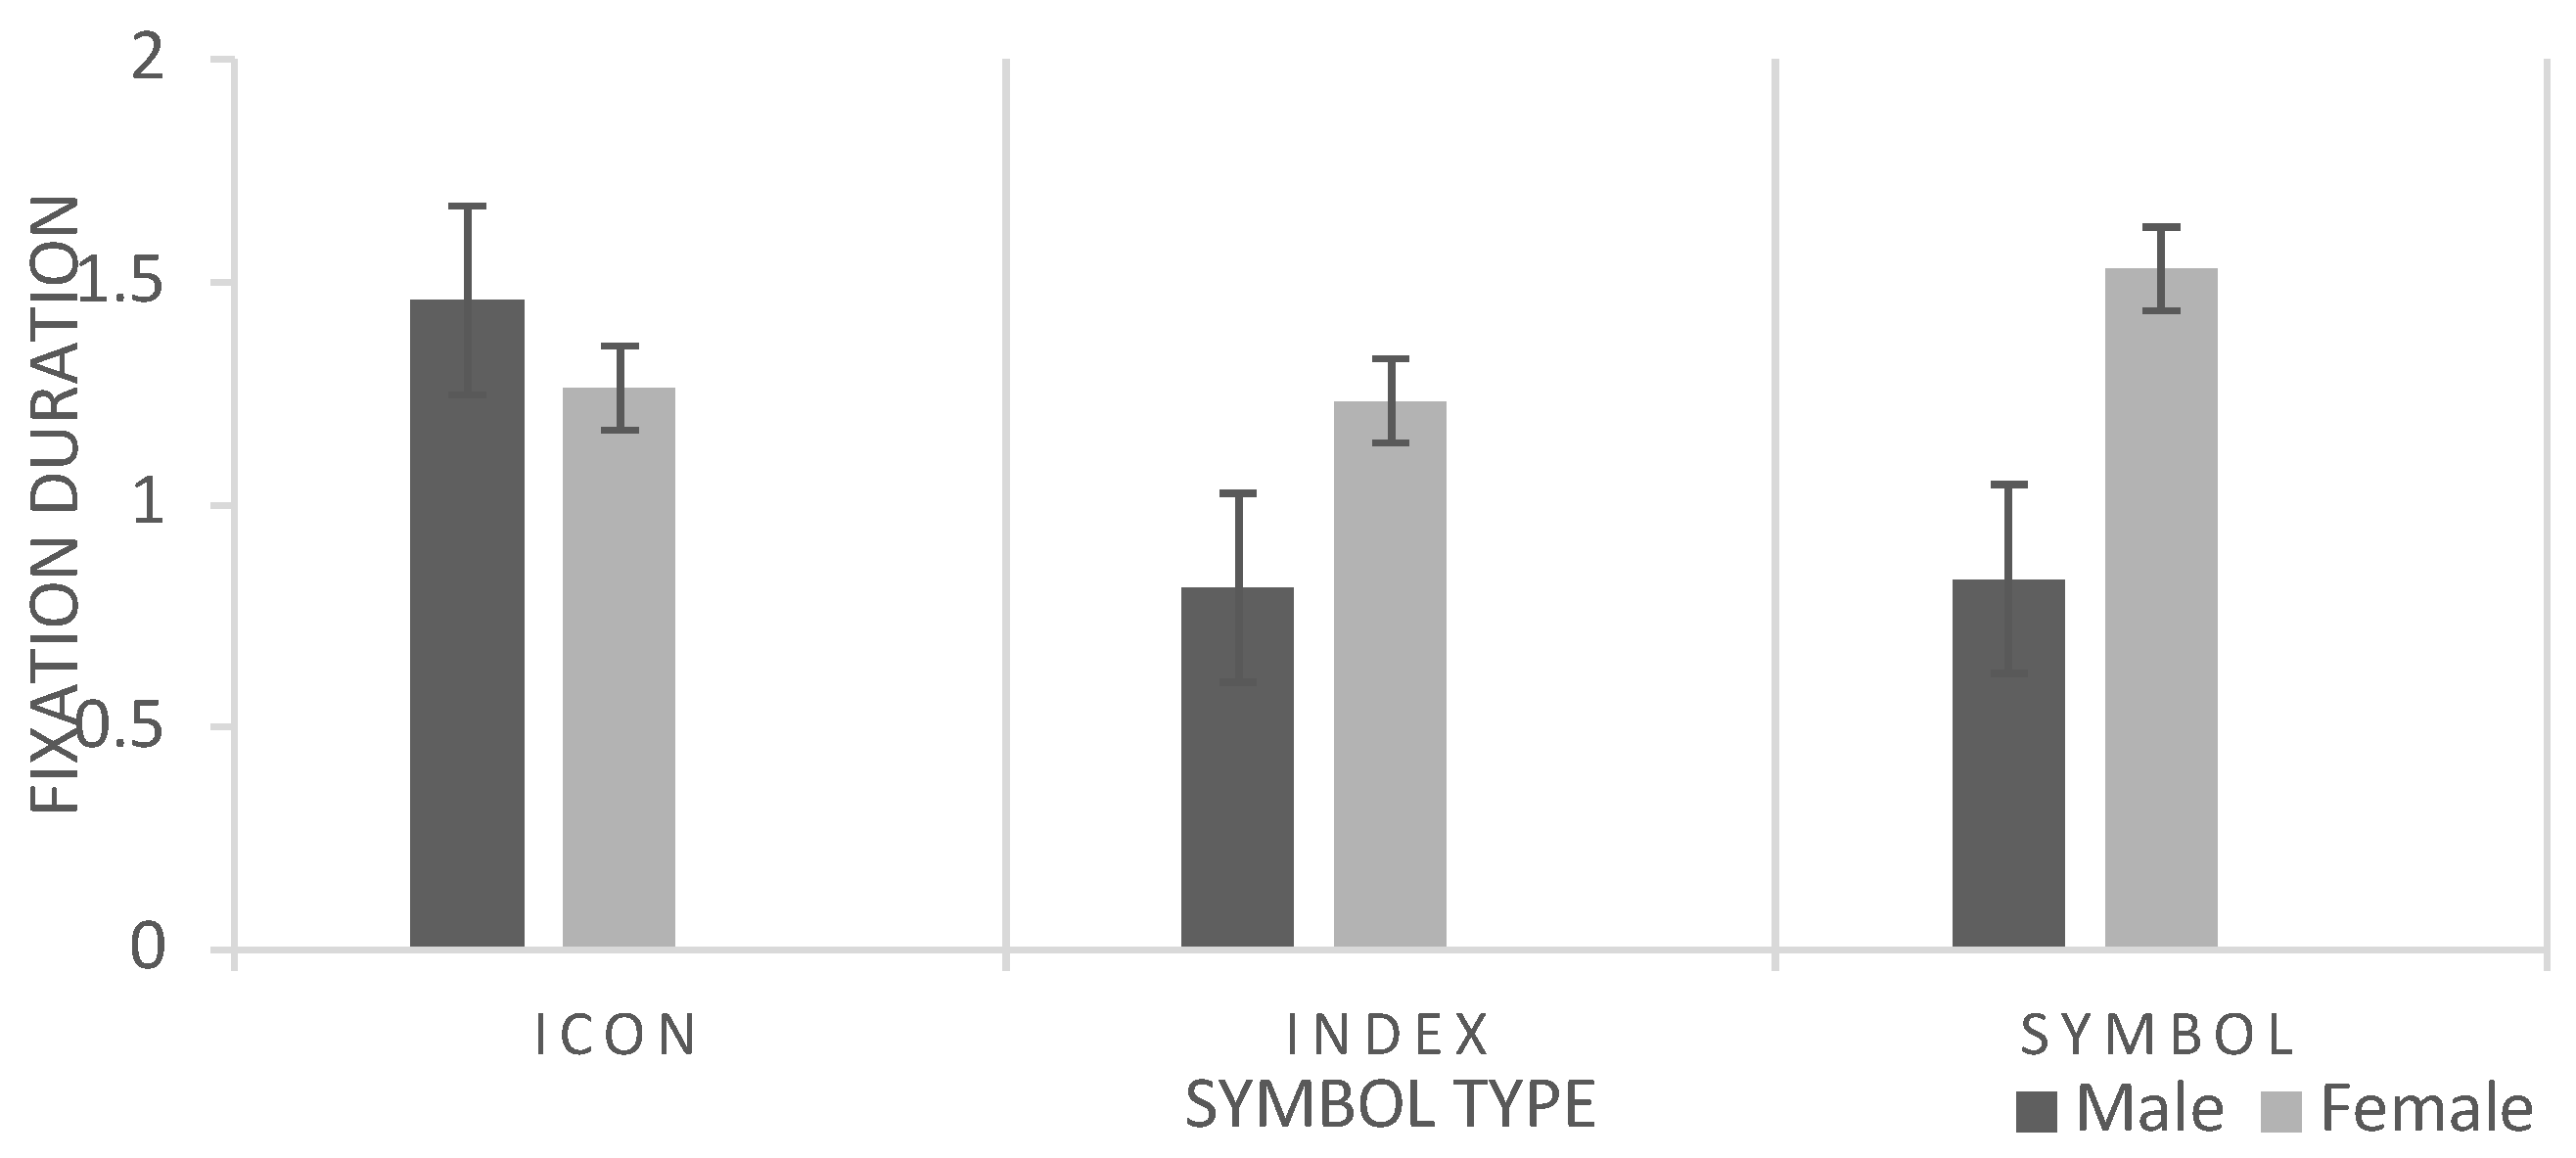
For male subjects, the fixation counts and fixation duration of ICON symbols show a significant difference with INDEX symbols and SYMBOL, and there is no significant difference between INDEX symbols and SYMBOL. For female subjects, there is no significant difference in the fixation counts among the three types of symbols. ICON symbols shows no significant difference in fixation duration with INDEX symbols and SYMBOL, and there is a significant difference in fixation duration between INDEX symbols and SYMBOL for females.
For ICON symbols, there is no significant difference in the fixation duration and fixation counts between male and female subjects. For SYMBOL, there is a significant difference in fixation duration and fixation counts between male and female subjects, and the fixation counts are significantly lower for male subjects than for females. For INDEX symbols, genders show no significant difference in the fixation duration, but a significant difference in the fixation counts. The fixation counts are significantly lower for male subjects than for female subjects.
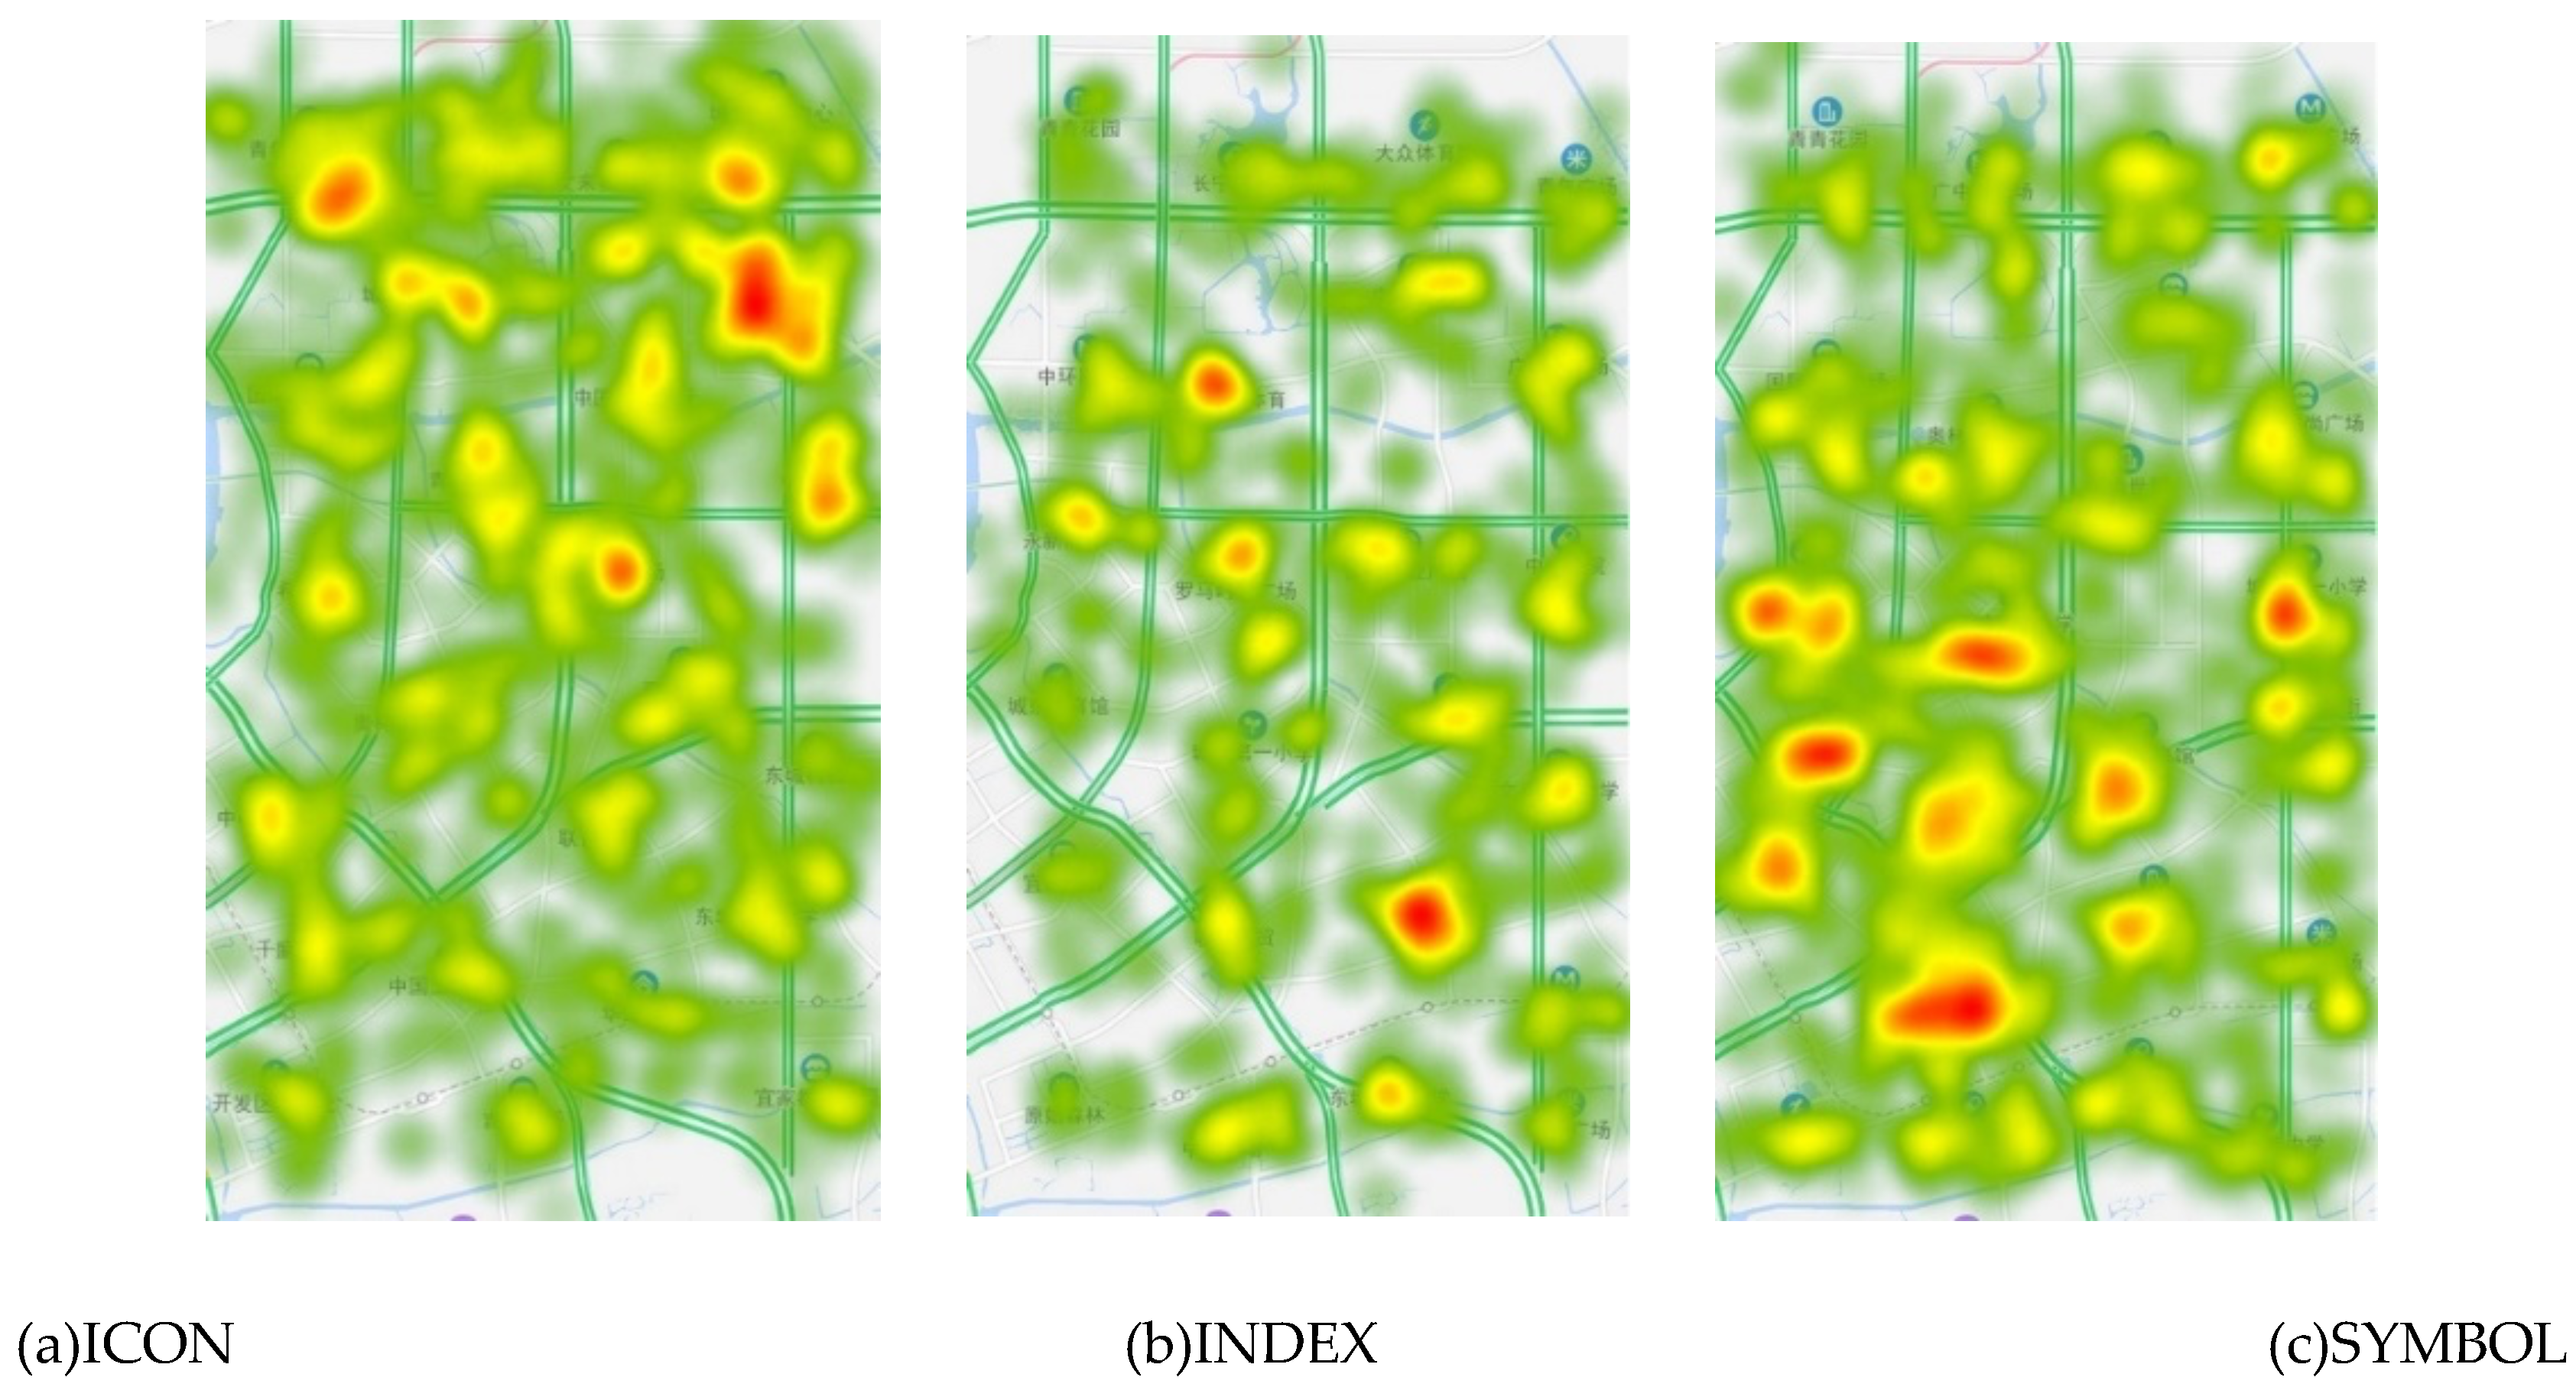
Eye Movement Heat Map
The eye movement heat map. can visualize the data recorded during the test and show some preliminary conclusions. The average behavior of all subjects is shown in this graph, where it can be seen that the areas with the most dense fixed points are shown in red. As the fixed point decreases, the color changes from red to yellow to green. It shows the average behavior of all subjects, and the feasibility and signal effect index are very high. As can be seen from the fig 6, the line of sight of the INDEX symbols is relatively concentrated, and the hot spot dense area is mainly concentrated near the target symbol. The attention during information processing is concentrated and the search efficiency is high. However, the other two types of vision are relatively scattered, and there are some interference fac-tors during information processing. After seeing the target, the subjects still tried to search near the target before making a judgment. It can be seen intuitively from the heat map that the cognitive effect of the INDEX symbols is better than the other two, which is basically consistent with the data analysis conclusion.
Figure 6.
Eye movement heat map of three symbol types (adjusting the transparency and color scheme of the map to allow surface symbol types to be visible in the background).
Figure 6.
Eye movement heat map of three symbol types (adjusting the transparency and color scheme of the map to allow surface symbol types to be visible in the background).
Discussion
Landmark Symbol Type Effect on Searching Performance
In this experiment, hypothesis 1 is verified. The order of correctness of the three symbols is: INDEX>ICON>SYMBOL:INDEX>ICON>SYMBOL, that is, in the search for map symbols, INDEX symbols has the best validity, while SYMBOL has the worst validity (see Section 3.1 on symbol validity). The reason for this phenomenon may be related to the uncertainty hypothesis theory, which states that the representation of signs may face more uncertainty. [61]. In this experiment, both the indicator and the pictorial symbol used graphic elements, while the symbolic symbols used literal elements. Although the cognition of text is generally considered to be more accurate[62], due to the limited space for displaying symbols in the map, the information display of the single text used is not clear, and the interpretation of graphics may be more diverse than that of words. In addition, there may be more semantic understanding, which is prone to cognitive confusion [27], especially for unfamiliar objects, and it is generally difficult to quickly establish relevant correspondence, so the accuracy rate of such symbols is the lowest. Both the double coding model and the independent coding model in cognitive psychology have proved the superiority of patterns in ideographic aspect [62-65]. This is also consistent with the generally accepted view in semiotic research that images are more efficient at searching than text in many map-like transportation systems, because graphics can be understood more widely than text [60,66].
For INDEX and ICON symbols, INDEX symbols emphasize the core function or important elements of the original object, thus enabling to establish symbolic referent relationships more accurately Whereas ICON symbols establish intuitive connections with geographical targets through similarity in appearance [26] . ICON symbols are less effective than INDEX symbols because of the limited space for displaying landmark symbols and the similarity in appearance of geographical buildings, which leads to uncertain correspondence and divergent thinking. This may also be the rea-son why the search efficiency of the indicator is significantly higher than that of the other two symbols [27].
Finally, while the Single-text symbols (SYMBOL) are less effective, but requiring less visual attention. In the early stage of symbol cognition, the first-time processing of pattern symbols (ICON and INDEX symbols) is more difficult and requires more visual attention resources. This is because the semantic extraction of SYMBOL is simpler, with lower information capacity and recognition load, which can effectively reduce attentional resources in the early stages of processing. This is also consistent with the previous study by Javier Roca et al. on safety symbols, which shows that single-word messages were associated with better performance and required fewer visual demands than pictograms[67].
Color Consistency of Symbol and Notation
Experiments show that the idea that "the same color of map landmark symbols and annotations is more conducive to improving search performance" proposed in Hypothesis 2 is not valid. The map materials designed in the experiment, the map background images are the same and the color of the landmark symbols are all blue. The annotation text is selected in black, and the color of the annotation text in a single map mate-rial is the same, and the visual effect is not cluttered. In the end, it did not have a significant impact on the searching performance of the subjects.
Interaction Effect Between Landmark Symbol Type and Gender
In addition, males were more likely to allocate cognitive resources to ICON symbols than to the other two symbols in both breadth and depth, and female subjects were more likely to allocate attention to SYMBOL than to the other two symbols in both breadth and depth. This is due to female's superiority in simulating and perceptual thinking abilities[46]. Females process semantic information more carefully than males and females tend to perceive specific objects more than males[45]. This is al-so consistent with the strategies of map and spatial cognition of men and women[69].There is no significant difference between male and female participants in terms of fixation time for the INDEX symbol, but there is a significant difference in terms of fixation count. The number of fixed gazes in male participants is significantly lower than that in female participants. This may be related to the INDEX symbol emphasizing the core function or important elements of the original object, thus helping people establish more accurate symbol referential relationships.
Evidence of differences in cognitive styles between males and females also suggests that, relative to females, males have a lower awareness of the presence of risk in unfamiliar things, while females perceive unfamiliar things as riskier[46]. [72]. In addition,the interaction differences between the types of landmark symbols and the genders of men and women are verified through analysis. Males have greater field independence than females, meaning that males prefer to perceive stimuli to the exclusion of the environment, whereas females are less able to cognitively separate the self from the environment [70]. Males are better at reasoning, and thus are usually able to make faster decisions with incomplete information[47, 48]. For males, the role of self-insight is expressed as a difference in processing speed, whereas for females, its role is expressed as a difference in processing level. In this single-text incomplete information, longer cognitive distance symbol searching tasks, males are usually able to make decisions more decisively and quickly. It can be seen that hypothesis 3 of this study holds.
The results for fixation duration, on the other hand, suggest that the forementioned trend of difference in searching efficiency only occurs at the late stage of symbol recognition processing, i.e., at the stage of decision-making about symbols. The understanding of knowledge inference and transfer in maps may differ from the conventional setting, where symbols that reinforce attributes such as function, as well as important features, do not require deep learning and comparison by subjects, whereas symbols based on attributes such as graphical similarity and syntactic symbols require more deep learning by subjects to complete the task[68].
Conclusions and Limitations
The following conclusions could be drawn from the study.
Among the three kinds of symbols, INDEX symbols has the highest search accuracy and efficiency. This symbol that emphasizes the function and important features of the target consumes the least cognitive resources in the search, and can be used for target recognition without deep in-formation processing.
Eye movement indicators show that the reading of SYMBOL requires less visual attention. This kind of semantically agreed characters and letter symbols have small information capacity and low identification load, which can effectively reduce the attention resources in the early stage of processing. The above differences in symbol searching performance were only at relatively late stage of processing, i.e., at the stage of decision making about the symbols. The INDEX symbols took fewer attentional resource allocation both in breadth and depth than the other two symbol types.
The experimental results of search efficiency show that the difference in cognitive styles between men and women leads to the difference in the search results of the three symbols. The searching performance of male subjects for SYMBOL were significantly better than that of female subjects; the searching performance of male subjects for INDEX symbols were significantly better than that of ICON symbols. The searching performance of female subjects for INDEX symbols was significantly higher than that of SYMBOL.
Due to the experimental environment, research scope, and technical conditions, this study has some limitations. First, tobiix2-60 used in the experiment is a desktop eye tracker, and research must be carried out on a computer desktop. This may be due to the lack of a real mobile map environment, which may have a certain impact on the results of the experiment. Second, due to the limited accuracy of the eye tracker, the symbols and annotations are divided into a region of interest in this study, and it is impossible to accurately determine whether the subjects focus on symbols or annotations. For example, the accuracy of the heat map depends on the data collection results, which cannot fully represent all samples, and the user behavior that cannot be collected affects the reliability of the heat map generated at the end of this experiment.
Future Work
The findings of the study could provide suggestions for the design of mobile map landmark symbols, so that the design of map symbols can be more suitable for users' cognitive habits and thus effectively improve the reading performance of mobile maps. In general, the effectiveness and efficiency of map symbols are an important guiding principle, so the design of symbols should grasp the most essential characteristics of geographical objects, such as the core functions and core components of geographical objects. In addition, in the navigation environment using mobile maps, users are usually in a multi task state. Their attention will be distracted from the road and traffic information, and their concentration in reading the map is low. At this time, although single text symbols without better effectiveness and efficiency may be a more appropriate choice, because their cognition requires less visual attention. This is also the problem to be verified in this study. In the follow-up, we will use a mobile eye tracker to carry out the experiment, so as to exclude the influence of experimental situation factors on the experimental results. In addition, the subjects' age, cultural background, map reading ability and professional knowledge may affect their understanding of symbols. In the follow-up study, we will screen the subjects through psychological questionnaire measurement, and strictly control the influence of these irrelevant variables on the experimental results.
Disclosure statement: No potential conflict of interest was reported by the author(s).
Funding
This work was supported by the National Natural Science Foundation of China (No. 42171438);the Major Project of the National Social Science Foundation of China "Theoretical and Practical Innovation of Art Theory Evaluation System,"( Project No. 21ZD11); the Research Fund of Wuhan University of Technology (K2023064, K2024022), and the Scientific Research Foundation of Wuhan Institute of Technology (Project No. K2024022).
References
- Nelson, E.S. , How Maps Work: Representation, Visualization, and Design. Cartographic Perspectives 1996, 27–30. [Google Scholar] [CrossRef]
- Kray, C.; Elting, C.; Laakso, K.; Coors, V. , In Presenting route instructions on mobile devices, 2003/1/1, 2003; 2003; pp. 117-124.
- Li, X.; Wu, X.; Yin, Z.; Shen, J. , THE INFLUENCE OF SPATIAL FAMILIARITY ON THE LANDMARK SALIENCE SENSIBILITY IN PEDESTRIAN NAVIGATION ENVIRONMENT. International Archives of the Photogrammetry, Remote Sensing & Spatial Information Sciences 2017, 42. [Google Scholar]
- Vaez, S.; Burke, M.; Yu, R. , Visitors' wayfinding strategies and navigational aids in unfamiliar urban environment. Tourism Geogr 2020, 22, (4-5), 832-847. [Google Scholar] [CrossRef]
- Hilton, C.; Johnson, A.; Slattery, T.J.; Miellet, S.; Wiener, J.M. , The impact of cognitive aging on route learning rate and the acquisition of landmark knowledge. Cognition 2021, 207, 104524. [Google Scholar] [CrossRef] [PubMed]
- Nurmi, P.; Salovaara, A.; Bhattacharya, S.; Pulkkinen, T.; Kahl, G. , In Influence of landmark-based navigation instructions on user attention in indoor smart spaces, 2011/1/1, 2011; 2011; pp. 33-42.
- Hampe, M.; Elias, B. , Integrating topographic information and landmarks for mobile navigation. na: 2004.
- Lynch, K. , The city image and its elements. In Routledge: 2015; pp. 620-630.
- Uttl, B.; Graf, P. , Object orientation information in semantic and episodic memory. Canadian Journal of Experimental Psychology/Revue Canadienne De Psychologie Expérimentale 1996, 50, (1), 87.
- Sorrows, M.E.; Hirtle, S.C. , In The nature of landmarks for real and electronic spaces, 1999/1/1, 1999; Springer: 1999; pp. 37-50.
- Presson, C.C.; Montello, D.R. , Points of reference in spatial cognition: Stalking the elusive landmark. Brit J Dev Psychol 1988. [Google Scholar] [CrossRef]
- Elias, B.; Paelke, V. , User-centered design of landmark visualizations. Map-Based Mobile Services: Design, Interaction and Usability 2008, 33-5.
- Besharat, J.; Komninos, A.; Papadimitriou, G.; Lagiou, E.; Garofalakis, J. , Augmented paper maps: Design of POI markers and effects on group navigation. J Amb Intel Smart En 2016, 8, 515–530. [Google Scholar] [CrossRef]
- Lioli, D.; Komninos, A. , In Icon Design for Landmark Importance in Mobile Maps, 2016/1/1, 2016; 2016; pp. 1-6.
- Caduff, D.; Timpf, S. , A framework for assessing the salience of landmarks for wayfinding tasks. Cogn Process 2006, 7, 23–23. [Google Scholar] [CrossRef]
- O'Neill, M.J. , Effects of signage and floor plan configuration on wayfinding accuracy. Environ Behav 1991, 23, 553–574. [Google Scholar] [CrossRef]
- Sholts, S.B.; Flores, L.; Walker, P.L.; Wärmländer, S.K. , Comparison of coordinate measurement precision of different landmark types on human crania using a 3D laser scanner and a 3D digitiser: implications for applications of digital morphometrics. Int J Osteoarchaeol 2011, 21, 535–543. [Google Scholar] [CrossRef]
- Michon, P.; Denis, M. , In When and why are visual landmarks used in giving directions? 2001/1/1, 2001; Springer: 2001; pp. 292-305.
- Golledge, R.G. , Place recognition and wayfinding: Making sense of space. Geoforum 1992, 23, 199–214. [Google Scholar] [CrossRef]
- Ross, T.; May, A.; Thompson, S. , In The use of landmarks in pedestrian navigation instructions and the effects of context, 2004/1/1, 2004; Springer: 2004; pp. 300-304.
- Krukar, J.; Anacta, V.J.; Schwering, A. , The effect of orientation instructions on the recall and reuse of route and survey elements in wayfinding descriptions. J Environ Psychol 2020, 68, 101407. [Google Scholar] [CrossRef]
- Klettner, S. , Affective communication of map symbols: a semantic differential analysis. Isprs Int J Geo-Inf 2020, 9, (5), 289.
- Keates, J.S. , Understanding maps. Routledge: 2014.
- MacEachren, A.M.; Roth, R.E.; O'Brien, J.; Li, B.; Swingley, D.; Gahegan, M. , Visual semiotics & uncertainty visualization: An empirical study. Ieee T Vis Comput Gr 2012, 18, 2496–2505. [Google Scholar]
- Noth, W. , Handbook of semiotics. Indiana University Press: 1990.
- Peirce, C.S. , Peirce on signs: Writings on semiotic. UNC Press Books: 1991.
- Meng, L. , Some theoretical concerns along with the development of cartographic technologies. Journal of Zhengzhou Institute of Surveying and Mapping 2006, 23, 89–96. [Google Scholar]
- Lakoff, G.; Johnson, M. , Metaphors we live by. University of Chicago press: 2008.
- Wang, H.; Zhao, C.; Qin, J. , Design and Implementation of Map Annotation Automatic Configuration Module Based on ArcEngine. Geospatial Information 05, (17), 56-59+5.
- Qiao, Z.; Yan, H. , Discussion on Map Labeling and Map Annotation. Geomatics & Spatial Information Technology 2011, 01, (34), 205-207.
- Ren, Z.; Chen, Y.; Sun, Q. , The Contents and Methods for Usability Evaluation of Electronic Map. Hydrographic Surveying and Charting 2007, 05, 44–47. [Google Scholar]
- Bertin, J. , Semiology of graphics: Diagrams, networks, maps. Redlands. In CA: Esri Press: 2010.
- Williams, L.G. , The effects of target specification on objects fixated during visual search. Acta Psychol 1967, 27, 355–360. [Google Scholar] [CrossRef]
- Von Wright, J.M. , Selection in visual immediate memory. Q J Exp Psychol 1968, 20, 62–68. [Google Scholar] [CrossRef]
- Treisman, A.M.; Gelade, G. , A feature-integration theory of attention. Cognitive Psychol 1980, 12, 97–136. [Google Scholar] [CrossRef]
- Garlandini, S.; Fabrikant, S.I. , In Evaluating the effectiveness and efficiency of visual variables for geographic information visualization, 2009/1/1, 2009; Springer: 2009; pp. 195-211.
- Phillips, R.J.; Noyes, L. , A comparison of colour and visual texture as codes for use as area symbols on thematic maps. Ergonomics 1980, 23, 1117–1128. [Google Scholar] [CrossRef]
- Wilson, D.L.; Kuperman, G.G.; Perez, W.A. , In Color symbol discrimination, 1988/1/1, 1988; IEEE: 1988; pp. 217-218.
- Wang, J.; Lin, L.; Gao, H.; Zhang, L. , Differences in college students' spatial symbol cognition of tourism map: based on experimental data from an eye-movement tracking system. Tourism Tribune 2016, 31, 97–105. [Google Scholar]
- Halpern, D.F. , Sex differences in cognitive abilities. Psychology press: 2013.
- Eals, M.; Silverman, I. , The hunter-gatherer theory of spatial sex differences: Proximate factors mediating the female advantage in recall of object arrays. Ethology and Sociobiology 1994, 15, 95–105. [Google Scholar] [CrossRef]
- Williams, C.L.; Barnett, A.M.; Meck, W.H. , Organizational effects of early gonadal secretions on sexual differentiation in spatial memory. Behav Neurosci 1990, 104, 84. [Google Scholar] [CrossRef] [PubMed]
- Lawton, C.A. , Gender differences in way-finding strategies: Relationship to spatial ability and spatial anxiety. Sex Roles 1994, 30, 765–779. [Google Scholar] [CrossRef]
- Fang, H.; Zhou, L. , The effect of gender, wayfinding strategy and navigational support on wayfinding behaviour. Acta Psychol Sin 2012. [Google Scholar] [CrossRef]
- Yan, Y.; Long, Y.; Shen, Q.; Wang, J. , Spatial Cognition Analysis of Electronic Map Concerns with Sex Difference. Geography and Geo-Information Science 2011, 04, (27), 48–51.
- Galotti, K.M. , Cognitive psychology in and out of the laboratory. Sage Publications: 2017.
- Hwang, Y. , The moderating effects of gender on e-commerce systems adoption factors: An empirical investigation. Comput Hum Behav 2010, 26, 1753–1760. [Google Scholar] [CrossRef]
- Peng, X.; Ma, S.H.; Li, X.M. , A study on the cognitive styles and gender difference of normal university students in China. J Health Psychol 2006, 14, 299–301. [Google Scholar]
- Kimura, D. , Sex and cognition. MIT press: 2000.
- Hyde, J.S. , Sex and cognition: gender and cognitive functions. Curr Opin Neurobiol 2016, 38, 53–56. [Google Scholar] [CrossRef]
- Nicholson, K.G.; Kimura, D. , Sex differences for speech and manual skill. Percept Motor Skill 1996, 82, 3–13. [Google Scholar] [CrossRef]
- Dong, W.; Liao, H.; Zhan, Z.; Liu, B.; Wang, S.; Yang, T. , New research progress of eye tracking-based map cognition in cartography since 2008. Acta Geogr. Sin 2019, 74, 599–614. [Google Scholar]
- Andrienko, N.; Andrienko, G.; Voss, H.; Bernardo, F.; Hipolito, J.; Kretchmer, U. , Testing the usability of interactive maps in CommonGIS. Cartogr Geogr Inf Sc 2002, 29, 325–342. [Google Scholar] [CrossRef]
- Ooms, K.; Maeyer, P.D.; Fack, V.; Assche, E.V.; Witlox, F. , Investigating the effectiveness of an efficient label placement method using eye movement data. The Cartographic Journal 2012, 49, 234–246. [Google Scholar] [CrossRef]
- Popelka, S.; Brychtova, A. , Eye-tracking study on different perception of 2D and 3D terrain visualisation. The Cartographic Journal 2013, 50, 240–246. [Google Scholar] [CrossRef]
- Lin, Y.; Deng, Y.; Lai, X.; Zhou, G. , Research on the Effectiveness of Point Symbols in Different Tourist Web-Map Style. Geomatics & Spatial Information Technology 2015, 02, (38), 58–62.
- Brychtova, A.; Coltekin, A. , An empirical user study for measuring the influence of colour distance and font size in map reading using eye tracking. The Cartographic Journal 2016, 53, 202–212. [Google Scholar] [CrossRef]
- Peng, N.; Xue, C. , Experimental study on characteristics of icon searching based on feature inference. Journal of Southeast University(Natural Science Edition)2017, 04, (47), 703–709.
- Urdan, T.C. , Statistics in plain English. Taylor & Francis: 2022.
- Guattari, C.; De Blasiis, M.R.; Calvi, A. , The effectiveness of variable message signs information: A driving simulation study. Procedia-Social and Behavioral Sciences 2012, 53, 692–702. [Google Scholar] [CrossRef]
- Ferrand, L. , Why naming takes longer than reading? The special case of Arabic numbers. Acta Psychol 1999, 100, 253–266. [Google Scholar] [CrossRef]
- Paivio, A. , Imagery and verbal processes. Psychology Press: 2013.
- Anderson, J.R.; Bower, G.H. , A propositional theory of recognition memory. Mem Cognition 1974, 2, 406–412. [Google Scholar] [CrossRef]
- Nelson, D.L.; Reed, V.S.; McEvoy, C.L. , Learning to order pictures and words: A model of sensory and semantic encoding. Journal of Experimental Psychology: Human Learning and Memory 1977, 3, (5), 485.
- Potter, M.C.; Faulconer, B.A. , Time to understand pictures and words. Nature 1975, 253, 437–438. [Google Scholar] [CrossRef]
- Proffitt, D.R.; Wade, M.M. , Creating effective variable message signs: human factors issues. In Virginia Transportation Research Council: 1998.
- Roca, J.; Insa, B.; Tejero, P. , Legibility of text and pictograms in variable message signs: can single-word messages outperform pictograms? Hum Factors 2018, 60, 384–396. [Google Scholar] [CrossRef]
- Fischer, S.; Itoh, M.; Inagaki, T. , Prior schemata transfer as an account for assessing the intuitive use of new technology. Appl Ergon 2015, 46, 8–20. [Google Scholar] [CrossRef]
- FANG, H.; SONG, Z.; YANG, L.; MA, Y.; QIN, Q. , Spatial cognitive elements of VR mobile city navigation map. Geomatics and Information Science of Wuhan University 2019, 44, 1124–1130. [Google Scholar]
- Paswan, A. , Gender, Design and Marketing. Journal of Consumer Marketing 2012, 29, 456–457. [Google Scholar] [CrossRef]
- Peter Kiefer, Ioannis Giannopoulos, Martin Raubal & Andrew Duchowski (2017) Eye tracking for spatial research: Cognition, computation, challenges, Spatial Cognition & Computation,2017,17:1-2, 1-19.
- Popovic D,Hosek A,Boli E, et al.Structural Differences in Some Psychological Characteristics between Young Men and Women[J].Open Access Library Journal,2016,3(6):1-9.
Figure 1.
Example of experimental maps.
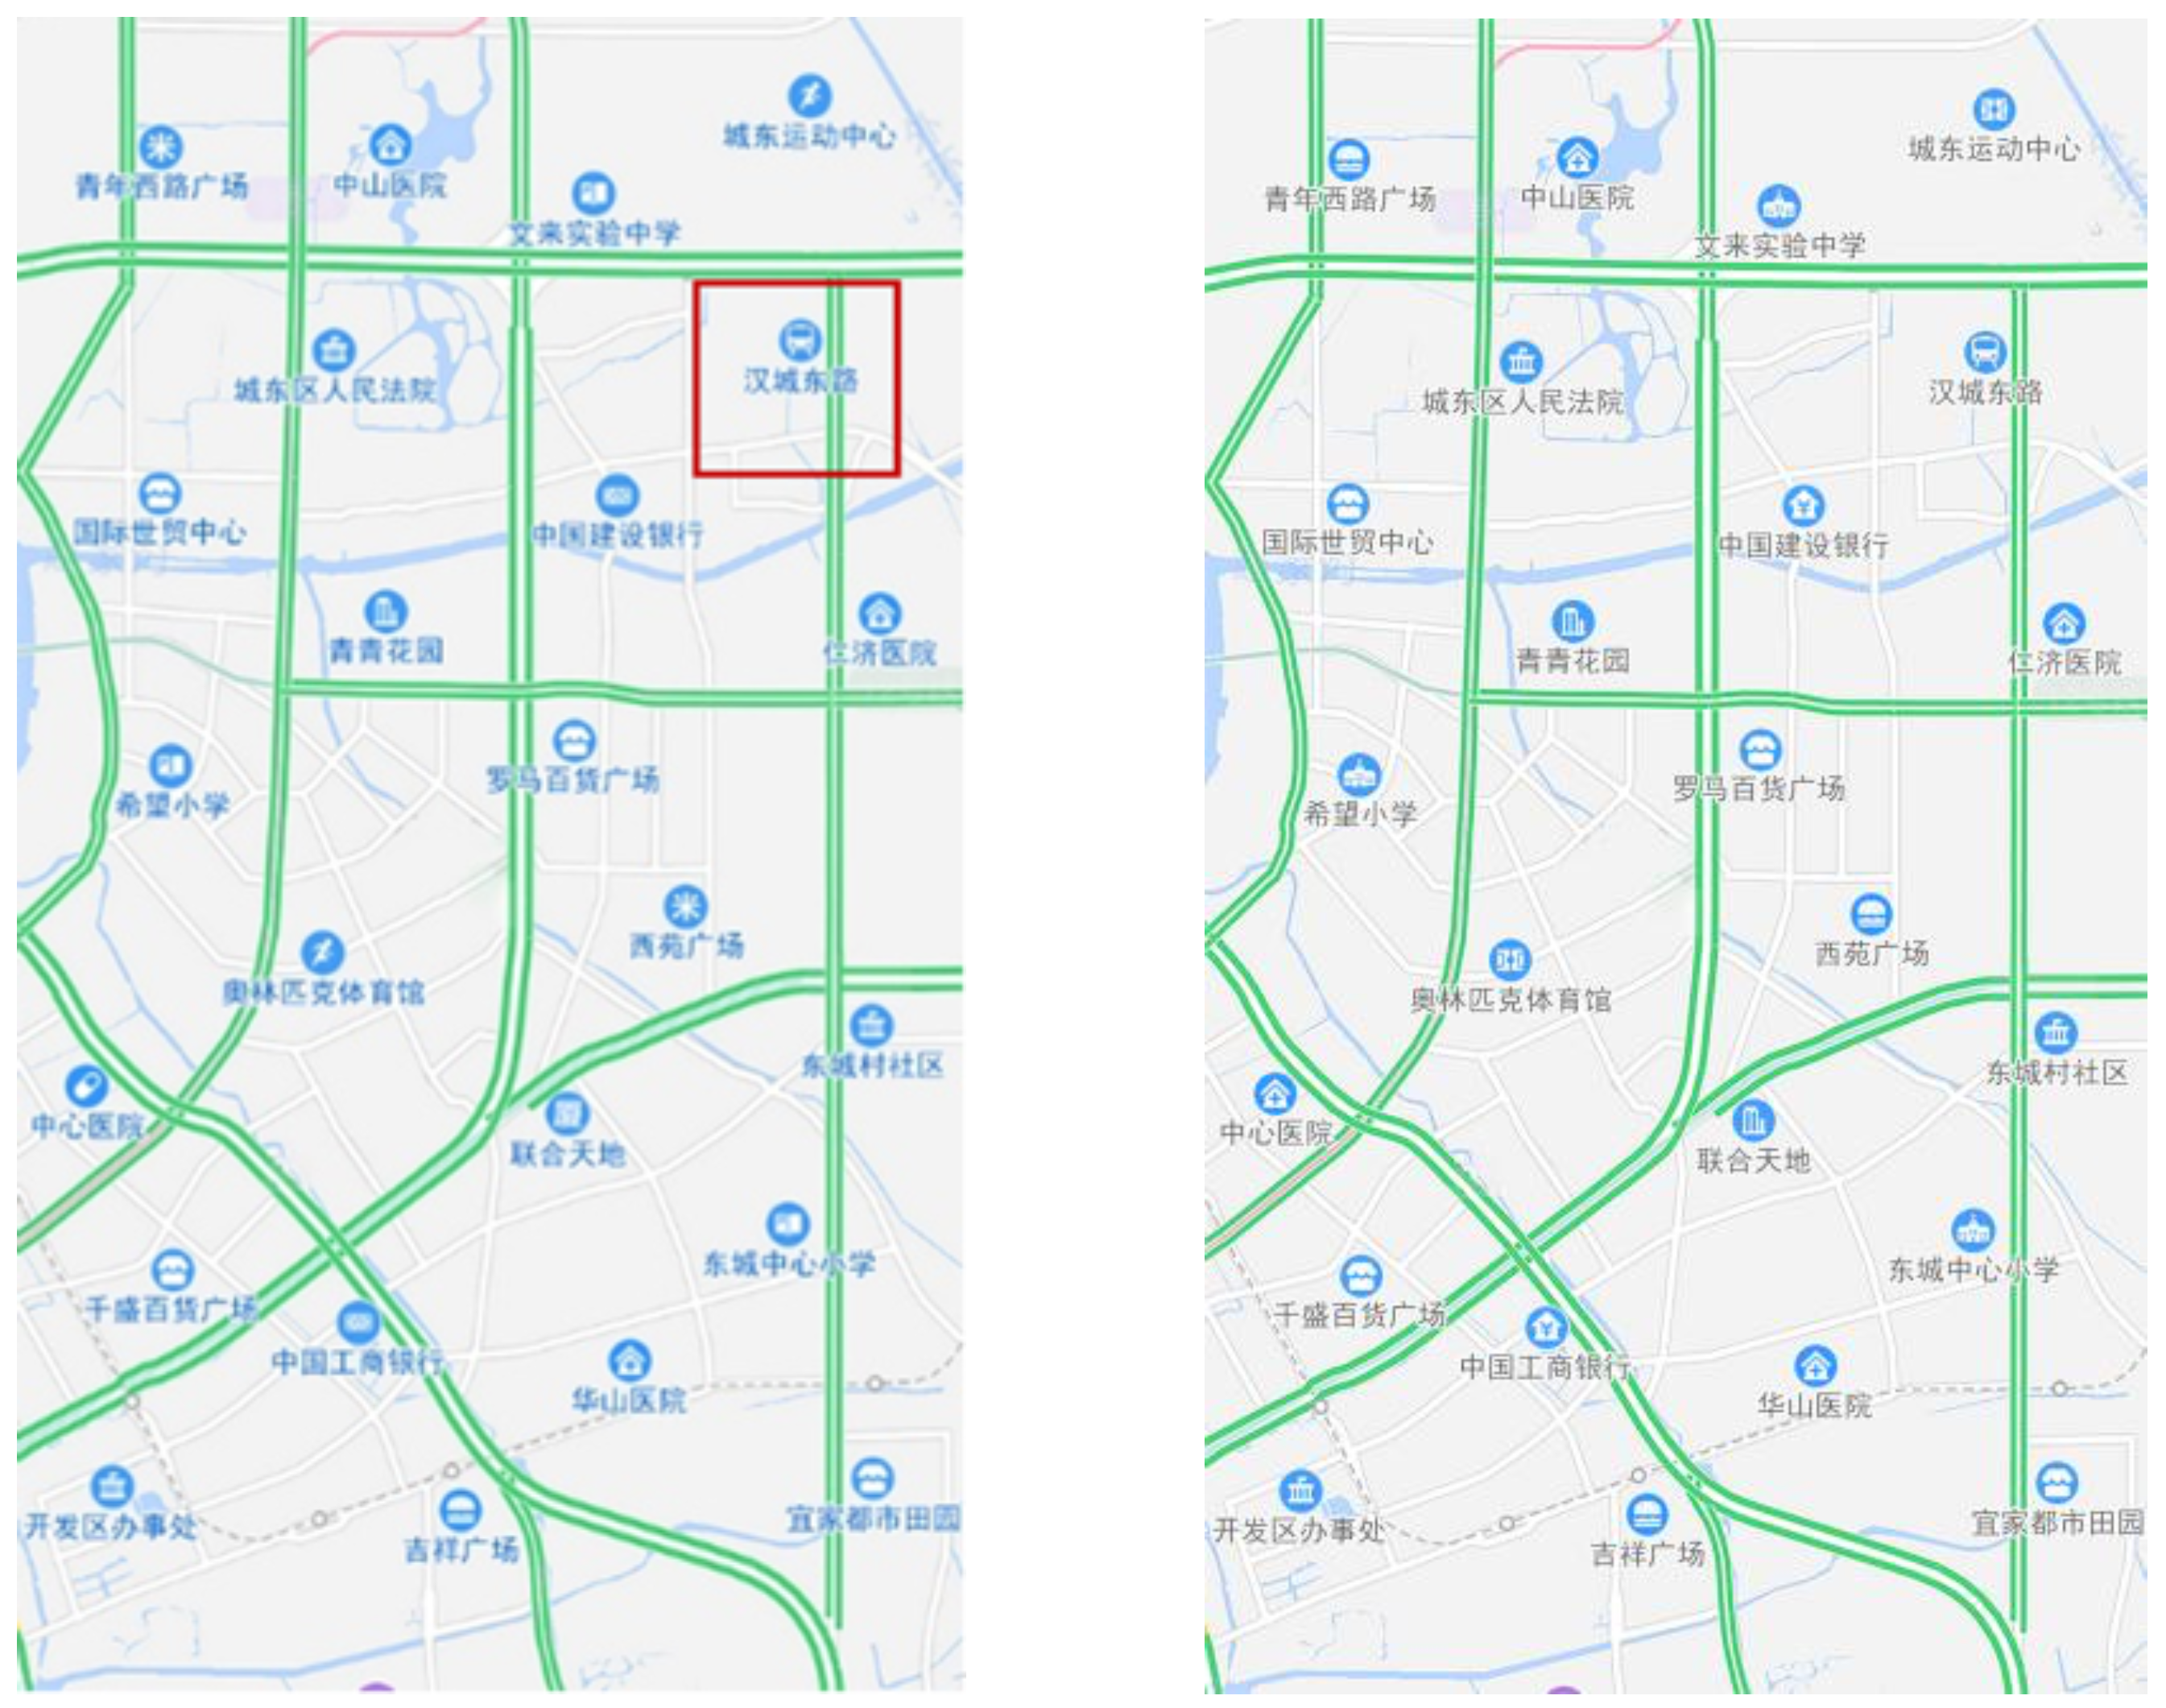
Figure 2.
Landmark symbol and connotation color design.

Figure 3.
Mean value diagram of Symbol type and time to first mouse click.
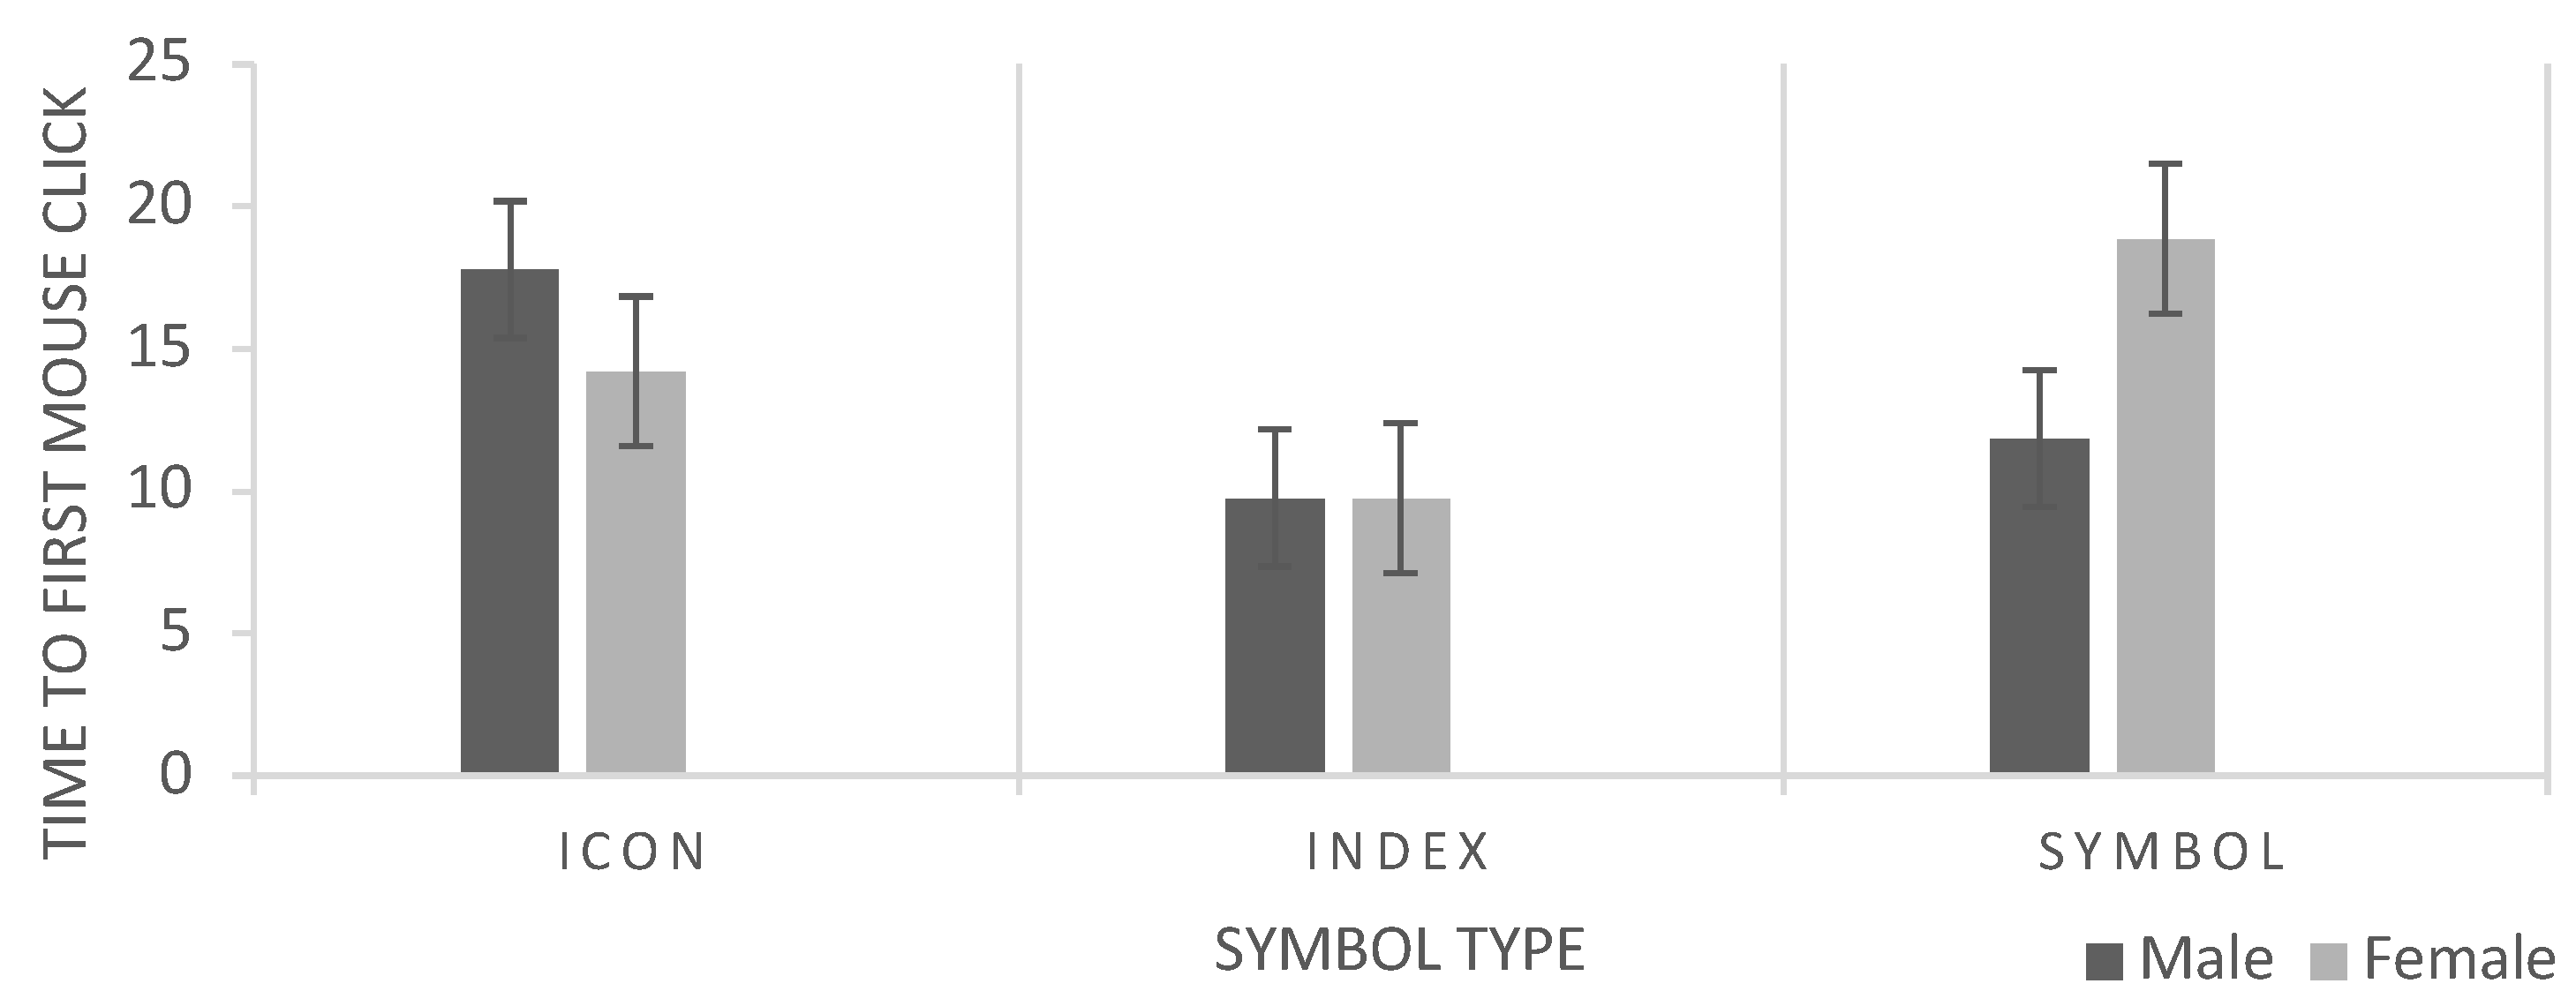
Figure 4.
Mean value diagram of Symbol type and fixation counts.
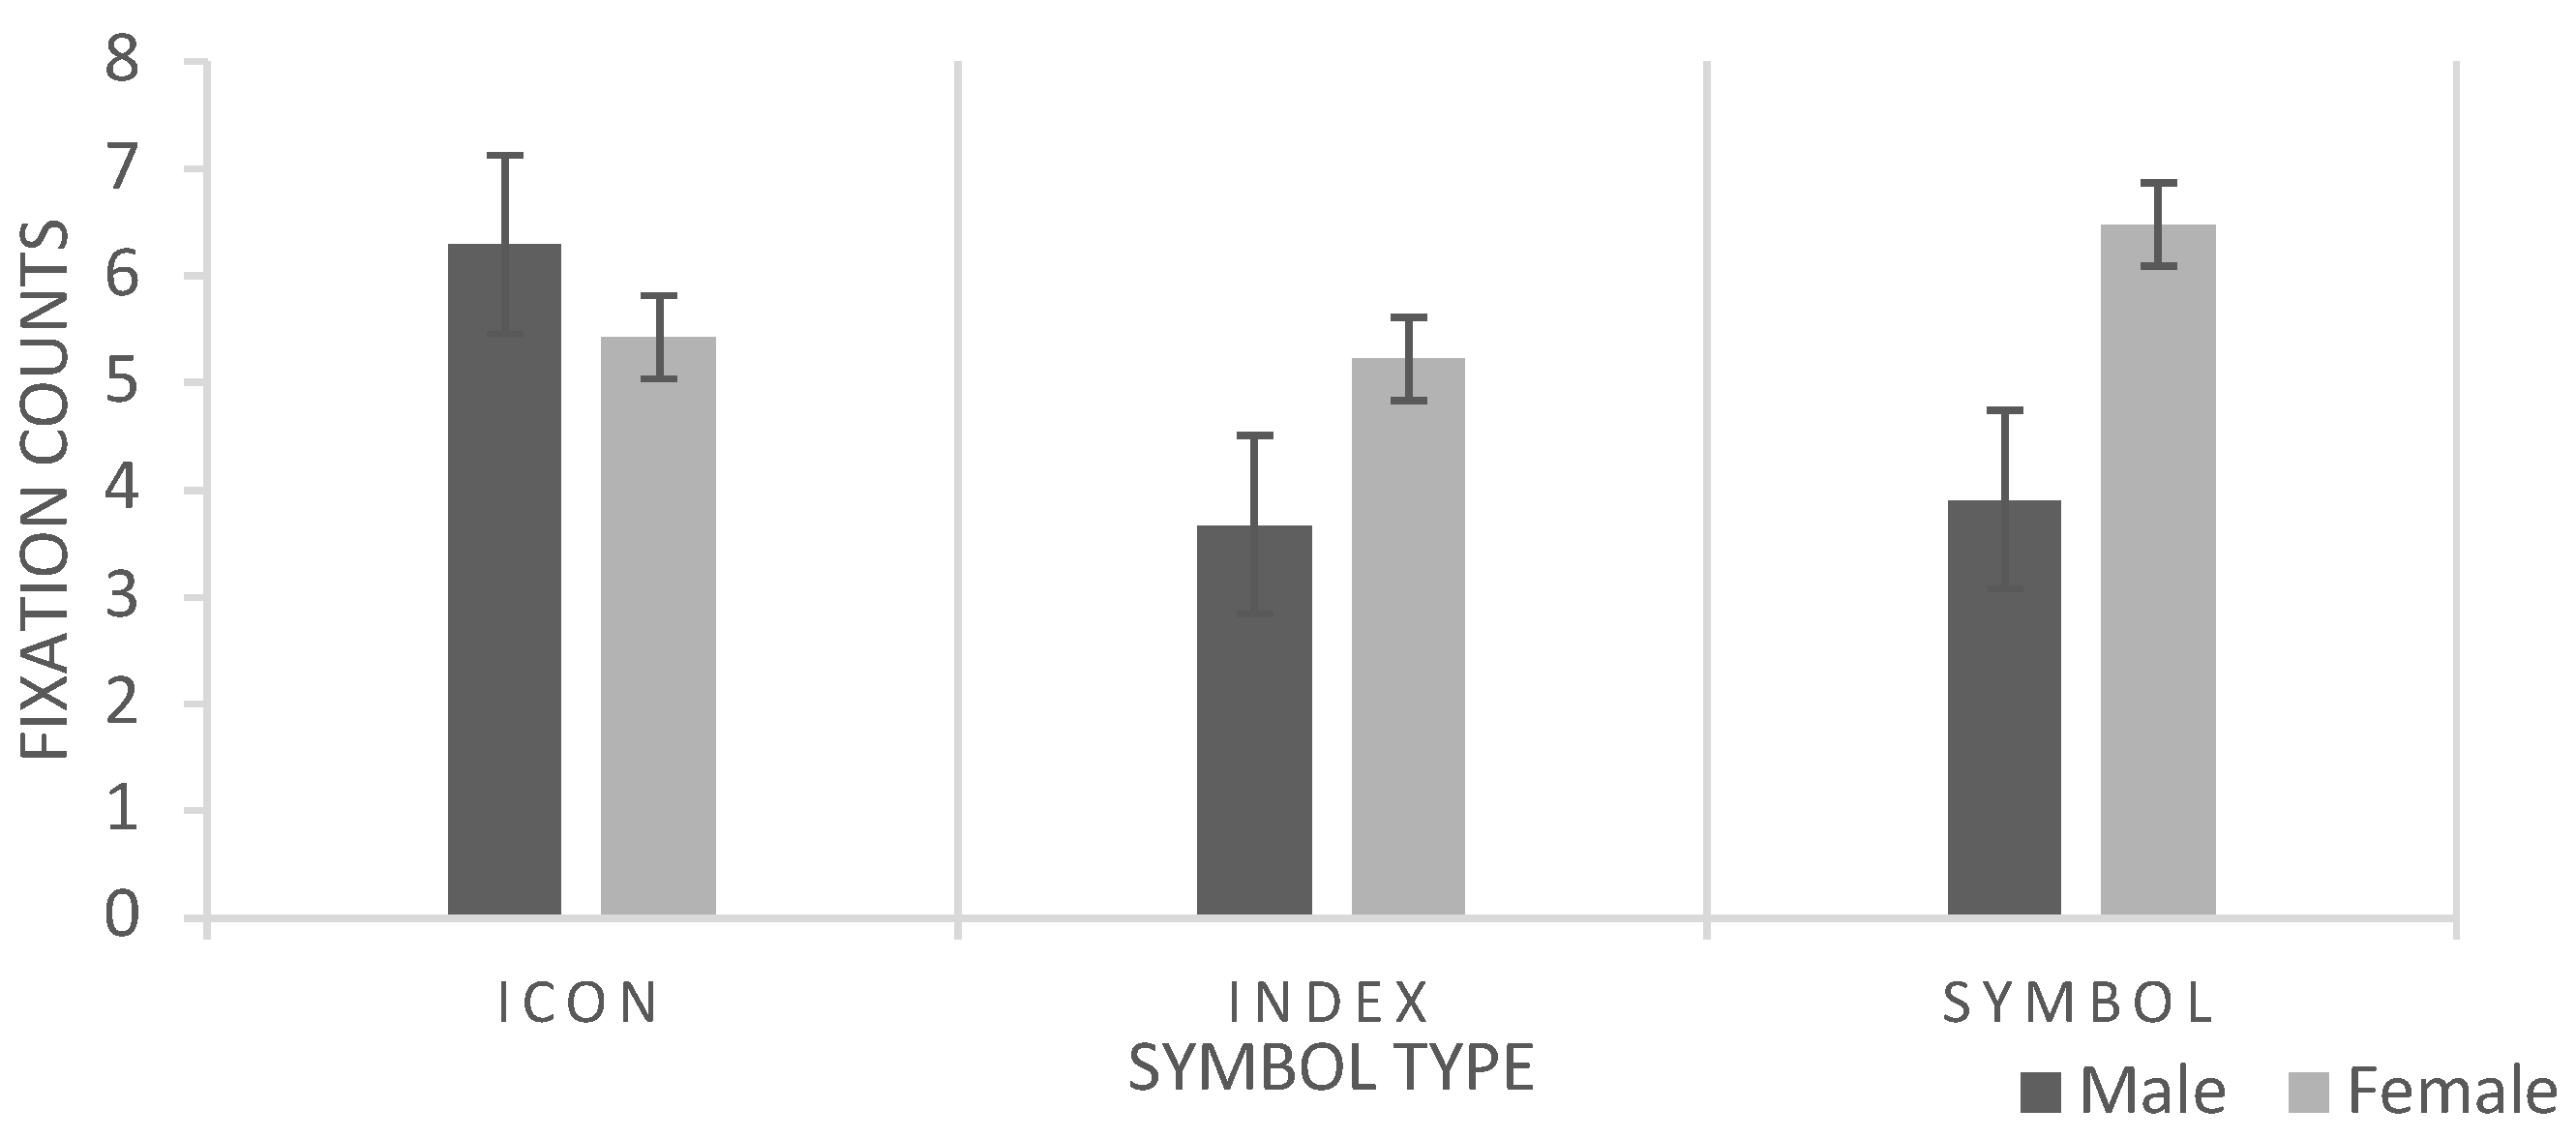

Table 1.
Definition and function of eye movement indicators.
| Indicators | Definition | Function |
|---|---|---|
| The correctness | The correctness of searching task | Indicate the validity of the symbol |
| Time to first mouse click | The time from the presentation of the stimulus material to the first mouse click in AOI | Indicate the efficiency of the symbol |
| The first fixation time | The duration of the first fixation point in AOI | Expressing the subject's attention. The shorter the duration of the first time, the more focused the attention span. |
| The fixation duration | Total fixation time in AOI | Indicates cognitive difficulty. The longer the total duration, the more difficult it is to recognize. |
| The fixation count | Total number of fixation points in AOI | Represents the subject's information processing |
Note: The AOI rectangle of interest is for analysis only and is not visible to participants.
Table 2.
Three landmark symbol types.
*. The difference was significant at.05 level.
Table 3.
Repeated measures ANOVA of the map symbols of the independent variable metro for the accuracy of target search, and the data are summarized in detail.
Table 3.
Repeated measures ANOVA of the map symbols of the independent variable metro for the accuracy of target search, and the data are summarized in detail.
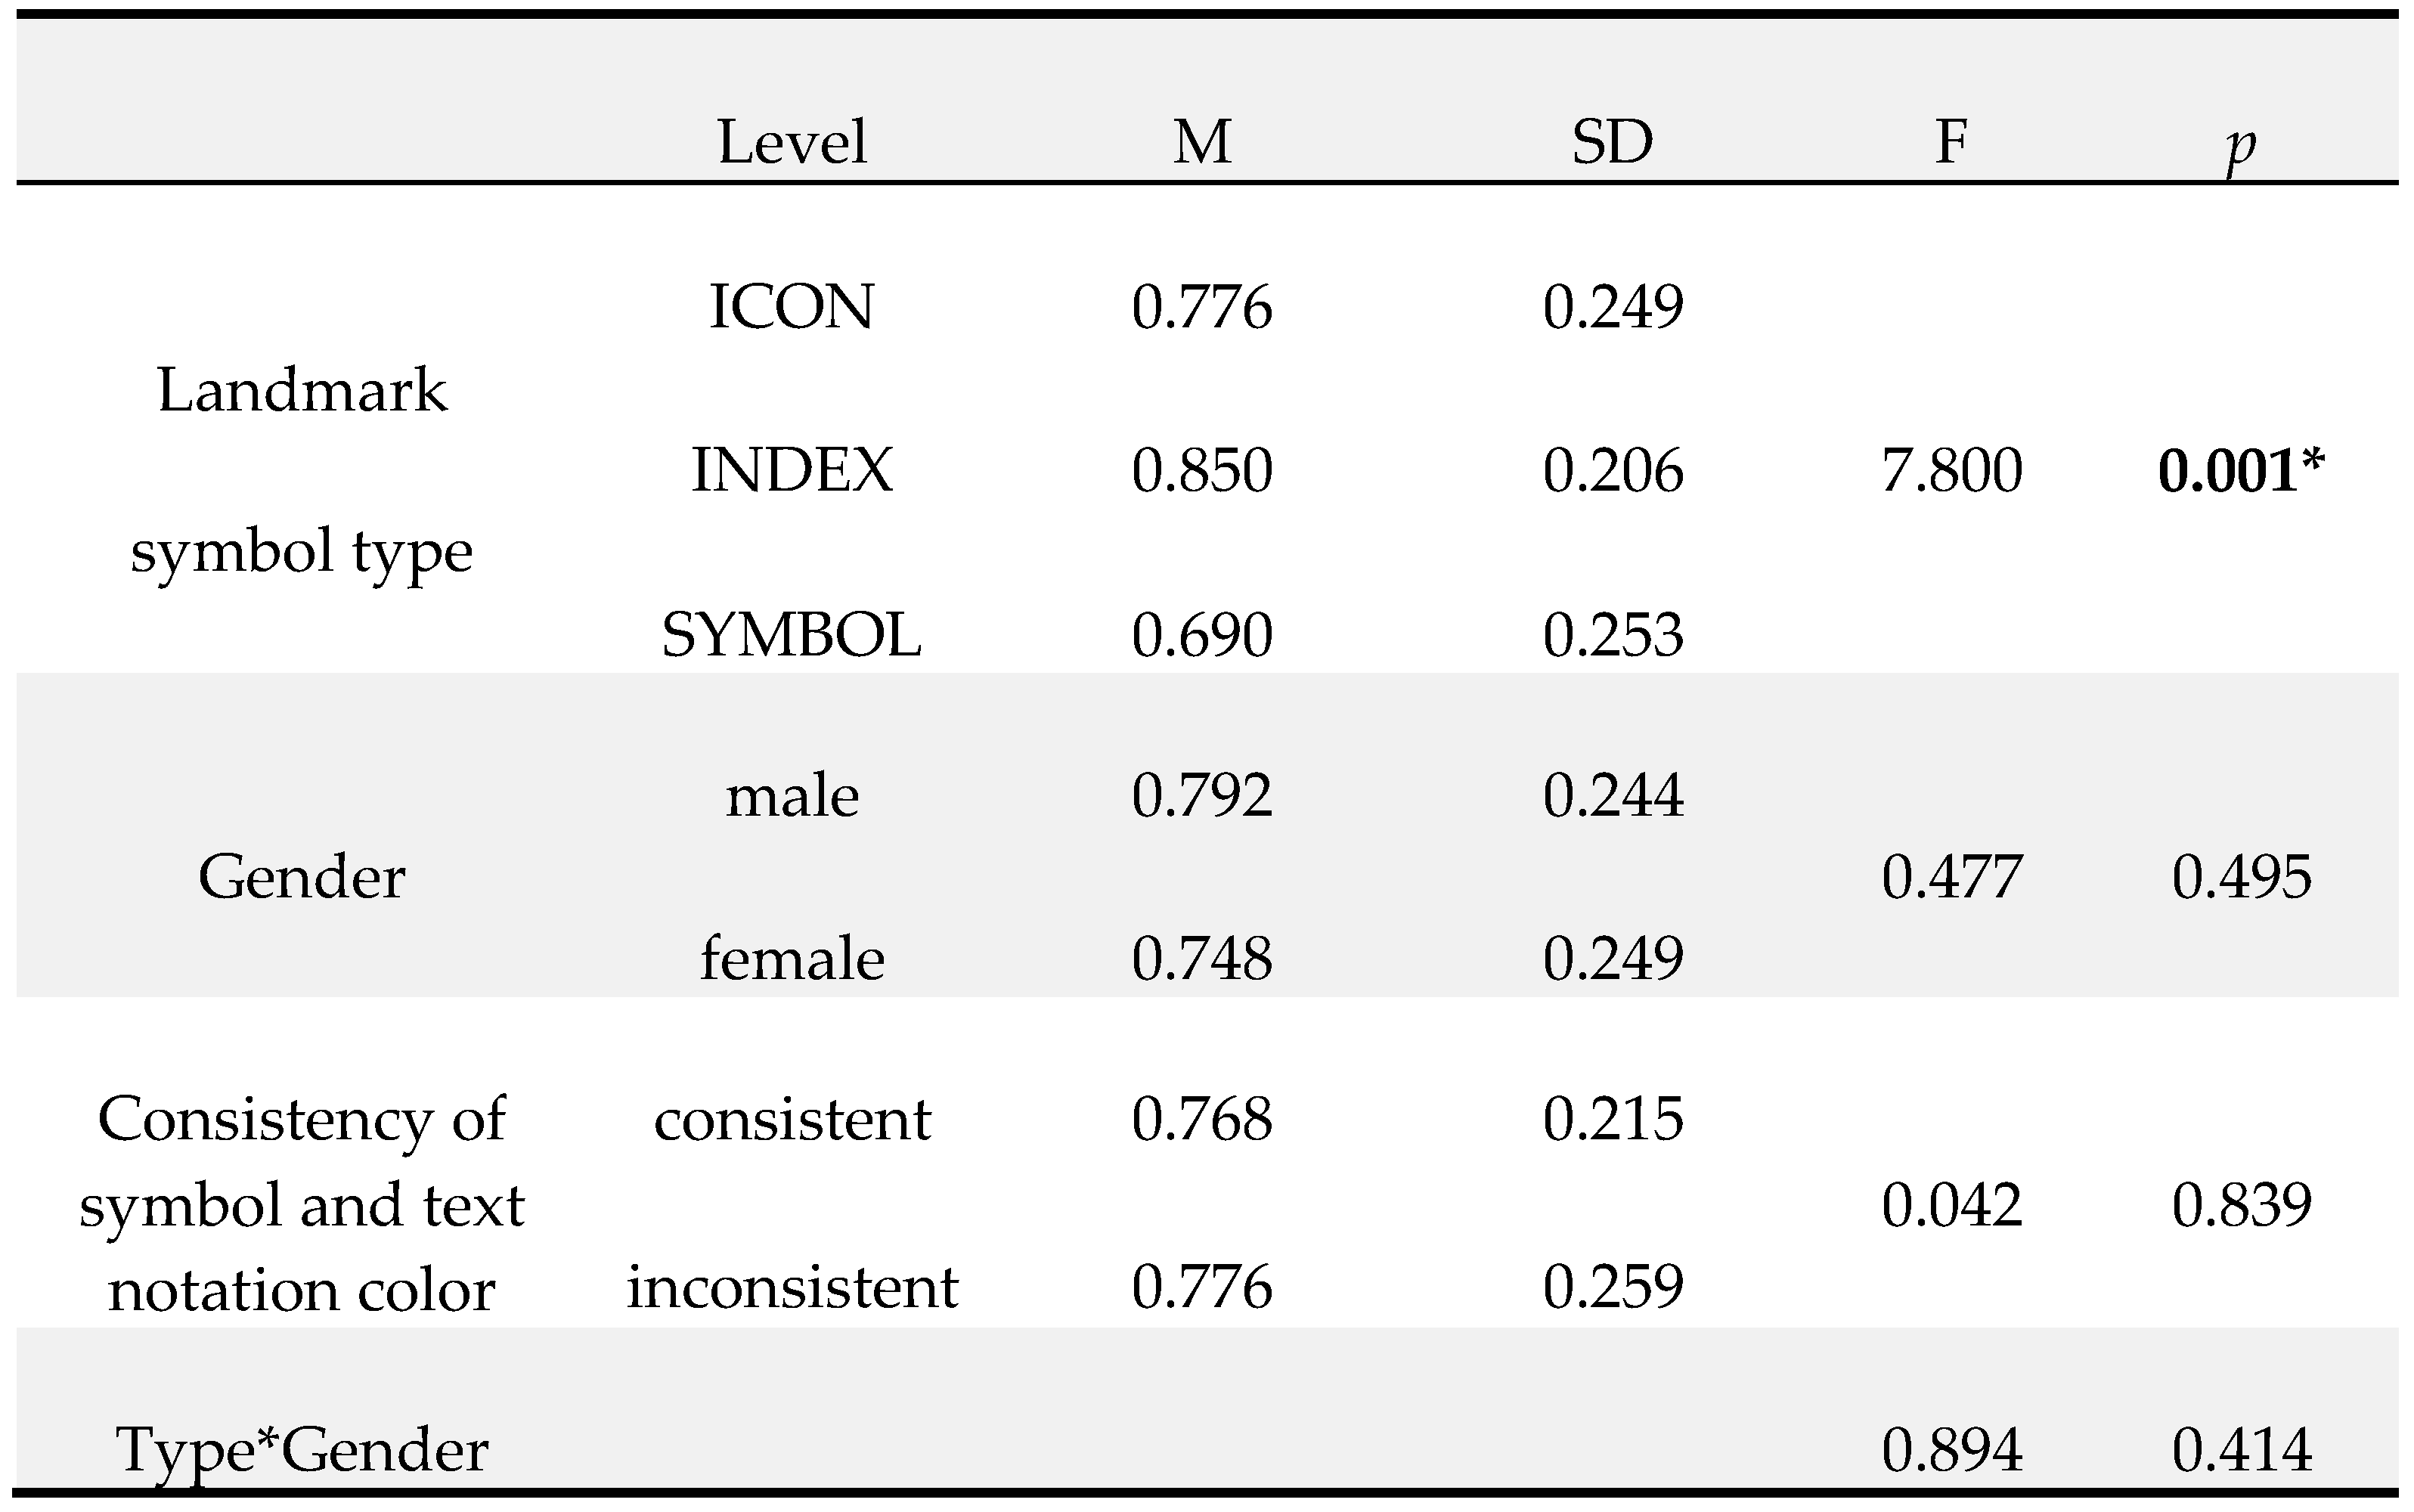
Table 4.
Repeated-measures ANOVA of independent variables on time to first mouse click.
| Level | M(s) | SD | F | p | |
|---|---|---|---|---|---|
| Landmark symbol type | ICON | 16.136 | 7.642 | 9.335 | 0.001* |
| INDEX | 9.756 | 3.721 | |||
| SYMBOL | 15.088 | 9.754 | |||
| Gender | male | 13.132 | 6.334 | 0.773 | 0.385 |
| female | 14.276 | 7.172 | |||
| Consistency of symbol and text notation color | consistent | 13.292 | 7.235 | 0.500 | 0.484 |
| inconsistent | 14.048 | 6.782 | |||
| Type*Gender | 5.654 | 0.009* |
*. The difference was significant at.05 level.
Table 5.
Results of paired comparison of landmark symbol type analysis on time to first mouse click.
Table 5.
Results of paired comparison of landmark symbol type analysis on time to first mouse click.
| (I)Landmark symbol type | (J) Landmark symbol type | Mean difference (I-J) | Standard Error (SE) | p |
| ICON | INDEX | 6.198 | 1.280 | 0.000* |
| SYMBOL | .577 | 1.914 | 0.765 | |
| INDEX | SYMBOL | -5.622 | 1.495 | 0.001* |
*. The mean difference was significant at.05 level.
Table 6.
Descriptive data of eye-tracking parameters.
| Landmark symbol type | Dependent variables | |||||
| First fixation time | Fixation duration | Fixation counts | ||||
| M(s) | SD | M(s) | SD | M | SD | |
| ICON | 0.212 | 0.131 | 1.365 | 0.717 | 5.879 | 2.157 |
| INDEX | 0.185 | 0.090 | 1.013 | 0.670 | 4.411 | 2.152 |
| SYMBOL | 0.158 | 0.074 | 1.163 | 0.906 | 5.130 | 2.742 |
Table 7.
Repeated-measures ANOVA of independent variables on dependent variables.
| Independent variables | Dependent variables | |||||
| First fixation time | Fixation duration | Fixation counts | ||||
| F | p | F | p | F | p | |
| (I) Landmark symbol type | 4.218 | 0.019* | 5.771 | 0.005* | 4.390 | 0.016* |
| (J) Gender | 0.029 | 0.865 | 2.273 | 0.140 | 6.274 | 0.017* |
| (K) Color consistency | 0.233 | 0.632 | 0.345 | 0.560 | 0.924 | 0.343 |
| (I*J) | 3.098 | 0.052 | 10.778 | 0.000* | 6.748 | 0.002* |
*. The difference was significant at.05 level.
Table 8.
Results of paired comparison of landmark symbol type analysis on eye-tracking parameters.
| Dependent variables |
(I)Landmark symbol type | (J) Landmark symbol type | Mean difference (I-J) | Standard Error (SE) | p |
| First fixation time | ICON | INDEX | 0.030 | 0.019 | 0.133 |
| SYMBOL | 0.057*\ | 0.021 | 0.011* | ||
| INDEX | SYMBOL | 0.027 | 0.018 | 0.141 | |
| Fixation duration | ICON | INDEX | 0.342 | 0.114 | 0.005* |
| SYMBOL | 0.178 | 0.111 | 0.116 | ||
| INDEX | SYMBOL | -0.163 | 0.072 | 0.029* | |
| Fixation counts | ICON | INDEX | 1.430 | 0.500 | 0.007* |
| SYMBOL | 0.657 | 0.557 | 0.245 | ||
| INDEX | SYMBOL | -.773 | 0.375 | 0.047* |
*. The mean difference was significant at.05 level.
Table 9.
Results of simple effect analysis on landmark symbol type level (Landmark symbol type*Gender).
Table 9.
Results of simple effect analysis on landmark symbol type level (Landmark symbol type*Gender).
| Dependent Variables |
Gender | (I)Landmark symbol type | (J) Landmark symbol type | Mean difference (I-J) | Standard Error (SE) | p |
| Fixation duration | Female | ICON | INDEX | 0.025 | 0.155 | 0.998 |
| ICON | SYMBOL | -0.277 | 0.163 | 0.251 | ||
| INDEX | SYMBOL | -0.302 | 0.112 | 0.019* | ||
| Male | ICON | INDEX | 0.659 | 0.169 | 0.001* | |
| ICON | SYMBOL | 0.634 | 0.152 | 0.001* | ||
| INDEX | SYMBOL | -0.025 | 0.093 | 0.992 | ||
| Fixation counts | Female | ICON | INDEX | 0.215 | 0.725 | 0.988 |
| ICON | SYMBOL | -1.071 | 0.807 | 0.474 | ||
| INDEX | SYMBOL | -1.285 | 0.543 | 0.069 | ||
| Male | ICON | INDEX | 2.646 | 0.690 | 0.001* | |
| ICON | SYMBOL | 2.386 | 0.767 | 0.011* | ||
| INDEX | SYMBOL | -0.261 | 0.517 | 0.944 |
*. The mean difference was significant at.05 level.
Table 10.
Results of simple effect analysis on gender level (Landmark symbol type*Gender).
| Dependent Variables |
Landmark symbol type | Gender | Mean difference (I-J) | Standard Error (SE) | p |
| Fixation duration | ICON | (I)Male | 0.202 | 0.258 | 0.382 |
| (J)Female | |||||
| INDEX | (I)Male | -0.432 | 0.241 | 0.053 | |
| (J)Female | |||||
| SYMBOL | (I)Male | -0.709 | 0.301 | 0.012* | |
| (J)Female | |||||
| Fixation counts | ICON | (I)Male | 0.855 | 0.695 | 0.226 |
| (J)Female | |||||
| INDEX | (I)Male | -1.577 | 0.644 | 0.019* | |
| (J)Female | |||||
| SYMBOL | (I)Male | -2.601 | 0.789 | 0.002* | |
| (J)Female |
*. The mean difference was significant at.05 level.
Disclaimer/Publisher’s Note: The statements, opinions and data contained in all publications are solely those of the individual author(s) and contributor(s) and not of MDPI and/or the editor(s). MDPI and/or the editor(s) disclaim responsibility for any injury to people or property resulting from any ideas, methods, instructions or products referred to in the content. |
© 2025 by the authors. Licensee MDPI, Basel, Switzerland. This article is an open access article distributed under the terms and conditions of the Creative Commons Attribution (CC BY) license (http://creativecommons.org/licenses/by/4.0/).
Copyright: This open access article is published under a Creative Commons CC BY 4.0 license, which permit the free download, distribution, and reuse, provided that the author and preprint are cited in any reuse.


