
Submitted:
03 January 2025
Posted:
04 January 2025
You are already at the latest version
Abstract
This study investigates the processing condition of modified carbon nanotube sheets doped with polypyrrole (CNTs-PPy) for high-performance energy storage applications, focusing on the impact of processing temperatures. The hybrid nanocomposites were prepared by coating CNTs with PI. The composites were then processed at three different temperatures 90°C, 180°C, and 250°C to study the effects of thermal treatment on their electrochemical properties. After processing, the composites underwent electrodeposition with polypyrrole (PPy) to enhance their electrochemical performance. A comprehensive set of electrochemical tests, including cyclic voltammetry (CV) and galvanostatic charge-discharge (GCD), was employed to assess the nanocomposites' specific capacitance, charge-discharge efficiency, and cycling stability. The results revealed that the composite processed at 90°C exhibited the highest specific capacitance, reaching up to 655.34 F/g at a scan rate of 5 mV/s. This composite also demonstrated excellent cycling stability, with only minimal capacitance loss over 10 cycles. The superior performance at 90°C is attributed to the optimal microstructural properties achieved at this temperature, including enhanced porosity, and effective PPy deposition, all of which contribute to improved ion transport and reduced internal resistance. In contrast, composites processed at higher temperatures (180°C and 250°C) exhibited significantly lower specific capacitance and reduced cycling stability. These findings suggest that higher temperatures may induce adverse structural changes, such as increased bulk resistance and reduced porosity, which negatively impact the electrochemical performance of the composites. The study underscores the importance of carefully controlling processing temperatures to improve the structural integrity and electrochemical functionality of PI/CNTs-PPy hybrid nanocomposites for advanced energy storage systems.
Keywords:
polyimide nanocomposites
; carbon nanotube sheets
; polyvinylidene fluoride
; polypyrrole
; p-Toluene sulfonic acid
; electrochemical
; specific capacitance
; processing temperature
1. Introduction
The rapid advancement of technology and the increasing energy demand have necessitated the development of efficient, sustainable, and high-performance energy storage systems [1,2,3]. Traditional energy storage technologies, such as lithium-ion batteries and supercapacitors, have made significant strides; however, there remains a critical need for materials that can deliver higher energy densities, longer life cycles, and improved safety [4]. In this context, hybrid nanocomposites, particularly those incorporating carbon-based materials, have emerged as promising candidates due to their unique structural, electrical, and mechanical properties [5,6,7]. Carbon nanotube sheets (CNTs) and graphene are among the most studied carbon-based materials for energy storage applications. CNTs are renowned for their high electrical conductivity, mechanical strength, and large surface area, which make them ideal for use in electrode materials [8,9]. Similarly, graphene, with its two-dimensional structure, exceptional electrical conductivity, and high specific surface area, has been extensively researched for its potential to enhance energy storage performance [10,11,12,13]. When combined with other nanomaterials, these carbon-based materials can synergistically enhance the overall properties of the resulting composites, making them suitable for advanced energy storage devices [14,15]. Polyvinylidene fluoride (PVDF) and polyimide (PI) are polymers that have garnered attention in the field of energy storage due to their excellent chemical stability, mechanical properties, and processability [16,17,18]. PVDF, in particular, is known for its high dielectric constant and electroactive properties, which are beneficial for capacitor applications [19,20,21,22]. PI, on the other hand, offers thermal stability and good mechanical strength, which are critical for the longevity and durability of energy storage devices [23,24,25,26,27,28]. Integrating CNTs and PVDF-PI into hybrid nanocomposites combines the advantageous properties of each component, potentially leading to materials with superior performance characteristics [29].
Recent studies have focused on optimizing the composition, processing conditions, and structural configuration of PI/CNTs-PPy hybrid nanocomposites to achieve enhanced energy storage efficiency [30]. For instance, the dispersion of CNTs within the polymer matrix is a key factor that influences the composite's electrical conductivity and mechanical integrity [31,32]. Techniques such as in situ polymerization, solution casting, and electrospinning have achieved uniform dispersion and strong interfacial interactions between CNTs and the polymer matrix [18,33,34]. Additionally, the introduction of dopants and the use of surface modification techniques can further enhance the electrochemical performance of these nanocomposites [35,36].
The purpose of this study is to investigate the PI/CNTs hybrid nanocomposites, with a specific focus on how processing conditions, such as processing temperature, affect their energy storage efficiency. By exploring the impact of different synthesis methods, processing parameters, and structural modifications, this research aims to deepen the understanding of the relationship between these factors and the electrochemical performance of the materials. The ultimate goal is to contribute to the development of next-generation energy storage devices that offer improved efficiency, reliability, and sustainability.
2. Materials and Methods
2.1. Materials
The reagents used in this investigation included 4,4-oxydianiline (ODA) (97% purity), pyromellitic dianhydride (PMDA) (99% purity), N-methyl pyrrolidone (NMP) (99% purity), and reagent-grade pyrrole monomer (98% purity), all purchased from Sigma-Aldrich. The dopant, p-Toluene sulfonic acid, was obtained from Sigma-Aldrich, St. Louis, Missouri, USA. Single-walled carbon nanotubes (SWCNTs) were sourced from TuballTM, Leudelange, Luxembourg. All chemicals were used as received.
The selection of materials and their respective proportions in this study was guided by several key factors aimed at optimizing the performance of polyimide nanocomposites for high-temperature and safety-critical applications in sustainable energy storage systems. These factors included the processing temperature, which was adjusted to produce structures ranging from dense to porous. The CV scan rate was varied to modify the time scale for electrochemical processes. The CNT sheets used in this study consisted of 90% carbon nanotubes (CNTs) and 10% polyvinylidene fluoride (PVDF), as specified by the manufacturer. Additionally, a 10 wt.% polyimide (PI) thin coating was applied to improve thermal stability and mechanical robustness.
2.2. Synthesis and Fabrication of the Hybrid Nanocomposites
2.2.1. Preparation of Polyimide/Carbon Nanotube Sheets (PI/CNTs) Hybrid Nanocomposites
A carbon nanotube sheet (CNTs) containing up to 90 wt.% of CNTs dispersed in polyvinylidene fluoride (PVDF) matrix was used to prepare the PI/CNTs hybrid nanocomposite. The PAA solution, synthesized by reacting equimolar amounts of PMDA and ODA in N-methyl-2-pyrrolidone (NMP) (Scheme 1), was uniformly applied onto the nanotube sheet using the solution casting method. The coated CNT sheet was initially cured in a vacuum oven at 70 °C for several hours to remove the solvent. This was followed by a stepwise thermal treatment process, raising the temperature to 90 °C for an additional six hours under a vacuum of 28 in.Hg. This thermal treatment converted the PAA into polyimide, resulting in a stable and robust composite material (Figure 1a). After cooling, the composite sheet was carefully peeled off the substrate, yielding a CNT/PVDF sheet uniformly covered with polyimide. The composite sheet was then used as the working electrode for the electrochemical deposition of polypyrrole (PPy). This thorough process ensured the film’s stability and integrity, preventing shrinkage and defects. This same process was repeated for samples cured at 180 °C and 250 °C, allowing for a comparative analysis of the impact of different processing temperatures on the material’s properties and electrochemical performance.
2.2.2. Polypyrrole Electrodeposition and Doping
Pyrrole (Py) was dissolved in 100 mL of water to create a 0.5 M solution, to which 0.0225 M p-Toluene sulfonic acid was added. The mixture was stirred until completely dissolved, resulting in a clear solution. The CNTs–PI film was used as the working electrode. Each electrode was immersed in the 0.5 M pyrrole solution within a three-electrode cell configuration connected to a Gamry 3000 potentiostat from Gamry Instruments, Warminster, Pennsylvania, USA (Figure 1b). A glassy carbon counter electrode and an Ag/AgCl reference electrode were employed to perform potentiostatic electrochemical polymerization by applying 2 V for 700 seconds. After the deposition of polypyrrole was completed, each electrode was rinsed with ethanol, dried in a vacuum oven at 100 °C to remove moisture, and weighed.
3. Characterization
3.1. Cyclic Voltammetry
Electrochemical characterization was performed using a Gamry 3000 potentiostat in a three-electrode cell setup with an Ag/AgCl reference electrode. Cyclic voltammetry (CV) was conducted within a 0 to 1 V voltage range, employing scan rates of 5 mV/s, 10mV/s, and 25 mV/s over 1 to 10 cycles. This analysis aimed to determine the nanocomposite electrode's peak current, total charge stored, and specific capacitance. Equation (1) was used to calculate the Cp in F/g, where I (A) is the response current obtained during the voltage sweep ∆V (V) at given scan rates v (mV/s) of the specific active material m (g). ∫IdV is the integrated area under the cyclic voltammetry curve.
The specific capacity of the material (Csp) in mAh/g was calculated using Equation (1b).
3.2. Gravimetric Cyclic Charge/Discharge
Samples were cycled under galvanostatic conditions at a current density of 0.5 A/g, from 0 V to 0.8 V. Specific capacitance (Cp) from charge-discharge curves was calculated using equation (2). Where Im is the discharge current density (Ag-1), is the discharge time (s), and is the drop in voltage (V) during that discharge period [37].
3.3. Electrochemical Impedance Spectroscopy (EIS)
EIS measurements were conducted over a frequency range from 1 MHz to 0.01 Hz, and the results were modeled using a Randle’s cell equivalent electrical circuit for a failed coating that included a solution resistance, pore resistance, double layer capacitor/ Coating capacitor (Cc), in Figure 2. EIS models for calculating specific capacitance (Cp) are based on the Bode and Nyquist plots using equation (4). Where f is the corresponding Bode frequency (s-1) at the apex of the Nyquist plot, Z’max is the max imaginary impedance (Ω), and m is the mass of active material (g). Equation (5) is the Randle circuit model, often used to describe electrochemical impedance in systems like batteries, fuel cells, and supercapacitors. The basic Randles model includes a resistor (Rs), a capacitor (C), a charge transfer resistance (Rct), and a Warburg impedance element (W), which accounts for diffusion effects. Where: Rs is the solution resistance, Rct is the charge transfer resistance, C is the double-layer capacitance, ZW(ω) is the impedance of the Warburg element, and ω is the angular frequency of the AC signal (ω=2πf, where f is the frequency).
A modified version of Archie's law, represented by Equations (6a) and (6b), was employed to estimate the electrode porosity from the EIS data.
Where σeff is the effective electrical conductivity of the electrode, t and A represent the thickness and contact area of the active electrode, respectively, Ru is the bulk resistance, C is the saturation coefficient ranging from 0.1 to 1, σ0 is the electrolyte conductivity, m is the cementation factor (typically between 1.5 to 4), and ϕ represents the sample’s porosity [38,39].
4. Results and Discussions
4.1. Cyclic Voltammetry
Figure 3 shows the transient current–time curves obtained during the potentiostatic electrochemical polymerization of pyrrole onto the composite PI/CNTs working electrodes processed at 90°C, 180°C, and 250°C for 700 seconds of deposition time. The composite processed at 90°C exhibits the highest steady-state current, reaching approximately 0.08 A, indicating that it forms the most efficient PPy layer for ion transport and charge transfer. In contrast, the 180°C condition stabilizes at a lower current of 0.04 A, suggesting a denser structure with reduced ion diffusion. The 250°C processing stabilizes at around 0.06 A, performing better than 180°C but still lower than 90°C. This suggests that, while 250°C creates a stable PPy layer, it does not achieve the same level of ion mobility and electrochemical efficiency as 90°C. Overall, 90°C proves to be the optimal temperature for polymerization, delivering the best electrochemical performance for energy storage applications.
Figure 4 presents the cyclic voltammograms (CVs) of PI/CNTs hybrid nanocomposites processed at 90 °C, followed by the electrodeposition of polypyrrole (PPy). The measurements were conducted using an Ag/AgCl reference electrode and a graphite rod counter electrode, with CV tests run at scan rates of 5 mV/s, 10 mV/s, and 25 mV/s. Figure 2a shows the results after 1 cycle, the peak current increases with the increase in the scan rate from 5 mV/s to 25 mV/s, indicating typical capacitive behavior where faster scan rates allow less time for ion diffusion, leading to higher current peaks. Figure 4b, displaying the CVs after 5 cycles, follows a similar trend, with increased peak currents at higher scan rates. Figure 4c, shows the CV results after 10 cycles, continuing this trend, with further increased peak currents as the scan rate increases. Compared to the 1 and 5-cycle data, the enhanced current response indicates that the electrode's performance improves with continued cycling, due to forming a more stable and efficient electrochemical interface.
Figure 5 presents the cyclic voltammograms (CVs) of PI/CNTs hybrid nanocomposites processed at 180 °C, followed by the electrodeposition of polypyrrole (PPy). The CV measurements were conducted using an Ag/AgCl reference electrode and a graphite rod counter electrode at scan rates of 5 mV/s, 10 mV/s, and 25 mV/s. Figure 5a shows the results after 1 cycle, the peak current increases as the scan rate rises from 5 mV/s to 25 mV/s, indicating typical capacitive behavior where faster scan rates lead to higher current peaks due to reduced time for ion diffusion. Figure 5b, displaying the CVs after 5 cycles, shows a consistent trend of increasing peak current with higher scan rates, with an overall higher current response compared to the 1-cycle data. Figure 5c illustrates the CV results after 10 cycles, where the peak currents continue to increase with higher scan rates. The current response is further enhanced compared to the 5-cycle data, indicating that the electrode's performance continues to improve with repeated cycling, potentially due to the formation of a more stable and efficient electrochemical interface. This suggests that repeated cycling improves the electrode's electrochemical performance by enhancing the utilization of active material and stabilizing the electrode surface.
Figure 6 presents the cyclic voltammograms (CVs) of PI/CNTs hybrid nanocomposites processed at 250 °C, followed by the electrodeposition of polypyrrole (PPy). The CV measurements were conducted using an Ag/AgCl reference electrode and a graphite rod counter electrode at a scan rate of 5 mV/s. In Figure 6a, after 1 cycle, the peak current increases with the scan rate, indicating typical capacitive behavior. However, the current response is lower compared to composites processed at lower temperatures, suggesting a reduction in electrochemical performance possibly due to the high processing temperature affecting the material's structure. Figure 6b shows the CVs after 5 cycles, where the peak currents are slightly higher than in the 1-cycle data, indicating that repeated cycling improves the electrode's performance. Despite this, the overall current response remains lower than that of composites processed at lower temperatures, implying that the high processing temperature might have negatively impacted the material's active surface area or conductivity. Figure 6c illustrates the CV results after 10 cycles, showing a continued increase in peak currents with the scan rate, though the overall enhancement in performance with cycling is modest. This suggests that the high processing temperature may limit the material's ability to achieve optimal electrochemical performance. These results highlight that while the PI/CNTs hybrid nanocomposites processed at 250 °C exhibit capacitive behavior and some improvement with cycling, the high processing temperature adversely affected the material's structure, leading to lower overall electrochemical performance compared to composites processed at lower temperatures. This emphasizes the importance of processing conditions for the best possible performance in energy storage applications.
Figure 7 displays the cyclic voltammograms (CVs) of PI/CNTs hybrid nanocomposites processed at three different temperatures 90 °C, 180 °C, and 250 °C followed by the electrodeposition of polypyrrole (PPy). The CV measurements were conducted using an Ag/AgCl reference electrode and a graphite rod counter electrode for 1 cycle at scan rates of 5 mV/s, 10 mV/s, and 25 mV/s. In Figure 7a, which shows the CV results at a scan rate of 5 mV/s, the composites processed at 90 °C exhibit the highest peak current, indicating superior capacitive behavior and electrochemical performance. The peak currents decrease for the composites processed at 180 °C and further decrease for those processed at 250 °C, suggesting that higher processing temperatures may negatively impact the electrochemical properties, possibly due to structural changes in the material that reduces its conductivity or active surface area. Figure 7b, which displays the CVs at a scan rate of 10 mV/s, shows a similar trend where the composites processed at 90 °C continue to exhibit the highest peak current, followed by those processed at 180 °C and 250 °C. Although the increased scan rate leads to higher current peaks, the relative performance trend remains consistent, with lower processing temperatures yielding better electrochemical results. Figure 7c, illustrating the CVs at a scan rate of 25 mV/s, further reinforces this pattern. The composites processed at 90 °C show the best electrochemical performance, with the highest peak currents, while the performance decreases with increasing processing temperature, with the composites processed at 250 °C showing the lowest peak currents. This consistent pattern across different scan rates underscores the significant impact of processing temperature on the electrochemical performance of the composites, highlighting that the 90 °C processing condition consistently produces the best results, making it the best temperature for preparing these composites for high-performance energy storage applications. Conversely, higher temperatures may lead to detrimental structural changes that reduce the effectiveness of the material.
Figure 8 shows the cyclic voltammograms (CVs) of PI/CNTs hybrid nanocomposites processed at 90 °C, 180 °C, and 250 °C, followed by the electrodeposition of polypyrrole (PPy). The CV measurements were conducted using an Ag/AgCl reference electrode and a graphite rod counter electrode after 5 cycles, with scan rates of 5 mV/s, 10 mV/s, and 25 mV/s. Figure 8a shows the CVs at 5 mV/s, the composite processed at 90 °C demonstrates the highest peak current, indicating superior electrochemical performance. As the processing temperature increases to 180 °C and 250 °C, the peak current decreases, suggesting a reduction in electrochemical activity, likely due to structural changes that negatively impact the material's conductivity or surface area. Figure 8b, the CVs at 10 mV/s, shows a consistent trend where the 90 °C processed composite again exhibits the highest peak current, followed by the 180 °C and 250 °C samples. The higher scan rate leads to increased currents overall, but the decline in performance with rising temperature remains evident. Figure 8c shows the CVs at 25 mV/s, the composite processed at 90 °C continues to exhibit the best electrochemical performance with the highest peak currents, while the composites processed at 180 °C and 250 °C show progressively lower currents. This consistent pattern across different scan rates emphasizes the significant impact of processing temperature on the electrochemical behavior of the composites, highlighting that the 90 °C processing condition provides the best performance, whereas higher temperatures seem to adversely affect the material's structure and efficiency.
Figure 9 presents the cyclic voltammograms (CVs) of PI/CNTs hybrid nanocomposites processed at 90 °C, 180 °C, and 250 °C, followed by the electrodeposition of polypyrrole (PPy). The CV measurements were conducted using an Ag/AgCl reference electrode and a graphite rod counter electrode after 10 cycles, with scan rates of 5 mV/s, 10 mV/s, and 25 mV/s. Figure 9a, shows the CVs at 5 mV/s, the composite processed at 90 °C demonstrates the highest peak current, indicating superior electrochemical performance. As the processing temperature increases to 180 °C and 250 °C, the peak currents decrease, suggesting a reduction in electrochemical activity, likely due to structural changes that negatively impact the material's conductivity and active surface area. Figure 9b, which presents the CVs at 10 mV/s, continues this trend, with the 90 °C processed composite showing the highest peak current, followed by the 180 °C and 250 °C samples. Although the increase in scan rate results in higher current peaks overall, the decline in performance with increasing temperature remains consistent. Figure 9c, displaying the CVs at 25 mV/s, further reinforces this pattern, with the composite processed at 90 °C demonstrating the best electrochemical performance and the highest peak currents. The performance decreases with increasing processing temperature, with the 250 °C sample showing the lowest peak currents. This consistent pattern across different scan rates and cycles highlights that the PI/CNTs hybrid nanocomposites processed at 90 °C consistently exhibits the best electrochemical performance, making it the optimal temperature for preparing these composites for high-performance energy storage applications. Conversely, higher processing temperatures seem to negatively impact the material's structure, leading to lower overall electrochemical performance.
Figures 10 illustrate the variation of specific capacitance calculated from cyclic voltammograms (CVs) at different scan rates (5 mV/s, 10 mV/s, and 25 mV/s) for PI/CNTs hybrid nanocomposites processed at various temperatures (90 °C, 180 °C, and 250 °C) and tested after 1 cycle, 5 cycles, and 10 cycles. Across all conditions, the specific capacitance decreases as the scan rate increases, which is typical for capacitive materials. This trend occurs because slower scan rates provide more time for ion diffusion and better interaction with the electrode surface, leading to higher capacitance values. In the 1-cycle tests, the specific capacitance at 90 °C starts around 651.68 F/g at 5 mV/s, decreases to approximately 236.25 F/g at 10 mV/s, and then slightly increases to about 257.61 F/g at 25 mV/s. This pattern suggests that ion movement becomes more restricted at higher scan rates, particularly during the initial cycle. In the 5-cycle tests, the specific capacitance shows improvement, with values around 626.80 F/g at 5 mV/s, 438.22 F/g at 10 mV/s, and 256.43 F/g at 25 mV/s, indicating enhanced charge storage capability as the electrode material stabilizes with repeated cycling. The 10-cycle tests show further gains, reaching approximately 655.34 F/g at 5 mV/s, 446.48 F/g at 10 mV/s, and 277.69 F/g at 25 mV/s, demonstrating even better charge storage and material stability with more cycles. With the impact of processing temperature, it is clear that the composites processed at 90 °C consistently exhibit the highest specific capacitance across all scan rates for 1 cycle, 5 cycles, and 10 cycles, followed by those processed at 180 °C and 250 °C. This pattern suggests that lower processing temperatures are more favorable for maximizing specific capacitance, likely due to better preservation of the material's structure and electrochemical properties. As the processing temperature increases, the material likely undergoes structural degradation, which diminishes its electrochemical performance. Despite the decline in specific capacitance at higher scan rates, the electrodes maintain strong performance even after 5 and 10 cycles, indicating their good potential for high-rate applications. The PI/CNTs hybrid nanocomposites demonstrate excellent specific capacitance, particularly at lower scan rates and with increased cycling, emphasizing their potential for high-performance energy storage applications, especially when processed at the best processing temperatures.
Figure 11.
Variation of specific capacities calculated from CV of (a) (i) 5mV/s at 1 cycle, (ii) 10mV/s at 1 cycle, (iii) 25mV/s at 1 cycle, (b) (i) 5mV/s at 5 cycle, (ii) 10mV/s at 5 cycle,(iii) 25mV/s at 5 cycle, (c) (i) 5mV/s at 10 cycles, (ii) 10mV/s at 10 cycles, (iii) 25mV/s at 10 cycles, (d) (i) 90oC at 1 cycle, (ii) 180oC at 1 cycle, (iii) 250oC at 1 cycle (e) (i) 90oC at 5 cycles, (ii) 180oC at 5 cycles, (iii) 250oC at 5 cycles and (f) (i) 90oC at 10 cycles, (ii) 180oC at 10 cycles, (iii) 250oC at 10 cycles.
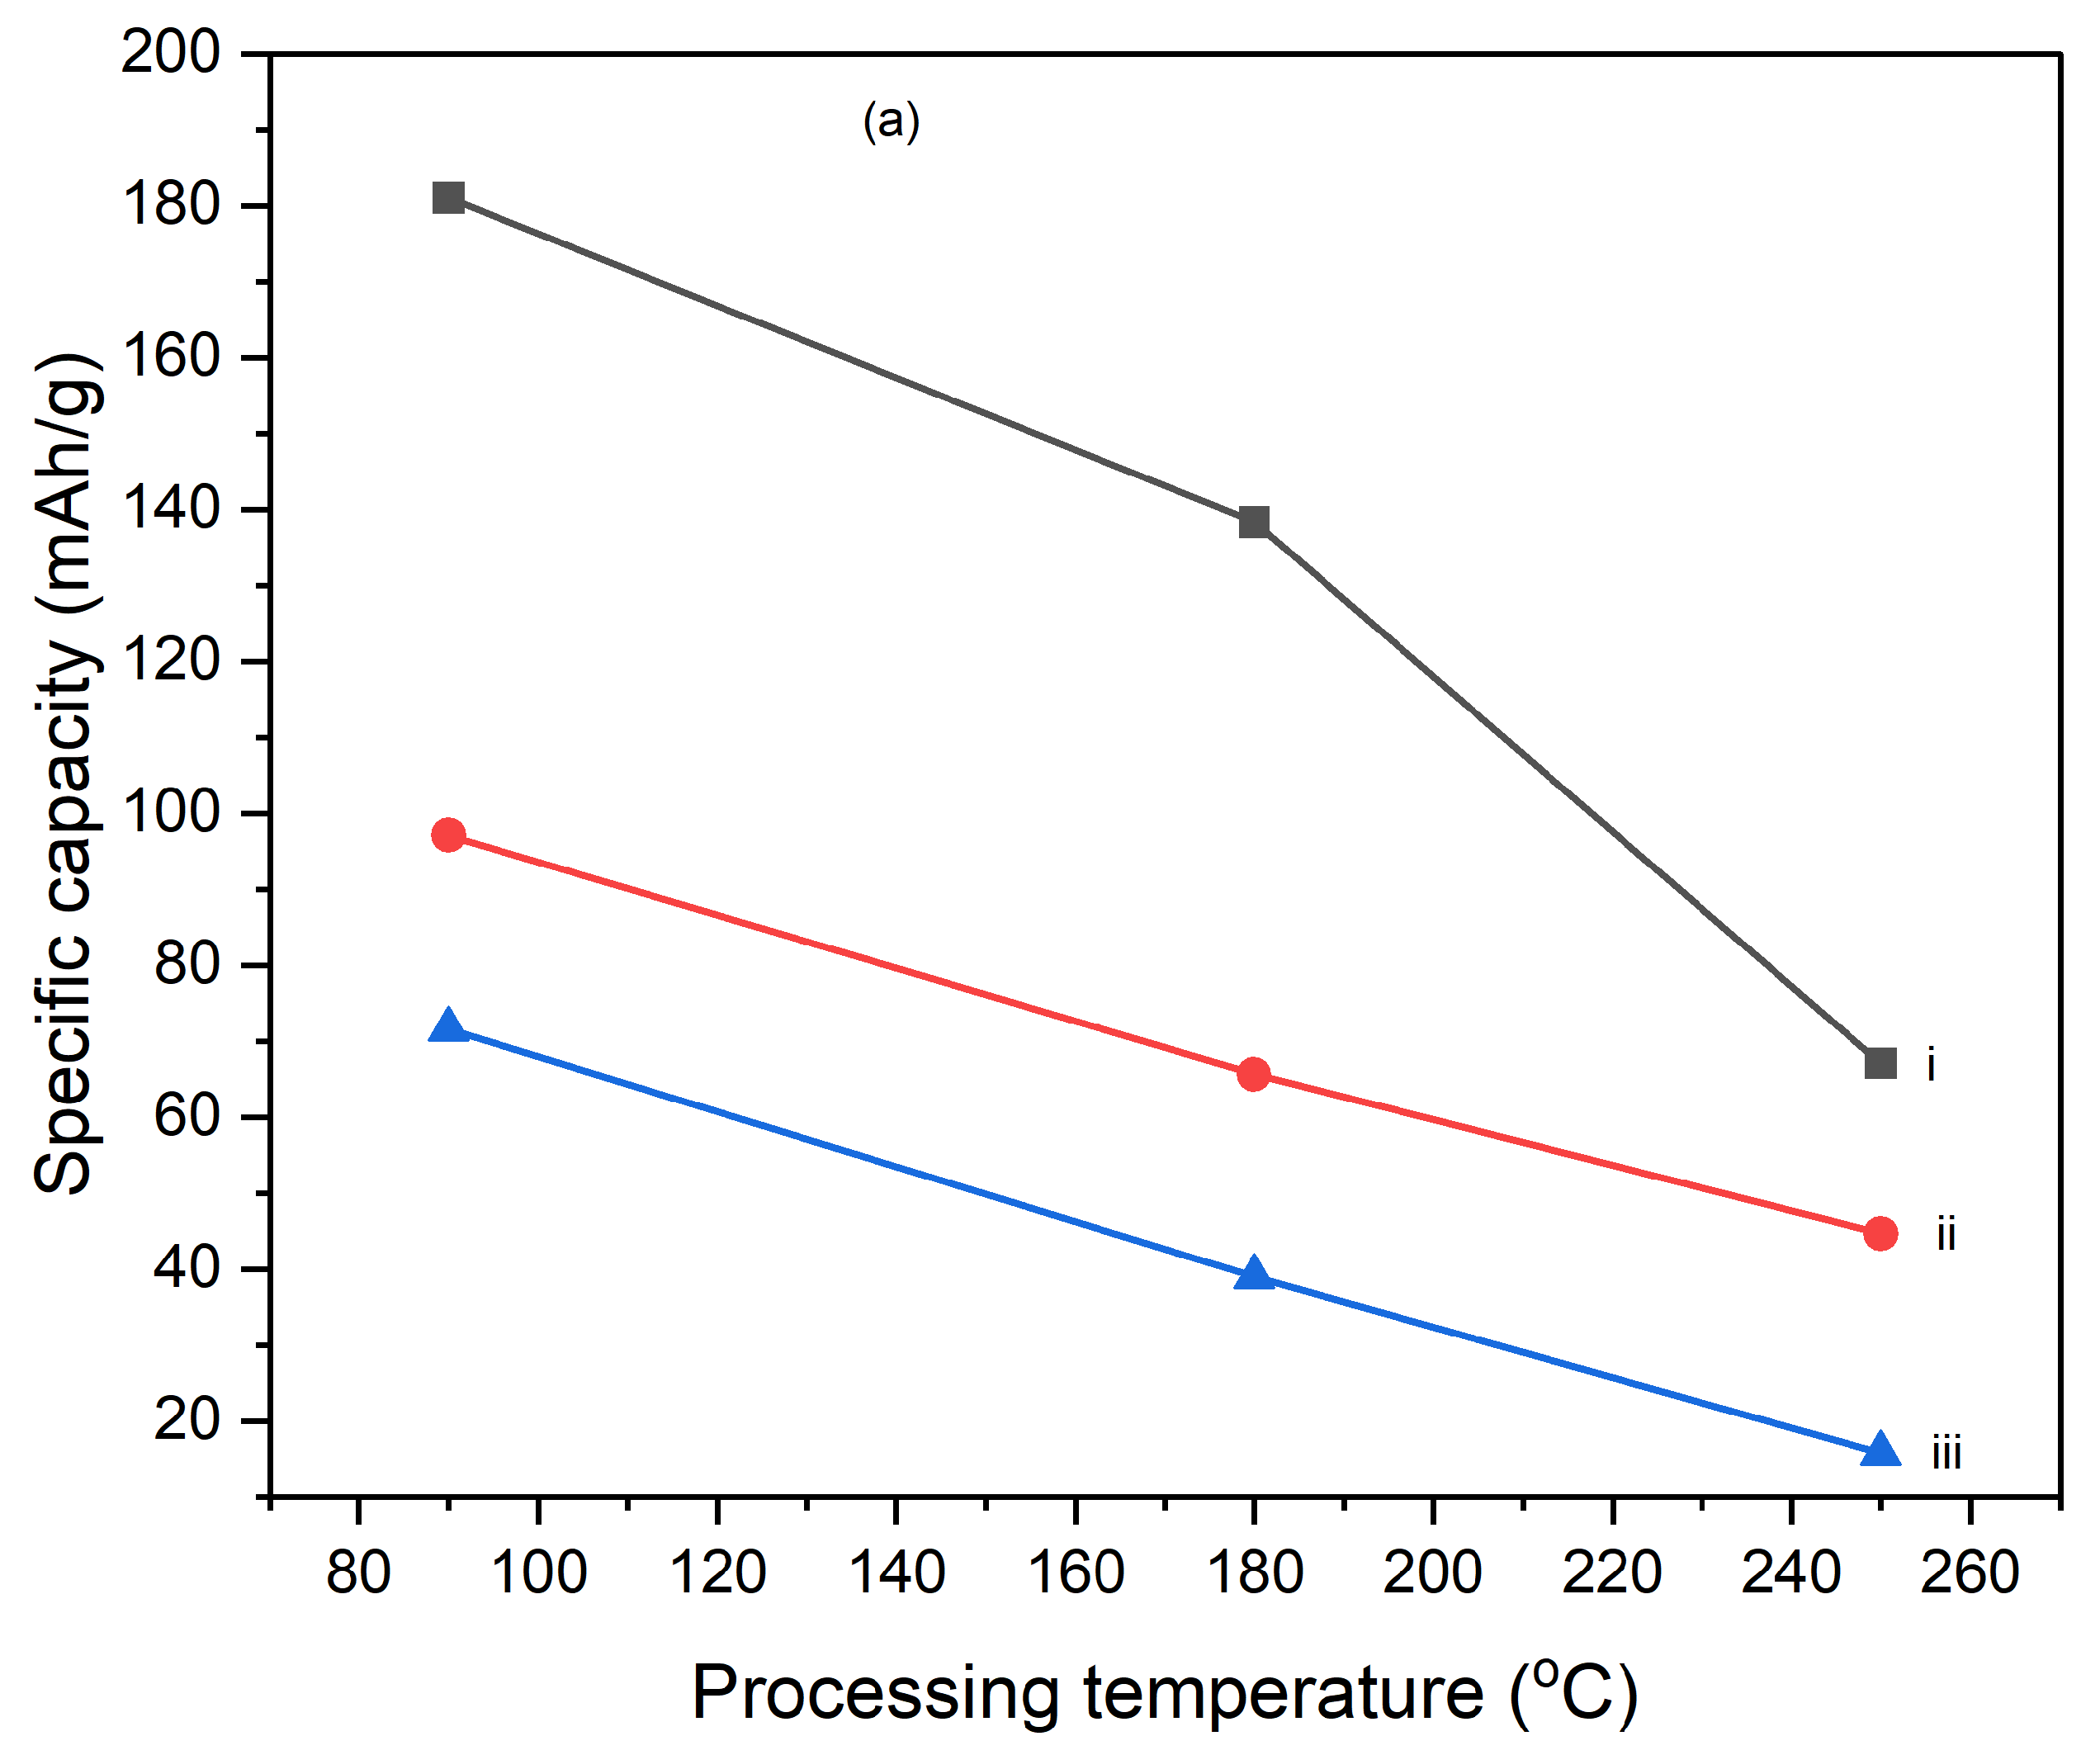
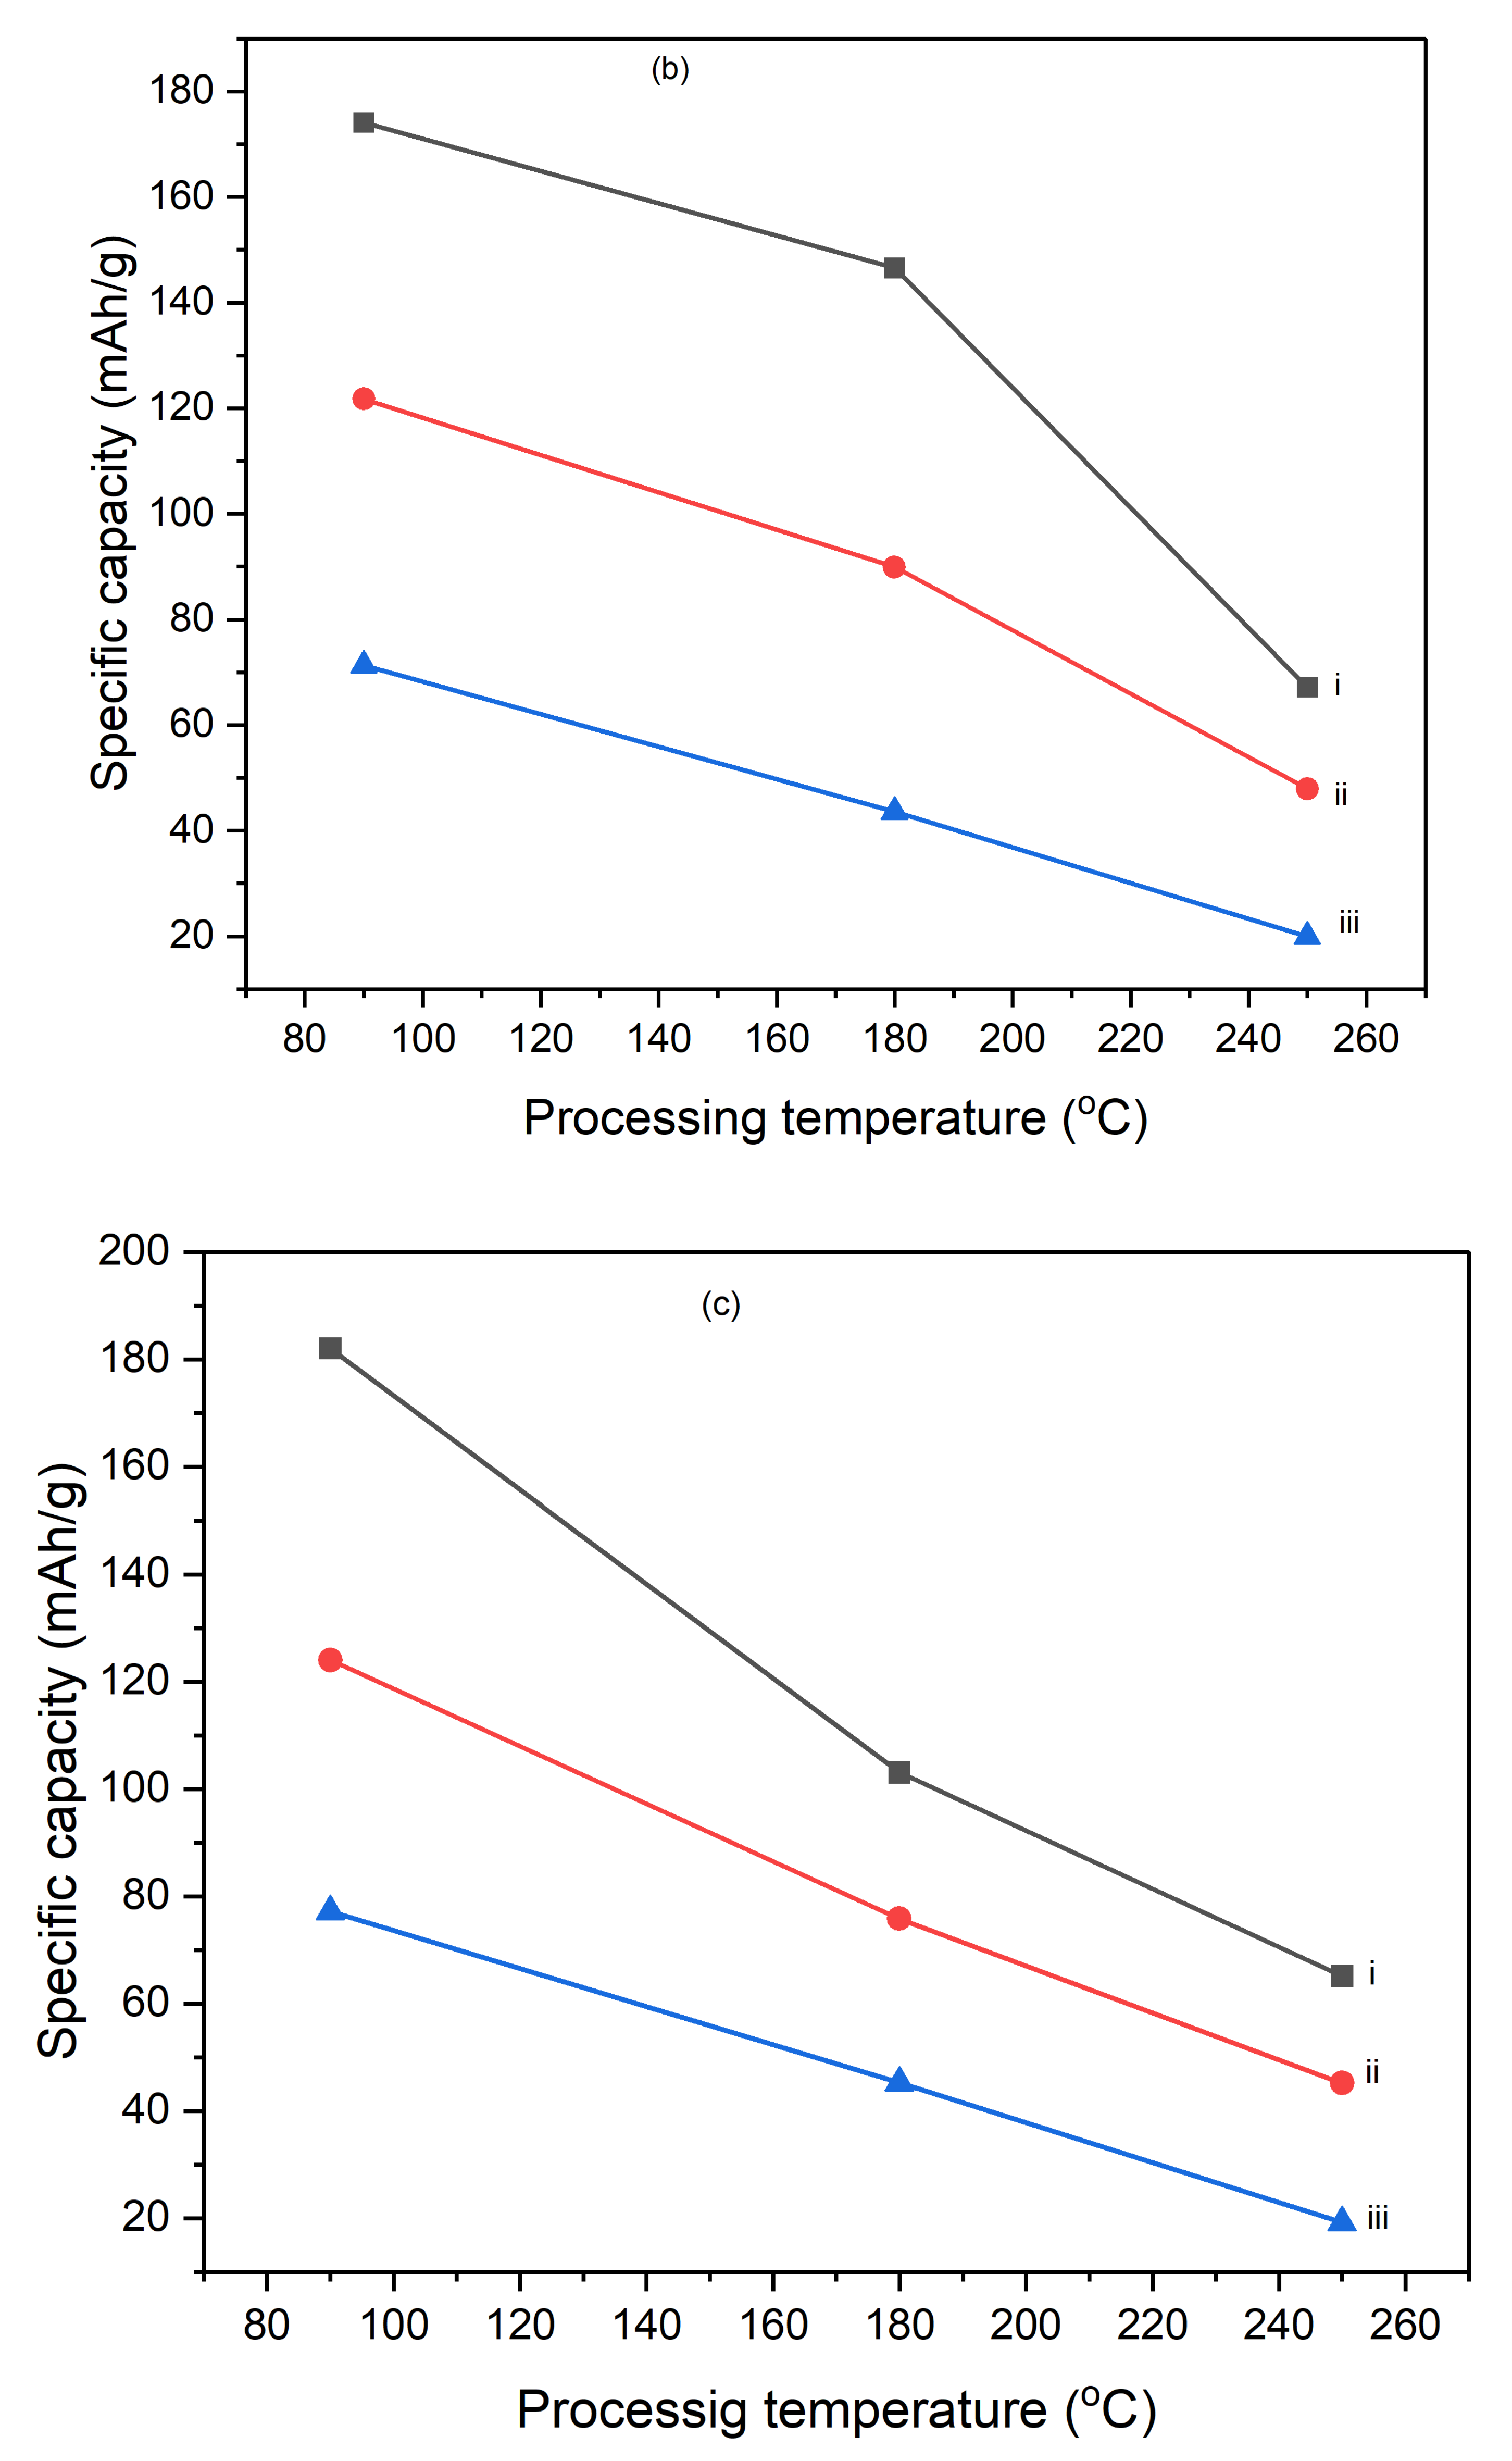
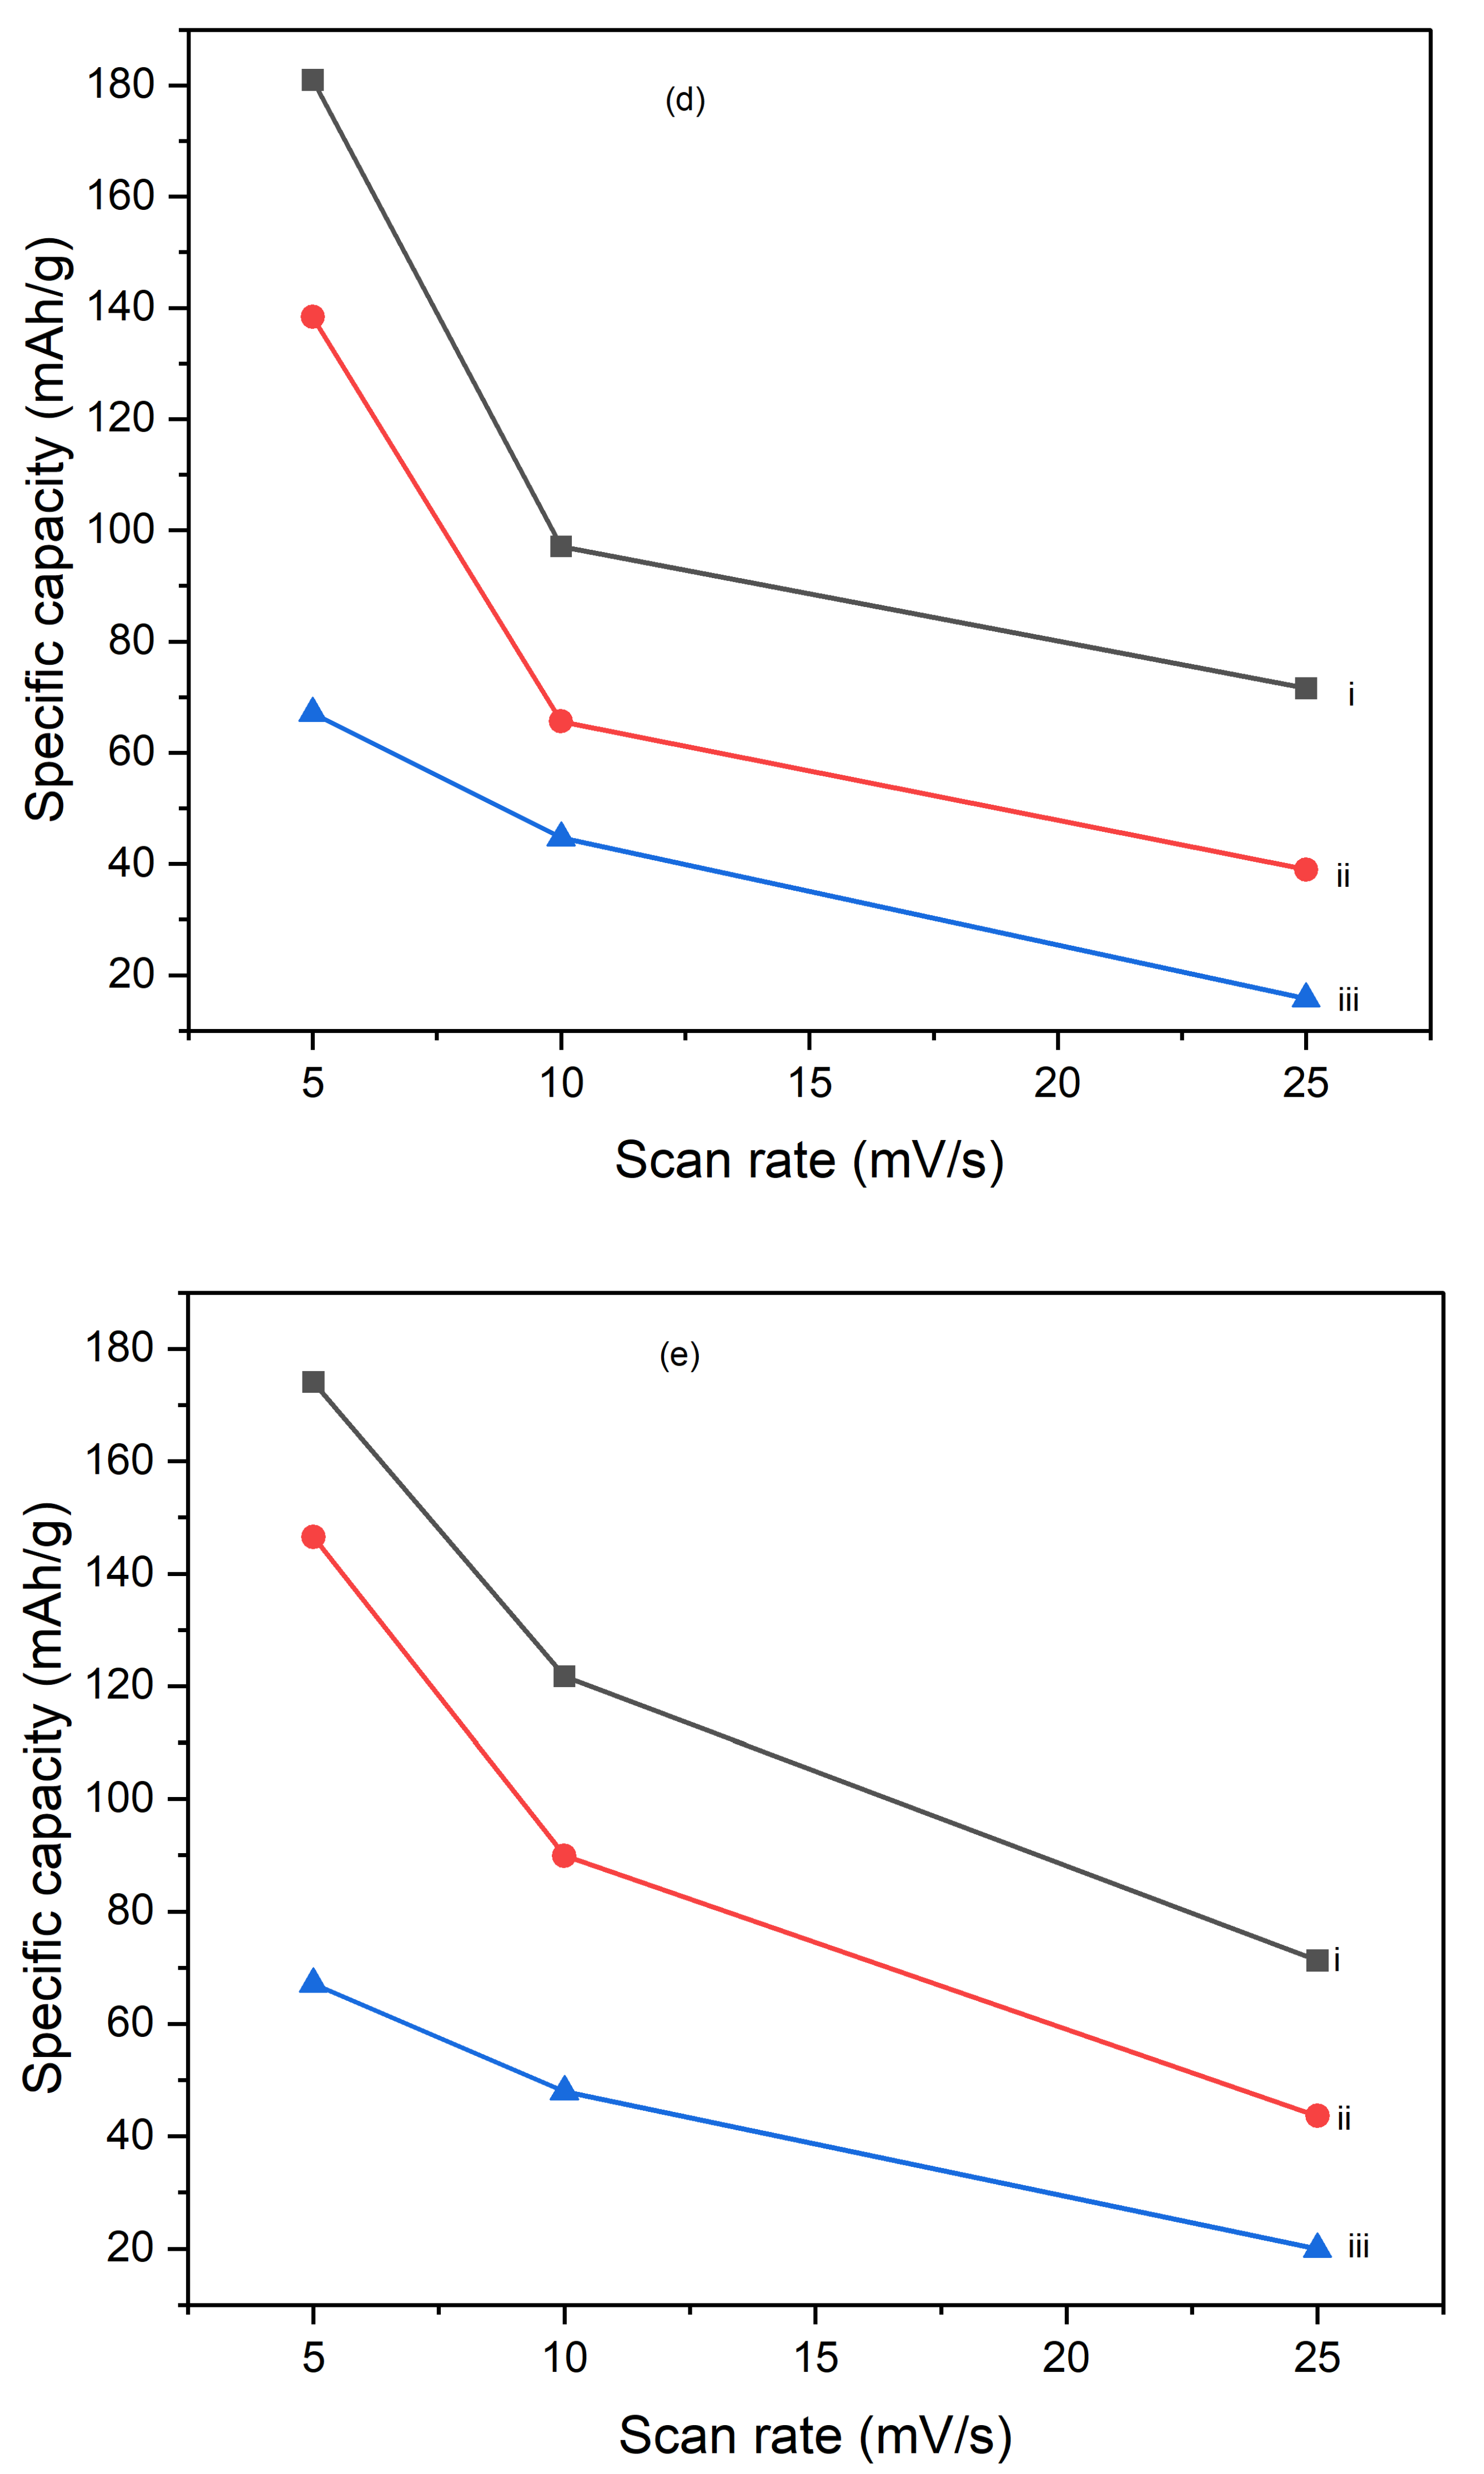
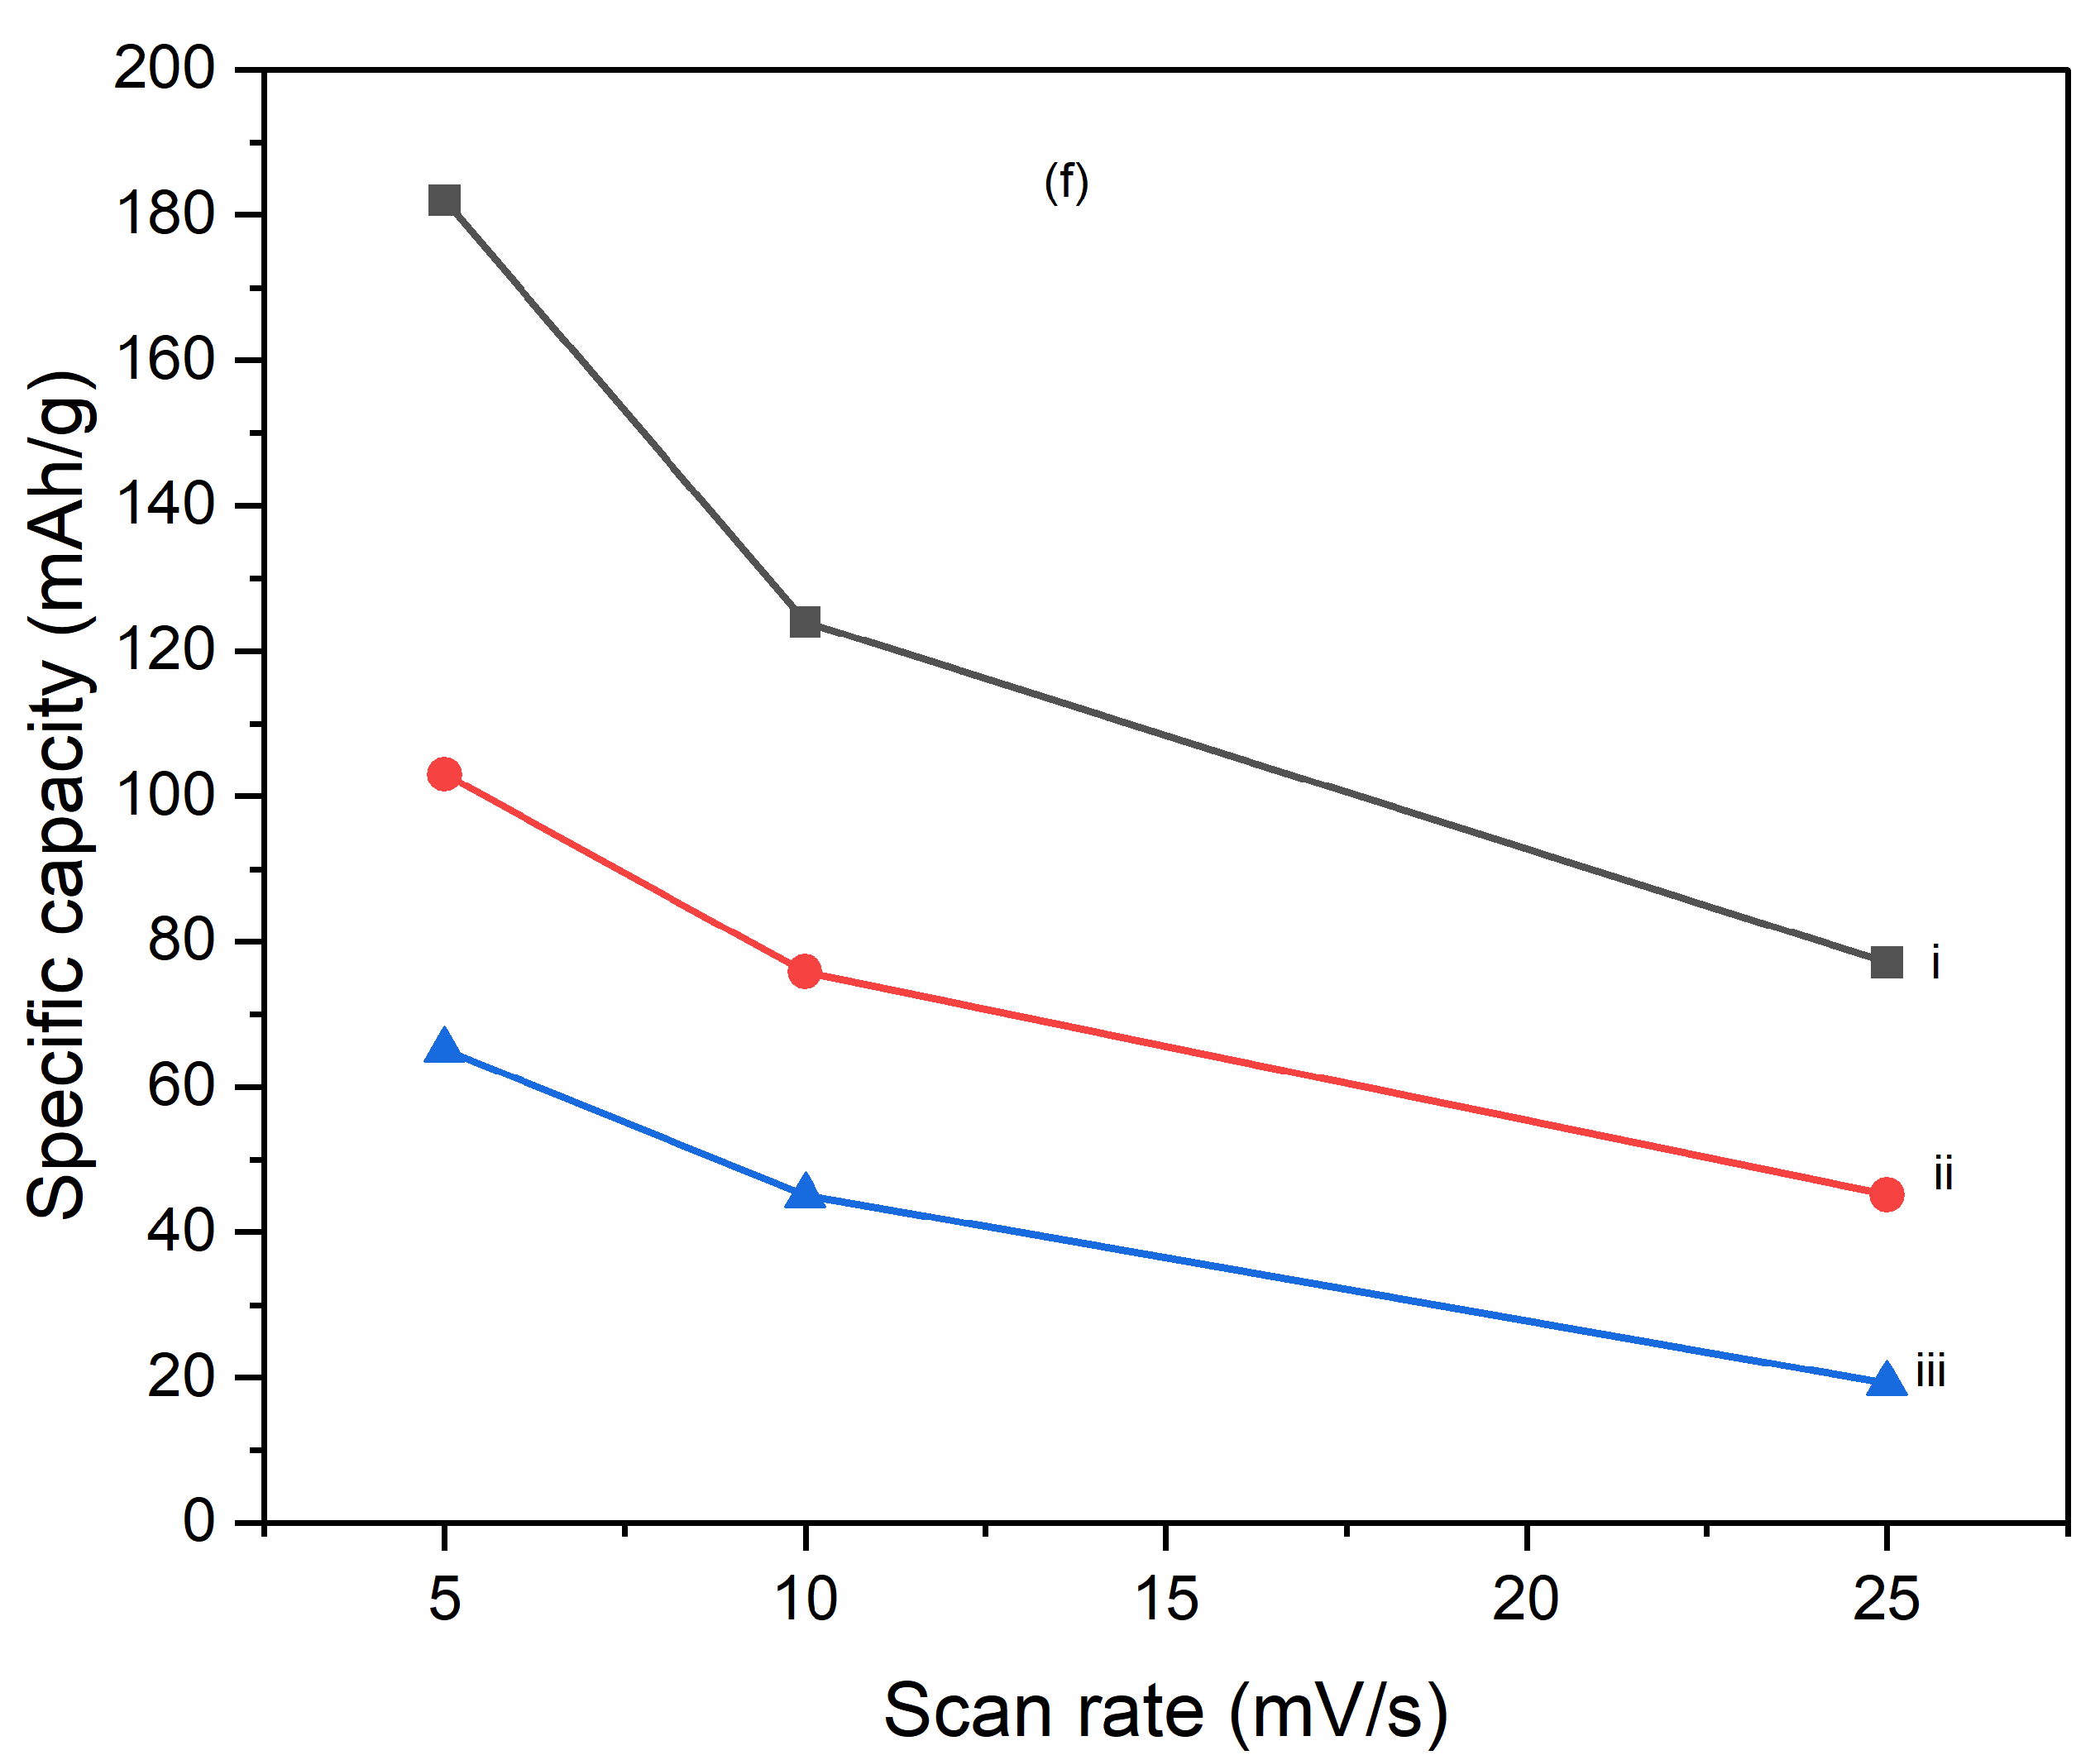

Table 1.
Calculated specific capacitance from cyclic voltammetry.
| CNTs/PI-PPy electrode |
Specific capacitance (F/g) 5mV/s 10mV/s 25mV/s |
||
| 90oC | 655.34 | 446.48 | 277.69 |
| 180oC | 370.99 | 272.95 | 162.68 |
| 250oC | 234.42 | 162.78 | 69.02 |
Table 2.
Calculated specific capacities from cyclic voltammetry.
| CNTs/PI-PPy electrode |
Specific capacities (mAh/g) 5mV/s 10mV/s 25mV/s |
||
| 90oC | 182.04 | 124.02 | 77.14 |
| 180oC | 103.05 | 75.82 | 45.19 |
| 250oC | 65.12 | 45.22 | 19.17 |
Figure 12 demonstrates that the processing temperature significantly influences the capacitance retention and overall electrochemical stability of CNTs/PI–PPy composite electrodes over 10 cycles at a current density of 0.5 A/g. The electrode processed at 90°C shows the best performance, maintaining capacitance retention around 100% throughout the 10 cycles with minimal degradation, indicating excellent stability and suggesting that 90°C is an optimal processing temperature. In contrast, the electrode processed at 180°C exhibits a noticeable decline in capacitance retention after the 4th cycle, dropping to around 80% by the 10th cycle. This suggests that this temperature may lead to material degradation or poor component interaction, affecting long-term performance. The 250°C processed electrode, while more stable than the 180°C sample, does not surpass the performance of the 90°C electrode, indicating that although higher temperatures may enhance certain material properties, they do not necessarily improve long-term electrochemical stability. Overall, the 90°C processing temperature is the most effective for achieving high capacitance retention and stability, making it the preferred choice for optimizing the performance of these composite electrodes in energy storage applications.
4.2. Galvanostatic Charge/Discharge
The charge/discharge curves in Figure 13 show the electrochemical performance of CNTs//PI–PPy composites processed at different temperatures (90 °C, 180 °C, and 250 °C) under an energy density of 0.5 A/g. The composite processed at 90 °C shows the longest discharge time, indicating the highest energy storage capacity, with a smooth and symmetric curve suggesting good capacitive behavior and efficient charge storage and release. The 180 °C composite exhibits a shorter discharge time and slight asymmetry, reflecting intermediate performance and some polarization effects. The 250 °C composite has the shortest discharge time and the most asymmetric curve, indicating the lowest energy storage capacity and higher resistance, likely due to material degradation or structural changes at the higher temperature. Overall, the 90 °C processed composite demonstrates the best electrochemical performance, emphasizing the importance of optimizing processing temperatures for supercapacitor applications. Higher processing temperatures negatively impact energy storage capacity and charge/discharge efficiency, as shown by the poorer performance of the 180 °C and 250 °C samples
Figure 14 and Figure 15 together illustrate the impact of processing temperature on the electrochemical performance of CNTs/PI composite electrodes electrodeposited with polypyrrole (PPy), as measured by galvanostatic charge-discharge (GCD) at a current density of 0.5 A/g. In Figure 14, the specific capacitance is shown to decrease significantly as the processing temperature increases. The composite electrode processed at 90 °C demonstrates the highest specific capacitance, approximately 266 F/g. However, with an increase in processing temperature to 180 °C, the specific capacitance drops sharply to around 135 F/g and further decreases to 113 F/g at 250 °C. This decline suggests that higher processing temperatures may negatively affect the composite’s ability to store charge, likely due to thermal degradation or alterations in the microstructure, such as reduced porosity or increased internal resistance, which hinder effective ion transport. Similarly, Figure 15 shows a corresponding decrease in specific capacity with increasing processing temperatures. The specific capacity of the composite electrode at 90 °C is the highest, around 74 mAh/g. As the temperature rises to 180 °C, the specific capacity drops to about 37 mAh/g, and further decreases to approximately 30 mAh/g at 250 °C. This trend parallels the decline observed in specific capacitance, reinforcing the idea that higher processing temperatures degrade the material's electrochemical properties, potentially due to reduced active surface area, decreased porosity, or changes in the internal resistance of the material. When considering both figures together, it becomes evident that processing temperature plays a critical role in determining the electrochemical performance of PI/CNTs hybrid nanocomposite electrodes. Lower processing temperatures, particularly around 90 °C, are more favorable for achieving higher specific capacitance and specific capacity. This is likely because lower temperatures help preserve the material's microstructure, ensuring higher porosity, better ion mobility, and lower internal resistance, which contribute to more efficient charge storage. On the contrary, higher processing temperatures, such as 180 °C and 250 °C, appear to impair these properties, leading to diminished electrochemical performance. This degradation may be attributed to factors such as thermal degradation, which can alter the material's structure, reduce active sites, and increase the resistance to ion movement, ultimately lowering both specific capacitance and specific capacity. Additionally, it's important to note the discrepancy between the specific capacitance values obtained from GCD measurements in Figure 13 and Figure 14 and those derived from cyclic voltammetry (CV) curves. GCD measurements, which involve a constant current charge-discharge process, tend to produce lower apparent capacitance due to higher polarization and greater voltage drops. In contrast, CV is more sensitive to surface redox reactions and captures more transient processes, often leading to higher capacitance values.
Figure 14.
The specific capacitance of composite electrode PI/CNTs doped with PPy was measured by using GCD at 0.5 A/g.
Figure 14.
The specific capacitance of composite electrode PI/CNTs doped with PPy was measured by using GCD at 0.5 A/g.
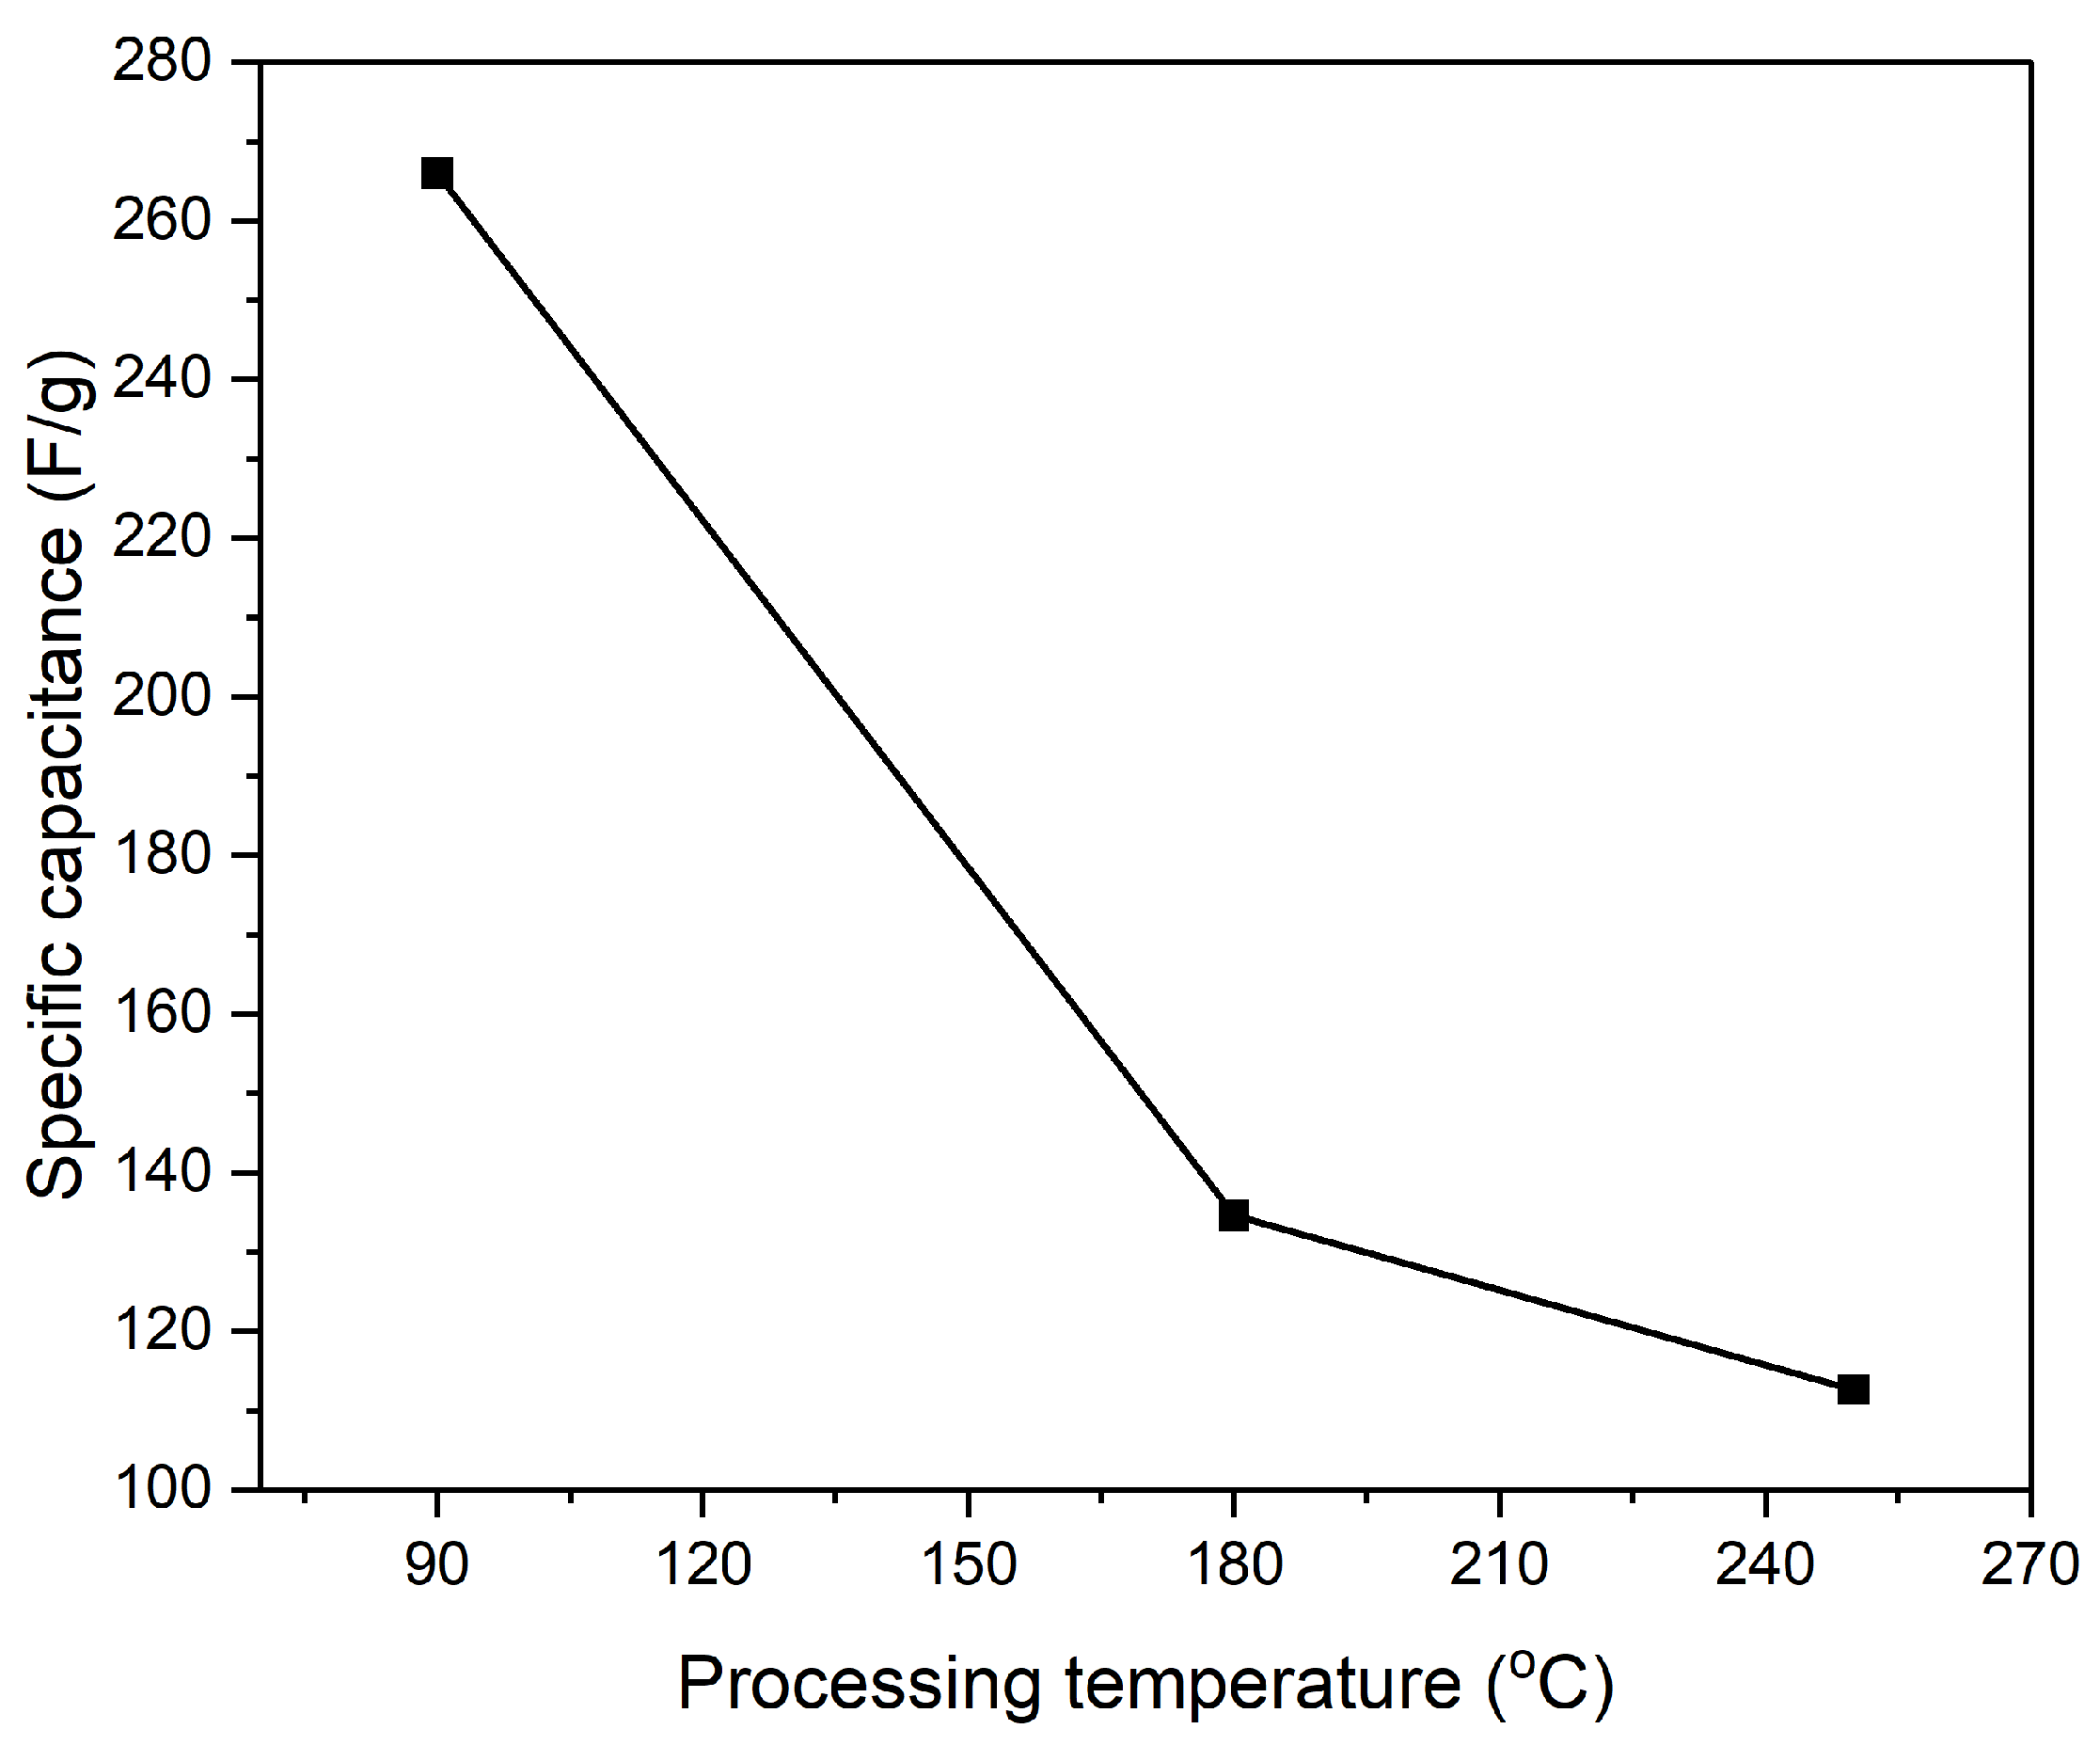
Figure 15.
The specific capacity of composite electrode PI/CNTs doped with PPy was measured by using GCD at 0.5 A/g.
Figure 15.
The specific capacity of composite electrode PI/CNTs doped with PPy was measured by using GCD at 0.5 A/g.
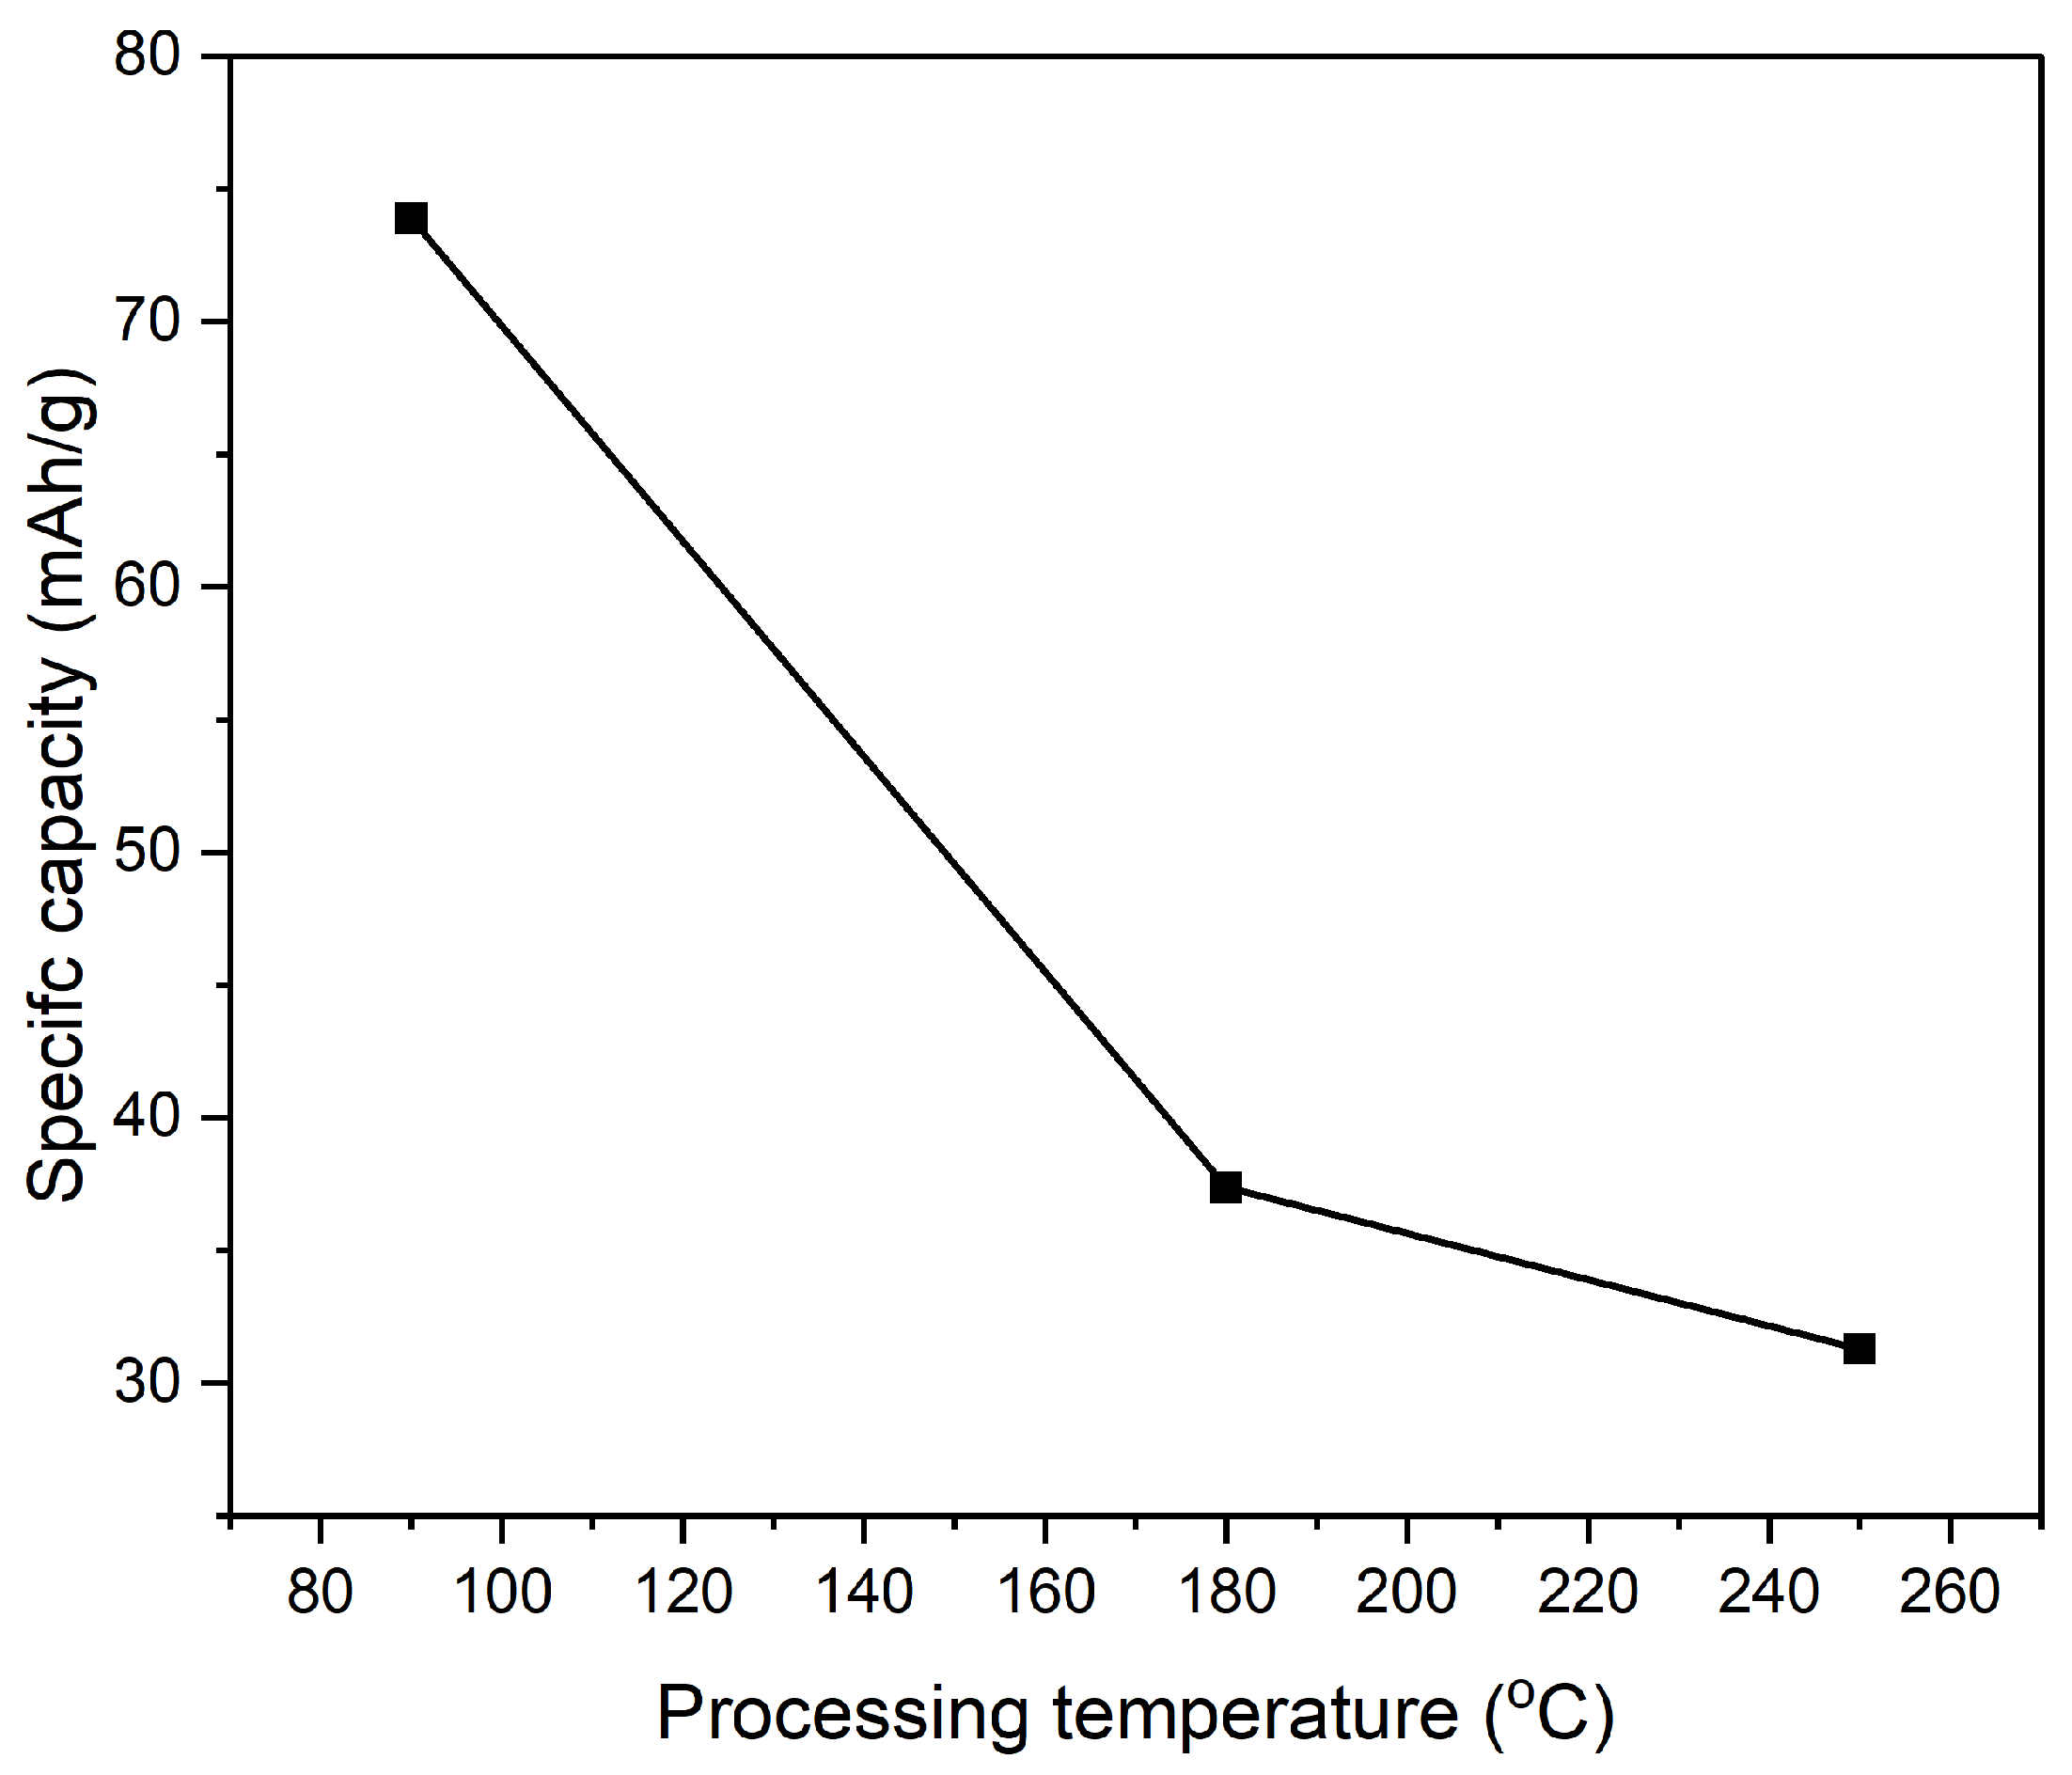
Table 3.
Summary of specific capacitance and capacities obtained from charge-discharge cycles for 700-second deposition at 0.5 A/g.
Table 3.
Summary of specific capacitance and capacities obtained from charge-discharge cycles for 700-second deposition at 0.5 A/g.
| PI/CNTs–PPy electrode |
Specific Capacitance (F/g) 0.5A/g |
Specific Capacity (mAh/g) |
|
| 90 °C | 265.98 | 73.88 | |
| 180 °C | 134.58 | 37.38 | |
| 250 °C | 112.65 | 31.29 |
4.3. Electrochemical Impedance Spectroscopy (EIS)
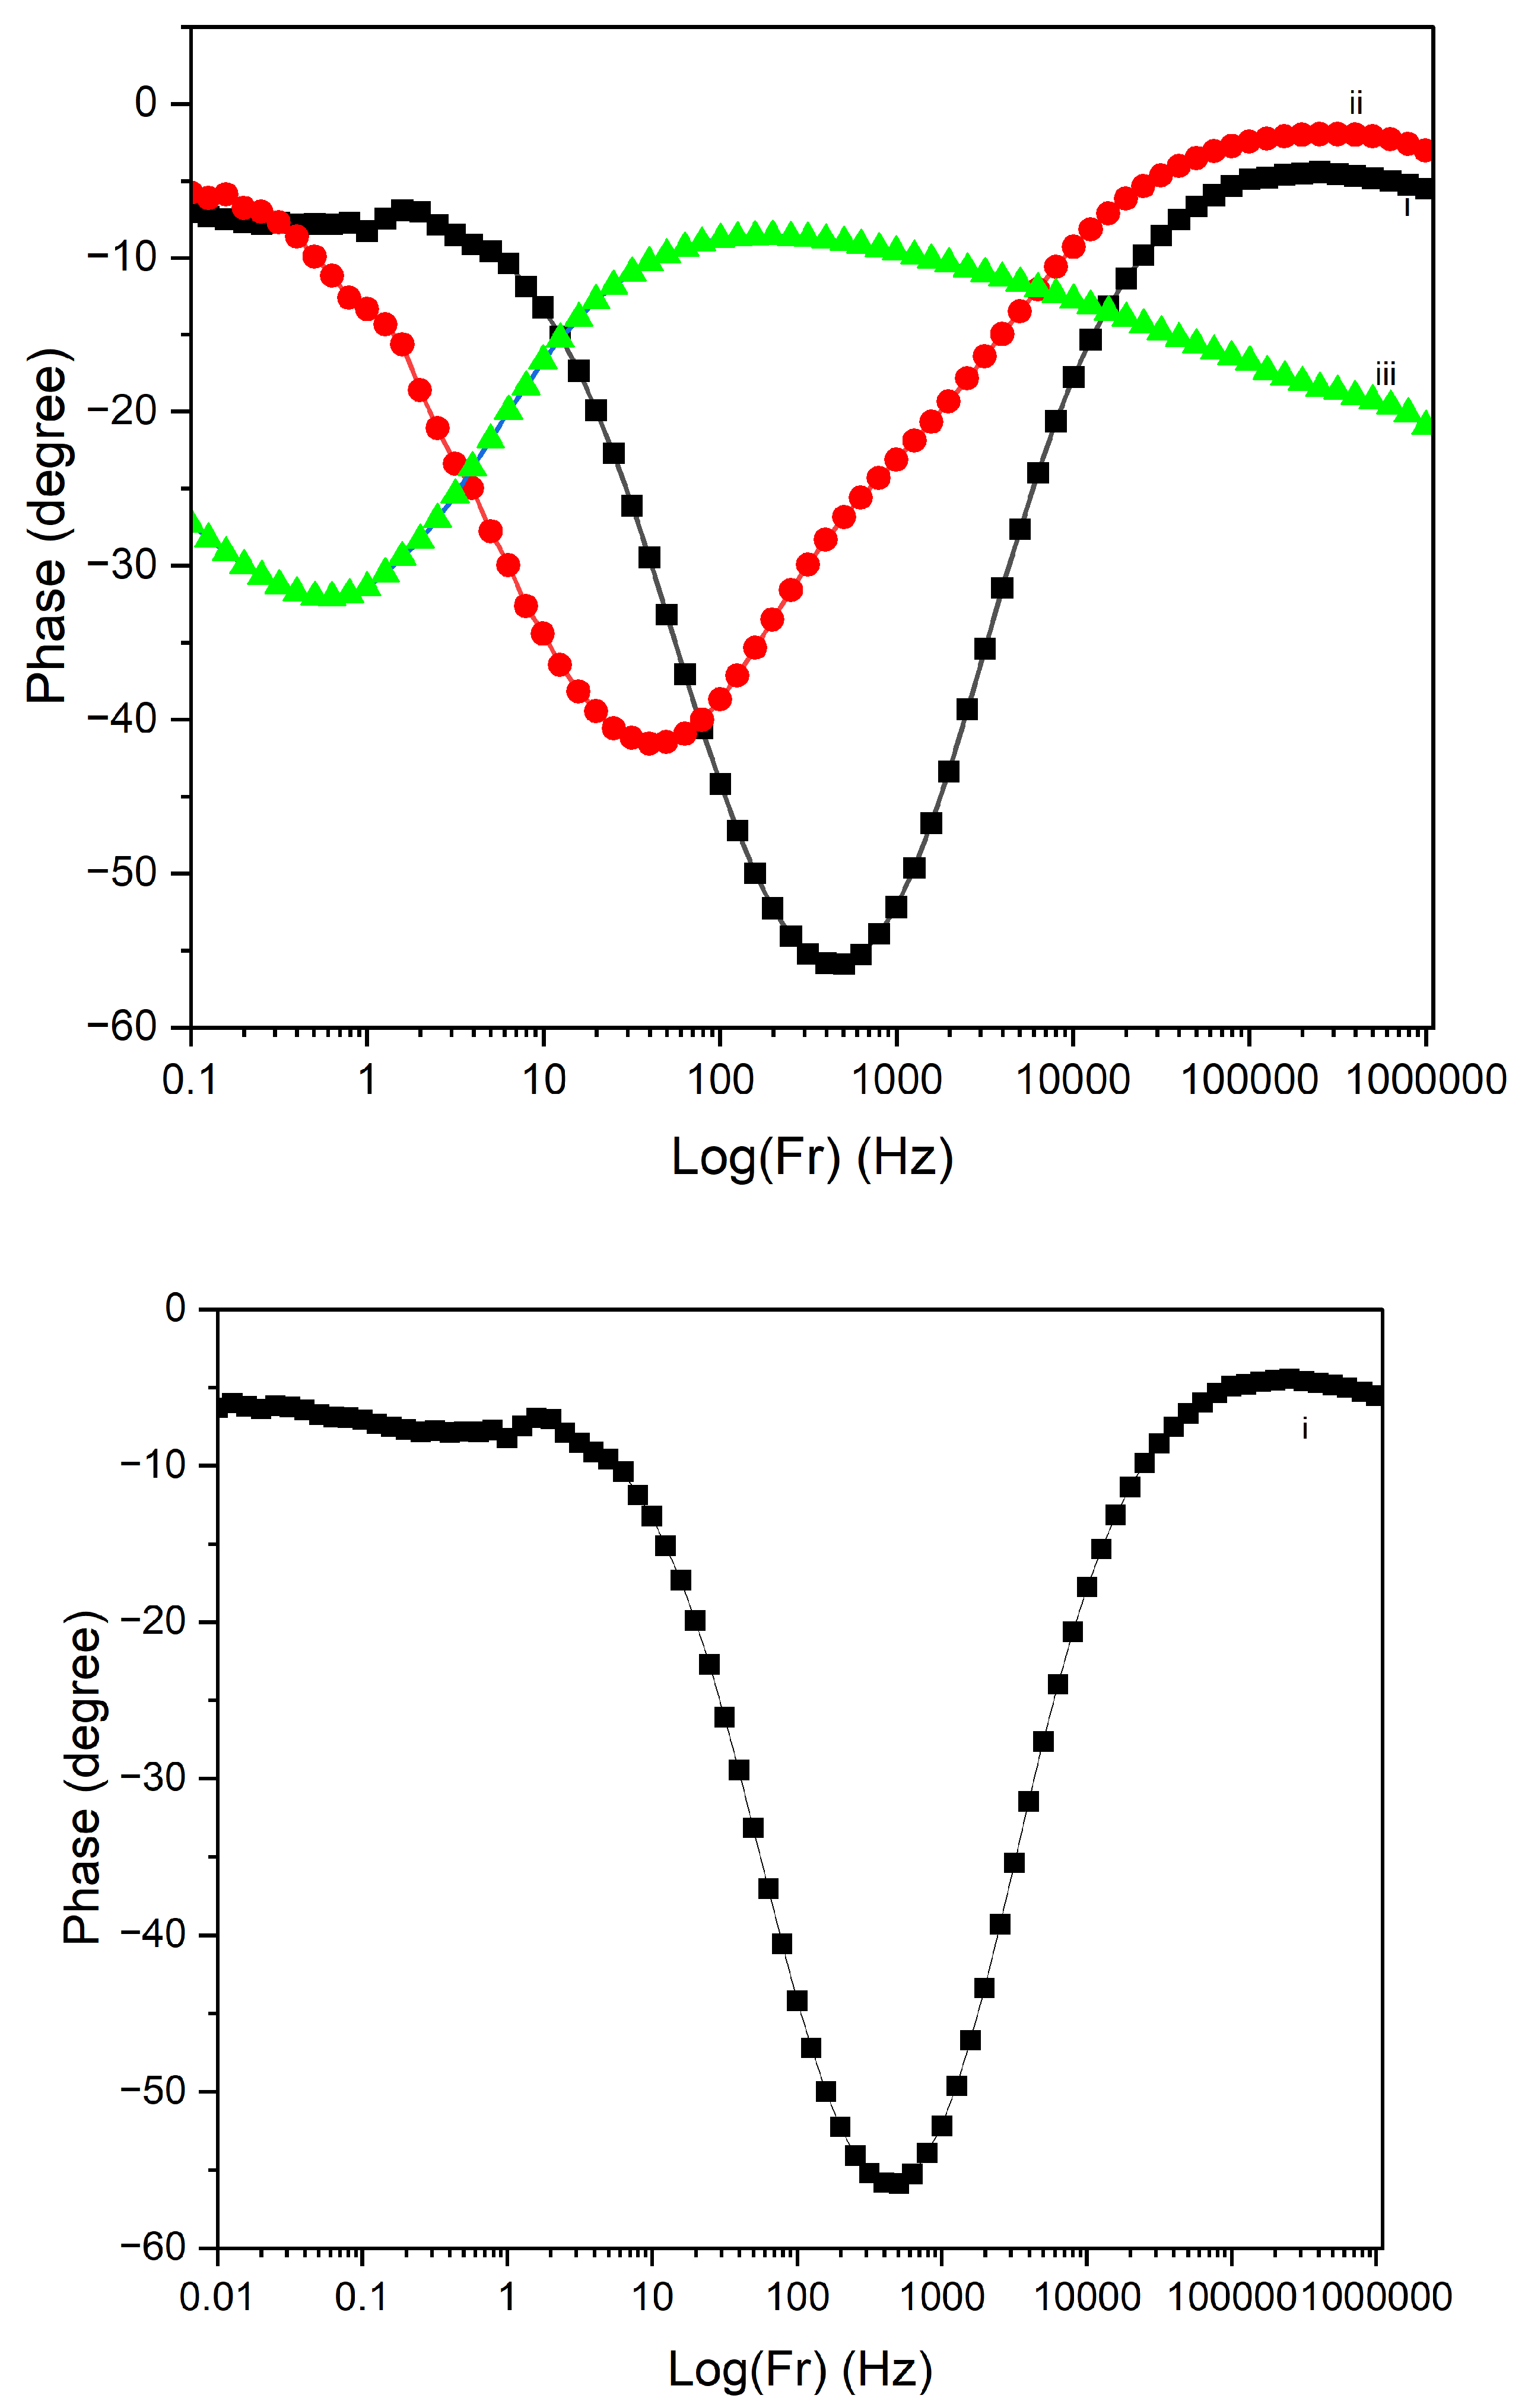
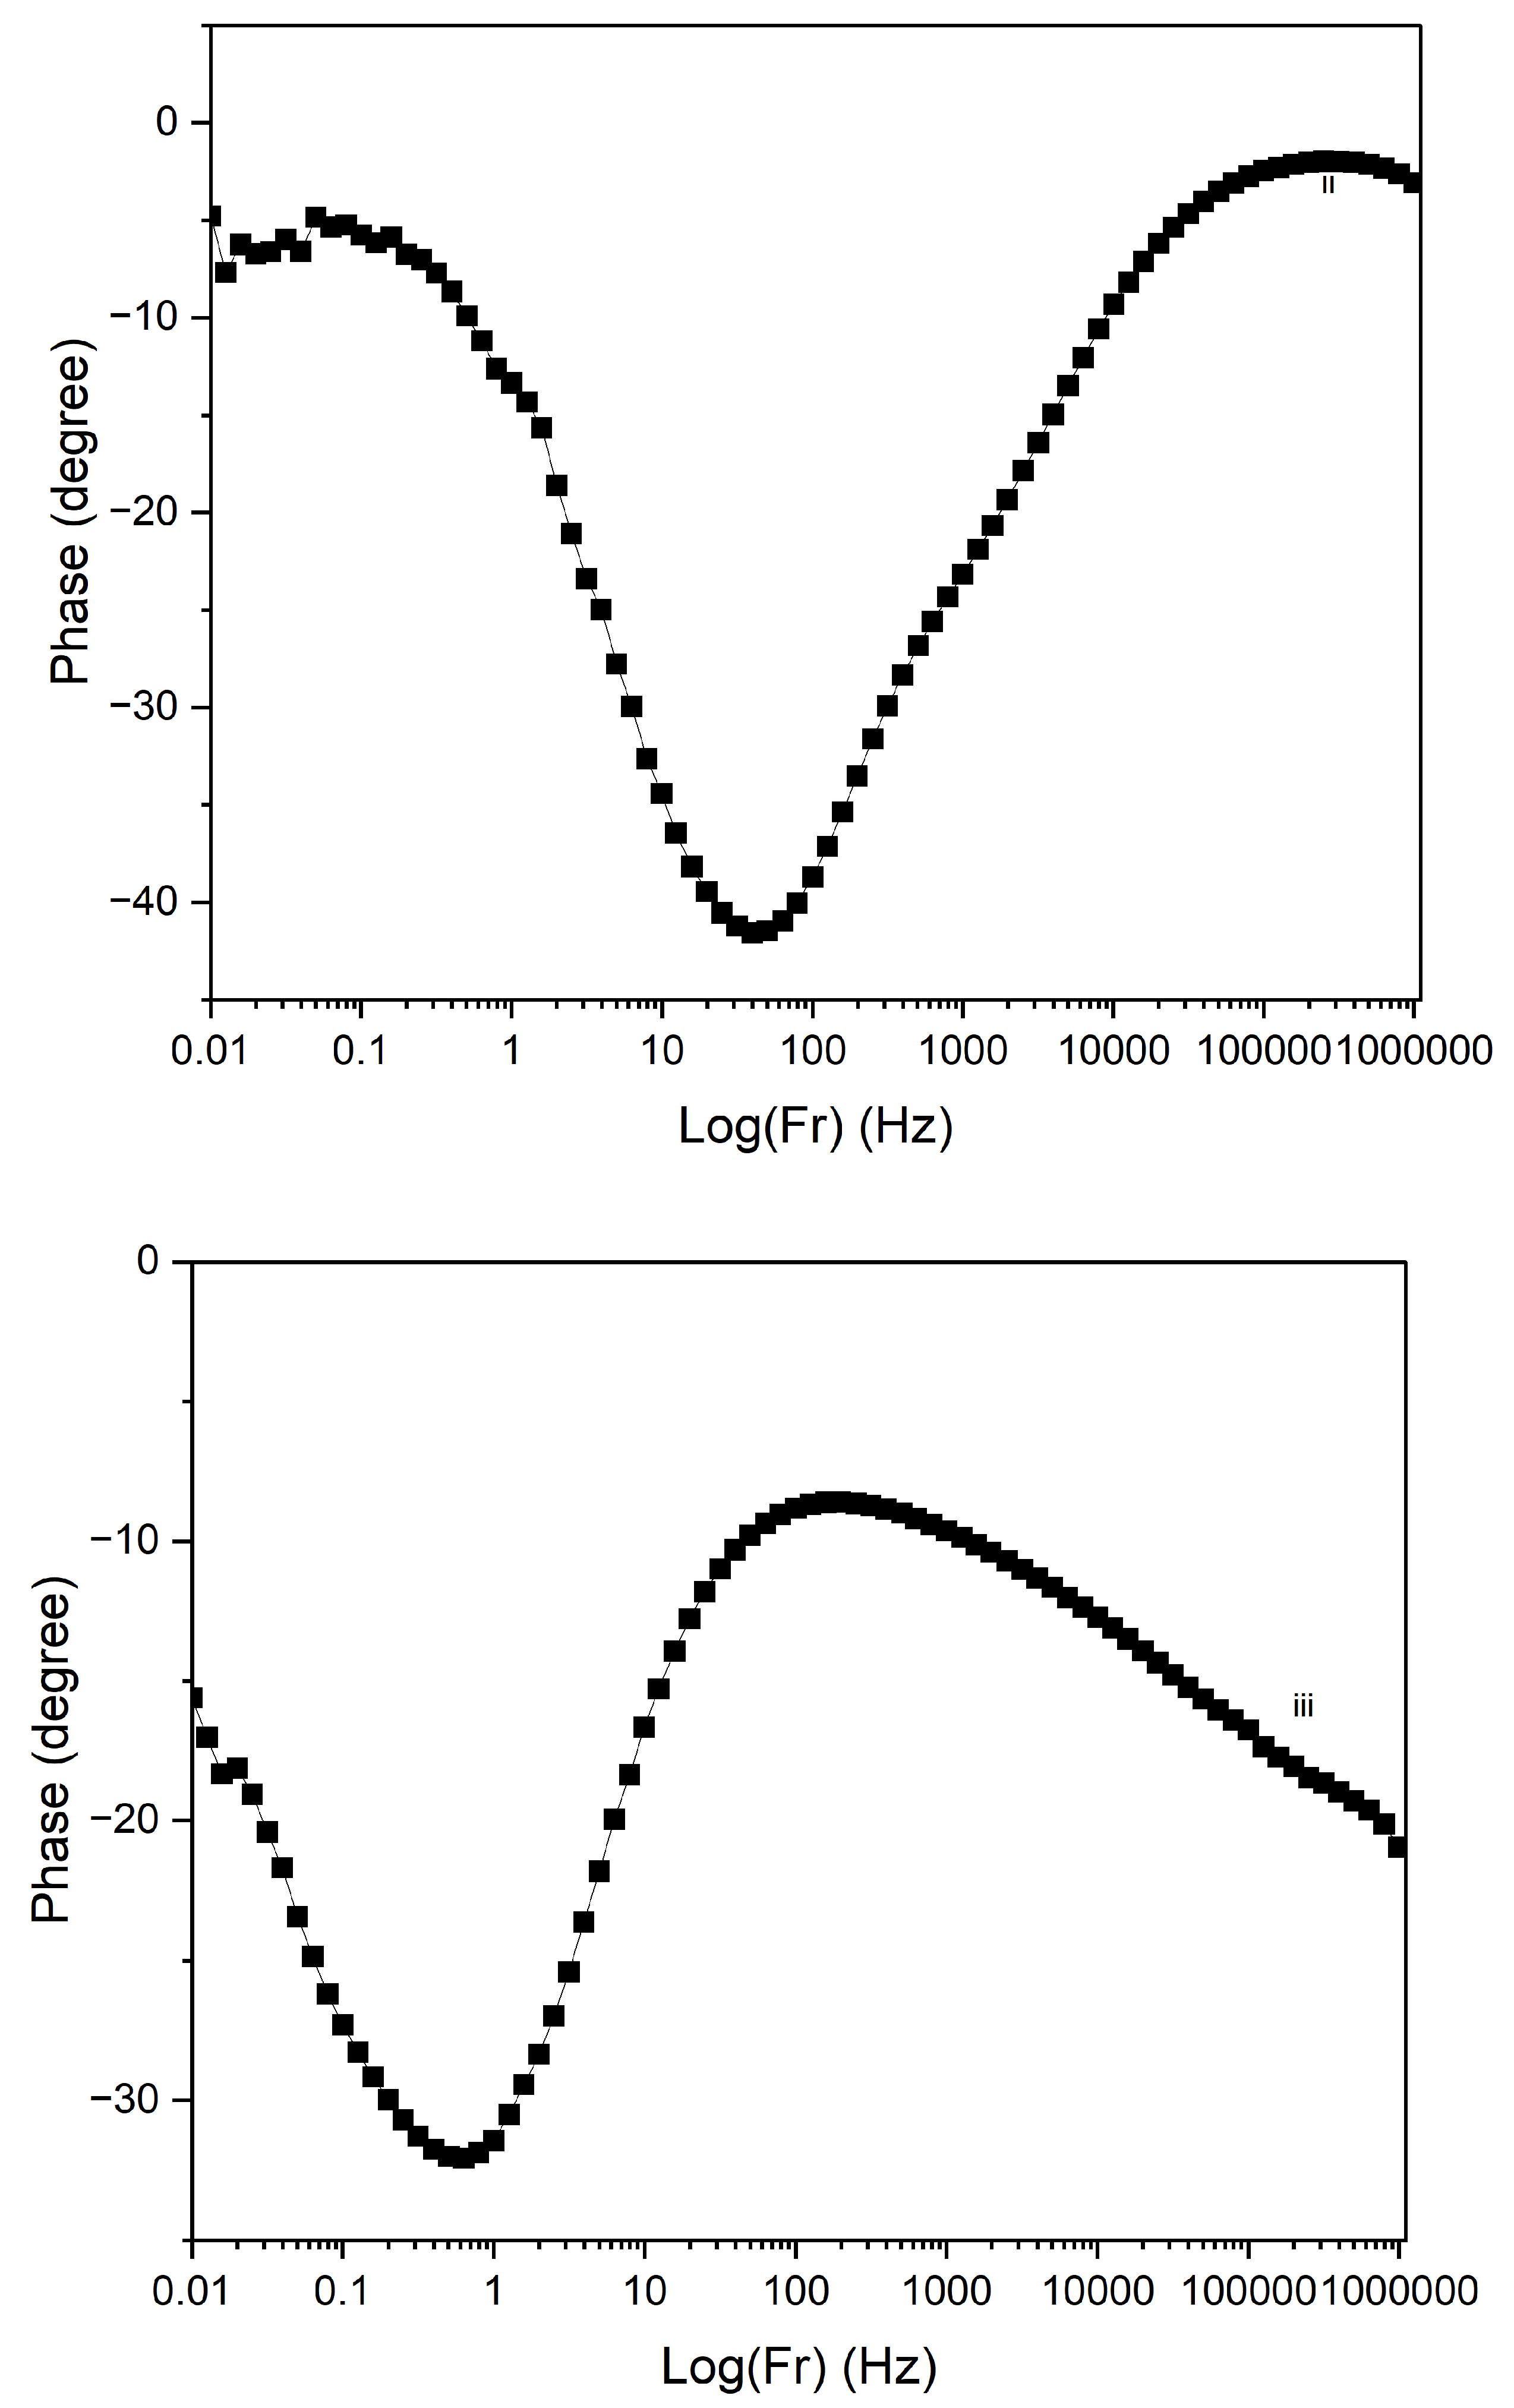
Figure 17 displays the Electrochemical Impedance Spectroscopy (EIS) Bode plots for PI/CNTs/–PPy composite samples processed at different temperatures (90 °C, 180 °C, and 250 °C) following a 700-second deposition of polypyrrole (PPy). In the impedance magnitude plot (Log(Z) vs. Log(Fr)) shown in Figure 16, the sample processed at 90 °C exhibits the lowest impedance across the frequency range, indicating superior conductivity and minimal resistance. This is further supported by the analysis of solution resistance, coating resistance, and pore resistance, where the 90 °C sample demonstrated the lowest values for all three parameters, particularly a solution resistance of 2.307 ohms, a coating resistance of 94 ohms, and a pore resistance of 301.8 ohms. These factors collectively suggest that the 90 °C sample has well-formed conductive and porous structures, facilitating efficient ion transport and charge transfer. The 180 °C sample shows higher impedance, reflecting increased resistance and reduced conductivity. The analysis reveals that the solution resistance is 87.67 ohms, significantly higher than the 90 °C sample, while the coating resistance is extremely high at 8700 ohms, indicating poor conductivity of the coating material. The pore resistance is also the highest among the samples at 13,930 ohms, suggesting substantial limitations in ion transport within the porous structure. This combination of high coating and pore resistance highlights the compromised electrochemical performance of the 180 °C sample, despite two notable time-constant phase changes in Figure 18, one at 30 Hz and another at 500 Hz. The phase changes reflect a balance between capacitive and resistive properties, though the resistance remains significantly higher than the 90 °C sample. In contrast, the 250 °C sample exhibits the highest impedance overall, signifying the poorest conductivity and the most resistive behavior. The solution resistance is relatively low at 51.8 ohms, but the coating resistance, at 400 ohms, is still considerably higher than the 90 °C sample, indicating suboptimal conductivity. The pore resistance is measured at 2991.9 ohms, lower than the 180 °C sample but still much higher than the 90 °C sample, reflecting limited ion transport. The phase angle plot Figure 17 for the 250 °C sample demonstrates the least capacitive behavior, with a time-constant phase change occurring at a much lower frequency of 7 Hz, underscoring significant resistive nature and poor charge transfer capabilities. The large shift in phase angle towards resistive behavior at low frequencies indicates substantial impedance and limited capacitive performance.
Overall, the Bode plots and resistance analysis indicate that the composite processed at 90 °C offers the best electrochemical performance, with lower impedance, effective ion transport, and a balanced capacitive response at higher frequencies. The low values of solution, coating, and pore resistances further confirm the superior electrochemical properties of the 90 °C sample compared to, the composites processed at 180 °C and 250 °C exhibit increased resistance across all resistance types, lower frequency phase changes, and less desirable capacitive properties. These findings emphasize the critical importance of optimizing processing temperatures to enhance the electrochemical properties of PI/CNTs–PPy composites for energy storage applications.
The Nyquist plots in Figure 19 reveal the impact of processing conditions on the electrochemical performance of PI/CNTs–PPy hybrid nanocomposites, highlighting the consequences of failed coatings. The 90°C sample demonstrates superior performance with a bulk resistance of 65.27 Ω, specific capacitance of 209.16 F/g (23.15 Ω impedance), and a weight gain of 1.669% (0.003287 g), supported by a small semicircle in the Nyquist plot, indicating uniform coating, low surface roughness, and effective ion diffusion, with a porosity of 4.59. In contrast, the 180°C sample shows characteristics of a failed coating, with a bulk resistance of 2366.4 Ω, drastically reduced specific capacitance of 5.4 F/g (1236 Ω impedance), and a weight gain of only 1.313% (0.002284 g). Its large semicircle reflects severe surface roughness, poor uniformity, and high charge transfer resistance, compounded by Warburg impedance effects and a low porosity of 0.35, indicating limited ion transport and inhomogeneity. The 250°C sample presents mixed results, with a bulk resistance of 143.62 Ω, a specific capacitance of 123.90 F/g (26.35 Ω impedance), and the lowest weight gain at 0.567% (0.004875 g). The large semicircle in its Nyquist plot indicates poor coating uniformity, sluggish charge transfer, and thermal degradation, as evidenced by a phase shift at 7 Hz, despite a slight improvement in porosity to 1.52 compared to the 180°C sample. These results demonstrate that failed coatings lead to increased impedance, reduced capacitance, and poor ion transport, with the 90°C sample emerging as the most efficient due to its balanced electrochemical properties, emphasizing the importance of optimizing processing temperatures for effective and uniform coatings.
Figure 19.
EIS Nyquist plot model with simplified Randles circuit for coating defect for PI/CNTs-PPy sample processed at (i) 90oC, (ii) 180oC, and (iii) 250oC at the 700-second deposition of PPy.
Figure 19.
EIS Nyquist plot model with simplified Randles circuit for coating defect for PI/CNTs-PPy sample processed at (i) 90oC, (ii) 180oC, and (iii) 250oC at the 700-second deposition of PPy.
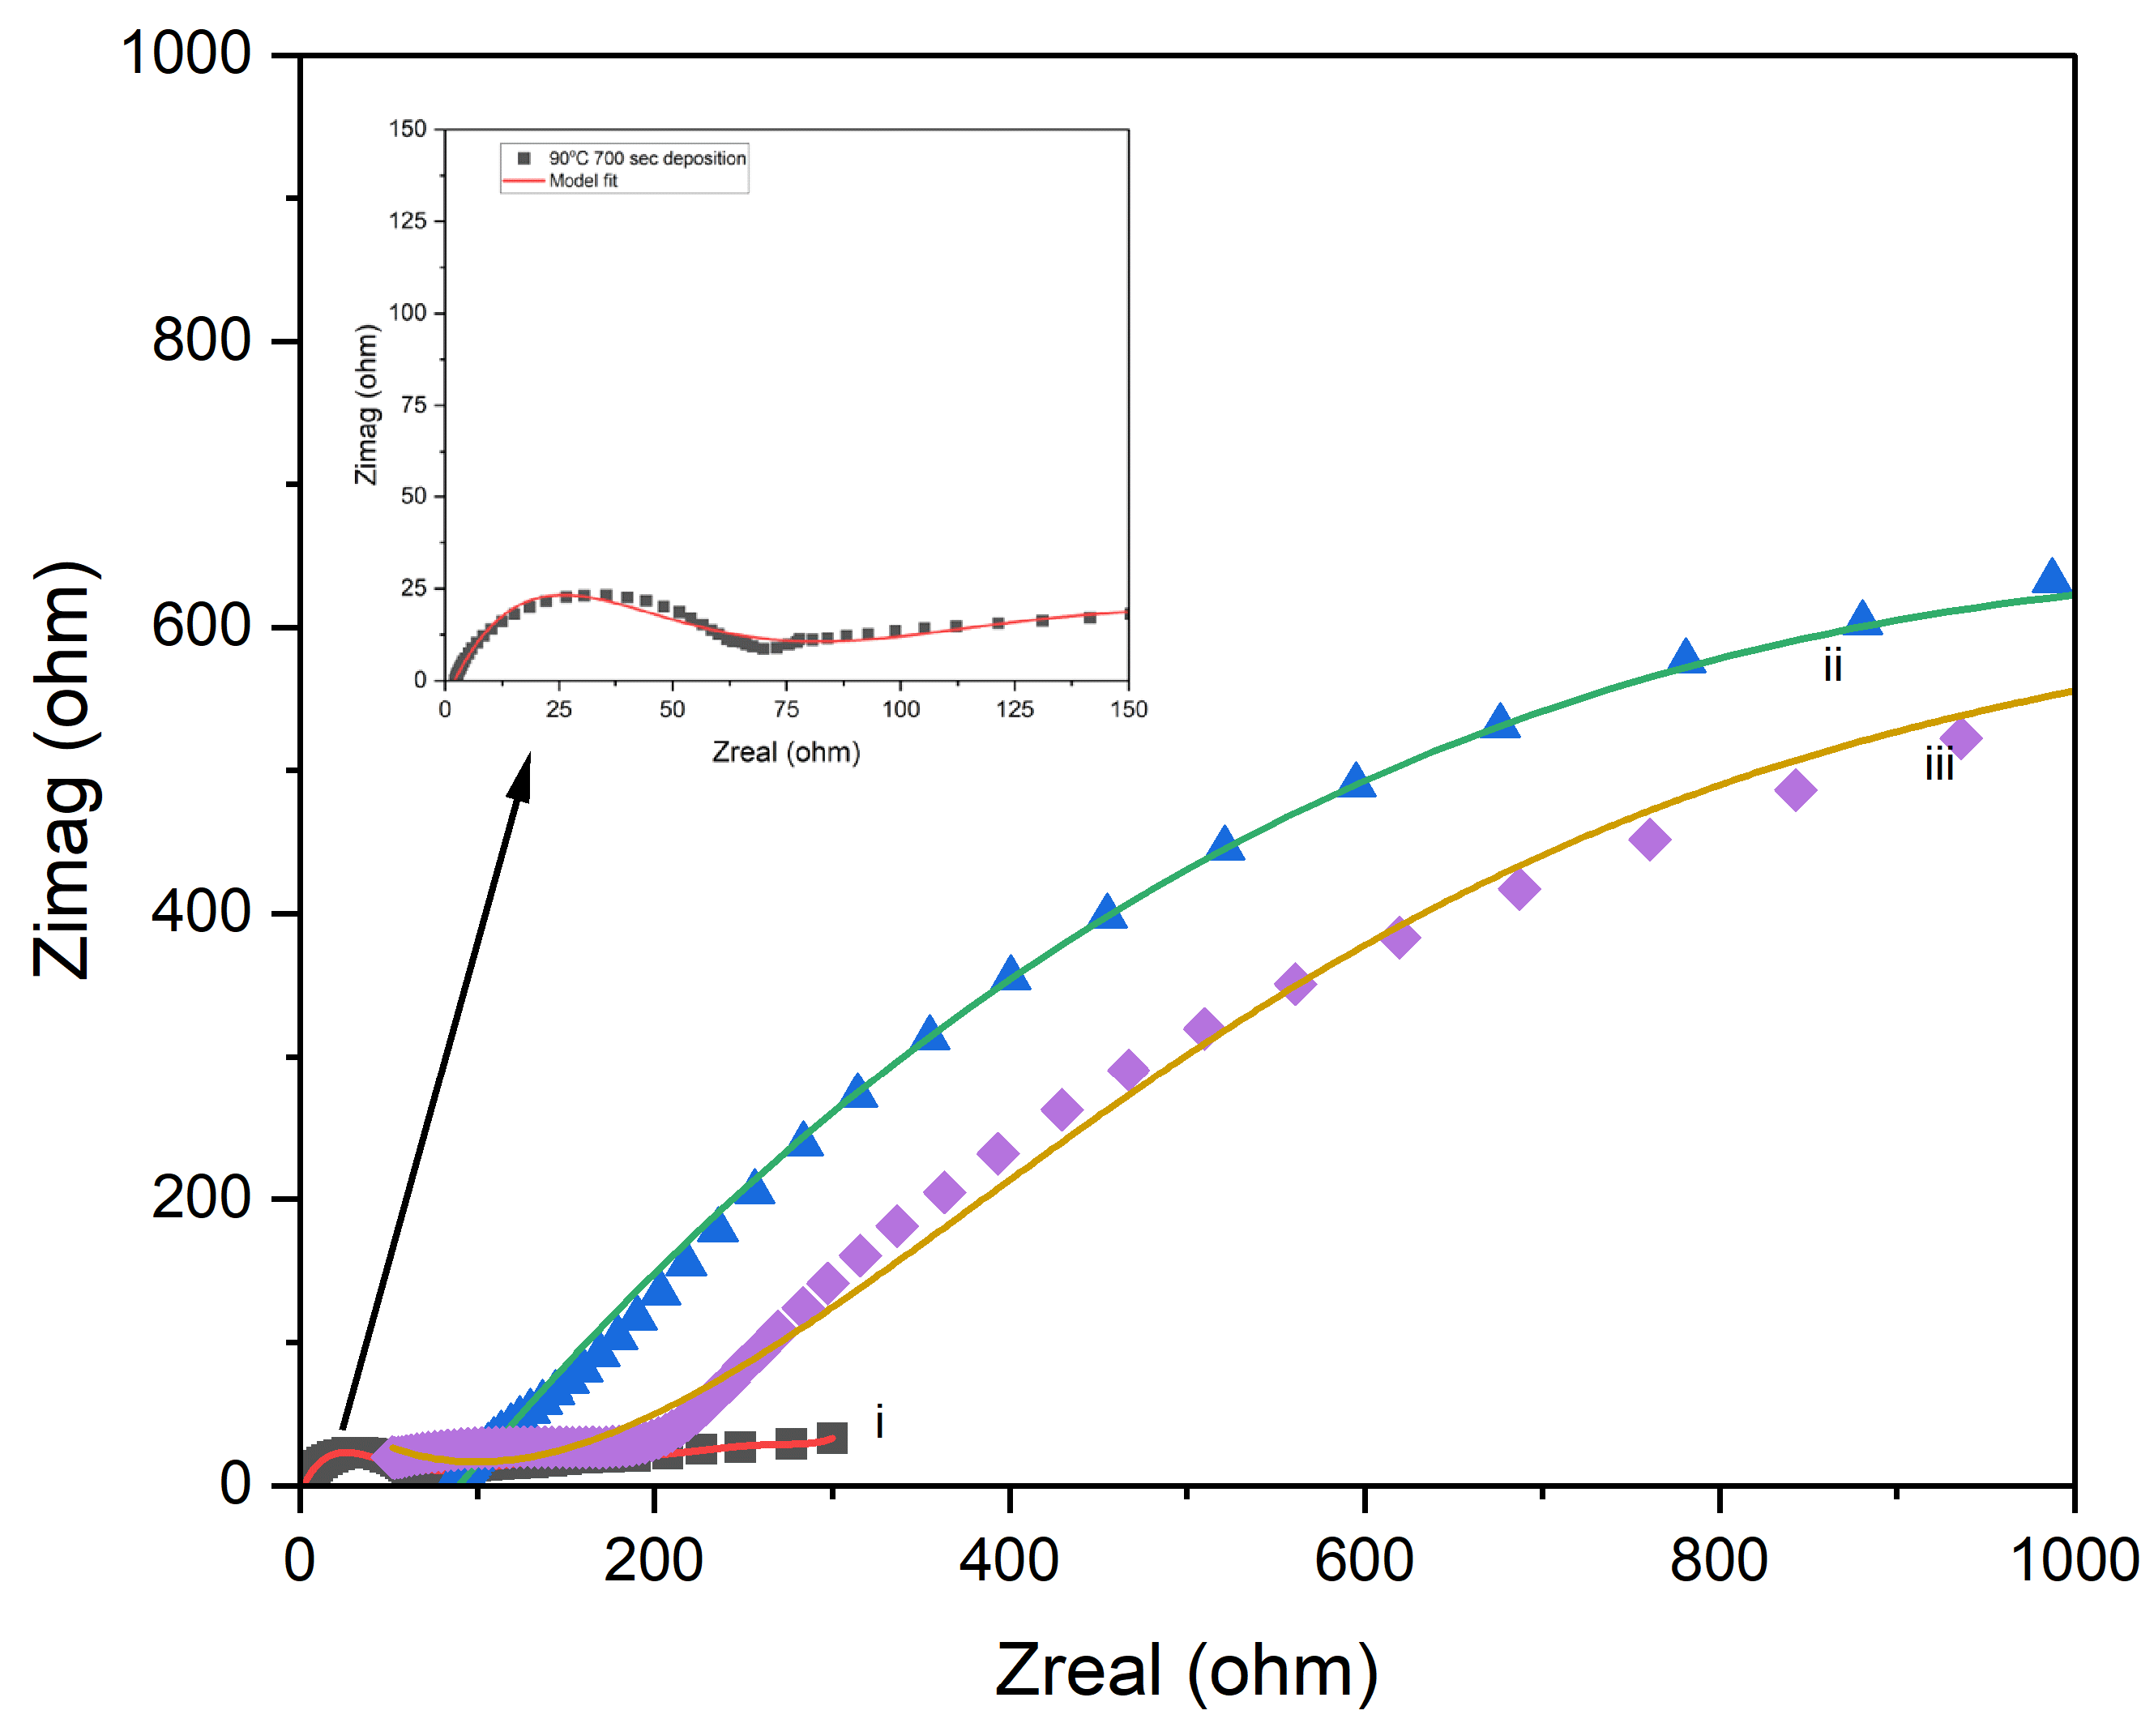
Table 4.
Summary of theoretical porosity, resistance, and specific capacitance obtained using EIS.
| Material | Bulk Resistance (Ω) (EIS) | Weigh gain (%) | Specific capacitance (F/g) (EIS) | Porosity (EIS) |
| PI/CNTs–90 °C | 65.27 | 1.669 (0.003287g) | 209.16 (23.15Ω) | 4.59 |
| PI/CNTs–180 °C | 2366.4 | 1.313 (0.002284g) | 5.40 (1236Ω) | 0.35 |
| PI/CNTs–250 °C | 143.62 | 0.567 (0.004875g) | 123.90 (26.35Ω) | 1.52 |
Table 5.
Summary of resistance values obtained using (EIS).
| Material | Solution resistance (Ω) | Charge transfer resistance (Ω) | Pore resistance (Ω) | Coating resistance (Ω) |
| PI/CNTs–90 °C | 2.307 | 67.58 | 301.8 | 94 |
| PI/CNTs–180 °C | 87.67 | 2465 | 13930 | 8700 |
| PI/CNTs–250 °C | 51.8 | 194.79 | 2991.9 | 400 |
5. Conclusions
This study provides a detailed examination of the influence of processing temperatures on the structural and electrochemical properties of PI/CNTs hybrid nanocomposites, with significant implications for their application in energy storage systems. The findings demonstrate that processing the composites at 90°C results in the most favorable electrochemical properties, including a high specific capacitance of up to 655.34 F/g and robust cycling stability over 10 cycles. These superior results are primarily due to the enhanced porosity and uniform dispersion of CNTs within the PVDF matrix at 90°C, which facilitates efficient PPy deposition, improves ion transport, and minimizes internal resistance.
Conversely, higher processing temperatures of 180°C and 250°C led to a noticeable decline in specific capacitance and cycling stability. This degradation is likely due to microstructural changes, such as reduced porosity and increased bulk resistance, which impede ion movement and diminish the overall electrochemical performance of the composites. The large semicircles observed in the Nyquist plots for the samples processed at higher temperatures further indicate increased charge transfer resistance and decreased conductivity, highlighting the detrimental effects of excessive thermal treatment.
Overall, this research emphasizes the critical role of temperature control during the processing of PI/CNTs nanocomposites. The ability to maintain structural integrity while improving electrochemical properties through precise temperature regulation is essential for developing high-performance energy storage systems. The study's findings offer valuable insights into the design and fabrication of next-generation supercapacitors and other energy storage devices, where the balance between structural stability and electrochemical efficiency is paramount.
Author Contributions
Conceptualization, J.O.I. and R.G.; methodology, J.O.I. and R.G.; software, R.G.; validation, J.O.I. and R.G.; formal analysis, R.G.; investigation, R.G.; resources, J.O.I.; data curation, R.G.; writing—original draft preparation, R.G.; writing review and editing, J.O.I. and R.G.; visualization, J.O.I.; supervision, J.O.I.; project administration, J.O.I.; funding acquisition, J.O.I.; All authors have read and agreed to the published version of the manuscript.
Funding
This research received no external funding.
Data Availability Statement
Not applicable.
Acknowledgments
The support provided by the Mechanical and Materials Engineering Department and the Polymer Laboratory at the University of Cincinnati is hereby acknowledged.
Conflicts of Interest
The authors declare no conflicts of interest.
References
- Liu, C., Li, F., Ma, L.P. and Cheng, H.M., 2010. Advanced materials for energy storage. Advanced materials, 22(8), pp. E28-E62. [CrossRef]
- Di Lecce, D., Verrelli, R. and Hassoun, J., 2017. Lithium-ion batteries for sustainable energy storage: recent advances towards new cell configurations. Green Chemistry, 19(15), pp.3442-3467. [CrossRef]
- Olabi, A.G., Abbas, Q., Al Makky, A. and Abdelkareem, M.A., 2022. Supercapacitors as next generation energy storage devices: Properties and applications. Energy, 248, p.123617. [CrossRef]
- Armand, M. and Tarascon, J.M., 2008. Building better batteries. nature, 451(7179), pp.652-657. [CrossRef]
- Siwal, S.S., Zhang, Q., Devi, N. and Thakur, V.K., 2020. Carbon-based polymer nanocomposite for high-performance energy storage applications. Polymers, 12(3), p.505. [CrossRef]
- Yao, F., Pham, D.T. and Lee, Y.H., 2015. Carbon-based materials for lithium-ion batteries, electrochemical capacitors, and their hybrid devices. ChemSusChem, 8(14), pp.2284-2311.
- Nathawat, R., Rathore, S.S., Kharangarh, P.R., Devi, R. and Kumari, A., 2023. Synthesis and application of carbon-based nanocomposite. In Carbon Nanomaterials and their Nanocomposite-Based Chemiresistive Gas Sensors (pp. 169-203). Elsevier.
- Iqbal, S., Khatoon, H., Pandit, A.H. and Ahmad, S., 2019. Recent development of carbon based materials for energy storage devices. Materials Science for Energy Technologies, 2(3), pp.417-428. [CrossRef]
- Ansaldo, A., Bondavalli, P., Bellani, S., Del Rio Castillo, A.E., Prato, M., Pellegrini, V., Pognon, G. and Bonaccorso, F., 2017. High-Power Graphene–Carbon Nanotube Hybrid Supercapacitors. ChemNanoMat, 3(6), pp.436-446.
- Zhu, J., Yang, D., Yin, Z., Yan, Q. and Zhang, H., 2014. Graphene and graphene-based materials for energy storage applications. Small, 10(17), pp.3480-3498. [CrossRef]
- Li, X. and Zhi, L., 2018. Graphene hybridization for energy storage applications. Chemical Society Reviews, 47(9), pp.3189-3216. [CrossRef]
- Shao, Q., Wu, Z.S. and Chen, J., 2019. Two-dimensional materials for advanced Li-S batteries. Energy Storage Materials, 22, pp.284-310. [CrossRef]
- Ni, J. and Li, Y., 2016. Carbon nanomaterials in different dimensions for electrochemical energy storage. Advanced Energy Materials, 6(17), p.1600278. [CrossRef]
- Kothandam, G., Singh, G., Guan, X., Lee, J.M., Ramadass, K., Joseph, S., Benzigar, M., Karakoti, A., Yi, J., Kumar, P. and Vinu, A., 2023. Recent Advances in Carbon-Based Electrodes for Energy Storage and Conversion. Advanced Science, 10(18), p.2301045. [CrossRef]
- Shi, C., Owusu, K.A., Xu, X., Zhu, T., Zhang, G., Yang, W. and Mai, L., 2019. 1D Carbon-based nanocomposites for electrochemical energy storage. Small, 15(48), p.1902348. [CrossRef]
- Zhang, C., Zhang, T., Feng, M., Cui, Y., Zhang, T., Zhang, Y., Feng, Y., Zhang, Y., Chi, Q. and Liu, X., 2021. Significantly improved energy storage performance of PVDF ferroelectric films by blending PMMA and filling PCBM. ACS Sustainable Chemistry & Engineering, 9(48), pp.16291-16303. [CrossRef]
- Ye, L., Ran, C., Xie, Z., Zhang, J. and Ma, S., 2024. Significantly Enhanced Energy Density of Polyvinylidene Fluoride/Polyimide-Based Nanocomposites by Core–Shell BaTiO3@ SiO2. Langmuir, 40(14), pp.7710-7722.
- Chen, D., Liu, T., Zhou, X., Tjiu, W.C. and Hou, H., 2009. Electrospinning fabrication of high strength and toughness polyimide nanofiber membranes containing multiwalled carbon nanotubes. The Journal of Physical Chemistry B, 113(29), pp.9741-9748. [CrossRef]
- You, L., Liu, B., Hua, H., Jiang, H., Yin, C. and Wen, F., 2023. Energy storage performance of polymer-based dielectric composites with two-dimensional fillers. Nanomaterials, 13(21), p.2842. [CrossRef]
- Li, W., Jiang, L., Zhang, X., Shen, Y. and Nan, C.W., 2014. High-energy-density dielectric films based on polyvinylidene fluoride and aromatic polythiourea for capacitors. Journal of Materials Chemistry A, 2(38), pp.15803-15807. [CrossRef]
- Li, J., Yin, J., Yang, C., Li, N., Feng, Y., Liu, Y., Zhao, H., Li, Y., Zhu, C., Yue, D. and Su, B., 2019. Enhanced dielectric performance and energy storage of PVDF-HFP-based composites induced by surface charged Al2O3. Journal of Polymer Science Part B: Polymer Physics, 57(10), pp.574-583.
- Bhardwaj, S., Sharma, J.D., Chand, S., Raina, K.K. and Kumar, R., 2021. Enhanced Electroactive Phases in Bi3· 3La0· 7Ti3O12-poly (vinylidene fluoride) composites with Improved Dielectric Properties. Solid State Communications, 326, p.114176. [CrossRef]
- Okafor, P.A., Huxel, B. and Iroh, J.O., 2015. Electrochemical behavior of multifunctional graphene–polyimide nanocomposite film in two different electrolyte solutions. Journal of Applied Polymer Science, 132(42). [CrossRef]
- Oktay, B., Türker, S., Karataş, S. and Apohan, N., 2018. Multi-walled carbon nanotube reinforced polyimide composites. Journal of the Turkish Chemical Society Section A: Chemistry, 5(1), pp.283-294. [CrossRef]
- Kim, B.S., Bae, S.H., Park, Y.H. and Kim, J.H., 2006, July. Polyimide/carbon nanotubes composite films: a potential for FPCB. In 2006 International Conference on Nanoscience and Nanotechnology. IEEE.
- Iroh, J.O., Levine, K., Shah, K., Zhu, Y., Donley, M., Mantz, R., Johnson, J., Voevodin, N.N., Balbyshev, V.N. and Khramov, A.N., 2004. Electrochemical behaviour of conducting polymer/polyimide composite. Surface engineering, 20(2), pp.93-98. [CrossRef]
- So, H.H., Cho, J.W. and Sahoo, N.G., 2007. Effect of carbon nanotubes on mechanical and electrical properties of polyimide/carbon nanotubes nanocomposites. European Polymer Journal, 43(9), pp.3750-3756. [CrossRef]
- Thuau, D., Koutsos, V. and Cheung, R., 2009. Electrical and mechanical properties of carbon nanotube-polyimide composites. Journal of Vacuum Science & Technology B: Microelectronics and Nanometer Structures Processing, Measurement, and Phenomena, 27(6), pp.3139-3144.
- Cerrada, M.L., Arranz-Andrés, J., Caballero-González, A., Blázquez-Blázquez, E. and Pérez, E., 2023. The β form in PVDF nanocomposites with carbon nanotubes: structural features and properties. Polymers, 15(6), p.1491. [CrossRef]
- Andezai, A.; Iroh, J.O. Influence of the Processing Conditions on the Rheology and Heat of Decomposition of Solution Processed Hybrid Nanocomposites and Implication to Sustainable Energy Storage. Energies 2024, 17, 3930. [CrossRef]
- Mohd Nurazzi, N., Asyraf, M.M., Khalina, A., Abdullah, N., Sabaruddin, F.A., Kamarudin, S.H., Ahmad, S.B., Mahat, A.M., Lee, C.L., Aisyah, H.A. and Norrrahim, M.N.F., 2021. Fabrication, functionalization, and application of carbon nanotube-reinforced polymer composite: An overview. Polymers, 13(7), p.1047. [CrossRef]
- Martínez-Hernández, A.L., Velasco-Santos, C. and Castano, V., 2010. Carbon nanotubes composites: processing, grafting and mechanical and thermal properties. Current Nanoscience, 6(1), pp.12-39. [CrossRef]
- Chazot, C.A., Jons, C.K. and Hart, A.J., 2020. In situ interfacial polymerization: a technique for rapid formation of highly loaded carbon nanotube-polymer composites. Advanced Functional Materials, 30(52), p.2005499. [CrossRef]
- Taha, T.A.M., Alanazi, S.S., El-Nasser, K.S., Alshammari, A.H. and Ismael, A., 2024. Structure–property relationships in PVDF/SrTiO3/CNT nanocomposites for optoelectronic and solar cell applications. Polymers, 16(6), p.736.
- Zhu, C., Zhai, J., Wen, D. and Dong, S., 2012. Graphene oxide/polypyrrole nanocomposites: one-step electrochemical doping, coating and synergistic effect for energy storage. Journal of Materials Chemistry, 22(13), pp.6300-6306. [CrossRef]
- Shah, S.S., Niaz, F., Ehsan, M.A., Das, H.T., Younas, M., Khan, A.S., Rahman, H.U., Nayem, S.A., Oyama, M. and Aziz, M.A., 2024. Advanced strategies in electrode engineering and nanomaterial modifications for supercapacitor performance enhancement: A comprehensive review. Journal of Energy Storage, 79, p.110152. [CrossRef]
- Gooneratne, R. and Iroh, J.O., 2022. Polypyrrole Modified Carbon Nanotube/Polyimide Electrode Materials for Supercapacitors and Lithium-ion Batteries. Energies, 15(24), p.9509. [CrossRef]
- Neithalath, N., Weiss, J. and Olek, J., 2006. Characterizing enhanced porosity concrete using electrical impedance to predict acoustic and hydraulic performance. Cement and Concrete Research, 36(11), pp.2074-2085. [CrossRef]
- Tully-Dartez, S., Cardenas, H.E. and Sit, P.F.S., 2010. Pore characteristics of chitosan scaffolds studied by electrochemical impedance spectroscopy. Tissue Engineering Part C: Methods, 16(3), pp.339-345. [CrossRef]
- Zhang, T., Zhang, F., Zhang, L., Lu, Y., Zhang, Y., Yang, X., Ma, Y. and Huang, Y., 2015. High energy density Li-ion capacitor assembled with all graphene-based electrodes. Carbon, 92, pp.106-118. [CrossRef]
- Yang, C., Ji, X., Fan, X., Gao, T., Suo, L., Wang, F., Sun, W., Chen, J., Chen, L., Han, F. and Miao, L., 2017. Flexible aqueous Li-ion battery with high energy and power densities. Advanced materials, 29(44), p.1701972. [CrossRef]
- Ajuria, J., Arnaiz, M., Botas, C., Carriazo, D., Mysyk, R., Rojo, T., Talyzin, A.V. and Goikolea, E., 2017. Graphene-based lithium ion capacitor with high gravimetric energy and power densities. Journal of Power Sources, 363, pp.422-427. [CrossRef]
Scheme 1.
Synthesis of polyimide (PI).
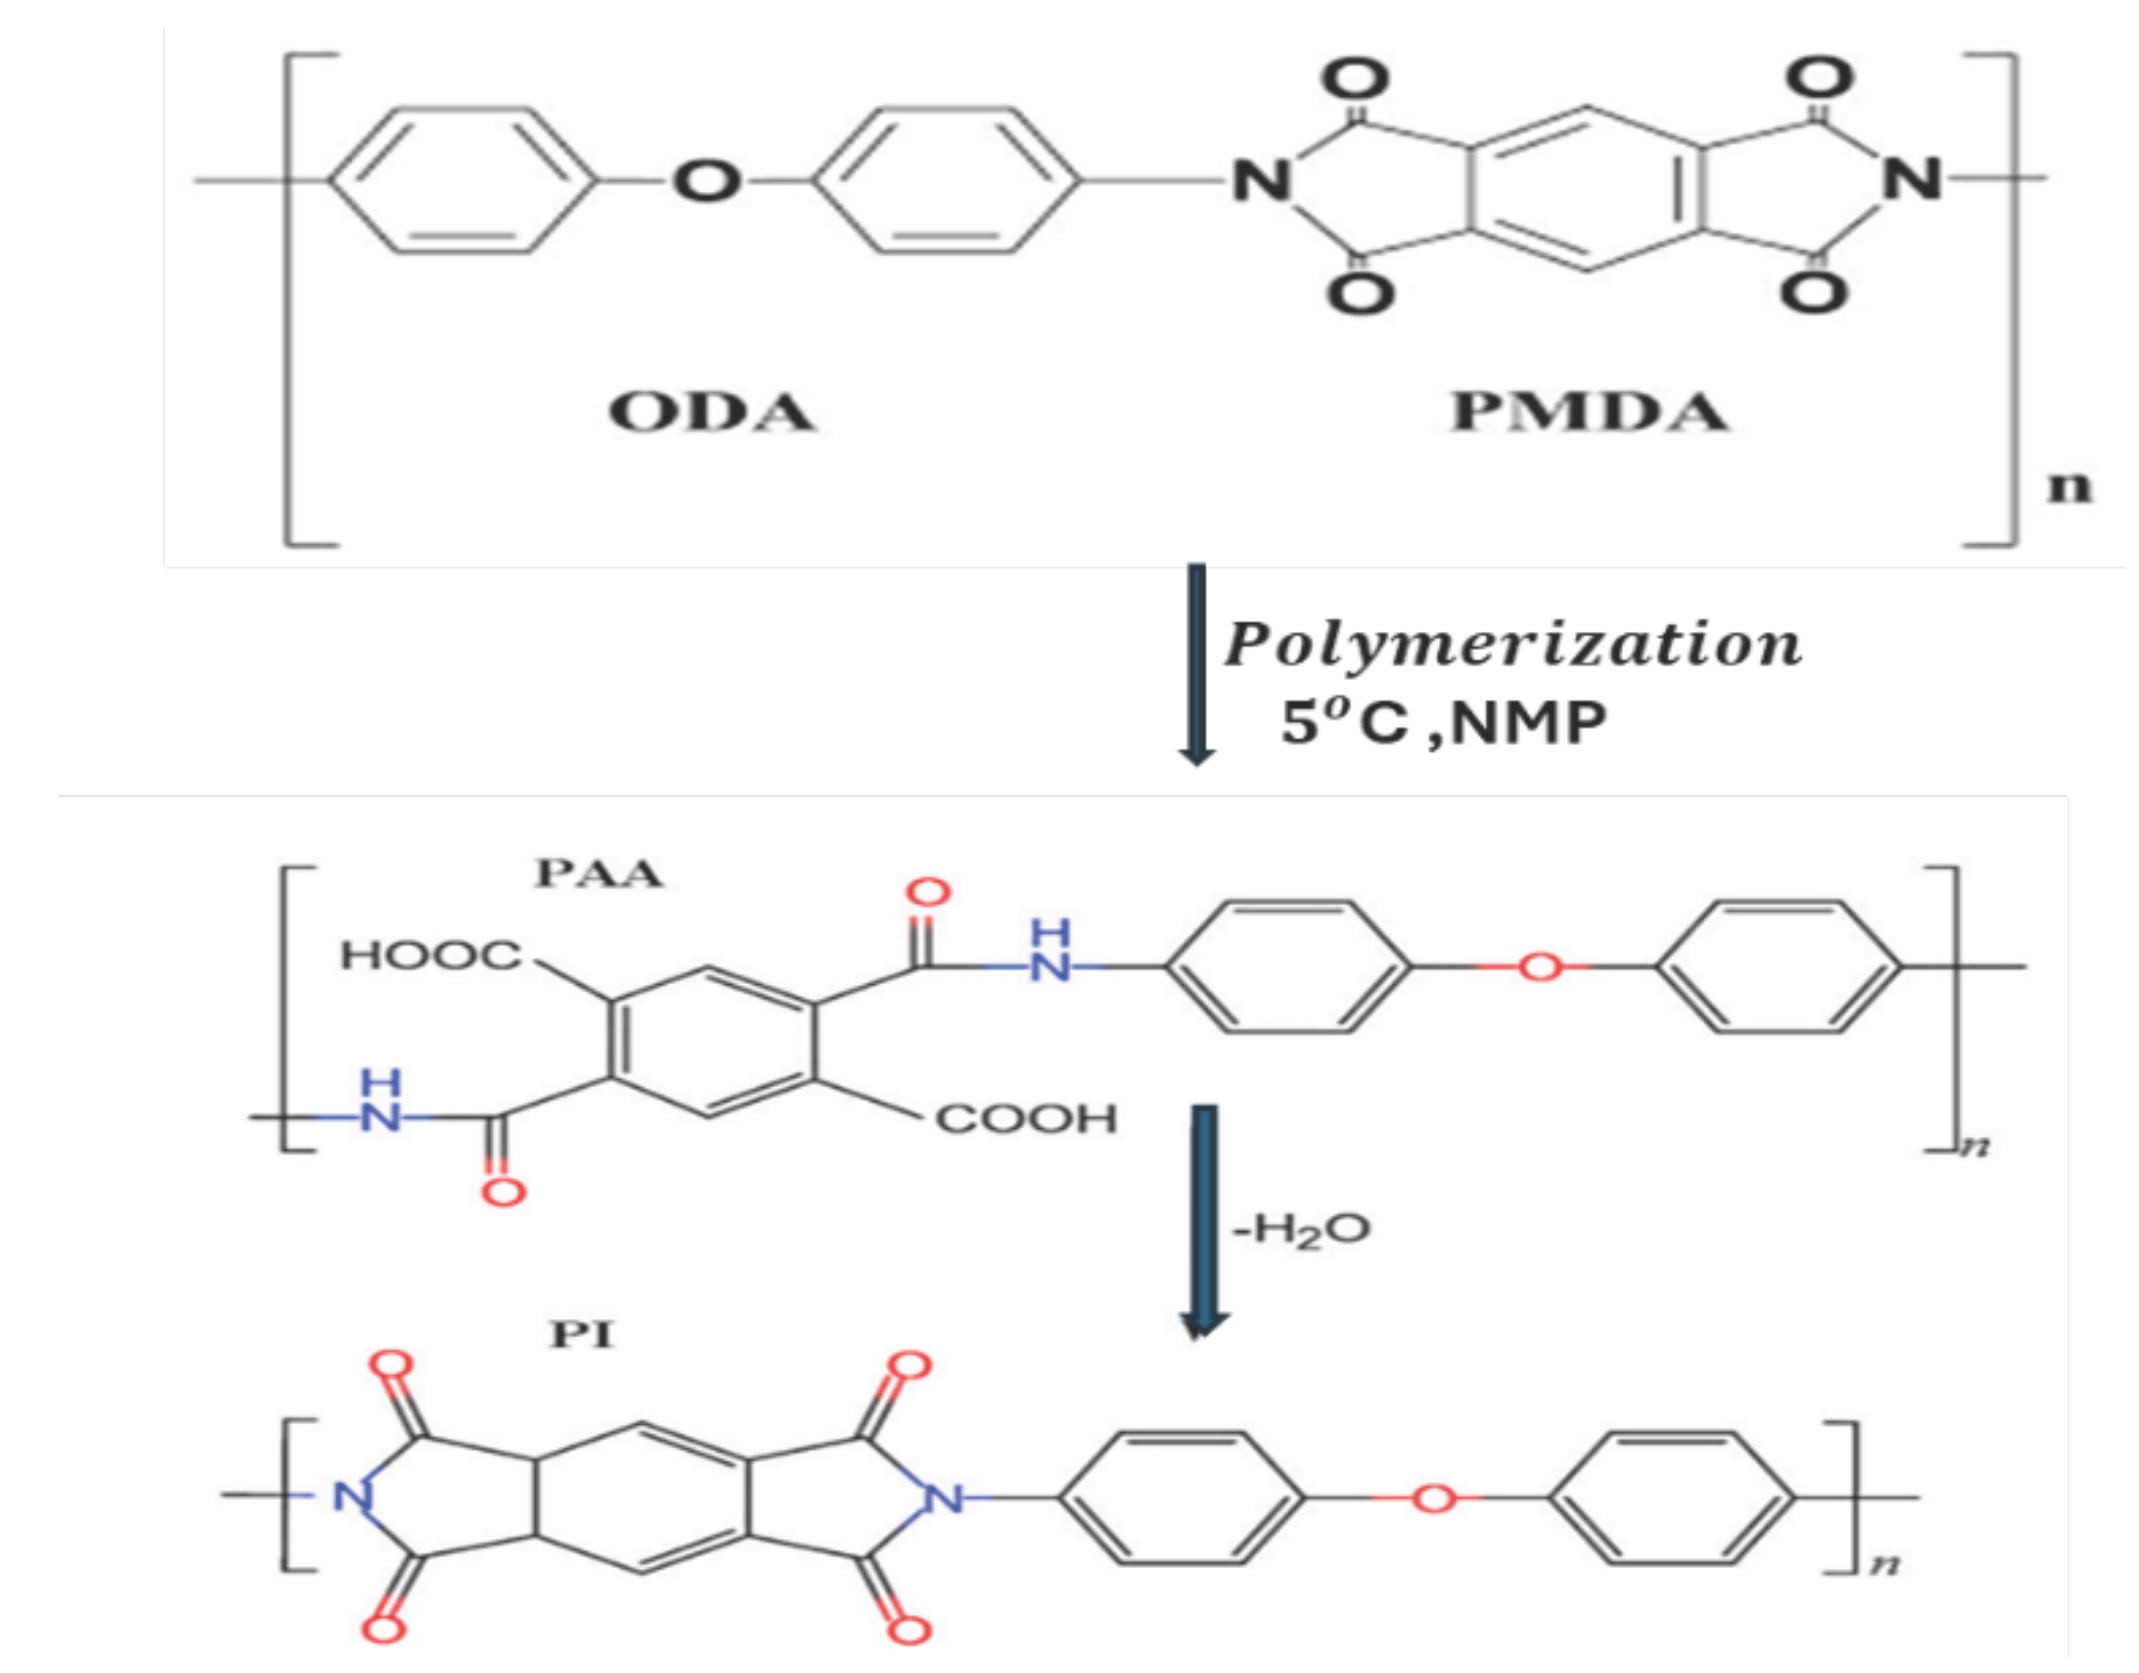
Figure 1.
(a) solution casting of PAA/CNTs, and (b) electrochemical synthesis of polypyrrole.
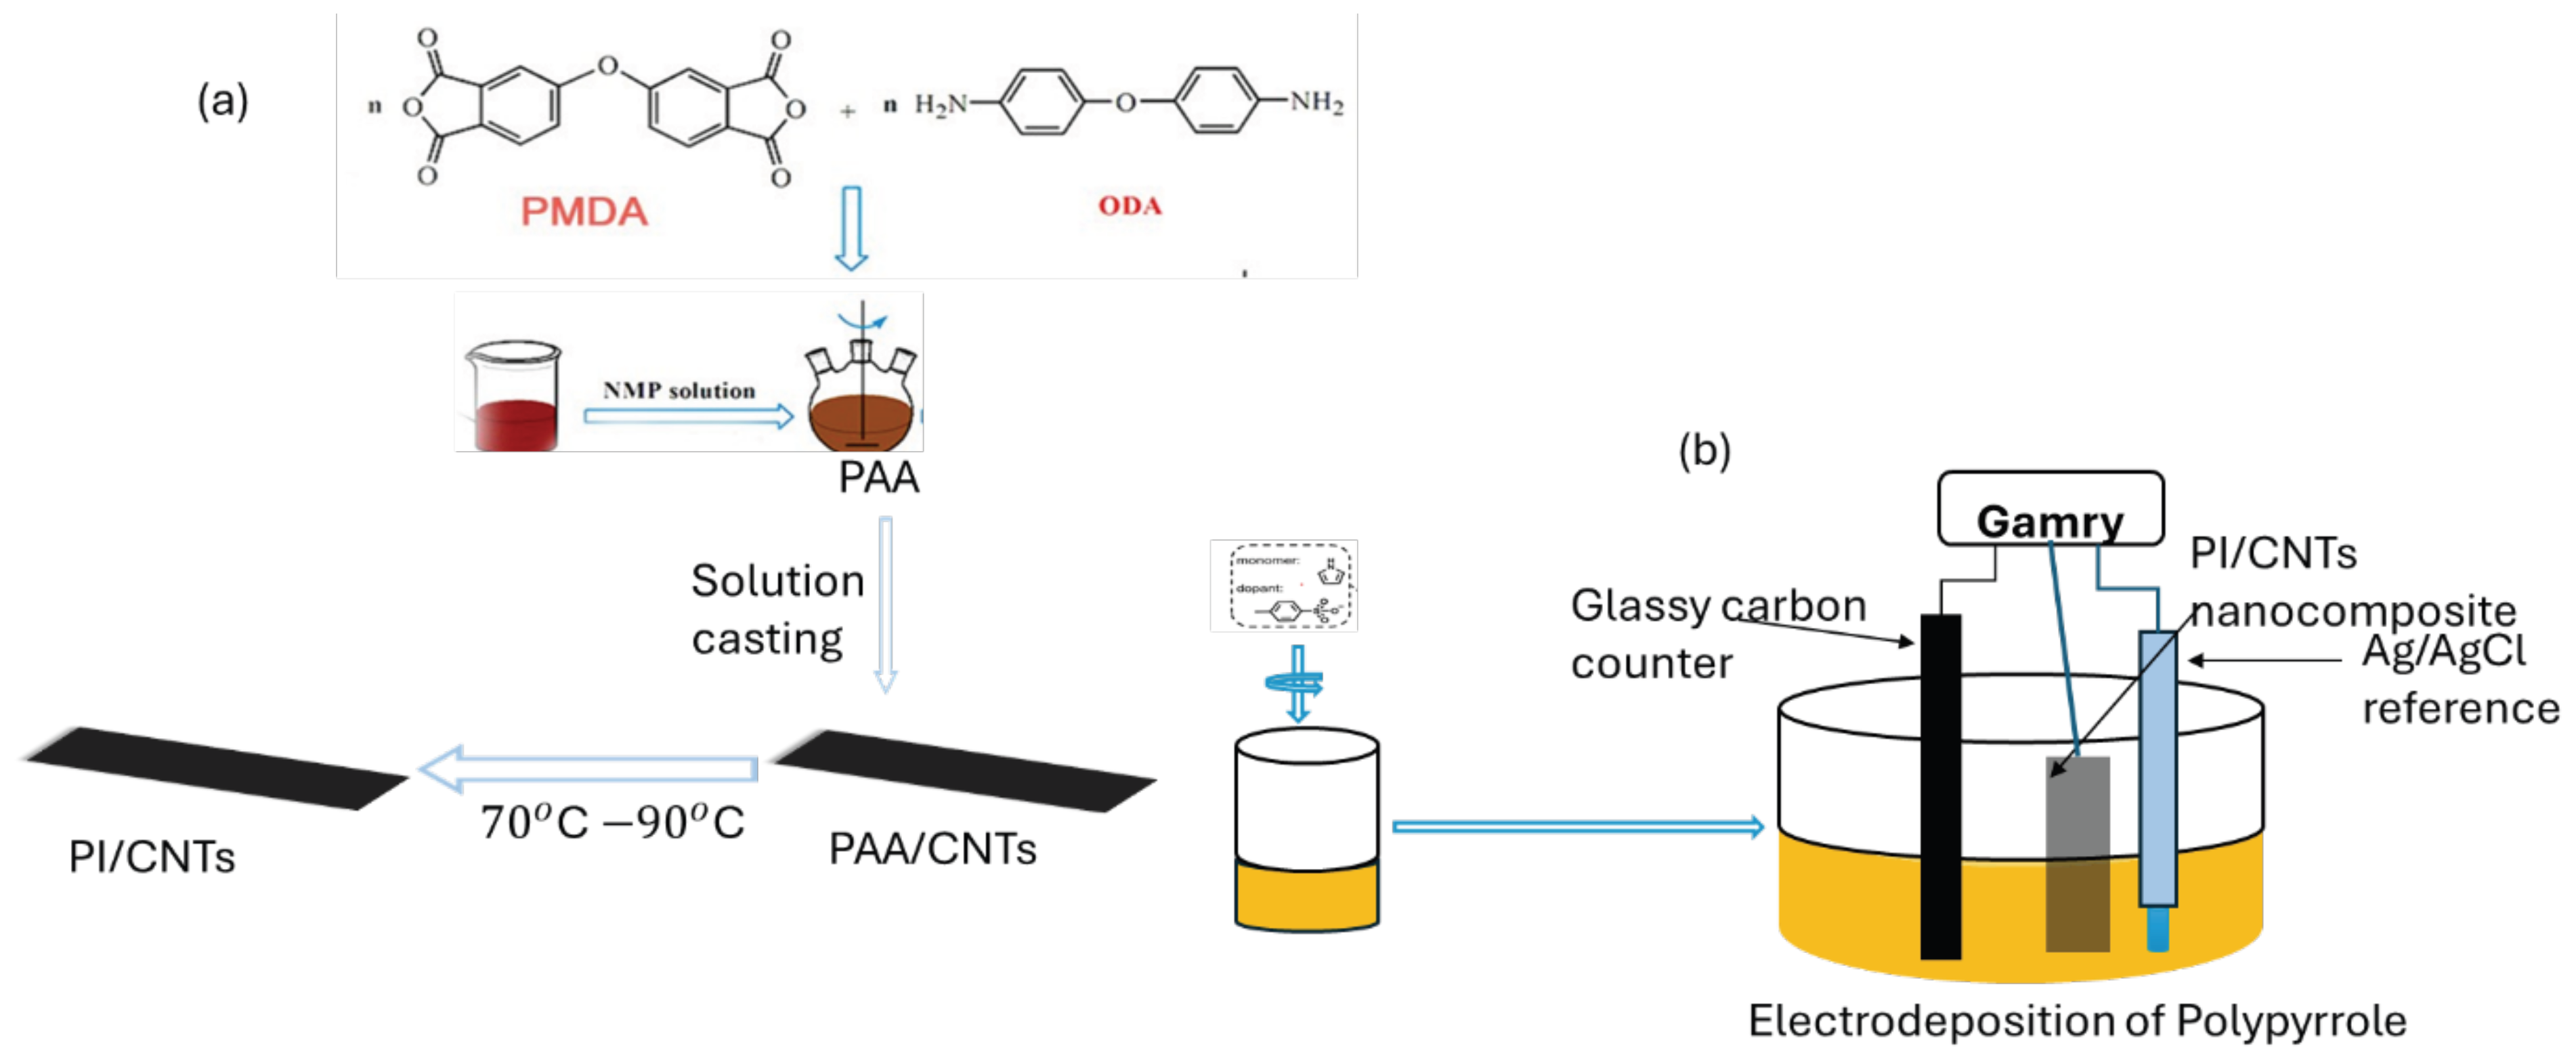
Figure 2.
Equivalent Randle’s cell circuit model for failed coating with double layer and coating capacitor for EIS Nyquist plot fitting.
Figure 2.
Equivalent Randle’s cell circuit model for failed coating with double layer and coating capacitor for EIS Nyquist plot fitting.
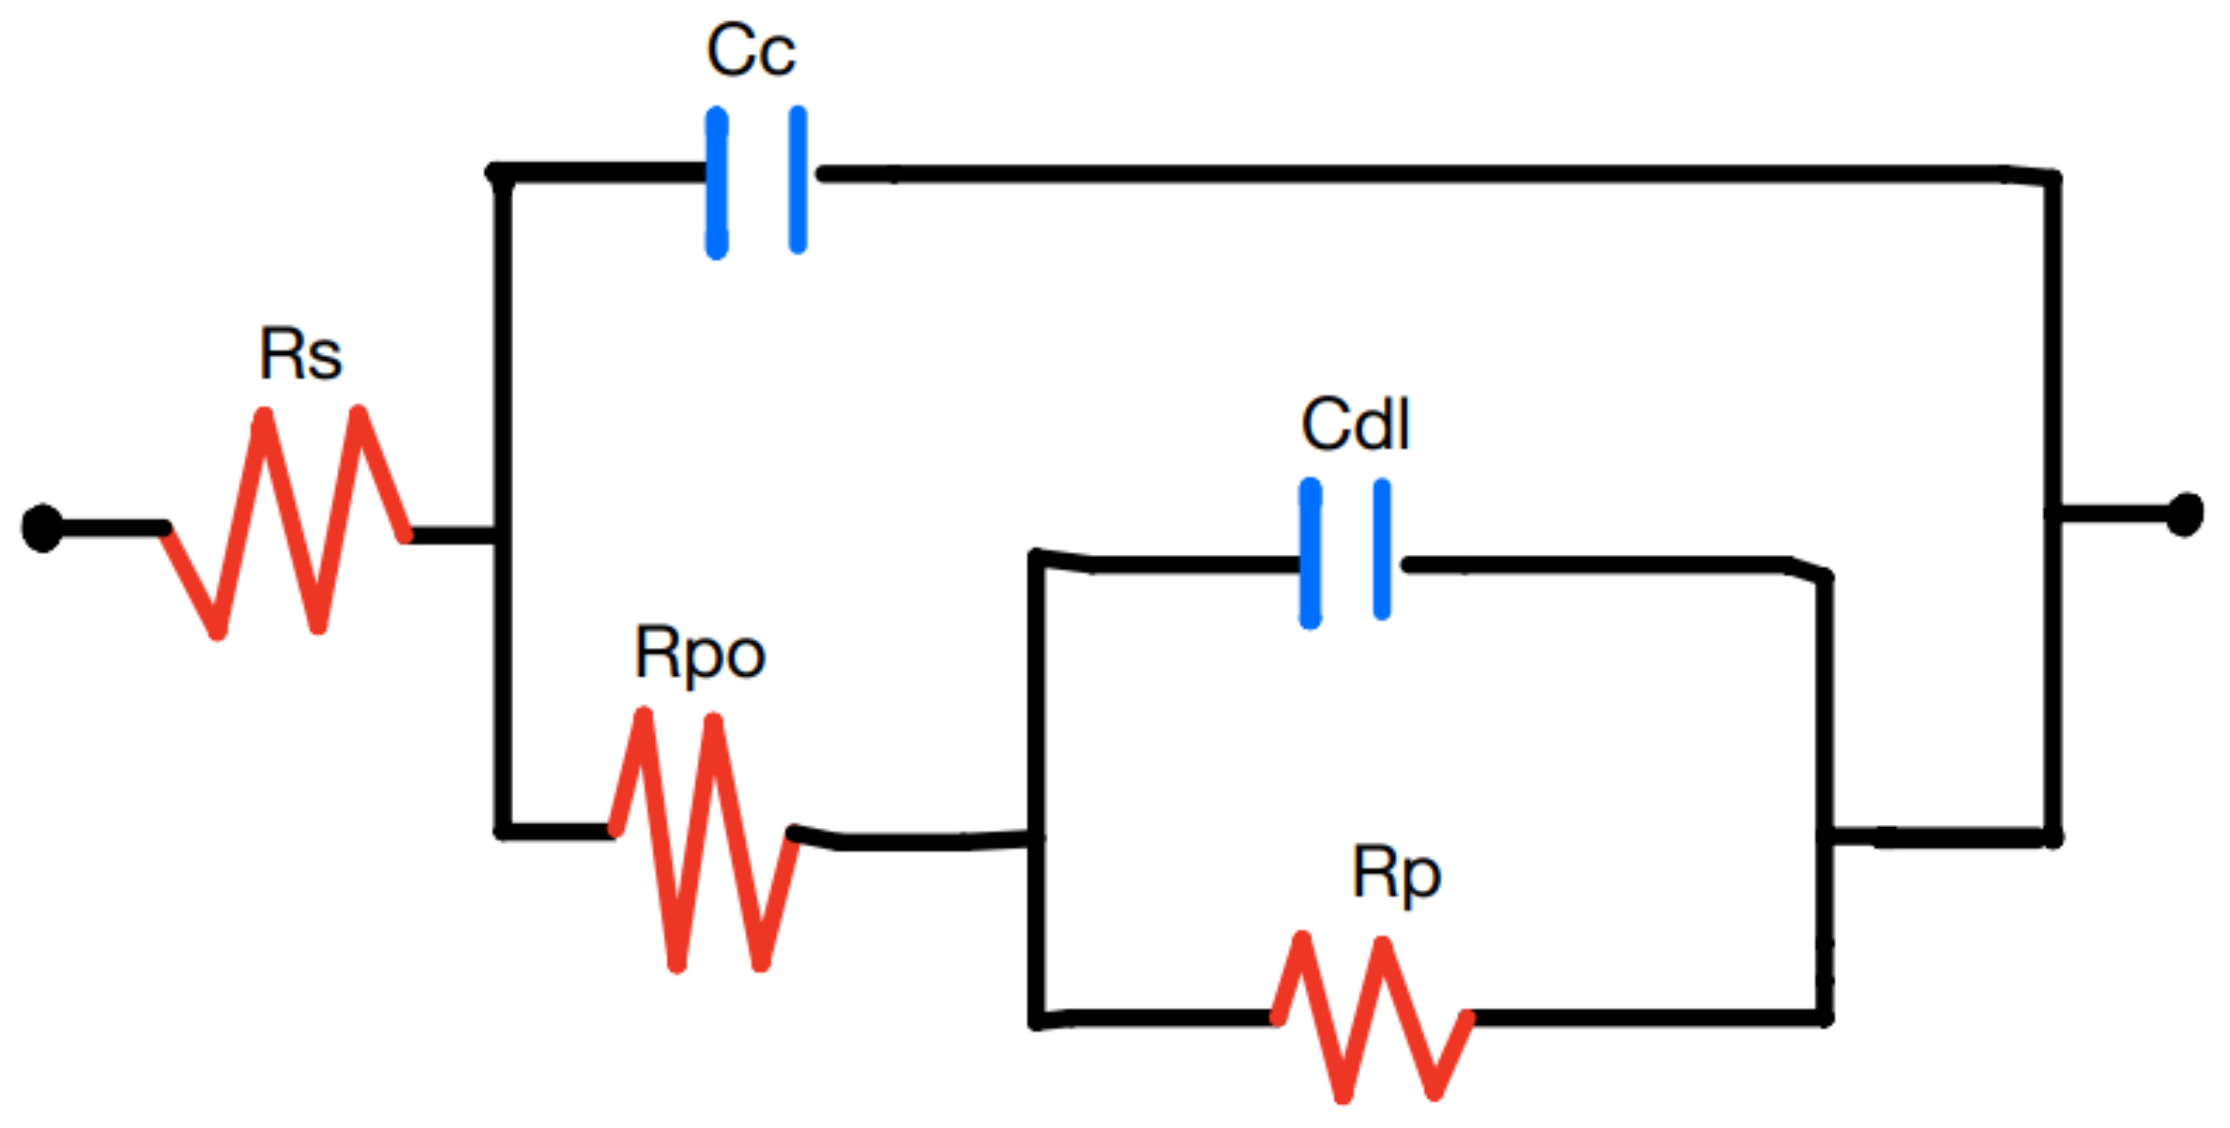
Figure 3.
Transient i–t curves obtained during potentiostatic polymerization of 0.5 M pyrrole in a 0.0225 M toluene sulphonic acid solution at an applied potential of 2 V onto PI/CNTs composite working electrodes processed at (i) 90°C, (ii)180oC and (iii) 250°C.
Figure 3.
Transient i–t curves obtained during potentiostatic polymerization of 0.5 M pyrrole in a 0.0225 M toluene sulphonic acid solution at an applied potential of 2 V onto PI/CNTs composite working electrodes processed at (i) 90°C, (ii)180oC and (iii) 250°C.
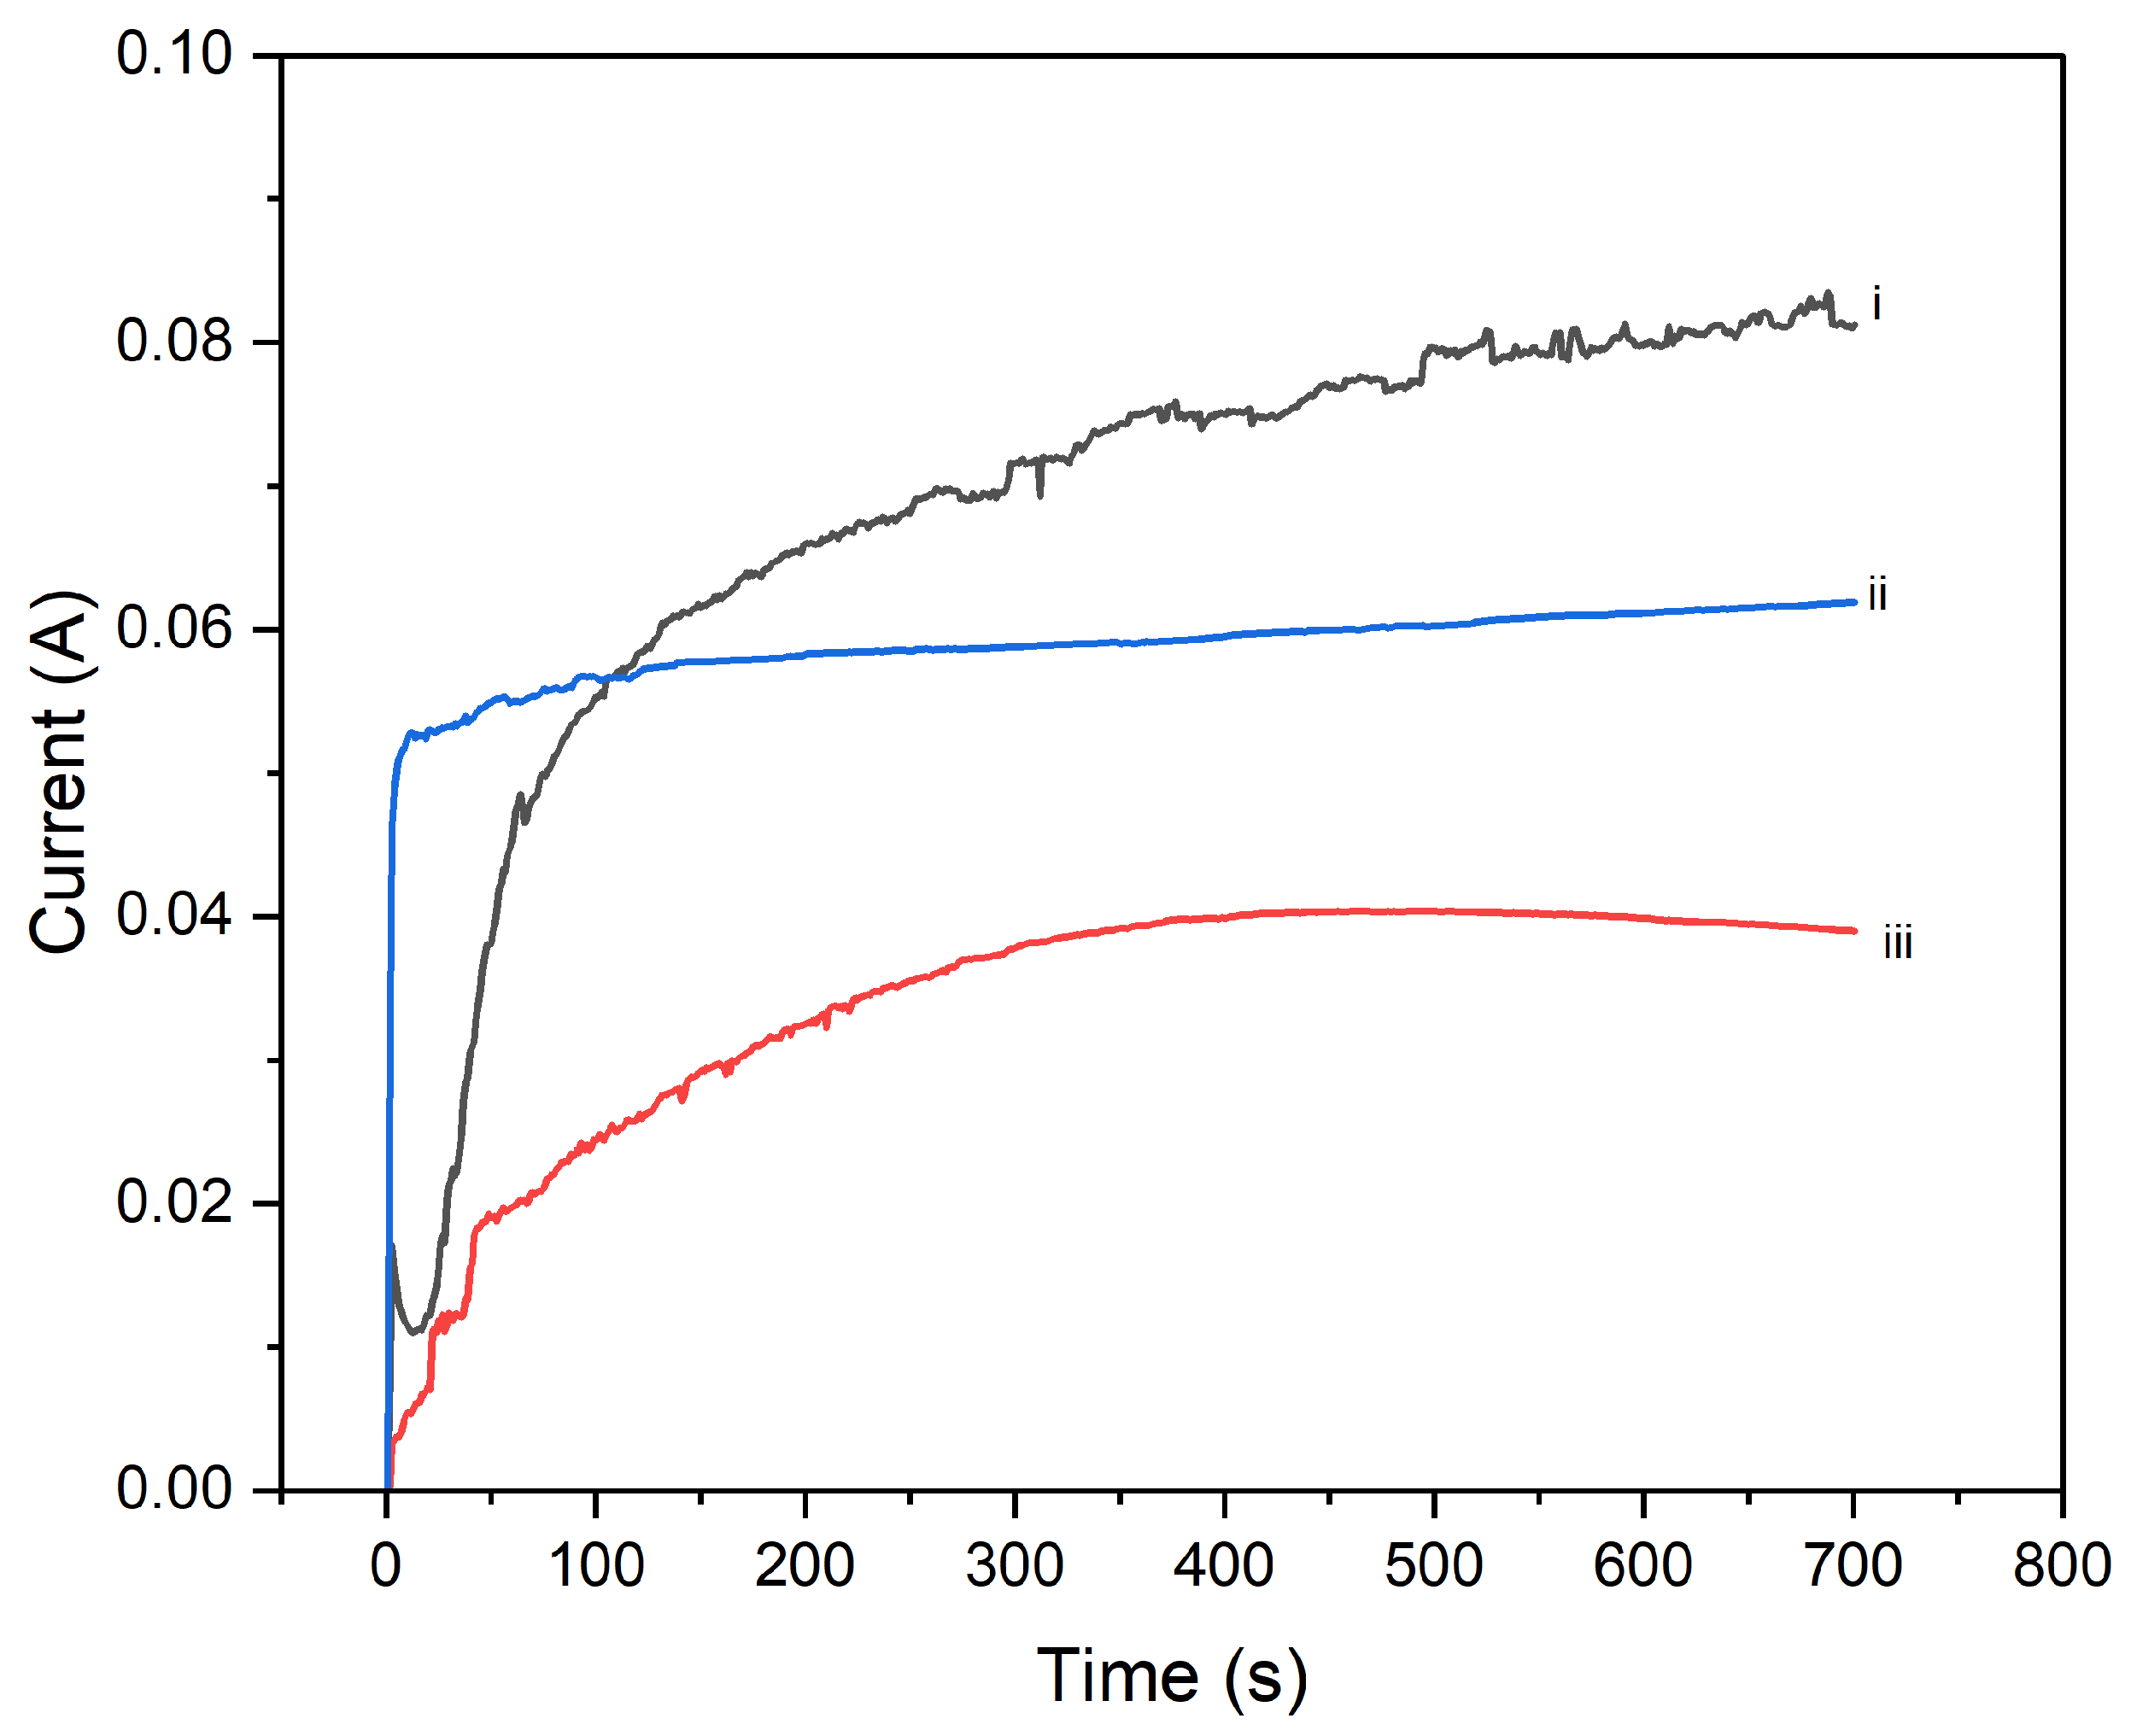
Figure 4.
Cyclic voltammograms of PI/CNTs hybrid nanocomposites processed at 90 °C followed by electrodeposition of PPy using an Ag/AgCl reference electrode and a graphite rod counter electrode for (a) (i)1 cycle at and (b) 5 cycles, (c) 10 cycles CV was run at 5 mV/s, 10mV/s, and 25mV/s.
Figure 4.
Cyclic voltammograms of PI/CNTs hybrid nanocomposites processed at 90 °C followed by electrodeposition of PPy using an Ag/AgCl reference electrode and a graphite rod counter electrode for (a) (i)1 cycle at and (b) 5 cycles, (c) 10 cycles CV was run at 5 mV/s, 10mV/s, and 25mV/s.
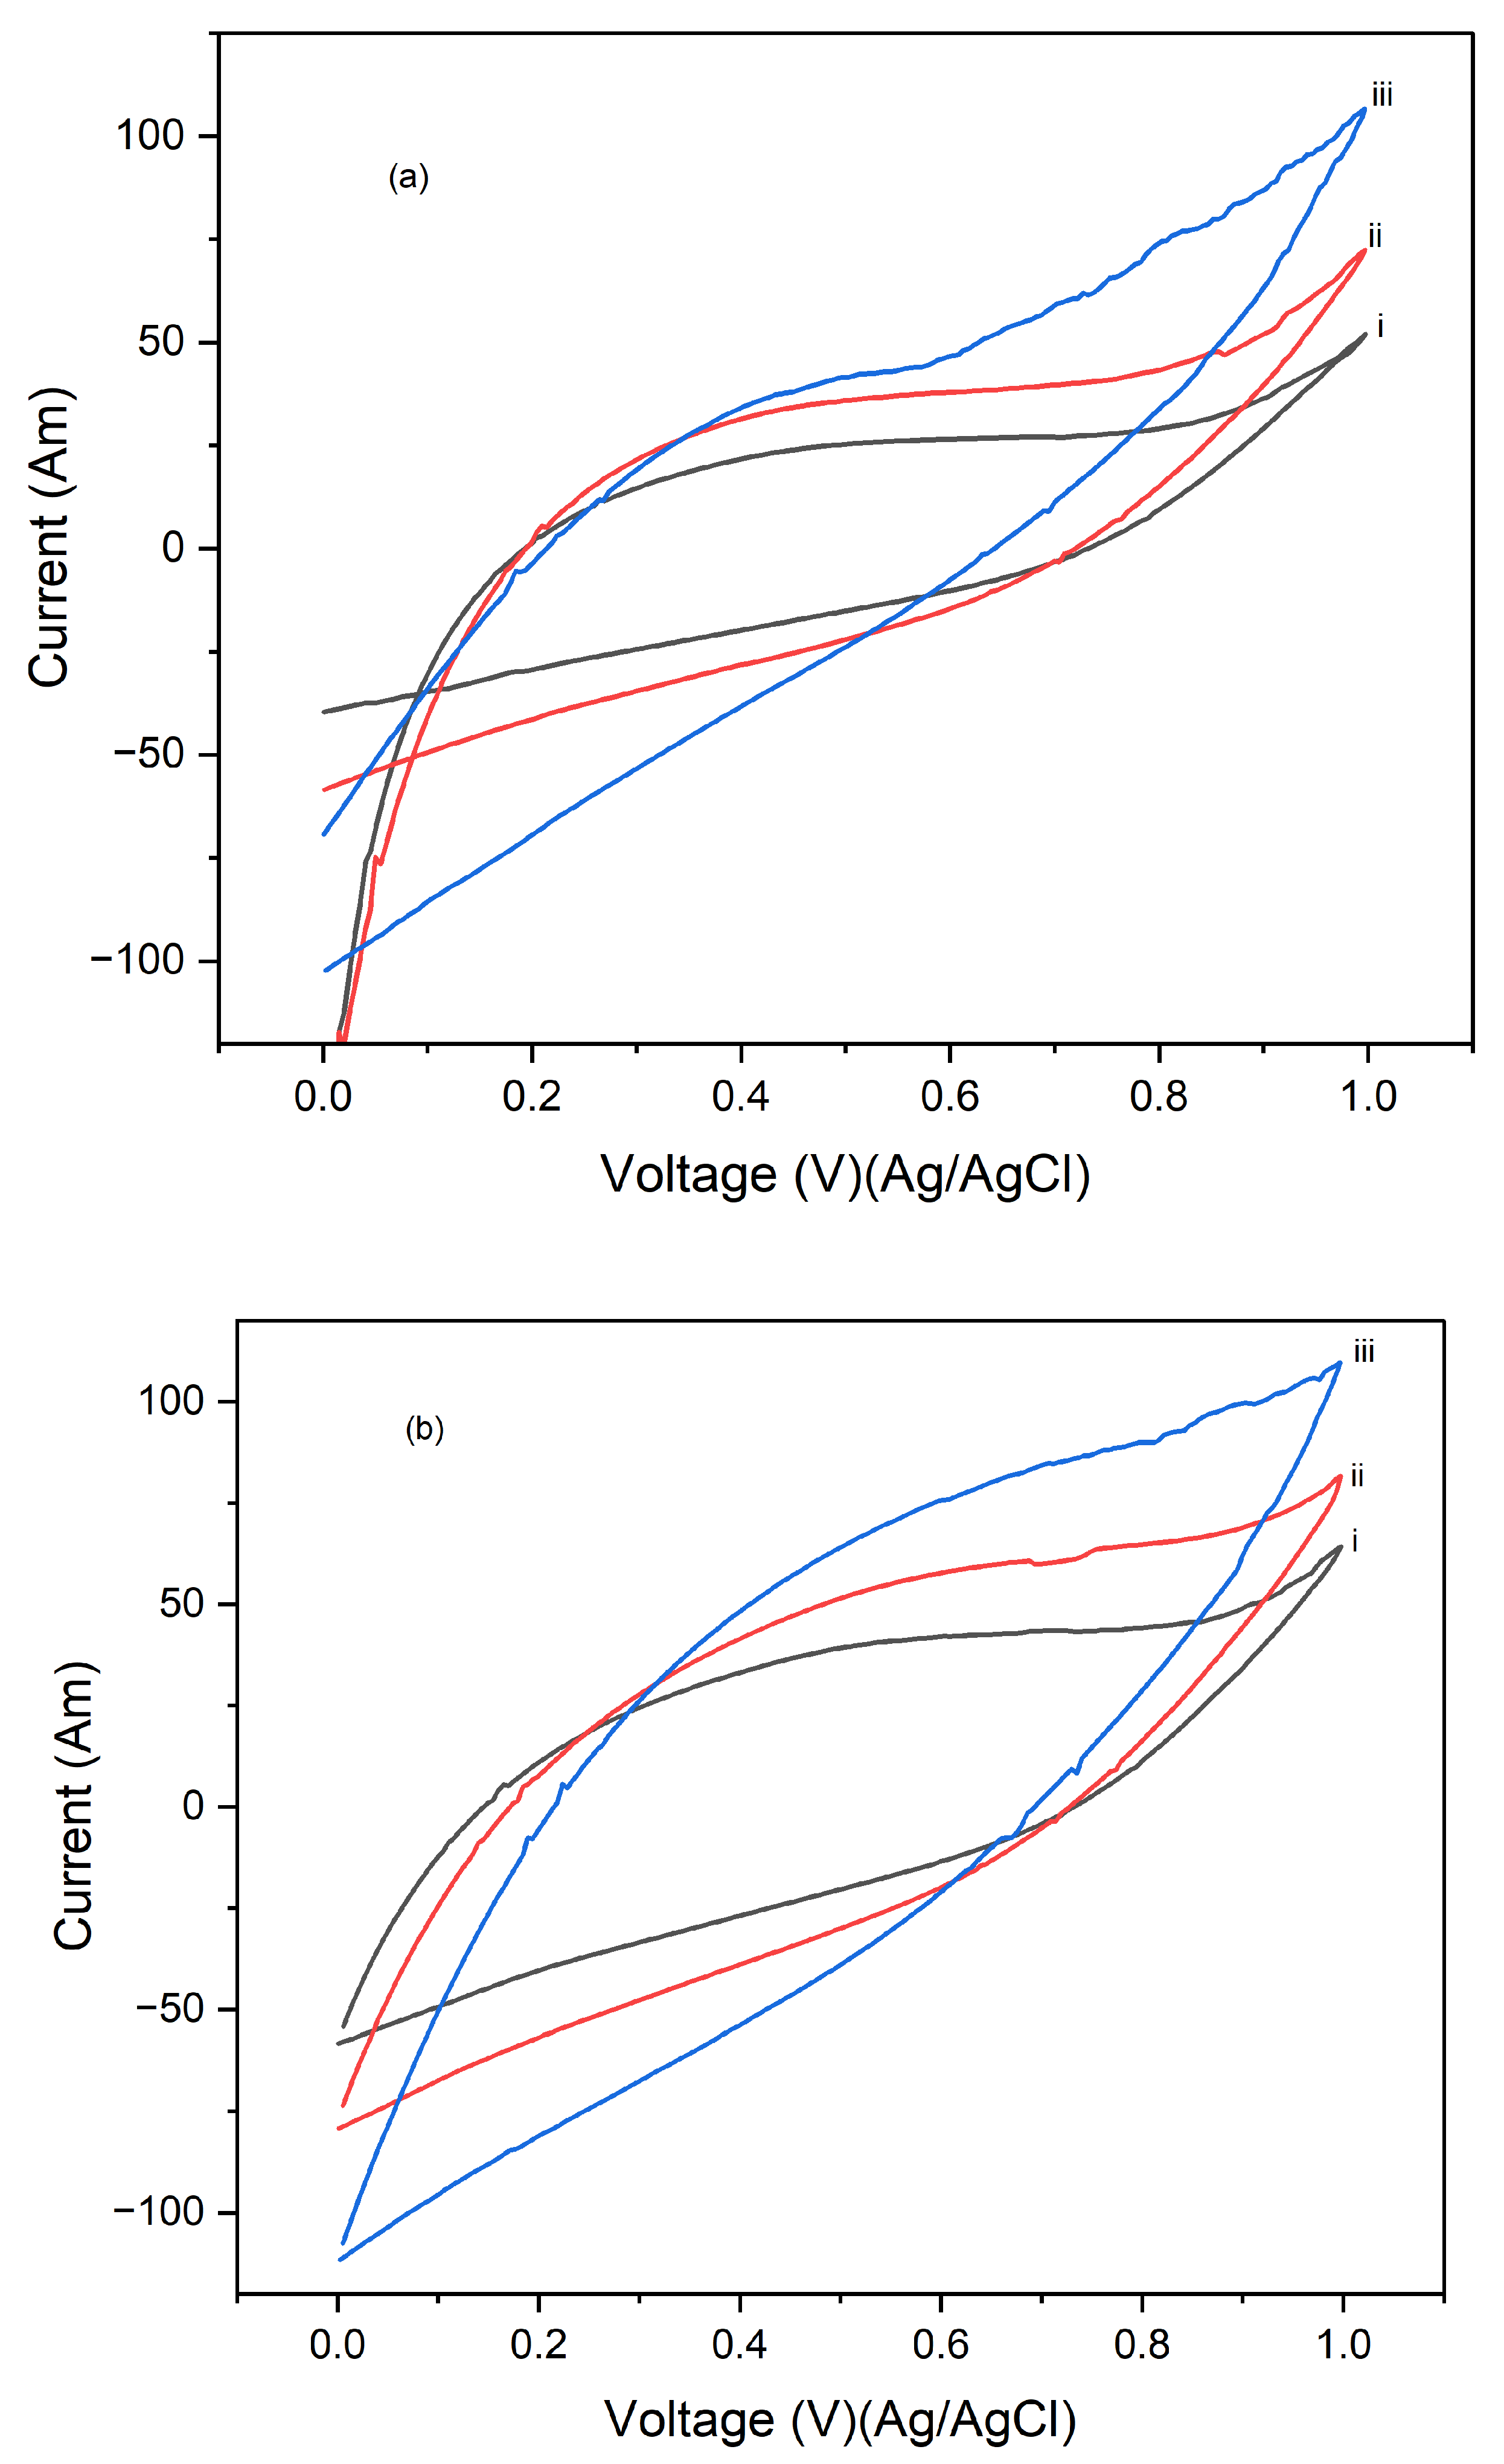
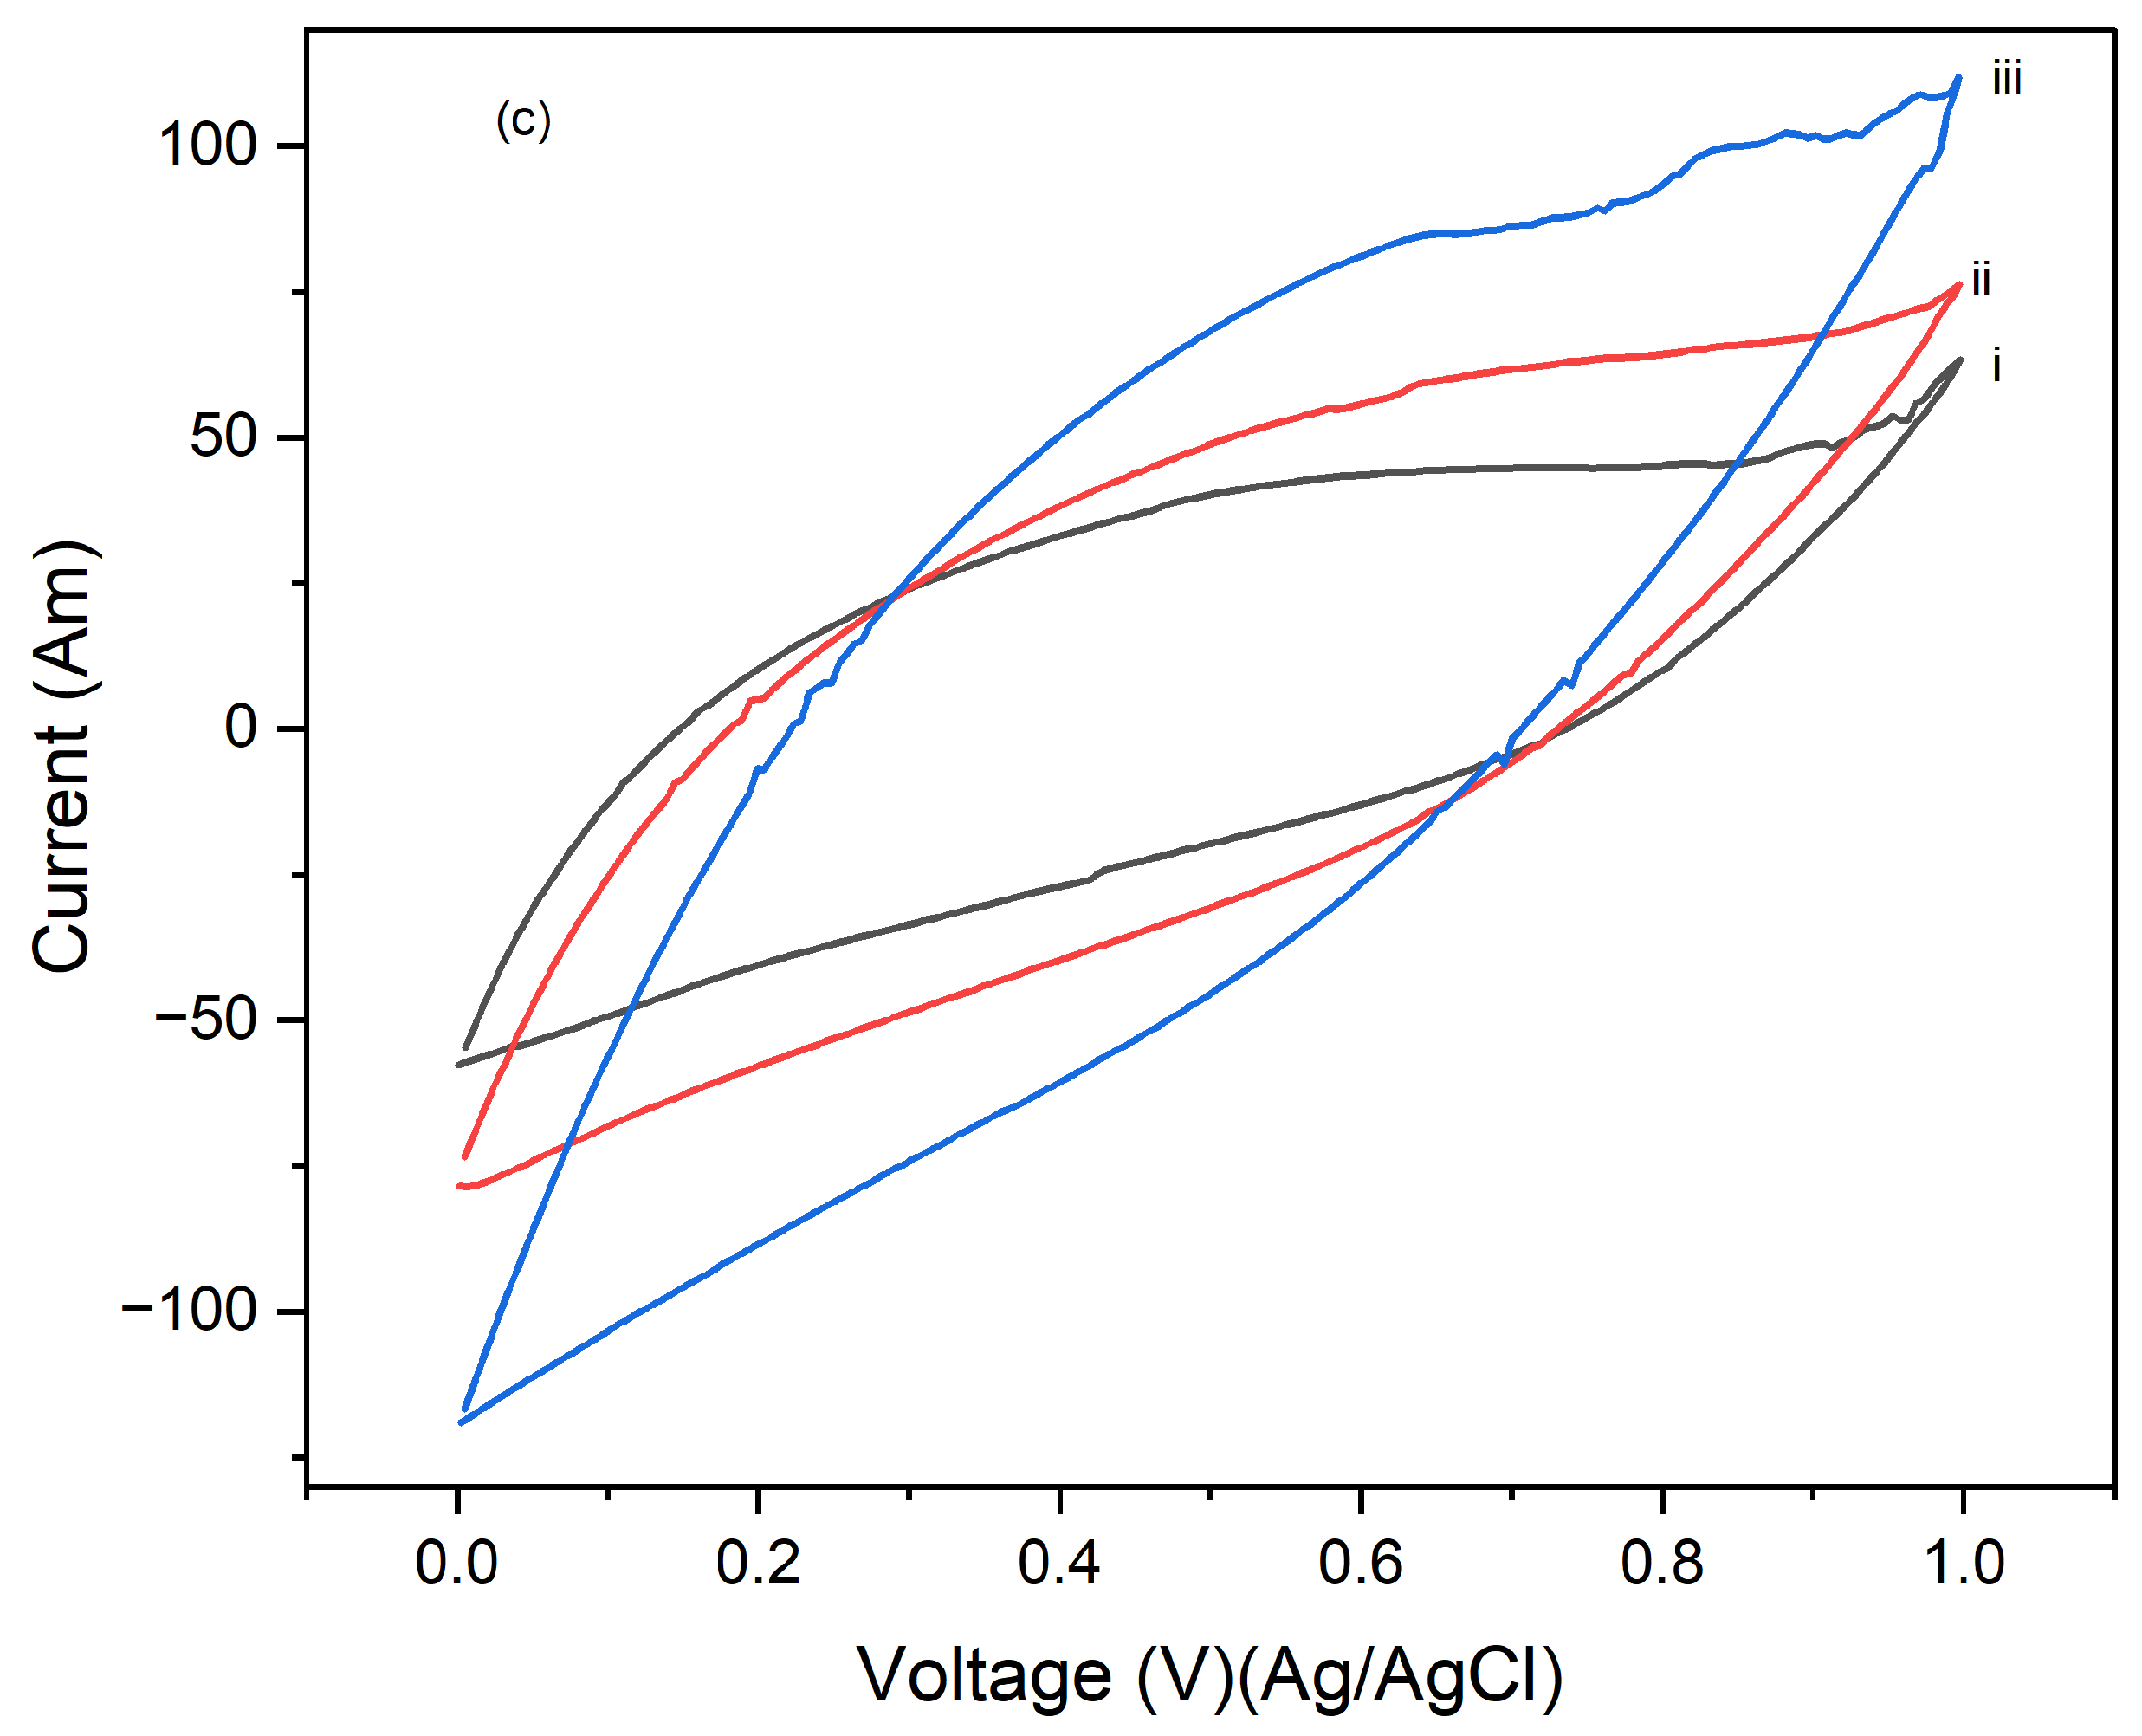
Figure 5.
Cyclic voltammograms of PI/CNTs hybrid nanocomposites processed at 180 °C followed by electrodeposition of PPy using an Ag/AgCl reference electrode and a graphite rod counter electrode for (a) (i) 1 cycle at 5mV/s, (ii) 1 cycle at 10mV/s, 1 cycle at 25mV/s and (b) (ii) 5 cycle at 5mV/s, (ii) 5 cycles at 10mV/s, (iii) 5 cycles at 25mV/s (c) (1)10 cycles at 5mV/s, (ii) 10 cycles at 10mV/s, (iii) 10 cycles at 25mV/s.
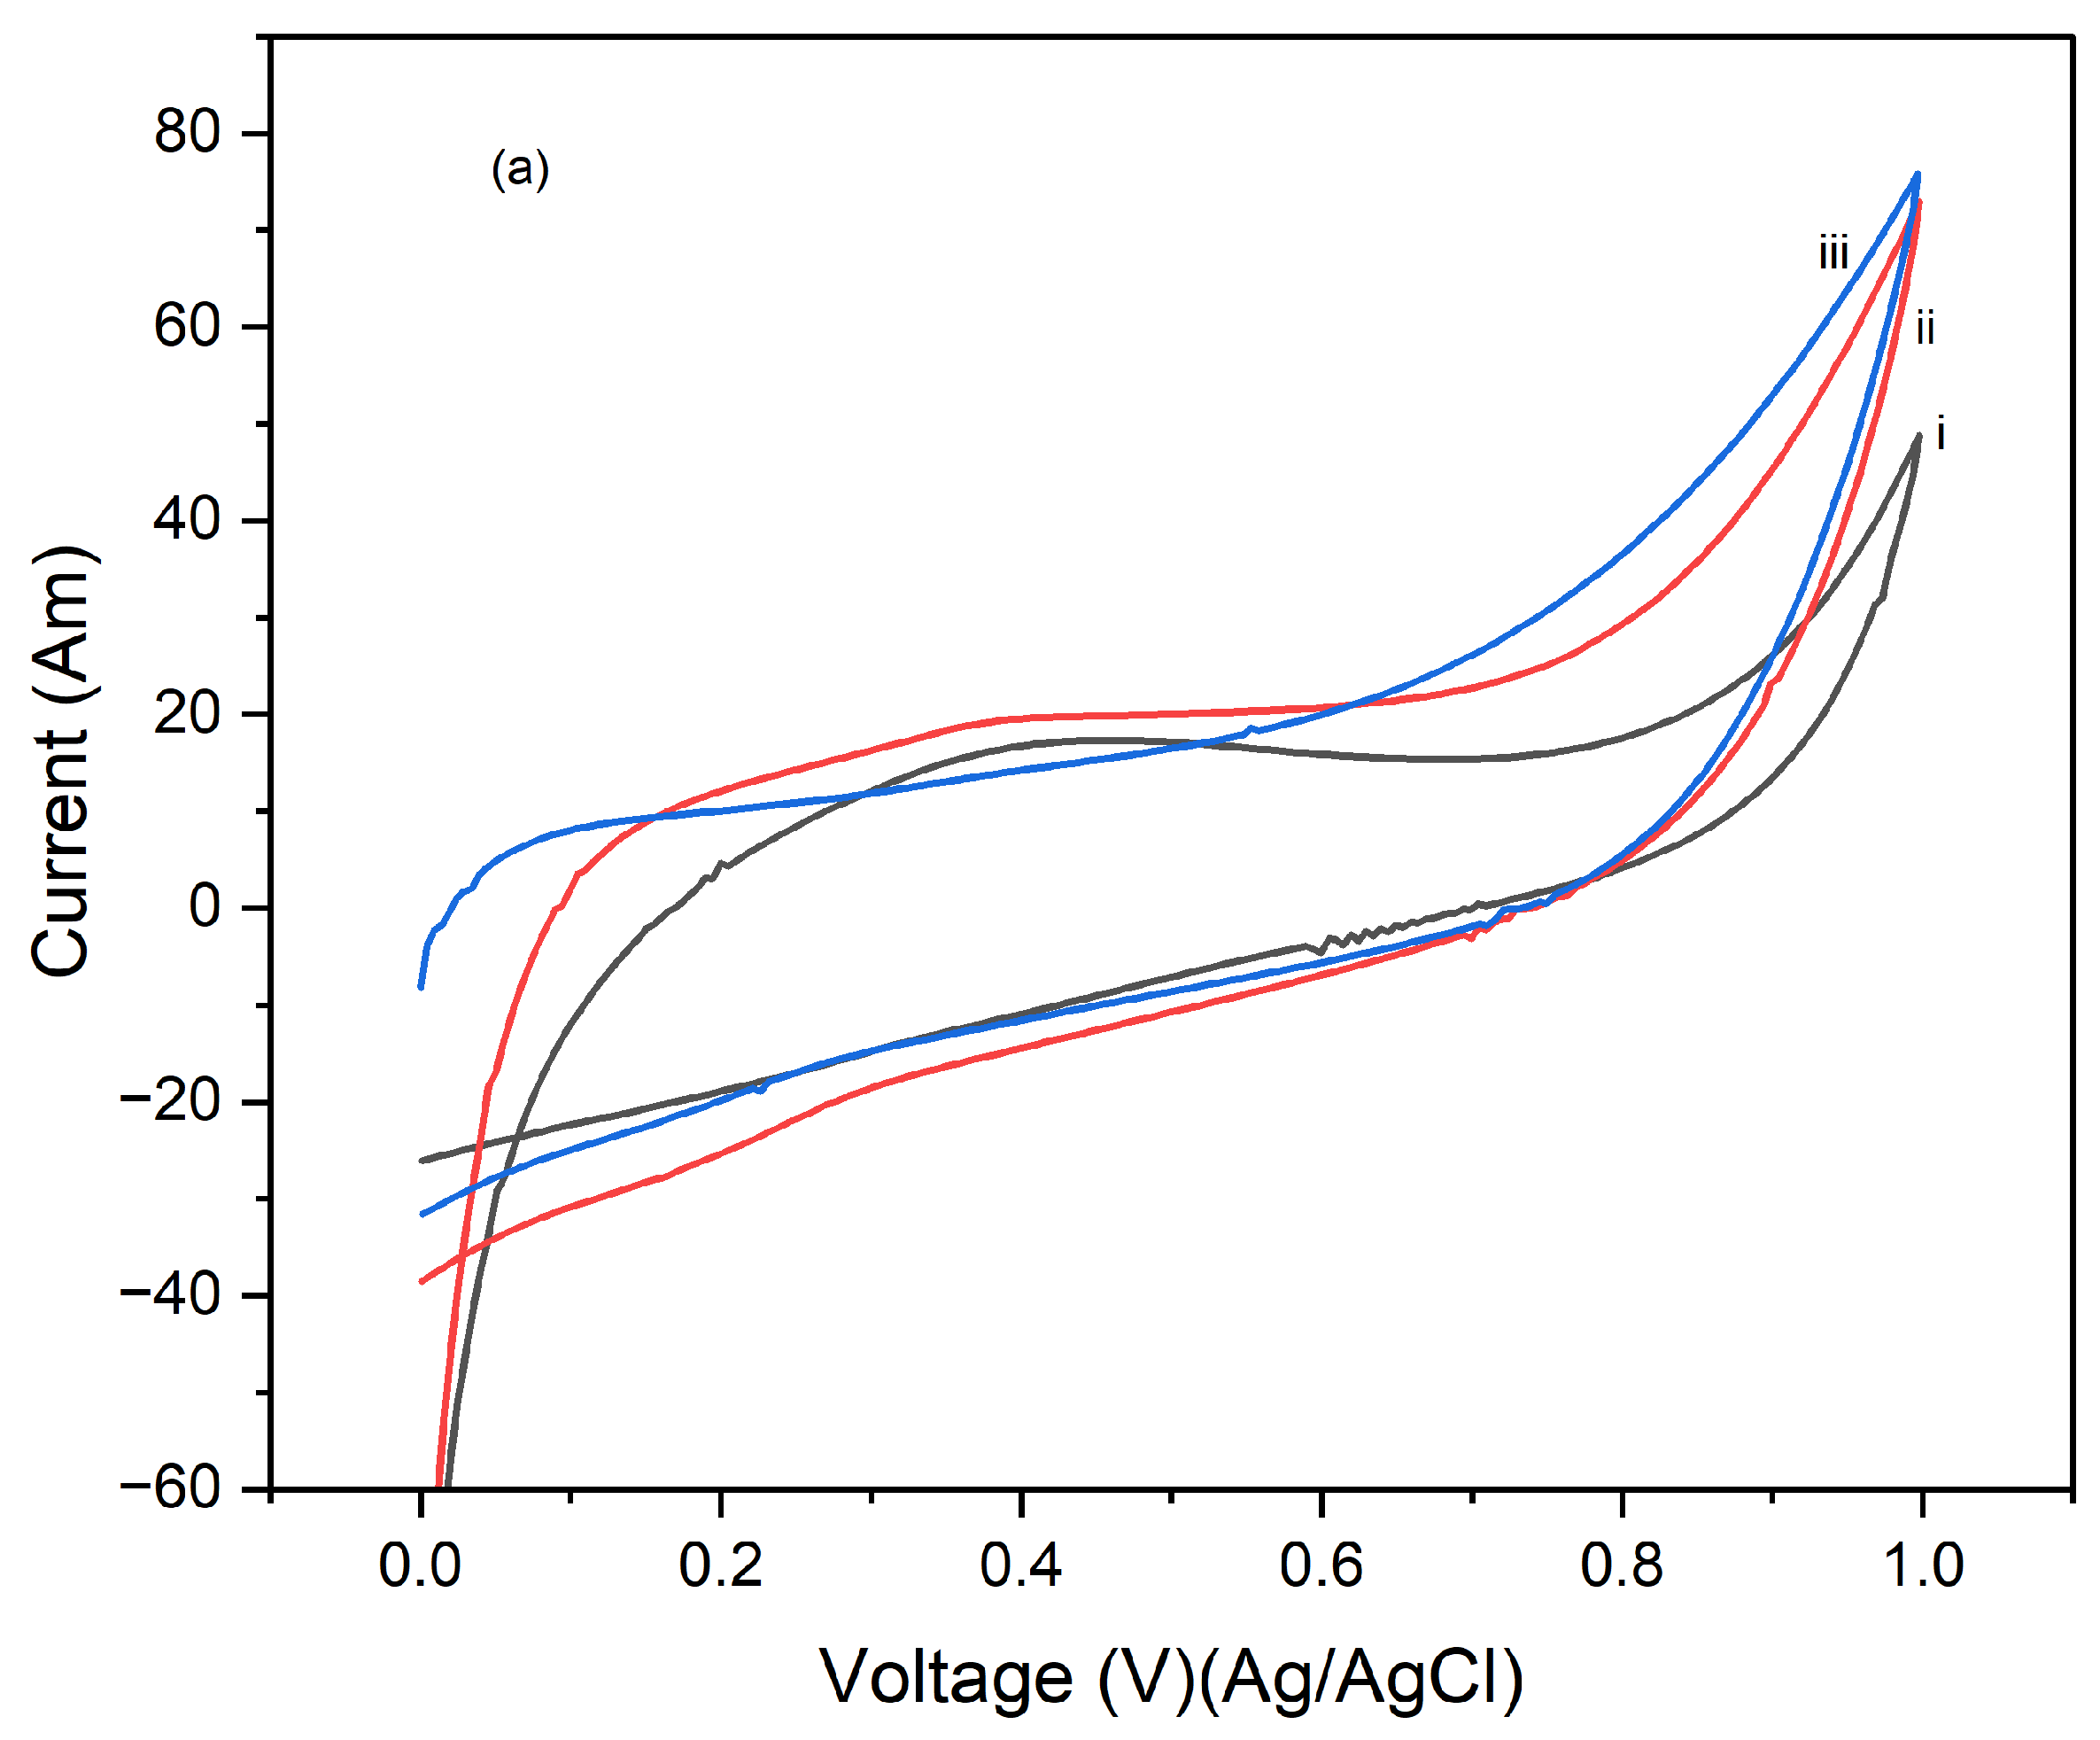
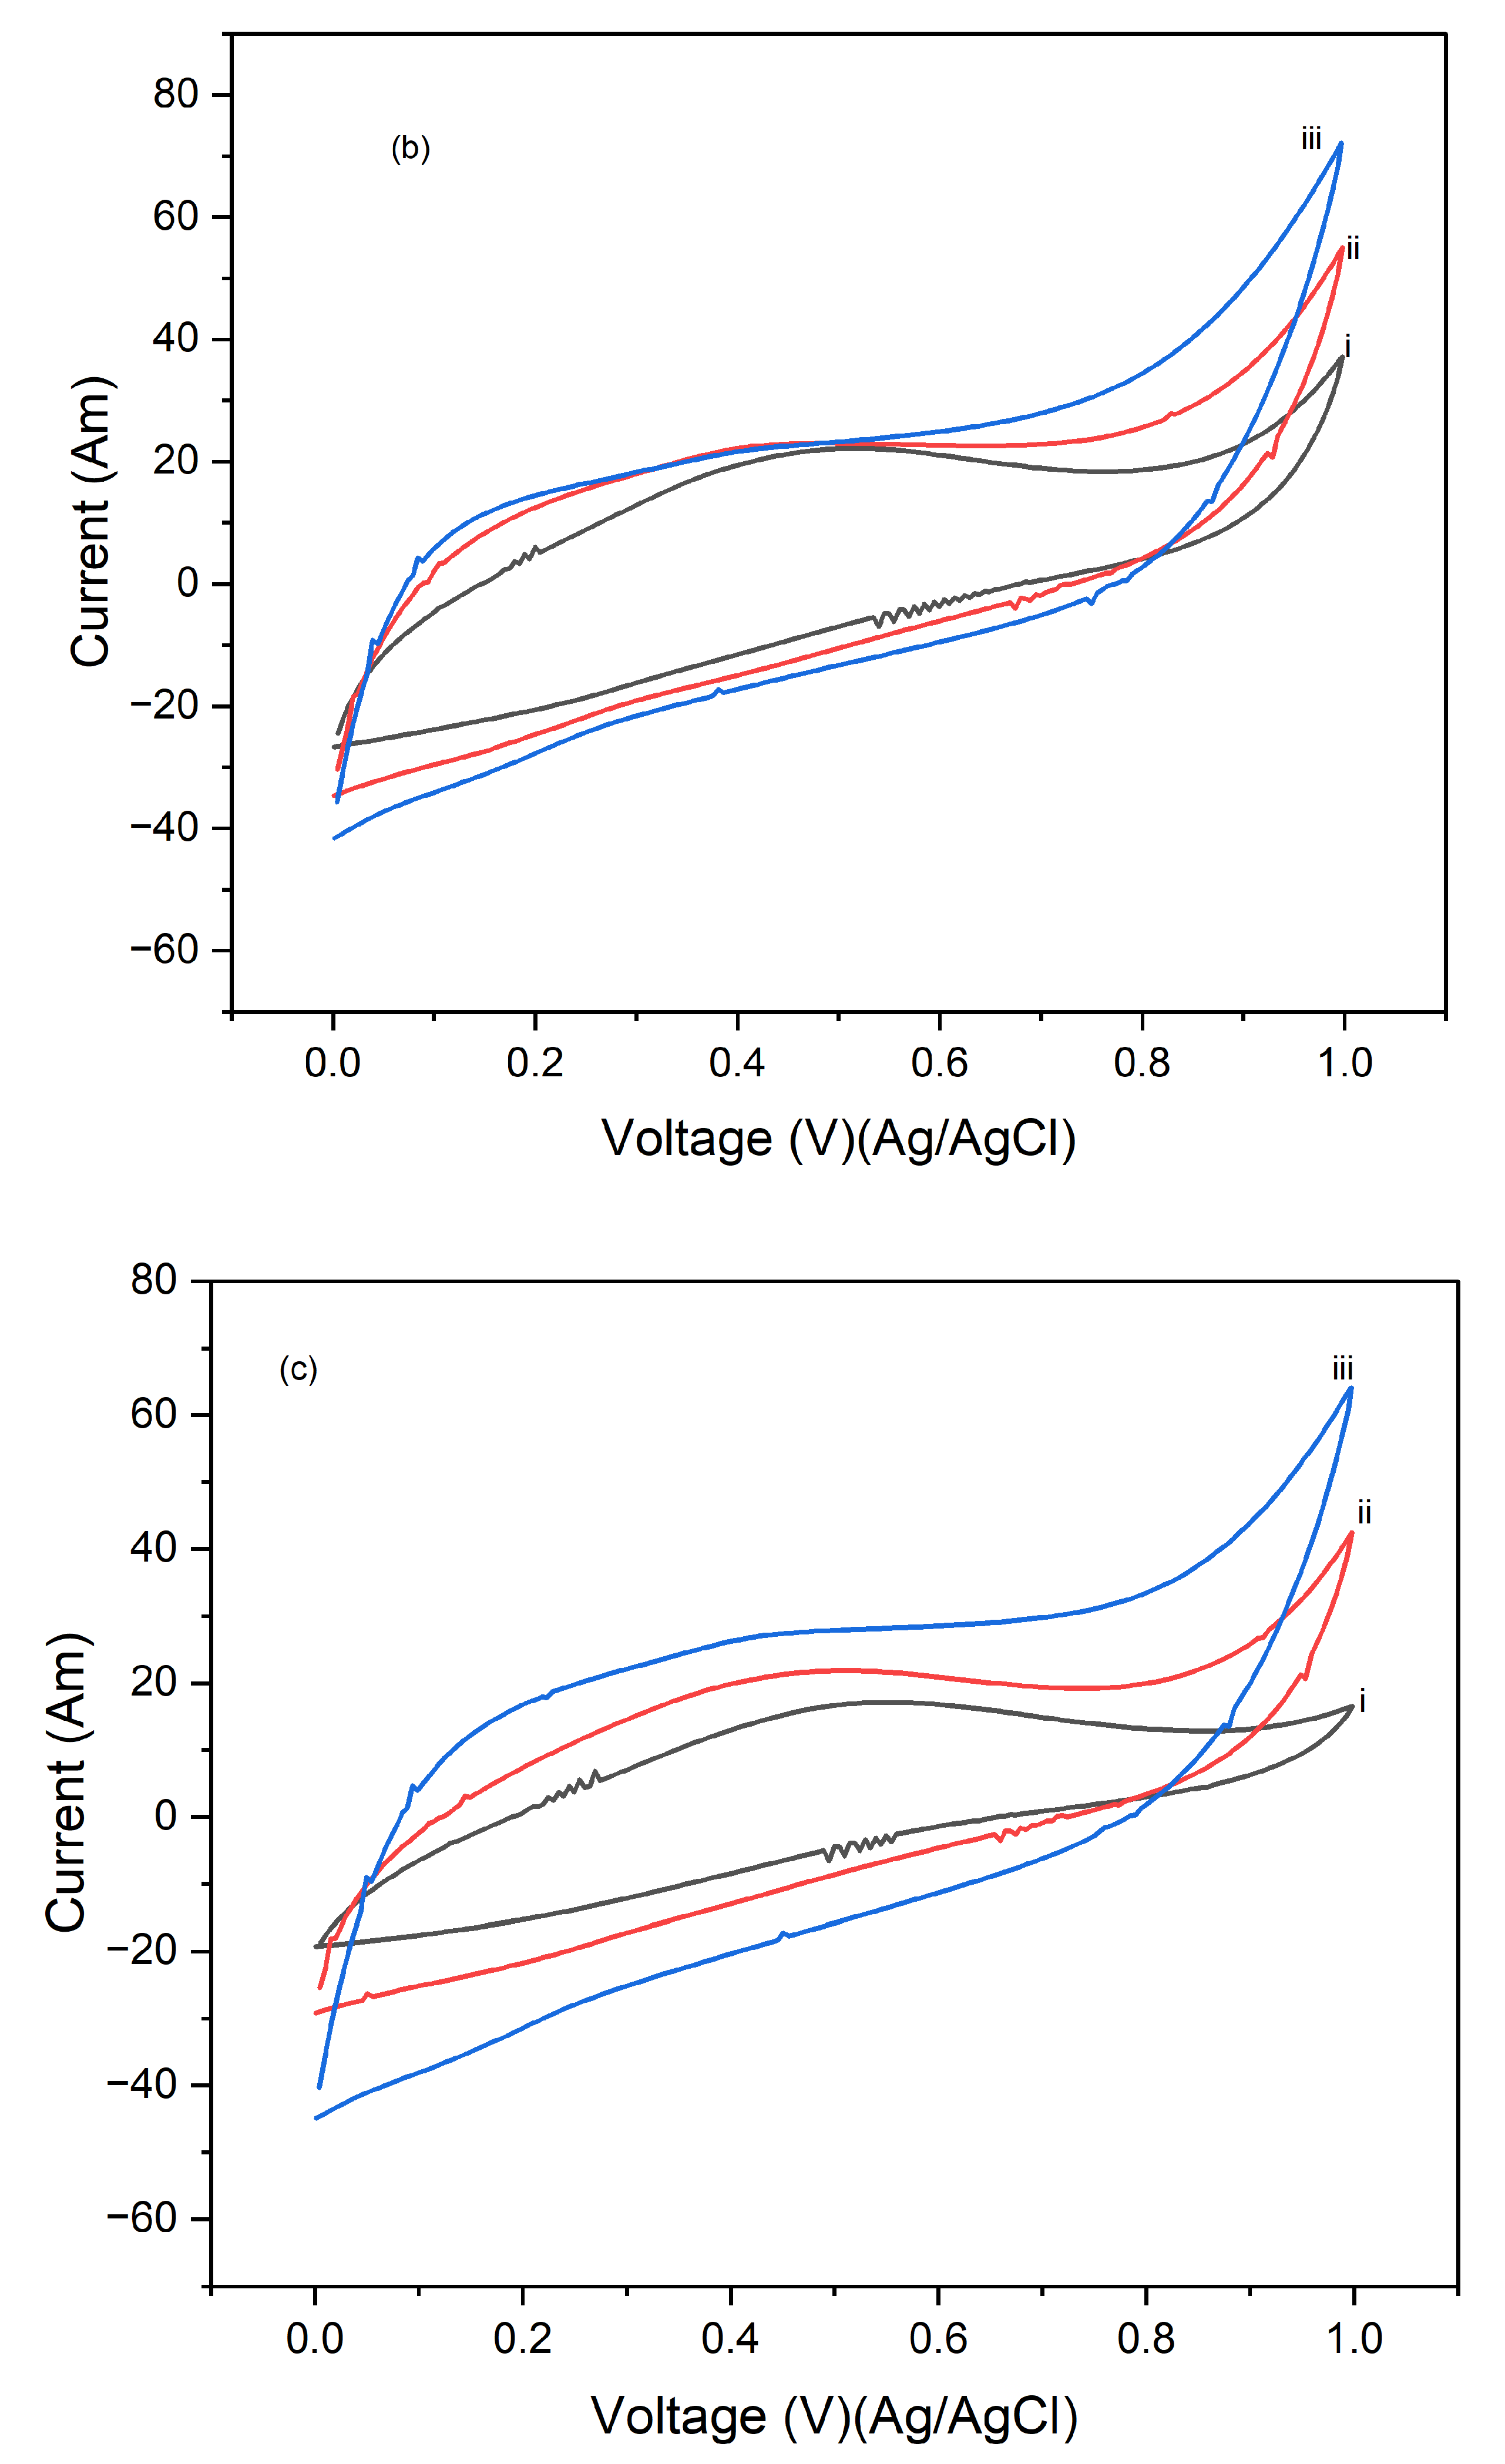
Figure 6.
Cyclic voltammograms of PI/CNTs hybrid nanocomposites processed at 250 °C followed by electrodeposition of PPy using an Ag/AgCl reference electrode and a graphite rod counter electrode for (a) (i) 1 cycle at 5mV/s, (ii) 1 cycle at 10mV/s, 1 cycle at 25mV/s, (b) (ii) 5 cycle at 5mV/s, (ii) 5 cycles at 10mV/s, (iii) 5 cycles at 25mV/s and (c) (i)10 cycles at 5mV/s, (ii) 10 cycles at 10mV/s, (iii) 10 cycles at 25mV/s.
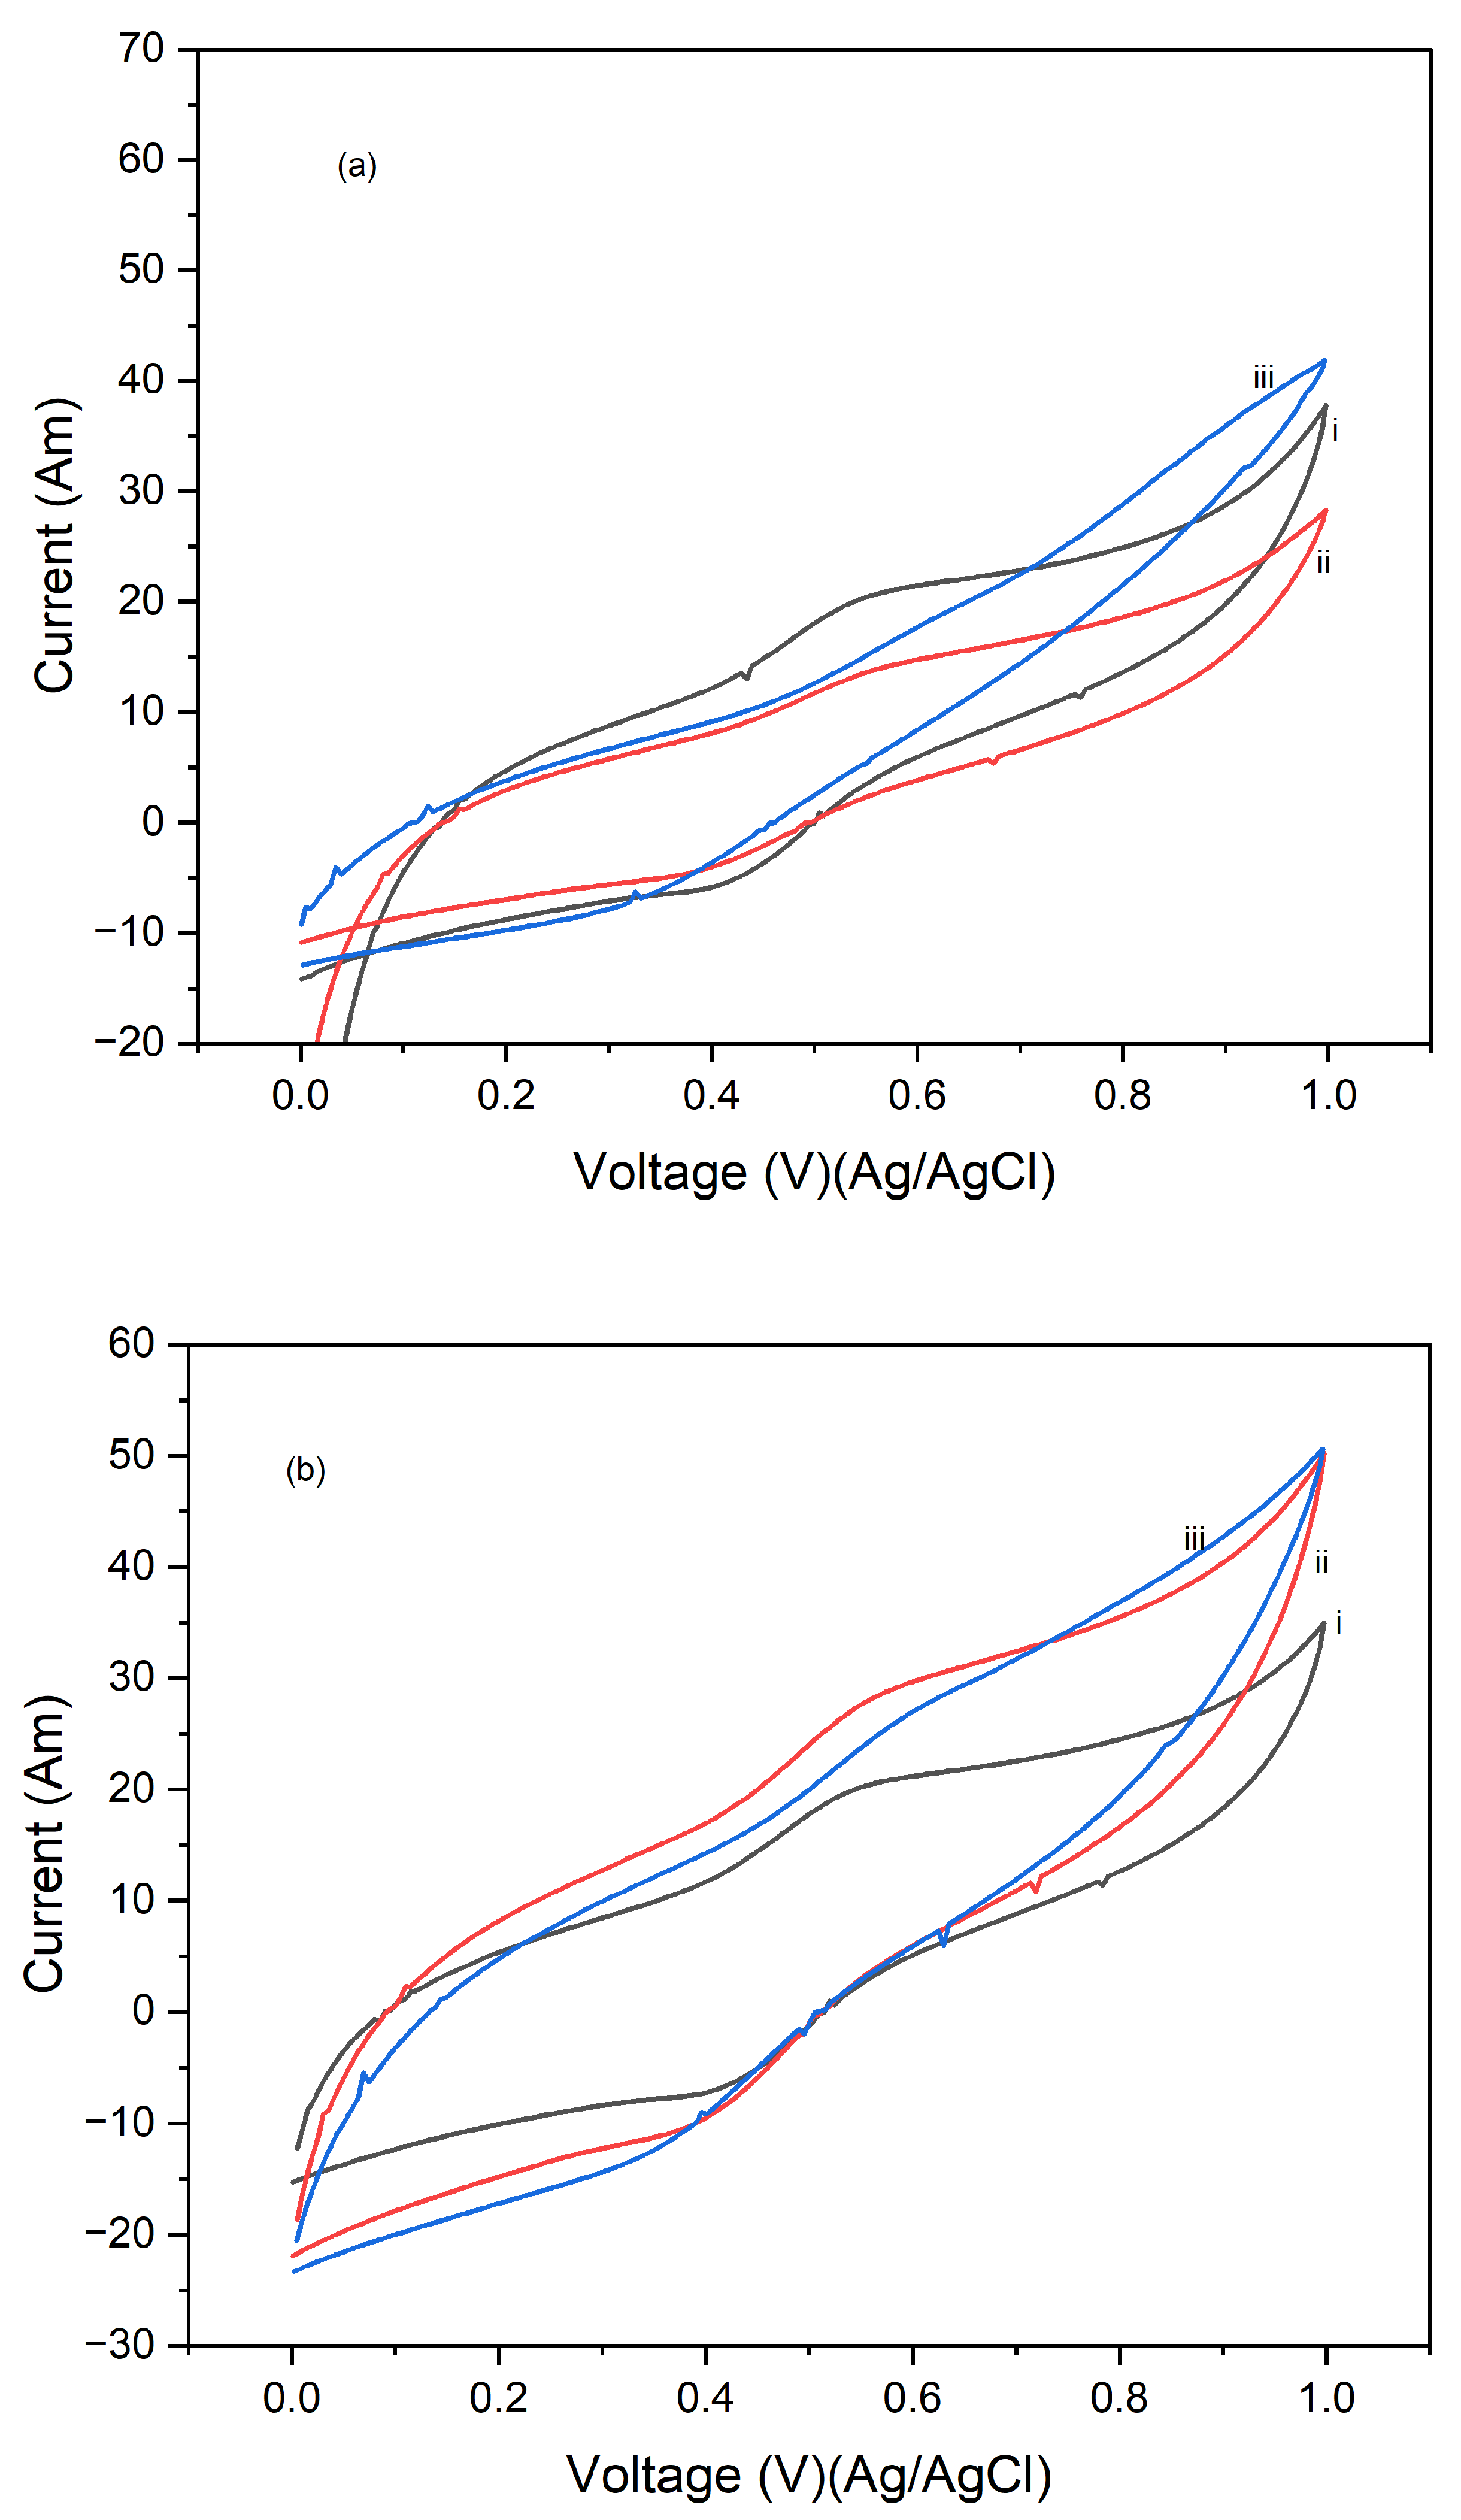
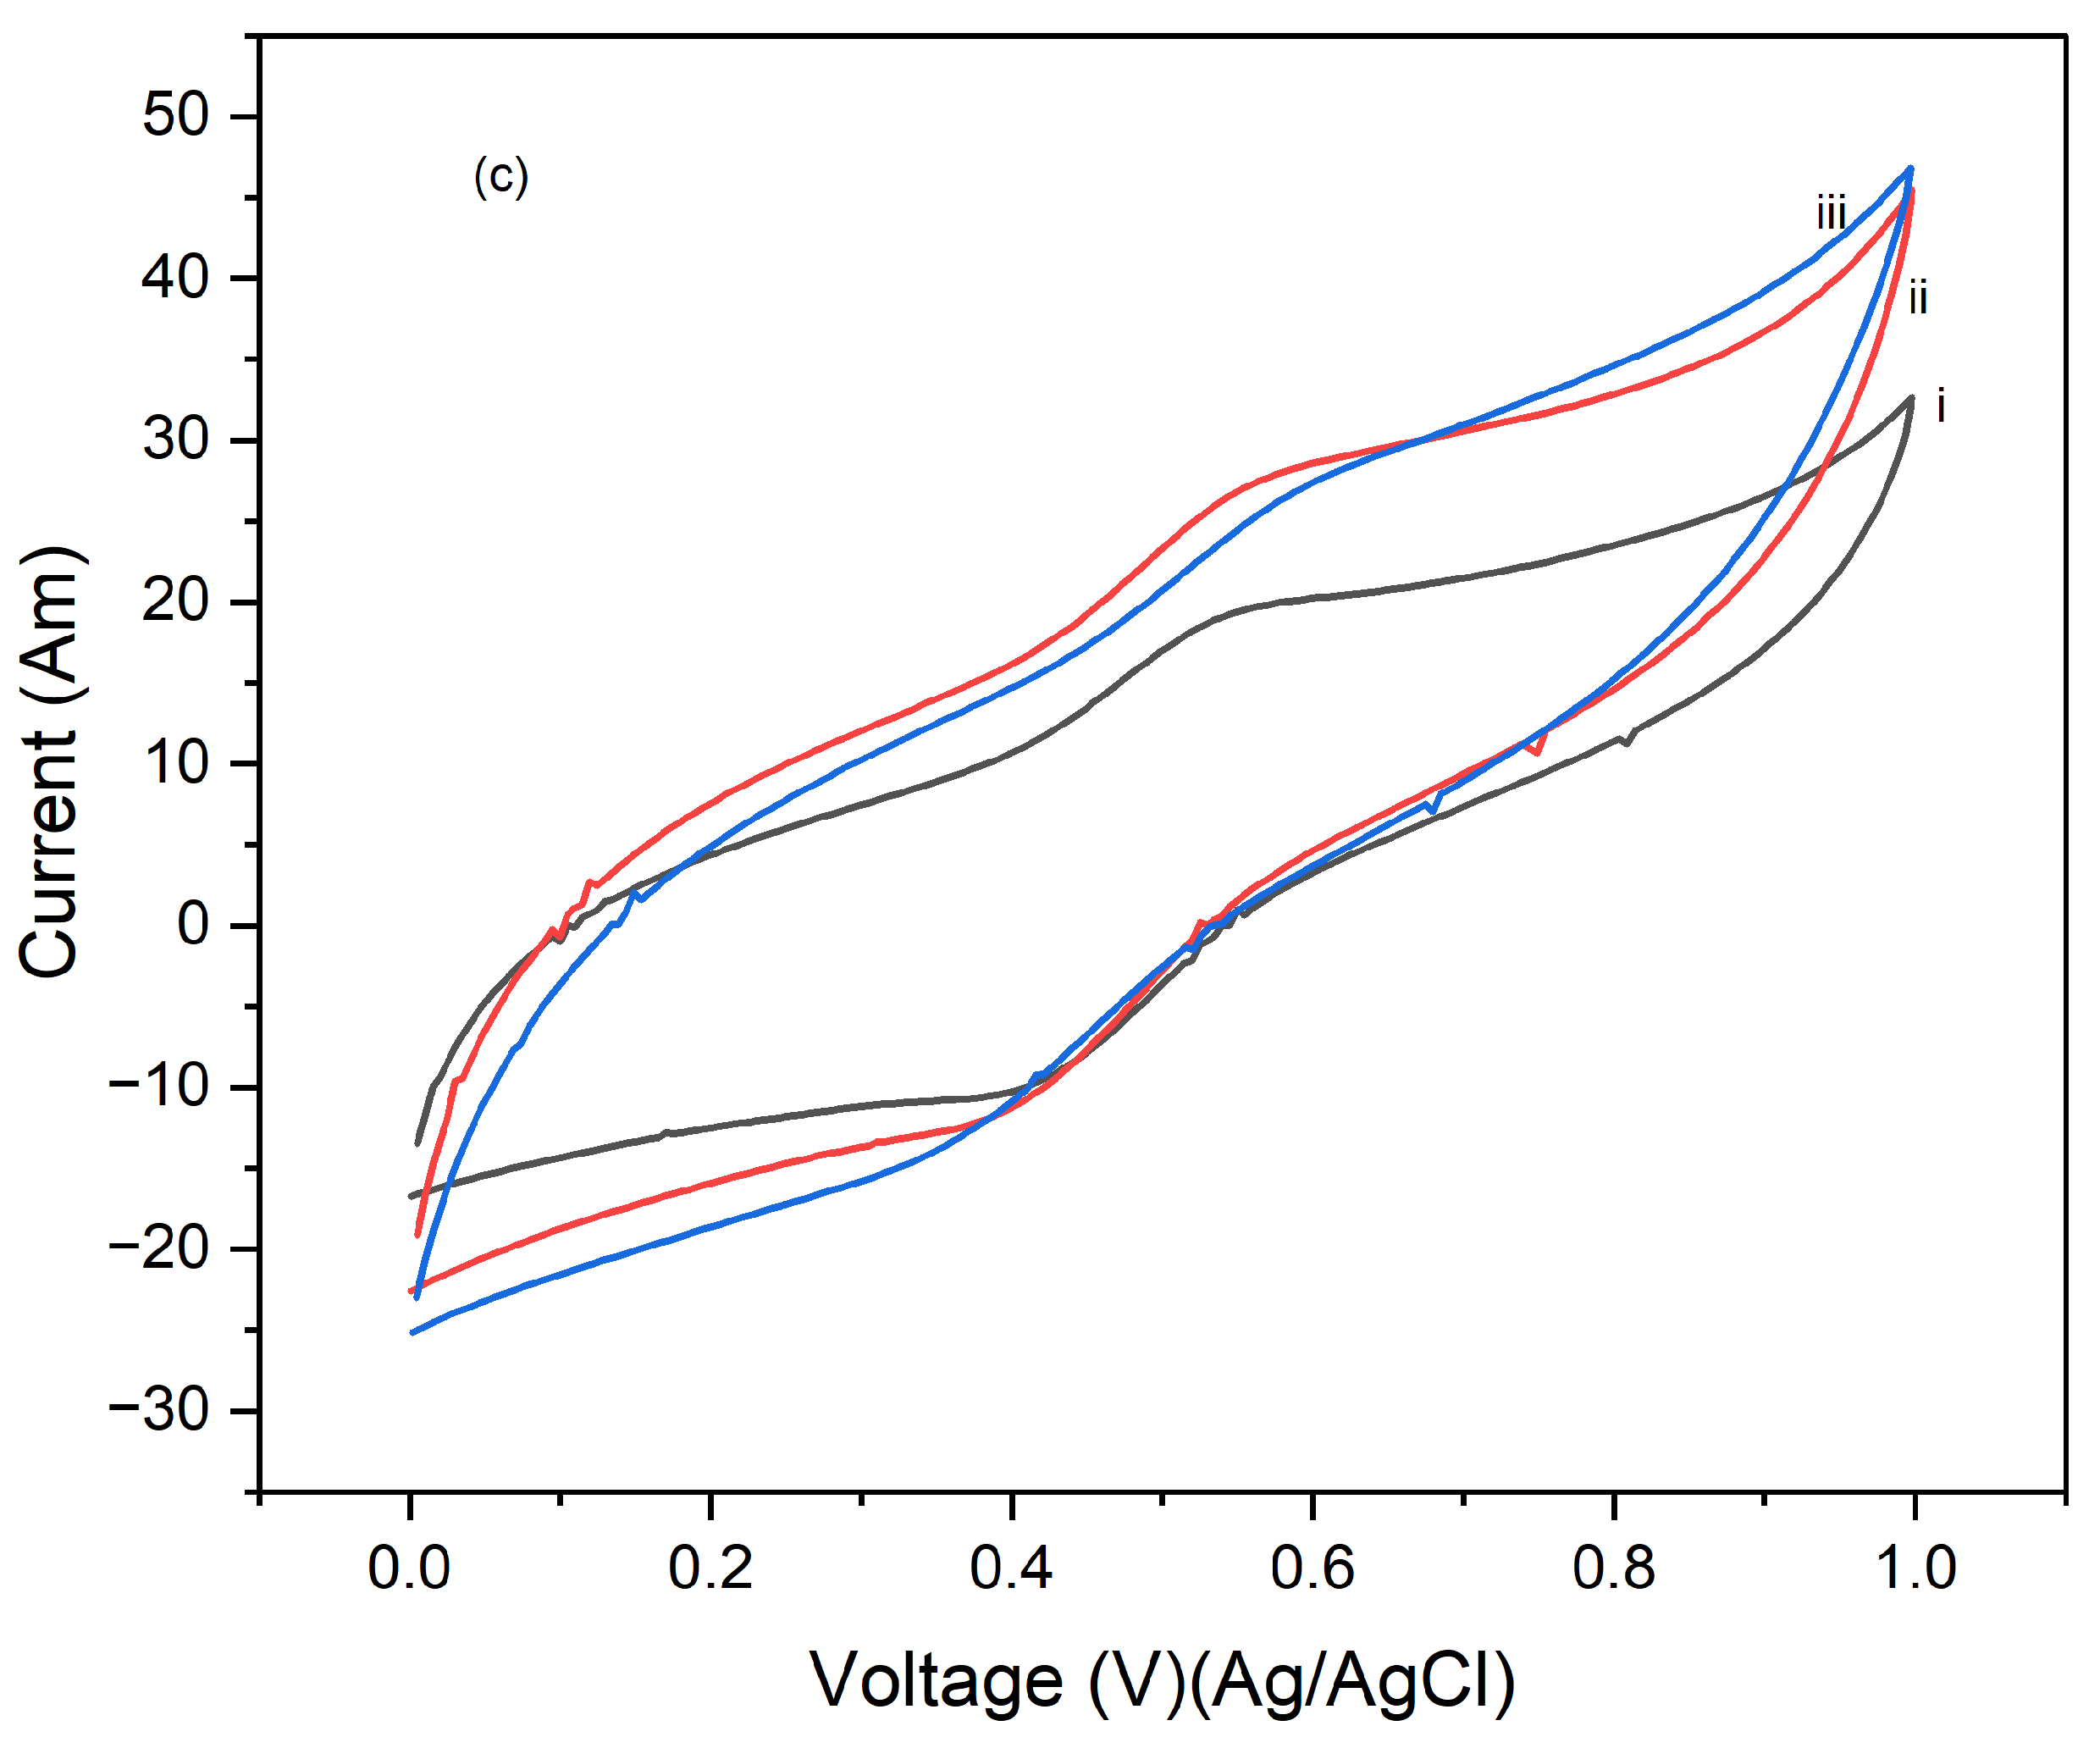
Figure 7.
Cyclic voltammograms of PI/CNTs hybrid nanocomposites processed at 90 °C, 180 °C, and 250 °C followed by electrodeposition of PPy using an Ag/AgCl reference electrode and a graphite rod counter electrode for 1 cycle at CV run of (a)(i) 90oC (ii) 180oC and (iii) 250oC at 5mV/s, (b) (i) 90oC (ii) 180oC and (iii) 250oC at 10mV/s, and (c) )(i) 90oC (ii) 180oC and (iii) 250oC at 25mV/s.

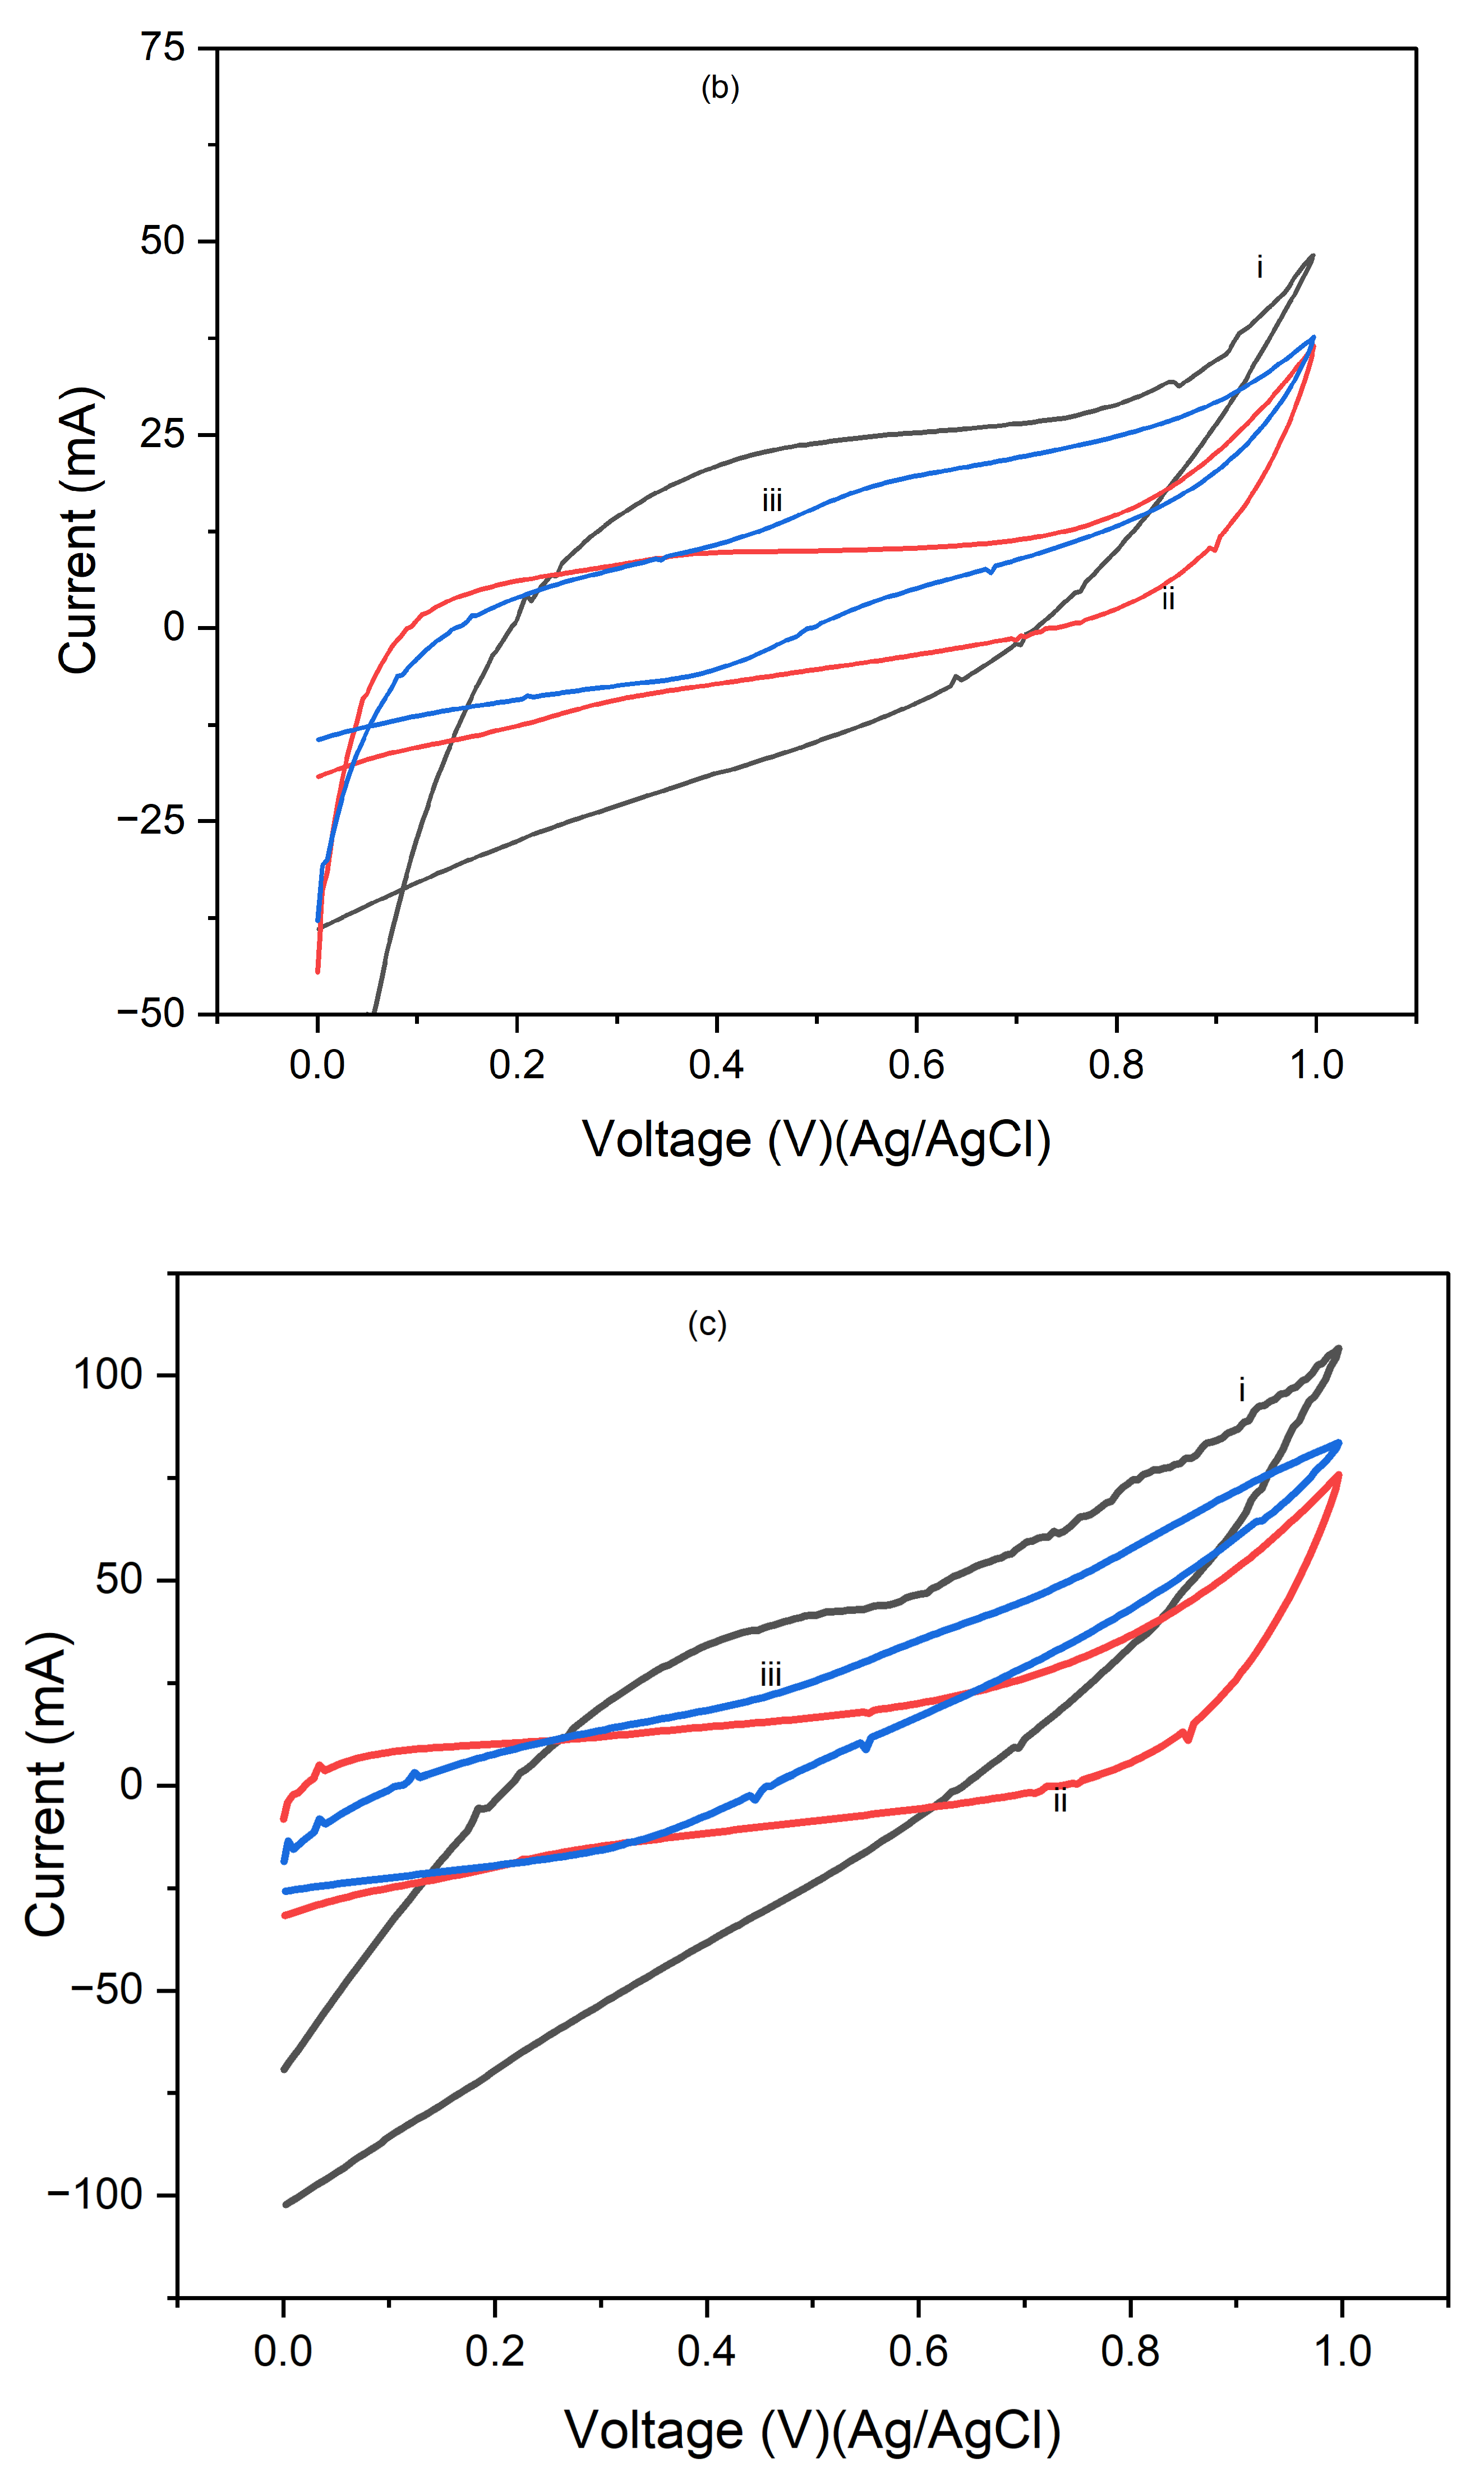
Figure 8.
Cyclic voltammograms of PI/CNTs hybrid nanocomposites processed at 90 °C, 180 °C, and 250 °C followed by electrodeposition of PPy using an Ag/AgCl reference electrode and a graphite rod counter electrode for 5 cycles at CV run of (a)(i) 90oC (ii) 180oC and (iii) 250oC at 5mV/s, (b) (i) 90oC (ii) 180oC and (iii) 250oC at 10mV/s, and (c) )(i) 90oC (ii) 180oC and (iii) 250oC at 25mV/s.
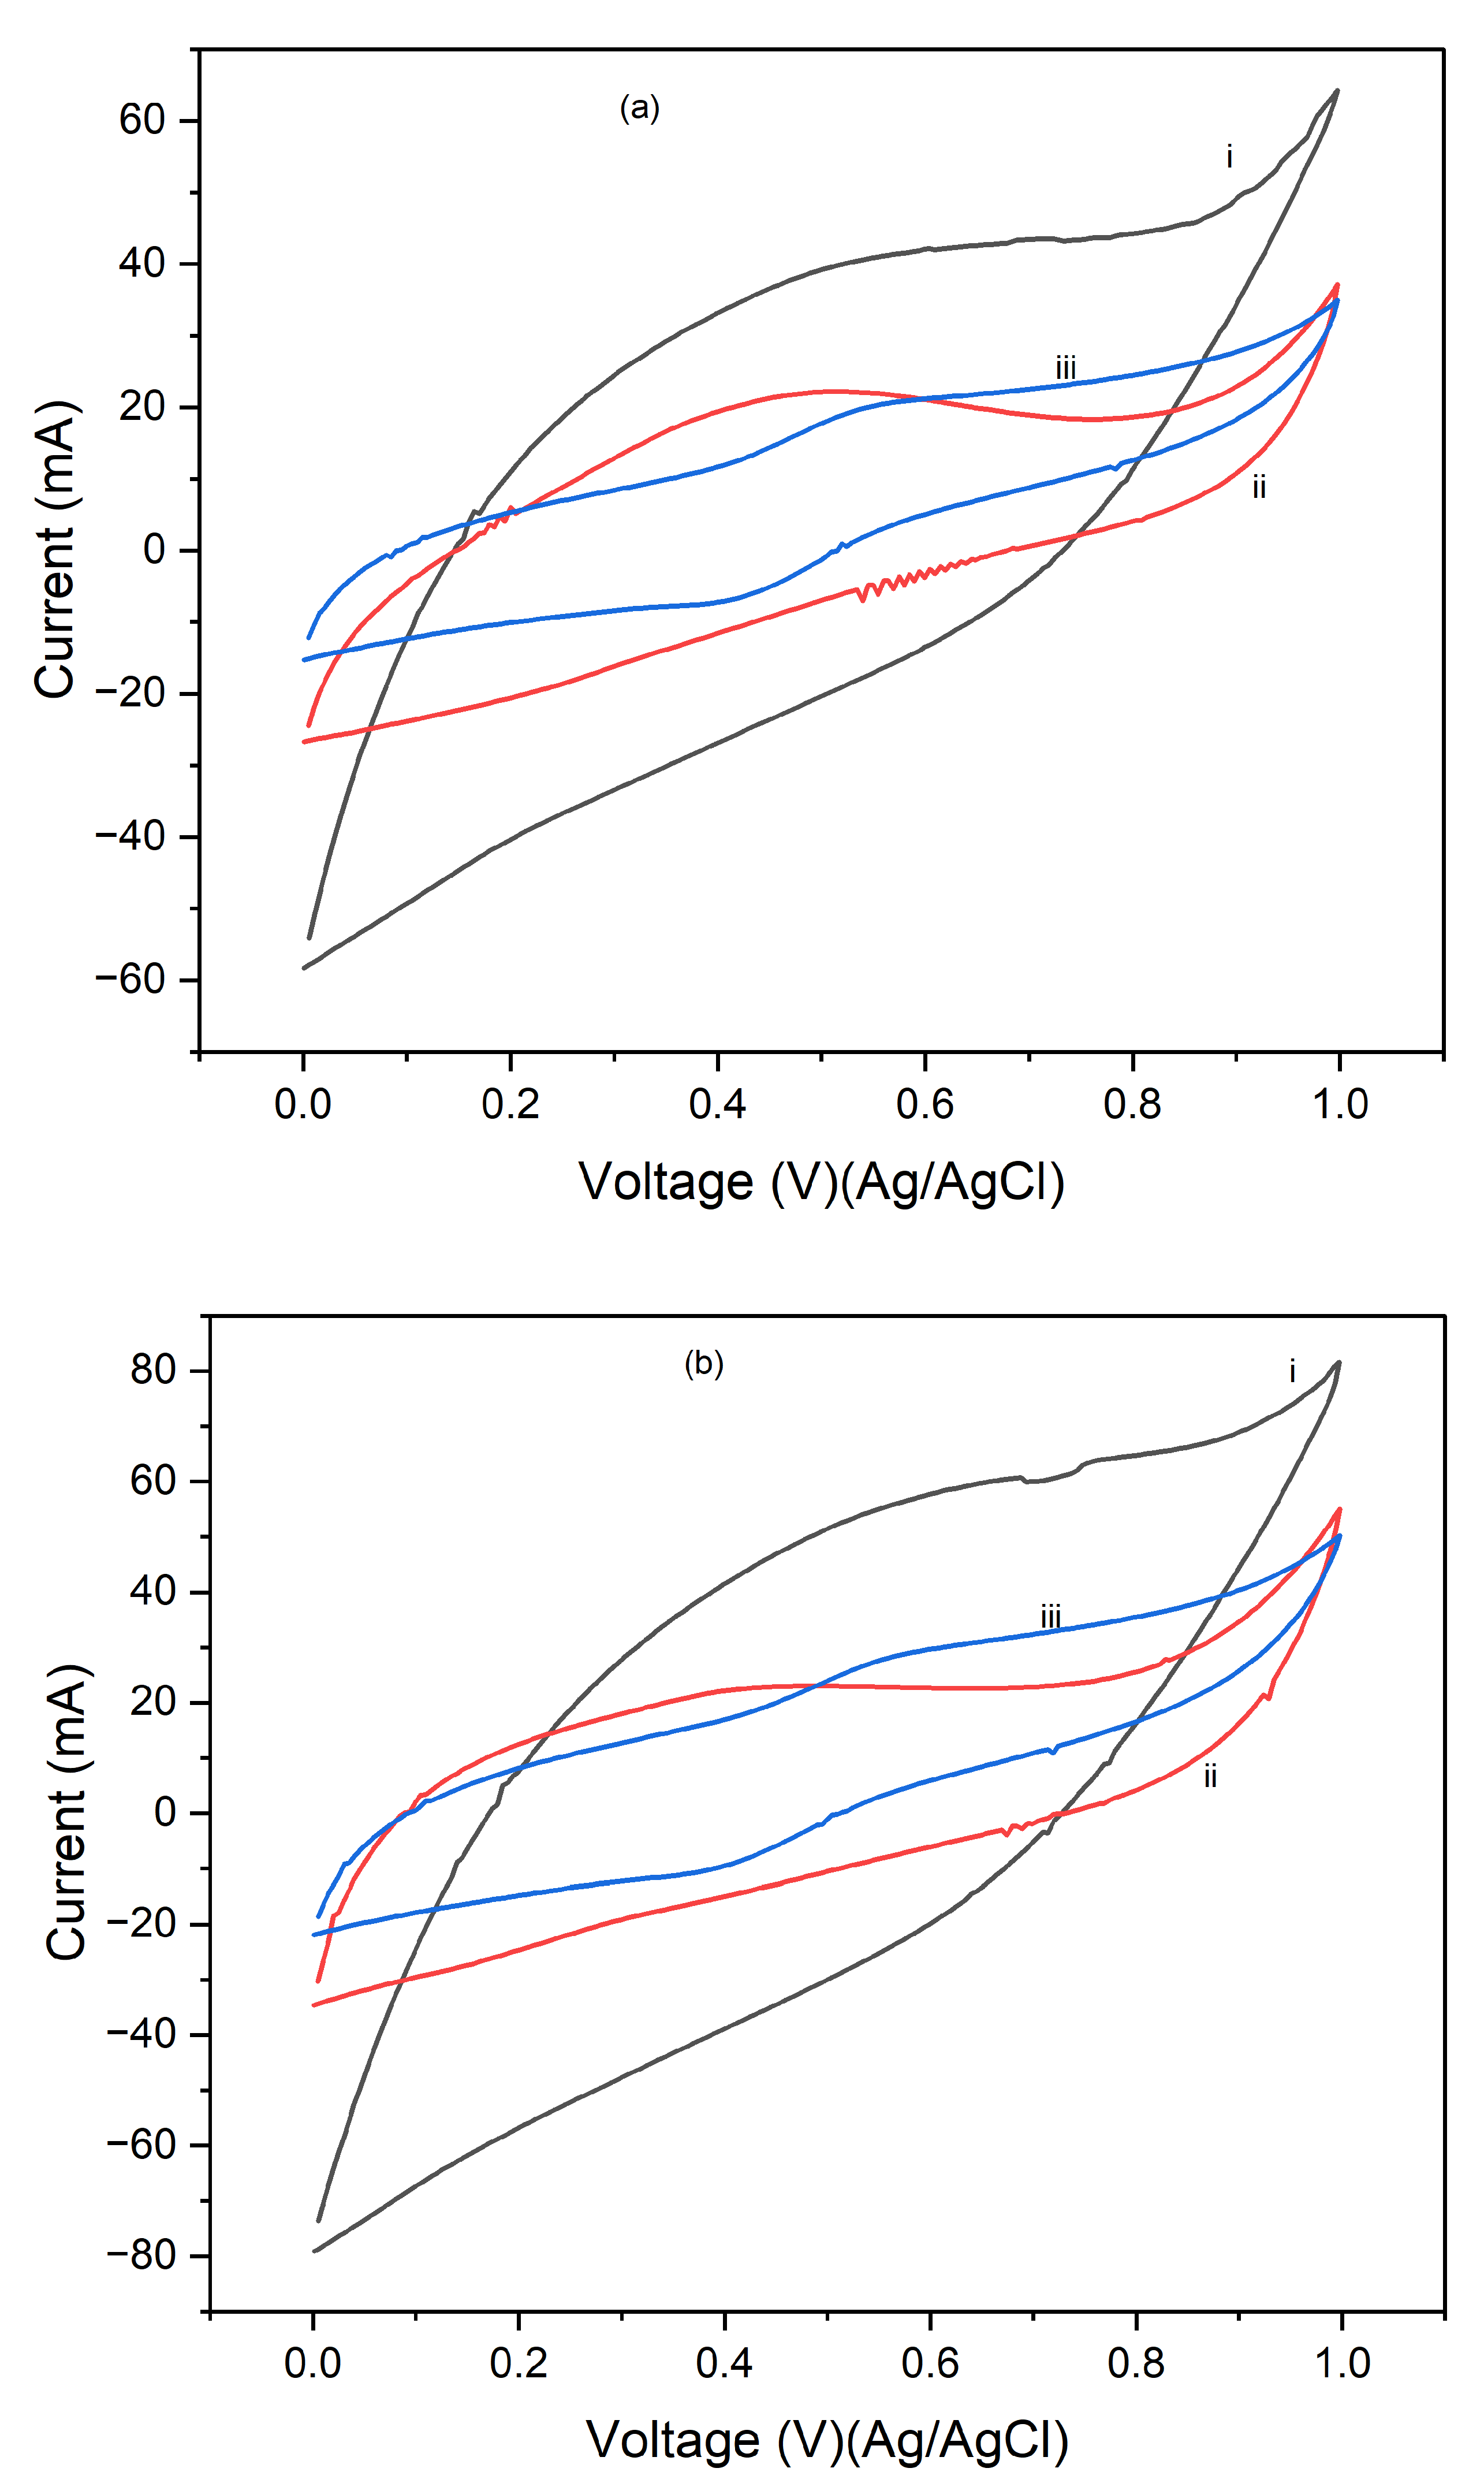
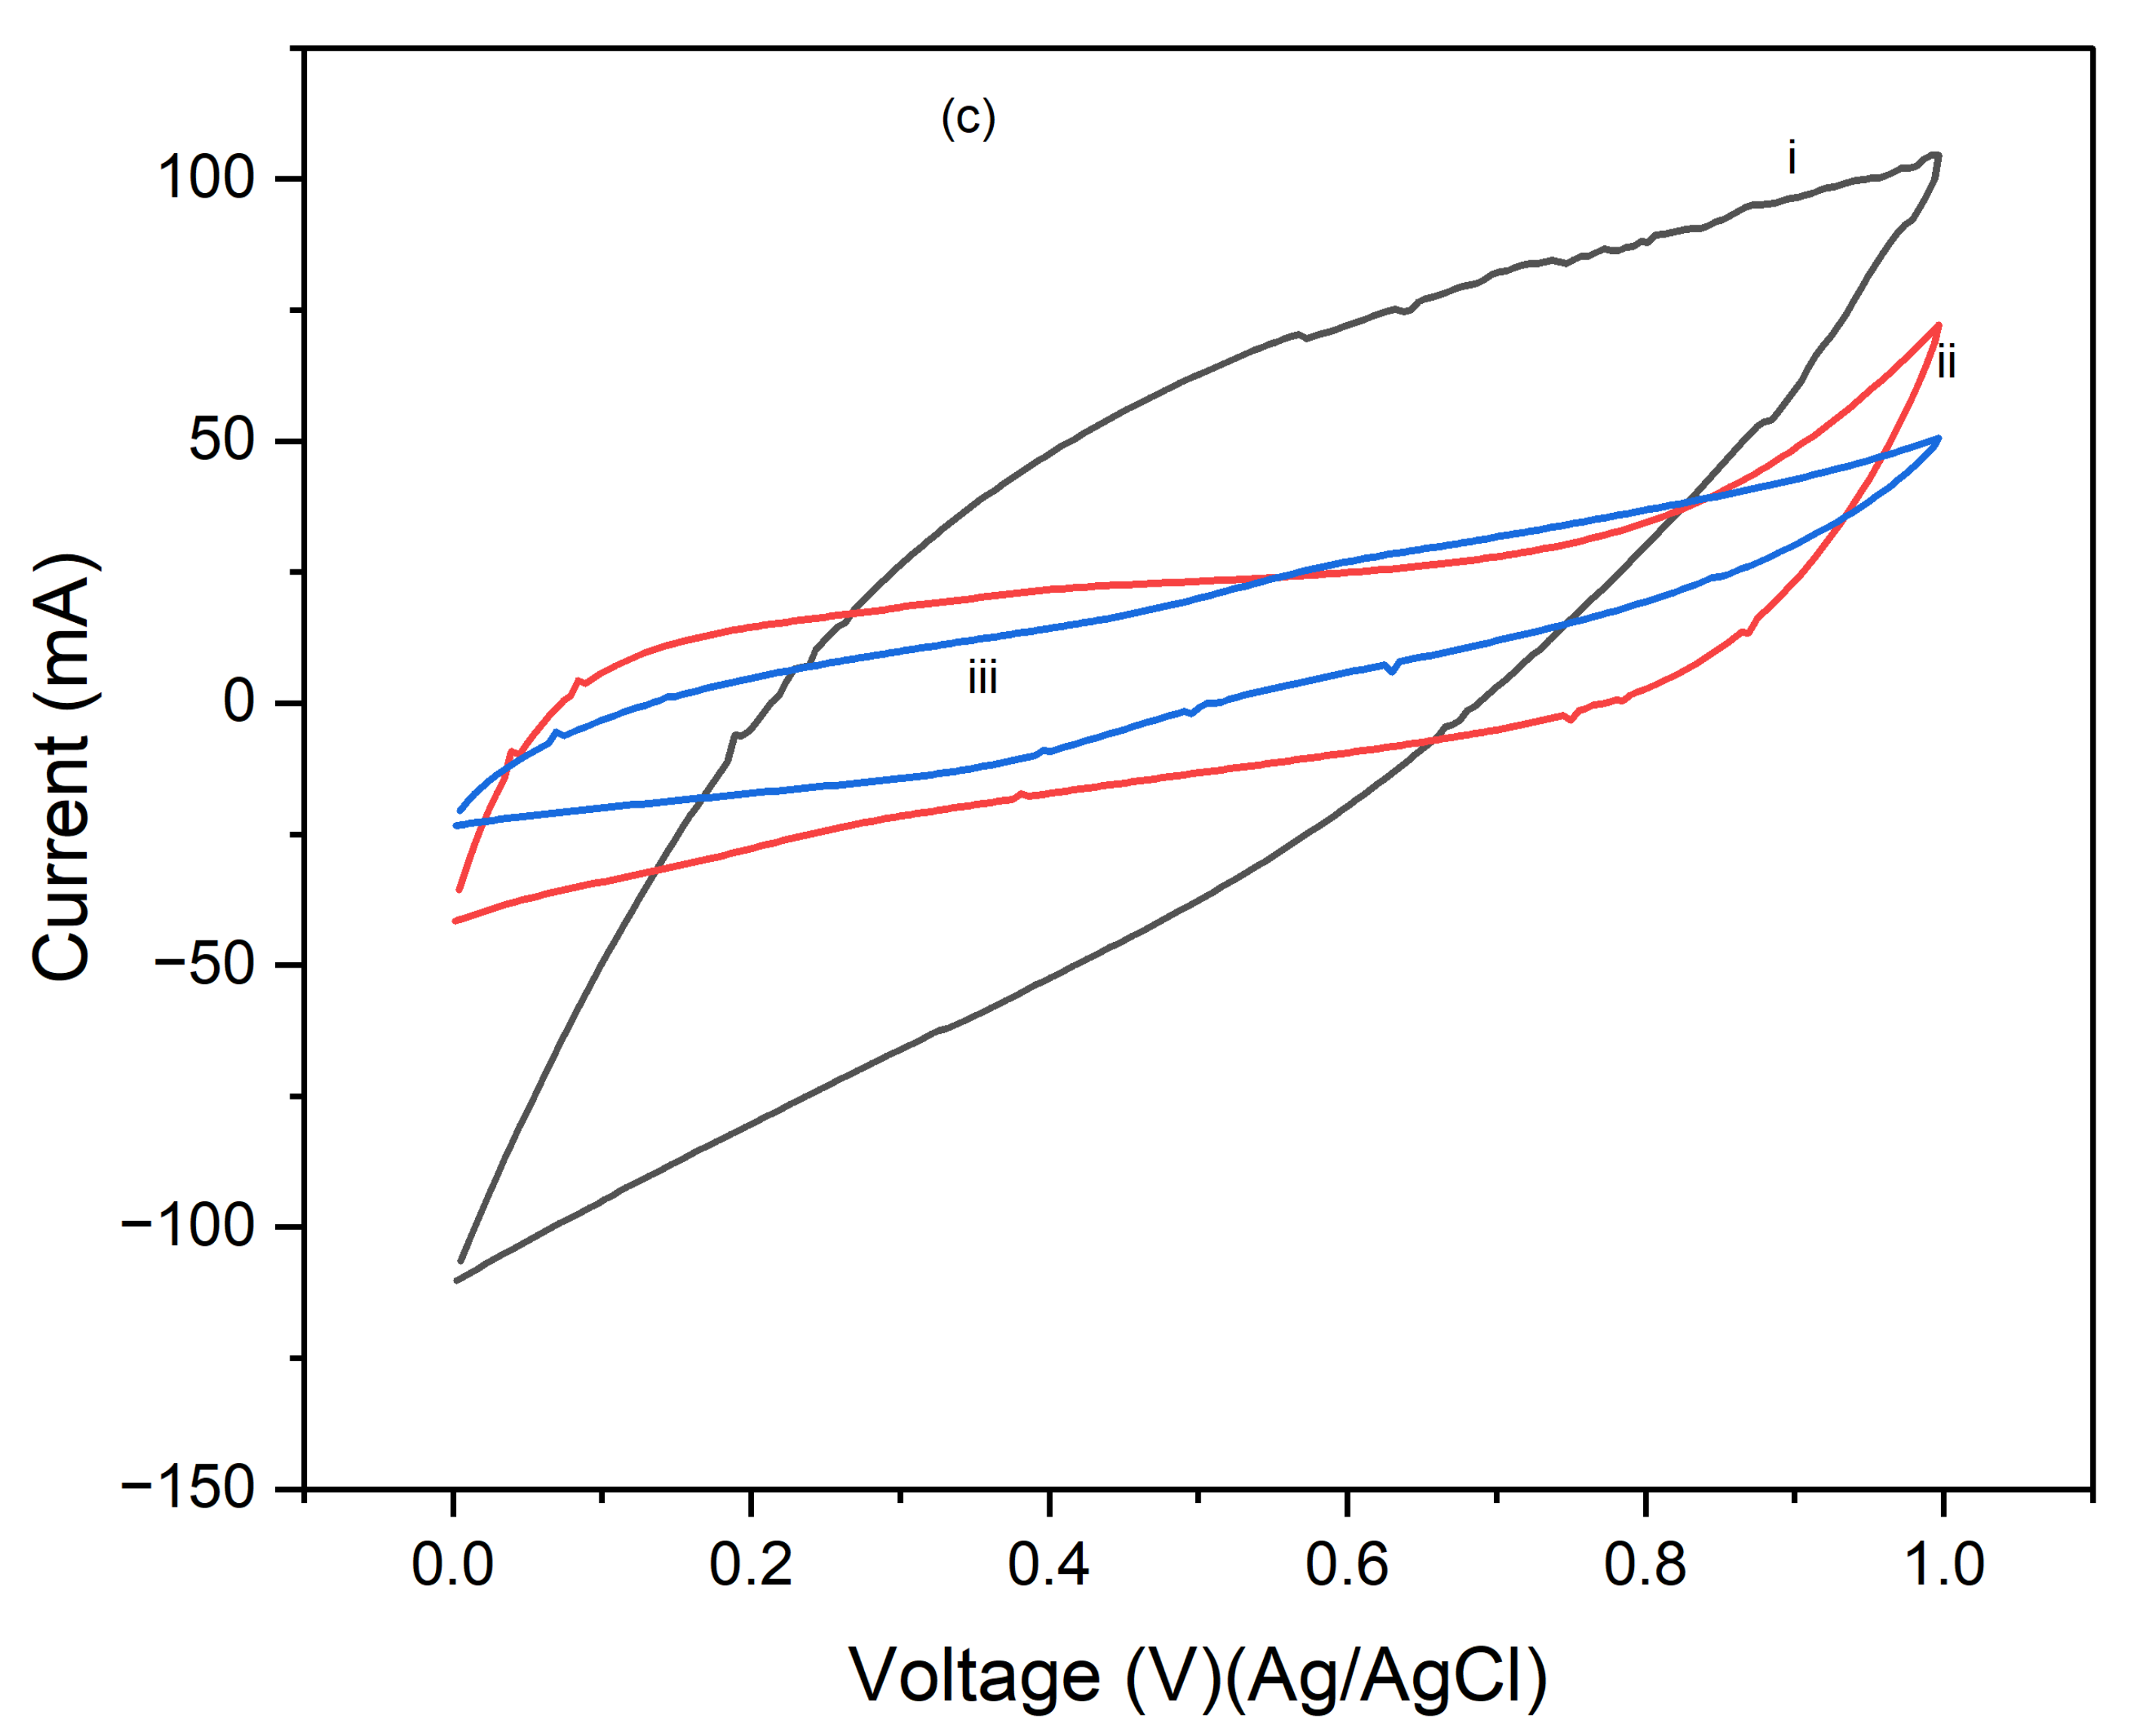
Figure 9.
Cyclic voltammograms of PI/CNTs hybrid nanocomposites processed at 90 °C, 180 °C, and 250 °C followed by electrodeposition of PPy using an Ag/AgCl reference electrode and a graphite rod counter electrode for 10 cycles at CV run of (a)(i) 90oC (ii) 180oC and (iii) 250oC at 5mV/s, (b) (i) 90oC (ii) 180oC and (iii) 250oC at 10mV/s, and (c) )(i) 90oC (ii) 180oC and (iii) 250oC at 25mV/s.
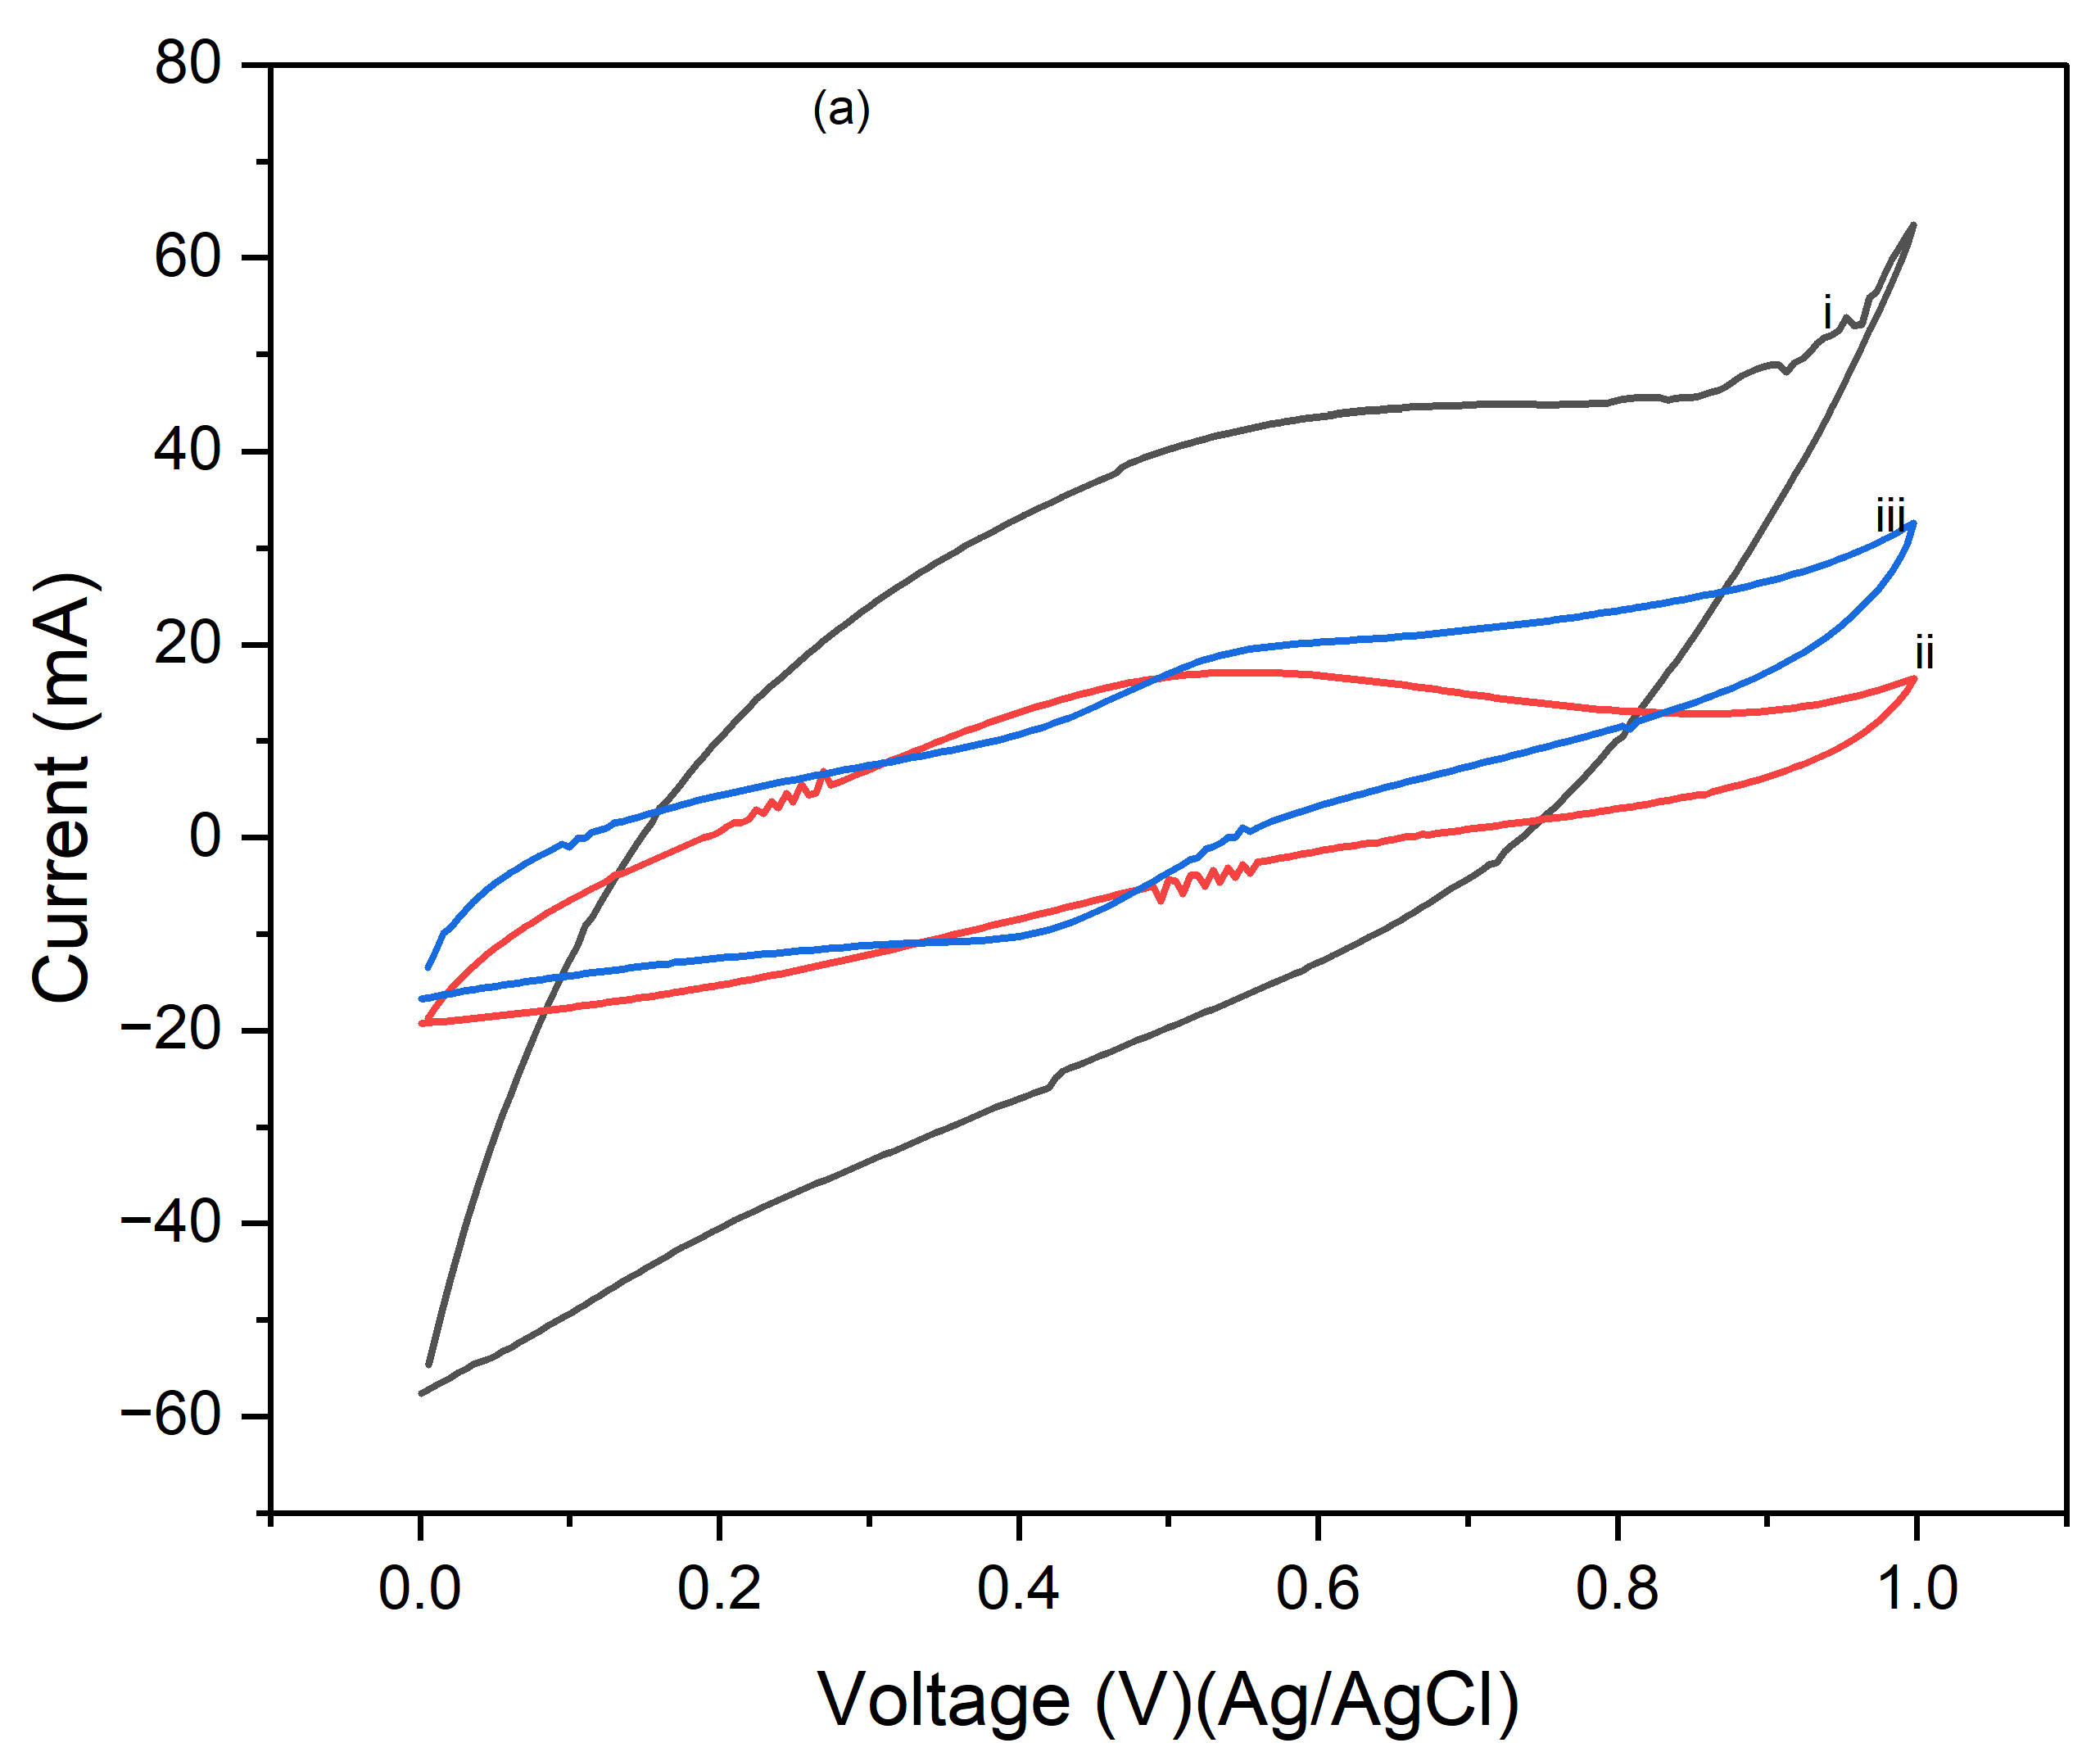
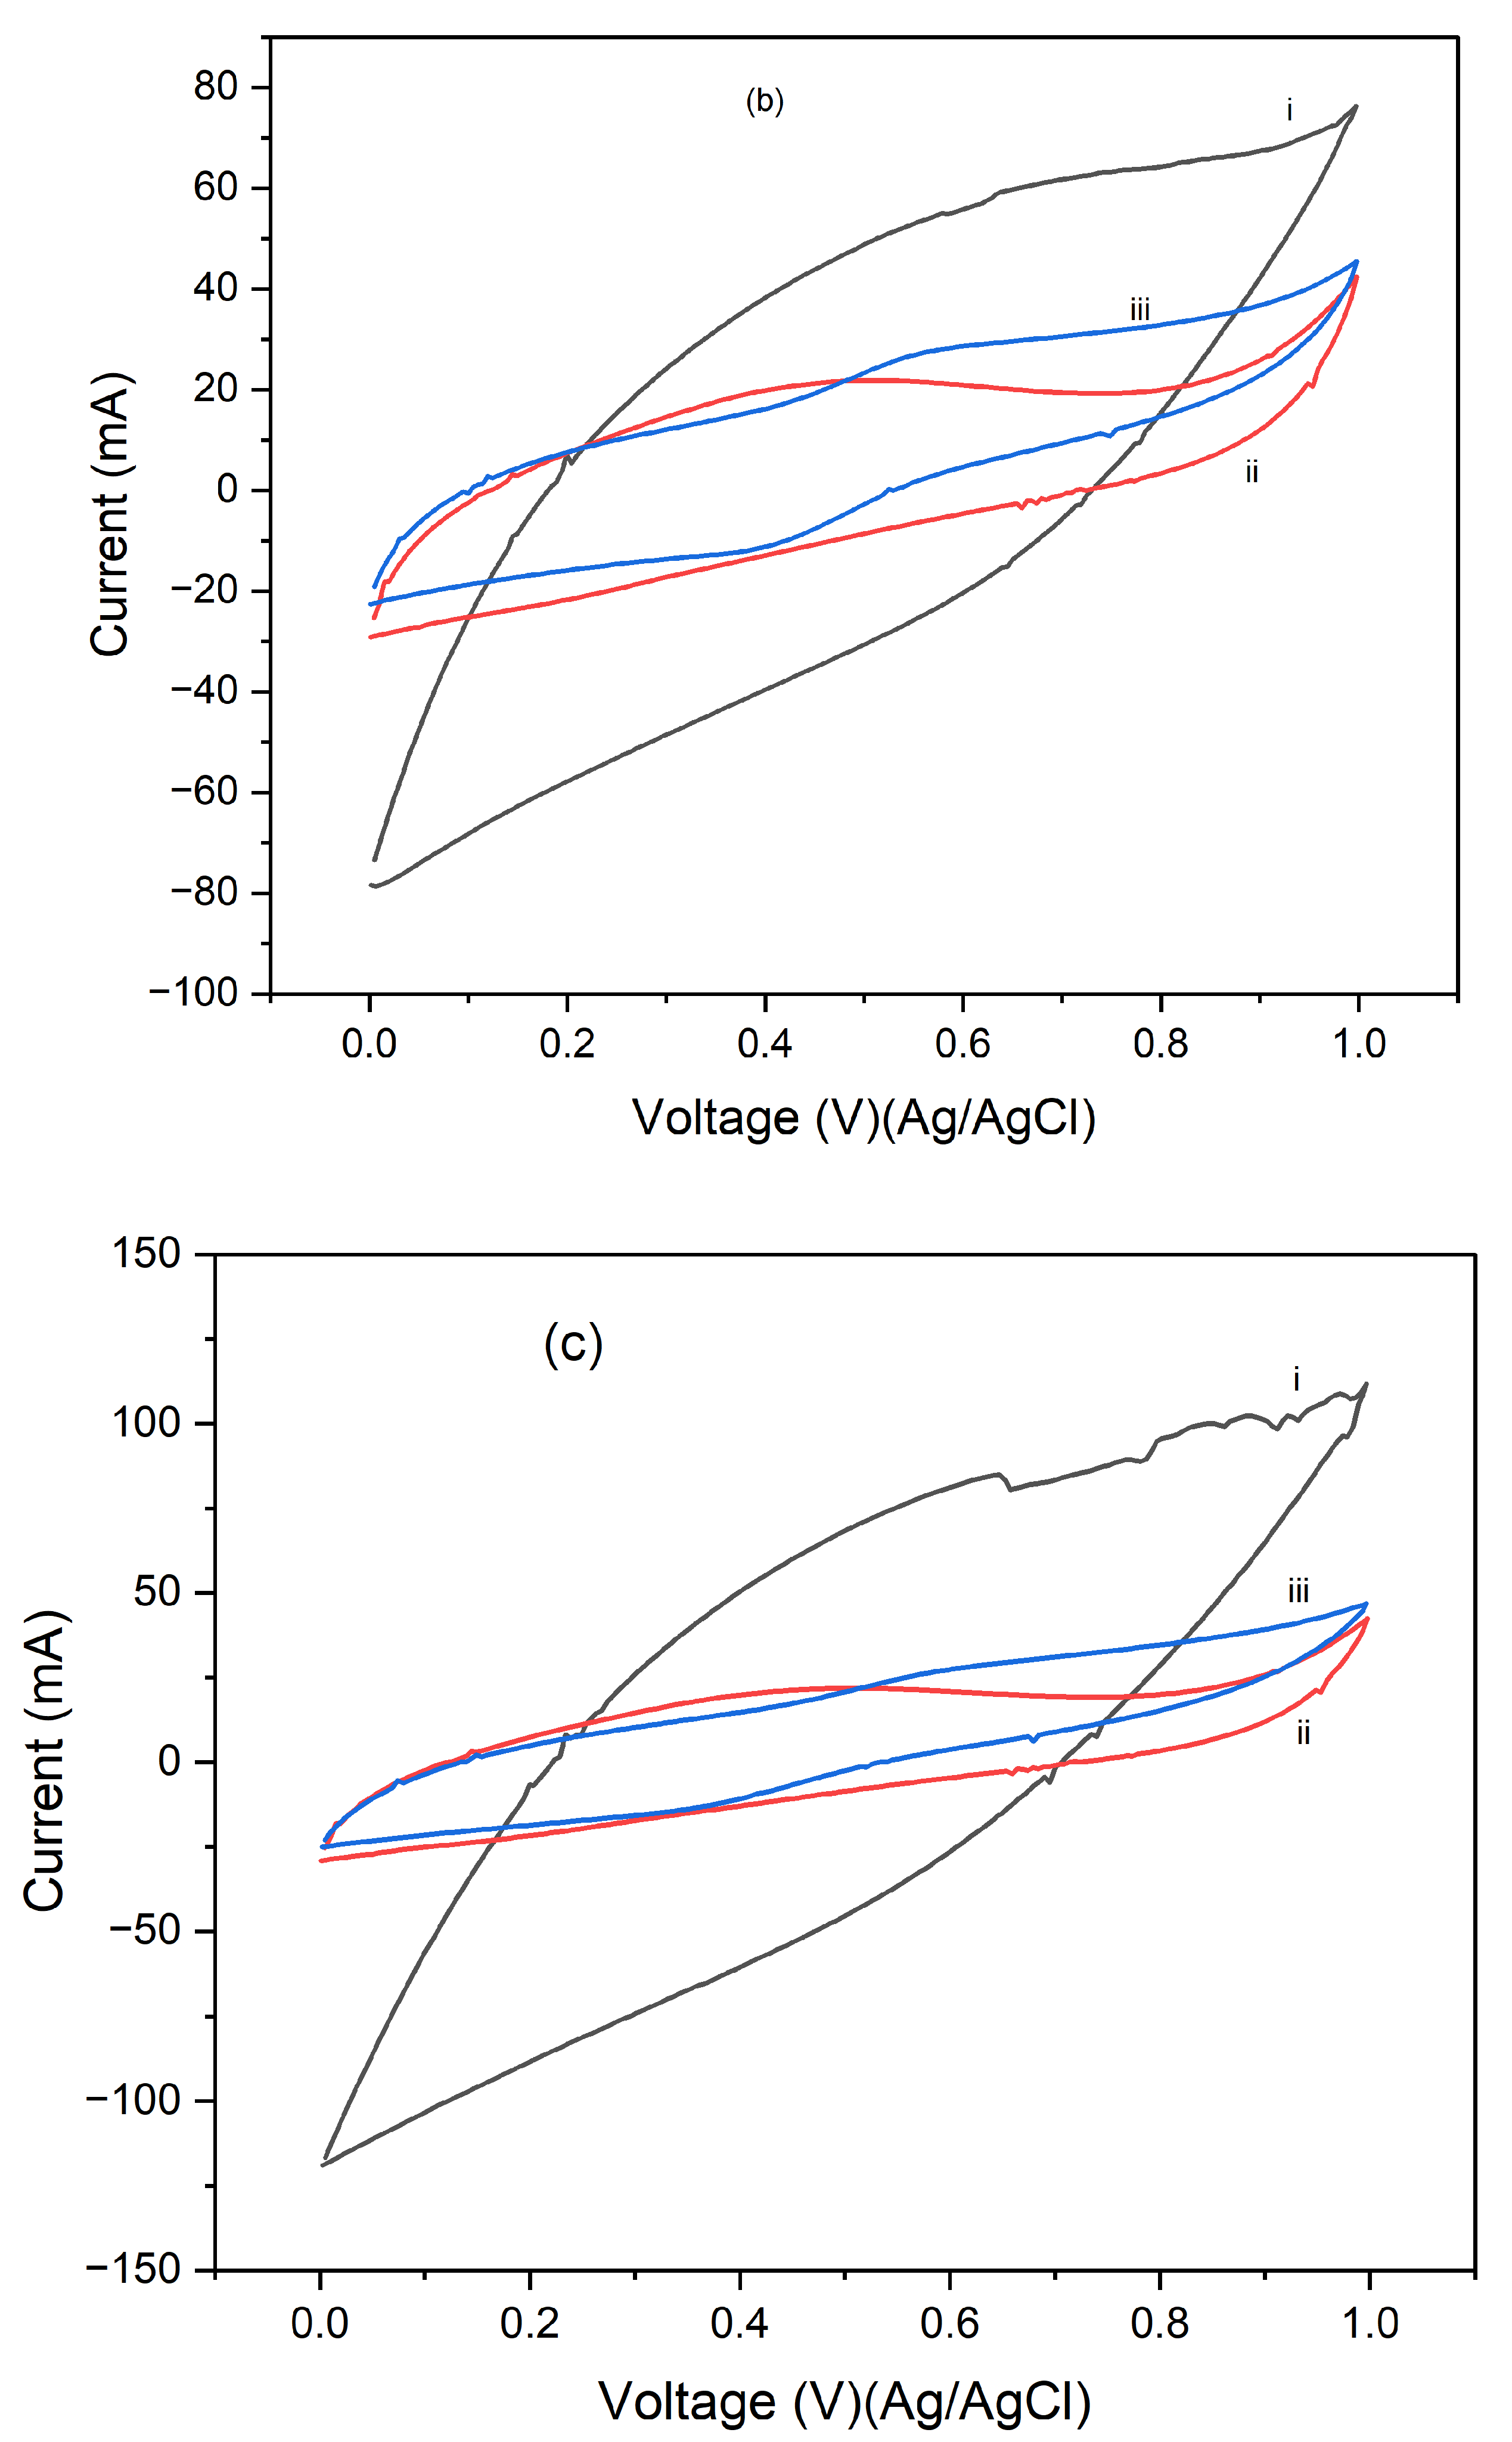
Figure 10.
Variation of specific capacitance calculated from CV of (a) (i) 5mV/s at 1 cycle, (ii) 10mV/s at 1 cycle, (iii) 25mV/s at 1 cycle, (b) (i) 5mV/s at 5 cycles, (ii) 10mV/s at 5 cycles,(iii) 25mV/s at 5 cycles, (c) (i) 5mV/s at 10 cycles, (ii) 10mV/s at 10 cycles, (iii) 25mV/s at 10 cycles, (d) (i) 90oC at 1 cycle, (ii) 180oC at 1 cycle, (iii) 250oC at 1 cycle (e) (i) 90oC at 5 cycles, (ii) 180oC at 5 cycles, (iii) 250oC at 5 cycles and (f) (i) 90oC at 10 cycles, (ii) 180oC at 10 cycles, (iii) 250oC at 10 cycles.
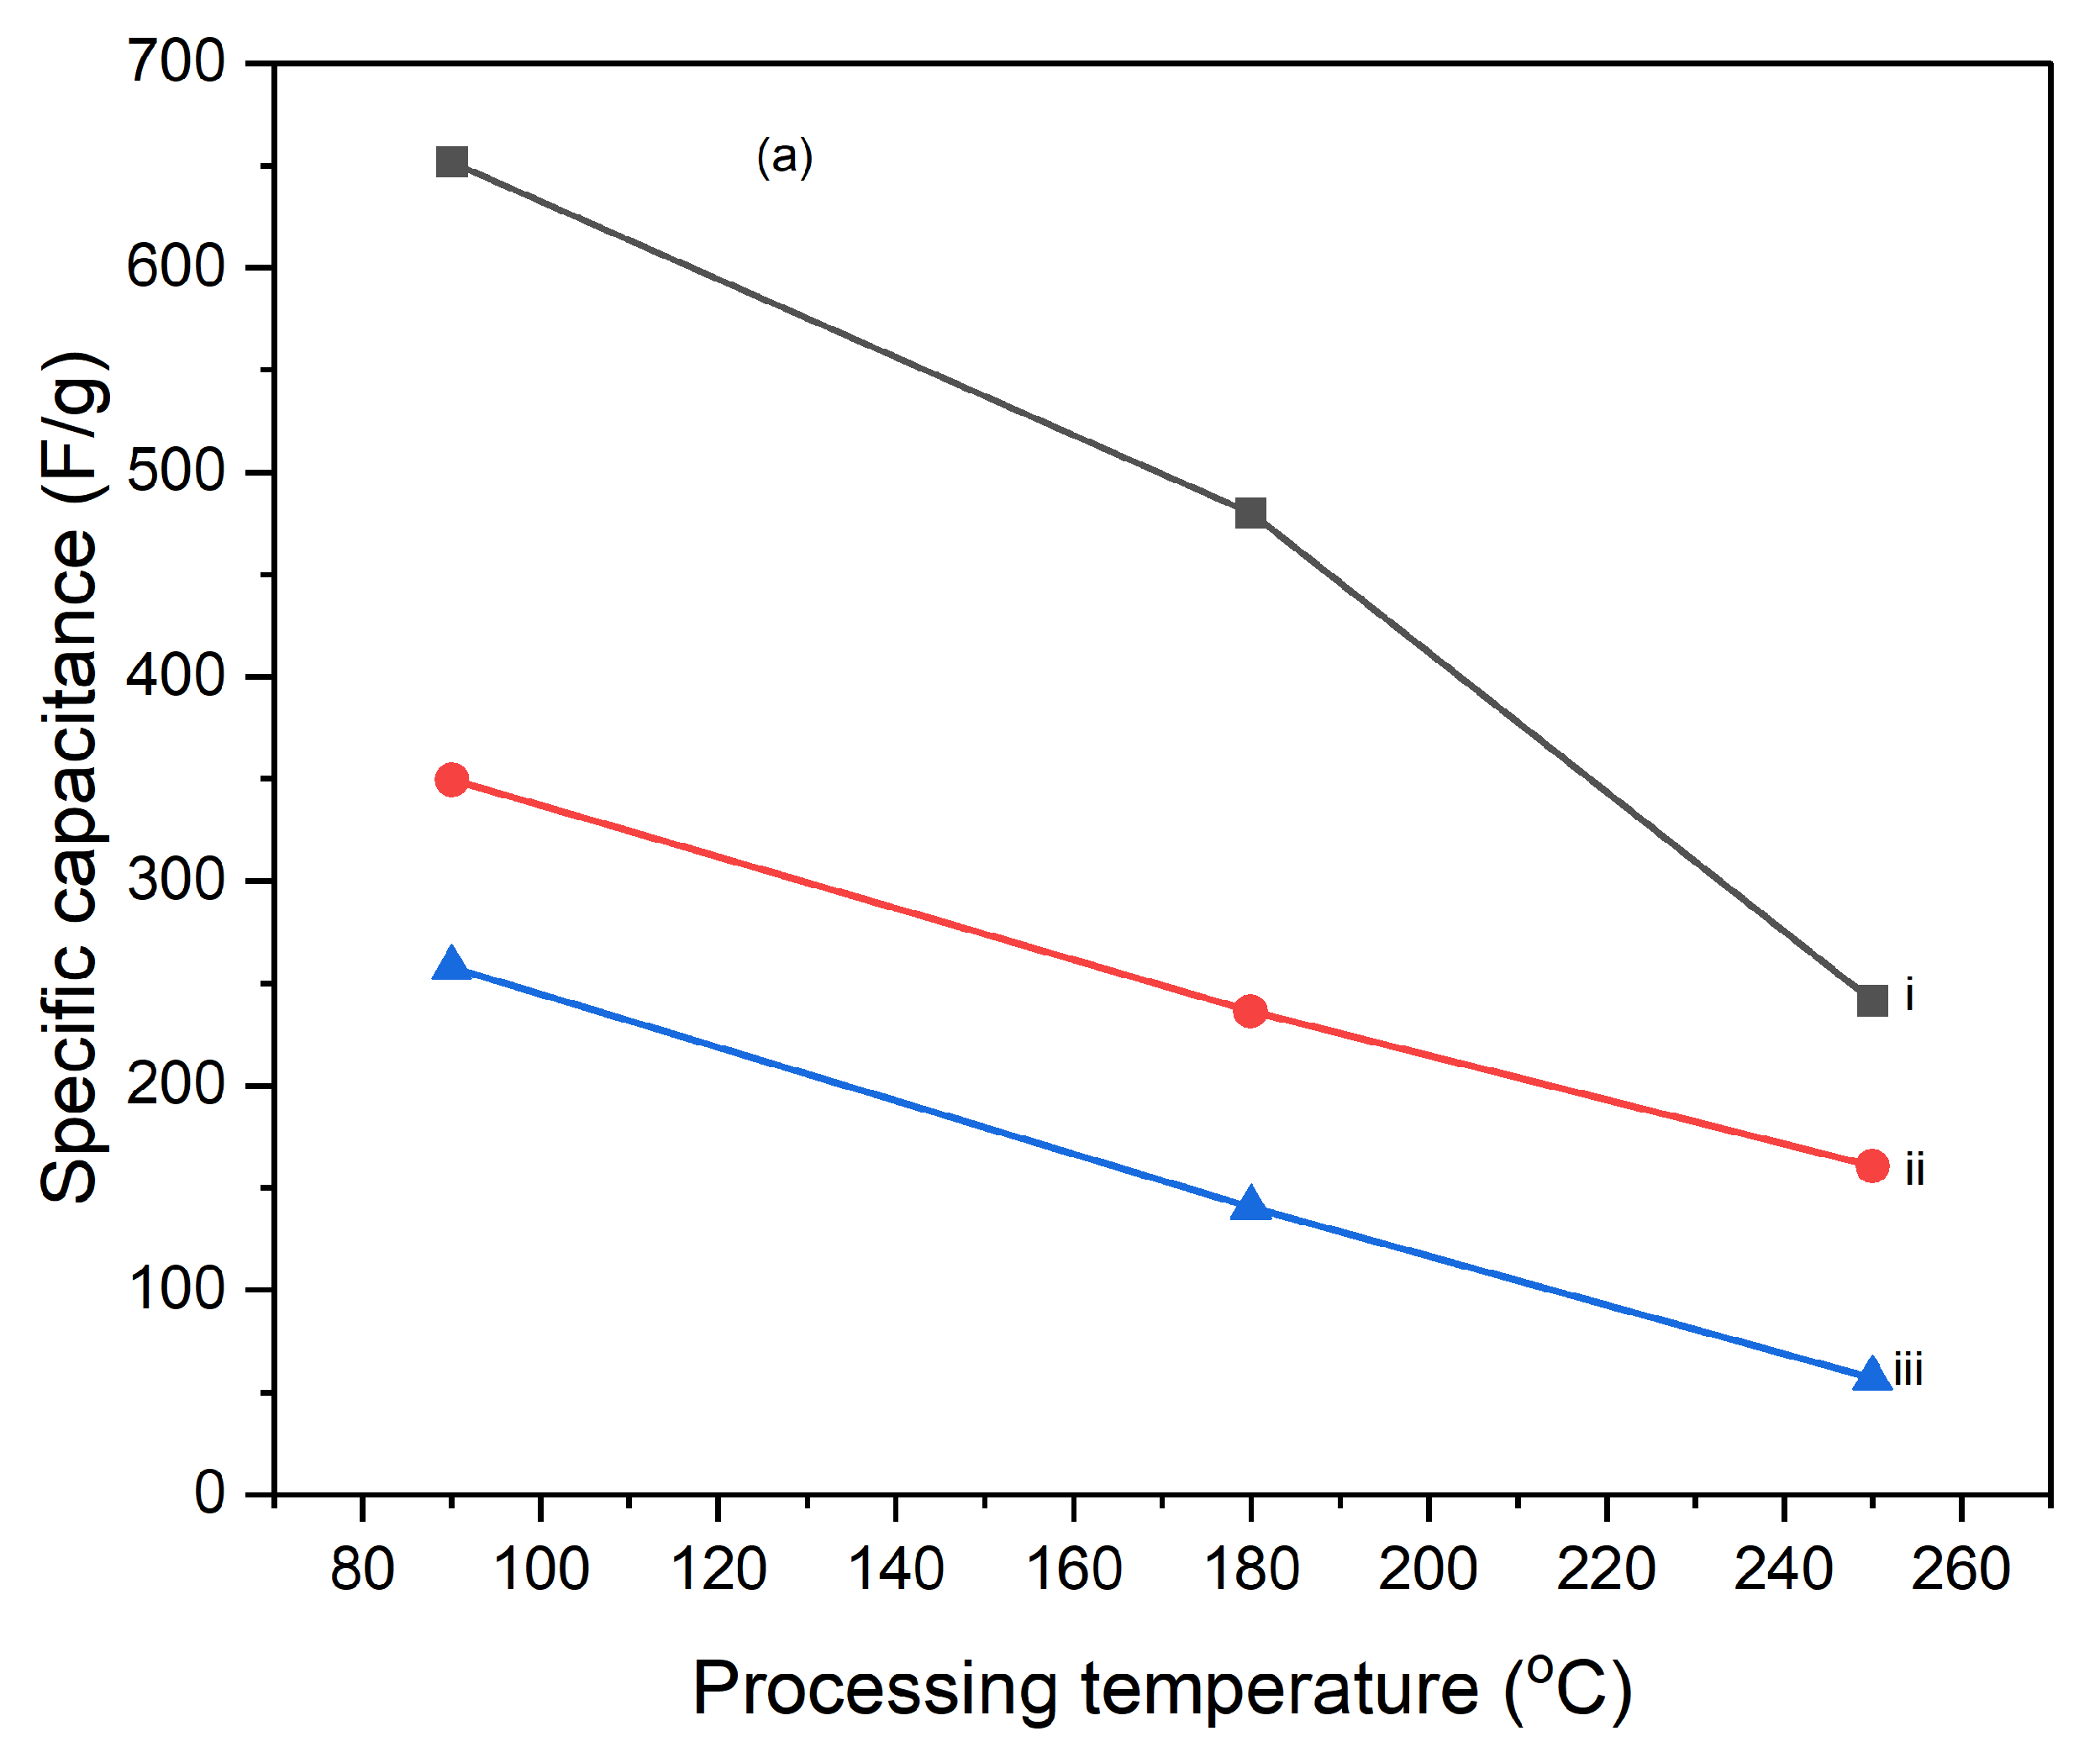
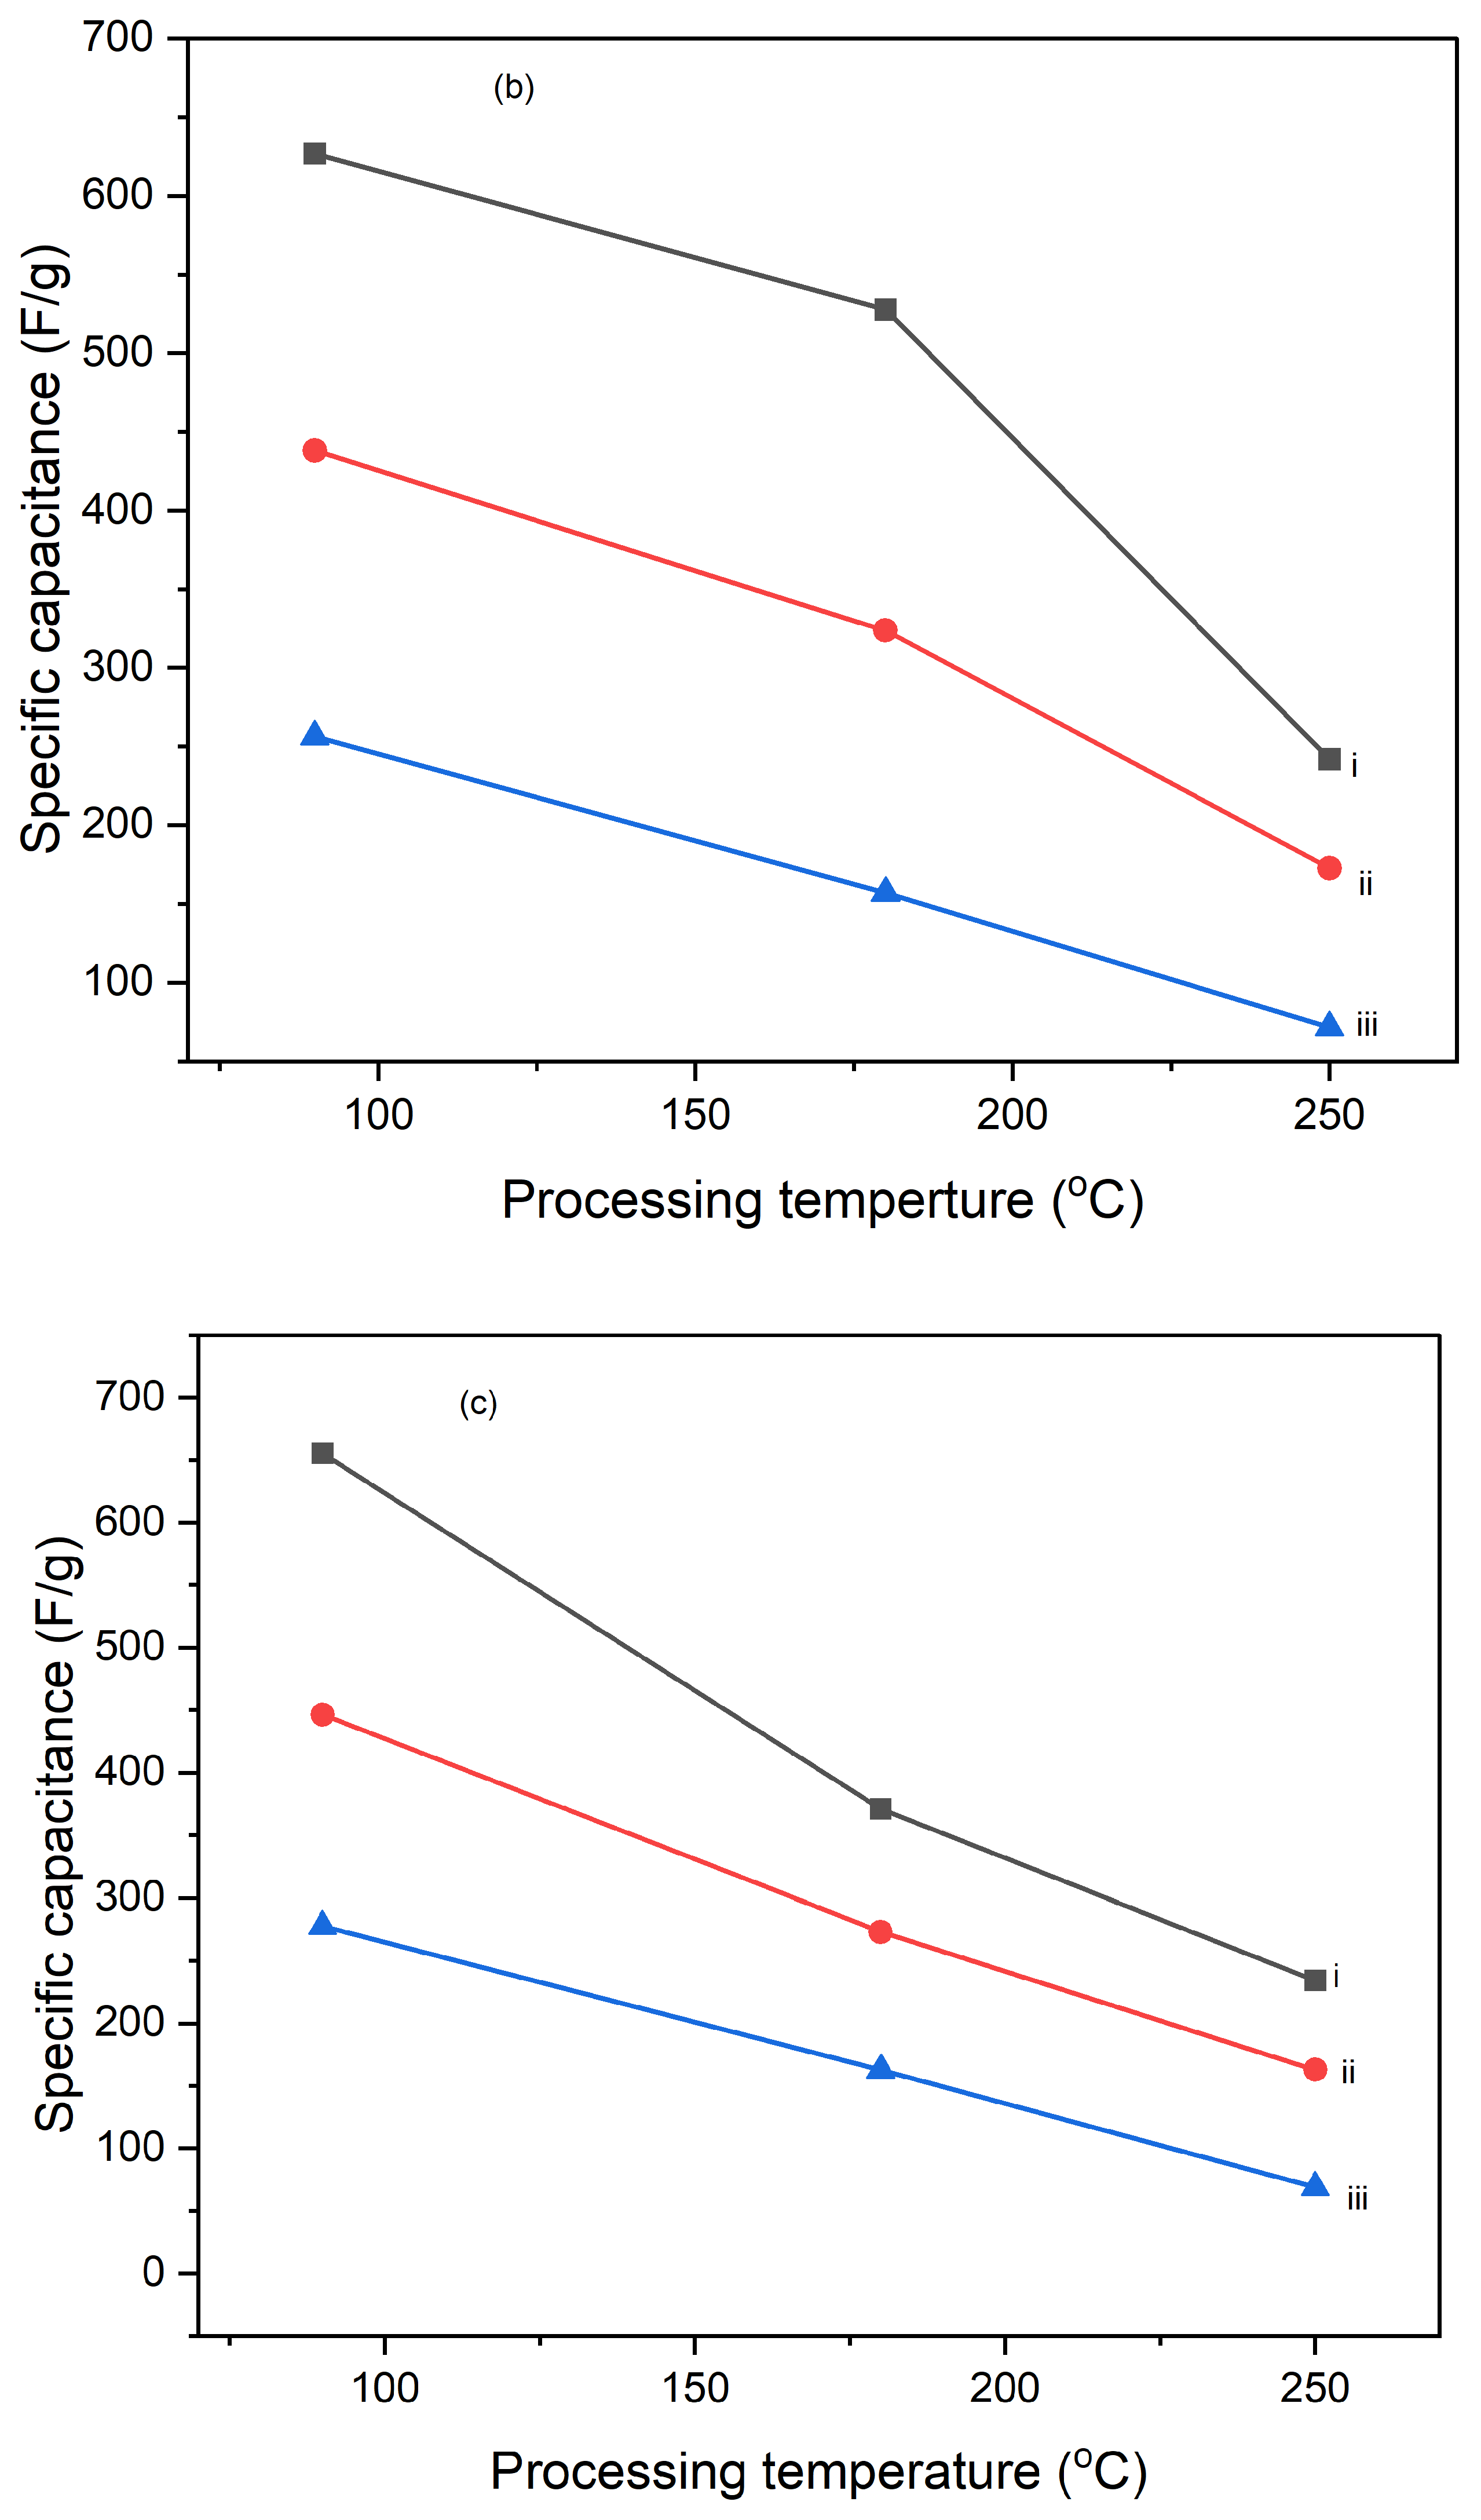
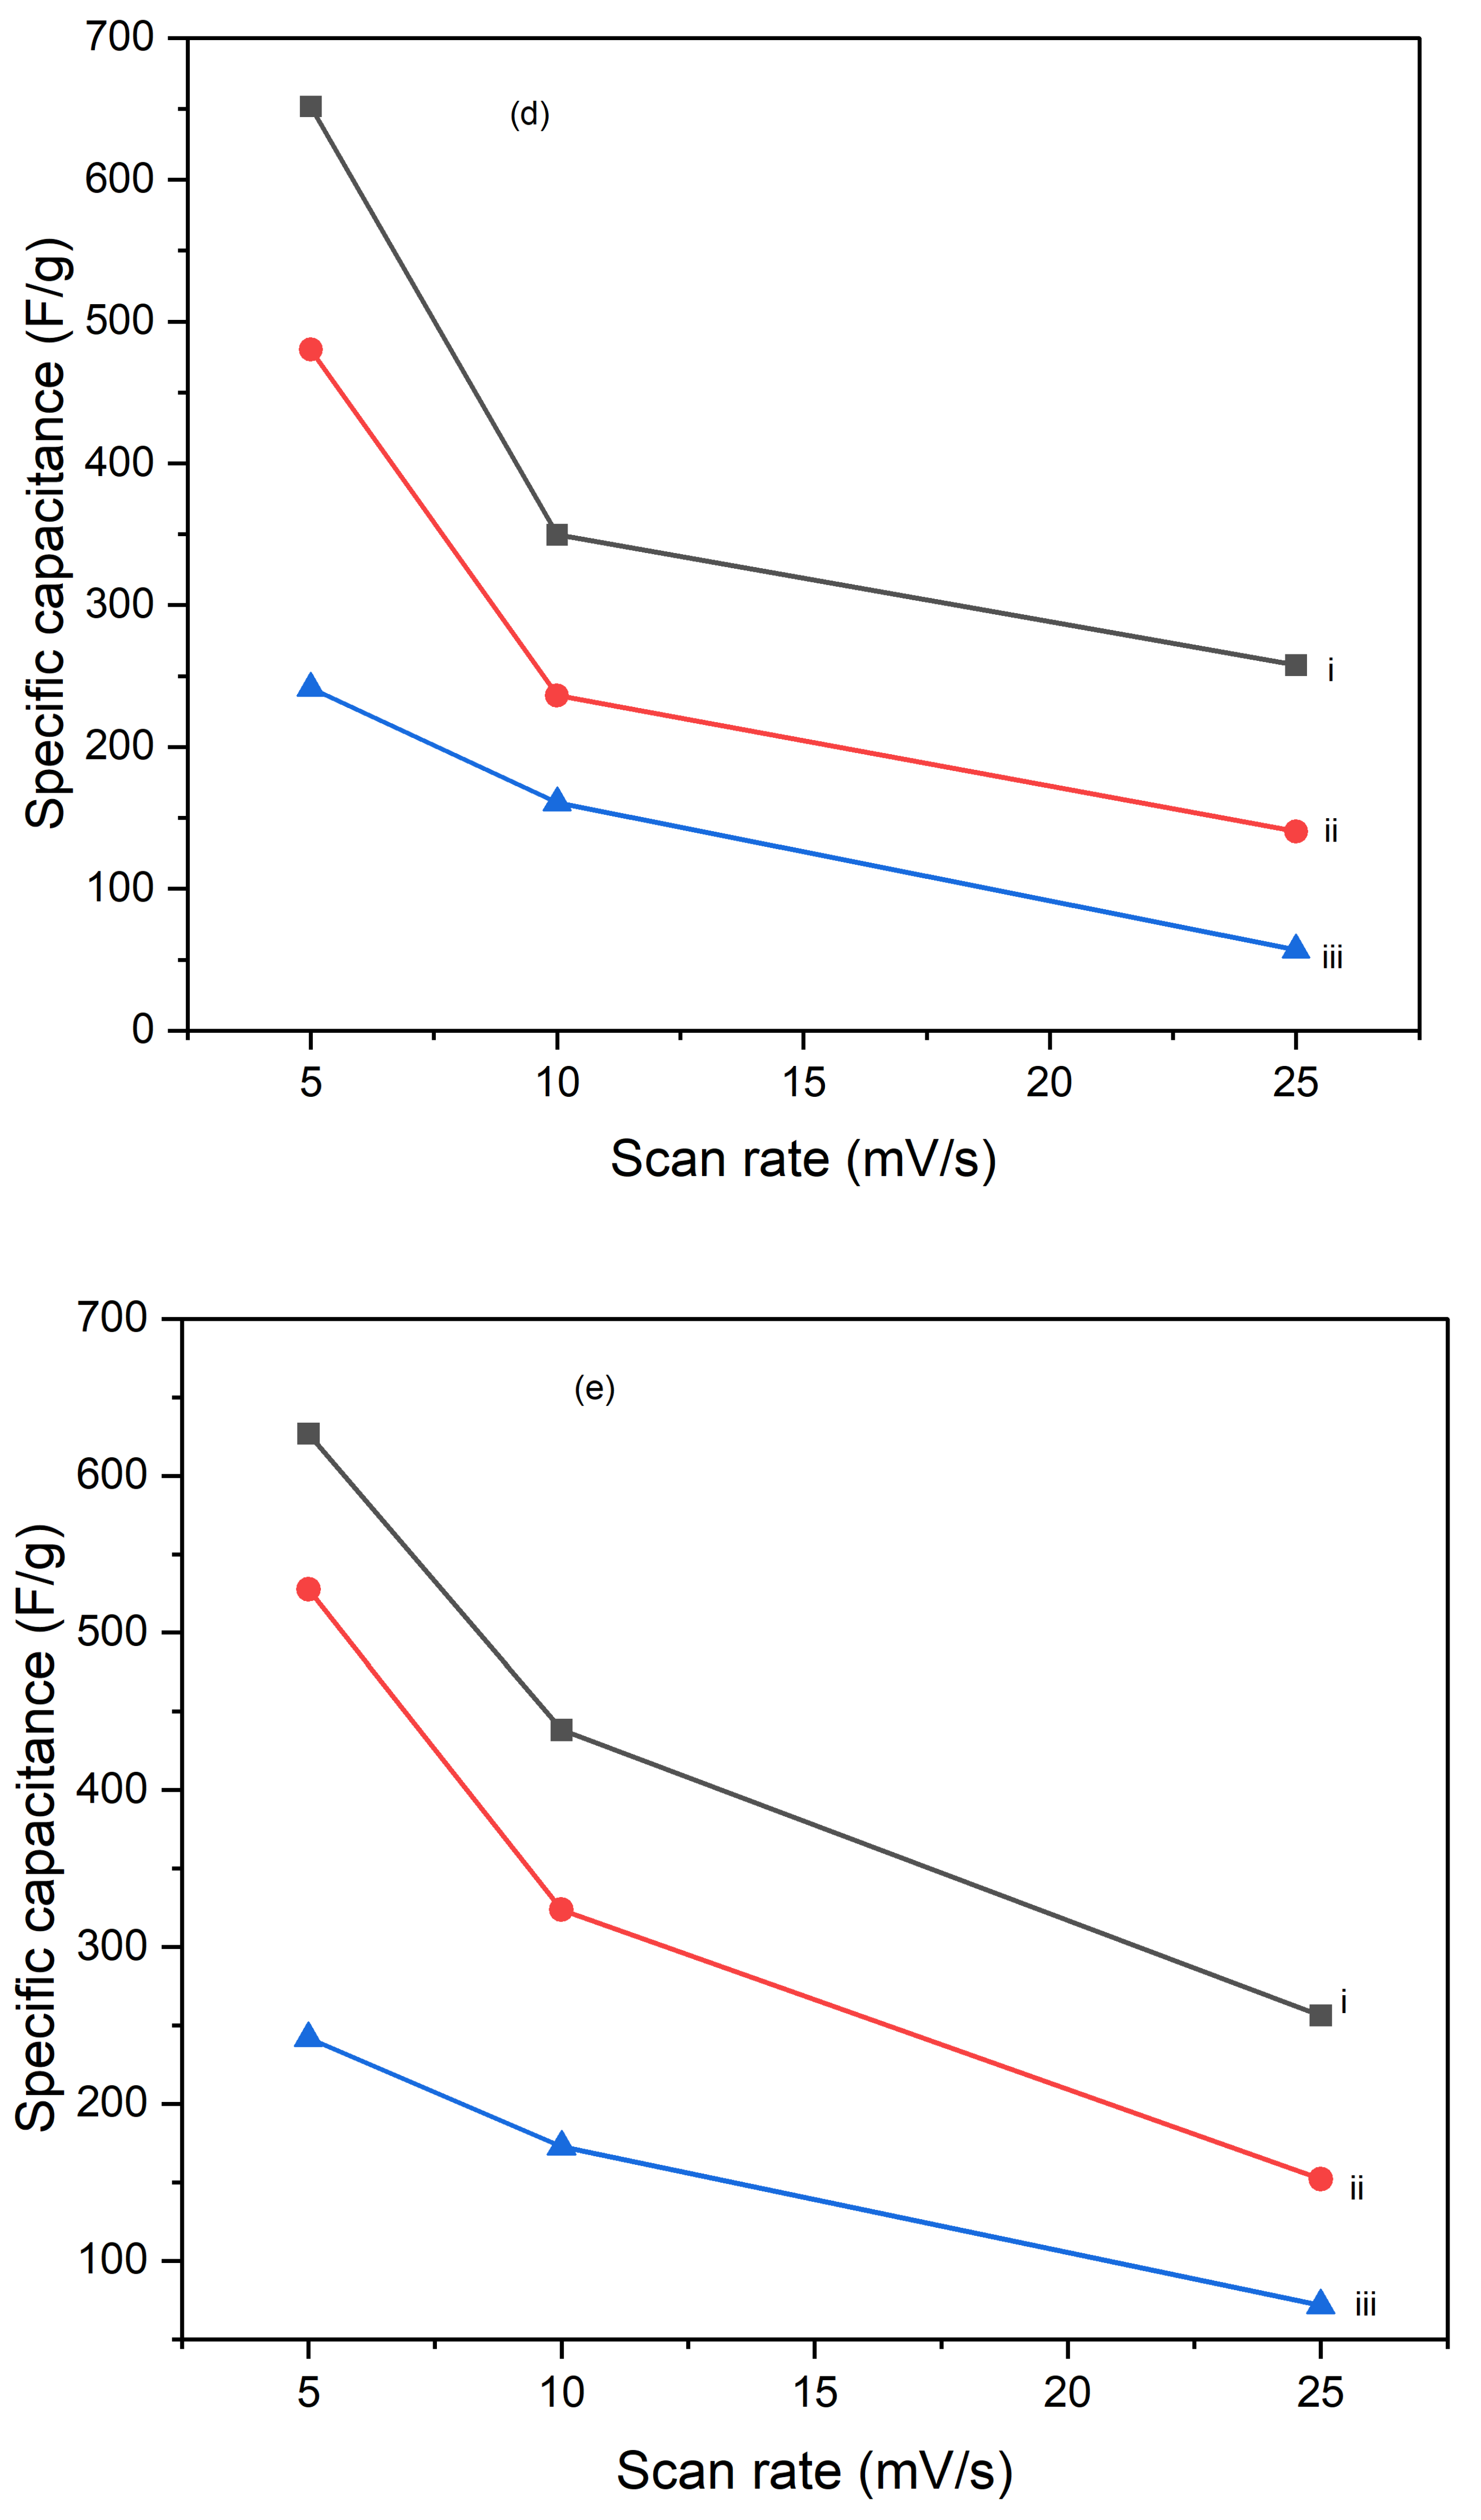
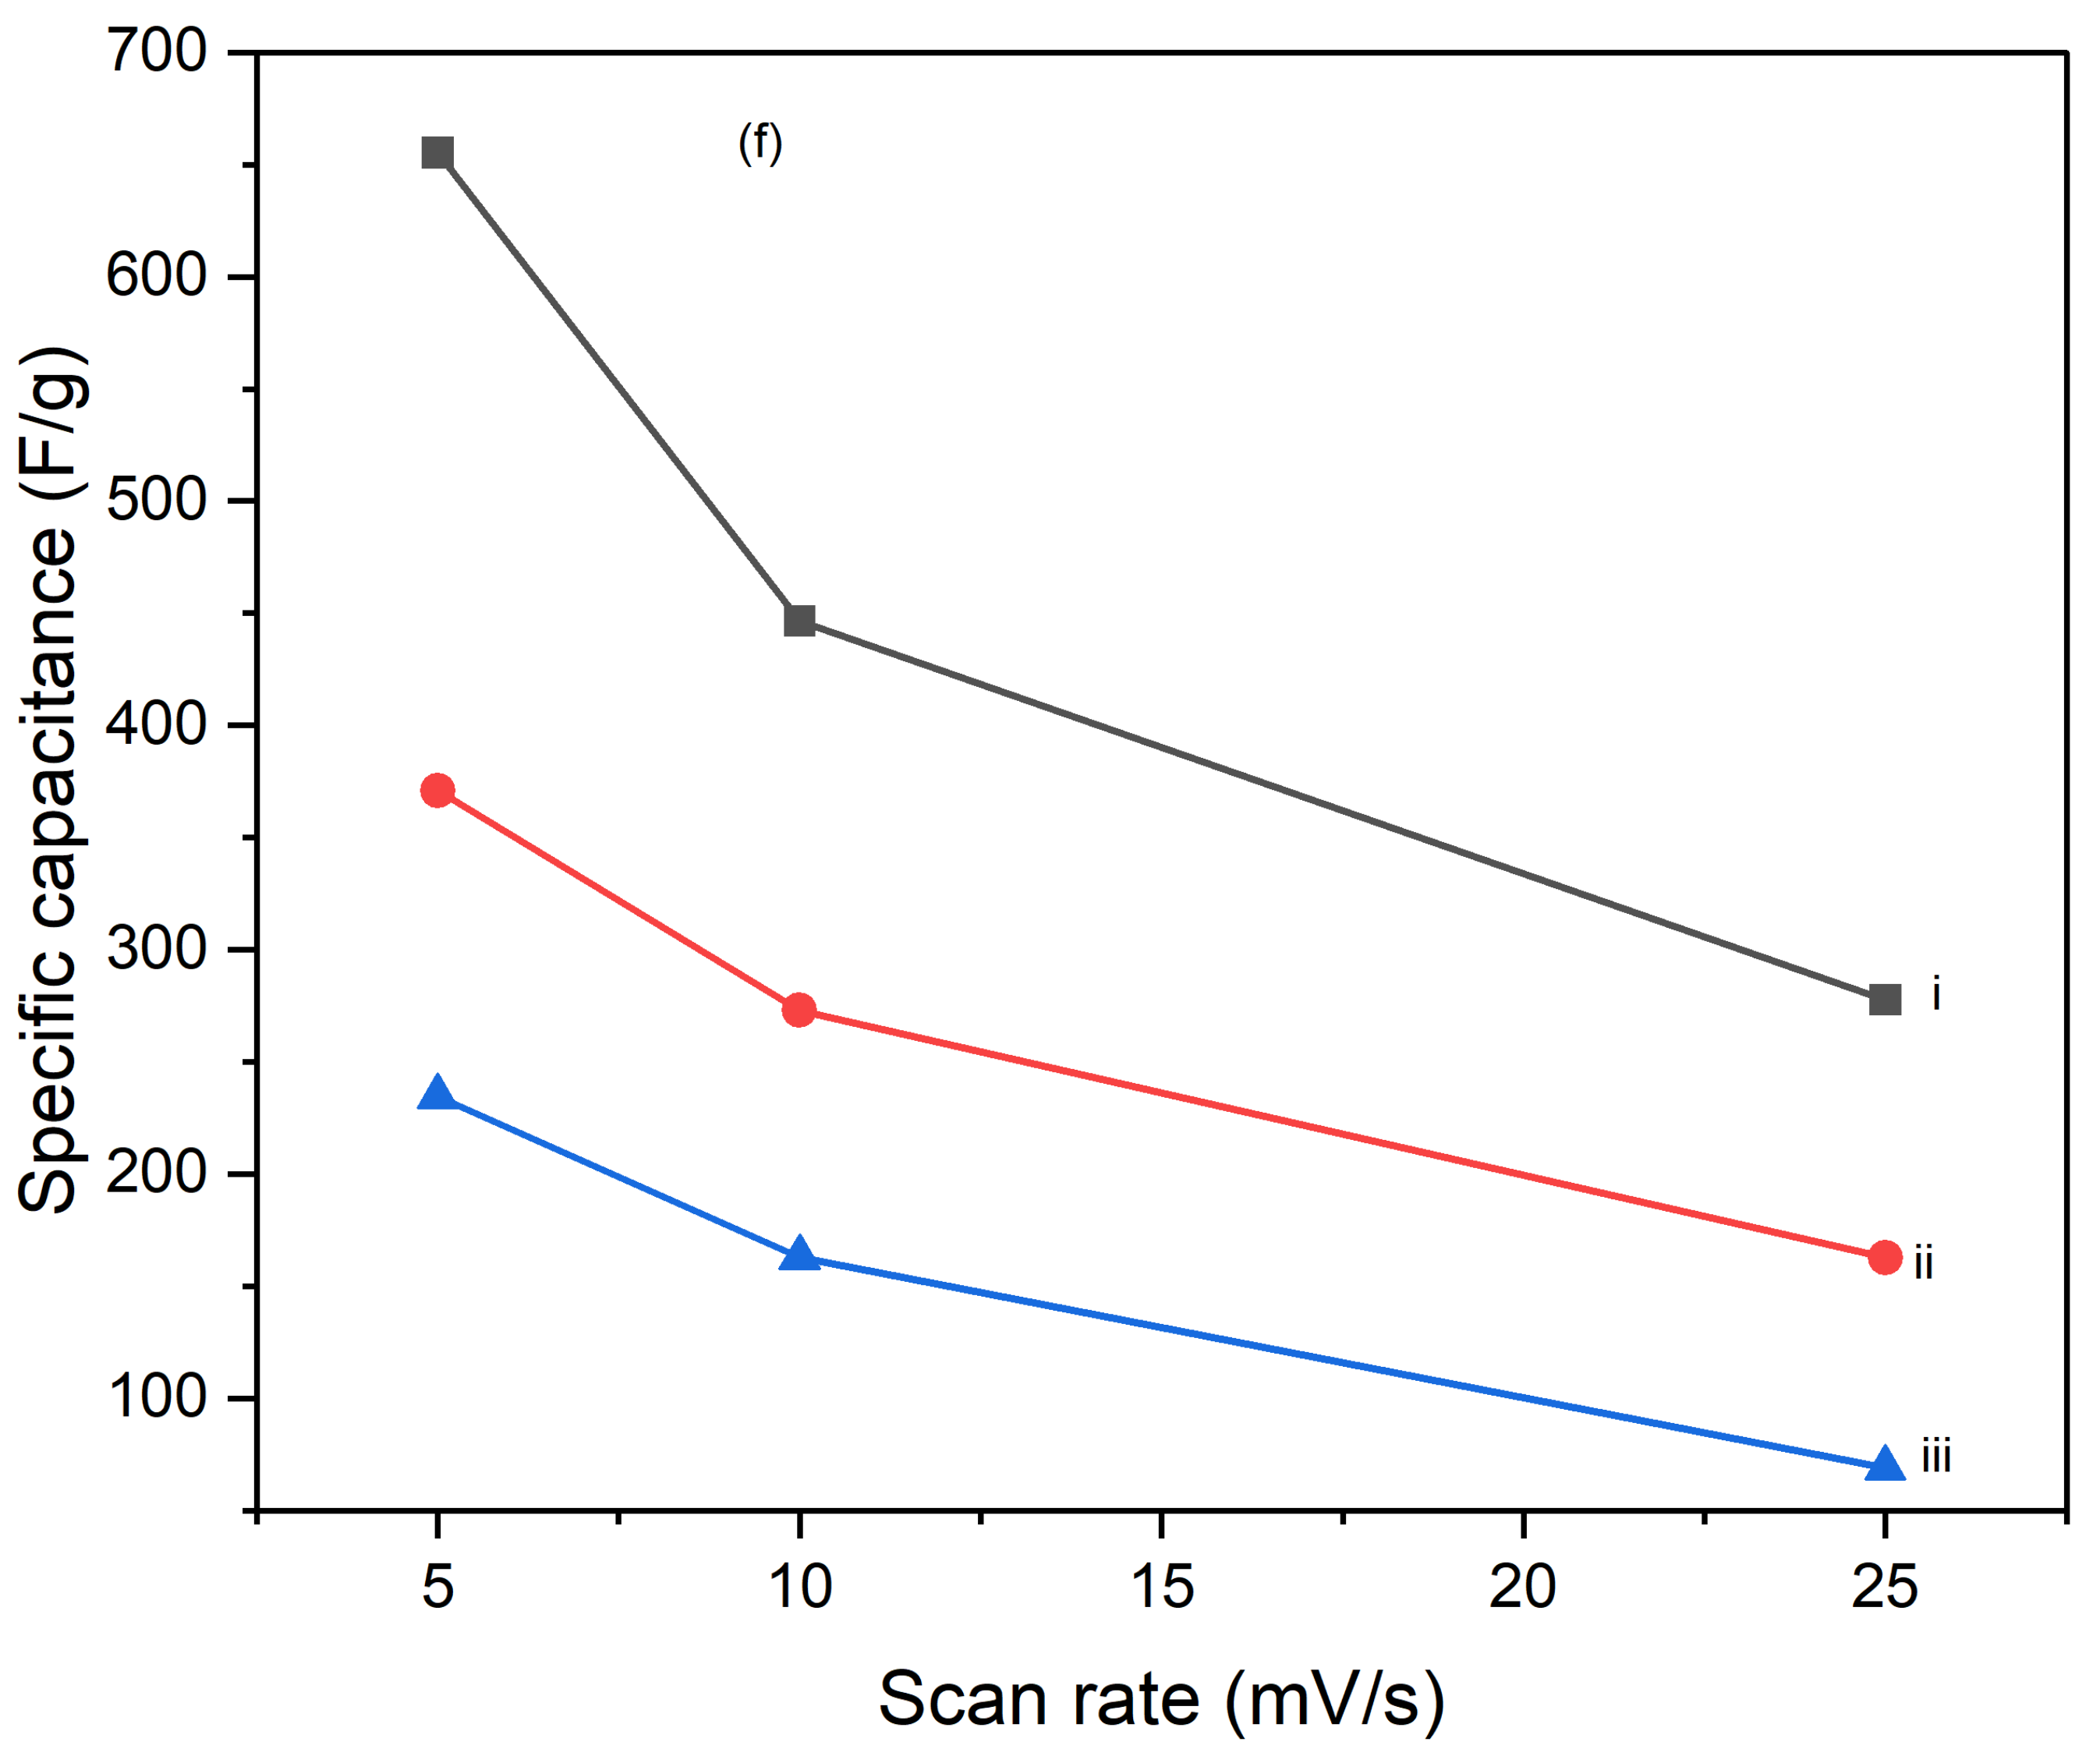
Figure 12.
Capacitance retention for CNTs/PI-PPy electrodes tested for 10 cycles at current densities of 0.5 A/g of (i) 90oC, (ii) 180oC, and (iii) 250oC.
Figure 12.
Capacitance retention for CNTs/PI-PPy electrodes tested for 10 cycles at current densities of 0.5 A/g of (i) 90oC, (ii) 180oC, and (iii) 250oC.
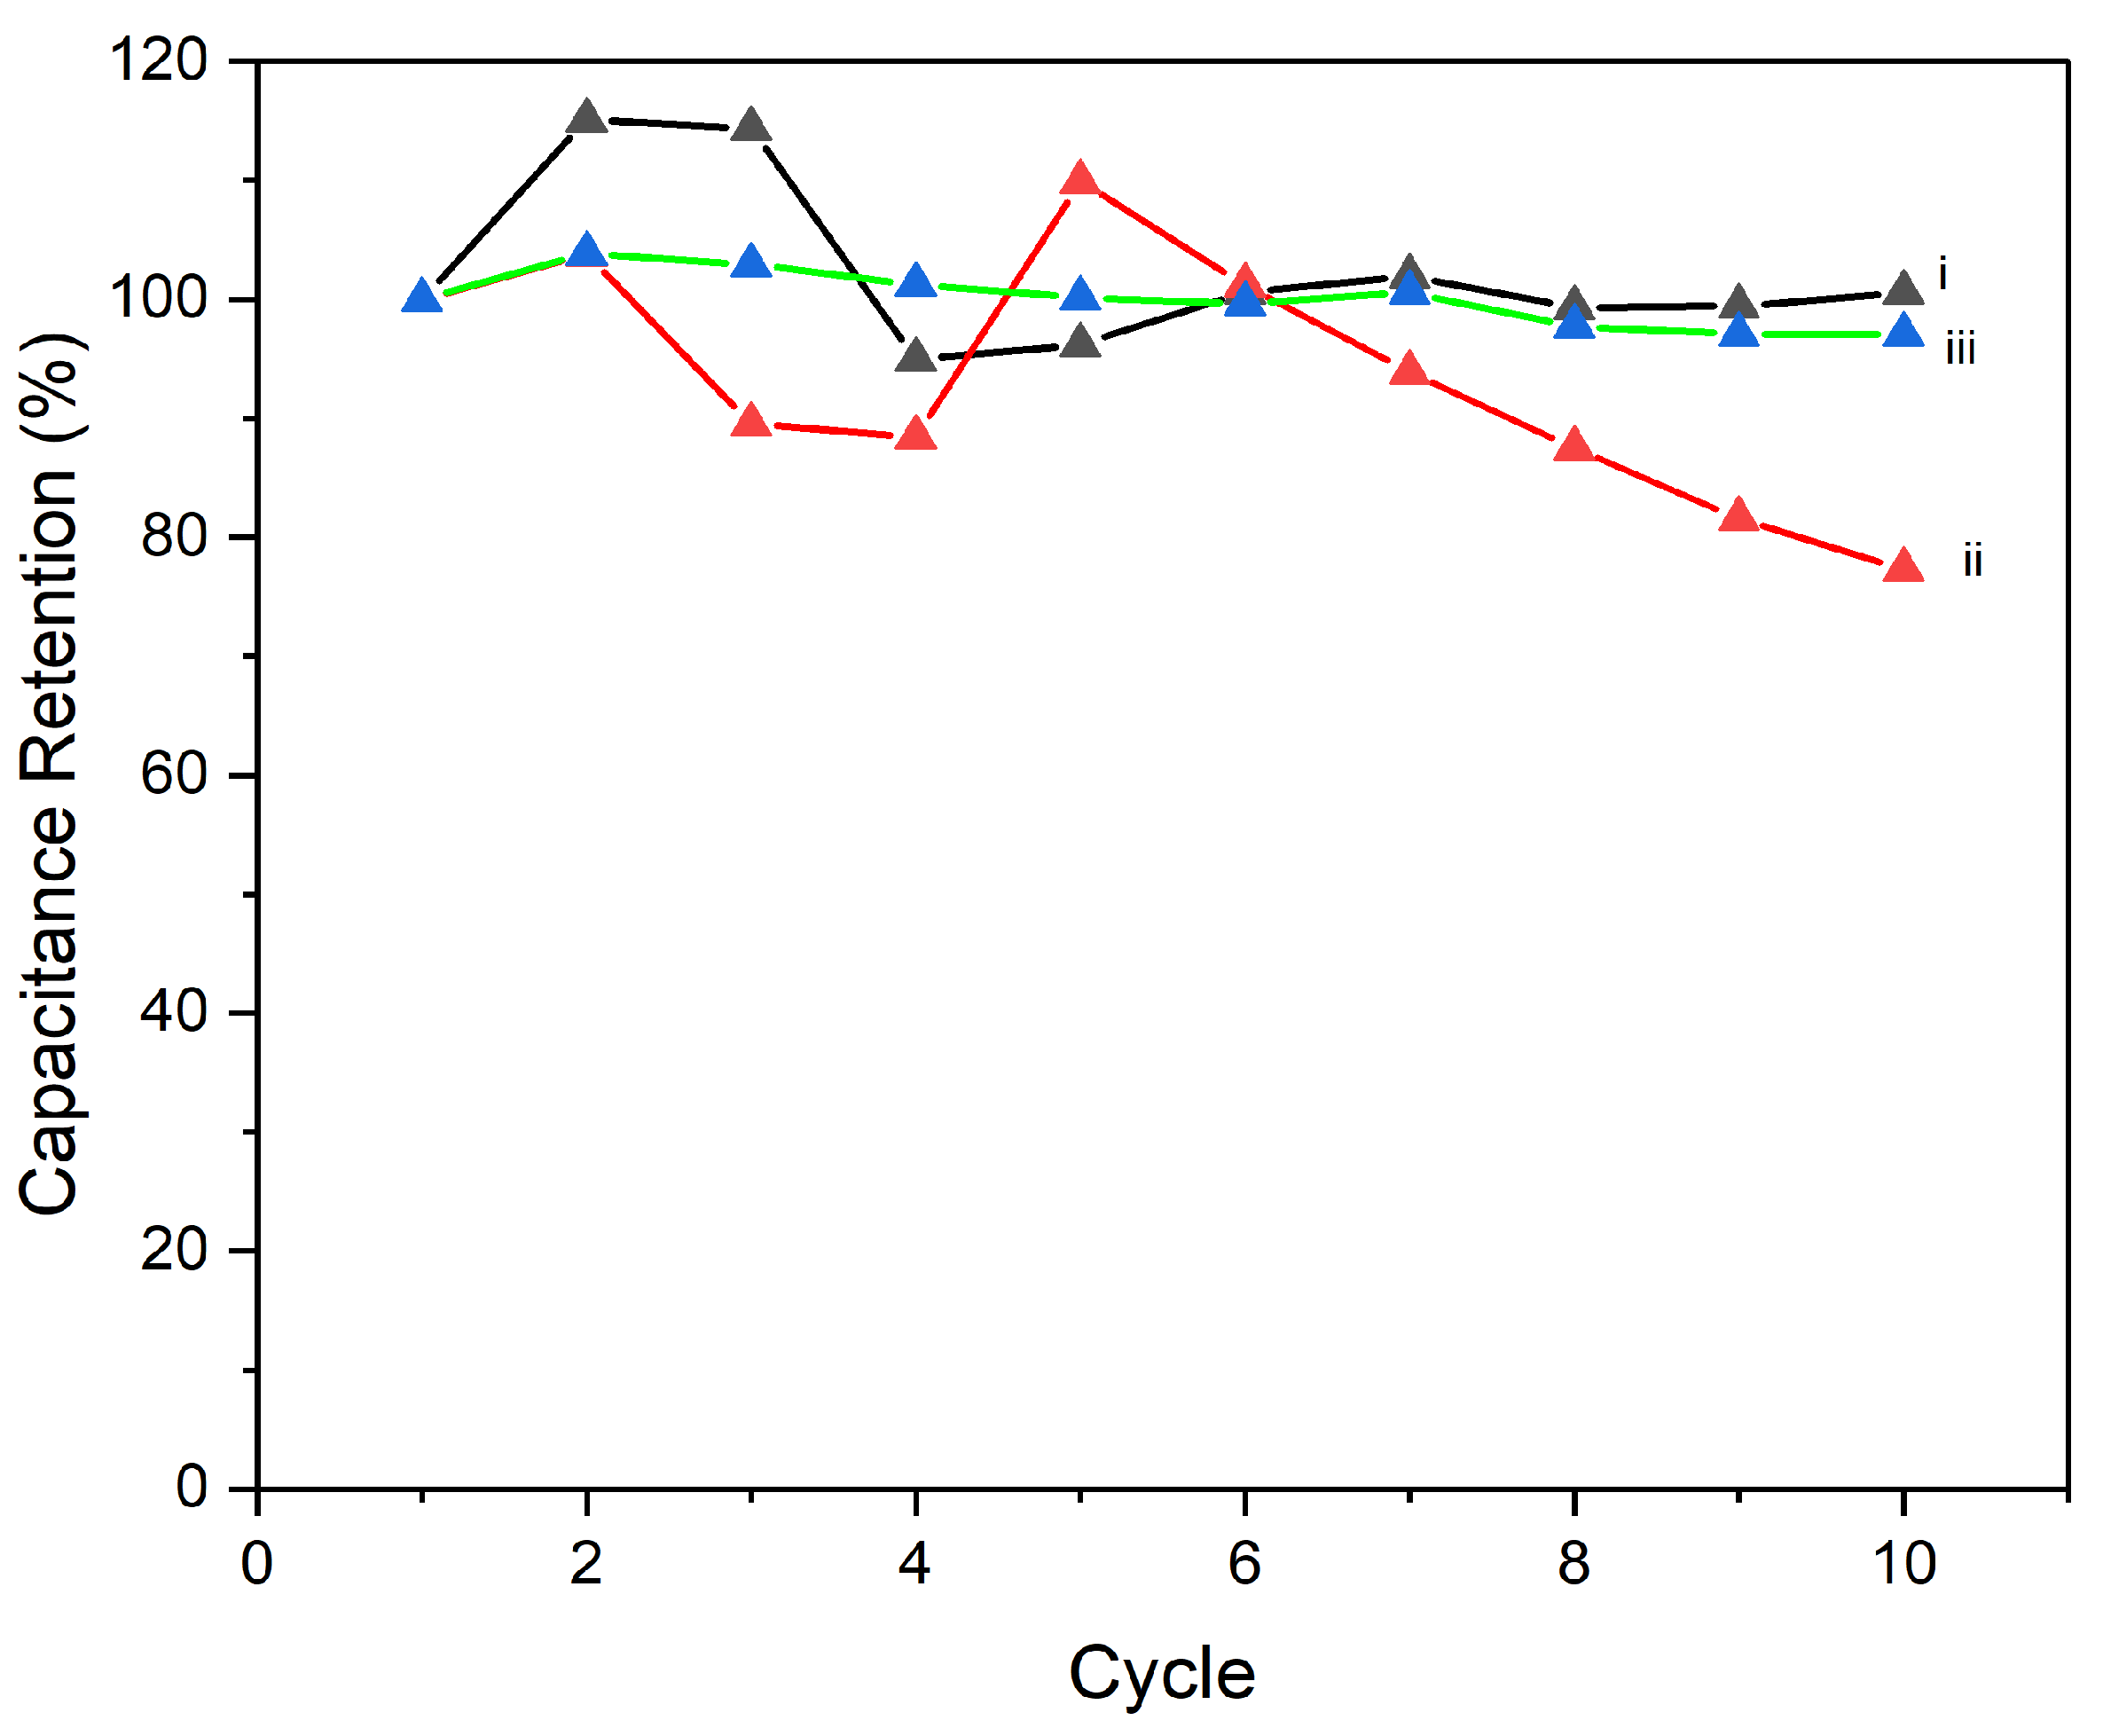
Figure 13.
Charge/discharge curve of CNTs/PI–PPy at different processing temperatures (i) 90oC, (ii) 180oC, (iii) 250oC.
Figure 13.
Charge/discharge curve of CNTs/PI–PPy at different processing temperatures (i) 90oC, (ii) 180oC, (iii) 250oC.
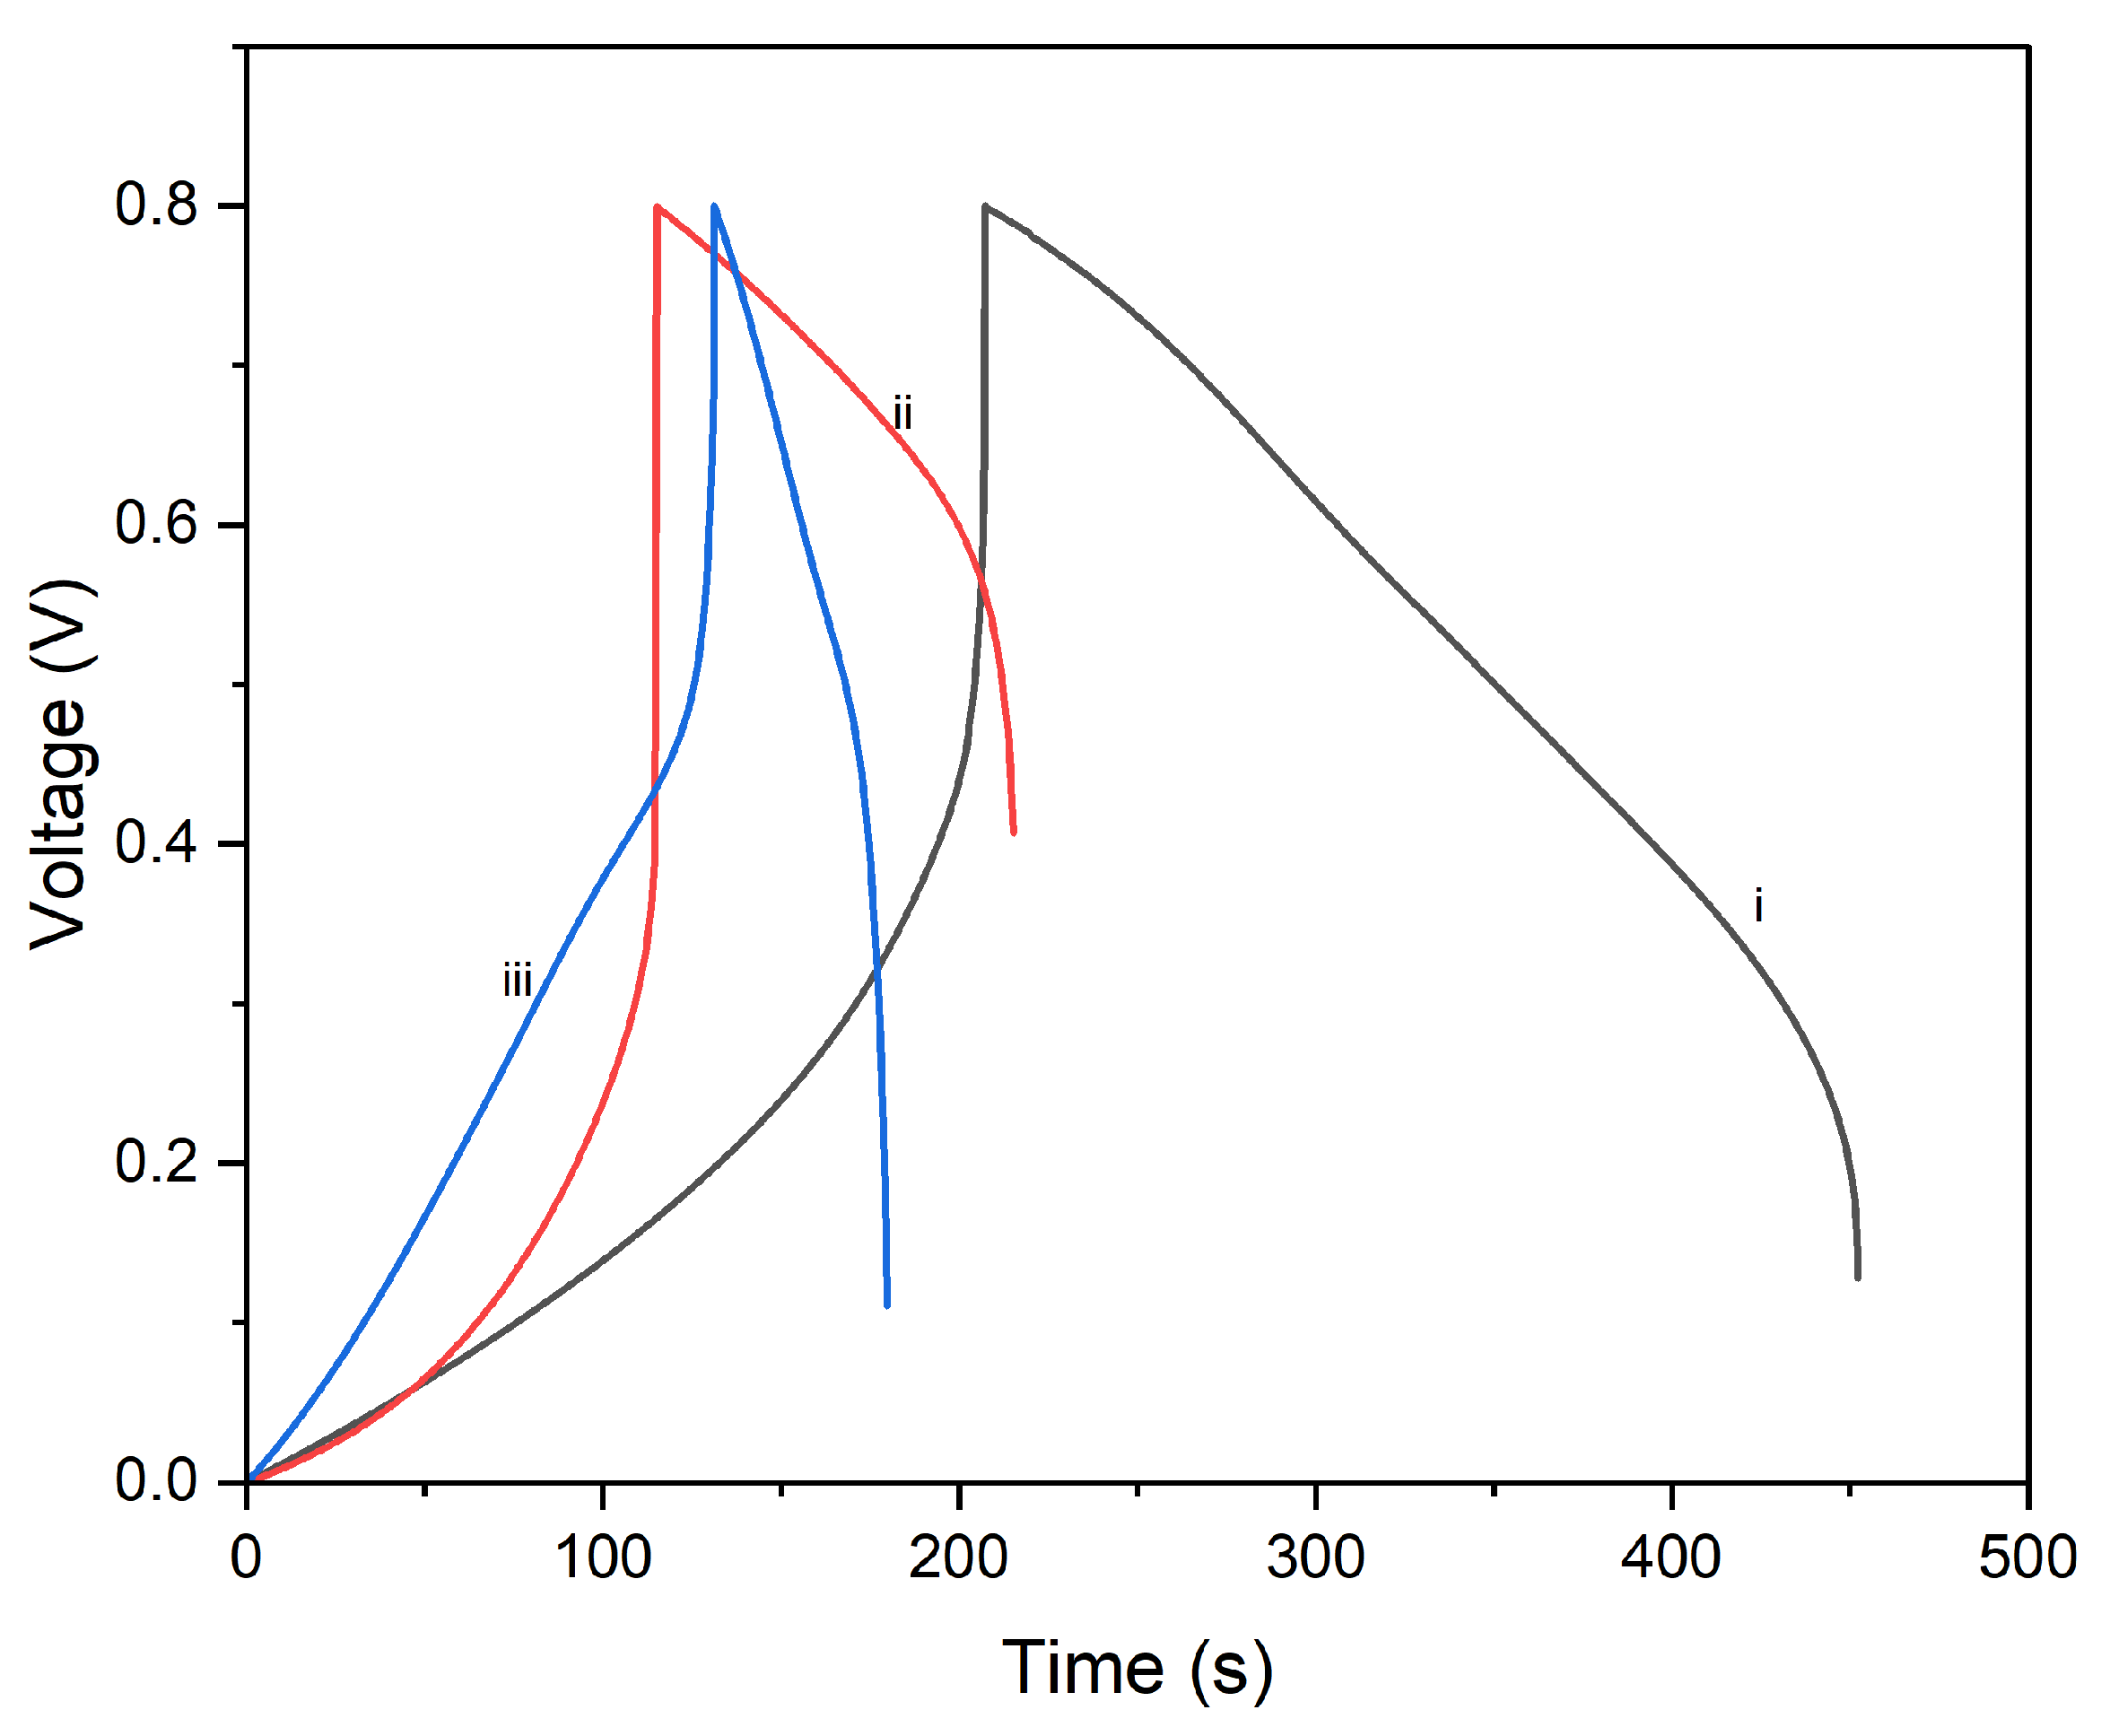
Figure 16.
Comparison of energy and power densities of different electrode materials of (i) Ref [40], (ii) Ref [41], (iii) Ref [42], (iv) PI/CNTs-PPy at 90oC, (v) PI/CNTs-PPy at 180oC, (vi) PI/CNTs-PPy at 250oC.
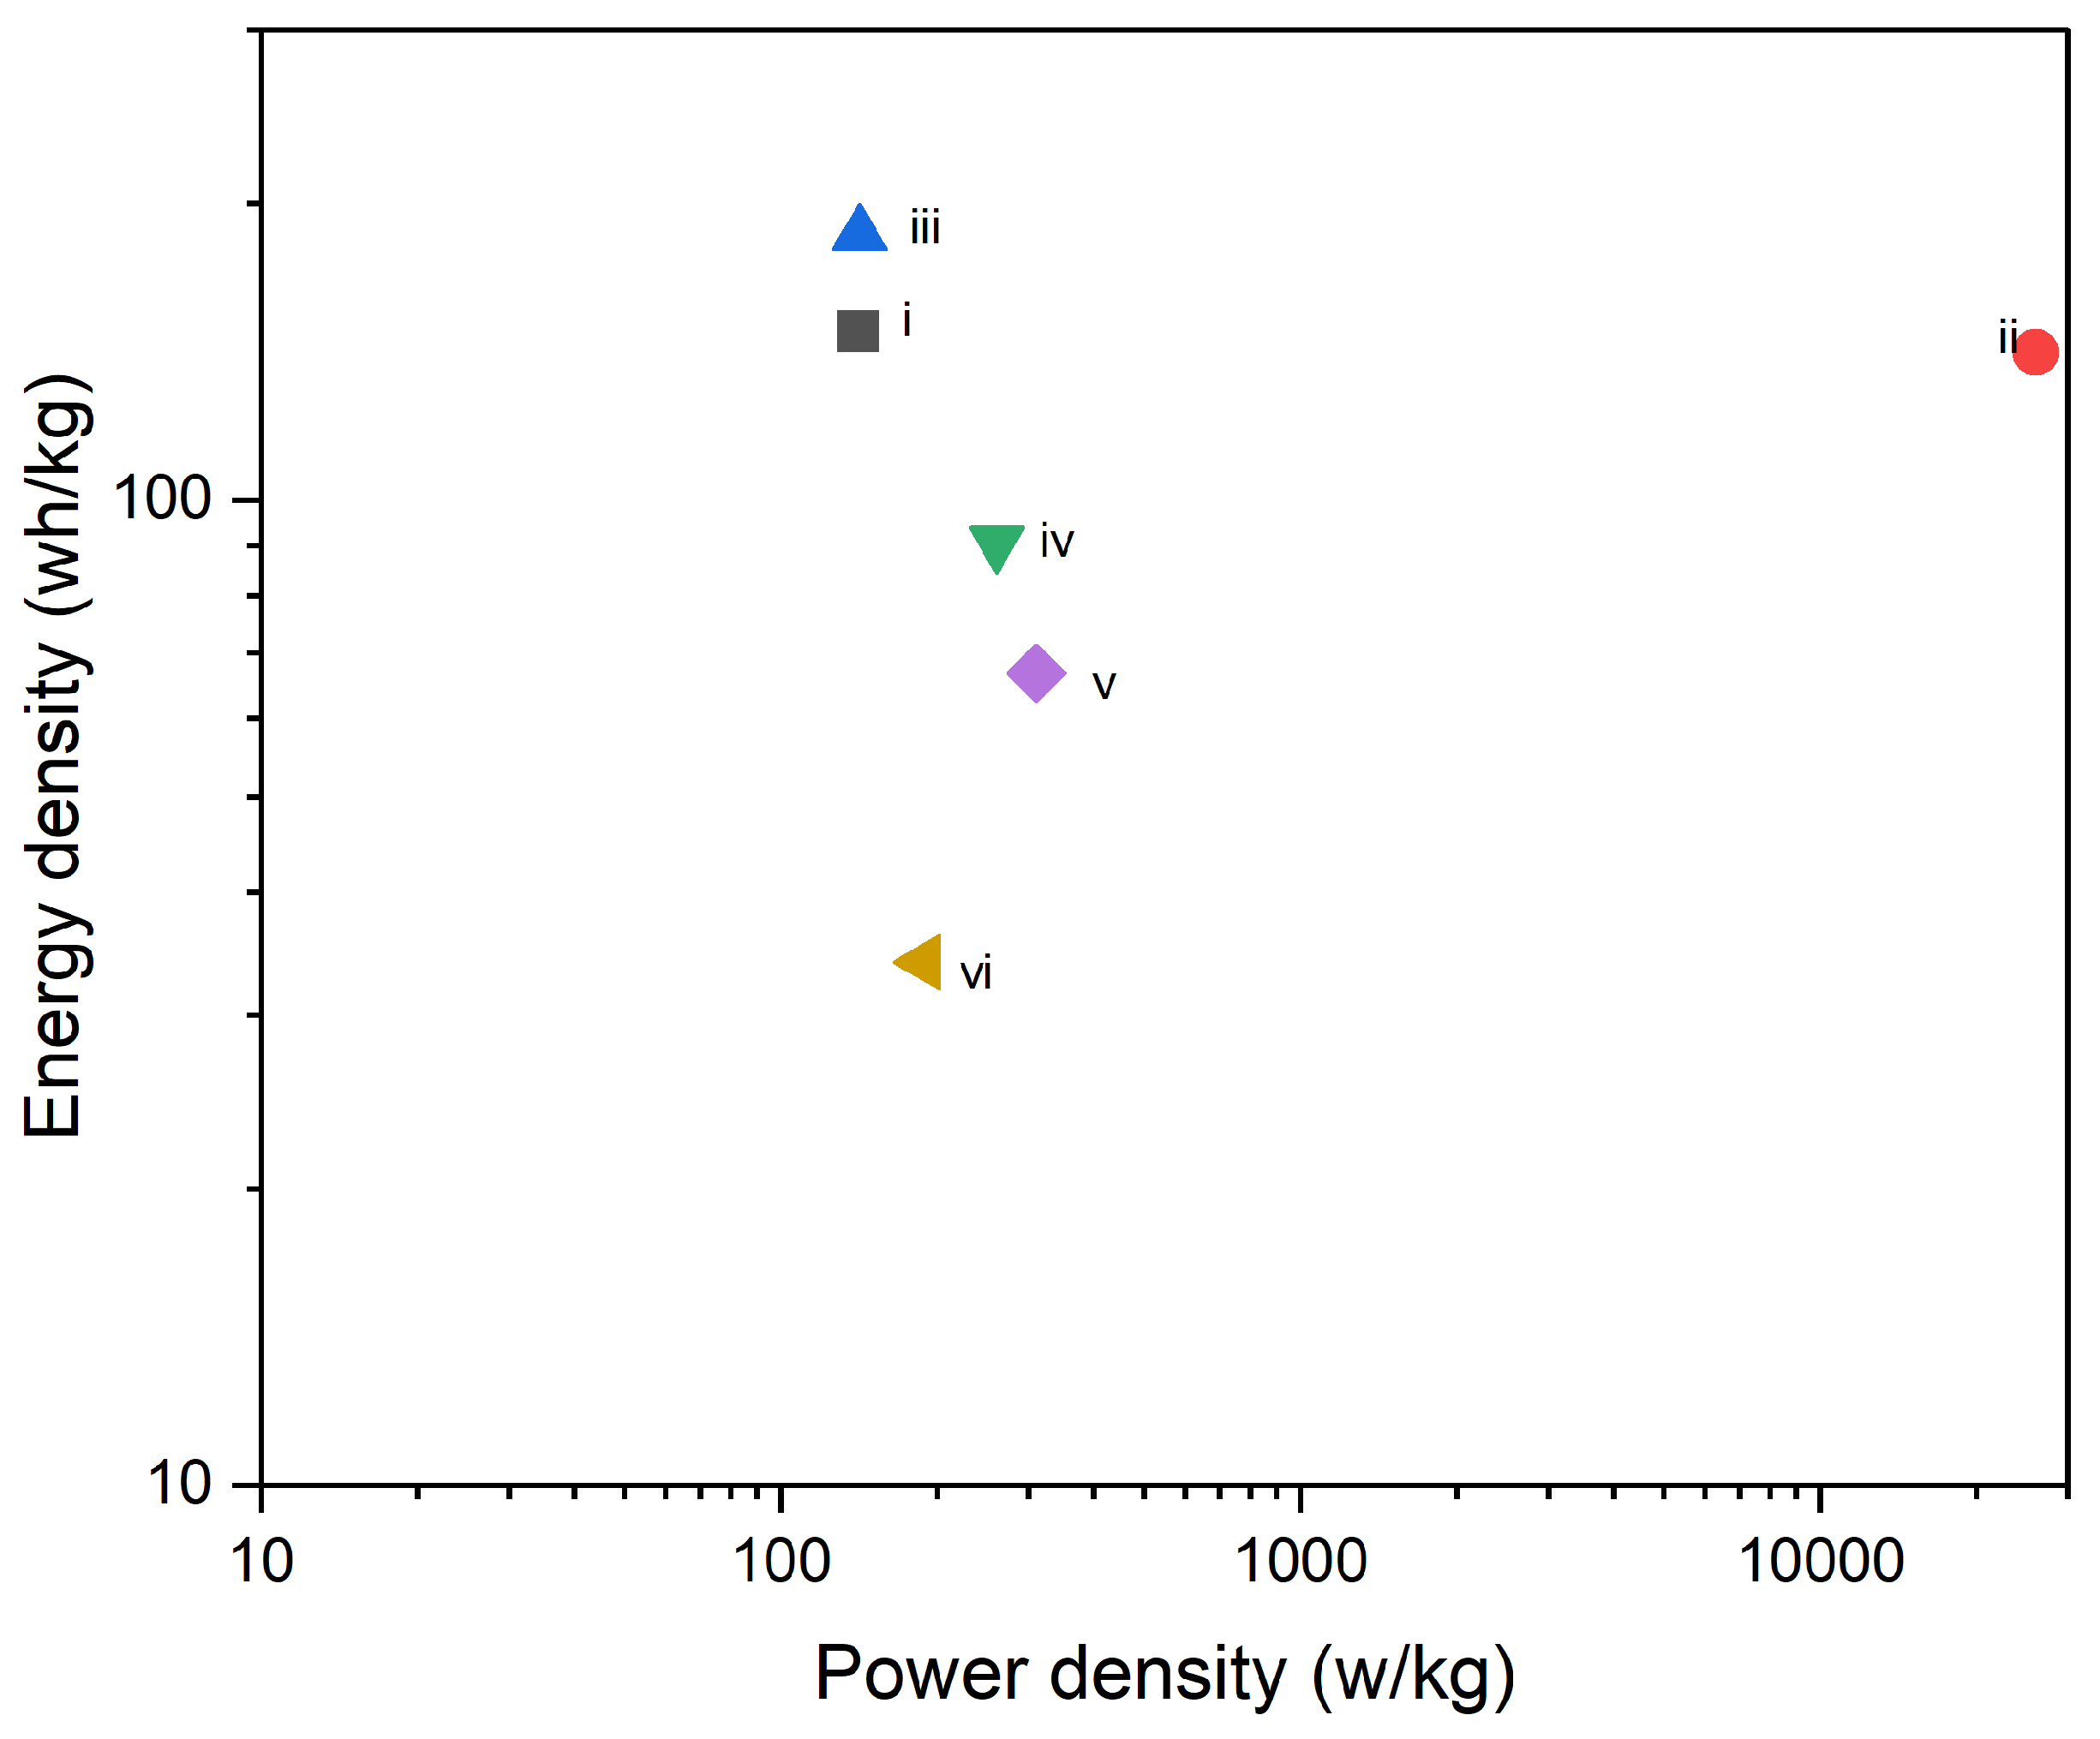
Figure 17.
EIS Bode plot for PI/CNTs sample processed at (i) 90oC, (ii) 180oC, and (iii) 250oC at the 700-second deposition of PPy.
Figure 17.
EIS Bode plot for PI/CNTs sample processed at (i) 90oC, (ii) 180oC, and (iii) 250oC at the 700-second deposition of PPy.
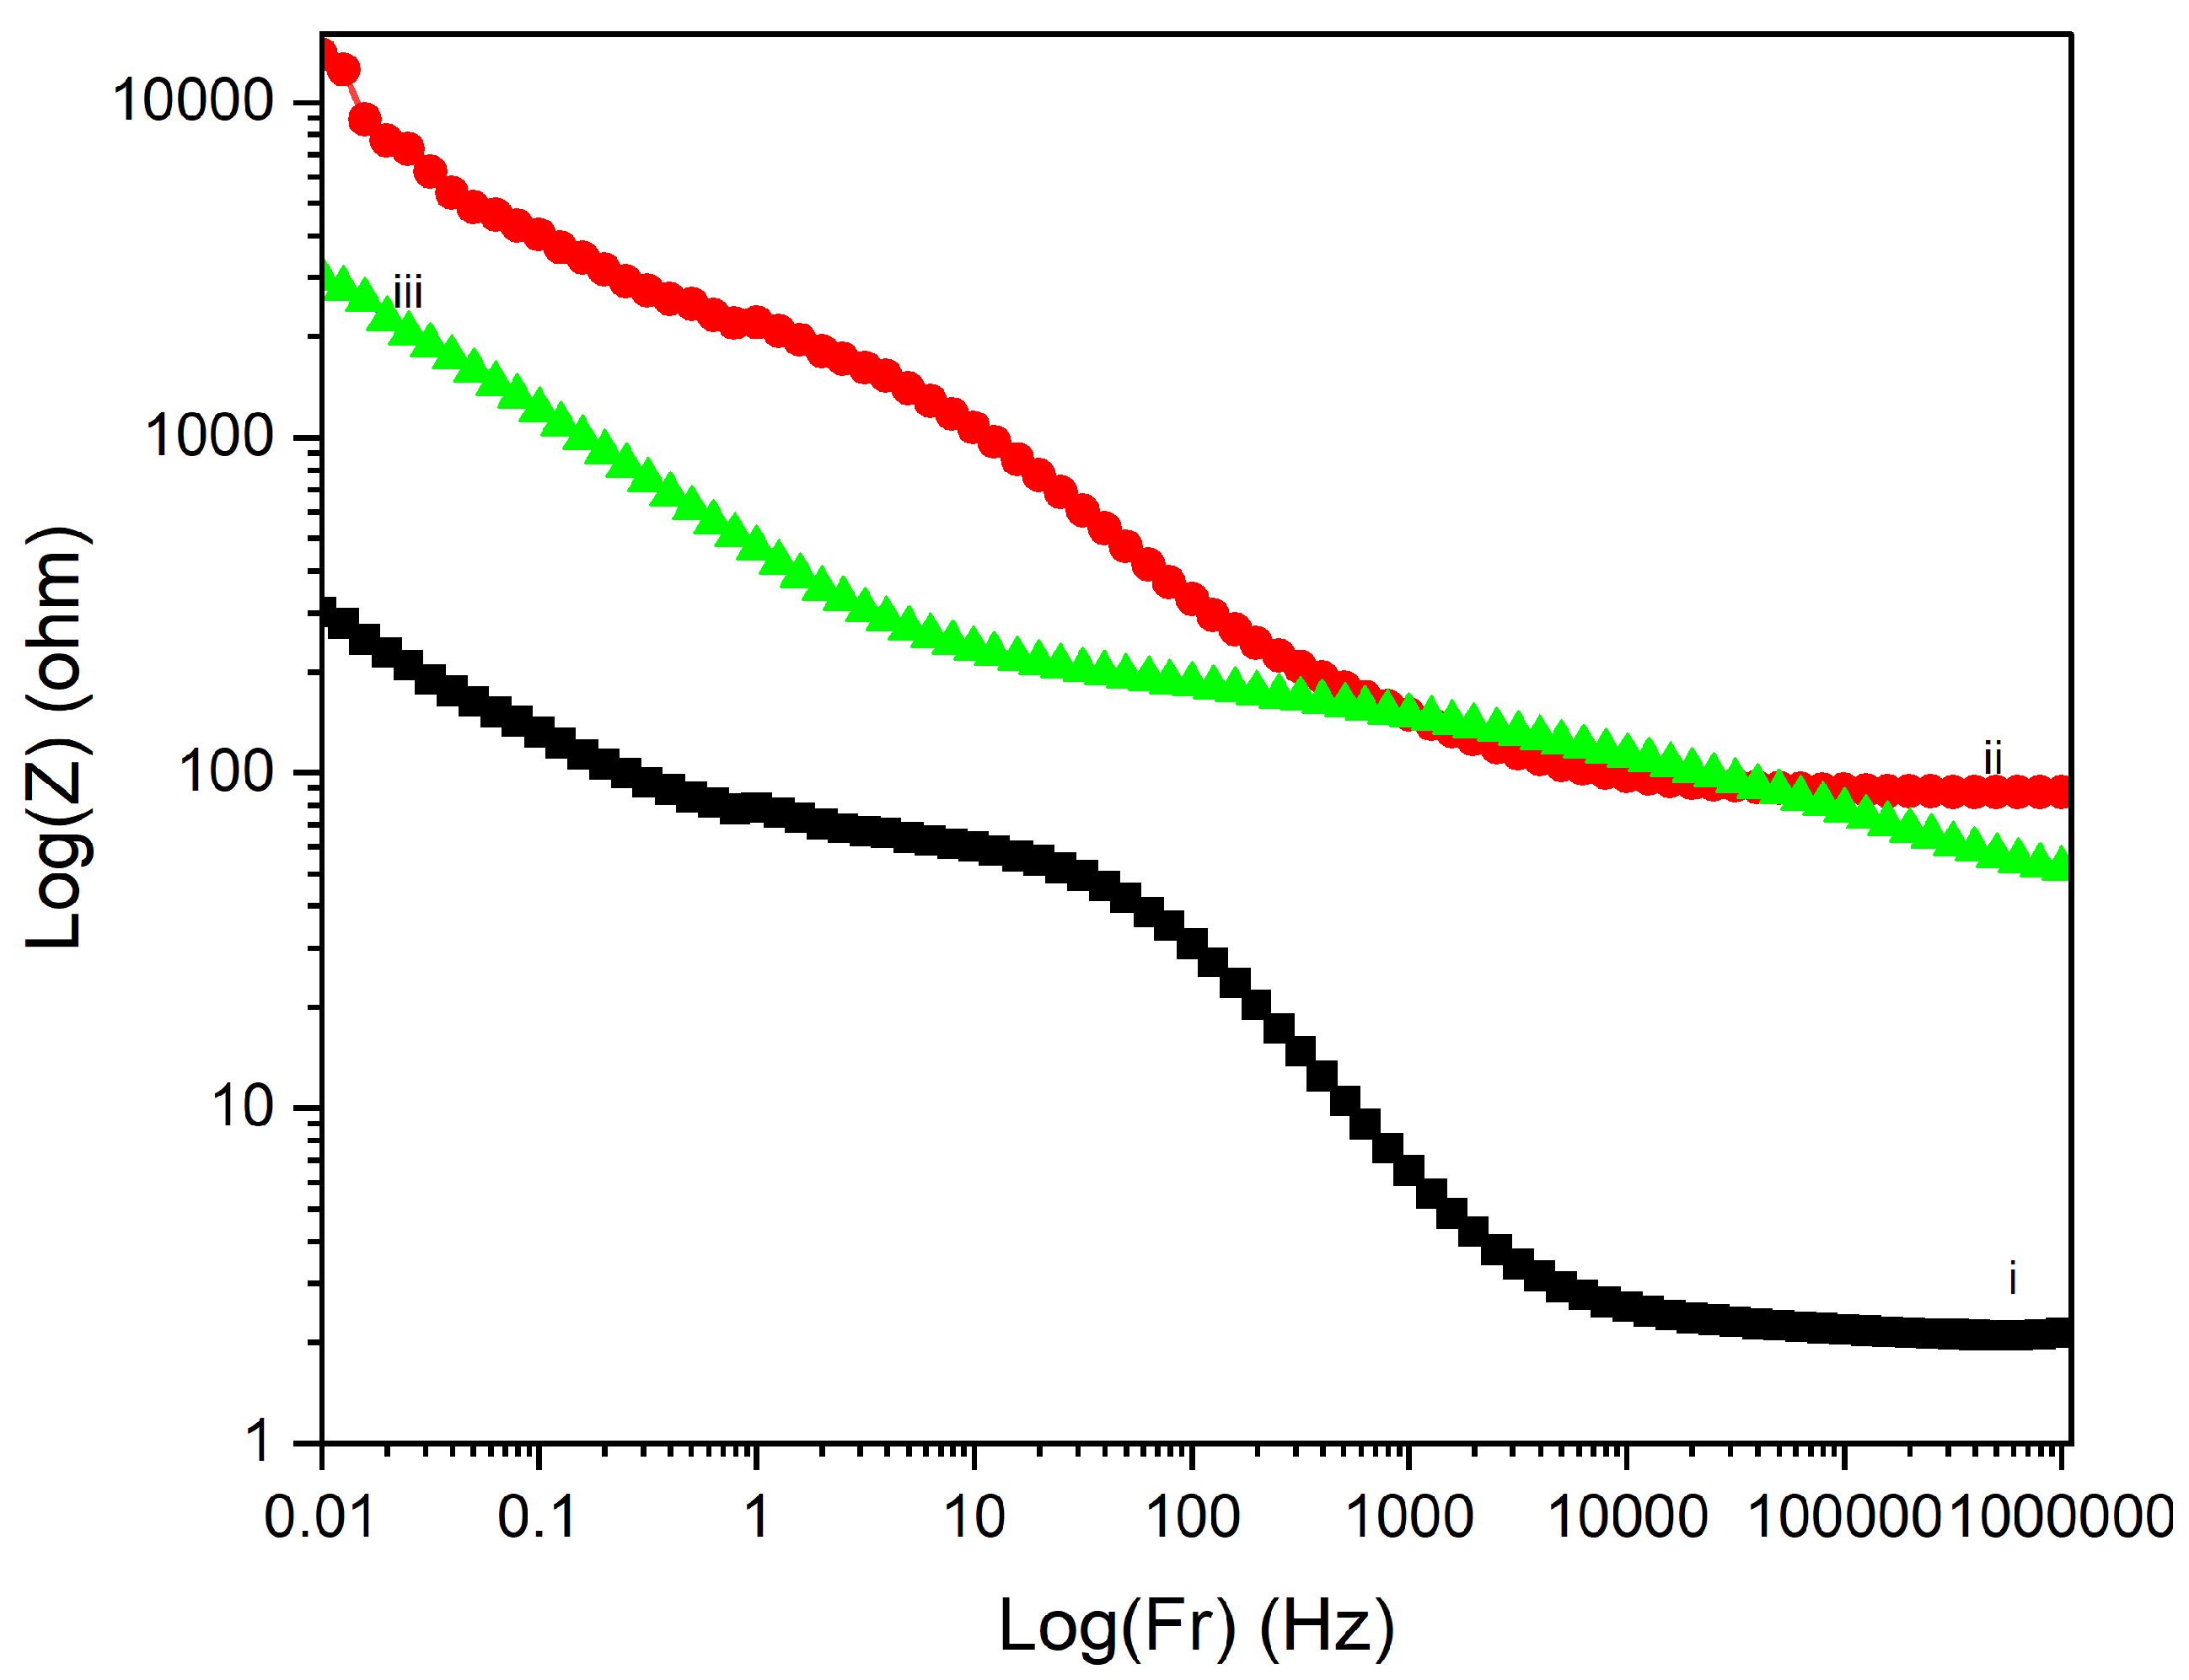
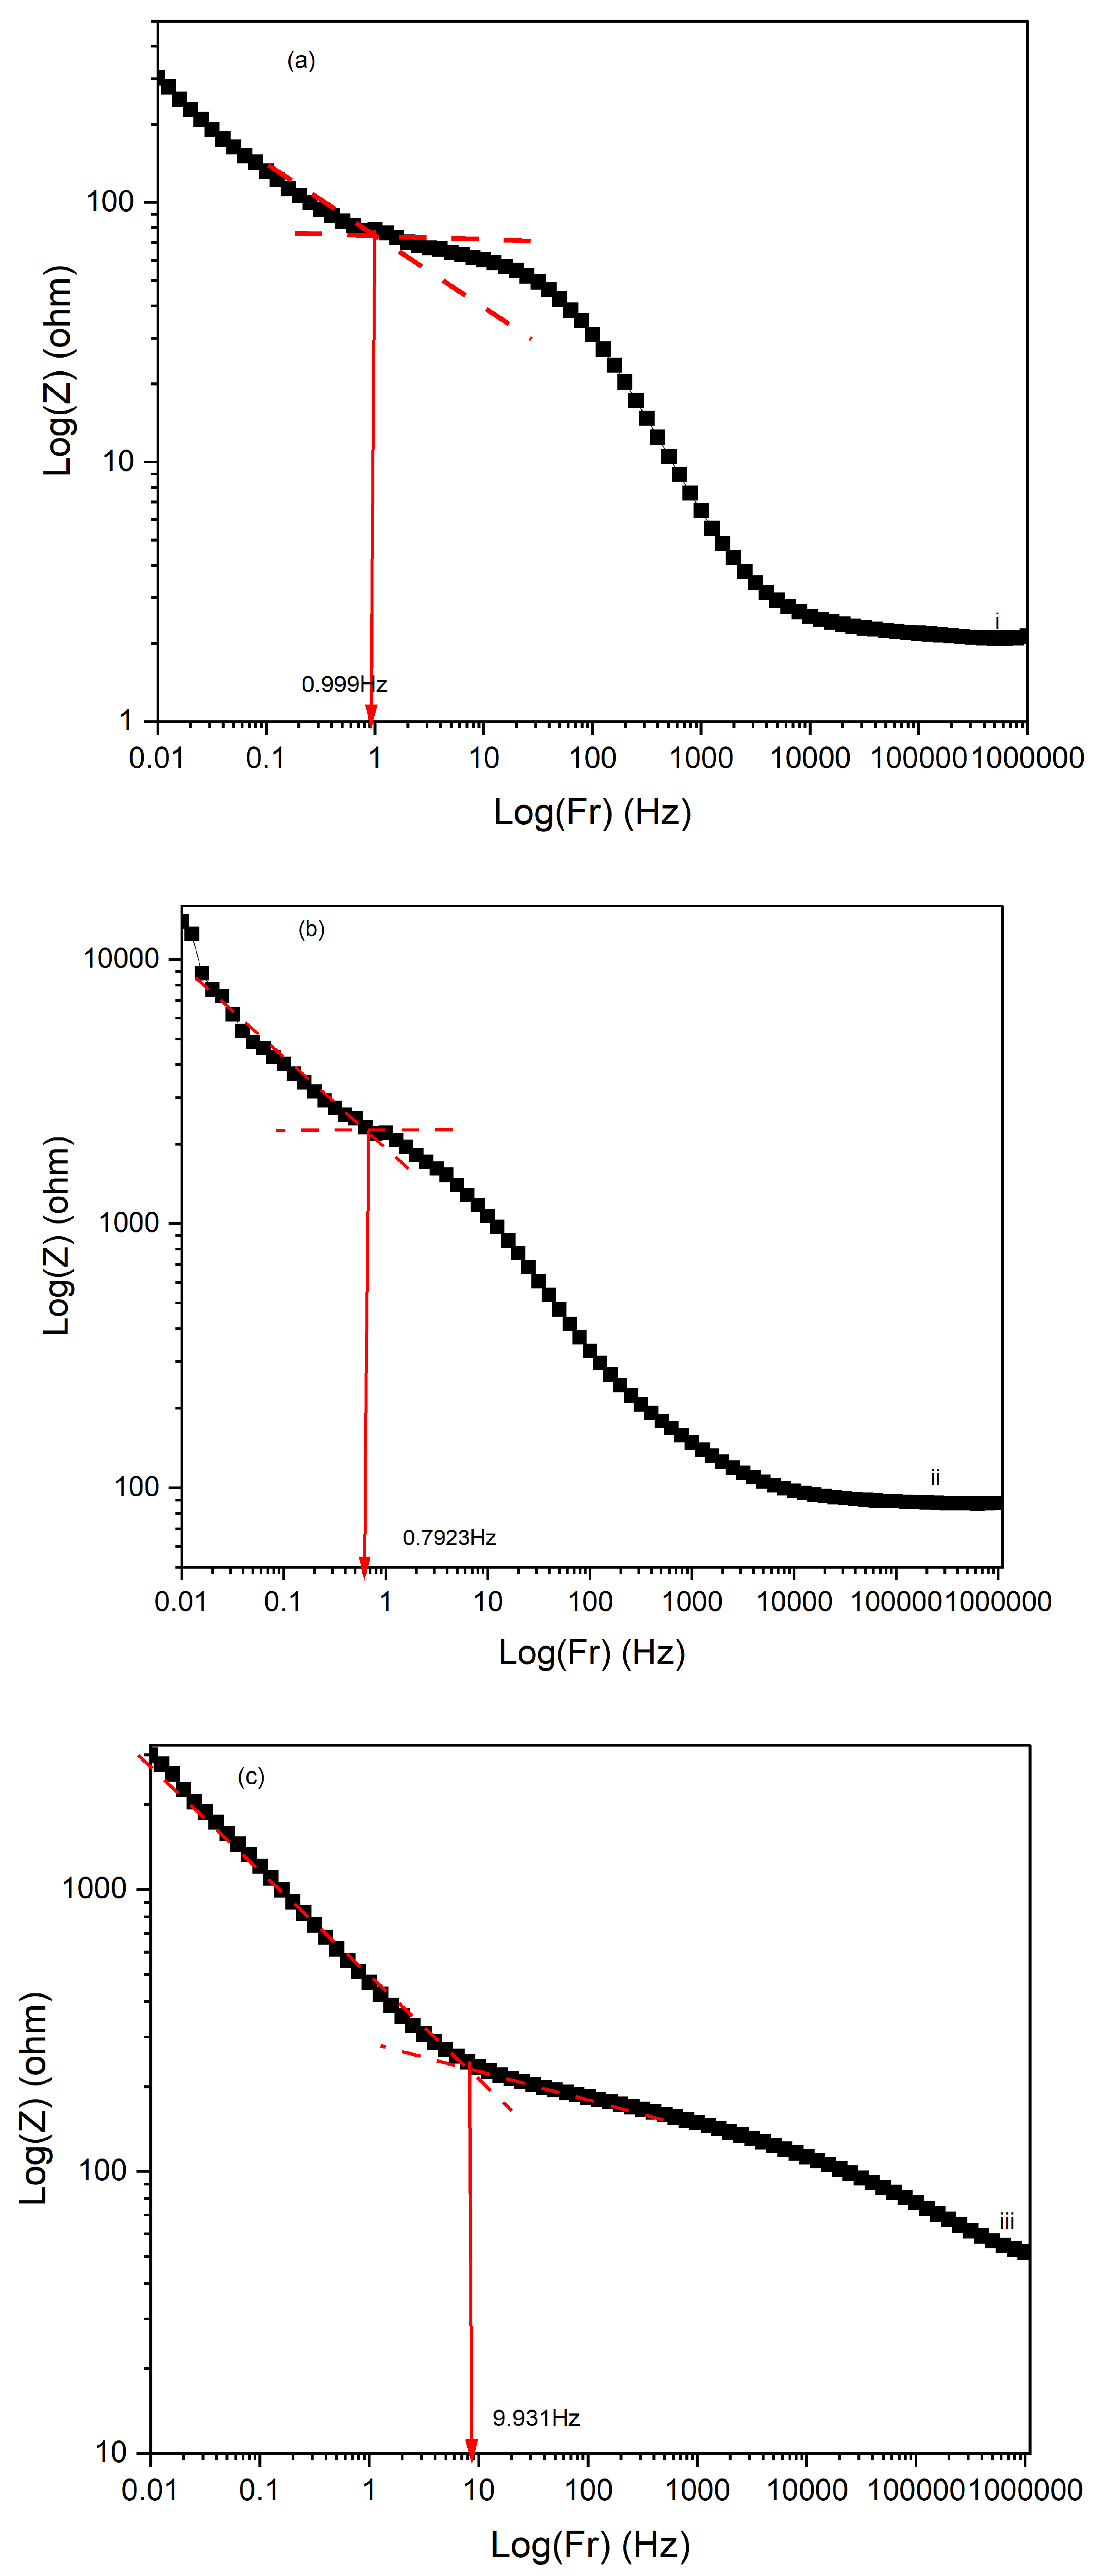
Figure 18.
Phase angle plot for PI/CNTs sample processed at (i) 90oC, (ii) 180oC, and (iii) 250oC at the 700-second deposition of PPy.
Figure 18.
Phase angle plot for PI/CNTs sample processed at (i) 90oC, (ii) 180oC, and (iii) 250oC at the 700-second deposition of PPy.
Disclaimer/Publisher’s Note: The statements, opinions and data contained in all publications are solely those of the individual author(s) and contributor(s) and not of MDPI and/or the editor(s). MDPI and/or the editor(s) disclaim responsibility for any injury to people or property resulting from any ideas, methods, instructions or products referred to in the content. |
© 2025 by the authors. Licensee MDPI, Basel, Switzerland. This article is an open access article distributed under the terms and conditions of the Creative Commons Attribution (CC BY) license (http://creativecommons.org/licenses/by/4.0/).
Copyright: This open access article is published under a Creative Commons CC BY 4.0 license, which permit the free download, distribution, and reuse, provided that the author and preprint are cited in any reuse.


