
Submitted:
02 January 2025
Posted:
03 January 2025
You are already at the latest version
Abstract
This study examines cost overrun factors in construction projects, focusing on the MENA region using Egypt as a case study. A systematic literature review was conducted, analyzing 405 research papers published between 2000 and 2024, from which 64 relevant papers were selected to identify 48 key factors contributing to cost overruns. Using K-Means clustering, these factors were grouped into three clusters based on their probability and impact, allowing for their classification by risk level. To ensure robust analysis, a survey was conducted to gather expert input, resulting in 369 valid responses from clients, contractors, and consultants. The Fuzzy Group Decision-Making Approach (FGDMA) was used to rank all 48 factors, offering a detailed assessment of their relative importance. Based on these rankings, the top 20 factors were identified for further analysis to examine variations in stakeholder priorities, capturing differences in perspectives among clients, contractors, and consultants. Sensitivity analysis and Tornado charts revealed critical variations among stakeholder, with consultants and clients prioritizing design-related risks, such as inconsistencies and delays in approvals, while contractors focused more on material waste. The findings present a structured approach for analyzing and prioritizing cost overrun risks, providing practical insights for construction professionals to improve cost and risk management strategies.
Keywords:
Cost overrun
; Construction
; Fuzzy logic
; K-mean analysis
; Sensitivity
; Tornado chart
; Risk management
1. Introduction
The construction sector is a key driver of economic expansion in many countries, particularly those in the Middle East and North Africa (MENA) region. Through its significant contribution to the Gross Domestic Product (GDP) and facilitation of urban development, the construction industry is essential to advancing economic growth and infrastructural improvement [1,2]. In the MENA, the construction sector accounts for an estimated $187 billion, or 8.4% of the GDP [3] and projected to expand by 2.2% in 2024 [4]. Generally, a project is considered successful if it is completed on time, under budget, and with considerable participant satisfaction with the project outcome. However, one of the main problems preventing the successful completion of most construction sector projects is cost overruns, which have a direct influence on task progress and may lead to the abandonment of projects [5].
Cost overrun is defined as the amount by which actual cost exceeds the estimated cost, with the cost measured in the local currency, constant price, and against a consistent baseline [6]. In construction projects, the cost overrun amount is the difference between the final actual cost of a construction project at completion and the contract amount agreed by and between the owner and the contractor during the signing of the contract [7]. Cost overrun may arise from external factors, such as inflation, weather, and regulations, or internal factors, such as project size, duration, complexity, location, design, and cost estimation method [8].
The complexity of construction projects, characterized by a lack of information, uncertainties, and limited understanding of project scope, often leads to inaccuracies in estimation and subsequent cost overruns [9]. Additionally, the intricate nature of construction processes, coupled with external factors such as economic fluctuations and internal inefficiencies, makes cost control a critical concern for stakeholders. Moreover, project complexity is directly proportional to the level of cost overrun, with higher complexity introducing greater uncertainties and leading to more frequent budget escalations [10,11]. This increasing technical and legal complexity in construction projects is further exacerbated by a growing number of risks, which negatively impact project execution [12]. To address these challenges, project risk management focuses on maximizing the likelihood and impact of positive events while minimizing the probability and effect of negative events, ensuring that project objectives are achieved and opportunities for positive outcomes are leveraged [13].
Egypt, as a key player in the MENA region, offers a unique lens to study cost overruns in construction projects. The country’s construction industry is vital to its economic growth, contributing significantly to GDP and employment. However, it faces persistent challenges, including inflation, currency instability, and resource allocation inefficiencies, which frequently lead to delays and budget escalations [14,15]. Despite the increasing complexity and scale of construction projects, existing research often fails to comprehensively address the localized risks specific to Egypt and the broader MENA region. This lack of focus leaves stakeholders without adequate tools to anticipate and manage cost-related challenges effectively.
Therefore, this study identified three critical research gaps in cost management practices within construction projects in the MENA region, using using Egypt as a case study. These gaps are the absence of (1) systematic identification and clustering of cost overrun factors in construction industry, considering its unique economic, managerial, operational, and external challenges; (2) integration of advanced analytical methodologies, to address the challenges inherent in data-driven and stakeholder-based evaluations; and (3) employing advanced tools to compare and prioritize risks based on stakeholder perspectives, including clients, contractors, and consultants. By addressing these gaps, the study identified critical cost overrun factors and developed a structured framework for prioritizing each stakeholder. The specific contributions of this study are as follows:
- It provides new insights into managing cost overrun risks in MENA construction projects using Egypt as a case study by systematically identifying 48 critical cost overrun factors.
- It develops an innovative methodological framework that integrates K-Means clustering and FGDMA, combining quantitative analysis for clustering risks with qualitative prioritization based on stakeholder perspectives.
- It employs sensitivity analysis and Tornado charts to highlight differences and alignments among the priorities of clients, contractors, and consultants, enabling the design of more effective and targeted risk mitigation strategies.
2. Research Background
Cost overrun is one of the most influential risks in construction projects, and it is challenging to completely minimize since it is dynamic and complicated [16,17]. The main cause is the resource-intensive nature of the construction sector, which results in fluctuations in the cost of materials and equipment, shortages of resources, unforeseen expenses, and accidents during construction [18]. Furthermore, the primary reasons for cost overruns shift over time (every ten years) [19]. Therefore, it is necessary to continuously update our understanding of cost overrun risks in order to avoid or mitigate them and manage complexity efficiently [20].
Many studies have been conducted to identify the causes of cost overrun in construction projects. In the MENA, the construction sector faces significant challenges influenced by political, economic, and environmental factors [21]. Alsuliman [22] highlighted that awarding contracts to the lowest bidder and prolonged project delays were critical causes of cost escalations in Saudi Arabia. Bekr [23] reported that in Iraq, security concerns, regulatory changes, and delayed payments significantly impacted project costs. Additionally, Al-Hazim et al. [24] emphasized that difficult terrain and adverse weather conditions were key factors driving up costs in Jordan. Koushki et al. [25] conducted a study in Kuwait and concluded that change orders, owners’ financial constraints, and lack of experience were significant contributors to cost overruns. Especially in Egypt, the construction sector faces unique challenges that reflect broader regional issues while highlighting local dynamics. Daoud et al. [26] found that poor project planning, a lack of skilled labor, scope changes, and payment delays were major factors contributing to cost overruns in large construction projects. Yousri et al. [27] identified 35 risk factors, including funding problems, unrealistic cost estimates, and material shortages, which further complicate cost management. Similarly, Abdelalim et al. [28,29,30] highlighted additional risks that exacerbate budget overruns, emphasizing the complexity of cost management in Egypt’s construction industry.
Fuzzy logic initially was integrated into construction risk assessment by Carr and Tah [31]. Since then, numerous researchers have either applied or modified fuzzy logic in various ways to enhance its practicality [32]. Modified fuzzy logic, along with combinations involving other methods such as the Analytical Hierarchy Process (AHP), Analytical Network Process (ANP), and Technique for Order of Preference by Similarity to Ideal Solution (TOPSIS), has gained significant attention for risk assessment in power plant projects and linear infrastructure [32,33]. The Fuzzy-AHP technique, a widely used Multi-Criteria Decision-Making (MCDM) method, can be burdensome due to the extensive pairwise comparisons required in complex projects [34]. ANP, a modified version of AHP, is particularly suited for capturing interdependencies between risks and their effects [32]. However, like AHP, ANP also demands numerous tedious pairwise comparisons. Fuzzy-TOPSIS, another frequently used MCDM method for project selection and risk assessment in complex and uncertain environments, has limitations. It does not account for attribute interrelations, and maintaining consistent weighting for attributes can be challenging [35].
Novak [36] highlighted the general limitations of fuzzy methods, emphasizing the need to consider the ambiguity and uncertainty inherent in qualitative judgments from experts who may lack sufficient knowledge or relevant experience. Moreover, developing suitable linguistic expressions for risk evaluation and appropriate aggregation rules to measure these expressions in ranking risks is critical. Rather than evaluating risks based solely on probability and impact, applying fuzzy methods to risk assessment in healthcare projects can yield more reliable results by incorporating additional criteria such as the expertise and qualifications of experts and project characteristics [9,37,38]. This broader approach contributes to a more comprehensive and in-depth understanding of the risks associated with cost overruns.
3. Research Methodology
The study first investigated relevant literature to identify possible risks of cost overruns. A structured questionnaire was subsequently distributed throughout Egypt as a representative sample from the MENA region. K-Means clustering was initially employed to group the identified factors into distinct clusters based on their probability and impact scores. These clusters then served as the basis for applying the fuzzy group decision-making approach (FGDMA), which refined the prioritization of risks through expert evaluations. Based on the results of the risk assessment, a comparative scenario was created to rank the most influential factors for the owner, consultant, and contractor. As shown in Figure 1, the following subsections provide a detailed step-by-step methodology.
4. Factors Identification
To comprehensively study cost overrun factors of construction projects, this paper used "cost overrun*", "cost escalation", "budget overrun*", "budget exceedance", "cost increase", "budget inflation", "cost acceleration", "cost increment", and "cost variation" as keywords in the ‘title’ section. Additionally, keywords were included in the 'topic' section, such as "construction project*", "construction management", "construction industry", and "construction sector". To further refine the search and focus on identifying relevant factors, this paper uses "factors", "causes", "drivers", "variables", and "reasons" in the 'topic' section to search papers from 2000 to 2024 using the Web of Science and Scopus databases.
By compiling the relevant literature and data, 405 English papers were obtained and read by the researchers to ensure that there are no invalid records. A careful manual review was conducted to eliminate any duplicate entries, resulting in the removal of 128 duplicates. The selection process followed two key inclusion criteria aligned with the research objectives. First, only peer-reviewed articles were included to ensure reliability and validity, as these undergo rigorous evaluation compared to conference papers or books. Second, the focus was on studies that ranked cost overrun factors, ensuring the selected papers not only identified the factors but also assessed their relative importance [39].
The final selection in this analysis was 64 papers from databases. From the final set of 64 papers, efforts were made to harmonize and standardize the terminology used to describe the factors, ensuring consistency and accuracy across the analysis. Finally, 48 construction project cost overrun factors were summarized, as shown in Table 1.
5. Questionnaire Design
As the first stage of creating our research questionnaires, the selected factors were discussed in the semi-structured interviews with expert engineers. A crucial stage in conducting the survey correctly was the pilot survey with expert engineers [40]. In this study, 15 expert engineers discussed the cost overrun factors collected from previous research to verify the workability of these factors in Egypt.
The surveys were separated into the following sections:
5.1. Section One: Demographic Information
Included information about the past experiences of the participants and their companies, such as job title, company size by using employees in their company, company type (client, project management firm/consultancy, contractor/subcontractor), level of education, and their years of experience in the construction projects. This is required to ensure that all the respondents involved in this study are intended.
5.2. Section Two: Survey Questions
This section was a structured type of survey to collect ratings for the final refined cost overrun factors. This section contains twenty (48) questions that illustrate the factors affecting cost overrun in construction projects. Measurement of the probability of occurrence frequency and impact of each factor was based using linguistic terms such as very low, low, medium, high, and very high. Corresponding numerical values of these linguistic terms are 1, 2, 3, 4, and 5 respectively, evaluating each factor based on both likelihood and consequence, specifically in terms of cost impact [41]. Each factor is examined twice in the same row; the first is for the probability of the factor, and the second is for the impact of the same factor.
6. Distribution & Collected Questionnaire
6.1. Questionnaire Distribution
Online questionnaires have the benefit of saving time and money in the carrying out research. The survey was sent via emails and LinkedIn to construction practitioners working in Egypt. The addressed practitioners in this survey were employees of main stakeholders in the construction field (i.e., clients, project management firm/consultancy, and contractors/subcontractors) in order to rank the cost overrun factors from different perspectives. The questionnaires were distributed with a variety of experiences, level of education, titles, and company sizes to derive a clear picture of the construction field. As a result, 369 valid questionnaires were successfully completed and collected.
6.2. Data Collected
This section presents the demographic information of the respondents. The survey questionnaires were collected from 37, 110, and 222 clients, project management firms/consultancy, and contractors/subcontractors respectively, as presented in Figure 2. In terms of the highest level of education achieved by the participants, the results indicate that 79.7% held a bachelor’s degree, 17.3% held a master’s degree, and 3% held a doctorate, as shown in Figure 3.
The size of the participants’ companies based on the number of employees in their companies was categorized in five categories, namely Micro (1-10 employees), Small (11-50 employees), Medium (51-250 employees), Large (251-1000 employees), and Large (251-1000 employees) and the number of participants related to these groups was 5, 15, 60, 85, and 204, respectively, as illustrates in Figure 4.
Furthermore, respondents for questionnaire 86 of them have 0-4 years of experience, 106 of them have 5-8 years of experience, 85 have 9-13 years of experience, 52 participants have 14-20 years of experience, and the 40 have more than 20 years’ experience in construction field, as show in Figure 5. Additionally, the respondents were chosen from a variety of participants’ titles to obtain comprehensive responses to the cost overrun factors associated with Egypt’s construction projects. Where, they were represented as illustrates in Figure 6.
7. K-Means Analysis
This section examines the K-means clustering algorithm, a vital data analytics tool known for its effectiveness and simplicity [42]. K-means clustering is a widely used and proven technique in clustering [43]. This method is particularly valuable for this research as it offers a unique perspective on the dynamics of the factors affecting cost overruns in construction projects.
To calculate the proper number of clusters (k), numerous methodologies such as the Hubert statistic, Davies Bouldin index, Dunn index, score function, elbow plot, and silhouette plot have been devised [44]. The elbow plot approach, which is renowned for its dependability [45,46], was used in this investigation to determine the cluster count.
The k-means algorithm's primary aim is to minimize the within-cluster sum-of-squares criteria, also known as cluster inertia. By showing distortion scores for a chosen number of clusters according to Equation (1), the elbow plot validates the choice of an appropriate number of clusters. The "elbow" point is the number of clusters at which WCSS is not appreciably decreased by additional. Notably, this research found that three clusters were the optimal number, as seen in Figure 7.
Where K=The total number of clusters, =The set of data points in the cluster, = A data point in the cluster, =The centroid of the cluster, and =The squared Euclidean distance between the data point and the centroid .
Figure 8 and Figure 9 provide a graphic representation of this study by listing the cost overrun factors within each cluster and displaying the network model colored by cluster. Table 2 shows these results and provides a summary of each cluster's characteristics.
Every cluster has a unique impact on risk, influencing how we should react to possible difficulties. The most significant threats are seen in Cluster 1, such as inflation (F16) and currency issues (F38), which are very likely factors to occur and have a significant impact. These are the kinds of risks that demand immediate attention and careful planning because ignoring them could seriously disrupt operations. Cluster 2 feels like the middle ground; risks such as project estimation problems (F22) and poor monitoring/controlling costs (F45) aren’t as urgent but still need consistent attention to avoid becoming bigger problems down the line. Lastly, factors in Cluster 3, while they are less likely to occur, having a backup plan is prudent since they might have a cascading impact if they do, such as Adverse Weather Conditions (F47) and Labour Availability and Skills (F05). These aren’t pressing issues right now, but they might be worth keeping an eye on in the long run. Each cluster shows us where to concentrate our attention, ensuring that we are taking care of the critical factors first while continuing to monitor the other factors
8. Model Set and Analysis (Fuzzy Group Decision-Making Approach)
Evaluate of factors affecting in complex construction projects is critical because of the complexity involved in understanding the nature of the risks, handling response evaluations of risks and subjective biases, and the relevance of the selected risk evaluation technique. Among many other fuzzy and hybrid methods, a modified fuzzy group decision making approach was applied in this study [47] because its capacity to handle the subjective biases for evaluated factors and its suitability for inference systems using limited data sets [34,48,49]. This entails participants assessing risks using the most popular probability–impact (P–I) approach [38] and their ability to judge individual factors based on their "professional competence" [50] to evaluate individual factors to increase the reliability of decision-making [37].
- The fuzzy triangular number (FTN) for the associated linguistic term is extracted following the scenarios and descriptions shown in . Triangular fuzzy numbers, which provide a three-point estimate (e.g., 0.5, 0.7, and 0.9 represent high severity) rather than an exact value. This three-point estimate for each factor allows the flexibility to set appropriate decision-making managing cost overrun risks in the project.
- Using the FTN, the following equation (2) provides a fuzzy decision matrix (FDM) for risk probability (p) or impact (i) of cost overrun for each risk factor (f):where L= lower, M= medium, and U= upper values of a risk's probability or impact cost, and n= represents the number of participants evaluating the risks.
-
Participants' judgment skills and the validity of their assessments might differ for a variety of reasons in a given situation; thus, they must be weighted accordingly. This is a function of their professional position (PP), experience years (EY), and education level (EL) [50]. The weighted judgment of each participant is included into the evaluation of crucial criteria to increase decision reliability [37]. Aboshady, Elbarkouky et al. [51] calculate the weight of each participant ( as follows:where ; ; and = each participant’s weights for PP, EY, and EL, respectively. Then to evaluate the participant’s weights, each criterion (i.e., ; ; and ) is assumed to be equal. The global weight of a participant () is calculated as [52]According to Jung et al. [50] to meet the principle aggregated fuzzy score, the global weights of all participants must equal unity.
- The FDM for each factor (f) is transformed into a weighted FDM (WFDM) by
- The fuzzy score () for each cost overrun factor is the sum of each column of the Eq. (6) matrix.
- The fuzzy risk score -which derived by risk probability and impact on cost- can be calculated using the fuzzy synthetic evaluation approach [53] as follows:Where and are fuzzy scores for probability and impact on cost for each factor, respectively. Despite traditional fuzzy if-then rules usually are typically utilized to draw conclusions about the significance of a critical factors, they have been criticized for their incapacity to address subjective biases [36]; as a result, an alternate method proposed by Xu et al. [53] is employed.
- Each factor’s level (i.e., low to very high) is defined by the defuzzification, which is calculated as [54]
9. Fuzzy Results
After applying the Fuzzy Group Decision-Making Approach (FGDMA) to the 48 selected cost overrun factors, the analysis provided a refined prioritization of risks by addressing biases and integrating stakeholder evaluations, building on K-Means clustering, which grouped factors into risk categories by probability and impact. This integration ensured a comprehensive evaluation that combined objective clustering with practical stakeholder considerations, offering a more balanced and actionable prioritization of risks. The study highlights the overall cost overrun risk scenario for Egypt's construction projects, derived from analyzing 369 responses. Financial, management, and operational difficulties emerged as the most significant risks, while external influences played a comparatively minor role, underscoring the importance of addressing systemic challenges within the industry.
The high-risk cost overrun factors found in construction projects are inflation (F16), currency issues (F38), cost of materials (F15), market fluctuations (F39), and economic challenges (F37). Of these top five factors, there are highlights of the pervasive impact of financial challenges and economic instability on project budgets. Notably, those financial factors are also present in the top 20 high-risk cost overrun factors, such as cash flows during construction (F44), financial issues by contractor (F19), and financial impediments by owner (F17), as shown in Table 4. This highlights the vital role that stable economies and prudent financial management play in guaranteeing the successful completion of building projects.
Alongside financial risks, managerial challenges also emerged as critical among the high-risk factors contributing to cost overruns. Key issues such as frequent changes in design (F02), poor project management (F46), and inadequate cost monitoring and control (F45) highlight the essential need for strong project management and well-structured planning, as outlined in Table 4. Additionally, operational challenges, including delays in material delivery (F31), execution problems (F20), and issues with material availability (F10), underscore the complexity of managing construction processes.
While external factors, such as adverse weather conditions (F47) and bureaucratic & unethical behavior (F28), are recognized, their impact is less significant compared to the more pressing systemic challenges. This analysis underscores the need for comprehensive risk management strategies that address the interconnected nature of these challenges to improve project resilience and outcomes. To effectively tackle these obstacles and ensure successful and efficient project delivery, it is essential to adopt a holistic risk management approach that accounts for the combined effects of operational challenges, managerial weaknesses, and financial constraints.
10. Sensitivity Analysis
Sensitivity analysis is an important part of risk analysis that enable prioritize critical risk factors and develop effective mitigation strategies. This study analyzed the Risk Score (RS) of top 20 risks, considering different clusters of stakeholders, to observe the sensitivities of the risks causing cost overruns from owner / client, contractor / subcontractor, and management firm / consultancy perspective in Egypt. The results from the analysis are detailed in Figure 10 and Table 5.
A tornado chart is a very useful tool for explaining the relative importance of various risks. It is a visual depiction of the model's sensitivity analysis. A plot of horizontal bars arranged in descending order represents the risk scores. When there is a positive connection, the bars move to the right; when there is a negative correlation, they move to the left.
11. Stakeholders Perspective Discussion
11.1. Contractor / Subcontractor Vs Client / Owner Perspective
The tornado graphic in Figure 11 illustrates the disparities between the client's and contractor's perceptions of the top 20 costs overrun factors. Positive differences imply that the contractor gives the factor more critical, whilst negative differences show that the client views the factor as more important than the contractor.
For instance, Design Inefficiencies (F23) shows the largest negative difference (-0.091), Delay in Design Stage (F36) has a notable negative difference (-0.086), and Frequent Changes in Design (F02) has a large difference (-0.076), meaning the client views design factors as significantly more important than the contractor. This could reflect the client’s concern about how the design stage might affect the project budget. Moderate differences, such as availability of materials (F10) (-0.066), delay in materials (F31) (-0.051), and subcontractor experience & performance (F08) (-0.052), show that the client prioritizes these issues more than the contractor, possibly due to their direct impact on cost and schedule planning for the project.
On the other hand, positive differences like Wastage of Materials on Site (F24) have a positive difference (+0.047), implying that the contractor is greatly affected by waste on site, leading to an increase in the planned budget. The differences for factor (F18) Delayed Payments by Owner for Contractors (+0.03) show the extent to which the contractor is focused on his payments and that the owner's delay has a significant impact on the project.
There are also areas where the contractor and client are largely aligned. Factors like inflation (F16) and cost of materials (F15) show minimal differences, indicating that both parties recognize the impact of economic challenges on the project. Similarly, market fluctuations (F39) and economic challenges (F37) exhibit small differences, reflecting a shared understanding of the broader financial risks involved in the project.
Overall, the differences between owners/clients and contractors/subcontractors emphasize the need for improved communication and clearer alignment of priorities, particularly regarding design and financial risks. Ensuring transparency during the design phase can minimize frequent changes, while adopting proactive financial planning and monitoring mechanisms can help contractors manage cost-related challenges. Bridging these gaps can enhance collaboration and reduce delays, ultimately supporting the successful delivery of projects.
11.2. Contractor / Subcontractor Vs Management Firm / Consultancy Perspective
The tornado chart shown in Figure 12 compares the perceptions of the contractor and the consultancy regarding the importance of various factors affecting the project. Negative differences indicate that the consultancy considers a factor more critical than the contractor, while positive differences show the opposite.
The most significant positive difference is for Wastage of Materials on Site (F24) (+0.101), highlighting that the contractor places far greater importance on managing material waste than the consultancy. This factor also ranked as the most significant for the contractor in the comparison between the contractor and the client, which confirms the contractor’s consistent prioritization of resource optimization and cost minimization across different perspectives, which is critical from an operational perspective. Additionally, factors like Poor Project Management (F46) and Project Estimation Problems (F22), although it is less obvious, further emphasize the contractor’s concern with managerial efficiency to mitigate potential risks to lead project cost overrun.
In contrast, several factors show negative differences, indicating higher importance for the consultancy. For example, Frequent Changes in Design (F02) (-0.049) and Availability of Materials (F10) (-0.042) are prioritized more by the consultancy. This reflects the consultancy's concern about how design stage and resources management may impact the project cost overrun. Interestingly, these priorities align closely with those of the client, as both the consultancy and the client place significant emphasis on those factors. Similarly, Currency Issues (F38) (-0.036) and Delayed Decision-Making by Owners (F25) (-0.028) also have negative differences, reflecting the consultancy’s focus on financial stability and decision efficiency, which are essential for maintaining project timelines.
Some factors show minimal differences negative or positive, such as Contractor Experience (F07), Poor Monitoring / Controlling Cost (F45), Cost of Materials (F15), and Cash Flows during Construction (F44). These alignments mean that both parties share a similar understanding of their impact on the project and are likely to collaborate effectively in addressing them.
Overall, the differences between contractors/subcontractors and management firms/consultants highlight critical areas where alignment is necessary to mitigate cost overruns. Enhancing cost control mechanisms and optimizing resource allocation are essential for addressing material waste and improving project management practices. Similarly, leveraging advanced analytical tools can support consultants in providing data-driven insights that align with contractor priorities. Addressing these differences fosters better coordination and reduces the likelihood of disputes arising from budget overruns.
11.3. Client / Owner Vs Management Firm / Consultancy Perspective
Figure 13 compares the priorities of the client / owner and the management firm / consultancy regarding top 20 project cost overrun factors. Positive differences indicate that the client views the factor as more critical than the consultancy, while negative differences show that the consultancy assigns higher importance.
The most significant positive difference is for Design Inefficiencies (F23) (+0.070) and Delay in Design Stage (F36) (+0.067), both highlighting the client’s strong focus on the design phase. This analysis confirms the client’s prioritization of ensuring efficiency and timeliness in design, recognizing its critical impact on project timelines and costs. In addition to the design phase, the client also places notable importance on factors such as Subcontractor Experience & Performance (F08), Contractor Experience (F07), and Contractual Ambiguity and Contradiction (F13). These factors reflect the client’s concern with ensuring that all parties involved in the project are competent, well-coordinated, and operating under clear and consistent contractual terms to minimize risks and enhance project performance.
In contrast, the consultancy places slightly more emphasis on factors like Cost of Materials (F15) (-0.019) and Financial Issues by Contractor (F19) (-0.020). This suggests that the consultancy is more focused on addressing specific financial risks and ensuring efficient resource allocation. Similarly, Currency Issues (F38) (-0.001) and Market Fluctuations (F39) (-0.008) also have negative differences, reflecting the consultancy’s focus on financial stability and external risks, which are essential for maintaining project timelines.
Some factors show minimal differences, such as Increase in Additional Work Orders (F03) (0.014) and Planning and Scheduling Issues (F32) (-0.007). These alignments suggest that both parties recognize the importance of managing additional work orders and addressing scheduling issues, reflecting a shared understanding of their role in maintaining project timelines and minimizing disruptions.
Overall, the relationship between clients/owners and management firms/consultancy highlights the need for enhanced collaboration to align strategic goals with operational execution. Clients benefit from clear and timely information provided by management firms, enabling better decision-making, while consultancies should focus on delivering actionable insights and proactive risk management strategies. Strengthening this partnership can ensure smoother project execution, mitigate risks, and support the achievement of project objectives within budget and schedule.
12. Conclusion
This study provides a detailed evaluation of cost overrun factors in construction projects across the MENA region, Egypt as a model by employing advanced analytical methodologies, including K-means clustering, the Fuzzy Group Decision-Making Approach (FGDMA), sensitivity analysis, and Tornado charts.
A systematic literature review of 405 research papers from Web of Science and Scopus databases, spanning the years 2000 to 2024, was conducted. This yielded a final selection of 64 relevant studies. From these, 48 distinct cost overrun factors were identified and analyzed. Key factors include inflation (F16), currency issues (F38), cost of materials (F15), market fluctuations (F39), and economic challenges (F37). These were assessed using a structured questionnaire completed by 369 construction practitioners, distributed among 37 clients, 110 project management firms/consultants, and 222 contractors/subcontractors in the region.
The K-means clustering analysis grouped these factors into four distinct clusters based on their probability and impact scores: Cluster 1 (High Risk): Includes inflation (F16), currency issues (F38), cost of materials (F15), market fluctuations (F39), and economic challenges (F37). These factors exhibit the highest probabilities (0.61–0.67) and impacts (0.66–0.73), emphasizing their critical influence on cost overruns. Cluster 2 (Medium Risk): Encompasses 33 critical factors. These factors have moderate probabilities (0.47–0.58) and impacts (0.56–0.65). Cluster 3 (Low Risk): Includes 10 factors with the lowest probabilities (0.33–0.49) and impacts (0.43–0.58).
The Fuzzy Group Decision-Making Approach effectively addressed subjective biases, providing weighted evaluations of each factor based on participant expertise. Results highlighted those financial factors, such as inflation and currency instability, pose the most significant risks, underscoring the need for economic stability and robust financial planning. Managerial factors, including poor project management (F46) and frequent design changes (F02), also play a critical role, while operational challenges, such as material delays (F31) and execution problems (F20), add further complexity.
The Tornado charts provided insights into stakeholder-specific perspectives, revealing alignment and discrepancies among clients, contractors, and consultants. For instance, clients prioritized design-related factors like inefficiencies (F23) and delays (F36), while contractors emphasized operational issues such as material wastage (F24) and delayed payments (F18).
This paper offers a comprehensive analysis of cost overrun factors in Egypt construction projects, combining literature review, clustering techniques, and decision-making approaches. By comparing and ranking the identified challenges, the study highlights the most critical financial, managerial, and operational risks. This structured evaluation provides stakeholders with actionable insights to prioritize efforts and address the most impactful factors, contributing to improved cost control and project outcomes in a complex construction environment.
Author Contributions
Conceptualization, Ahmed Mohammed Abdelalim and Mohamed Tantawy; Data curation, Ahmed Mohammed Abdelalim, Maram Salem and Mohamed Tantawy; Formal analysis, Ahmed Mohammed Abdelalim, Maram Salem and Mohamed Tantawy; Funding acquisition, Ahmed Mohammed Abdelalim, Mohamed Salem and Manal Al-Adwani; Investigation, Ahmed Mohammed Abdelalim, Maram Salem, Mohamed Salem and Mohamed Tantawy; Methodology, Ahmed Mohammed Abdelalim, Maram Salem and Mohamed Tantawy; Project administration, Ahmed Mohammed Abdelalim; Resources, Ahmed Mohammed Abdelalim; Software, Ahmed Mohammed Abdelalim, Maram Salem and Mohamed Tantawy; Supervision, Ahmed Mohammed Abdelalim and Mohamed Tantawy; Validation, Ahmed Mohammed Abdelalim, Maram Salem, Mohamed Salem, Manal Al-Adwani and Mohamed Tantawy; Visualization, Ahmed Mohammed Abdelalim, Maram Salem, Mohamed Salem, Manal Al-Adwani and Mohamed Tantawy; Writing – original draft, Ahmed Mohammed Abdelalim, Maram Salem and Mohamed Tantawy; Writing – review & editing, Ahmed Mohammed Abdelalim, Mohamed Salem, Manal Al-Adwani and Mohamed Tantawy.
References
- A. Gouda Mohamed, F. K. Alqahtani, M. Sherif, and S. M. El-Shamie, “Scrutinizing the adoption of smart contracts in the MENA Region’s Construction Industry,” Journal of Asian Architecture and Building Engineering, Mar. 2024. [CrossRef]
- H. M. Ertuğrul and B. Pirgaip, “The nexus between construction investment and economic development: evidence from MENA countries,” Construction Management and Economics, vol. 39, no. 11, pp. 932–947, 2021. [CrossRef]
- F. A. Rojas Cama and N. Emara, “Financial inclusion and gross capital formation: A sectoral analysis approach for the MENA region and EMs,” International Review of Financial Analysis, vol. 79, p. 101993, Jan. 2022. [CrossRef]
- “World Bank: Middle East and North Africa Economic Update — October 2024.” Accessed: Dec. 31, 2024. [Online]. Available: https://www.worldbank.org/en/region/mena/publication/middle-east-and-north-africa-economic-update.
- S. Amini, A. Rezvani, M. Tabassi, and S. S. Malek Sadati, “Causes of cost overruns in building construction projects in Asian countries; Iran as a case study,” Engineering, Construction and Architectural Management, vol. 30, no. 7, pp. 2739–2766, Aug. 2023. [CrossRef]
- S. Melaku Belay, S. Tilahun, M. Yehualaw, J. Matos, H. Sousa, and E. T. Workneh, “Analysis of Cost Overrun and Schedule Delays of Infrastructure Projects in Low Income Economies: Case Studies in Ethiopia,” Advances in Civil Engineering, vol. 2021, no. 1, p. 4991204, Jan. 2021. [CrossRef]
- M. Enrica, H. Purba, and A. Purba, “Risks Leading to Cost Overrun in Construction Projects: A Systematic Literature Review,” Advance Researches in Civil Engineering, vol. Vol.3, No.1, no. 2645–7229, pp. 43–60, Jan. 2021. [CrossRef]
- A. M. Kamaruddeen, C. F. Sung, and W. Wahi, “A study on factors causing cost overrun of construction projects in Sarawak, Malaysia,” Civil Engineering and Architecture, vol. 8, no. 3, pp. 191–199, Jun. 2020. [CrossRef]
- M. S. Islam, M. Salem, M. Tantawy, and M. Salah, “Cost Overrun Risk Assessment for Healthcare Projects: A Modified Fuzzy Group Decision-Making Approach,” J Constr Eng Manag, vol. 150, no. 12, p. 04024168, Sep. 2024. [CrossRef]
- F. Arif, S. H. Lodi, and N. Azhar, “Factors influencing accuracy of construction project cost estimates in Pakistan: Perception and reality,” International Journal of Construction Management, vol. 15, no. 1, pp. 59–70, Jan. 2015. [CrossRef]
- A. M. Abdelalim, A. Essawy, A. A. Alnaser, A. Shibeika, and A. Sherif, “Digital Trio: Integration of BIM–EIR–IoT for Facilities Management of Mega Construction Projects,” Sustainability 2024, Vol. 16, Page 6348, vol. 16, no. 15, p. 6348, Jul. 2024. [CrossRef]
- M. Abdel-Monem, K. T. Alshaer, and K. El-Dash, “Assessing Risk Factors Affecting the Accuracy of Conceptual Cost Estimation in the Middle East,” Buildings 2022, Vol. 12, Page 950, vol. 12, no. 7, p. 950, Jul. 2022. [CrossRef]
- “PMBOK Guide | Project Management Institute.” Accessed: Dec. 31, 2024. [Online]. Available: https://www.pmi.org/standards/pmbok.
- A. M. Abdelalim, M. Abdel, and H. Hassanen, “Risk Identification and Assessment of Mega Industrial Projects in Egypt,” International Journal of Management and Commerce Innovations, vol. 10, pp. 187–199, 2022. [CrossRef]
- M. S. B. A. Abd El-Karim, O. A. Mosa El Nawawy, and A. M. Abdel-Alim, “Identification and assessment of risk factors affecting construction projects,” HBRC Journal, vol. 13, no. 2, pp. 202–216, Aug. 2017. [CrossRef]
- S. M. E. Sepasgozar, A. M. Costin, R. Karimi, S. Shirowzhan, E. Abbasian, and J. Li, “BIM and Digital Tools for State-of-the-Art Construction Cost Management,” Buildings 2022, Vol. 12, Page 396, vol. 12, no. 4, p. 396, Mar. 2022. [CrossRef]
- A. M. Abdelalim, M. Abdel, and H. Hassanen, “A Proposed Approach for a Balanced Construction Contract for Mega Industrial Projects in Egypt,” International Journal of Management and Commerce Innovations, vol. 10, pp. 217–229, 2022. [CrossRef]
- M. A. Ashtari, R. Ansari, E. Hassannayebi, and J. Jeong, “Cost Overrun Risk Assessment and Prediction in Construction Projects: A Bayesian Network Classifier Approach,” Buildings 2022, Vol. 12, Page 1660, vol. 12, no. 10, p. 1660, Oct. 2022. [CrossRef]
- W. Xie, B. Deng, Y. Yin, X. Lv, and Z. Deng, “Critical Factors Influencing Cost Overrun in Construction Projects: A Fuzzy Synthetic Evaluation,” Buildings, vol. 12, no. 11, Nov. 2022. [CrossRef]
- A. A. Chadee, X. T. Chadee, I. Ray, A. Mwasha, and H. H. Martin, “When Parallel Schools of Thought Fail to Converge: The Case of Cost Overruns in Project Management,” Buildings 2021, Vol. 11, Page 321, vol. 11, no. 8, p. 321, Jul. 2021. [CrossRef]
- A. M. Abdelalim, R. Al-Sabah, M. Salem, S. O. Said, M. Tantawy, and M. R. Ezz Al-Regal, “Variations and Claims in International Construction Projects in the MENA Region from the Last Decade,” Buildings 2024, Vol. 14, Page 2496, vol. 14, no. 8, p. 2496, Aug. 2024. [CrossRef]
- J. A. Alsuliman, “Causes of delay in Saudi public construction projects,” Alexandria Engineering Journal, vol. 58, no. 2, pp. 801–808, Jun. 2019. [CrossRef]
- G. Bekr, “Causes of Delay in Public Construction Project in Iraq,” Jordon Journal of Civil Engineering, vol. Volume 9, No.2, 2016, Accessed: Nov. 08, 2024. [Online]. Available: https://platform.almanhal.com/Files/Articles/83746.
- N. Al-Hazim, Z. A. Salem, and H. Ahmad, “Delay and Cost Overrun in Infrastructure Projects in Jordan,” Procedia Eng, vol. 182, pp. 18–24, 2017. [CrossRef]
- P. A. Koushki, K. Al-Rashid, and N. Kartam, “Delays and cost increases in the construction of private residential projects in Kuwait,” Construction Management and Economics, vol. 23, no. 3, pp. 285–294, Mar. 2005. [CrossRef]
- A. O. Daoud, M. El Hefnawy, and H. Wefki, “Investigation of critical factors affecting cost overruns and delays in Egyptian mega construction projects,” Alexandria Engineering Journal, vol. 83, pp. 326–334, Nov. 2023. [CrossRef]
- Yousri, E.; Sayed, A.E.B.; Farag, M.A.M.; Abdelalim, A.M. Risk Identification of Building Construction Projects in Egypt. Buildings 2023, 13, 1084. [CrossRef]
- R. Khedr and A. M. Abdelalim, “The Impact of Strategic Management on Project`s Performance of Construction Firms in Egypt,” 2021. [Online]. Available: www.researchpublish.com.
- R. Khedr and A. M. Abdelalim, “Predictors for the Success and Survival of Construction Firms in Egypt,” 2021. [Online]. Available: www.researchpublish.com.
- S. Farag and A. M. Abdelalim, “CONSTRUCTION CONTRACTS’ PRICING ACCORDING TO CONTRACTUAL PROVISIONS AND RISK ALLOCATION,” 2023. [Online]. Available: https://www.researchgate.net/publication/370322416.
- V. Carr and J. H. M. Tah, “A fuzzy approach to construction project risk assessment and analysis: construction project risk management system,” Advances in Engineering Software, vol. 32, no. 10–11, pp. 847–857, Oct. 2001. [CrossRef]
- M. S. Islam, M. P. Nepal, M. Skitmore, and M. Attarzadeh, “Current research trends and application areas of fuzzy and hybrid methods to the risk assessment of construction projects,” Advanced Engineering Informatics, vol. 33, pp. 112–131, Aug. 2017. [CrossRef]
- A. R. Fayek, “Fuzzy Logic and Fuzzy Hybrid Techniques for Construction Engineering and Management,” J Constr Eng Manag, vol. 146, no. 7, p. 04020064, Jul. 2020. [CrossRef]
- S. Ebrahimnejad, S. M. Mousavi, R. Tavakkoli-Moghaddam, H. Hashemi, and B. Vahdani, “A novel two-phase group decision making approach for construction project selection in a fuzzy environment,” Appl Math Model, vol. 36, no. 9, pp. 4197–4217, Sep. 2012. [CrossRef]
- M. Velasquez and P. T. Hester, “An Analysis of Multi-Criteria Decision Making Methods,” International Journal of Operations Research, vol. 10, no. 2, pp. 56–66, 2013.
- V. Novák, “Reasoning about mathematical fuzzy logic and its future,” Fuzzy Sets Syst, vol. 192, pp. 25–44, Apr. 2012. [CrossRef]
- G. Kabir, R. Sadiq, and S. Tesfamariam, “A fuzzy Bayesian belief network for safety assessment of oil and gas pipelines,” Structure and Infrastructure Engineering, vol. 12, no. 8, pp. 874–889, Aug. 2016. [CrossRef]
- A. Taroun, “Towards a better modelling and assessment of construction risk: Insights from a literature review,” International Journal of Project Management, vol. 32, no. 1, pp. 101–115, Jan. 2014. [CrossRef]
- Abdelalim, A.M.; Salem, M.; Salem, M.; Al-Adwani, M.; Tantawy, M. An Analysis of Factors Contributing to Cost Overruns in the Global Construction Industry. Buildings 2025, 15, 18. [CrossRef]
- S. Karthick, S. Kermanshachi, and K. Loganathan, “Impact of Construction Workers’ Physical Health and Respiratory Issues in Hot Weather: A Pilot Study,” Tran-SET 2022 - Proceedings of the Tran-SET Conference 2022, pp. 135–145, 2022. [CrossRef]
- Y. Li and X. Wang, “Risk assessment for public–private partnership projects: using a fuzzy analytic hierarchical process method and expert opinion in China,” J Risk Res, vol. 21, no. 8, pp. 952–973, Aug. 2018. [CrossRef]
- Abdelalim, A.M.; Al-Sabah, R.; Salem, M.; Said, S.O.; Tantawy, M.; Ezz Al-Regal, M.R. Variations and Claims in International Construction Projects in the MENA Region from the Last Decade. Buildings 2024, 14, 2496. [CrossRef]
- R. Ostrovsky, Y. Rabani, L. J. Schulman, and C. Swamy, “The effectiveness of lloyd-type methods for the k-means problem,” Journal of the ACM (JACM), vol. 59, no. 6, Jan. 2013. [CrossRef]
- S. G. S. Pai, M. Sanayei, and I. F. C. Smith, “Model-Class Selection Using Clustering and Classification for Structural Identification and Prediction,” Journal of Computing in Civil Engineering, vol. 35, no. 1, p. 04020051, Sep. 2020. [CrossRef]
- C. Yuan and H. Yang, “Research on K-Value Selection Method of K-Means Clustering Algorithm,” J 2019, Vol. 2, Pages 226-235, vol. 2, no. 2, pp. 226–235, Jun. 2019. [CrossRef]
- W. Medhat, H. Abdelkhalek, and A. M. Abdelalim, “A Comparative Study of the International Construction Contract (FIDIC Red Book 1999) and the Domestic Contract in Egypt (the Administrative Law 182 for the year 2018)”. [CrossRef]
- M. S. Islam, M. P. Nepal, and M. Skitmore, “Modified Fuzzy Group Decision-Making Approach to Cost Overrun Risk Assessment of Power Plant Projects,” J Constr Eng Manag, vol. 145, no. 2, Feb. 2019. [CrossRef]
- Y. M. Wang and T. M. S. Elhag, “A fuzzy group decision making approach for bridge risk assessment,” Comput Ind Eng, vol. 53, no. 1, pp. 137–148, Aug. 2007. [CrossRef]
- F. E. Boran, S. Genç, M. Kurt, and D. Akay, “A multi-criteria intuitionistic fuzzy group decision making for supplier selection with TOPSIS method,” Expert Syst Appl, vol. 36, no. 8, pp. 11363–11368, Oct. 2009. [CrossRef]
- J. H. Jung, D. Y. Kim, and H. K. Lee, “The computer-based contingency estimation through analysis cost overrun risk of public construction project,” KSCE Journal of Civil Engineering, vol. 20, no. 4, pp. 1119–1130, May 2016. [CrossRef]
- A. M. Aboshady, M. M. G. Elbarkouky, and M. M. Marzouk, “A fuzzy risk management framework for the egyptian real estate development projects,” AEI 2013: Building Solutions for Architectural Engineering - Proceedings of the 2013 Architectural Engineering National Conference, pp. 343–352, 2013. [CrossRef]
- E. E. Ameyaw, A. P. C. Chan, D. G. Owusu-Manu, and E. Coleman, “A fuzzy model for evaluating risk impacts on variability between contract sum and final account in government-funded construction projects,” Journal of Facilities Management, vol. 13, no. 1, pp. 45–69, Feb. 2015. [CrossRef]
- Y. Xu, J. F. Y. Yeung, A. P. C. Chan, D. W. M. Chan, S. Q. Wang, and Y. Ke, “Developing a risk assessment model for PPP projects in China — A fuzzy synthetic evaluation approach,” Autom Constr, vol. 19, no. 7, pp. 929–943, Nov. 2010. [CrossRef]
- M. Abdelgawad and A. R. Fayek, “Risk Management in the Construction Industry Using Combined Fuzzy FMEA and Fuzzy AHP,” J Constr Eng Manag, vol. 136, no. 9, pp. 1028–1036, Feb. 2010. [CrossRef]
Figure 1.
Research Methodology.
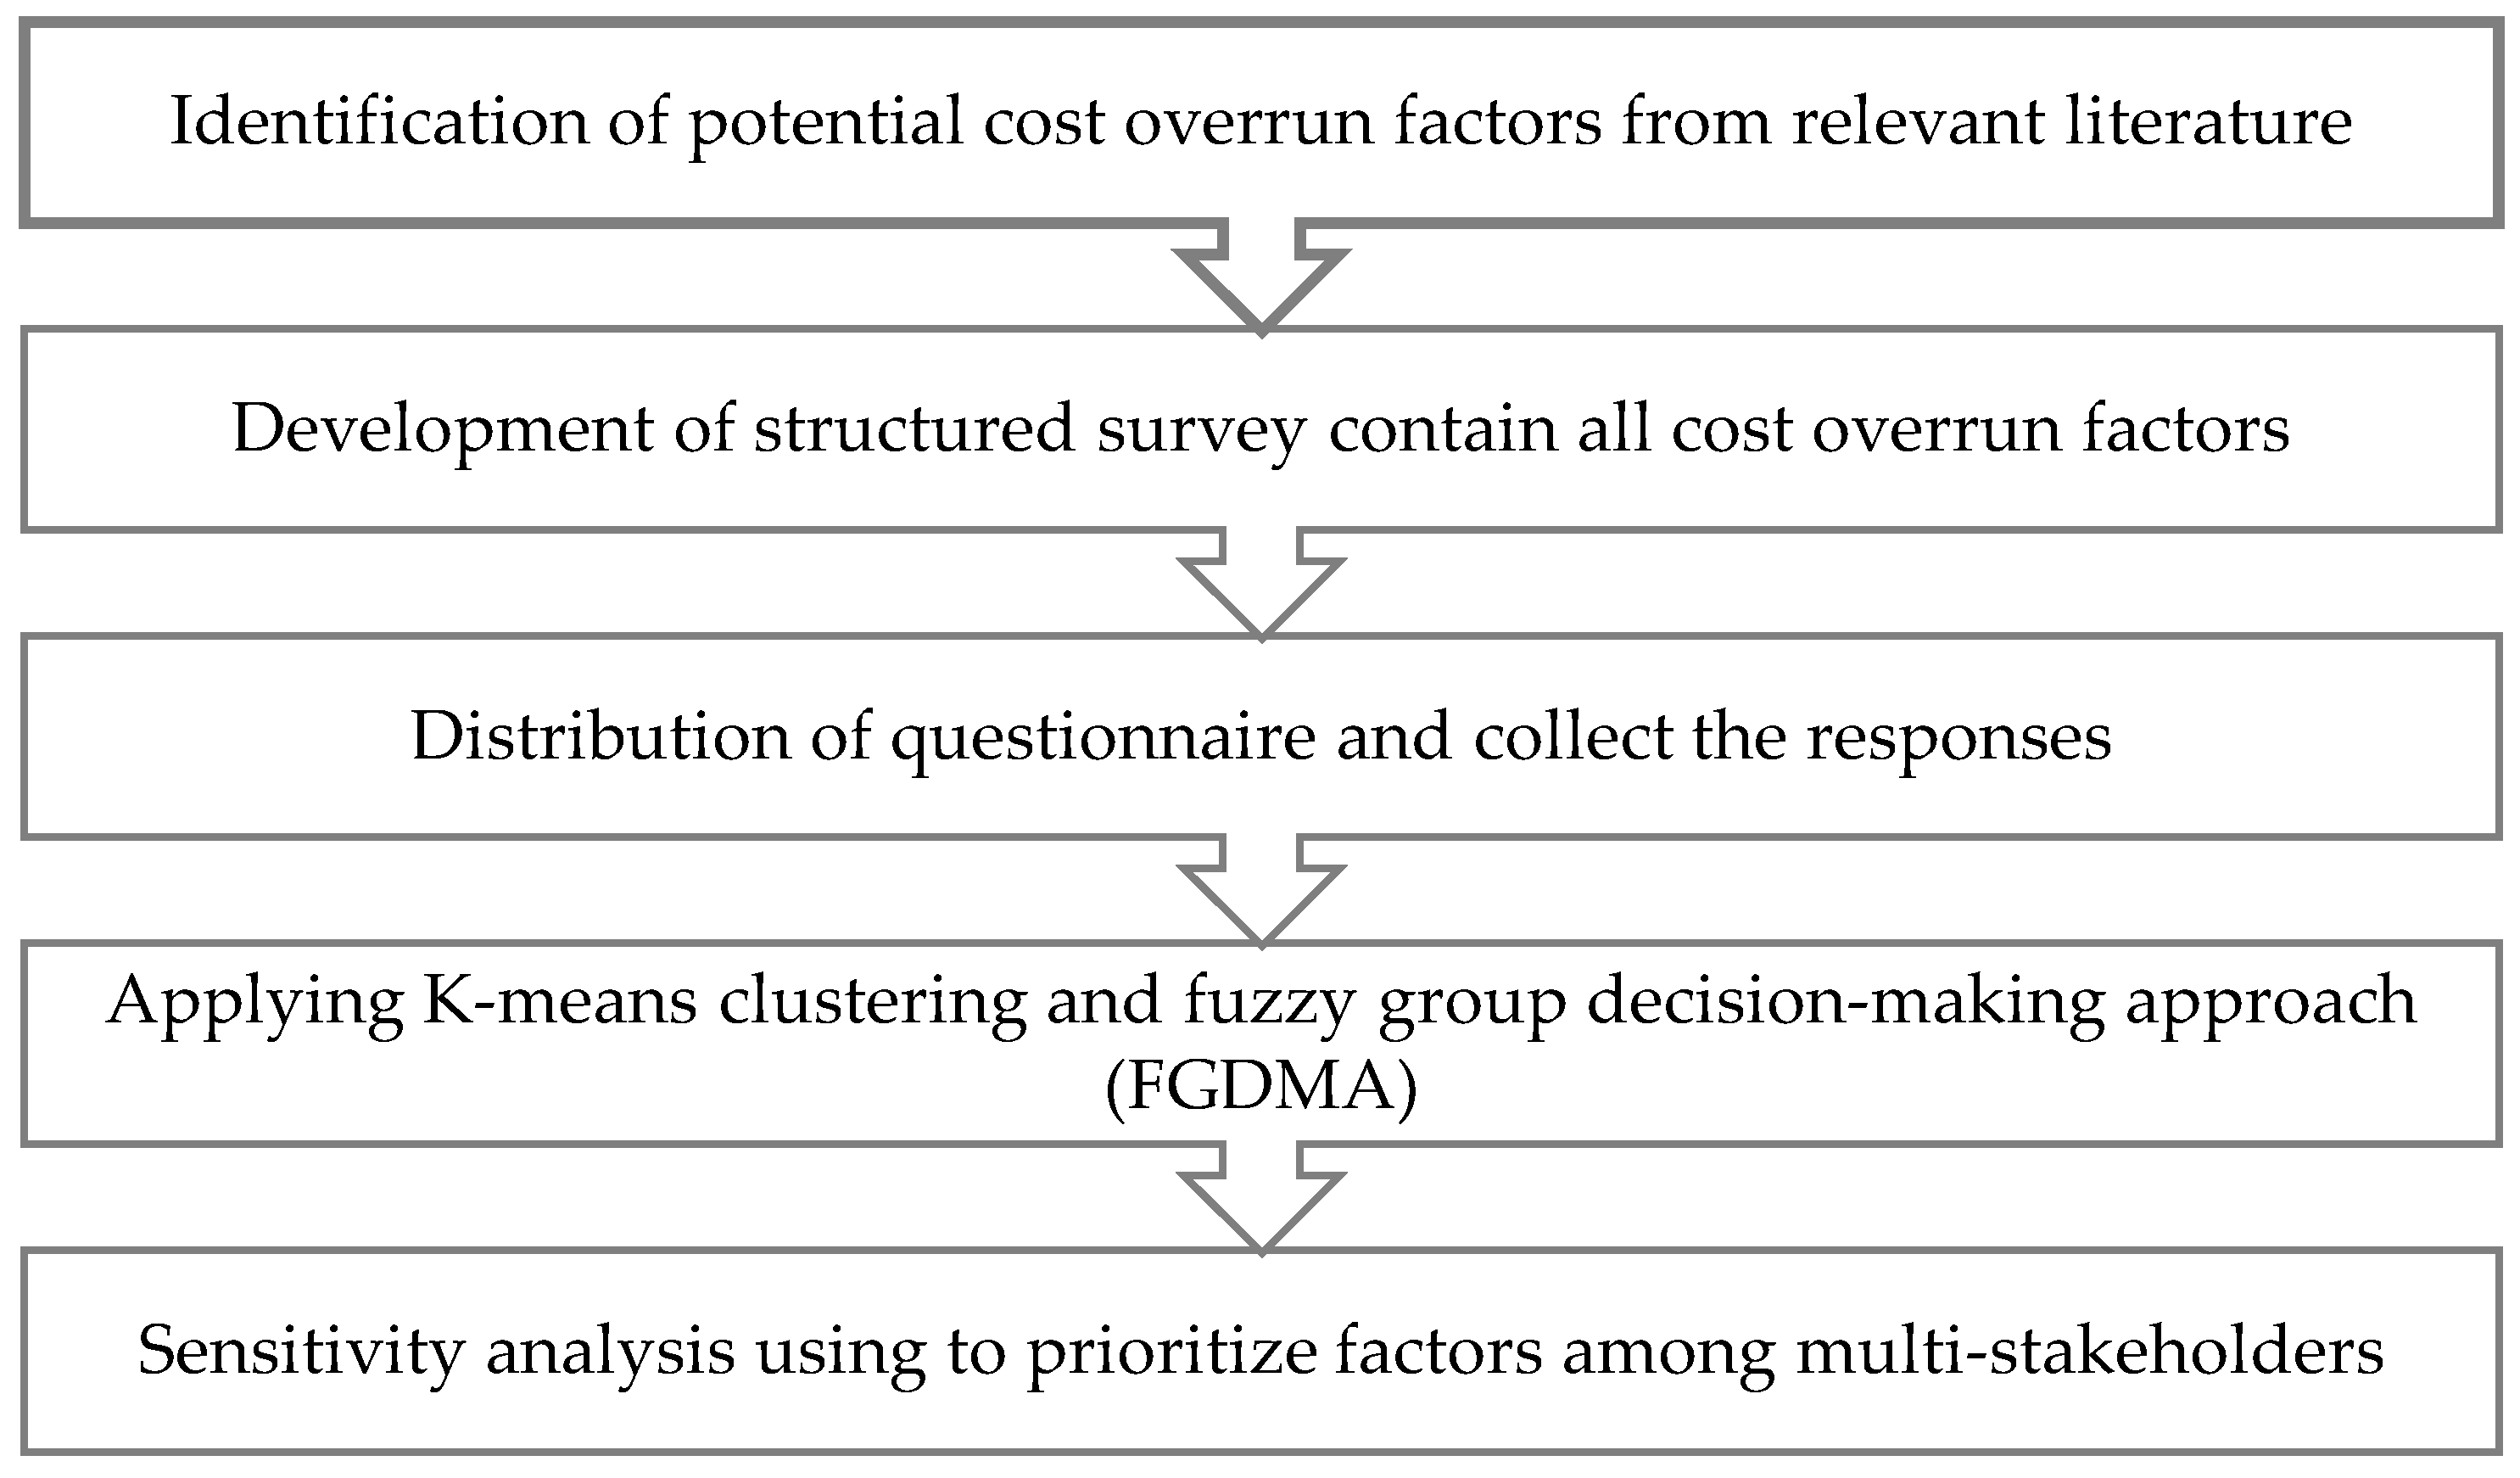
Figure 2.
Distribution of the Respondents According to Stakeholder.
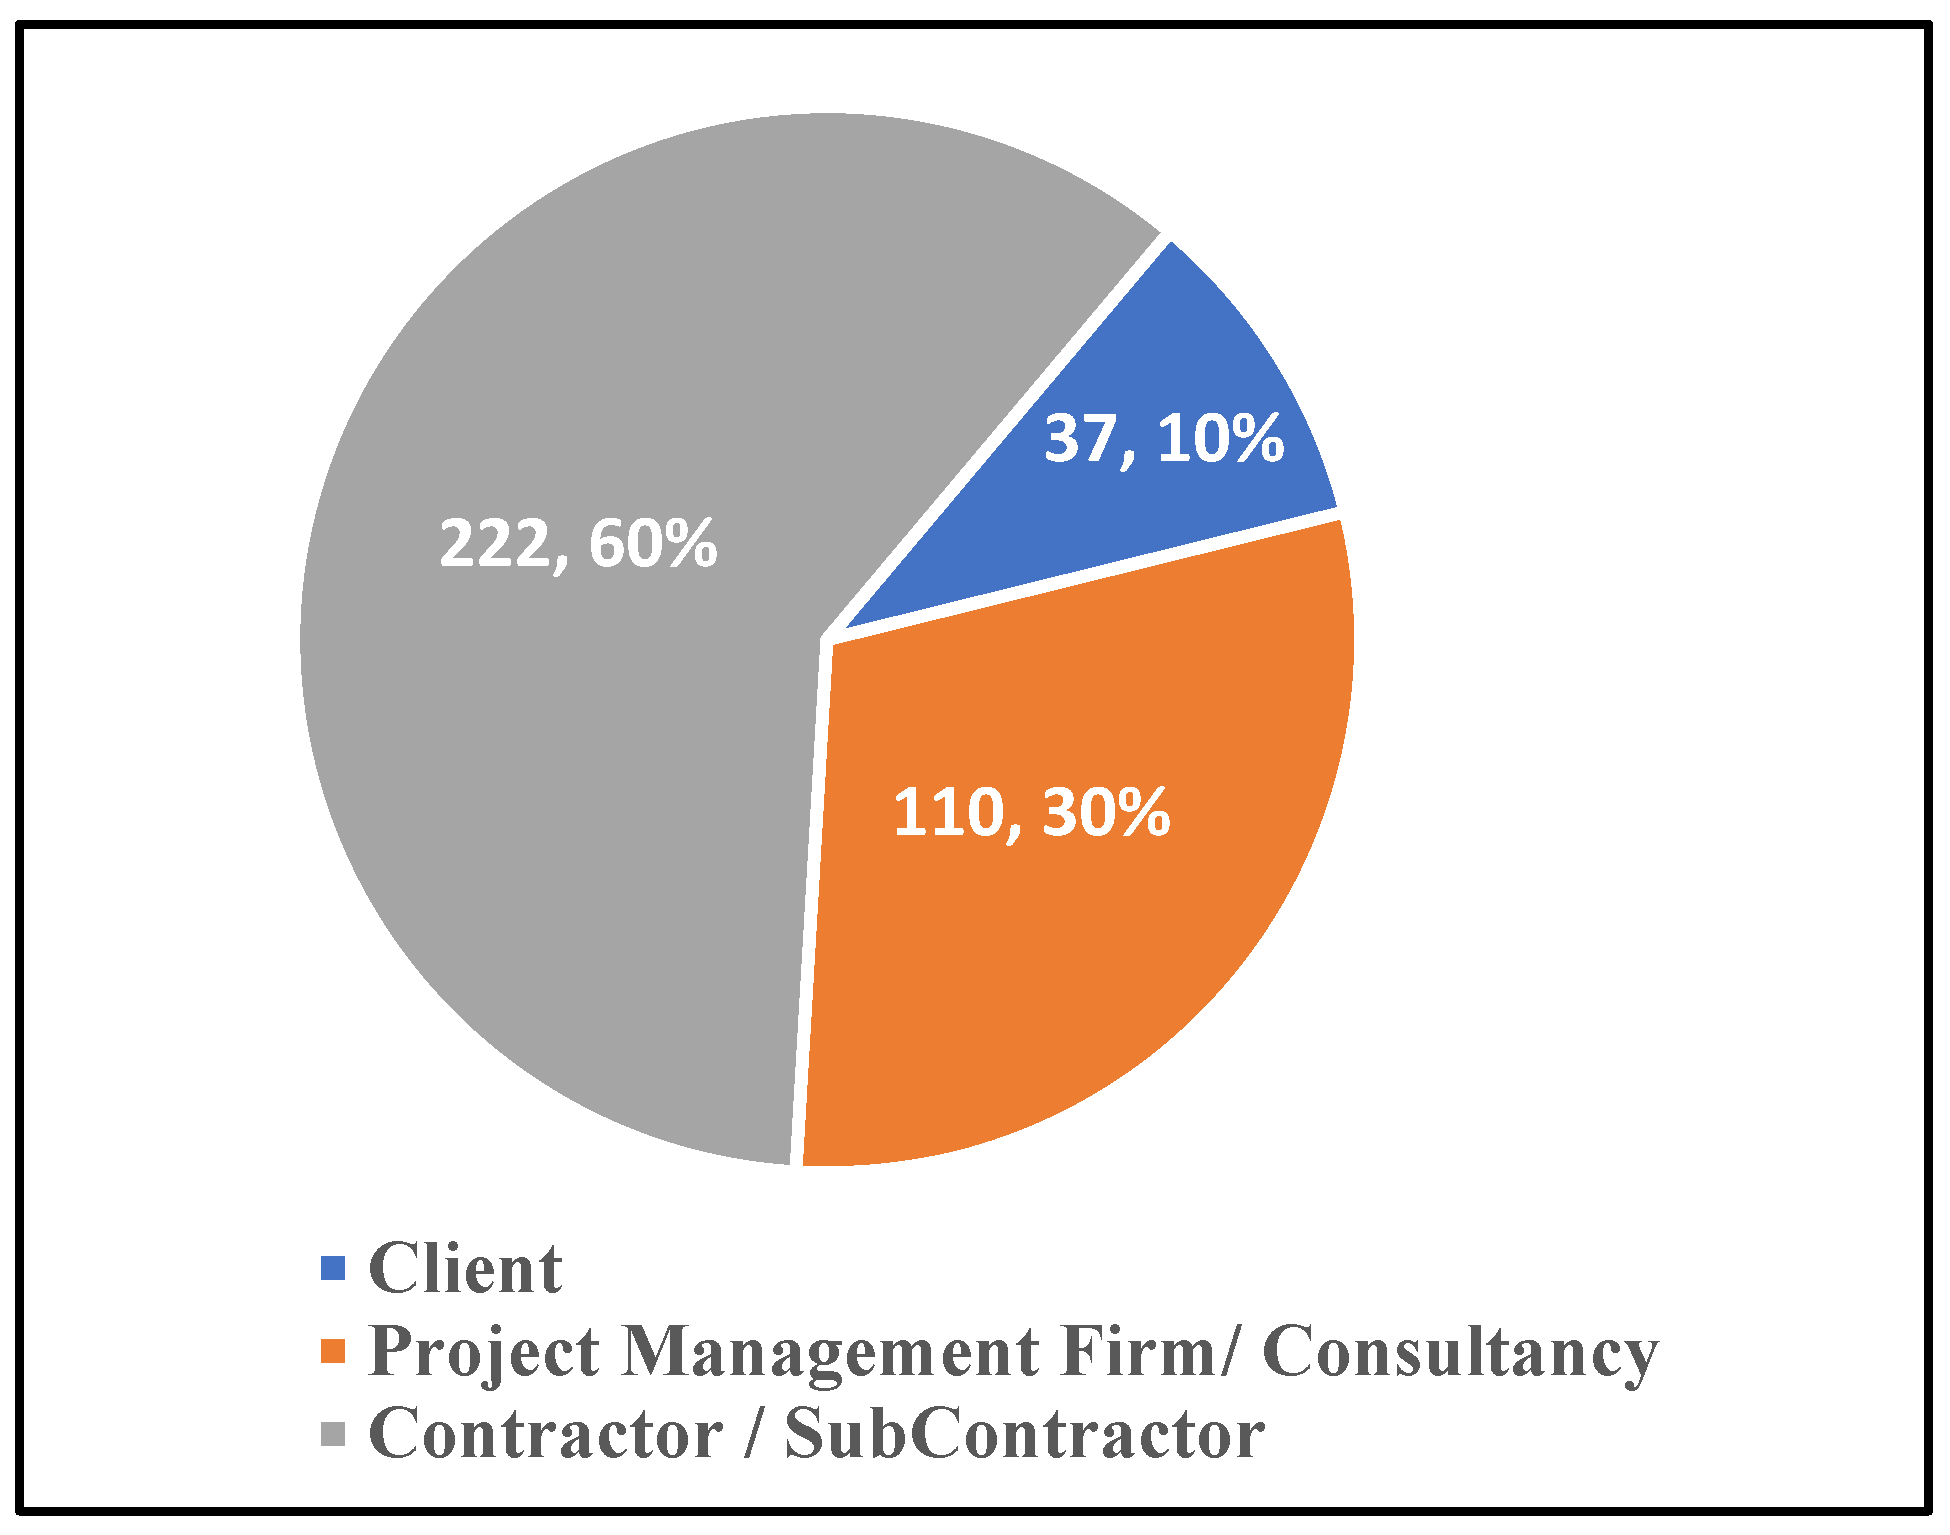
Figure 3.
Distribution of the Respondents According to Level of Education.
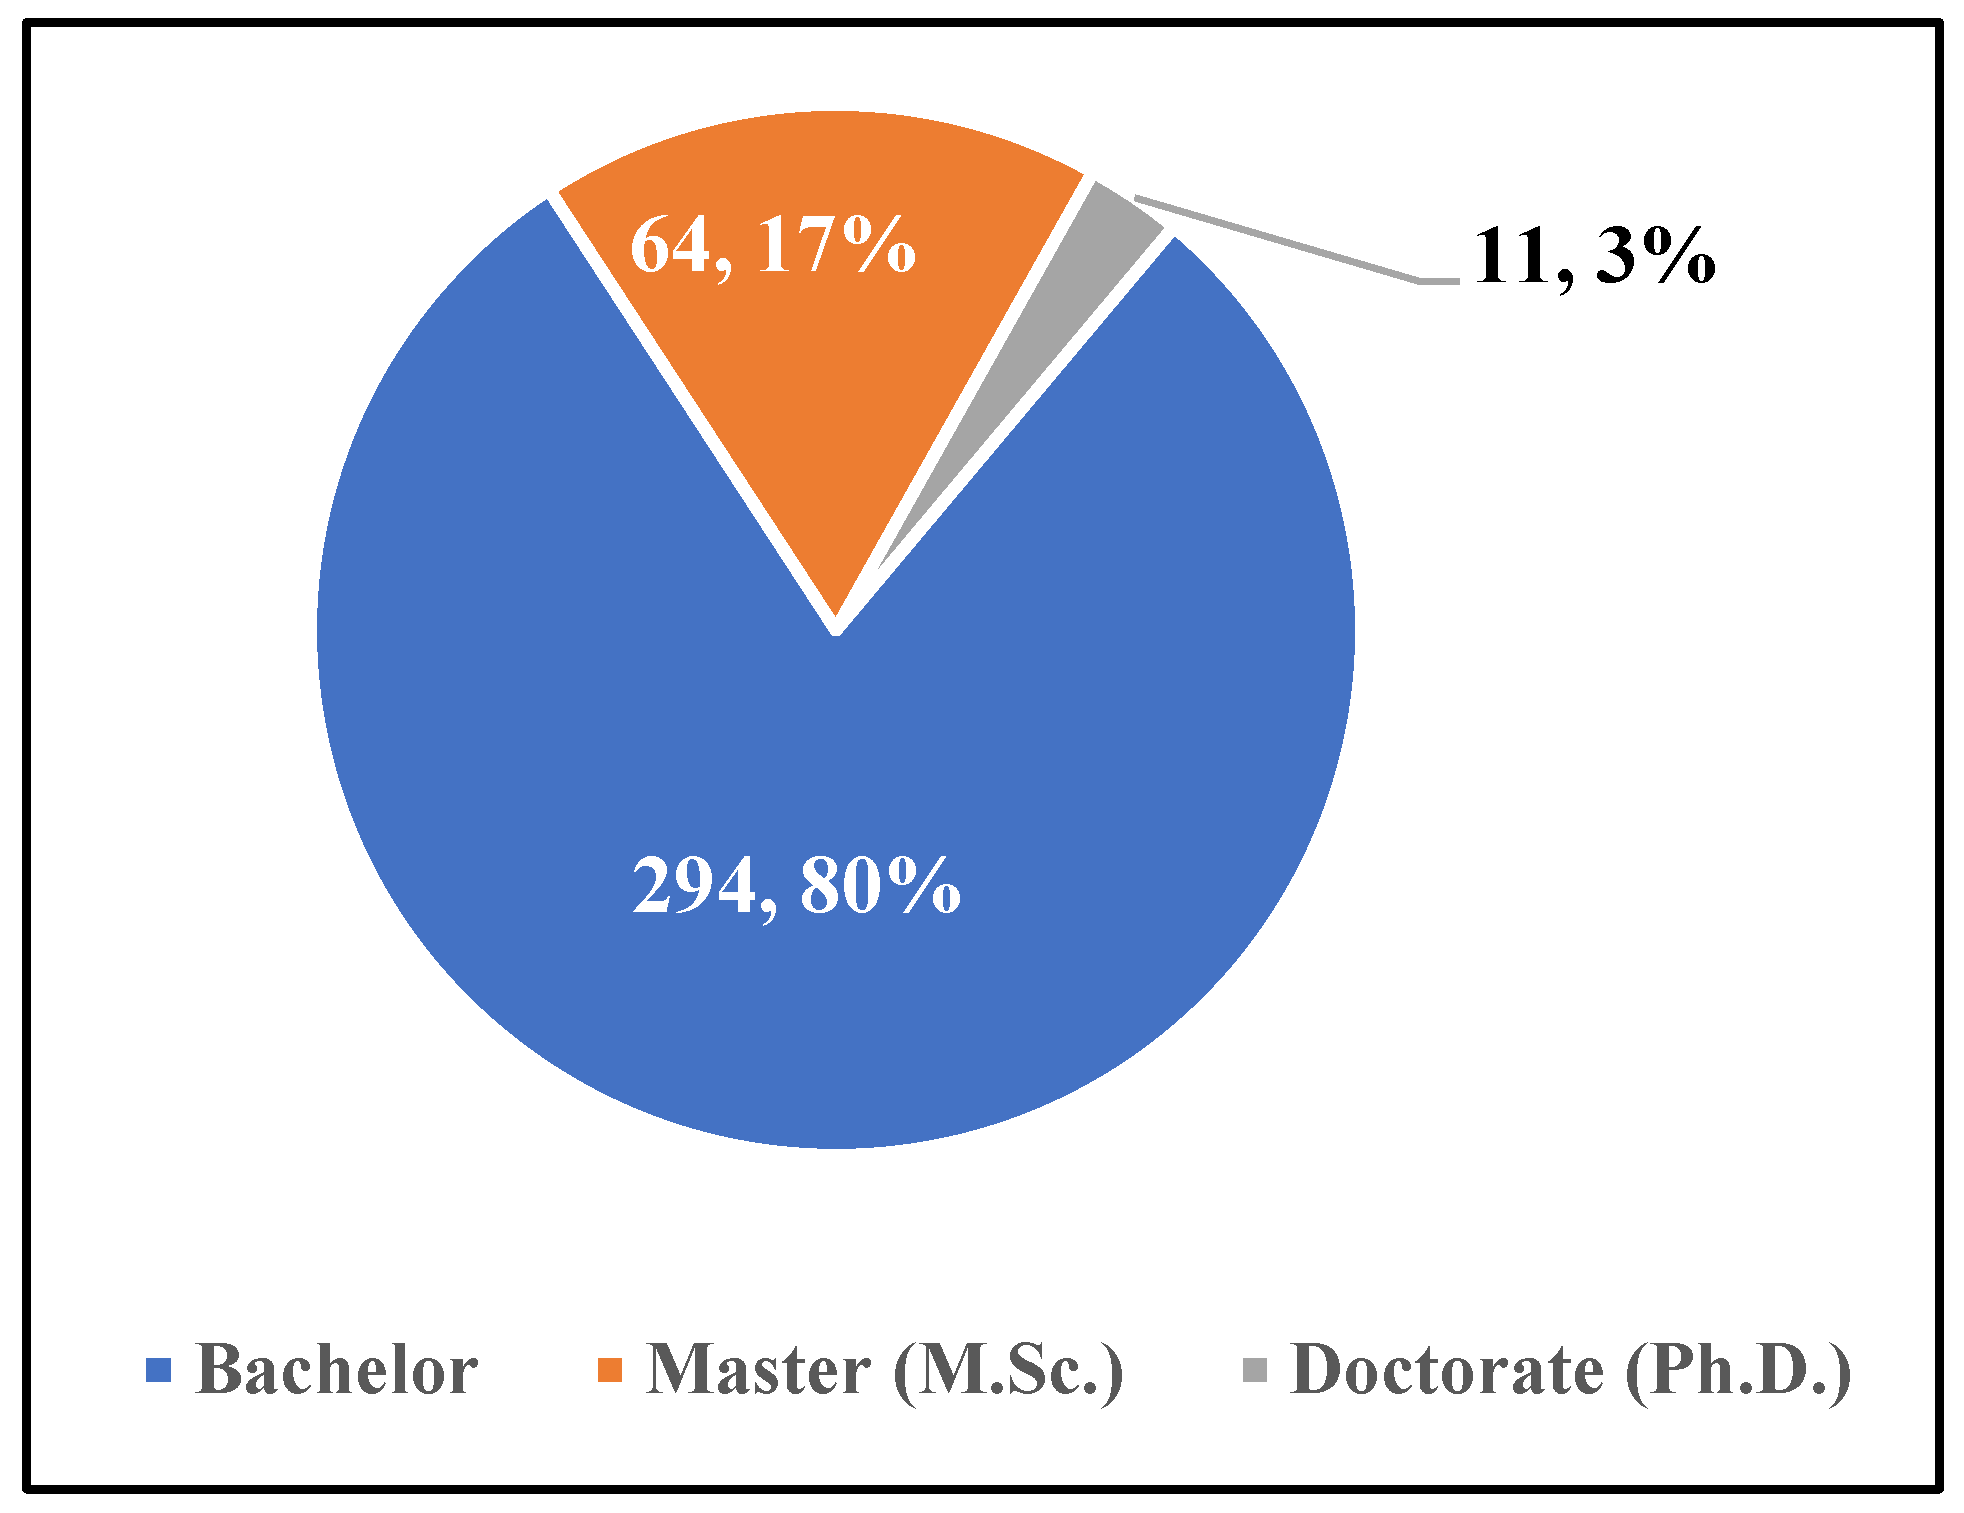
Figure 4.
Distribution of the Respondents According to Size of Firm.
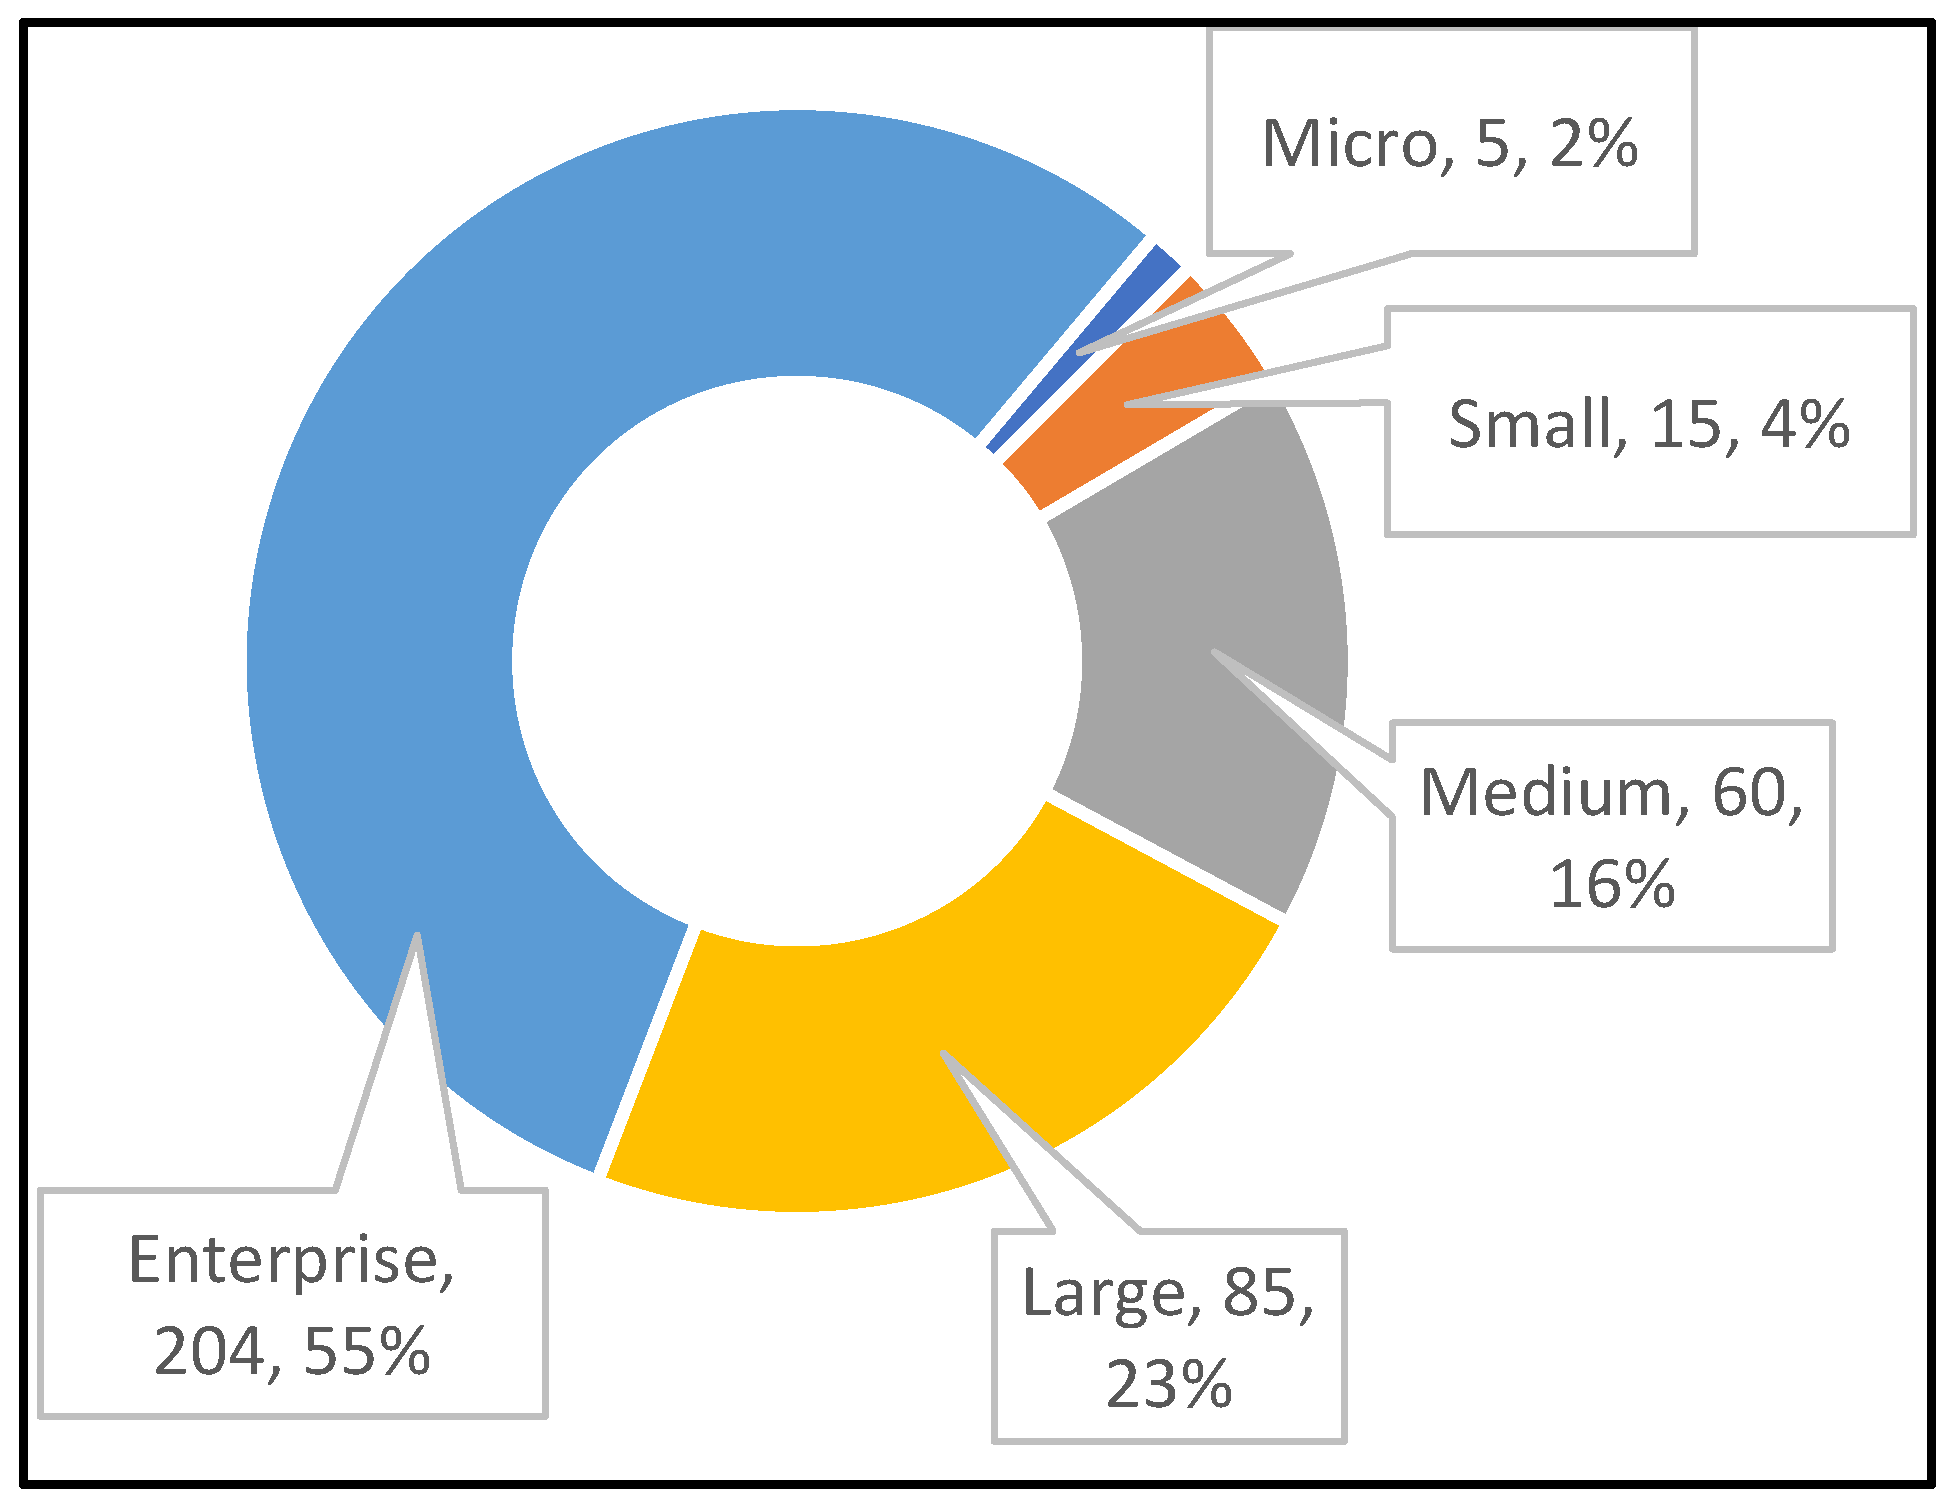
Figure 5.
Distribution of the Respondents According to Experience.
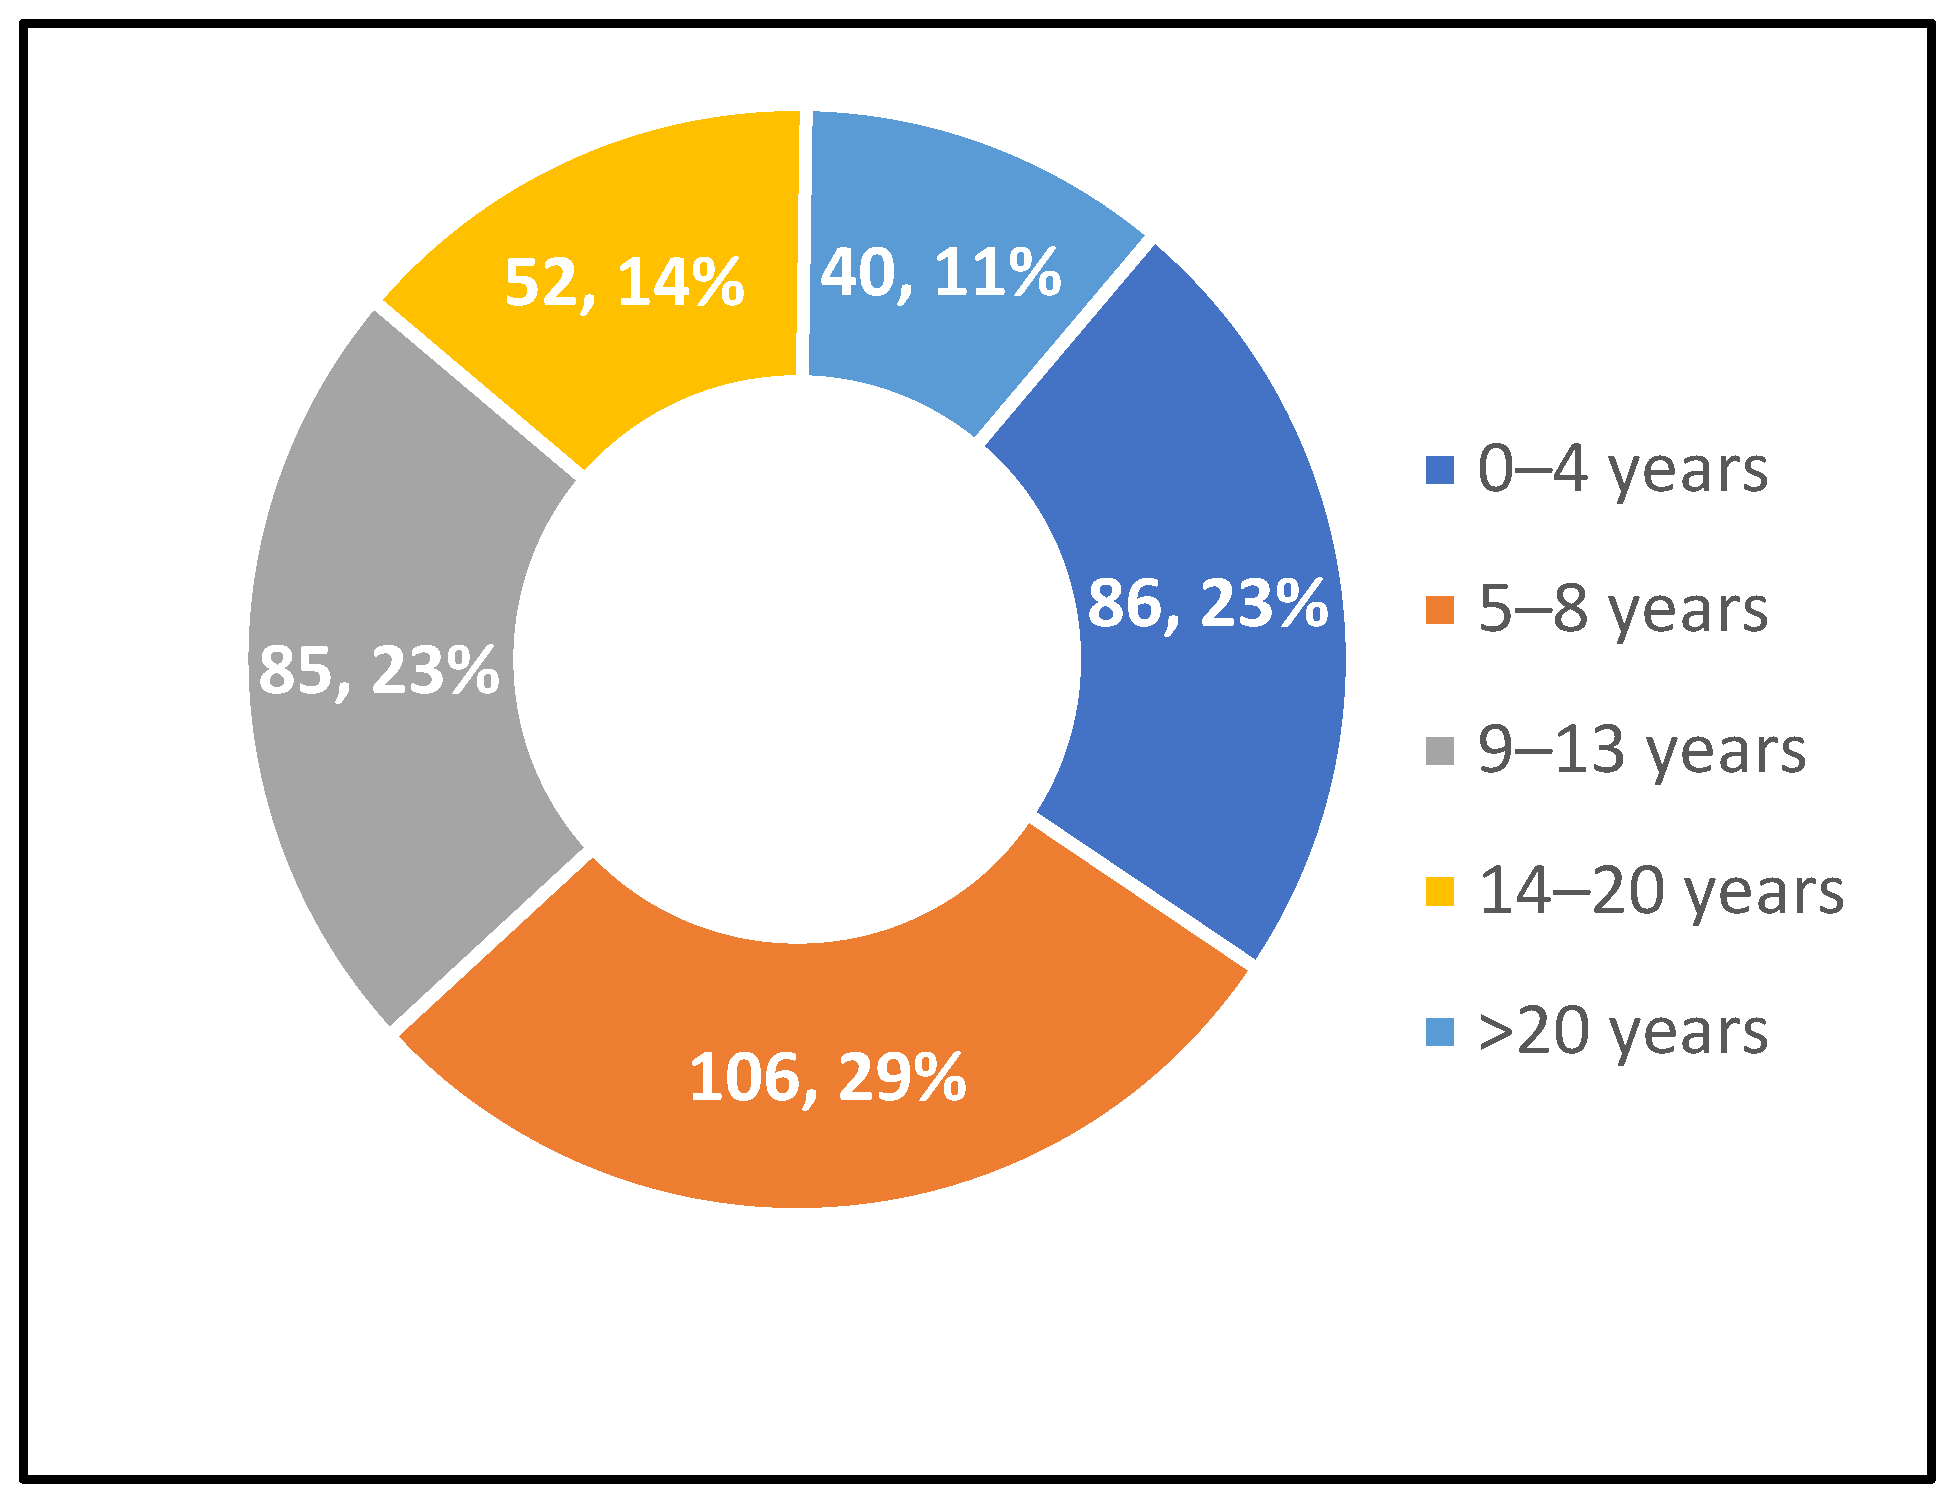
Figure 6.
Distribution of the Respondents According to Section/Position.
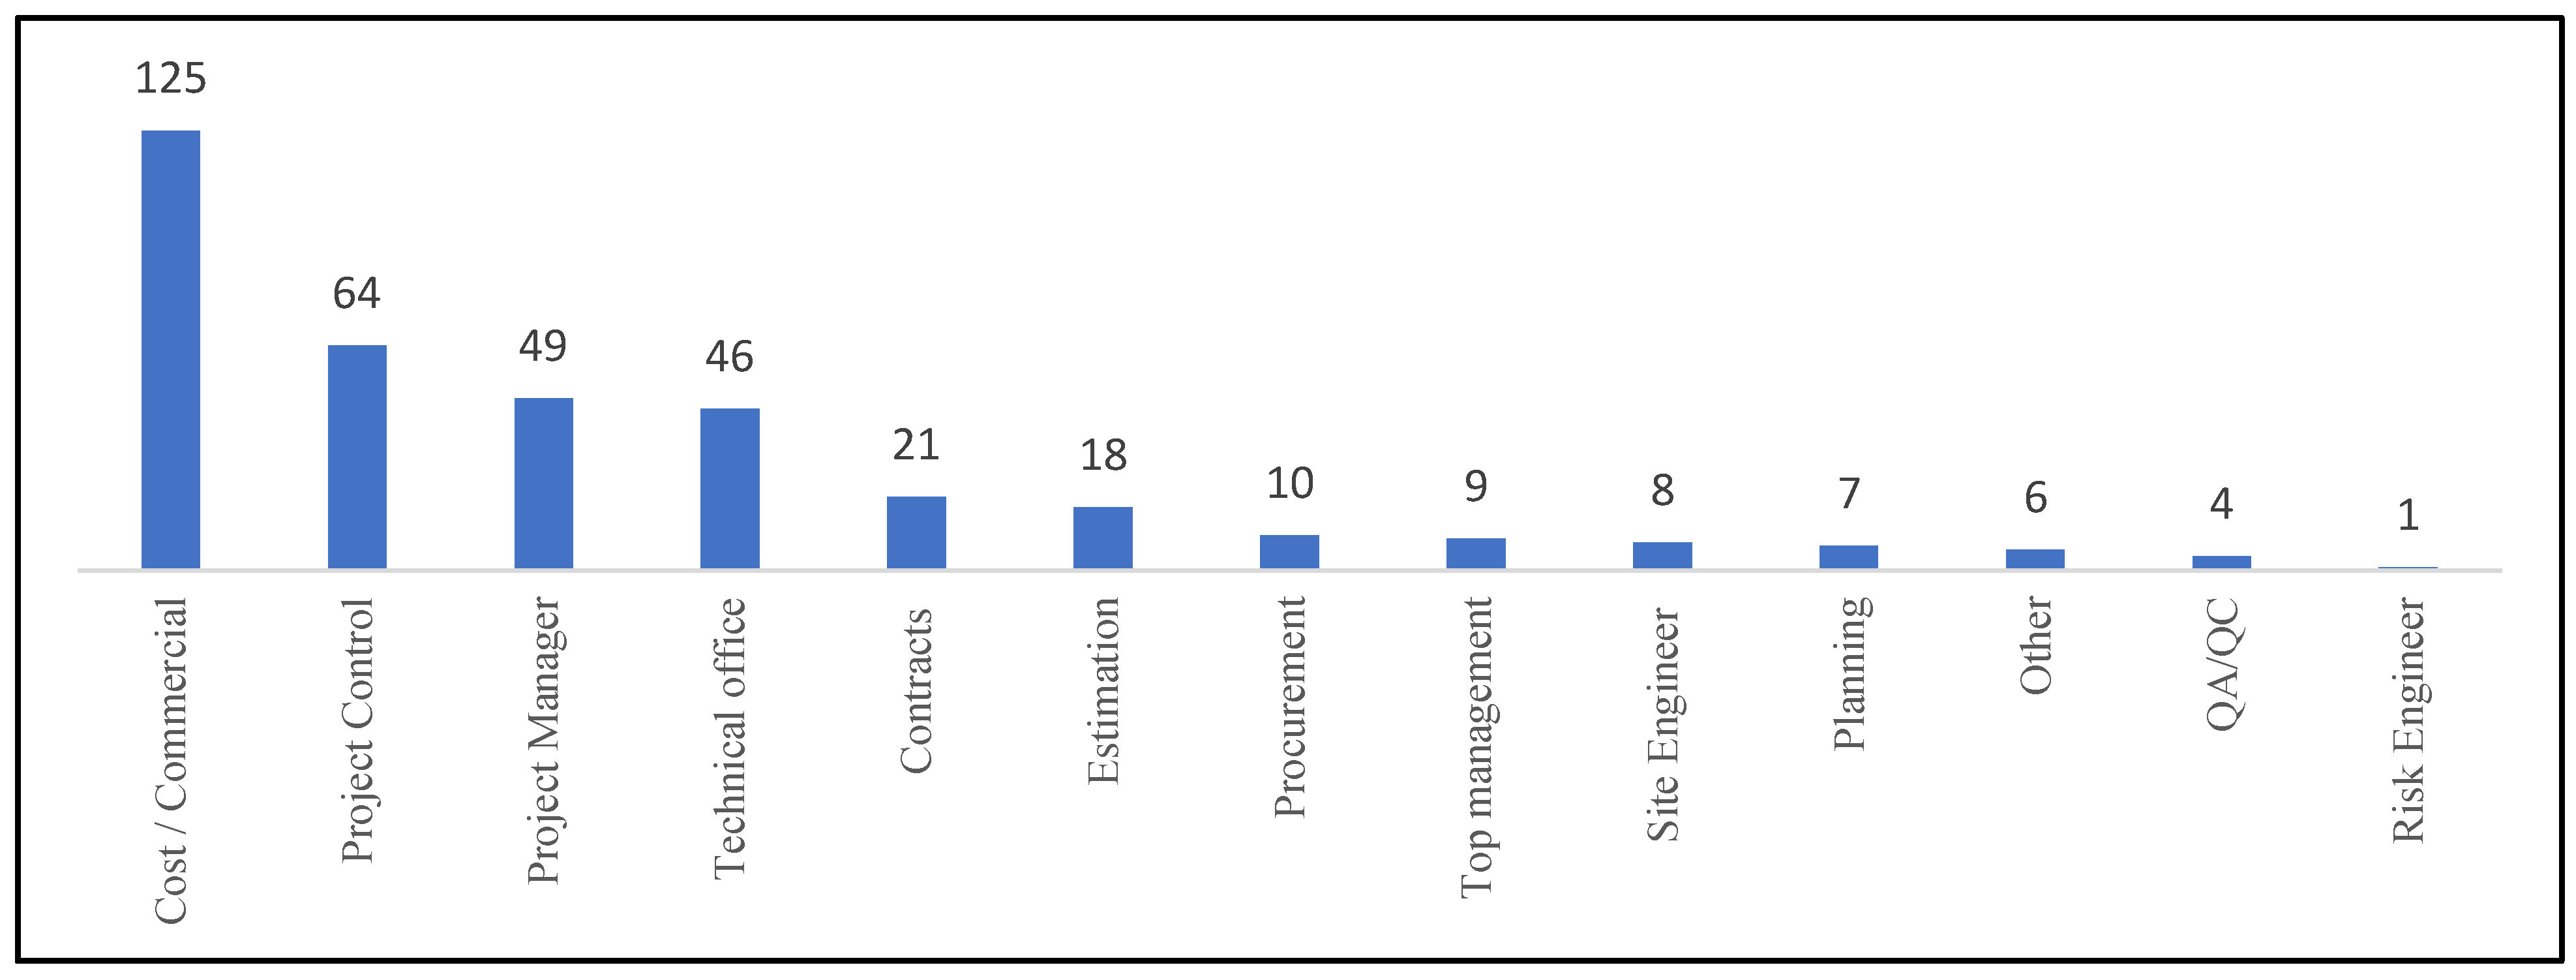
Figure 7.
Elbow Plot for the Optimal Number of Clusters.
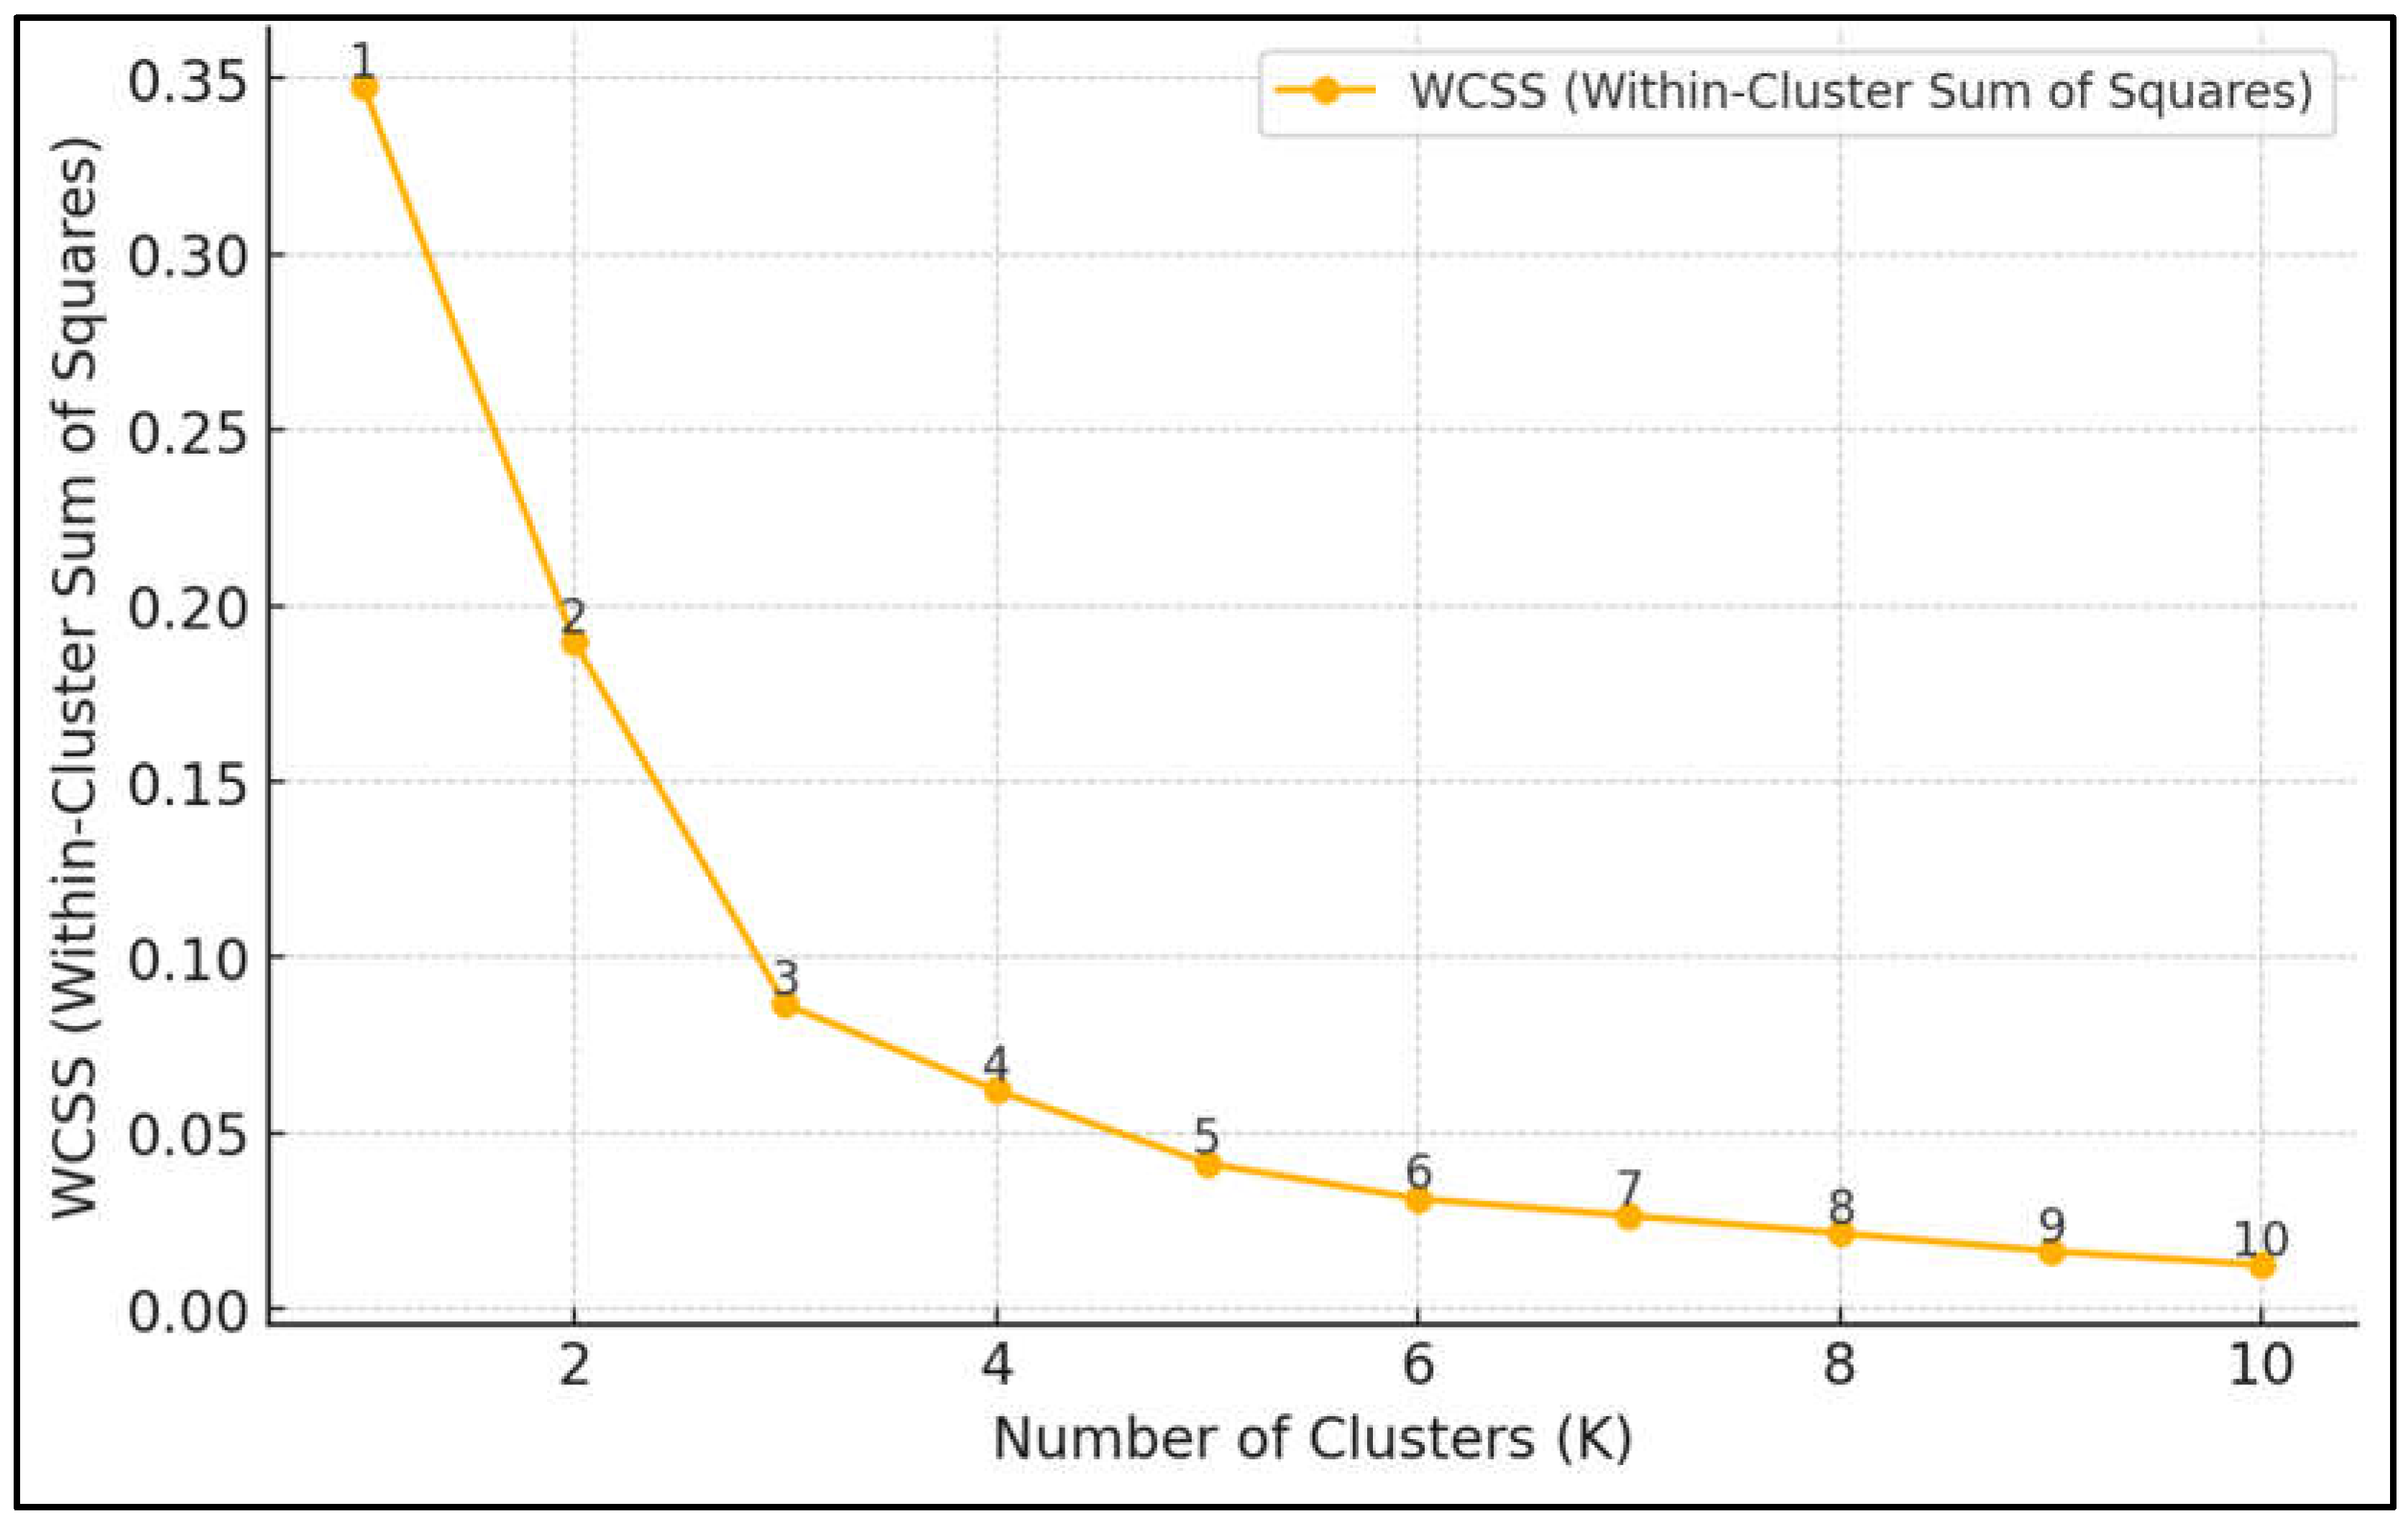
Figure 8.
K-Means Clustering Visualization for Cost Overrun Factors.
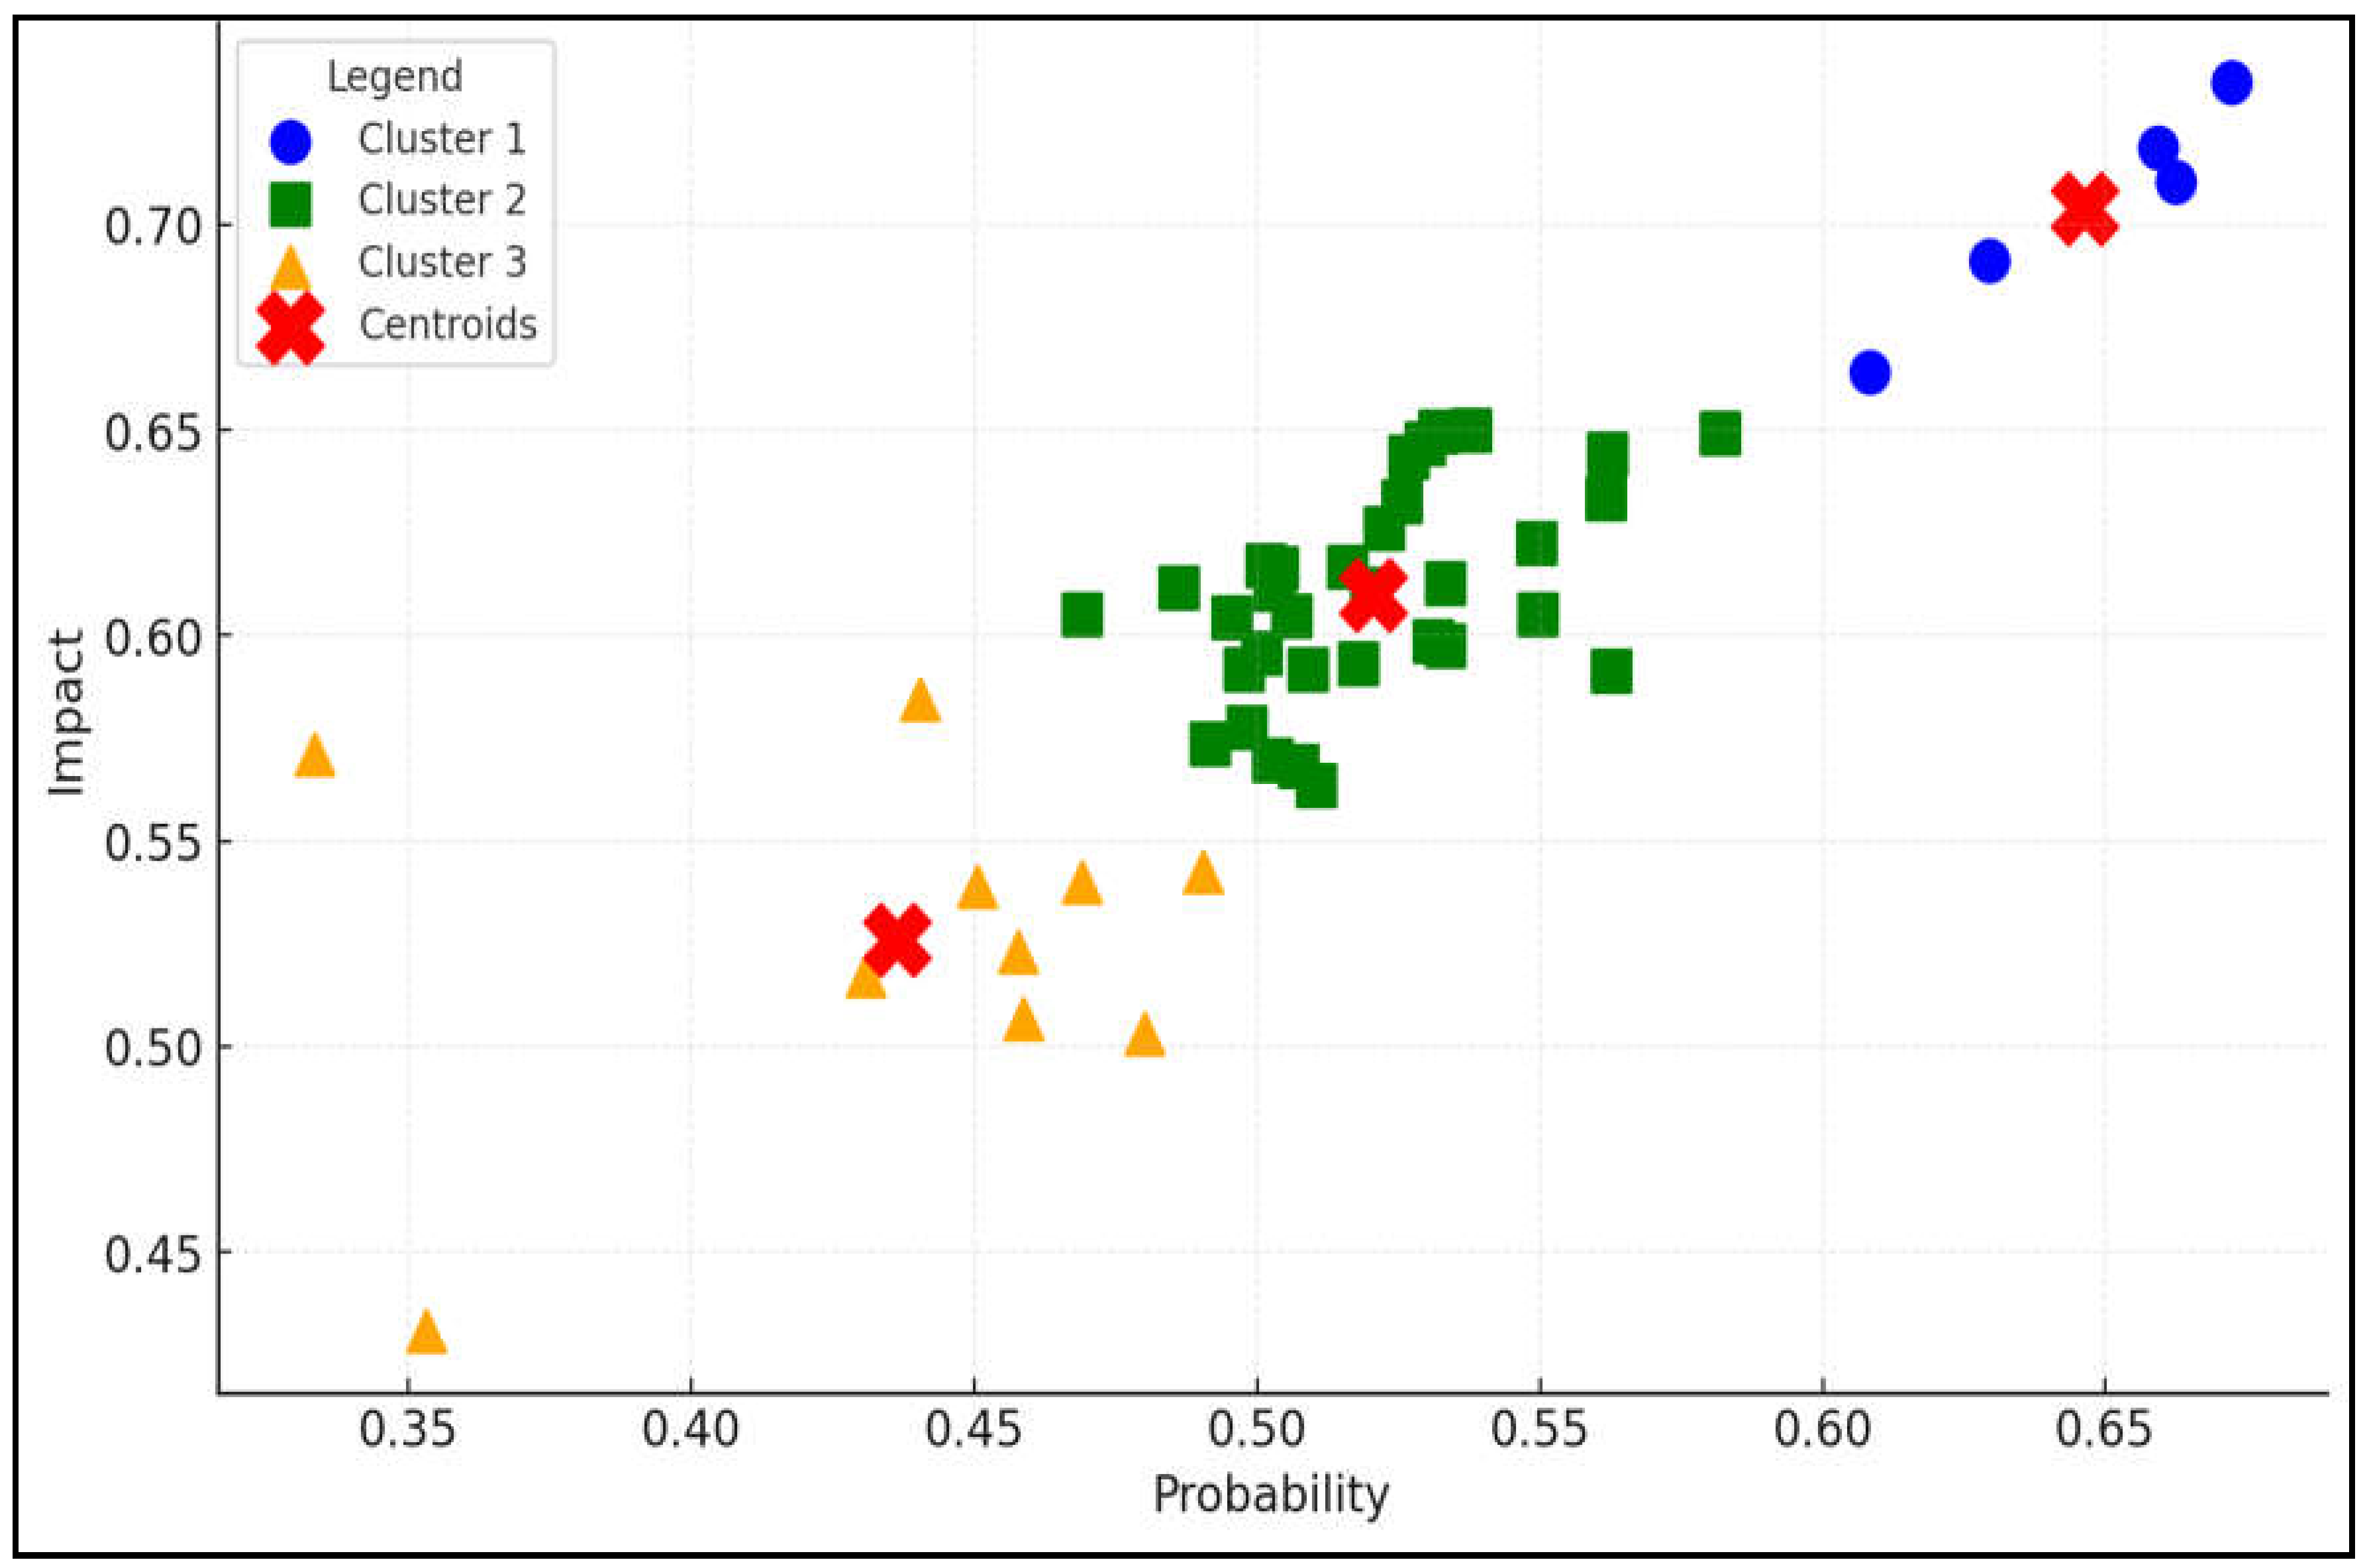
Figure 9.
K-Means Clustering with Four Distinct Groups.
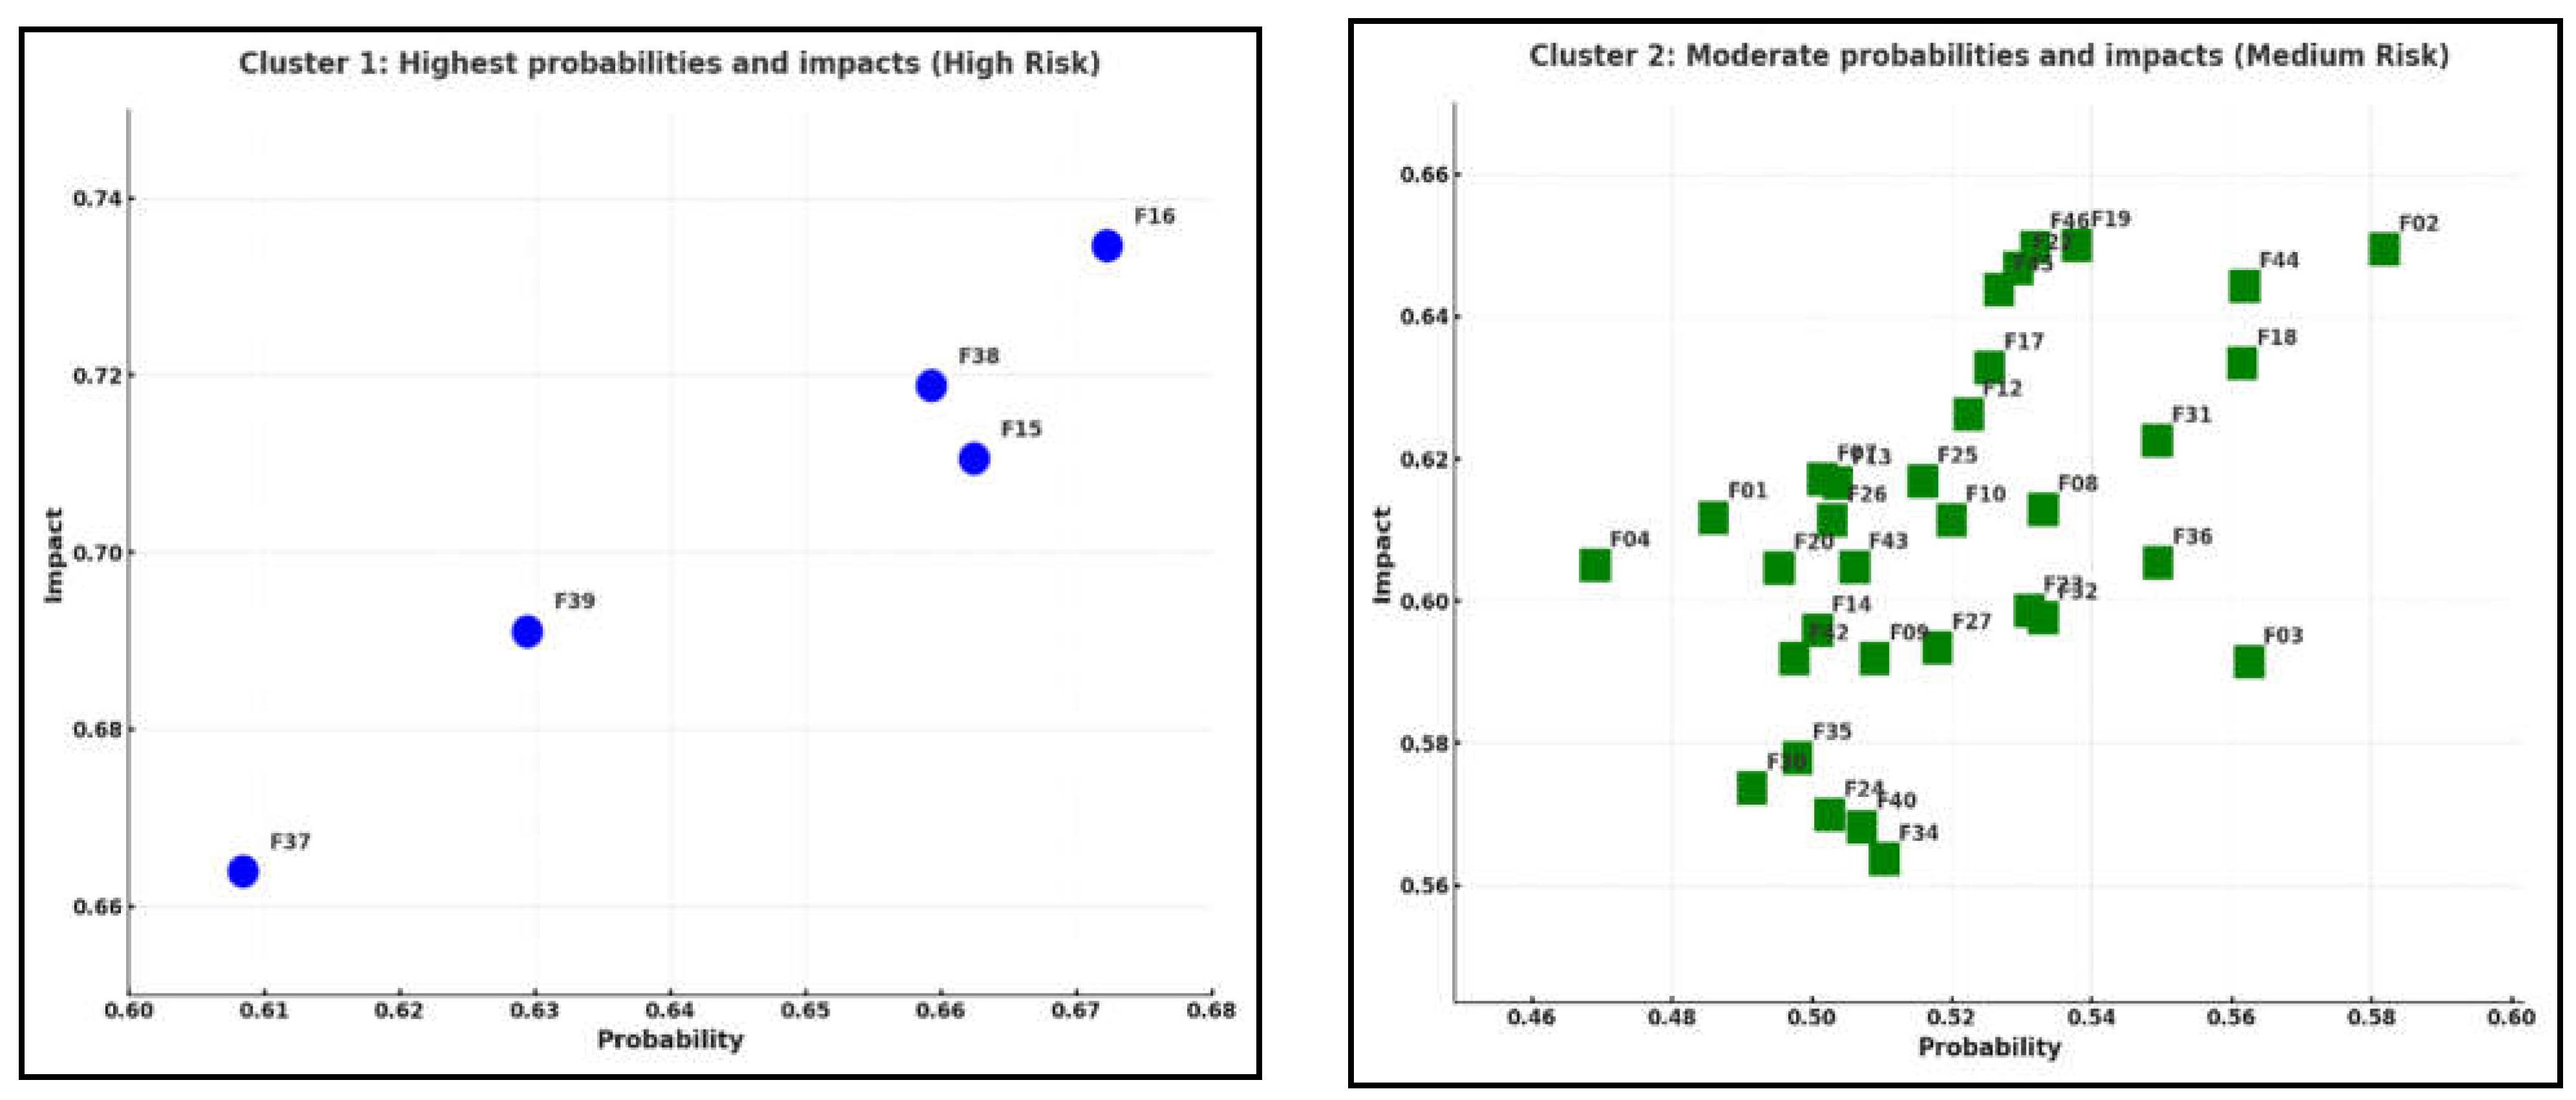
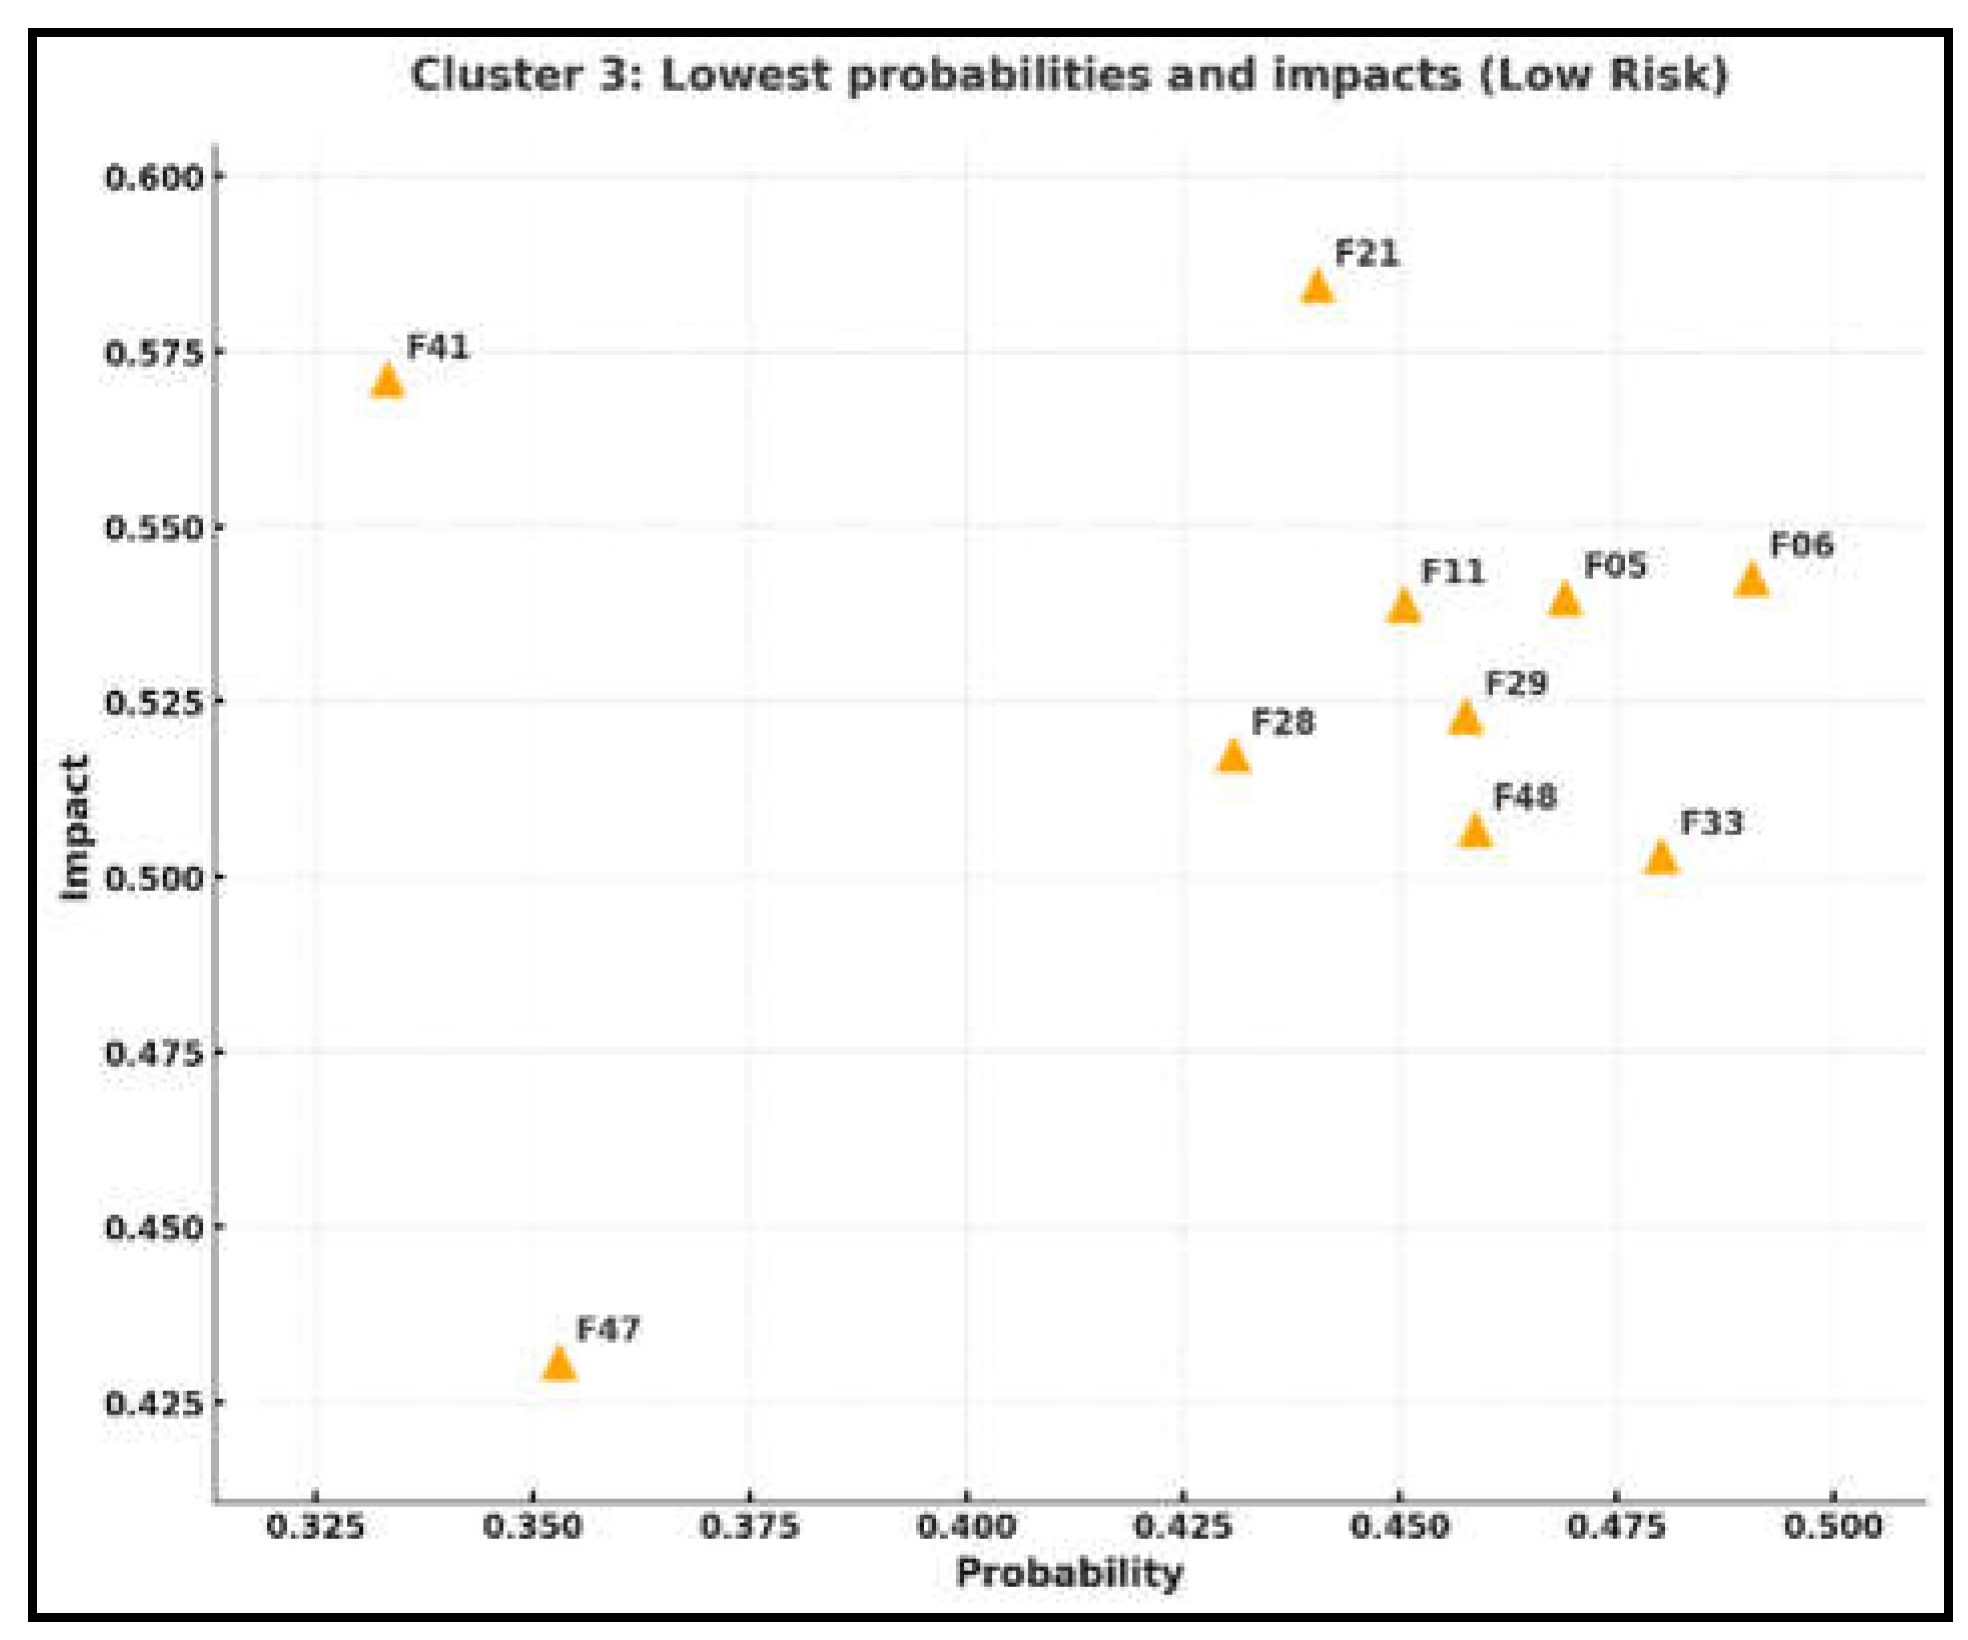
Figure 10.
Sensitivity analysis of the top 20 risks from a stakeholder perspective.
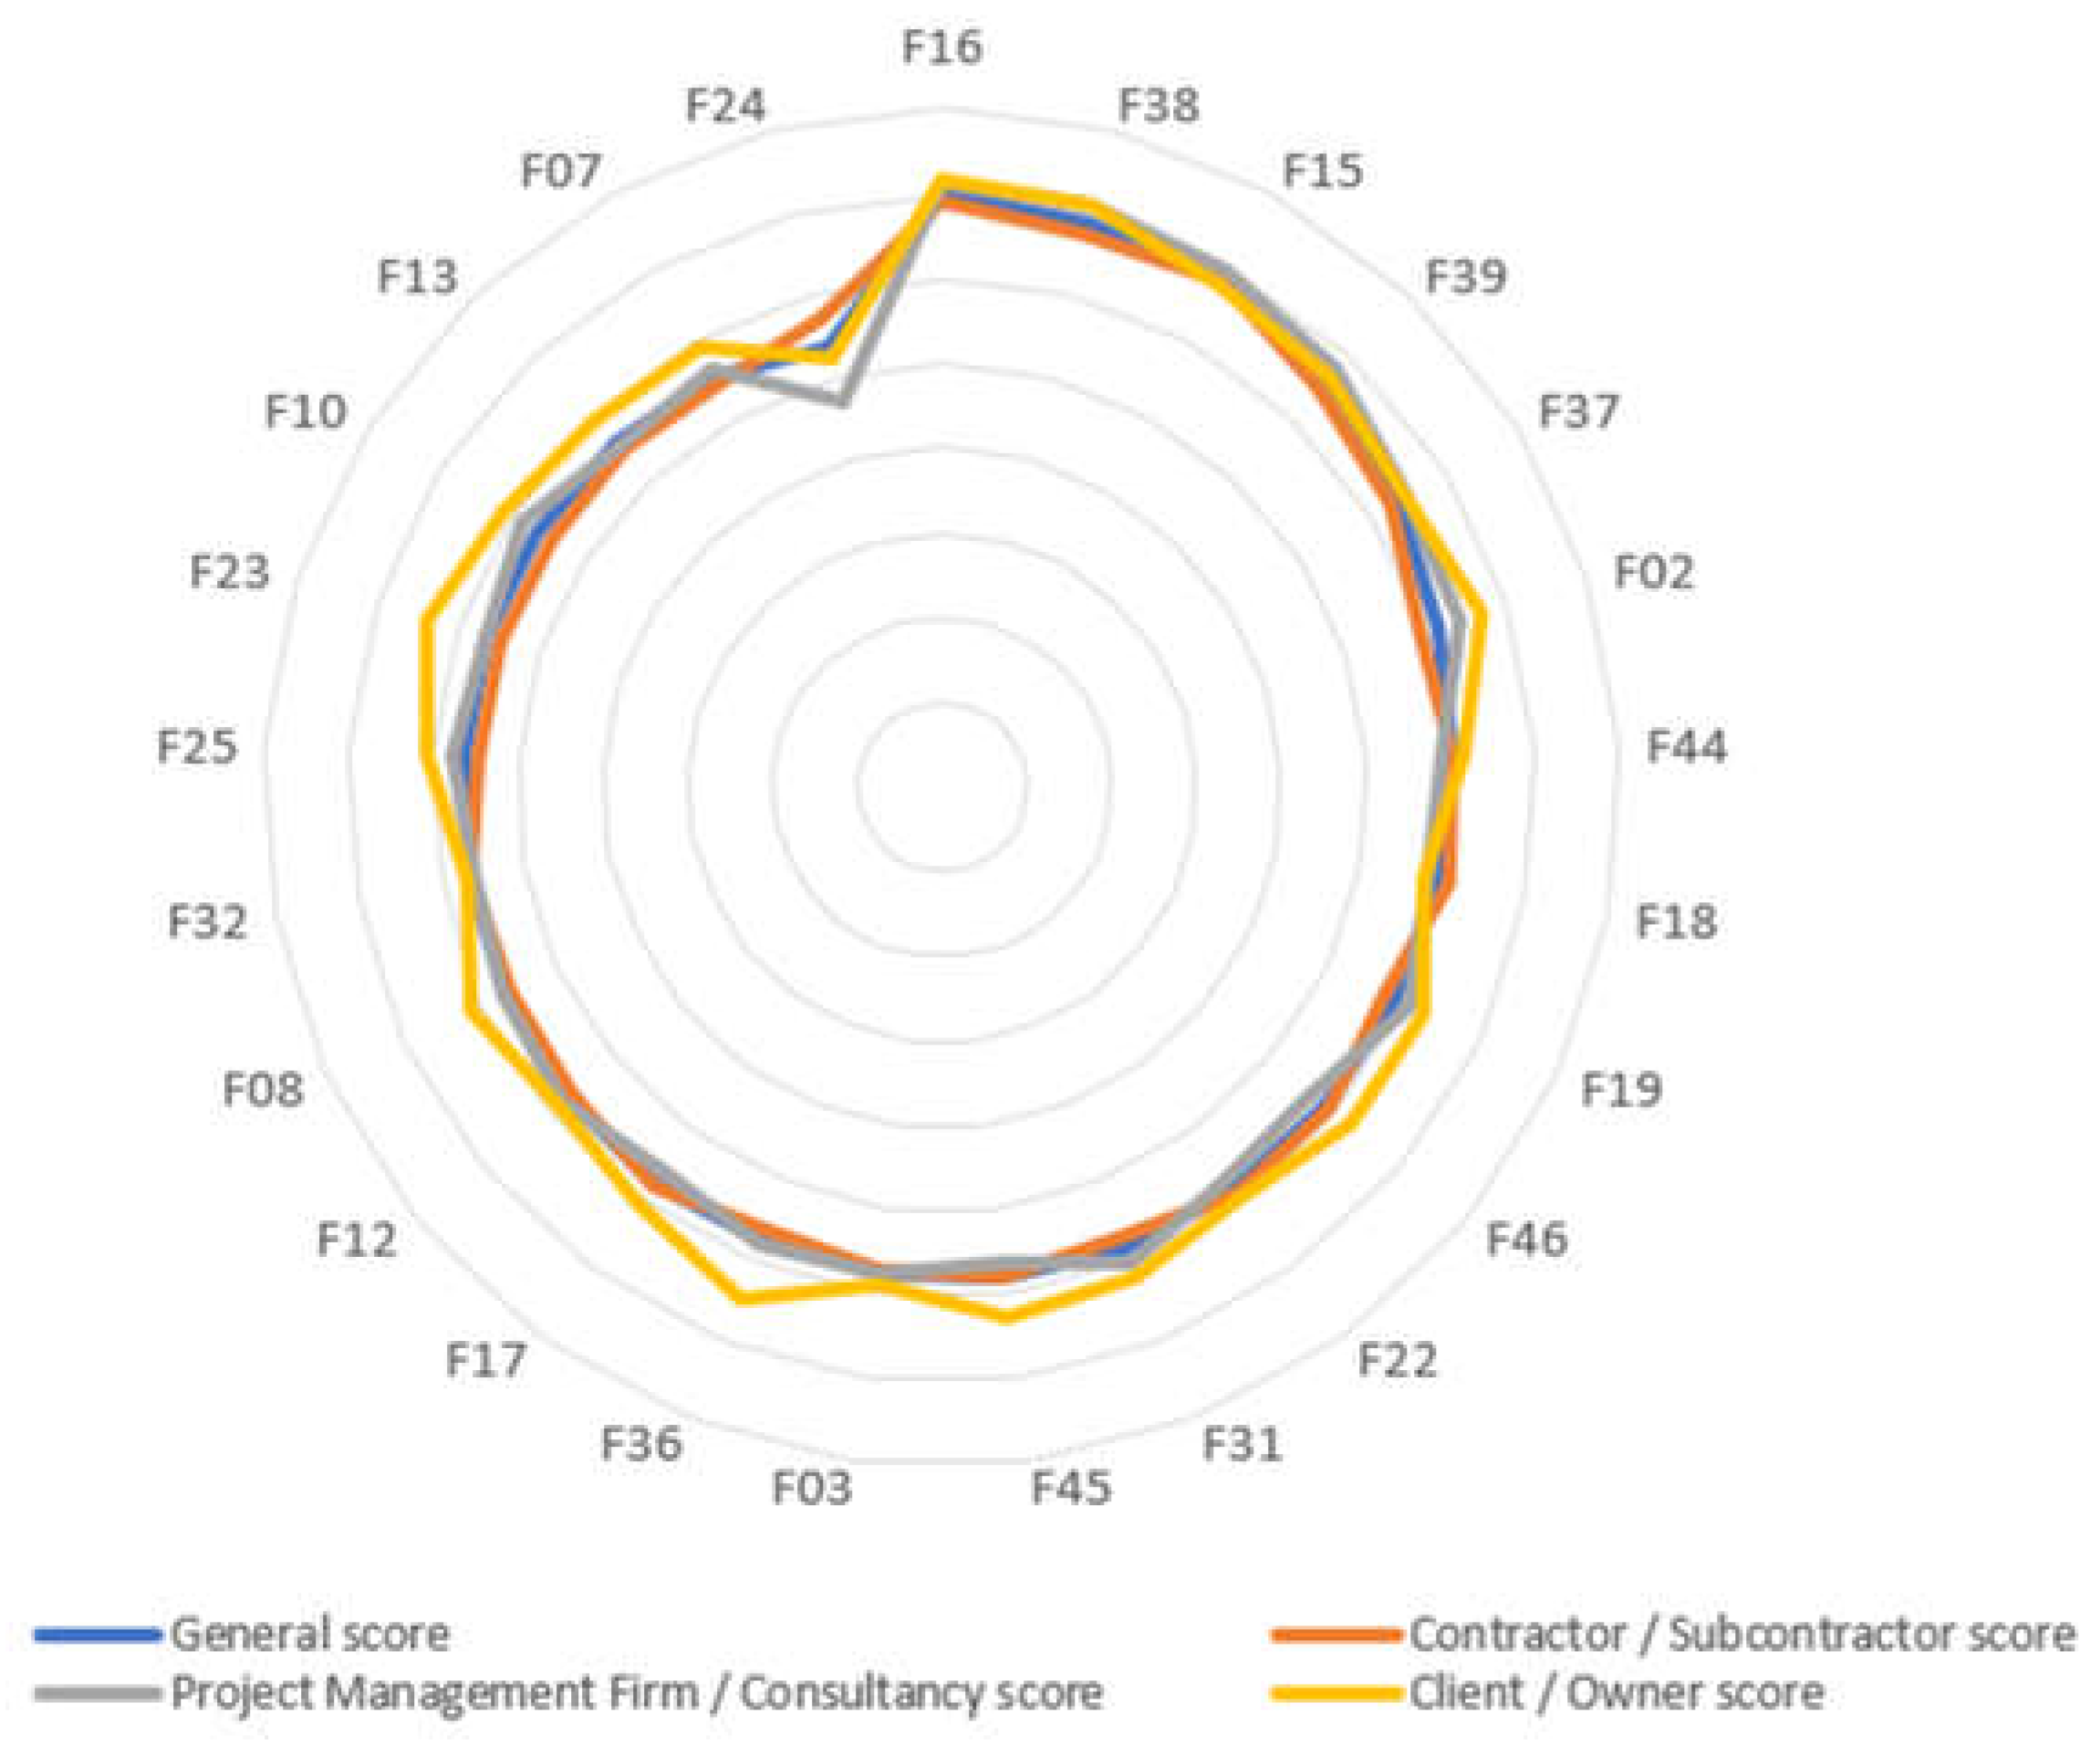
Figure 11.
Tornado chart for Contractor / Subcontractor Vs Client / Owner perspective.
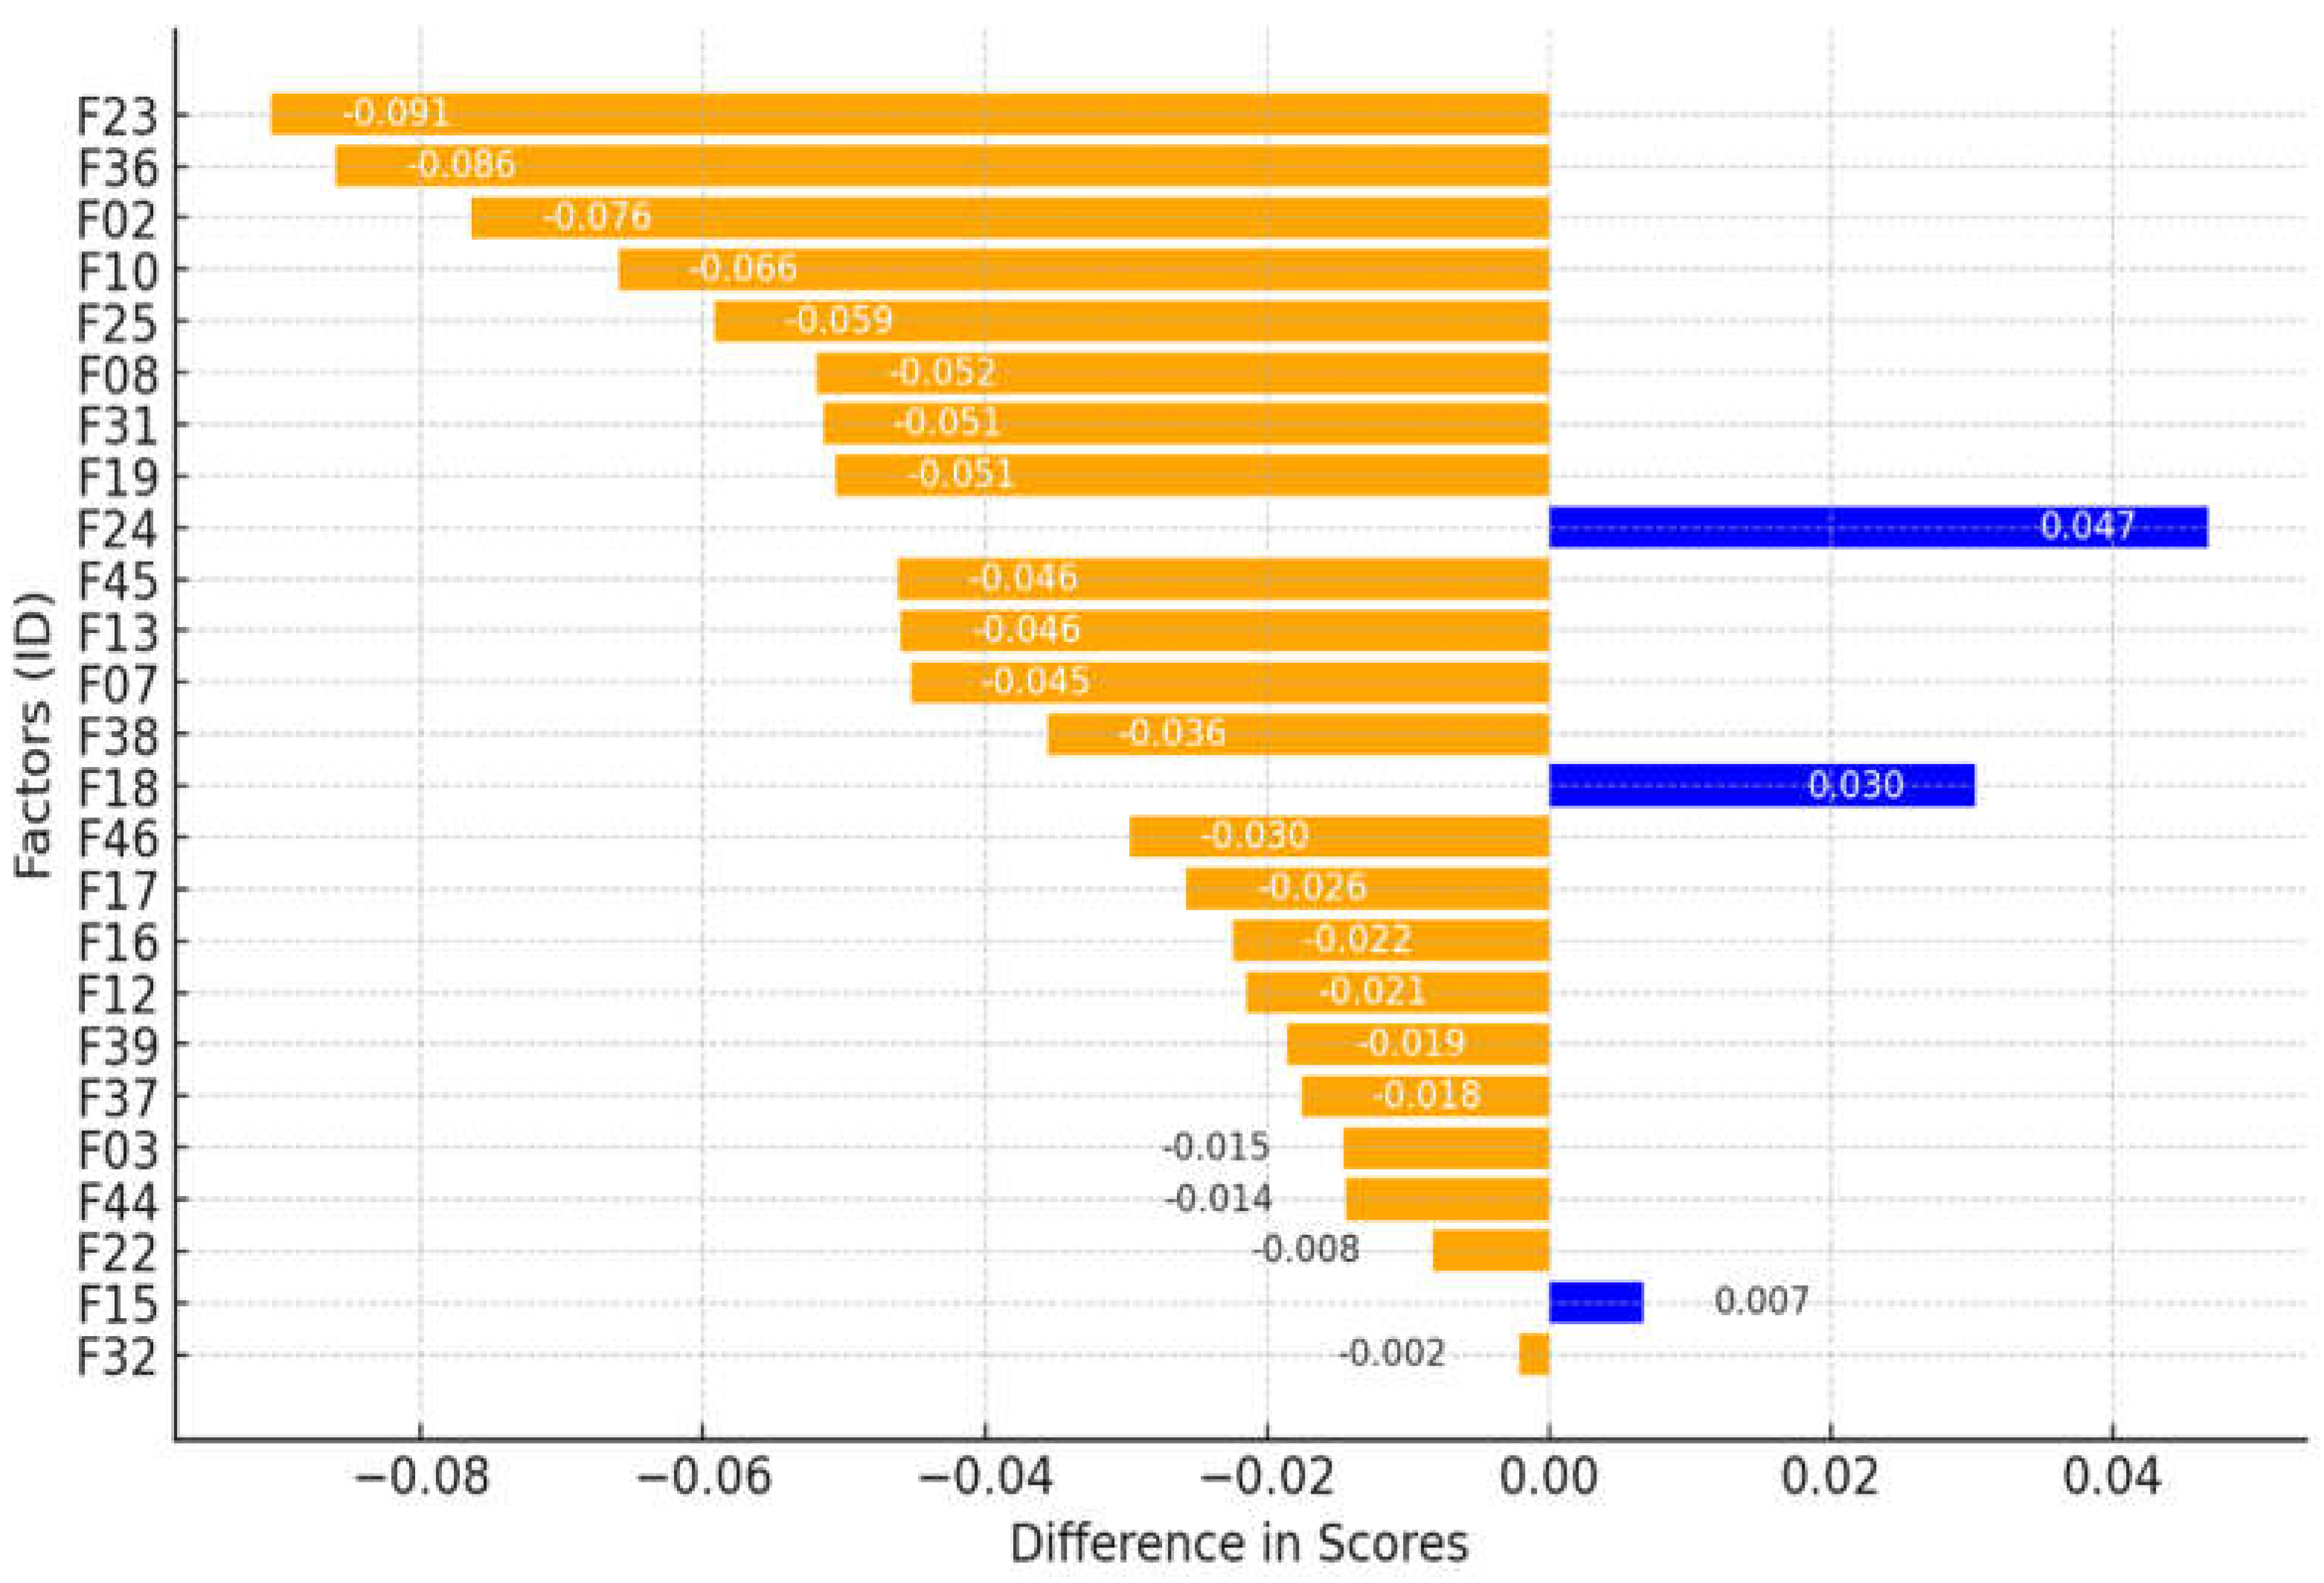
Figure 12.
Tornado chart Contractor / Subcontractor Vs Management Firm / Consultancy perspective.
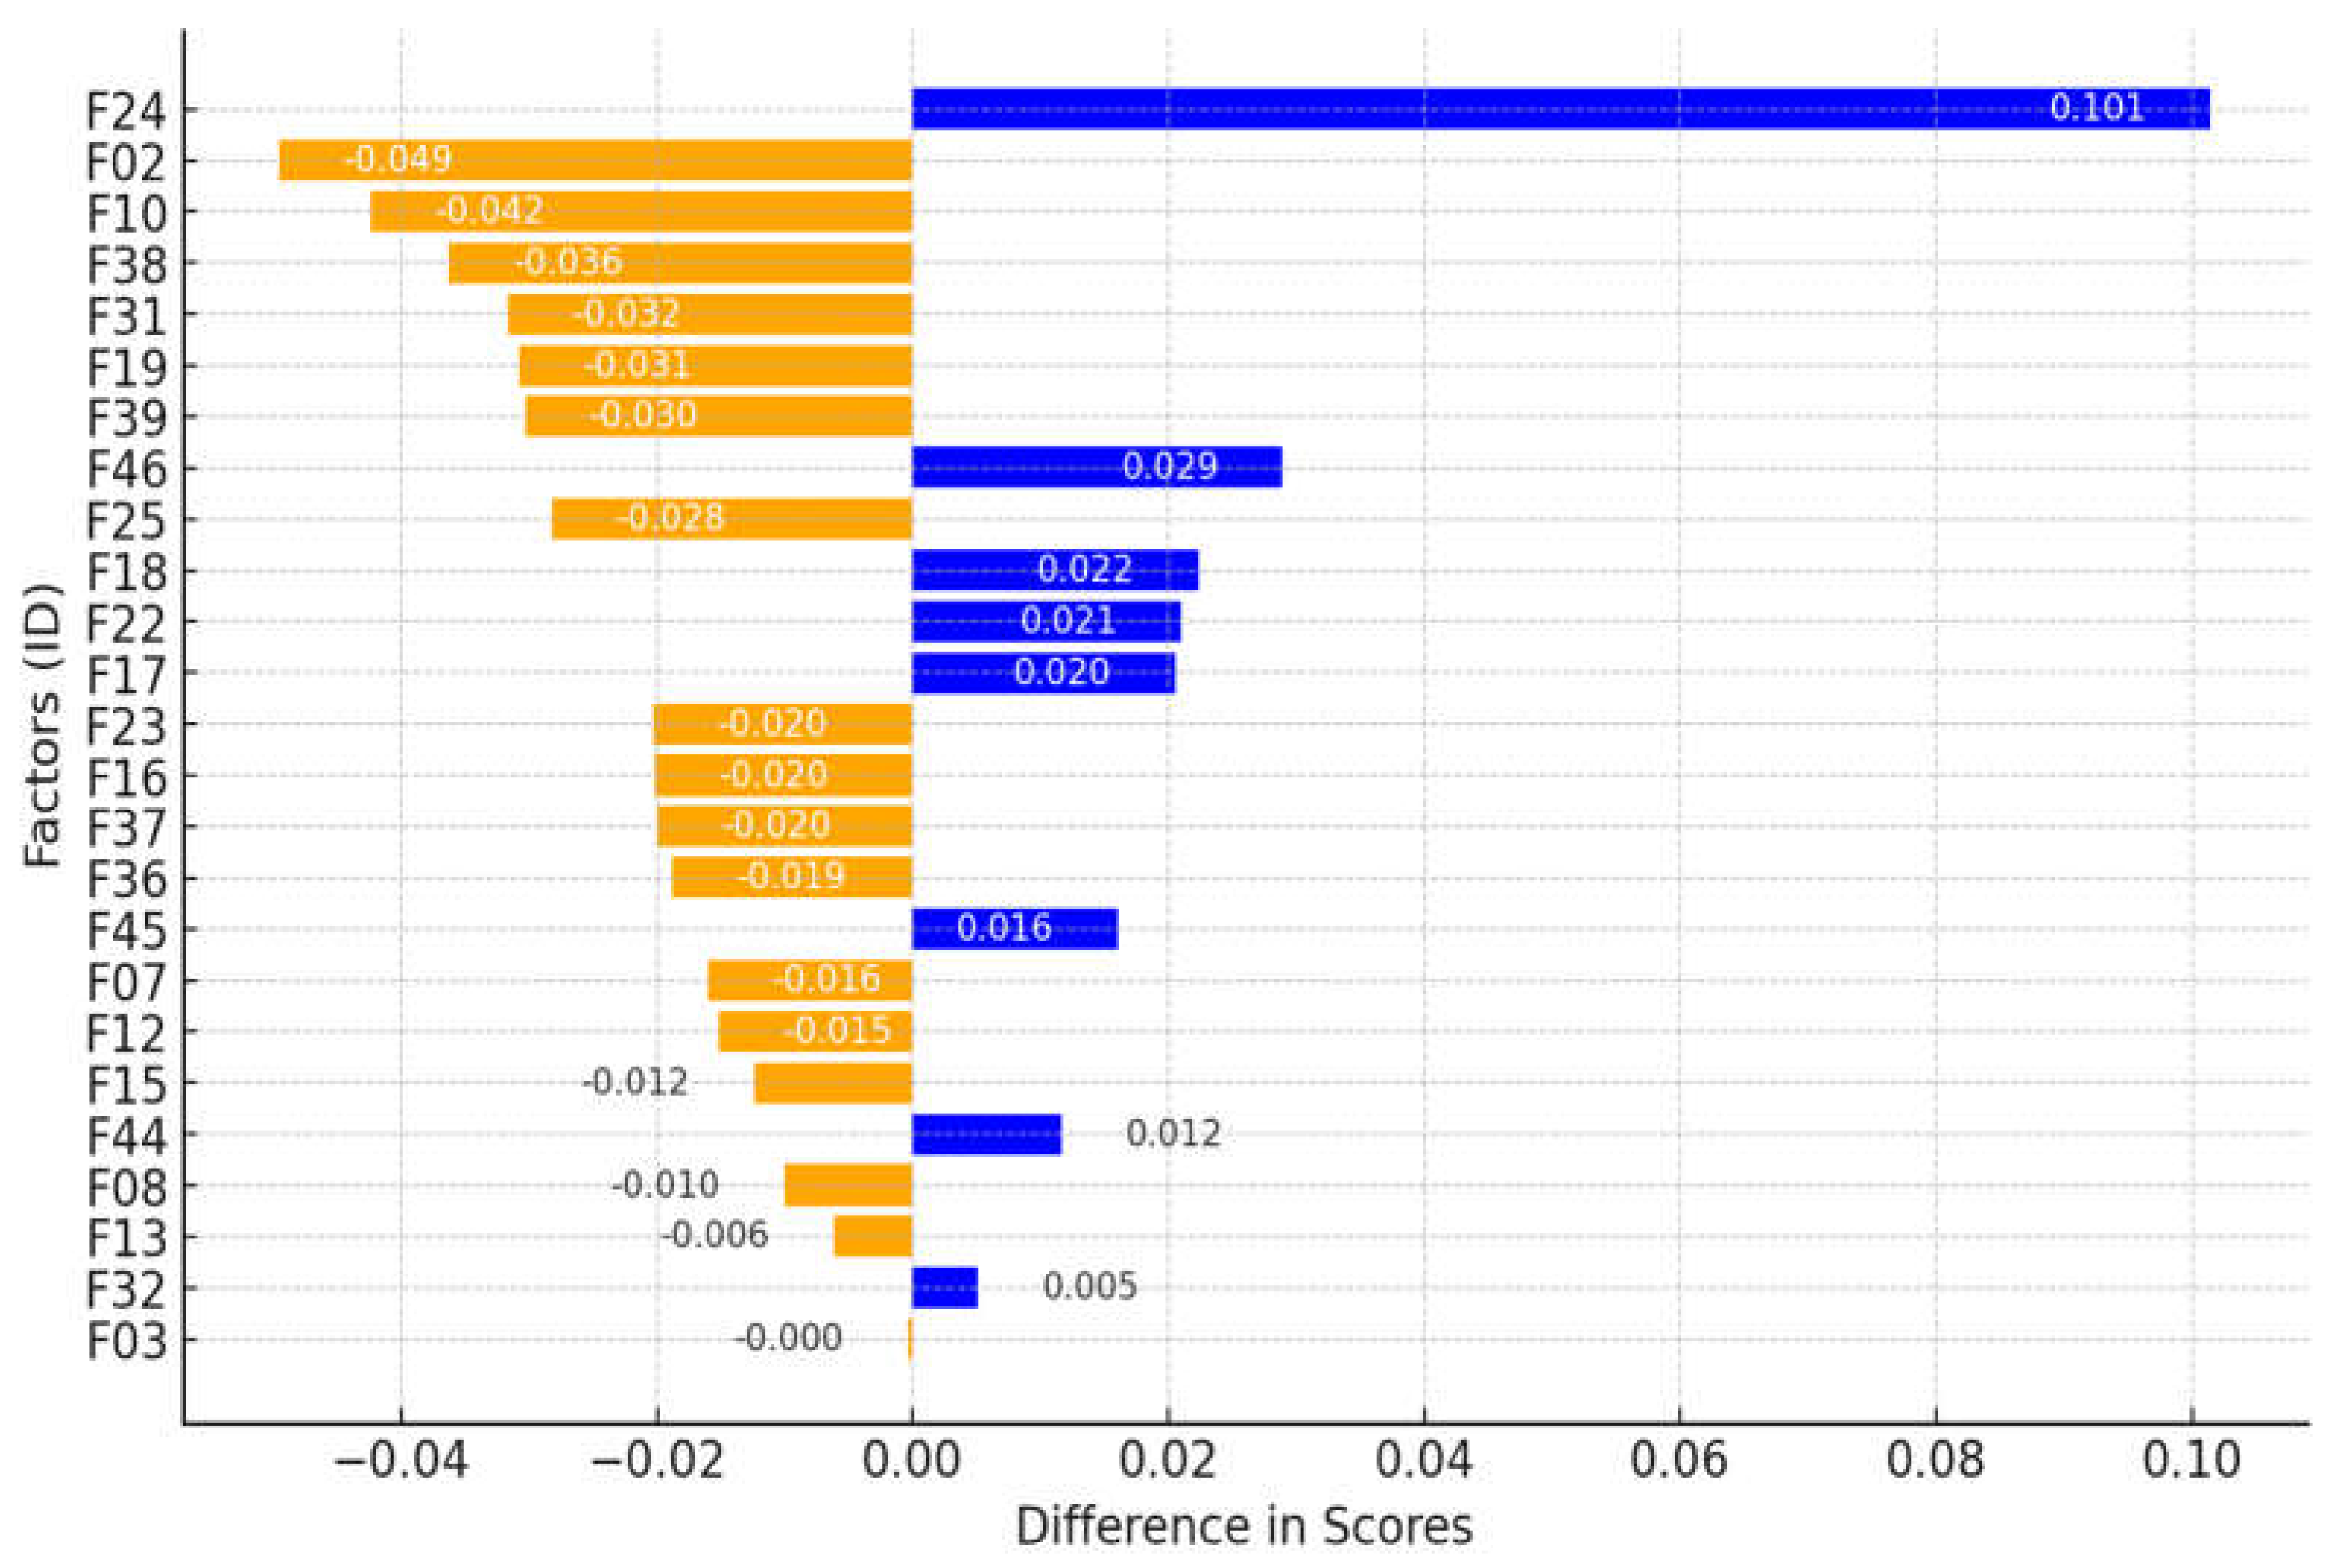
Figure 13.
Tornado chart Client / Owner Vs Management Firm / Consultancy perspective.
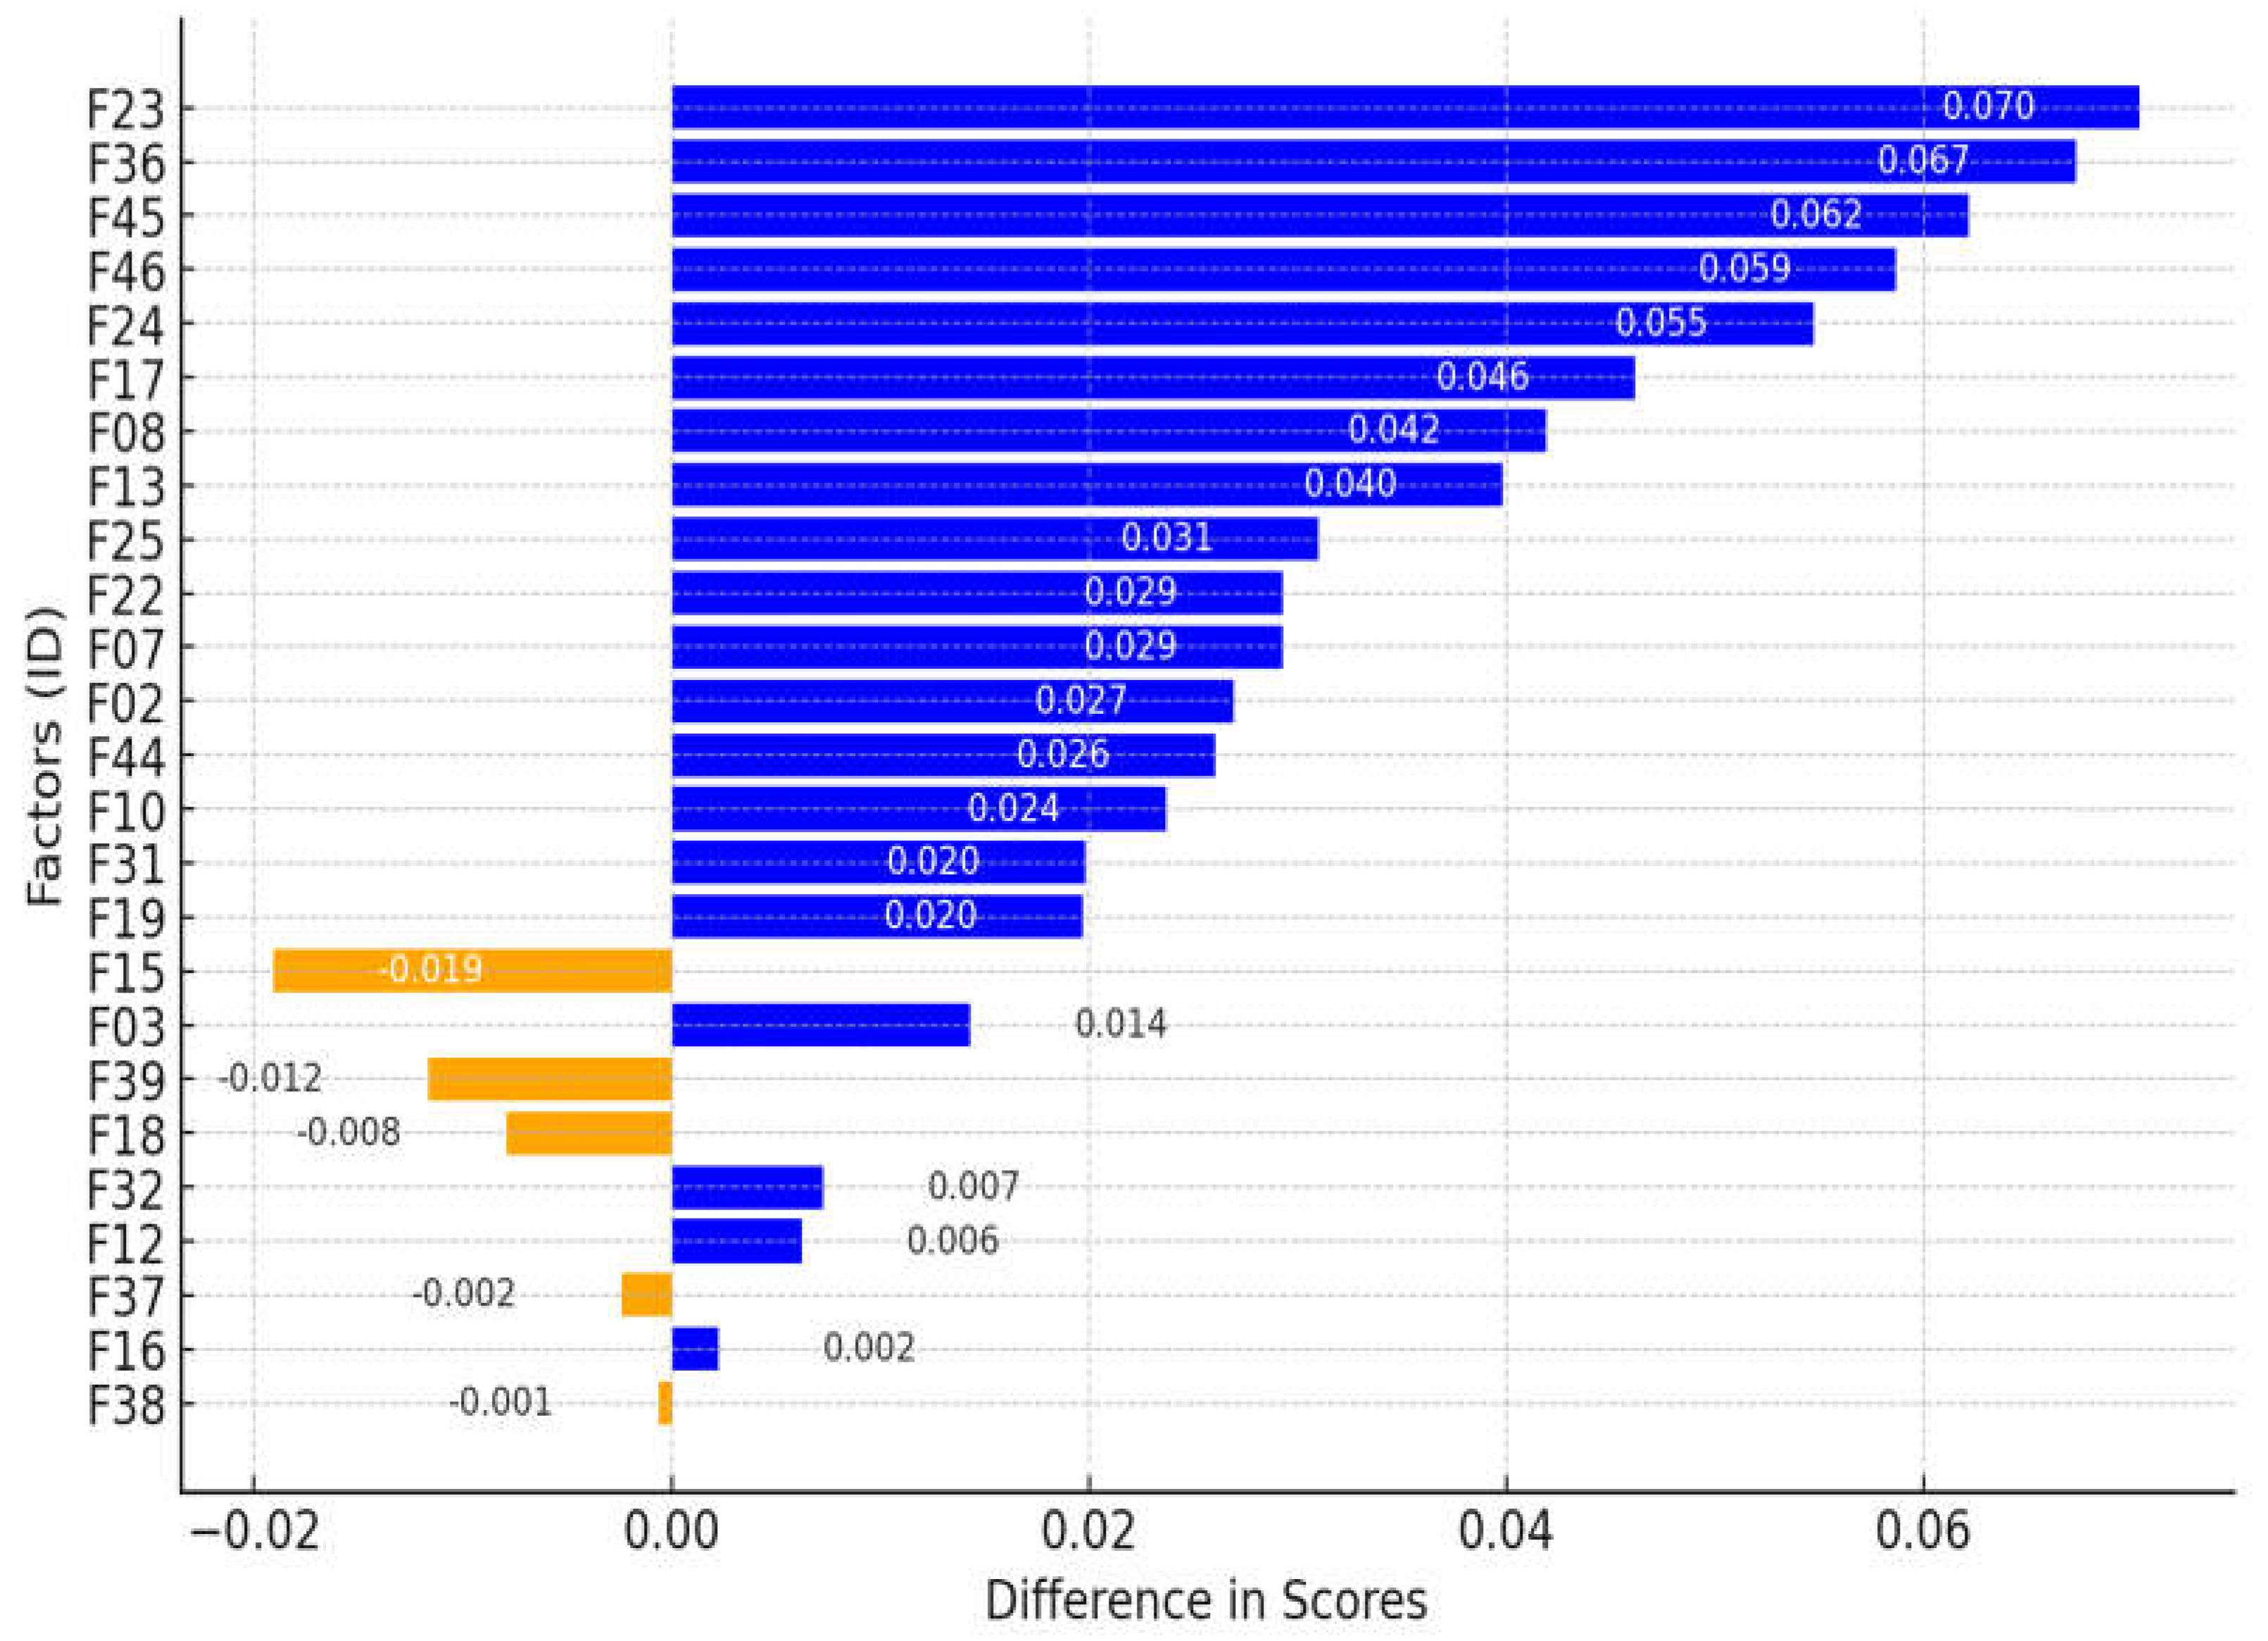

Table 1.
Summary of construction project cost overrun factors.
| Code | Factor | Code | Factor |
|---|---|---|---|
| F01 | Define the Scope | F25 | Delayed Decision-Making by Owners |
| F02 | Frequent Changes in Design | F26 | Political Interference |
| F03 | Increase Additional Work Orders | F27 | Contractual Claims & Disputes |
| F04 | Project Specifications and Feasibility | F28 | Bureaucratic & Unethical Behavior |
| F05 | Labour Availability and Skills | F29 | Lack of Communication between Parties |
| F06 | Labour Productivity | F30 | Lack of Coordination & Cooperation |
| F07 | Contractor Experience | F31 | Delay in Materials |
| F08 | Subcontractor Experience & Performance | F32 | Planning and Scheduling Issues |
| F09 | Poor Site Management Supervision | F33 | Cost of Labour |
| F10 | Availability of Materials | F34 | Cost of Equipment |
| F11 | Equipment Suitability and Availability | F35 | Market and Supply Conditions |
| F12 | Resource Planning & Allocation | F36 | Delay in Design Stage |
| F13 | Contractual Ambiguity and Contradiction | F37 | Economic Challenges |
| F14 | Bidding and Tendering Difficulties | F38 | Currency Issues |
| F15 | Cost of Materials | F39 | Market Fluctuations |
| F16 | Inflation | F40 | Owner Interference |
| F17 | Financial Impediments by Owner | F41 | Force Majeure |
| F18 | Delayed Payments by Owner for Contractors | F42 | Unclear or Changes in Specification |
| F19 | Financial Issues by Contractor | F43 | Mistakes / Deficiency in BOQ |
| F20 | Bad Execution Problems | F44 | Cash Flows during Construction |
| F21 | Unforeseeable Site and Soil Conditions | F45 | Poor Monitoring / Controlling Cost |
| F22 | Project Estimation Problems | F46 | Poor Project Management |
| F23 | Design Inefficiencies | F47 | Adverse Weather Conditions |
| F24 | Wastage of materials on site | F48 | HSE Management |
Table 2.
K-Means Clustering Analysis Summary.
| Cluster | Factor IDs | Characteristics | Probability Range | Impact Range | Number of Factors |
|---|---|---|---|---|---|
| 1 | F15, F16, F37, F38, F39 | Highest probabilities and impacts (High Risk) | 0.61 - 0.67 | 0.66 - 0.73 | 5 |
| 2 | F01, F02, F03, F04, F07, F08, F09, F10, F12, F13, F14, F17, F18, F19, F20, F22, F23, F24, F25, F26, F27, F30, F31, F32, F34, F35, F36, F40, F42, F43, F44, F45, F46 | Moderate probabilities and impacts (Medium Risk) | 0.47 - 0.58 | 0.56 - 0.65 | 33 |
| 3 | F05, F06, F11, F21, F28, F29, F33, F41, F47, F48 | Lowest probabilities and impacts (Low Risk) | 0.33 - 0.49 | 0.43 - 0.58 | 10 |
Table 3.
Linguistic variables and the associated fuzzy numbers.
| Level of risk Probability or Impact | Fuzzy triangular number (FTN) | Defuzzified number range | Description |
|---|---|---|---|
| Very high | 0.7, 0.9, 1 | 0.7 to < 0.9 | Extremely high probability of risk event occurrence, with catastrophic impact on cost overrun. |
| High | 0.5, 0.7, 0.9 | 0.5 to < 0.7 | High probability of risk event occurrence, with significant impact on cost overrun. |
| Medium | 0.3, 0.5, 0.7 | 0.3 to < 0.5 | Moderate probability of risk event occurrence, with notable impact on cost overrun. |
| Low | 0.1, 0.3, 0.5 | 0.1 to < 0.3 | Low probability of risk event occurrence, with minor impact on cost overrun. |
| Very low | 0, 0.1, 0.3 | 0.025 to < 0.1 | Very low probability of risk event occurrence, with negligible impact on cost overrun. |
Table 4.
FGDMA outcomes of cost overrun factors.
| Code | Factor | Probability Score |
Impact Score |
Risk Score |
Rank |
|---|---|---|---|---|---|
| F16 | Inflation | 0.672 | 0.735 | 0.703 | 1 |
| F38 | Currency Issues | 0.659 | 0.719 | 0.688 | 2 |
| F15 | Cost of Materials | 0.662 | 0.711 | 0.686 | 3 |
| F39 | Market Fluctuations | 0.629 | 0.691 | 0.660 | 4 |
| F37 | Economic Challenges | 0.608 | 0.664 | 0.636 | 5 |
| F02 | Frequent Changes in Design | 0.582 | 0.649 | 0.615 | 6 |
| F44 | Cash Flows during Construction | 0.562 | 0.644 | 0.602 | 7 |
| F18 | Delayed Payments by Owner for Contractors | 0.562 | 0.633 | 0.596 | 8 |
| F19 | Financial Issues by Contractor | 0.538 | 0.650 | 0.591 | 9 |
| F46 | Poor Project Management | 0.532 | 0.650 | 0.588 | 10 |
| F22 | Project Estimation Problems | 0.530 | 0.647 | 0.585 | 11 |
| F31 | Delay in Materials | 0.549 | 0.622 | 0.585 | 12 |
| F45 | Poor Monitoring / Controlling Cost | 0.527 | 0.644 | 0.582 | 13 |
| F03 | Increase Additional Work Orders | 0.563 | 0.591 | 0.577 | 14 |
| F36 | Delay in Design Stage | 0.550 | 0.605 | 0.577 | 15 |
| F17 | Financial Impediments by Owner | 0.525 | 0.633 | 0.577 | 16 |
| F12 | Resource Planning & Allocation | 0.522 | 0.626 | 0.572 | 17 |
| F08 | Subcontractor Experience & Performance | 0.533 | 0.613 | 0.572 | 18 |
| F32 | Planning and Scheduling Issues | 0.533 | 0.598 | 0.564 | 19 |
| F25 | Delayed Decision-Making by Owners | 0.516 | 0.617 | 0.564 | 20 |
| F23 | Design Inefficiencies | 0.5311 | 0.5987 | 0.5639 | 21 |
| F10 | Availability of Materials | 0.5200 | 0.6113 | 0.5638 | 22 |
| F13 | Contractual Ambiguity and Contradiction | 0.5037 | 0.6165 | 0.5572 | 23 |
| F07 | Contractor Experience | 0.5015 | 0.6172 | 0.5564 | 24 |
| F26 | Political Interference | 0.5030 | 0.6113 | 0.5545 | 25 |
| F27 | Contractual Claims & Disputes | 0.5179 | 0.5934 | 0.5544 | 26 |
| F43 | Mistakes / Deficiency in BOQ | 0.5061 | 0.6048 | 0.5532 | 27 |
| F09 | Poor Site Management Supervision | 0.5090 | 0.5918 | 0.5489 | 28 |
| F20 | Bad Execution Problems | 0.4954 | 0.6046 | 0.5472 | 29 |
| F14 | Bidding and Tendering Difficulties | 0.5008 | 0.5958 | 0.5463 | 30 |
| F01 | Define the Scope | 0.4860 | 0.6118 | 0.5453 | 31 |
| F42 | Unclear or Changes in Specification | 0.4976 | 0.5919 | 0.5427 | 32 |
| F40 | Owner Interference | 0.5072 | 0.5682 | 0.5368 | 33 |
| F35 | Market and Supply Conditions | 0.4980 | 0.5779 | 0.5365 | 34 |
| F34 | Cost of Equipment | 0.5104 | 0.5636 | 0.5363 | 35 |
| F24 | Wastage of materials on site | 0.5026 | 0.5699 | 0.5352 | 36 |
| F04 | Project Specifications and Feasibility | 0.4691 | 0.6050 | 0.5327 | 37 |
| F30 | Lack of Coordination & Cooperation | 0.4915 | 0.5737 | 0.5310 | 38 |
| F06 | Labour Productivity | 0.4905 | 0.5427 | 0.5160 | 39 |
| F21 | Unforeseeable Site and Soil Conditions | 0.4404 | 0.5845 | 0.5074 | 40 |
| F05 | Labour Availability and Skills | 0.4690 | 0.5399 | 0.5032 | 41 |
| F11 | Equipment Suitability and Availability | 0.4504 | 0.5391 | 0.4927 | 42 |
| F33 | Cost of Labour | 0.4801 | 0.5031 | 0.4915 | 43 |
| F29 | Lack of Communication between Parties | 0.4576 | 0.5231 | 0.4892 | 44 |
| F48 | HSE Management | 0.4586 | 0.5067 | 0.4821 | 45 |
| F28 | Bureaucratic & Unethical Behavior | 0.4308 | 0.5175 | 0.4721 | 46 |
| F41 | Force Majeure | 0.3332 | 0.5711 | 0.4363 | 47 |
| F47 | Adverse Weather Conditions | 0.3530 | 0.4308 | 0.3900 | 48 |
Table 5.
Ranking of the top 20 factors from a stakeholder perspective.
| ID | Factor | GE score | Rank | CS score |
Rank | MC score |
Rank | OW score |
Rank |
| F16 | Inflation | 0.703 | 1 | 0.694 | 1 | 0.714 | 1 | 0.717 | 1 |
| F38 | Currency Issues | 0.688 | 2 | 0.674 | 3 | 0.710 | 2 | 0.709 | 2 |
| F15 | Cost of Materials | 0.686 | 3 | 0.683 | 2 | 0.695 | 3 | 0.676 | 3 |
| F39 | Market Fluctuations | 0.660 | 4 | 0.648 | 4 | 0.679 | 4 | 0.667 | 5 |
| F37 | Economic Challenges | 0.636 | 5 | 0.628 | 5 | 0.648 | 5 | 0.645 | 7 |
| F02 | Frequent Changes in Design | 0.615 | 6 | 0.591 | 9 | 0.641 | 6 | 0.668 | 4 |
| F44 | Cash Flows during Construction | 0.602 | 7 | 0.604 | 7 | 0.592 | 9 | 0.618 | 13 |
| F18 | Delayed Payments by Owner for Contractors | 0.596 | 8 | 0.607 | 6 | 0.584 | 11 | 0.576 | 28 |
| F19 | Financial Issues by Contractor | 0.591 | 9 | 0.576 | 13 | 0.607 | 7 | 0.627 | 10 |
| F46 | Poor Project Management | 0.588 | 10 | 0.594 | 8 | 0.565 | 20 | 0.623 | 11 |
| F22 | Project Estimation Problems | 0.585 | 11 | 0.591 | 10 | 0.570 | 17 | 0.599 | 18 |
| F31 | Delay in Materials | 0.585 | 12 | 0.570 | 16 | 0.601 | 8 | 0.621 | 12 |
| F45 | Poor Monitoring / Controlling Cost | 0.582 | 13 | 0.582 | 11 | 0.566 | 19 | 0.629 | 9 |
| F03 | Increase Additional Work Orders | 0.577 | 14 | 0.575 | 14 | 0.576 | 15 | 0.590 | 22 |
| F36 | Delay in Design Stage | 0.577 | 15 | 0.562 | 20 | 0.581 | 12 | 0.648 | 6 |
| F17 | Financial Impediments by Owner | 0.577 | 16 | 0.580 | 12 | 0.560 | 23 | 0.606 | 17 |
| F12 | Resource Planning & Allocation | 0.572 | 17 | 0.565 | 18 | 0.580 | 13 | 0.586 | 23 |
| F08 | Subcontractor Experience & Performance | 0.572 | 18 | 0.563 | 19 | 0.573 | 16 | 0.615 | 14 |
| F32 | Planning and Scheduling Issues | 0.564 | 19 | 0.566 | 17 | 0.561 | 22 | 0.568 | 33 |
| F25 | Delayed Decision-Making by Owners | 0.564 | 20 | 0.549 | 26 | 0.577 | 14 | 0.608 | 16 |
| F23 | Design Inefficiencies | 0.564 | 21 | 0.548 | 28 | 0.568 | 18 | 0.639 | 8 |
| F10 | Availability of Materials | 0.564 | 22 | 0.544 | 32 | 0.586 | 10 | 0.610 | 15 |
| F13 | Contractual Ambiguity and Contradiction | 0.557 | 23 | 0.551 | 24 | 0.557 | 24 | 0.596 | 19 |
| F07 | Contractor Experience | 0.556 | 24 | 0.547 | 30 | 0.563 | 21 | 0.592 | 20 |
| F24 | Wastage of materials on site | 0.535 | 36 | 0.572 | 15 | 0.470 | 44 | 0.525 | 40 |
Note: GE means General for all responses, CS means for Contractor/ Subcontractor responses, MC means Management Firm / Consultancy, and OW means Owner/Client responses.
Disclaimer/Publisher’s Note: The statements, opinions and data contained in all publications are solely those of the individual author(s) and contributor(s) and not of MDPI and/or the editor(s). MDPI and/or the editor(s) disclaim responsibility for any injury to people or property resulting from any ideas, methods, instructions or products referred to in the content. |
© 2025 by the authors. Licensee MDPI, Basel, Switzerland. This article is an open access article distributed under the terms and conditions of the Creative Commons Attribution (CC BY) license (http://creativecommons.org/licenses/by/4.0/).
Copyright: This open access article is published under a Creative Commons CC BY 4.0 license, which permit the free download, distribution, and reuse, provided that the author and preprint are cited in any reuse.


