Introduction
Policy initiatives in Chinese communities, as basic units of social organization are integral to daily life and closely linked to the public. With socioeconomic development and improved living standards, community sports have become an essential aspect of life in China, enabling more people to engage in physical activities and enhance physical and mental health (Urban Community Sports Facilities Construction Land Index) [
1]. In 2020, the State Council issued the Opinions on Strengthening the Construction of Fitness Venues and Promoting Mass Sports, which mandated that community fitness facilities in new residential areas be planned, constructed, inspected, and delivered in tandem with housing developments. Facilities must not be repurposed or infringed upon, and property management companies are encouraged to build additional fitness space as needed [
2]. Sports facilities should be integrated into urban renewal plans in older neighborhoods, with flexible construction of non-standardized venues where necessary (Opinions on strengthening Fitness Venues). These efforts aim to improve the public fitness service system and expand access to fitness facilities [
3].
In 2022, the state council issued the Opinions on Building a Higher-Level Public Fitness Service System, emphasizing the need to allocate resources based on population demographics and ensure equitable access to fitness facilities in urban and rural areas [
4]. The policy encourages the integration of fitness spaces, such as riverwalks and greenways within the metropolitan fitness plans. Concurrently, the Guidelines for Building Complete Residential Communities, issued by the Ministry of Housing and Urban-Rural Development, promote the “15-minute life circle” concept, which facilitates the inclusion of fitness amenities within walking or cycling distance of residential areas [
5]. Community sports facility development has become central to China's national fitness strategy, aiming to integrate physical activity into daily life and foster comprehensive community development. However, there remains a gap between increasing fitness demand and the availability of adequate sports facilities. A 2017 WHO report identified physical inactivity as the fourth leading cause of global mortality, with over 80% of adolescents not meeting recommended activity levels. The China 2020 National Fitness Survey found that while a growing number of citizens recognize the benefits of physical activity, lack of road access and uneven spatial distribution of sports facilities still pose major barriers to participation in strategic and fitness activities [
6]. Participatory programs also require a “10 -Minute Fitness Circle” in other residential areas, which requires not ideally, everyone has access to indoor and outdoor physical activity space This approach emphasizes the city’s commitment to improving access to physical activity through community programs and addressing the diversity of community needs [
7].
Behavioral spatial theory examines the relationship between human behavior and the spatial environment and explains how physical interaction defines spatial perception. It emerged in the 1960s through Merleau-Ponty's research into the role of the body in spatial perception [
8]. This theory has broad applications in psychology, geography, and anthropology, and is heard by methods that field research, experimental research, and theory serve to examine how human behavior evolves across spatial contexts and behavioral psychology, founded by John Watson, examines how environmental stimuli shape behavior in visual and cognitive responses [
9]. It emphasizes the integration of behavioral and psychological research. Emphasize the integration of behavioral psychology to understand how the spatial environment influences human behavior.
1. Methods
1.1. Study Region
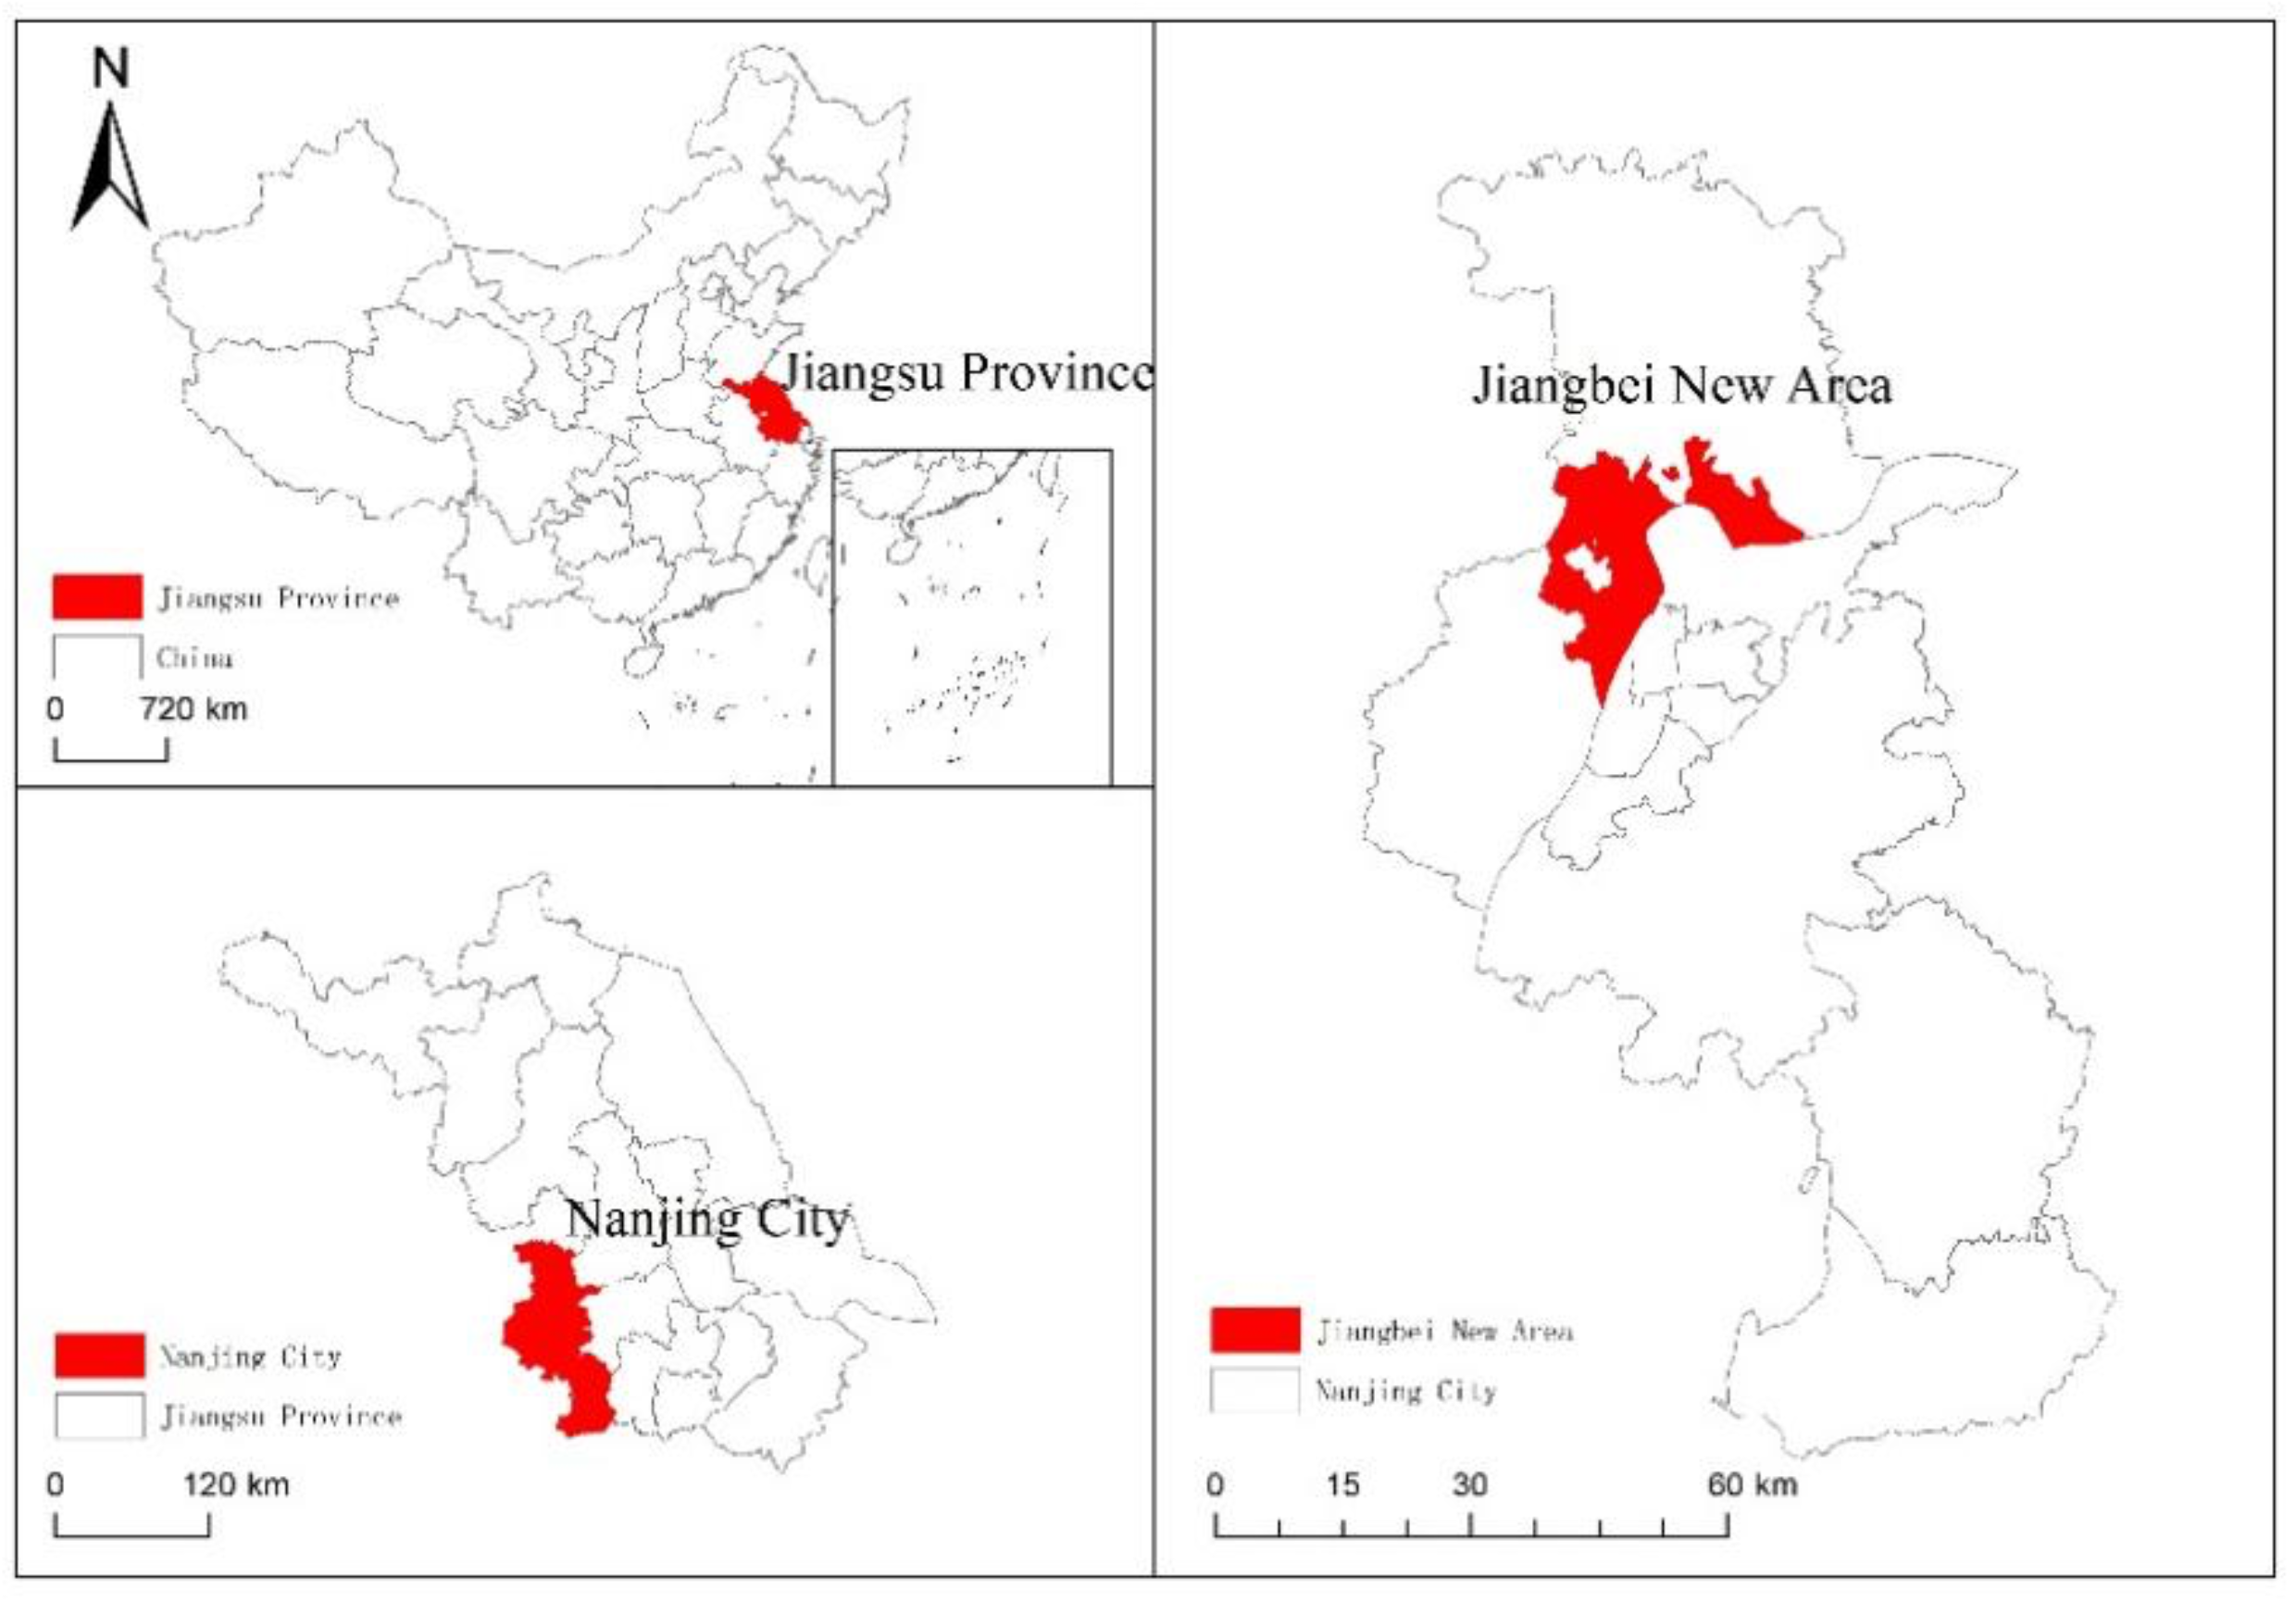
JiangBei New District, located in northern Nanjing, Jiangsu province spans 386.25 square kilometers was selected as the research object for this study (
Figure 1). Home to approximately 1.08 million people, it has emerged as a center for innovation and industrial development aligned with the “Three Zones and One Platform” strategy and hosts the China pilot free trade zone [
10]. The district GDP will surpass 370 billion RMB by 2022, contributing over 20% to Nanjing's economy [
11]. To promote public health, the district has implemented the “10-minute fitness circle” initiative enhancing accessibility to sports facilities through public welfare funds from the sports lottery [
12].
1.2. Design of the Questionnaire
1.2.1. Initial Selection of Items
An initial selection of items for the community sports facilities supply capacity questionnaire was undertaken through a pre-survey designed to identify potential design issues and conduct reliability testing and exploratory factor analysis (EFA) [
13]. A sample of 100 residents from 10 communities was chosen, meeting the conditions required for factor analysis. Online and offline methods were utilized, yielding 97 valid responses after excluding extreme values and incomplete data, resulting in a 97% valid response rate. This process enabled the refinement of key questionnaire items for further testing, ensuring the robustness of the initial item selection.
1.2.2. Optimization of Items
For the formal survey, a refined sample of 510 retired elderly residents from 51 communities was selected, exceeding the minimum threshold for structural equation modeling (SEM) analysis [
14]. By focusing on this specific demographic, characterized by greater leisure time, the study aimed to enhance the precision and relevance of the findings. The distribution of the community sports facilities supply capacity questionnaire was conducted offline to ensure higher response accuracy, and following data cleaning, 489 valid responses were obtained, representing a 95.88% valid response rate. This approach optimized the selection of respondents and questionnaire items, ensuring robust data for the subsequent analysis and model refinement in SEM.
1.3. Procedure
Using a random sampling method, the survey was conducted between study periods from November 10, 2023, to November 20, 2023. For those participants who had difficulty reading or completing the questionnaire, the survey was administered face-to-face, allowing participants to respond with help A total of 500 questionnaires were distributed, with 489 valid responses for a valid response rate of 95.88%. This high level of randomness in the sample increases the reliability of the research findings.
1.4. Statistical Analysis
Structural equation modeling (SEM) is a complex multivariate analysis method for developing, estimating, and testing models of causal relationships (AMOS 24.0) It includes directly measurable observed variables and observable latent variables straight together [
15]. SEM offers a comprehensive framework, which is an extension of traditional methods such as multiple regression, path analysis, factor analysis, and analysis of covariance Using SEM, researchers can examine the influence of individual factors on overall results is the relationship between variables examined. Compared to the traditional approach, SEM not only describes the variability in the data but also provides insight into the covariate relationships between variables. There are two main types of factor analysis in SEM: exploratory factor analysis (EFA) and confirmatory factor analysis (CFA). EFA is used to identify underlying structures in data sets, while CFA is used to confirm hypotheses about the relationships between observed and latent variables Based on the CFA results with a structural model a suggests barriers to physical activity [
16].
2. Results
2.1. Development of the Conceptual Model
2.1.1. Analysis of Validity
Before conducting exploratory factor analysis (EFA), the reliability and validity of the data must be assessed. In this study, reliability was analyzed using SPSS 26.0 based on valid data from 100 samples. The preliminary questionnaire consisted of 14 items, and reliability was evaluated, before EFA. The Cronbach Alpha coefficient for the standardized items was 0.953, demonstrating a high level of reliability for the questionnaire (
Table 1). To assess the validity, Bartlett’s test of sphericity and the Kaiser-Meyer-Olkin (KMO) test were employed. As shown in
Table 2 the KMO value was 0.884 (KMO> 0.60), indicating an adequate sampling adequacy and strong correlation among the variables. Bartlett’s test of sphericity yielded X
2 = 1042. 576, df= 66, (p > 0.001), confirming significant intercorrelation among the observed variables. These results demonstrate that the data fit exploratory factor analysis (EFA).
2.1.2. Exploratory Factor Analysis
An exploratory factor analysis (EFA) was conducted to identify the key factors underlying constructs related to physical activity and residential satisfaction within the dataset. Using principal component analysis with varimax rotation, orthogonal factors with eigenvalues exceeding one were extracted shown in
Table 3. The EFA results revealed multiple factors that explained a considerable portion of the total variance. The first factor, "community facilities and space” accounted for a substantial share of the variance. Factor loadings for this component were notably high with items such as B1 (0.813) and B4 (0.822) demonstrating strong associations. The second factor termed “resident demand” also exhibited high factor loadings particularly on items A1 (0.847) and A3 (0.782), reflecting community needs and satisfaction. Another significant factor was “physical exercise behavior” with factor loadings ranging from 0.786 to 0.846 across related items (C1-C3), indicating the participant's engagement in physical activities. Finally, the factor labeled “Residential Satisfaction” showed robust factor loadings on items such as D1 (0.854) and D3 (0.868) emphasizing the influence of physical activity on overall satisfaction with the living environment. Together these factors accounted for a significant proportion of the total variance, with factor loadings ranging from 0.407 to 0.868 across the various components providing a comprehensive understanding of the underlying constructs.
2.1.3. Confirmatory Factor Analysis (CFA)
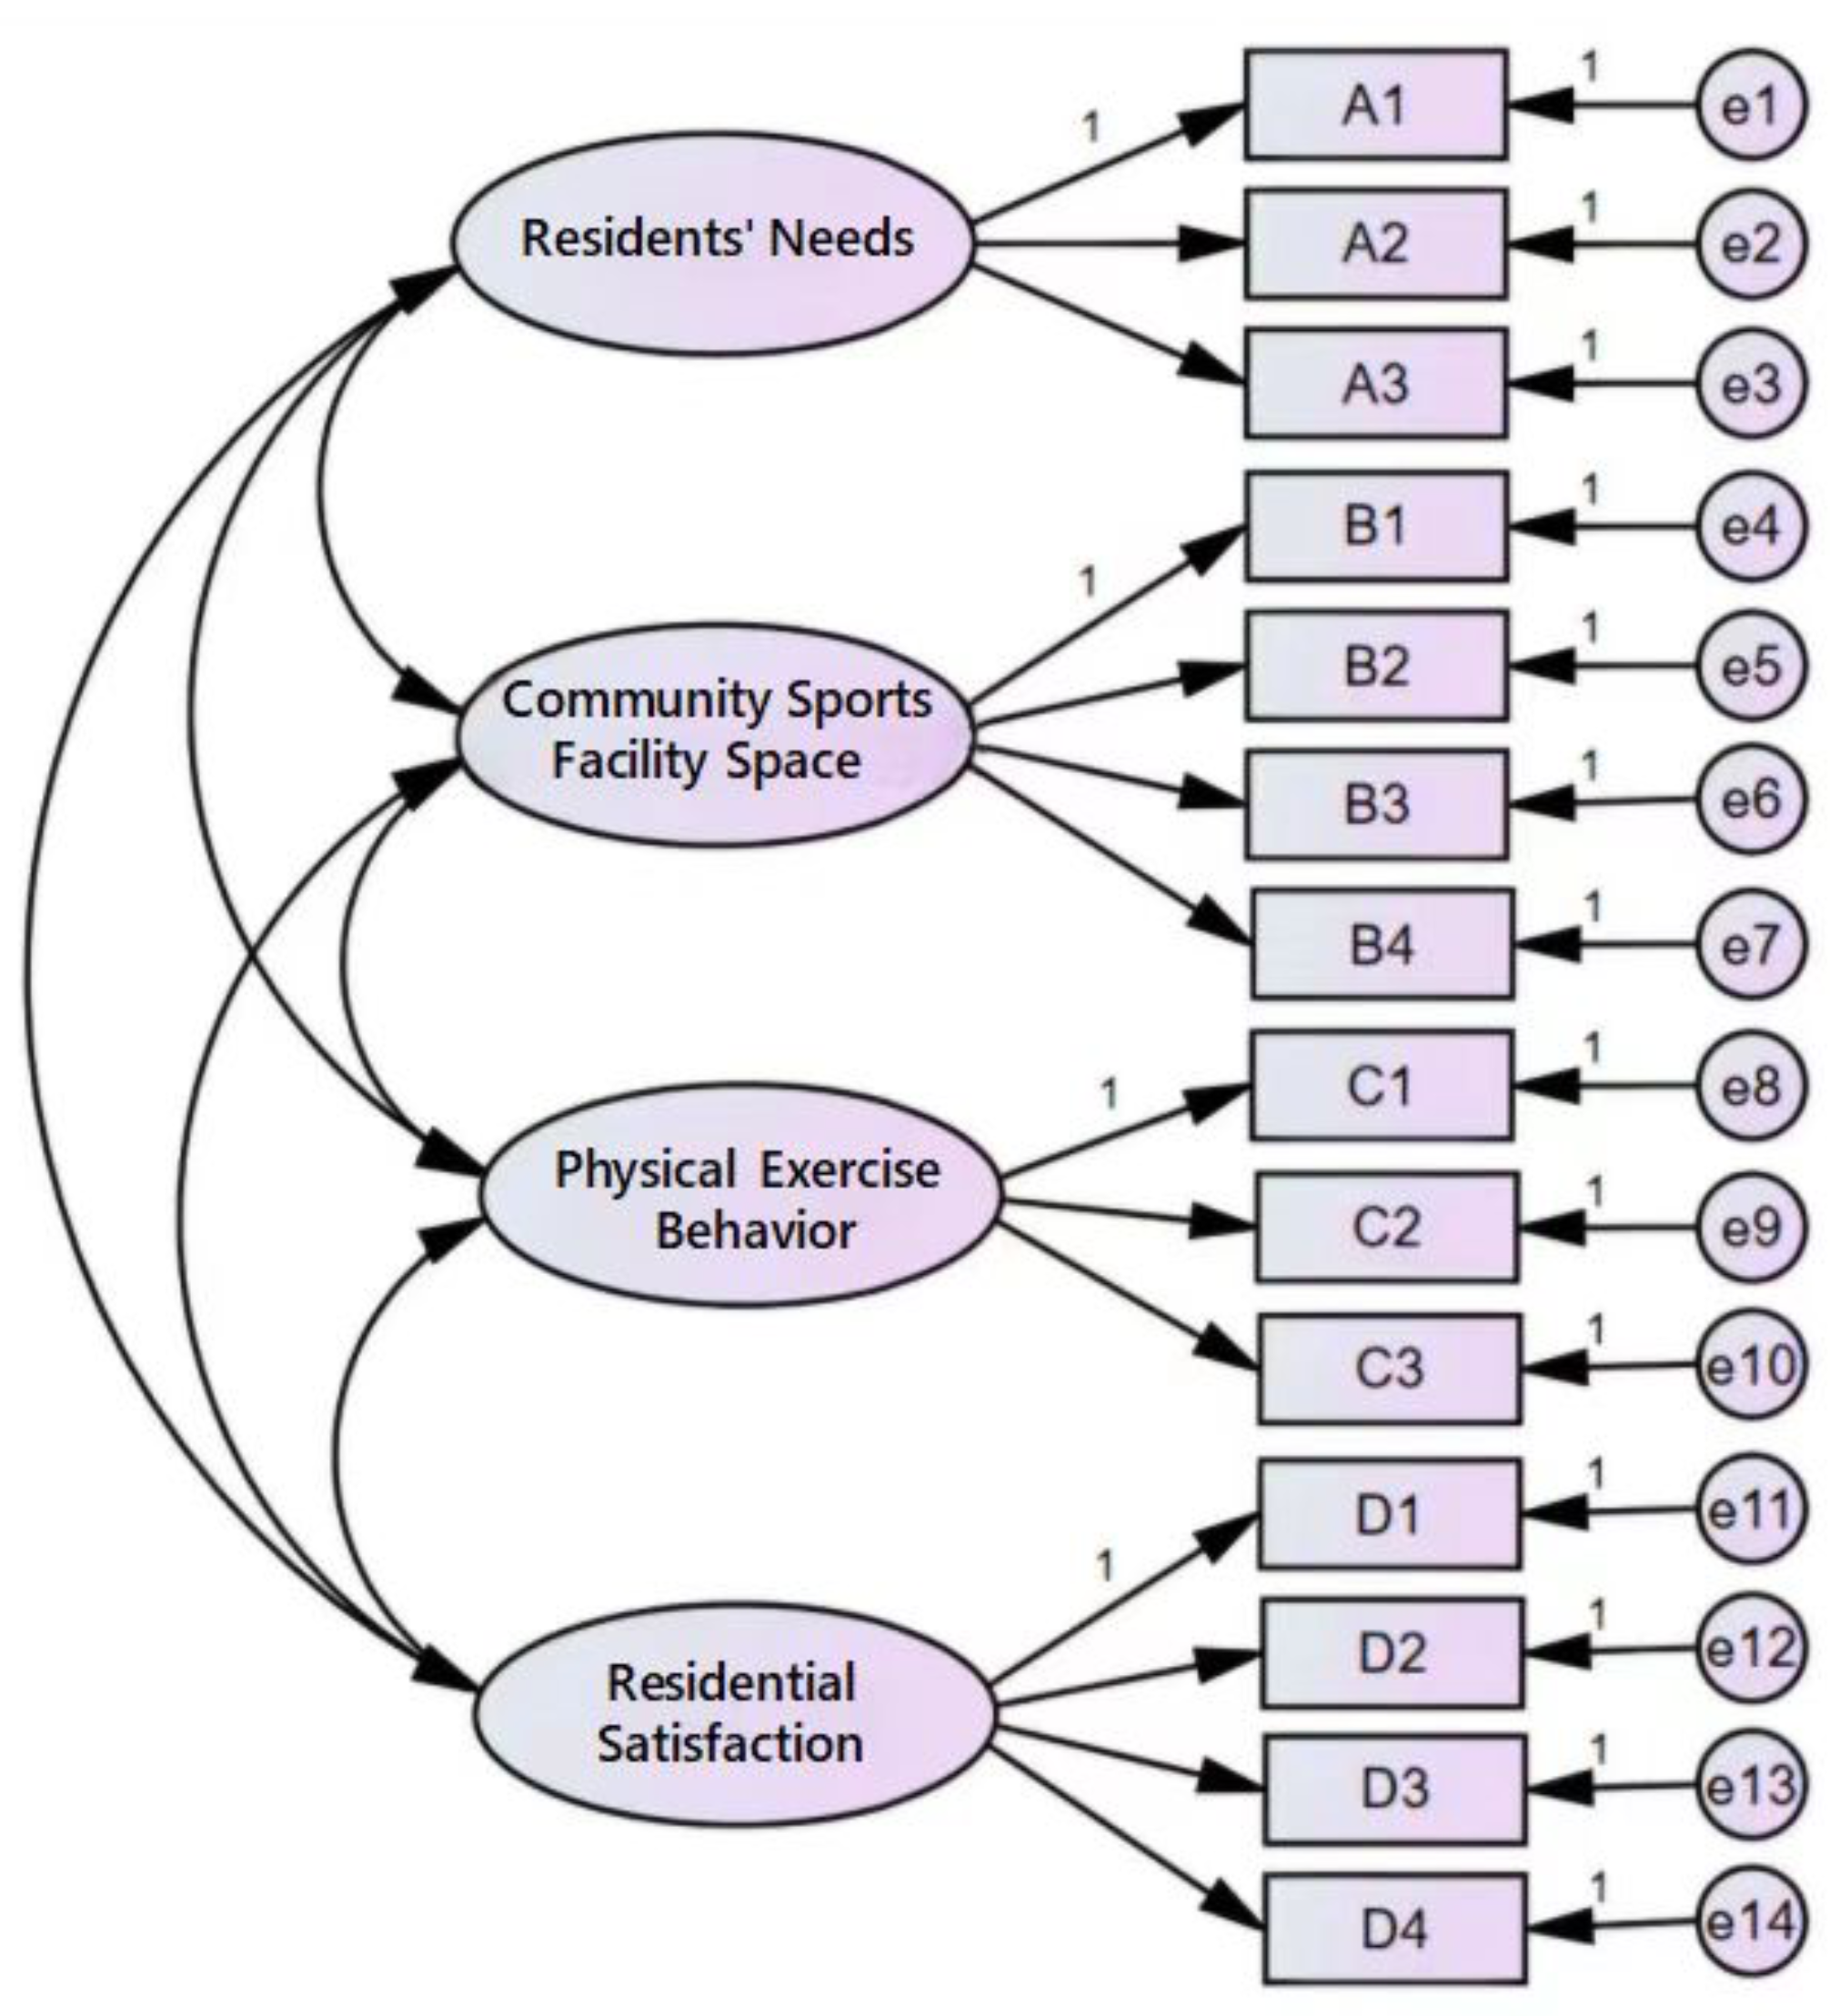
The latent variables identified through exploratory factor analysis (EFA) were used to develop a measurement model, where the corresponding factors were used as observed variables These measures were formulated using a structural equation model (SEM). Confirmatory factor analysis (CFA) was conducted to assess the reliability and validity of the model (
Table 4). For reliability analysis, Cronbach’s α coefficients were calculated for each latent variable. The results showed that all Cronbach’s α values were above 0.7, indicating strong reliability. For example, the Cronbach α coefficient for “resident requirements” was 0.931, and “local sports facility” was 0.769, indicating high internal consistency among the variables identified in each latent building as shown in
Figure 2.
Several key indices were examined to assess the adequacy of the model in terms of model fit. The chi-square to degrees of freedom ratio (X2/DF) was 2.234, which falls within the acceptable range from 1 to 3, indicating a reasonable fit of the model. Additionally, the root mean square error of approximation (RMSEA) was 0.050 below the threshold of 0.08 further supporting a good fit. Other fit indices, such as the goodness of fit index (GFI= 0.956) and the adjusted goodness of fit index (AGFI = 0.936), both exceeded the recommended threshold of 0.9 indicating that the model fits the data well. Overall, the CFA validated the reliability and internal consistency of the measurement model, with the fit indices confirming that the model adequately represents the data without the need for further modifications.
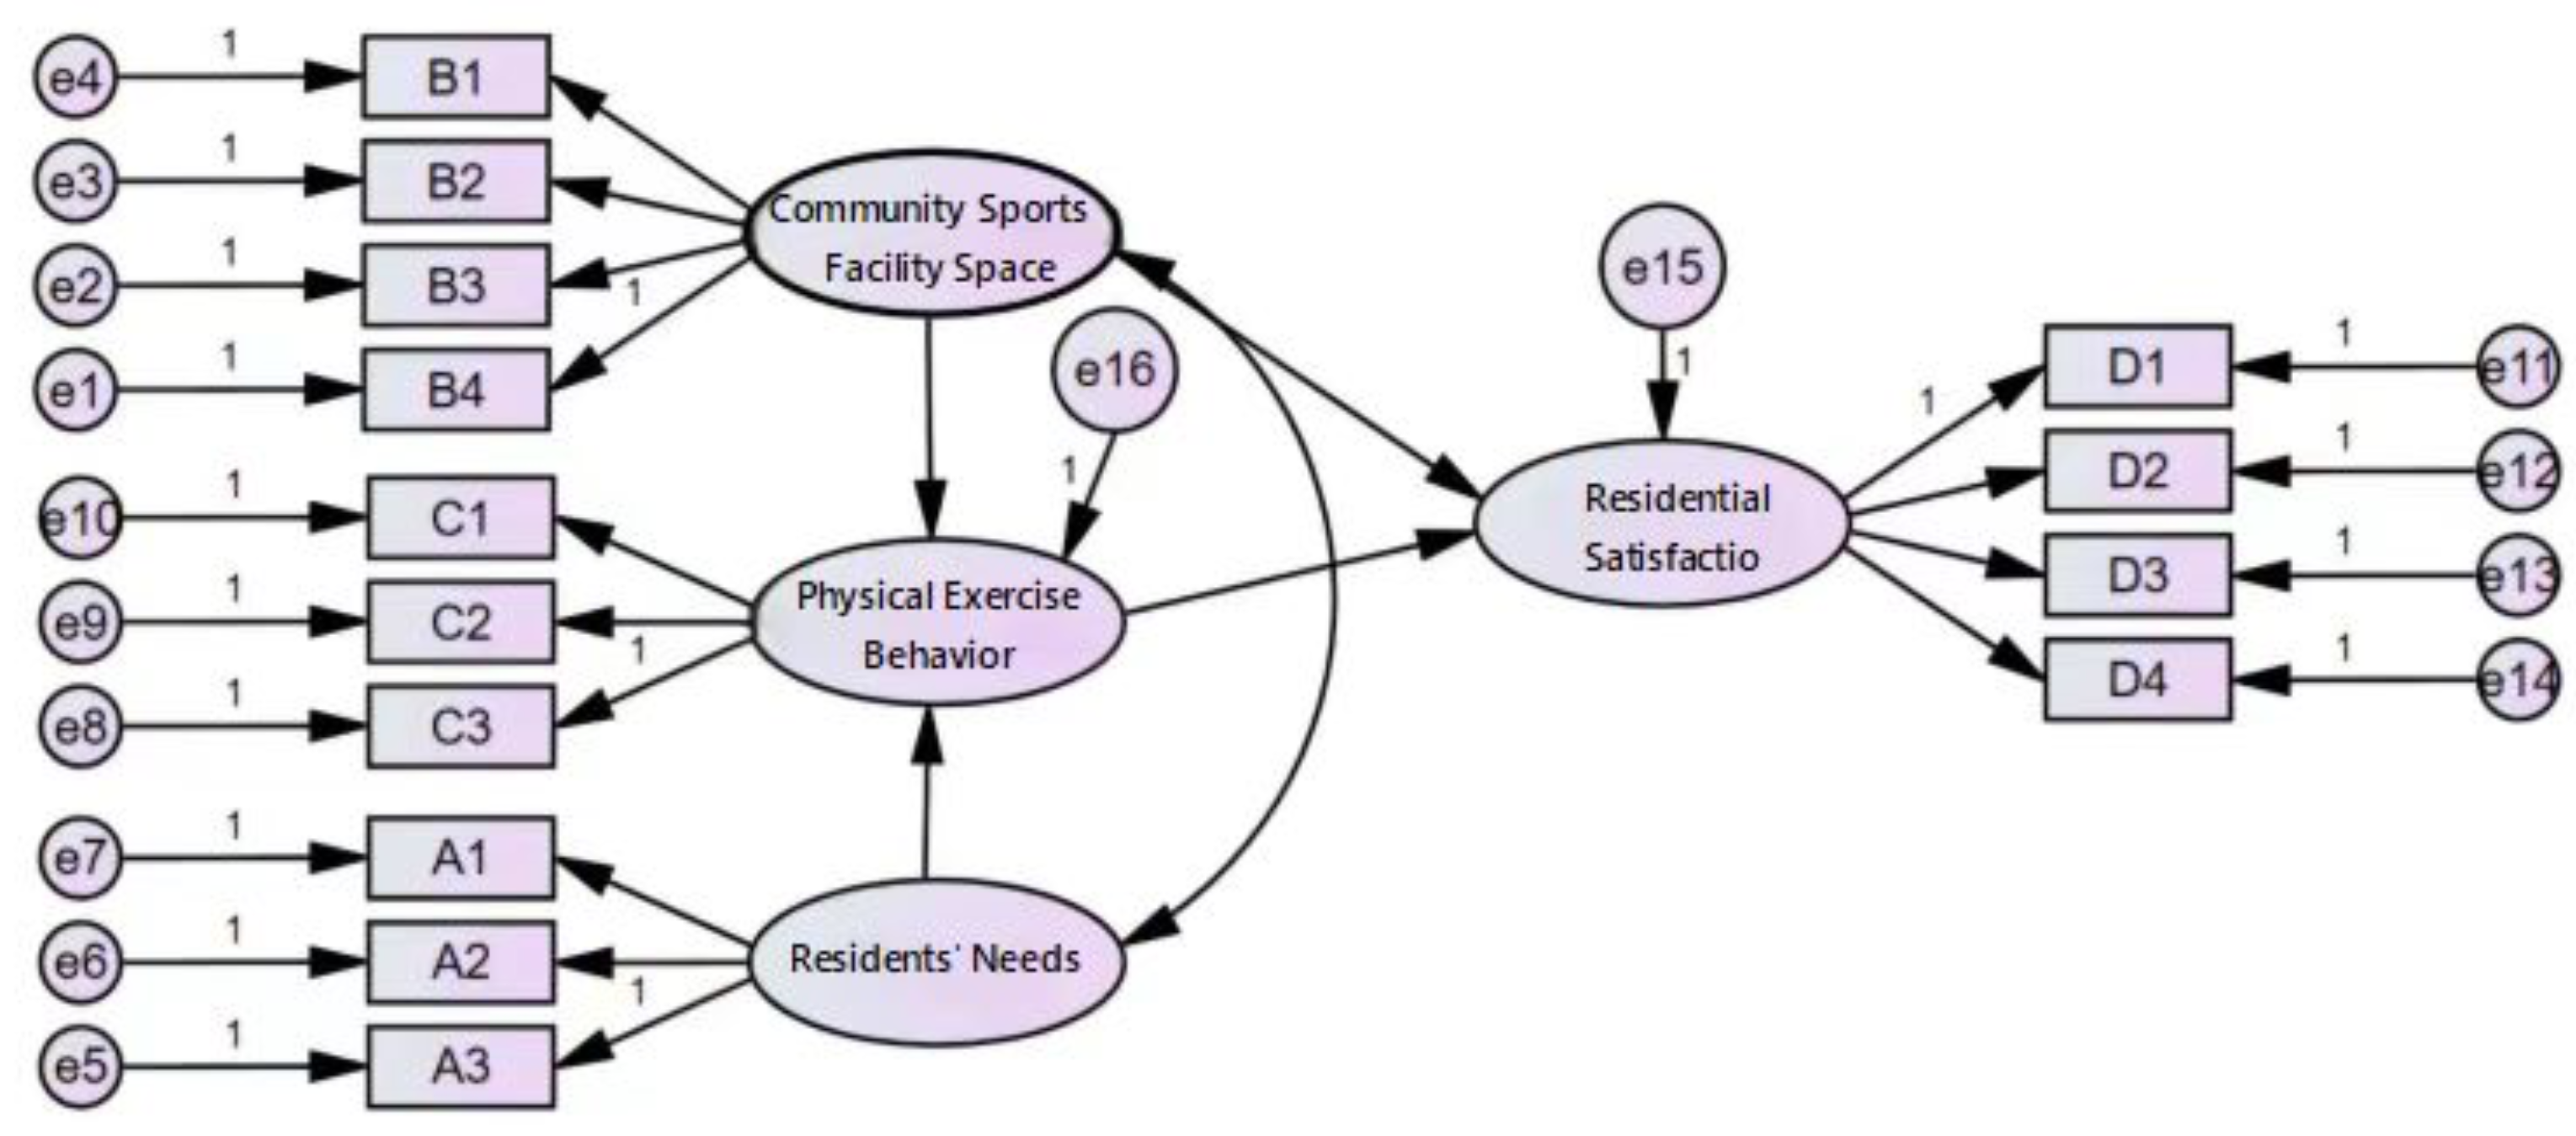
2.2. Construction of Structural Equation Model
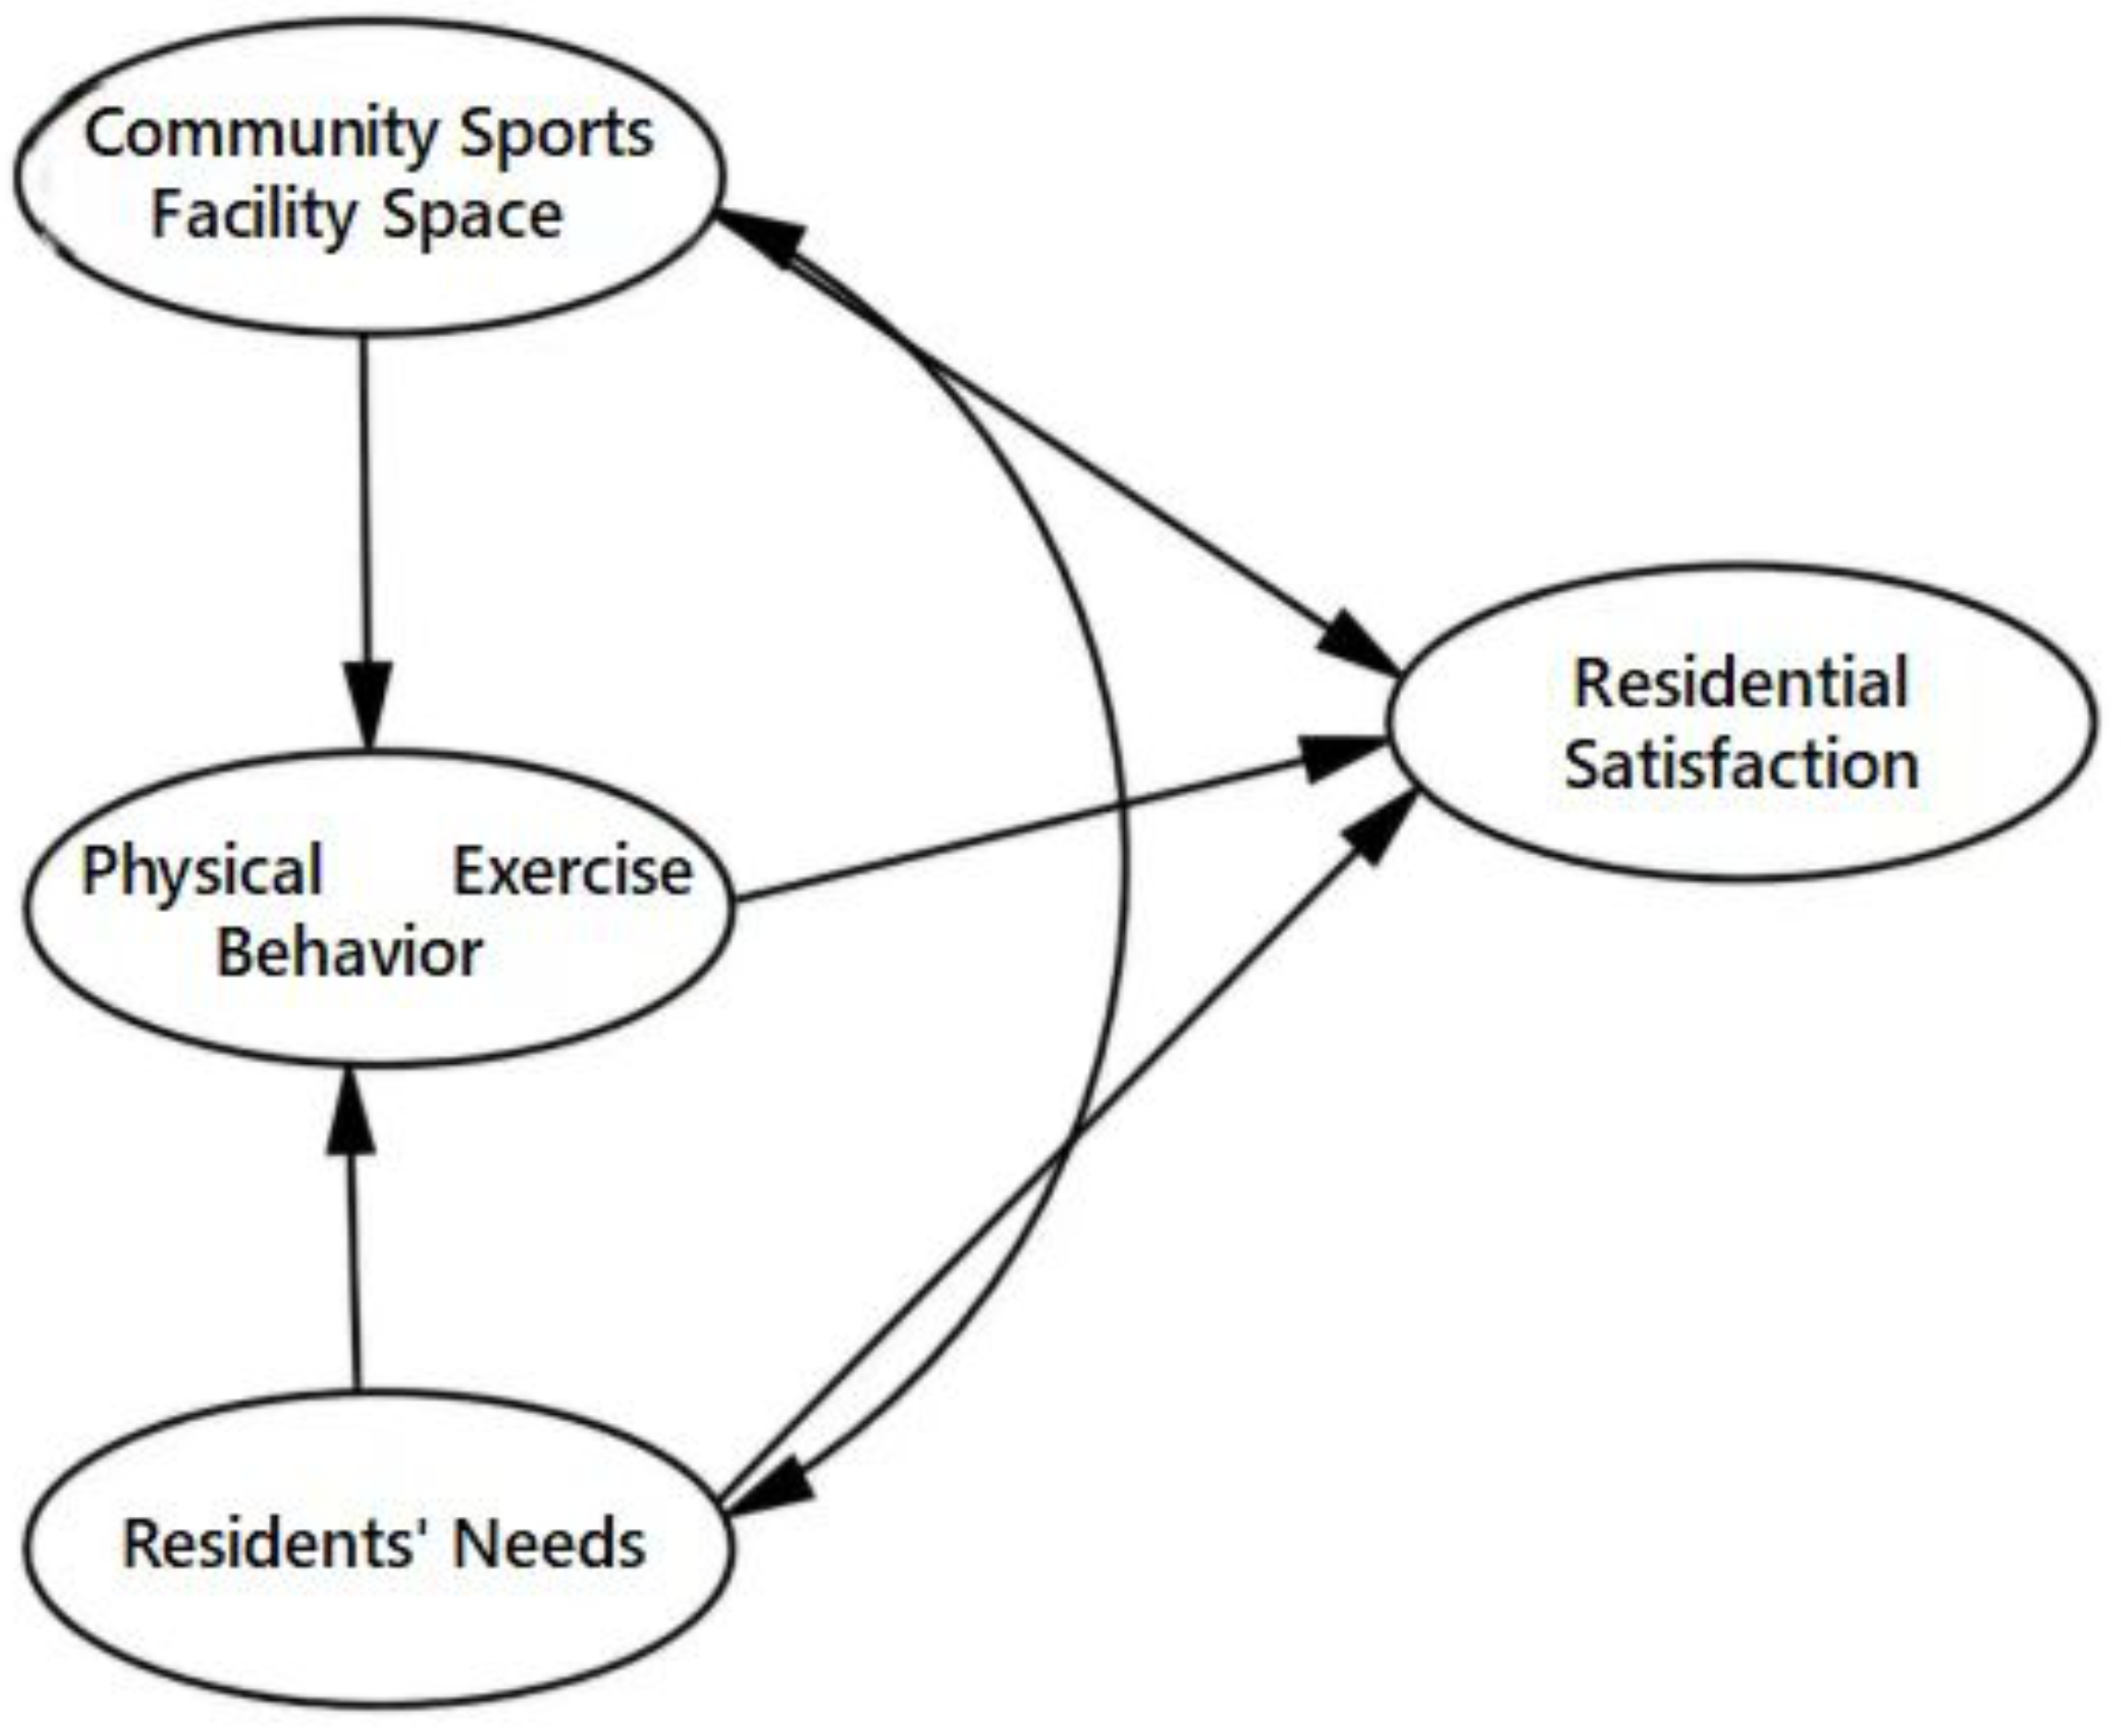
The conceptual structure equation model describing the relationships between the latent variables in the study on community sports facilities is illustrated in
Figure 3 The model hypothesizes several key relationships between factors influencing the supply and demand of these facilities;
H1. the spatial attributes of community sports facilities positively impact resident's exercise behavior. This suggests that improved spatial characteristics such as proximity and diversity of the facilities, foster increased physical activity.
H2. Resident's demand has a positive influence on their exercise behavior. Higher demand, driven by the specific needs of residents is expected to lead to greater engagement in physical activities.
H3. Resident demand positively influences resident satisfaction. Improvements to access roads are also proposed to meet the demand for additional amenities to ensure residential satisfaction for all residents.
H4. The quality and availability of neighborhood playgrounds significantly increase residential satisfaction. This hypothesis suggests that well-managed, accessible, and diverse sports venues increase satisfaction with the community.
H5. Exercise behavior has a direct positive effect on resident satisfaction. Increased physical activity is expected to increase satisfaction with the environment, emphasizing the benefits of an active lifestyle on residents’ well-being.
This hypothesis provides a comprehensive framework for examining how the availability and use of community play spaces, community demands, and physical activity practices interact to affect overall residential satisfaction. This framework provides valuable insights into how to optimize supply and demand dynamics in these areas to promote local health and well-being.
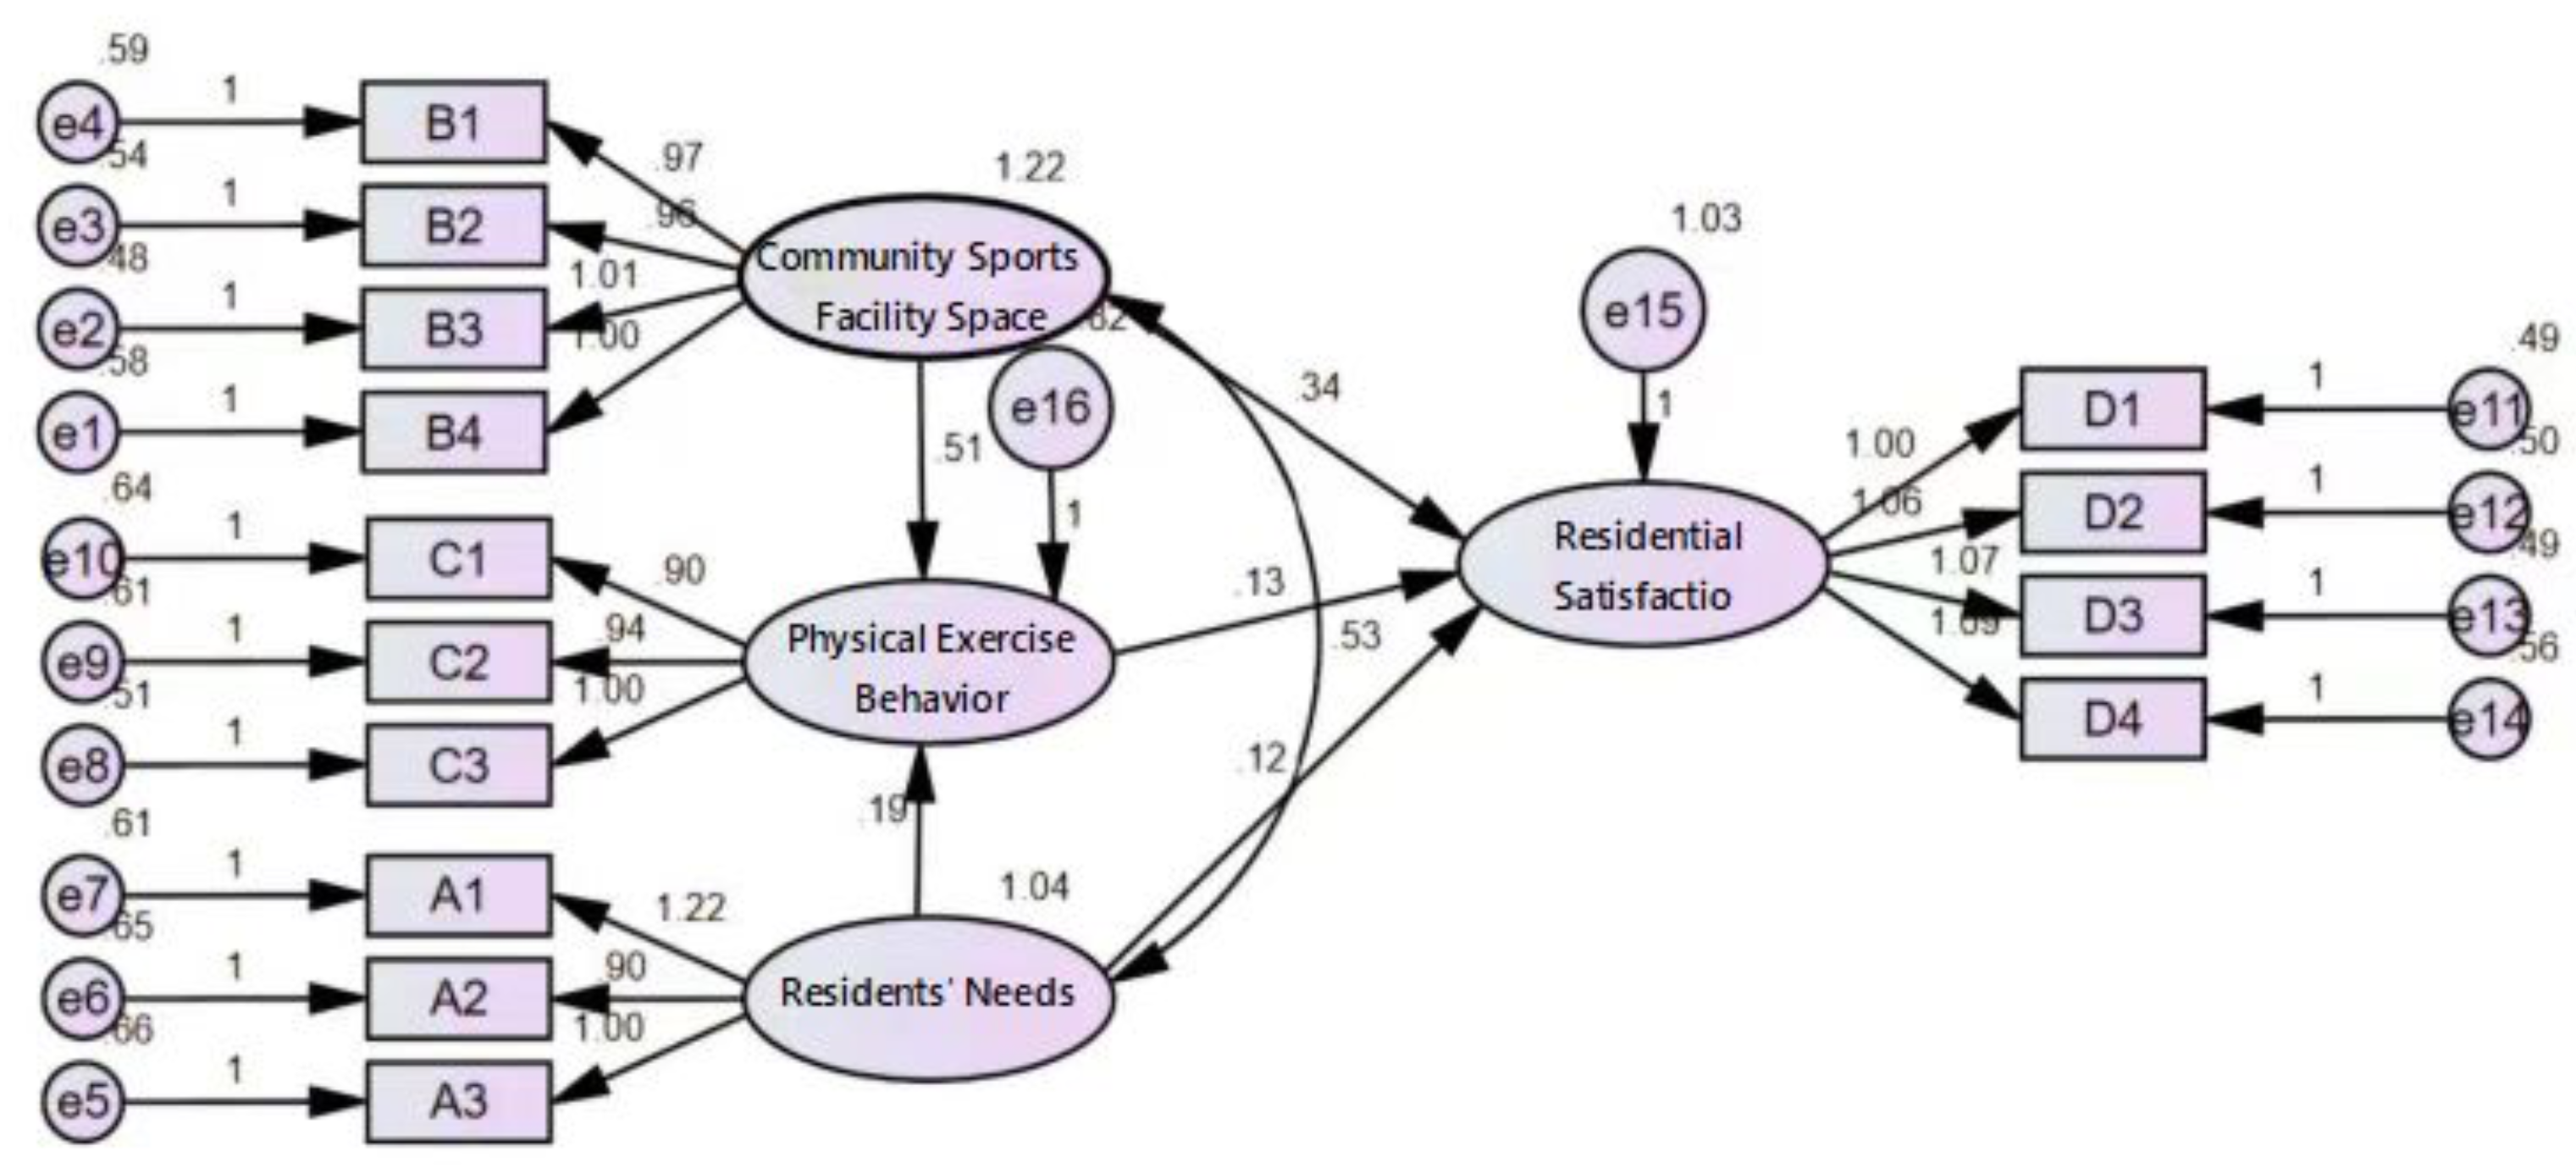
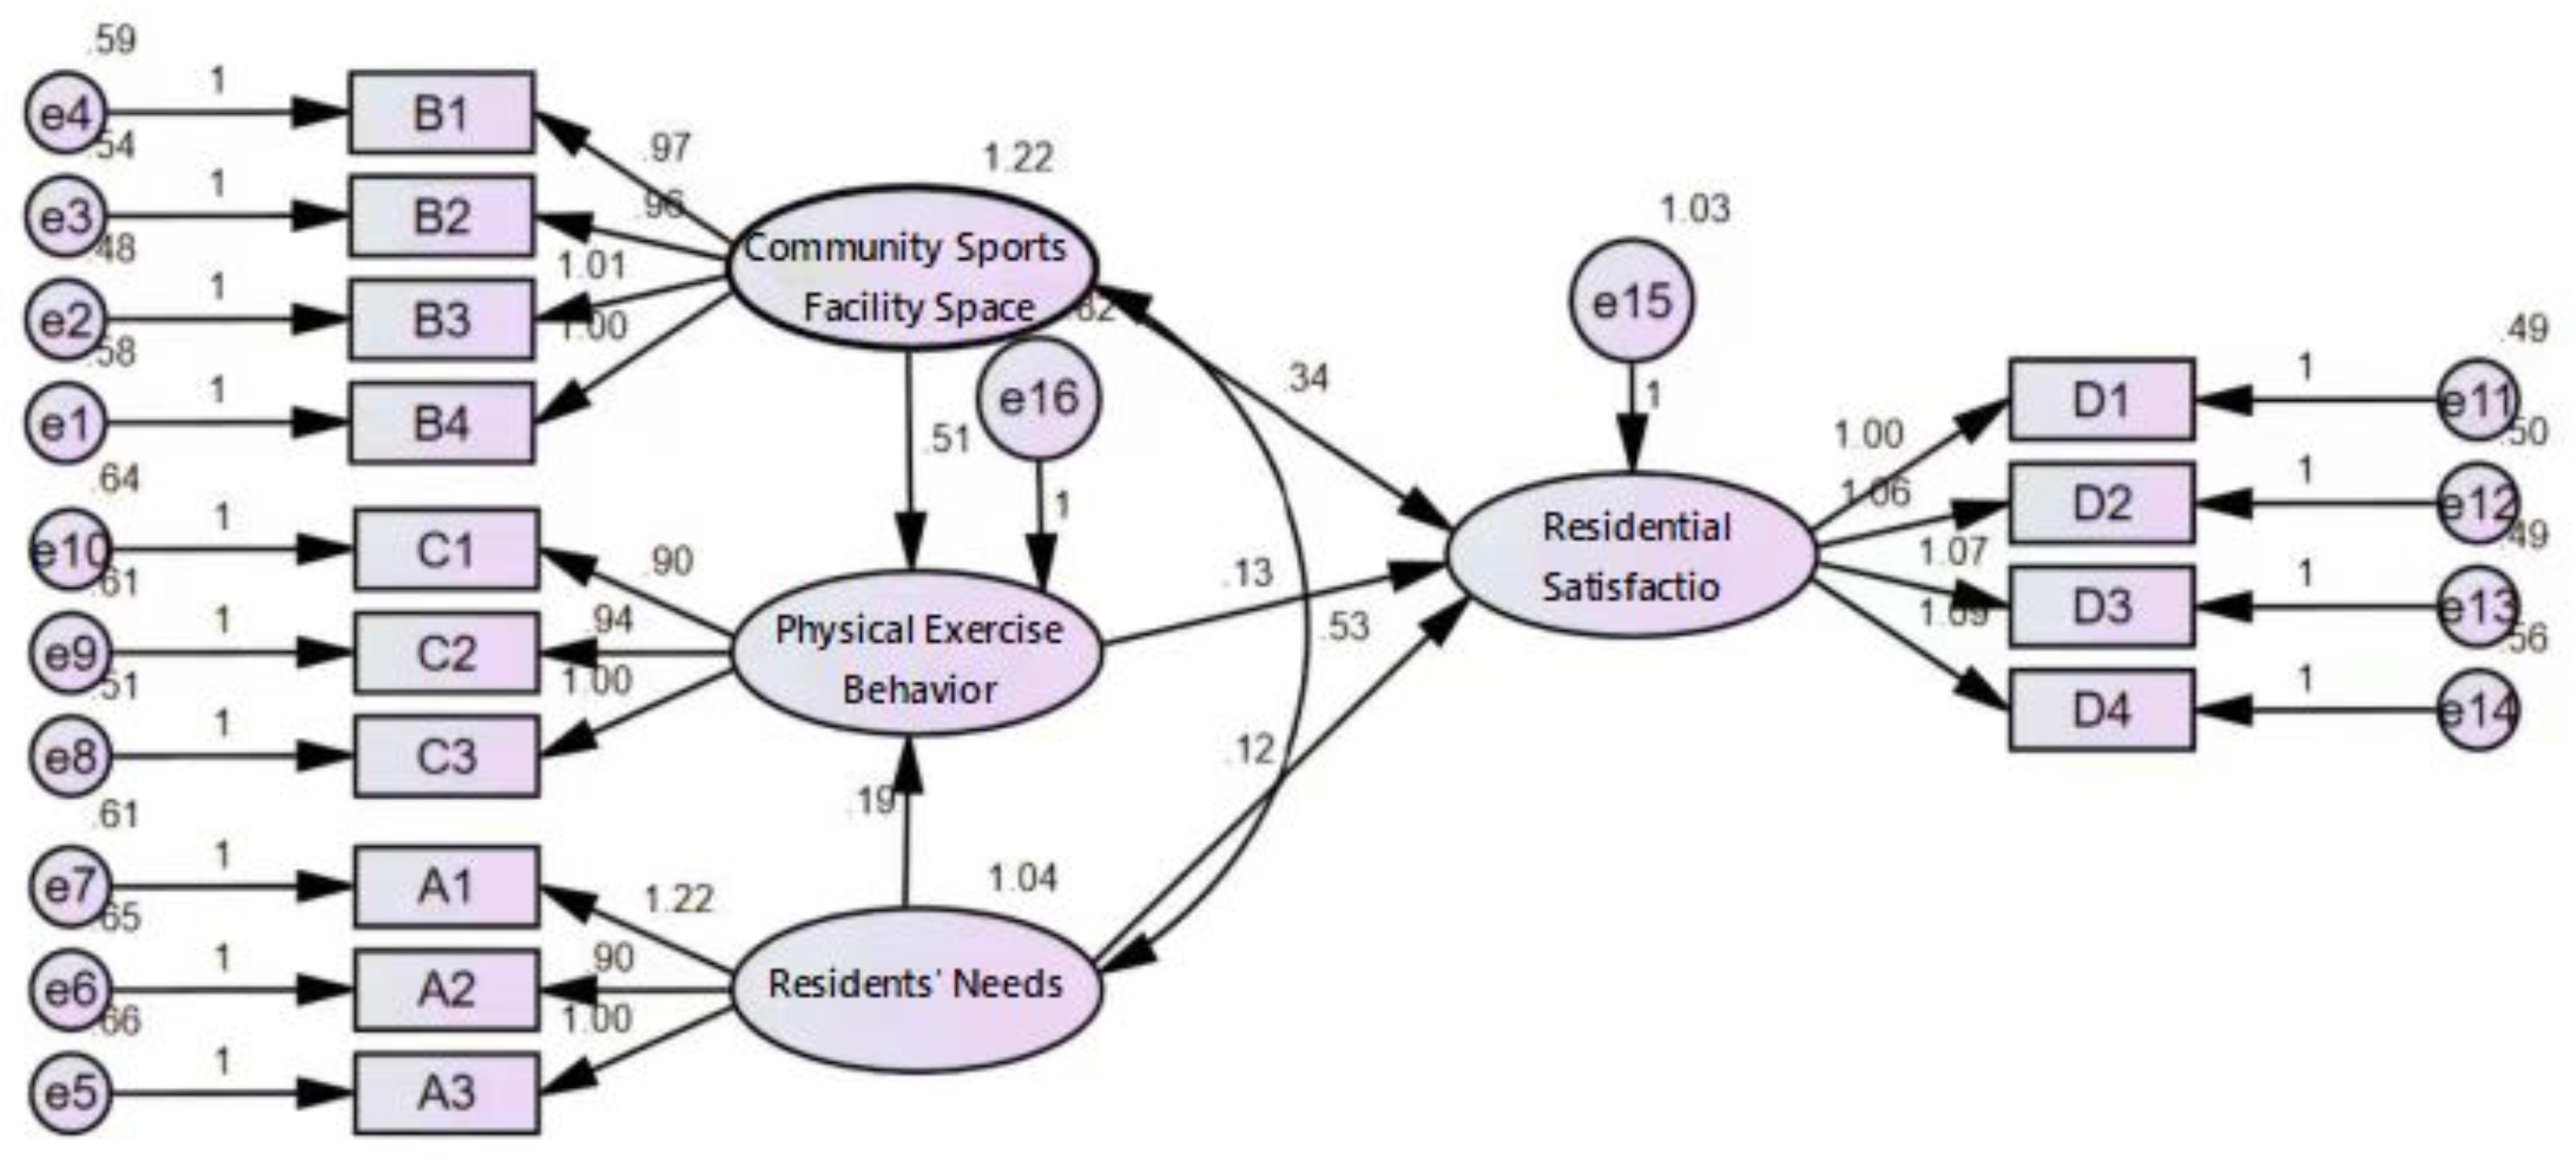
2.3. Modification of the Structural Equation Model and Results
The modification of the structural equation model (SEM) was guided by the value of the modification index (MI) and the t-value obtained from the model output. Coefficients were adjusted using the principle of sequentially decreasing MI value changes, to ensure that the adjustments followed the model's dimensional pattern (
Figure 4 &
Figure 5). In particular, observed variables with MI residue terms were gradually removed with higher levels were eliminated or modified. In addition, methods with larger MI values were included where appropriate in simulations, and comparisons of model fit indices before and after adjustment were used to assess the preference of these adjustments
After these modifications, significant improvements in model fit indices were observed compared to the original model. The revised model yielded a chi-square value of 968.364 with 210 degrees of freedom, resulting in a chi-square/DP ratio (X2/DF) of 4.611. Although slightly above the optimum due to the sample size, this value remained within acceptable limits. The Root Mean Square Error of Approximation (RMSEA) approached 0.08, and the goodness of fit index (GFI), adjusted goodness of fit index (AGFI), comparative fit index (CFI), incremental fit index (IFI), and Tucker-Lewis’s index (TLI) all approached 0.9. while slight deviations were noted due to the large sample size all indices remained within acceptable ranges. Ultimately, after these adjustments, the model's overall fit met the required standards resulting in a final structural equation model that effectively analyzes the barriers to physical activity in the context of community sports facilities (
Table 5 &
Figure 6).
2.4. Structural Equation Model Path Analysis
The analysis of the structural equation model (SEM) examined the relationships between latent variables affecting the supply and demand of community sports facilities (
Table 6 &
Table 7 ). The model was evaluated based on the hypothesis regarding the impact of spatial attributes, resident demand, and exercise behavior on community sports facility usage and residential satisfaction. The results of the path analysis are summarized based on the hypotheses and findings from the study. The results indicated that H1, H2, H3, H4, and H5 were valid: the path coefficient of H1 was 0.567, indicating a strong positive impact. This suggests that improved spatial conditions such as better access and a variety of facilities, lead to increased physical activity among residents. It was found that the H2 requirements of community members’ sports facilities positively influence their physical activity behaviors, with the coefficient of the path being 0.489. Increased demand, driven by the needs and wants of the population, strongly encourages participation in physical activity, emphasizing the importance of matching facility provision with the needs of the population. Residential satisfaction was also positively affected by H3s seeking sports facilities, with a path coefficient of 0.423. Meeting the requirement for innovation and accessibility improvements has been shown to increase residents’ overall satisfaction with their living environment, indicating the availability of a well-planned playground is a key component of residential satisfaction. H4 Quality and availability of sports facilities was found to significantly improve residential satisfaction with a path coefficient of 0.624. Well-equipped, accessible and diverse sports facilities were important in achieving satisfaction with the general public, indicating that the environment plays an important role in residents’ quality of life. H5 Exercise behavior had a direct positive effect on residential satisfaction with a path coefficient of 0.372. Increased physical activity contributed to greater satisfaction with the environment, emphasizing the benefits of an active lifestyle to societal well-being. This information provides valuable insights to improve the supply and demand of local sports facilities, and highlights the importance of well-planned, accessible, and collapsible fitness program types to promote community health and well-being. The model emphasizes the need for facilities that align with residents' needs and promote physical activity, which in turn leads to higher levels of satisfaction with the residential environment.
3. Discussion
This study examines the complex factors affecting the supply and demand of local sports facilities in Jiangbei New District, Nanjing, Jiangsu Province. Using structural equation modeling (SEM), we identified and quantified key determinants of resident participation in physical activity [
17,
18]. This study contributes to the growing body of literature on urban planning and public health, and focuses on how environmental characteristics affect community participation in physical activity A key finding of this study is that safety and accessibility play an important role in residents’ willingness to use neighborhoods for physical activity, these results are consistent with previous research emphasizing the importance of reducing travel barriers to encourage physical activity meet [
19]. City planners in the New Jiangbei District prioritized building accessible roads and increasing connectivity to ensure residents could easily travel to these areas. Perceived safety was also a significant predictor (H4: path coefficient = 0.624). Factors such as hidden safety hazards and inadequate safety measures have been shown to deter residents from using green roads. This finding is consistent with existing literature, suggesting that increased perceptions of safety may lead to increased participation in physical activity [
20]. Policymakers must implement effective safety measures and improve resort design to mitigate these risks and promote a safe user environment.
The study also confirmed that resident demand is important in physical activity behavior and residential satisfaction. High demand for sports facilities directly influenced exercise habits (H2: path coefficient = 0.489) and their overall satisfaction with the community (H3: path coefficient = 0.423). These findings suggest that tailoring the facility to specific needs and preferences is essential to achieving an active lifestyle [
21]. Involving residents in the process can help encourage greater engagement by ensuring that the resources provided meet their expectations [
22]. Interestingly, the study found that the availability of services and facilities did not significantly influence residents’ willingness to participate in physical activity in the community These findings challenge previous research indicating a strong correlation between the availability of exercise facilities and increased physical activity. The implications of this are noteworthy, suggesting that supply alone is insufficient to drive participation [
23]. Instead, emphasis should be placed on the quality, structure, and context of this intervention (H4: path coefficient = 0.624). Insights from this study highlight the need for a comprehensive approach to the acquisition and development of community sports facilities [
24]. City planners and planners in the New Jiangbei District should focus on environmental protection, accessibility, and soil quality as priorities. Strategies may include: (1) increasing accessibility, (2) improving safety, and (3) investing in soil quality. In summary, this study sheds light on the complex determinants affecting the supply and demand of local stadiums in Jiangbei New County. By addressing barriers related to safety, accessibility, and soil fertility, communities can increase resident participation in physical activity [
25]. These findings provide a valuable framework for policymakers and urban planners seeking to enhance community health and well-being through improved access to physical activity opportunities.
4. Conclusion and Limitations of the Study
This study examined the dynamics of supply and demand for local sports venues and their impact on resident satisfaction to identify the key factors that shape this relationship. The findings provide valuable insights that can aid national fitness programs and inform the development of robust sports programs. Several key findings emerged from this study. First, the study confirms that community sports facilities play an important role in increasing residents’ physical activity levels. The availability and quality of well-maintained and accessible sporting facilities are essential to encourage residents to participate actively in physical activity. This highlights the need for continued investment in the upgrading of community fitness facilities to improve public health. Second, resident needs were found to positively influence physical activity behaviors. This reflects the personal motivations that motivate individuals to engage in physical activity. Understanding and meeting these needs is crucial in designing facilities that meet community expectations and encourage greater participation in physical activity Furthermore, community play spaces have emerged as a key determinant satisfaction of with residential. The quality of the outdoor environment, including the accessibility and usability of sports facilities, has a significant impact on how satisfied residents are with their place of residence. This finding highlights the importance of improving the quality of all available community spaces to improve the lives of residents.
Interestingly, the study found that residents’ expressed needs did not have a statistically significant direct effect on resident satisfaction. This implies that the physical nature, availability, and convenience of facilities are taken into account over the stated preferences of residents and therefore attention should be paid to providing visual aspects of local play areas to improve and increase satisfaction. Furthermore, physical activity had a direct positive effect on resident satisfaction. Residents’ perceptions of the convenience and usefulness of community play spaces were significantly associated with their overall satisfaction with their living environment This highlights the importance of building well-planned play infrastructure and accessibility to create a sense of satisfaction among the community. While this study provides important insights into the dynamic nature of community theaters and their impact on resident satisfaction, several limitations must be acknowledged. The study was geographically limited, limiting the generalizability of the findings. Besides, local stadium needs, citizens’ preferences, and satisfaction levels can vary from place to place due to factors such as climate, urban density, and local government policies, the study is based on cross-sectional data, capturing only one moment. This limits the ability to assess longitudinal changes or to evaluate the long-term effects of improvements in local sports facilities on resident satisfaction and physical activity behaviors. Longitudinal studies provide a more comprehensive understanding of these developments. Finally, the study relied on self-reported data to determine residents’ exercise behaviors and satisfaction, which may introduce biases due to social desirability or inaccurate recall Future research using objective measures of exercise such as wearable devices or observational methods, to obtain greater accuracy data
In conclusion, although the findings provide important insights into the important role of community playgrounds in promoting physical activity and increasing residential satisfaction, measurement is needed for these limitations when interpreting the results. Future research should aim to address these limitations and examine the challenges of future community playground use and the broader impact on community quality of life.
Ethics approval and consent to participate
Not applicable.
Availability of data and materials
Data and materials from this study are available from the first author upon reasonable request.
Patient consent for publication
Informed consent was obtained from all participants.
Author Contributions
Si-Cheng Huang (First Author) was responsible for the conceptualization, data collection, formal analysis, and original draft preparation. Kwangsoo Lee (Corresponding Author) provided supervision, methodology guidance, and critically revised the manuscript for important intellectual content. Both authors have read and approved the final manuscript.
Funding
The authors declare that there is no funding associated with this work.
Acknowledgments
Not required
Conflicts of Interest
The authors declare that they have no conflicts of interest.
References
- Bray M: Community initiatives in education: Goals, dimensions and linkages with governments. Compare: A Journal of Comparative and International Education 2003, 33(1):31-45.
- Shian G, Yongguan D: The Problem and Response of School Sports Venues that Open to the Public under the National Strategy of the National Fitness. 2017.
- Wang K, Wang X: Providing sports venues on mainland China: Implications for promoting leisure-time physical activity and national fitness policies. International Journal of Environmental Research and Public Health 2020, 17(14):5136.
- Congkan C, Ning C: Constructing a Higher-level Public Service System for National Fitness: Basis, Focus and Practical Essentials. Journal of Shanghai University of Sport 2024, 48(7):43-55.
- Li Y: Design and Implementation of Fitness Engineering System Based on Big Data Analysis. In: 2015 4th National Conference on Electrical, Electronics and Computer Engineering: 2015: Atlantis Press; 2015: 106-109.
- Menhas R, Dai J, Ashraf MA, M Noman S, Khurshid S, Mahmood S, Weng Y, Ahmad Laar R, Sang X, Kamran M: Physical inactivity, non-communicable diseases and national fitness plan of China for physical activity. Risk Management and Healthcare Policy, 2021:2319-2331.
- Wang J: The association between physical fitness and physical activity among Chinese college students. Journal of American College Health, 2019, 67(6):602-609.
- Jankowski P: Behavioral decision theory in spatial decision-making models. In: Handbook of behavioral and cognitive geography. edn.: Edward Elgar Publishing; 2018: 41-55.
- Harvey D: Conceptual and measurement problems in the cognitive—behavioral approach to location theory. In: Behavioral Problems in Geography Revisited. edn.: Routledge; 2015: 18-42.
- Björkgren K: Free trade zones in China: A guide. 2015.
- Tan J, Wang J, Wang H, Liu Z, Zeng N, Yan R, Dou X, Wang X, Wang M, Jiang F: Influence of extreme 2022 heatwave on megacities' anthropogenic CO2 emissions in lower-middle reaches of the Yangtze River. Science of The Total Environment, 2024, 951:175605.
- Southerland JB: Fit in 10: Slim & Strong—for Life!: Simple Meals and Easy Exercises for Lasting Weight Loss in Minutes a Day: Rodale; 2017.
- Weaver B, Maxwell H: Exploratory factor analysis and reliability analysis with missing data: A simple method for SPSS users. The Quantitative Methods for Psychology, 2014, 10(2):143-152.
- Nahm E-S: A model of computer-mediated social support among older adults: University of Maryland, Baltimore; 2003.
- Min L, Yichao S, Hailing M: An Empirical Research on Construct and Influencing Factors of College Students’ Blended Learning Power Based on SPSS 22 software and AMOS 24.0 software. In: 2021 2nd International Conference on Artificial Intelligence and Education (ICAIE): 2021: IEEE; 2021: 425-431.
- Widaman KF, Helm JL: Exploratory factor analysis and confirmatory factor analysis. 2023.
- Fan Y, Chen J, Shirkey G, John R, Wu SR, Park H, Shao C: Applications of structural equation modeling (SEM) in ecological studies: an updated review. Ecological Processes, 2016, 5:1-12.
- Teo T, Tsai LT, Yang C-C: Applying structural equation modeling (SEM) in educational research: An introduction. In: Application of structural equation modeling in educational research and practice. edn.: Brill; 2013: 1-21.
- Chen Y-T, Yang AY-Y: Evaluating the influence of sustainable urban disaster prevention planning satisfaction on residents’ living willingness: A structural equation modeling approach in Kaohsiung City. Sustainability, 2024, 16(13):5624.
- Seo H-C, Lee Y-S, Kim J-J, Jee N-Y: Analyzing safety behaviors of temporary construction workers using structural equation modeling. Safety Science, 2015, 77:160-168.
- Peng C, Yuan G, Mao Y, Wang X, Ma J, Bonaiuto M: Expanding social, psychological, and physical indicators of urbanites’ life satisfaction toward residential community: A structural equation modeling analysis. International Journal of Environmental Research and Public Health, 2021, 18(1):4.
- Carbó-Carreté M, Guàrdia-Olmos J, Giné C, Schalock RL: A structural equation model of the relationship between physical activity and quality of life. International Journal of Clinical and Health Psychology, 2016, 16(2):147-156.
- Sang X, Menhas R, Saqib ZA, Mahmood S, Weng Y, Khurshid S, Iqbal W, Shahzad B: The psychological impacts of COVID-19 home confinement and physical activity: a structural equation model analysis. Frontiers in psychology, 2021, 11:614770.
- Alessandri G, Zuffianò A, Perinelli E: Evaluating intervention programs with a pretest-posttest design: A structural equation modeling approach. Frontiers in psychology, 2017, 8:223.
- Musci RJ, Pas ET, Bettencourt AF, Masyn KE, Ialongo NS, Bradshaw CP: How do collective student behavior and other classroom contextual factors relate to teachers’ implementation of an evidence-based intervention? A multilevel structural equation model. Development and psychopathology, 2019, 31(5):1827-1835.
|
Disclaimer/Publisher’s Note: The statements, opinions and data contained in all publications are solely those of the individual author(s) and contributor(s) and not of MDPI and/or the editor(s). MDPI and/or the editor(s) disclaim responsibility for any injury to people or property resulting from any ideas, methods, instructions or products referred to in the content. |
© 2025 by the authors. Licensee MDPI, Basel, Switzerland. This article is an open access article distributed under the terms and conditions of the Creative Commons Attribution (CC BY) license (http://creativecommons.org/licenses/by/4.0/).