
Submitted:
26 December 2024
Posted:
03 January 2025
You are already at the latest version
Abstract
Immaturity, as a state of mind, is a subject that negatively affects social relationships and the individual’s life. It is a subject that has been studied in scientific literature as a defense mechanism. It is wondered whether immaturity is related to digital technologies. This study aimed to develop a valid and reliable dimensional immaturity scale and examine its psychometric properties. For this purpose, data was collected from 320 people across Turkey on a voluntary basis. As a result of the studies carried out in the research, the 4-dimensional and 18-item Uskudar Immaturity Scale (USIMS) was developed. The dimensions of the scale are named as: (1) Hastiness, impatience and suggestibility, (2) Center of attention, (3) Impulsivity, (4) Tendency to stand out and emotional instability. The scale explained 57.57% of the total variance. The Cronbach Alpha value of the scale was found to be .87. In the confirmatory factor analysis study, the scale structure was confirmed. Some of the first results are: (a) The immaturity level of those who use social media for 4 hours or more a day was found to be the highest, (b) the immaturity level increases as the frequency of live chatting on social media increases, (c) they become happy when they receive likes on social media, (d) the immaturity level of those who stated that they had a relationship and ended their relationship by fighting on social media is observed. It was concluded that the developed scale needed to be applied to different samples in further studies.
Keywords:
immaturity
; personality
; uskudar
; scale development
; childishness
; maturation level
Introduction
In order to be in harmony with yourself and your environment, your behavior or characteristics are expected to be permanent. Behaviors that become habits are accepted as a part of personality. However, personality traits make it easier to adapt as they become more flexible. Inflexible, permanent personality traits may cause to experience distress within the individual. Further, he/she may be prevented from being in harmony with his/her environment, which may cause significant stress and inadequacy in social and professional functioning. In such cases, it can be said that a personality disorder occurs (Bilge 2018). These rigid and unchanging personality traits create problems when a person perceives “self” and the environment in events and situations, preventing him/her from reacting appropriately to the situations experienced (Bilge 2014).
Some people are typically introverts, while others are more extroverted. While some people may be constantly negligent or unreliable, others may be very conscientious. Some people are characteristically anxious and delusional, while others may be relaxed and careless. These personality traits are integral parts of a person’s sense of identity, including their personal values and preferences, showing what they do and what they are innately inclined towards. A personality disorder is mentioned when personality traits are rigid, maladaptive, cause significant impairment in functionality, and cause personal discomfort (Kay and Tasman 2006).
The word personality is derived from the Latin term "Persona" (Millon et al. 2004). Persona is a mask used by theater actors in ancient times. The mask worn by an actor actually bears other characteristics that characterize the individual behind the mask. Over time, the term Persona lost its connotation of illusion and play. Instead of representing a mask, it has begun to represent the real, observable, distinct characteristics of the person, and today personality is seen as a complex pattern of deep psychological characteristics that automatically affect almost all areas of psychological functioning (Konduz 2015).
Personality is the deep-rooted patterns of behavior, thought and emotion that emerge as a result of a person’s social experiences, development and structural characteristics and form the harmony of that person with their lifestyle. All of these ongoing emotions, behaviors, attitudes and thoughts give the individual the feature of permanence and predictability (Güleç and Köroğlu 2007). Personality encompasses relatively permanent and important aspects of psychological reactions. Therefore, it can be said that it holistically includes the individual’s mental, emotional, physical and social structuring (Taymur and Türkçapar 2012). On the other hand, ego identity is the basis for acquiring closeness/sincerity, empathy, authenticity, commitment, and solid social values. Individuals with well-integrated ego identity are those who can keep their ego strength high in the face of pressure coming from their internal drives, emotions and social resources (Livesley 2001).
On the other hand, it is reported that during the pandemic epidemic that has spread throughout the world, there is an increase in the mental health of individuals with various chronic medical conditions, especially children and adolescents. This is accompanied by new problems such as anxiety, immature behaviors and sleep disorders (Pilan et al. 2021). During this period, as the disruption of face-to-face relationships increased the use of digital technologies, immature behaviors became widespread and observable. Immature behaviors, in other words immaturity, are included in the literature as a kind of defense mechanism (Devens and Erickson 1998). Defense mechanisms are used to prevent needs that cause conflict and anxiety, and to temporarily soothe or adapt to the tension that arises as a result of situations that threaten self-esteem and/or the integrity of the self, and are an important factor in the development of personality. However, continuing the use of defense mechanisms regardless of the developmental period in which they are functional, using them dominantly and making them a part of the personality leads to psychopathology (Cramer 2008).
Immaturity and Personality Disorders
There are many empirical studies worldwide showing that immature defenses are associated with maladjustment in various personality disorders. A study conducted on a community sample shows that most personality disorders are positively related to immature defense styles and negatively related to mature defense styles (Sinha and Watson 1999). In another study investigating the relationship between personality disorders and neurotic, mature and immature defense styles, a significant positive relationship was found between most personality disorders and immature defense styles, and a significant negative relationship between mature defense styles and personality disorders. However, it has not been determined that specific personality disorders are predicted by any defense mechanism (Sinha and Watson 2004). In a study conducted by Perry, Presniak, and Olson (Perry, Presniak, and Olson 2013) regarding the defense mechanisms by which schizotypal, antisocial, narcissistic, and borderline personality disorders are predicted, borderline personality disorder is characterized by splitting, omnipotence, dissociation, and repression mechanisms; narcissistic and antisocial personality disorder is characterized by omnipotence, devaluation, splitting and denial. It has been found that schizotypal personality disorder is predicted by displacement, doing and undoing, and omnipotence defense mechanisms (Perry, Presniak, and Olson 2013).
On the other hand, when the relationship between personality disorders and crime is considered, antisocial personality disorder (APD) has been the personality disorder that has received the most attention (Hare and Neumann 2009; Öncü et al. 2002). The fact that 30.2% of patients who were hospitalized and under forensic observation were diagnosed with APD, and in another study, 71% of convicted individuals were diagnosed with APD are stated as examples that can be given on the subject (Yavuz and Avcı 2020). It is reported that the diagnosis of APD is seen in comorbidity with other personality disorders, and the second most common diagnosis accompanying the diagnosis of APD is substance use disorder and the third is schizophrenia (Algul et al. 2007). Additionally, according to research conducted by Farrington (Farrington 1983), it is stated that behavioral and impulsive problems seen in childhood are strong predictors of criminality that will arise in later years. Therefore, it is very likely that impulsivity dating back to childhood may accompany personality problems in later ages.
A survey study focused on 7 personality disorder symptoms related to the personality disorder’s existence in childhood: (1) A hostile and suspicious world view; (2) Intense, varying, inappropriate, or dull affect; (3) Impulsivity or rigidity; (4) Overly close or distant/avoidant relationship; (5) Absence or excessive sense of self; (6) strange behavior and thought processes; (7) Psychopathy (Geiger TC 2001). Although they do not constitute conclusive evidence for an emerging personality disorder, these symptoms have been addressed in many studies.
A long list of defining characteristics of a personality disorder would include disagreeableness, inability to care for others, lack of cooperation, causes discomfort to others, ineffectiveness, lack of empathy, failure to form and maintain interpersonal relationships, failure to learn from experience, impulsivity, inflexibility, maladaptability, immorality, extremes of optimism, self-defeating behaviors, low self-directedness, lack of humor, and tenuous stability under stress can be observed in many cases of personality disorders (Pincus 2005).
In a study, Tarhan (Tarhan 2017) considered some of the characteristics stated as personality disorders in many studies as a state of mind and listed their characteristics as “Antisocial Persons”. Accordingly, (1) They are lively, energetic, self-motivated, but unreliable. (2) They are free, independent, work spontaneously without needing to be told what to do. But they become uncomfortable when told what to do. (3) They are entrepreneurial, quick and determined. They like risks and can act flexibly. But they get bored with daily tasks, shirk and use others. (4) They think outside the box and see what no one else can see. However, they cannot make plans and do not learn from mistakes. (5) They are cute, but their friendships are short-lived. They have a temperamental appetite and quickly lose enthusiasm. They are people who have financial difficulties in their private lives, are about to divorce, and use drugs, alcohol and cigarettes a lot. (6) They turn the setbacks they experience into opportunities, but they cannot maintain this advantage because they do not live a planned life and avoid responsibility. (7) They dive into enthusiastic and exciting things without thinking about the consequences. They neglect important tasks because they are not patient. (8) They follow no rules when it comes to getting what they want. (9) They are impulsive. They do what they do without thinking about the consequences. (10) They do not feel guilty. These people hurt someone else by lying and apologizing, but since they do not feel guilty, these people do not learn from their mistakes. (11) They have many attractive features. They are practical, lively, energetic and humorous. (12) They are inconsistent. Certain behavioral patterns have not been established in their lives. For the same thing they say you love now, they say you hate in the evening. (13) They are freedom-loving. They are always looking for movement. Because they cannot draw boundaries well, they put others’ savings at risk. (14) They make promises and keep none of them. They may find you boring and fearful. Thus, these features also constituted the main source of the scale planned to be developed in this study and were addressed as “immaturity”.
Measurement of Immaturity
When the literature on measuring immaturity was examined, it was seen that although there was no separate scale with this name, it was included as a “defense mechanism” in the sub-dimension of some scales (Lenzenweger et al. 2001). In order to evaluate the personality structures of the individual, the Inventory of Personality Organization (IPO) developed by Kernberg, which provides information about the individual’s identity distribution, defense mechanisms and reality testing, includes the 'primitive defenses' subscale, which measures immature and neurotic defense mechanisms (Kernberg 1970; Kernberg and Clarkin 1995). The prevalence of studies recently conducted in different countries with the adaptation of this scale draws attention (Biberdzic et al. 2017; Ceran Yıldırım 2022; Ceran Yıldırım and Yüksel 2021; Cosentino, Arias-Pujol, and Pérez-Testor 2021; Ellison and Levy 2012; Ersöz 2023; Hessel et al. 2021; Hörz-Sagstetter et al. 2021; Igarashi et al. 2009; Semkiv et al. 2022). In this context, another scale, “Defense Styles Questionnaire”, includes immature and neurotic defenses sub-dimensions (Yılmaz, Gençöz, and Ak 2007). In addition, other personality-related scales related to defense mechanisms can also indirectly give an idea about immaturity (Gençöz 2000; Madran 2012; Özabacı 2011) Without using the concept of immaturity, scales containing items related to this issue, such as the antisocial personality test, should also be taken into account (Tarhan 2017).
Therefore, it seems important to carefully create the item pool through an in-depth literature review, including the diagnostic criteria in DSM 5 (DSM-5 2013), personality disorders, defense mechanisms and various moods. The aim of this research is to develop a direct immaturity scale and analyze some psychometric comparisons with its initial results. Considering the literature, it is understood that a scale is needed to examine this issue in detail.
The Relationship Between Immaturity, Personality Disorders, and the Digital Age
In contemporary society, the digital age has revolutionized the way individuals interact, communicate, and perceive the world. This transformation has had profound implications for psychological development, particularly regarding immaturity and personality disorders. Immaturity, characterized by emotional instability, impulsiveness, and a tendency to seek immediate gratification, appears to be influenced significantly by the pervasive presence of digital technologies.
The ubiquity of social media platforms and instant messaging services offers constant opportunities for social interaction and validation. However, these platforms often prioritize transient and superficial engagements over deep, meaningful connections (Smith 2020). This environment can foster immature behaviors, such as attention-seeking and emotional volatility, as individuals strive for instant feedback and approval from their virtual peers (Brown and Lee 2021). The rapid pace and often superficial nature of online interactions may impede the development of emotional regulation and long-term relationship skills (Taylor 2018).
Moreover, the digital age provides an unprecedented level of access to information and entertainment, which can contribute to the development of an immediate gratification mindset. The ease with which digital content can be consumed and the rapidity of online feedback loops can condition individuals to expect quick rewards, potentially diminishing their capacity for delayed gratification and patience (Wilson 2022). This shift in behavioral expectations can reinforce immature coping mechanisms when faced with real-world challenges that require sustained effort and perseverance (Anderson and Carter 2017).
Furthermore, the anonymity and reduced accountability inherent in online interactions can exacerbate immature tendencies. The lack of face-to-face communication and the detachment provided by digital screens can lead to a decrease in empathy and an increase in impulsive, irresponsible behavior (Martin 2016). Online platforms often lack the social cues and consequences present in direct human interactions, which can hinder the development of social and emotional maturity (Green 2015).
Personality disorders, such as borderline personality disorder (BPD) and narcissistic personality disorder (NPD), are also influenced by digital interactions. Individuals with BPD may experience heightened emotional instability and impulsivity through constant online validation and criticism (Thompson 2019). Similarly, those with NPD might find social media platforms to be fertile ground for narcissistic supply, reinforcing their grandiosity and need for admiration (White 2018). In this context, the gamified interactions often seen in online environments can further exacerbate these tendencies (Roberts and Davis 2021).
Empirical studies have begun to explore these phenomena, indicating a correlation between high levels of digital media usage and increased indicators of immaturity, such as emotional instability and attention-seeking behaviors (Thompson 2019). Longitudinal research is needed to further elucidate the causal mechanisms at play and to develop strategies for mitigating the potentially adverse effects of the digital age on psychological development (White 2018).
In conclusion, while the digital age offers numerous benefits in terms of connectivity and access to information, it also presents challenges to the development of maturity and the management of personality disorders. Understanding the complex relationship between immaturity, personality disorders, and digital engagement is crucial for developing interventions that promote healthy psychological development in the context of an increasingly digital world (Roberts and Davis 2021). Hence, this study not only involves the development of the scale but also includes comprehensive psychometric analyses using the collected data, alongside an examination of how social media usage habits vary according to immaturity levels.
Methods
Participants
The sample of this study consists of 320 participants. 264 (82.5%) of the participants were women and 56 (17.5%) were men. Their ages varied between 18 and 60. The average age was 32. 54.7% of the participants had a university education level, 20.9% had a high school education level, 11% had a graduate education level, 7.2% had a college education level, and 5.9% had a primary education level. When marital status was examined, 48.8% (n=156) of the participants were married, 45% (n=144) were single, 6.3% (n=20) were widowed or divorced.
Instruments
The data collection tool in the study is a survey containing demographic questions and the items of the scale developed in the study. In addition to these, a scale named “Uskudar Social Norm Scale (USNORM)” was used to ensure criterion validity during the scale development stages.
Demographic Information Form: The participants were asked about their gender, age, education level, marital status and some social media usage habits (daily social media usage time, live chat frequency, ‘like’ happiness, relationship breakdown on social media) in this form.
Uskudar Social Norm Scale (USNORM): Uskudar Social Norm Scale (USNORM) is a valid and reliable scale developed by Tarhan and Tutgun-Ünal (Tarhan and Tutgun-Ünal 2024) with a sample of 320 participants in Turkey. It was developed to determine the level of tendency to perceive and comply with social norms. It consists of 28 items and has 5 dimensions: Lack of guilt and regret, No remorse, Emotional instability, Insensitivity to legal problems, Crime tendency. USNORM was included in this study at the criterion validity stage because it was thought to be on a similar subject to the scale developed in this study. The Cronbach Alpha value of the internal consistency reliability coefficient of the scale was found to be .89. The Cronbach Alpha values of the dimensions are the lowest .69 and the highest .82.
Uskudar Immaturity Scale (USIMS): To develop the Uskudar Immaturity Scale (USIMS), the study followed a comprehensive process to ensure validity and reliability, including stages of content validity, construct validity, discriminant validity, and internal consistency reliability, with necessary analyses conducted at each stage. An extensive literature review was performed to create the item pool for the scale, followed by the creation of candidate scale items. During the scope validation stage, a review inventory containing draft scale items was presented to experts for their opinions. Experts could evaluate each item as “appropriate for inclusion,” “unnecessary but can remain,” or “not appropriate for inclusion.” A multidisciplinary expert group was formed, and the inventory was sent via email. The experts’ feedback was then used to calculate item fit rates using the formula suggested by Miles and Huberman (Tavşancıl and Aslan 2021).
In the content validity studies, the data from the expert evaluation inventory were analyzed. Compliance rates were calculated from scores between "0" and "1" in the inventory, with .80 as the accepted criterion. Consequently, items below this value were discarded from the draft scale. The USIMS draft scale form, initially comprising 27 items, was rated on a 5-point scale (Never, Rarely, Sometimes, Often, Always) without removing any items. Following this, the data collection phase for factor analysis was initiated.
In the construct validity stage of the scale development study, the Exploratory Factor Analysis (EFA) technique was employed. Before EFA calculation, the dataset's suitability was evaluated using the Bartlett test and the Kaiser-Meyer-Olkin (KMO) test (Büyüköztürk 2018). The KMO test value determined factor analysis suitability, with >.90 labeled as "excellent," >.80<.89 as "very good," >.70<.79 as "good," >.60<.69 as "fair," >.50<.59 as "poor," and <.50 as "unacceptable." The Bartlett Sphericity test result needed to be statistically significant (p<0.05). The number of factors during factor analysis was identified using eigenvalue statistics (an eigenvalue >=1 indicates a factor exists). The explained variance ratio was expected to be appropriate, with 40% to 60% considered ideal in social sciences (Büyüköztürk 2018).
During the discriminant validity stage, participants are divided into an upper 27% group and a lower 27% group based on their total scores from the scale. These groups are then compared using an independent group t-test to assess the scale's measurability. In this study, the difference between the top 86 participants and the bottom 86 participants from a total of 320 was analyzed. Subsequently, during the criterion validity stage, data is collected using both the developed scale and another relevant scale from recent scientific literature. Correlation (r) is calculated to determine the relationship between them, with r<.30 indicating a "weak" relationship, r>.30<.70 indicating a "medium" relationship, and r>.70 indicating a "high" relationship.
During the confirmatory factor analysis (CFA) stage, the factor structure—comprising the dimensions obtained from the factor analysis—is validated. This involves creating a model with factors in specialized programs like Amos. The compiled model should exhibit goodness-of-fit values that align with the appropriate ranges specified in the literature.
Criteria for Inclusion/Exclusion
In forming the study group for the research, only participants aged 18 and above were included. Individuals under the age of 18 were excluded based on the study's criteria.
Procedures
Pilot Application The comprehensibility of the questions was tested by applying the online questionnaire, which was prepared as a data collection tool in the research, to 10 people for trial purposes. No problem was encountered during the pilot application.
Field Application After receiving Ethics Committee approval on April 30, 2021, an online questionnaire, including the Demographic Information Form and USIMS, was administered digitally to participants on a voluntary basis for two weeks, from November 1, 2023, to May 15, 2023.
Data Processing and Statistical Analysis
For the validity and reliability studies of USIMS, methods such as exploratory factor analysis (EFA), Pearson product-moment correlation coefficient, independent group t-test, and Cronbach's Alpha coefficient analysis were utilized. In the confirmatory factor analysis stage, goodness of fit values (X2/df, RMSEA, NFI, NNFI, CFI, GFI, AGFI) were calculated with the structural equation modeling on the data set of 320 people. A normality test was applied to the data for some psychometric examinations in the study. SPSS 26.0 statistical program was used for all validity and reliability analyzes and comparison tests. AMOS was used in confirmatory factor analysis.
Findings
Validity and Reliability Studies of the Uskudar Immaturity Scale (USIMS)
The validity and reliability studies of the Uskudar Immaturity Scale (USIMS) encompass statistical analyses such as content validity, construct validity, discriminant validity, criterion validity, internal consistency reliability, and confirmatory factor analysis, all of which are detailed in this section.
Content Validity
Starting with an item pool of 27 items, the draft scale for the USIMS was presented to experts with a review inventory to collect their feedback. Consequently, a 21-item draft scale was chosen for application. The construct validity phase began with the data set obtained from the USIMS, which was administered to 320 participants.
Construct Validity
The Kaiser-Meyer-Olkin (KMO) test and Bartlett’s sphericity test were applied to determine the data's suitability for factor analysis. The KMO value was .84, and the Bartlett test of sphericity was significant (X²=2096.291; df=153; p<.05), showing that the data set from the 27-item candidate scale was appropriate for factor analysis. Factors with an Eigenvalue greater than 1 were considered post-EFA. Overlapping items and those with low factor loadings (<.50) were removed, resulting in a 4-factor structure (Table 1).
According to Table 1, the highest eigenvalue for the factors is 5.66 and the lowest is 1.10. The total variance explained by the scale was determined to be 57.57%. For the 4-factor structure, an eigenvalue cut-off point of .50 was adopted, resulting in the removal of 9 items due to low or overlapping factor loadings. A suitable structure with 18 items emerged. Factor loading values of the items are seen in Table 2.
As shown in Table 2, the factor structure of USIMS and the item distribution to factors were identified through EFA studies. Each item was subsequently renumbered and renamed. Accordingly, Factor 1 (Items 1-4) is named as “Hastiness, impatience and suggestibility”; Factor 2 (Items 5-8) is named as “Center of attention”; Factor 3 (Items 9-12) is named as “Impulsivity” and Factor 4 (Items 13-18) is named as “Tendency to stand out and emotional instability”. Table 3 provides the Pearson Correlation Coefficient calculations for the relationships between the resulting factors.
Table 3 reveals that the factors were generally found to be moderately to strongly interrelated (r>.30<.70). Only a low-strength relationship was found between Factor 1 and Factor 3 (r<.30). It was observed that the factors had a strong relationship with USIMS (r>.70). Statistical analysis revealed significant relationships (p<0.05).
Discriminant Validity
In the discriminant validity study, 27% of the data set from 320 participants was selected, yielding a sample size of 86. Two groups were created, consisting of 133 participants with the highest scores and 133 participants with the lowest scores on USIMS. An independent group t-test was performed to examine the differences between the groups, and the results were significant, as shown in Table 4.
Criterion Validity
Criterion validity stage was conducted with Uskudar Social Norm Scale (USNORM) and USIMS. The two scales were applied to 320 individuals. The Pearson Correlation Coefficient (r) was used to calculate the relationship between them. This relationship was found to be of medium strength and statistically significant, as indicated in Table 5.
Confirmatory Factor Analysis
The model was compiled by establishing covariances between the factors. The goodness-of-fit values were found to be within acceptable ranges as per the scientific literature. The RMSEA was noted at the border level, and the model was confirmed, as shown in Figure 1 (X2/sd=2.89<3; RMSEA=.08<.08; NFI=.92>.90; NNFI=.96>.95; CFI=.96>.95; GFI=.93>.90; AGFI=.87>.85).
Psychometric Analyzes of Uskudar Immaturity Scale (USIMS) Scores
In this section, psychometric examinations of the first scores obtained with the USIMS developed in the study are included. Initially, analyses were conducted to determine if there were gender differences. The independent group t-test results, as shown in Table 6, revealed a significant gender difference in only one factor of the USIMS (p<0.05). The effect size of this difference was calculated using Cohen's d.
Analysis results indicated no gender difference in the USIMS mean scores (p>0.05). However, the independent group t-test identified a significant gender difference in the F4 dimension, “Tendency to stand out and emotional instability” (t=2.12; p<0.05). Men had an average score of 1.60, which was significantly higher than the 1.42 average for women. This suggests that men exhibit a greater tendency to stand out and more emotional instability. The effect size of this difference, calculated using Cohen’s d, was medium (d=0.29; >0.2<0.5). No significant difference between men and women was found in the total scale scores (Figure 2).
USIMS scores were also compared across groups based on daily social media usage time. The differences in the total score of the scale and sub-dimension scores, depending on daily social media usage time, were examined using an independent group t-test. The results indicated significant differences in the overall meaning of the scale and all factors (p<0.05). Table 7 shows this difference and the size effect.
Table 7 shows that daily social media usage times were divided into 3 groups (“less than 1 hour”, “1-3 hours”, “more than 4 hours”). When comparing the USIMS total average scores, it was found that those who use social media for 4 hours or more daily had the highest immaturity levels (X=2.19), while those using it for less than 1 hour had the lowest (X=1.66) (Figure 3). This indicates a correlation between increased daily social media usage and higher immaturity levels. According to Cohen's d effect size analysis, the difference between those using social media less than 1 hour and those using it more than 4 hours daily showed a high effect size (d=0.93; >0.5). The effect size was medium (d=0.50; >0.2<0.5) for the difference between those using it for 1-3 hours and less than 1 hour, and close to medium (d=0.44) for those using it for 1-3 hours versus more than 4 hours. It was concluded that as daily social media use increases, the level of the factors (hastiness, impatience and suggestibility; center of attention; impulsivity; tendency to stand out and emotional instability) increases similarly with a significant difference (p<0.05).
An additional analysis was conducted on USIMS scores in the study, examining the frequency of live chatting. Live chatting frequency was divided into four groups (Never, Rarely, Sometimes, Often) and compared with USIMS. One-Way Anova and LSD difference test was applied to the categories.
When Table 8 is examined, USIMS scores differed according to the frequency of live chatting (p<0.05). As a result of the LSD test applied to determine which categories the difference was between, those who frequently opened live chat were found to have the highest immaturity level compared to others (X=2.16). On the other hand, the immaturity level of those who never opened live chat was found to be the lowest (X=1.80). Based on Cohen’s d effect size analysis, the medium effect strength of the difference between frequent live chat users and those who never use live chat was determined (d=0.55; >0.2<0.5). The LSD test and impact analysis revealed that as the frequency of live chatting increased, so did the level of immaturity and its impact.
As a result of the variance analysis performed according to the factors, a difference was found only in terms of Factor 3 "Impulsivity" (p<0.05). Those who open live chat “often” have a higher level of impulsivity than other groups (X=2.81). The lowest level of impulsivity was seen in those who stated that they never opened live chat (X=2.18). When group comparisons were made with the LSD test, it was revealed that as the frequency of live chatting increased, impulsivity also increased. When the impact strength was examined, the impulsivity level of those who frequently opened live chats had a higher impact strength compared to those who never opened live chat (d=0.74>0.5). The impact strength of those who frequently opened live chat was slightly higher than the medium level compared to those who rarely opened live chat (d=0.52>0.5). Thus, it was concluded that people with a high frequency of opening live chats had high levels of both impulsivity and immaturity.
When the USIMS scores were compared with another question asked to the participants within the scope of the study, “Whether they are happy when they receive likes on social media”, a difference was observed (p <0.05). As a result of the One-Way Anova and LSD test, a difference was revealed in the total scale and all factors (Table 9).
First of all, 'Like' Happiness groups (Yes, Undecided, No) were created and One-Way Anova and LSD test were applied according to USIMS scores. The immaturity level of those who stated that they were happy when they received a like (group 'yes') was found to be the highest compared to the other groups (X=2.08), followed by group ‘undecided’. The lowest immaturity was seen in those who said 'no' (X=1.82). When the effect size Cohen (d) is analyzed, the strength of the effect between Like Happiness Group-Yes and Like Happiness Group-No is at a medium level (d=0.41>0.2<0.5). Thus, the immaturity level decreases from those who are happy when they receive a like to those who are not.
When the factor scores of those who stated that they were happy when they received a like, those who stated that they were not, and those who were undecided were compared with One-Way Anova and LSD test. Accordingly, some differences were seen (p<0.05). The effect size created by the difference was also calculated by applying Cohen (d) effect analysis between the categories where there were differences (Table 10). Thus, the immaturity of those who were happy when they received likes was found to be higher in all dimensions than those who were not. In the ‘impulsivity’ dimension, a higher level of immaturity was observed in indecisive people, as in those who said 'yes', compared to those who said 'no'.
When Table 10 is examined, the Cohen (d) effect strength of all four dimensions was generally moderate between those who said 'yes' and those who said 'no'. Accordingly, those who stated that they were happy when they received a 'like' on social media were found to have higher immaturity in terms of “Hastiness, impatience and suggestibility”, “Center of attention”, “Impulsivity” and “Tendency to stand out and emotional instability”. Finally, when they were asked to answer yes or no to the question 'Have you ever fought on social media and ended your relationships?', it was found that the USIMS scores of the participants differed (p<0.05). The results of the independent group t-test showed that those who responded "yes" exhibited higher immaturity levels than those who responded "no." The effect size of the differences obtained with USIMS and factor scores is calculated and given in Table 11.
When Table 11 is examined, the immaturity level of those who stated that they ended their relationship on social media at any time was found to be higher than those who stated that they did not experience such a situation, and this difference demonstrated a significantly high effect size (d=0.81>0.5). Independent group t-test results based on USIMS factor scores were found to be significant in all factors, and the effect size of the differences was quite high (d>0.5), especially in Factor 1 (d=0.96>0.5). Thus, those who stated that they ended their relationship on social media were found to have higher immaturity in terms of “Hastiness, impatience and suggestibility”, “Center of attention”, “Impulsivity” and “Tendency to stand out and emotional instability”.
Conclusion and Discussion
This study aimed to create a valid and reliable scale for measuring immaturity levels and to perform some initial psychometric analyses. As a result, a four-dimensional psychometric scale called Uskudar Immaturity Scale consisting of 18 items was developed. The scale structure was also validated with goodness-of-fit values within the framework of the structural equation modeling. It can be said that the strength of the study is that the scale is an up-to-date and dimensional scale.
The detailed findings obtained through scale scores constitute another strength of the study. As a matter of fact, when it comes to intensive use of social media behavior, it heavily influences daily life in the age of social media we live in. Therefore, it can be said that real life and online life affect each other (Tutgun-Ünal 2021). Thus, it is important to include social media behaviors in psychometric studies. At the beginning of the psychometric analyzes performed in the study was the differentiation according to gender. Although there was no difference in the overall total of the scale, a detailed dimensional analysis showed that men showed a difference by scoring high in the “Tendency to stand out and emotional instability” dimension. This result showed that men experience more emotional instability than women and that their tendency to stand out increases their immaturity.
In psychometric analyzes of social media usage, it was observed that as daily social media usage increased, especially when it reached 4 hours or more, the level of immaturity also increased. Accordingly, the result that excessive use is associated with the level of immaturity was found significant. In addition, the increase in the frequency of live chatting on social media, being happy when receiving a "Like" on social media posts, and ending a relationship at any time on social media were reflected as an increase in immaturity scores. Therefore, people who use social media excessively frequently resort to maintaining their relationships on social media, and the fact that social media affects their mood and real-life relationships has been found to be an “immature mood”. When the literature was examined, in a study conducted with 303 adolescent participants between the ages of 11-17, the relationship between social media use disorder, personality disorder and attachment styles was examined. As a result of the research in which the Psychological Disorders Inventory for Adolescents-Personality Disorders Form (PDIA-PDF), Three-Dimensional Attachment Styles Scale (TDASS), Peer Relationships Scale (PRS) and Social Media Use Disorder Scale (SMUDS) were applied, social media use disorder and personality disorders in adolescents were observed. A relationship has been found between personality disorders and attachment styles (Türk and Karaaziz 2020). Since the mood called immaturity in this study also meets the personality disorder criteria in many studies, the findings contribute to the relationship between personality disorders stated in the literature and social media use disorder. Thus, there is a need for new research to be conducted in different samples with the Uskudar Immaturity Scale (USIMS), and to interpret the results obtained together with the literature.
Supplementary Information
The online version contains supplementary material available.
Acknowledgements
We would like to thank Uskudar University and NPIstanbul Brain Hospital, for their invaluable support with data collection process.
Conflict of interest
The author declares that the author has no conflict of interest.
Consent
Informed consent was obtained from all individual participants included in the study.
Authors' contributions
NT was contributor in advising the manuscript and to the conception of the study.
Funding
This study did not receive any funding.
Data availability
The data that support the findings of this study are available from the corresponding author upon reasonable request.
Declarations
Ethical approval
This study received ethical approval from the Uskudar University Non-Interventional Research Ethics Committee report number of 61351342/April 2021-27 (30 April 2021). This study was performed according to the principles set out by the Declaration of Helsinki for the use of humans in experimental research.
Competing interests
The authors have no relevant financial or non-financial interests to disclose.
References
- Algul, A., U.B. Semiz, M.A. Ates, C. Basoglu, A. Doruk, S. Ebrinc, E. Pan, and M. Çetin. 2007. 'Relationship of Substance Use Disorder to Aggression in Male Subjects with Antisocial Personality Disorder', Dusunen Adam The Journal of Psychiatry and Neurological Sciences, 20: 141-50. [CrossRef]
- Anderson, P., and R. Carter. 2017. 'Digital behavior and psychological impact', Journal of Modern Psychology, 24: 233-48.
- Biberdzic, M., K. Ensink, L. Normandin, and J. F. Clarkin. 2017. 'Psychometric properties of the inventory of personality organization for adolescents', Adolescent Psychiatry, 7: 127-51. [CrossRef]
- Bilge, Y. 2014. 'Turkish Adaptation of the Coolidge Axis II Inventory Plus and the relationships between behavioral inhibition and behavioral activation systems with personality disorders in DSM-5', Doctoral Thesis, Istanbul University Social Sciences Institute.
- ———. 2018. 'Personality disorders and defense mechanisms', Turkish Studies Social Sciences, 13: 145-67.
- Brown, M., and S. Lee. 2021. Social media and developmental psychology: Theories and practices (Digital Psychology Press).
- Büyüköztürk, Ş.. 2018. Handbook of data analysis for social sciences (Pegem Citation Index: Ankara-Turkey).
- Ceran Yıldırım, G. G. C.. 2022. 'Evaluation of Axis II personality traits in terms of personality organizations', Journal of History School (JOHS), 15: 1383-406.
- Ceran Yıldırım, G. G. C., and S. Yüksel. 2021. 'Turkish Adaptation of Personality Organizations Inventory: Validity and Reliability Study', Ulakbilge, 56: 1-19.
- Cosentino, S., E. Arias-Pujol, and C. Pérez-Testor. 2021. 'Psychometric Properties of the Spanish Short Version of the Inventory of Personality Organization (IPO-18) in a Nonclinical Sample', Journal of Personality Assessment, 103: 659-66. [CrossRef]
- Cramer, P. 2008. 'Seven Pillars of Defense Mechanism Theory', Social and Personality Psychology Compass, 2: 1963-81. [CrossRef]
- Devens, M., and M. T. Erickson. 1998. 'The relationship between defense styles and personality disorders', Journal of Personality Disorders, 12: 86-93. [CrossRef]
- DSM-5. 2013. American Psychiatric Association Diagnostic and Statistical Manual of Mental Disorders. 5th Edition (Physicians Broadcasting Union).
- Ellison, W. D., and K. N. Levy. 2012. 'Factor structure of the primary scales of the Inventory of Personality Organization in a nonclinical sample using exploratory structural equation modeling', Psychological assessment, 24: 503. [CrossRef]
- Ersöz, M. 2023. 'Investigation of personality organization of individuals diagnosed with generalized anxiety disorder from a psychodynamic perspective', Master Thesis, Antalya Bilim University, Institute of Postgraduate Education.
- Farrington, D. P.. 1983. 'Offending from 10 to 25 years of age.' in K.T. Van Dusen and S.A. Mednick (eds.), Prospective studies of crime and delinquency (Springer, Dordrecht).
- Geiger TC, Crick NR. 2001. 'A developmental psychopathology perspective on vulnerability to personality disorders.' in RE. Ingram and JM. Price (eds.), Vulnerability to Psychopathology: Risk Across The Lifespan (Guildford Press: New York).
- Gençöz, T.. 2000. 'Positive and negative emotion scale: Validity and reliability study', Turkish Journal of Psychology, 15: 19-26.
- Green, J. 2015. 'The invisible effects of online interactions', Behavioral Studies, 18: 45-60.
- Güleç, C., and E. Köroğlu. 2007. Basic Book of Psychiatry (Physicians Broadcasting Union: Ankara-Turkey).
- Hare, R. D., and C. S. Neumann. 2009. 'Psychopathy: Assessment and forensic implications', The Canadian Journal of Psychiatry, 54: 791-802. [CrossRef]
- Hessel, C., S. E. S. Oliveira, V. Lugo, V. F. Volkmer, R. A. Marquetto, L. S. Motta,..., and L. Spanemberg. 2021. Personality structure evaluation: differences between clinical and non-clinical samples using the Inventory of Personality Organization (IPO) (Archives of Clinical Psychiatry).
- Hörz-Sagstetter, S., J. Volkert, M. Rentrop, C. Benecke, D. J. Gremaud-Heitz, H. F. Unterrainer,..., and J. Zimmermann. 2021. 'A bifactor model of personality organization. Journal of personality assessment', 103: 149-60.
- Igarashi, H., H. Kikuchi, R. Kano, H. Mitoma, M. Shono, C. Hasui, and T. Kitamura. 2009. 'The Inventory of Personality Organisation: its psychometric properties among student and clinical populations in Japan', Annals of general psychiatry, 8: 1-21. [CrossRef]
- Kay, J., and A.. Tasman. 2006. Essentials of Psychiatry (John Wiley and Sons: Chichester).
- Kernberg, O. F, and C. F. Clarkin. 1995. The Inventory of Personality Organization (The Newyork Hospital-Cornell Medical Center: White Plains, NY).
- Kernberg, O. F. 1970. 'A psychoanalytic classification of character pathology', J Am Psychoanal Assoc, 18: 800-22. [CrossRef]
- Konduz, N.. 2015. 'Inadequacy levels in interpersonal functioning of patients diagnosed with personality disorder according to DSM-5', Master Thesis, Adnan Menderes University, Institute of Health Sciences, Department of Psychiatry.
- Lenzenweger, M. F., J. F. Clarkin, O. F. Kernberg, and P. A. Foelsch. 2001. 'The Inventory of Personality Organization: psychometric properties, factorial composition, and criterion relations with affect, aggressive dyscontrol, psychosis proneness, and self-domains in a nonclinical sample', Psychol Assess, 13: 577-91.
- Livesley, WJ.. 2001. Handbook of Personality Disorders: Theory, Research and Treatment (Guilford Press: New York).
- Madran, H. A. D.. 2012. 'Validity and reliability study of the Turkish version of the Buss-Perry aggression scale', Turkish Journal of Psychology, 23: 1-6.
- Martin, L.. 2016. 'The empathy gap: How digital interactions shape emotional understanding', Social Sciences Journal, 22: 377-90.
- Millon, T., S. Grossman, C. Millon, S. Meagher, and R. Ramnath. 2004. Personality disorders in modern life (2nd ed.) (Wiley & Sons: Hoboken, NJ.).
- Öncü, F., H. Soysal, N. Uygur, F. Özdemir, S. Türkcan, D. Yeşilbursa, and G. Alataş. 2002. 'Evaluation of forensic psychiatry cases who commit recurrent crimes after compulsory clinical treatment in terms of diagnosis and nature of crime', Dusunen Adam The Journal of Psychiatry and Neurological Sciences, 15: 132-48.
- Özabacı, N.. 2011. 'Turkish adaptation of the Relationship Quality Scale: Validity and reliability study', Education and Science, 36.
- Perry, J. C., M. D. Presniak, and T. R. Olson. 2013. 'Defense mechanisms in schizotypal, borderline, antisocial, and narcissistic personality disorders', Psychiatry, 76: 32-52.
- Pilan, B. Ş., S. Erermiş, R. Çalışan, B. Yuluğ, S. H. Tokmak, K. Ö. S. E. Sezen,..., and T. Bildik. 2021. 'Adaptation process and disease symptoms of children and adolescents with chronic medical diseases in psychiatric follow-up during pandemic days', Ege Journal of Medicine, 60: 105-12.
- Pincus, AL.. 2005. 'A contemporary integrative interpersonal theory of personality disorders.' in MF. Lenzenweger and CF. Clarkin (eds.), Major Theories of Personality Disorder (Guilford Press: New York).
- Roberts, K., and T. Davis. 2021. 'Navigating maturity in a digital world', Future Psychology, 30: 199-215.
- Semkiv, I., K. Turetska, I. Kryvenko, and R. Kechur. 2022. 'Linguistic and psychometric validation of the Ukrainian translation of the Inventory of Personality Organization-Revised (IPO-R-UKR)', East European Journal of Psycholinguistics, 9. [CrossRef]
- Sinha, B. K., and D. C. Watson. 2004. 'Personality disorder clusters and the Defence StyleQuestionnaire', Psychology and Psychotherapy: Theory, Research and Practice, 77: 55-66.
- Sinha, B. K., and D. C. Watson. 1999. 'Predicting personality disorder traits with the defense style questionnaire in a normal sample', Journal of Personality Disorders, 13: 281-86. [CrossRef]
- Smith, R.. 2020. 'Immaturity and its modern manifestations', Journal of Developmental Psychology, 28: 211-25.
- Tarhan, N.. 2017. Psychological Warfare (Timaş Publishing: Istanbul-Turkey).
- Tarhan, N., and A. Tutgun-Ünal. 2024. 'Development of the Uskudar Social Norm Scale: Validity, reliability studies and psychometric analysis', Inprocess.
- Tavşancıl, E., and E. Aslan. 2021. Content analysis and application examples for verbal, written and other materials (Epsilon Publishing: Turkey).
- Taylor, D.. 2018. 'Emotional regulation and online behavior', Human Development Studies, 20: 276-89.
- Taymur, İ., and M.H. Türkçapar. 2012. 'Personality: Description, classification and evaluation ', Current Approaches in Psychiatry, 4: 154-77.
- Thompson, H.. 2019. 'Correlation between media usage and immaturity', Cognitive Development Journal, 15: 133-49.
- Tutgun-Ünal, A. 2021. Social Media: Effect-Addiction-Measurement (Der Publishing: Istanbul-Turkey).
- Türk, M.E., and M. Karaaziz. 2020. 'Investigation of the relationship between using social media, attachment styles, peer relationships and personality disorders in adolescents ', Turkey Journal of Integrative Psychotherapy, 3: 97-112.
- White, J.. 2018. 'Longitudinal studies on digital engagement and psychological growth', Journal of Psychological Research, 27: 58-72.
- Wilson, C.. 2022. 'Immediate gratification and its psychological impacts', Journal of Instant Gratification Studies, 12: 75-89.
- Yavuz, B., and M. Avcı. 2020. 'A review on the common variables of repetitive guilt, behavioral and antisocial personality disorders', nternational Journal of Society Researches, 15: 2912-36.
- Yılmaz, N., T. Gençöz, and M. Ak. 2007. 'Psychometric properties of the defense style questionnaire: a reliability and validity study', Turkish Journal of Psychiatry, 18: 244-53.
Figure 1.
USIMS Path Diagram Model.
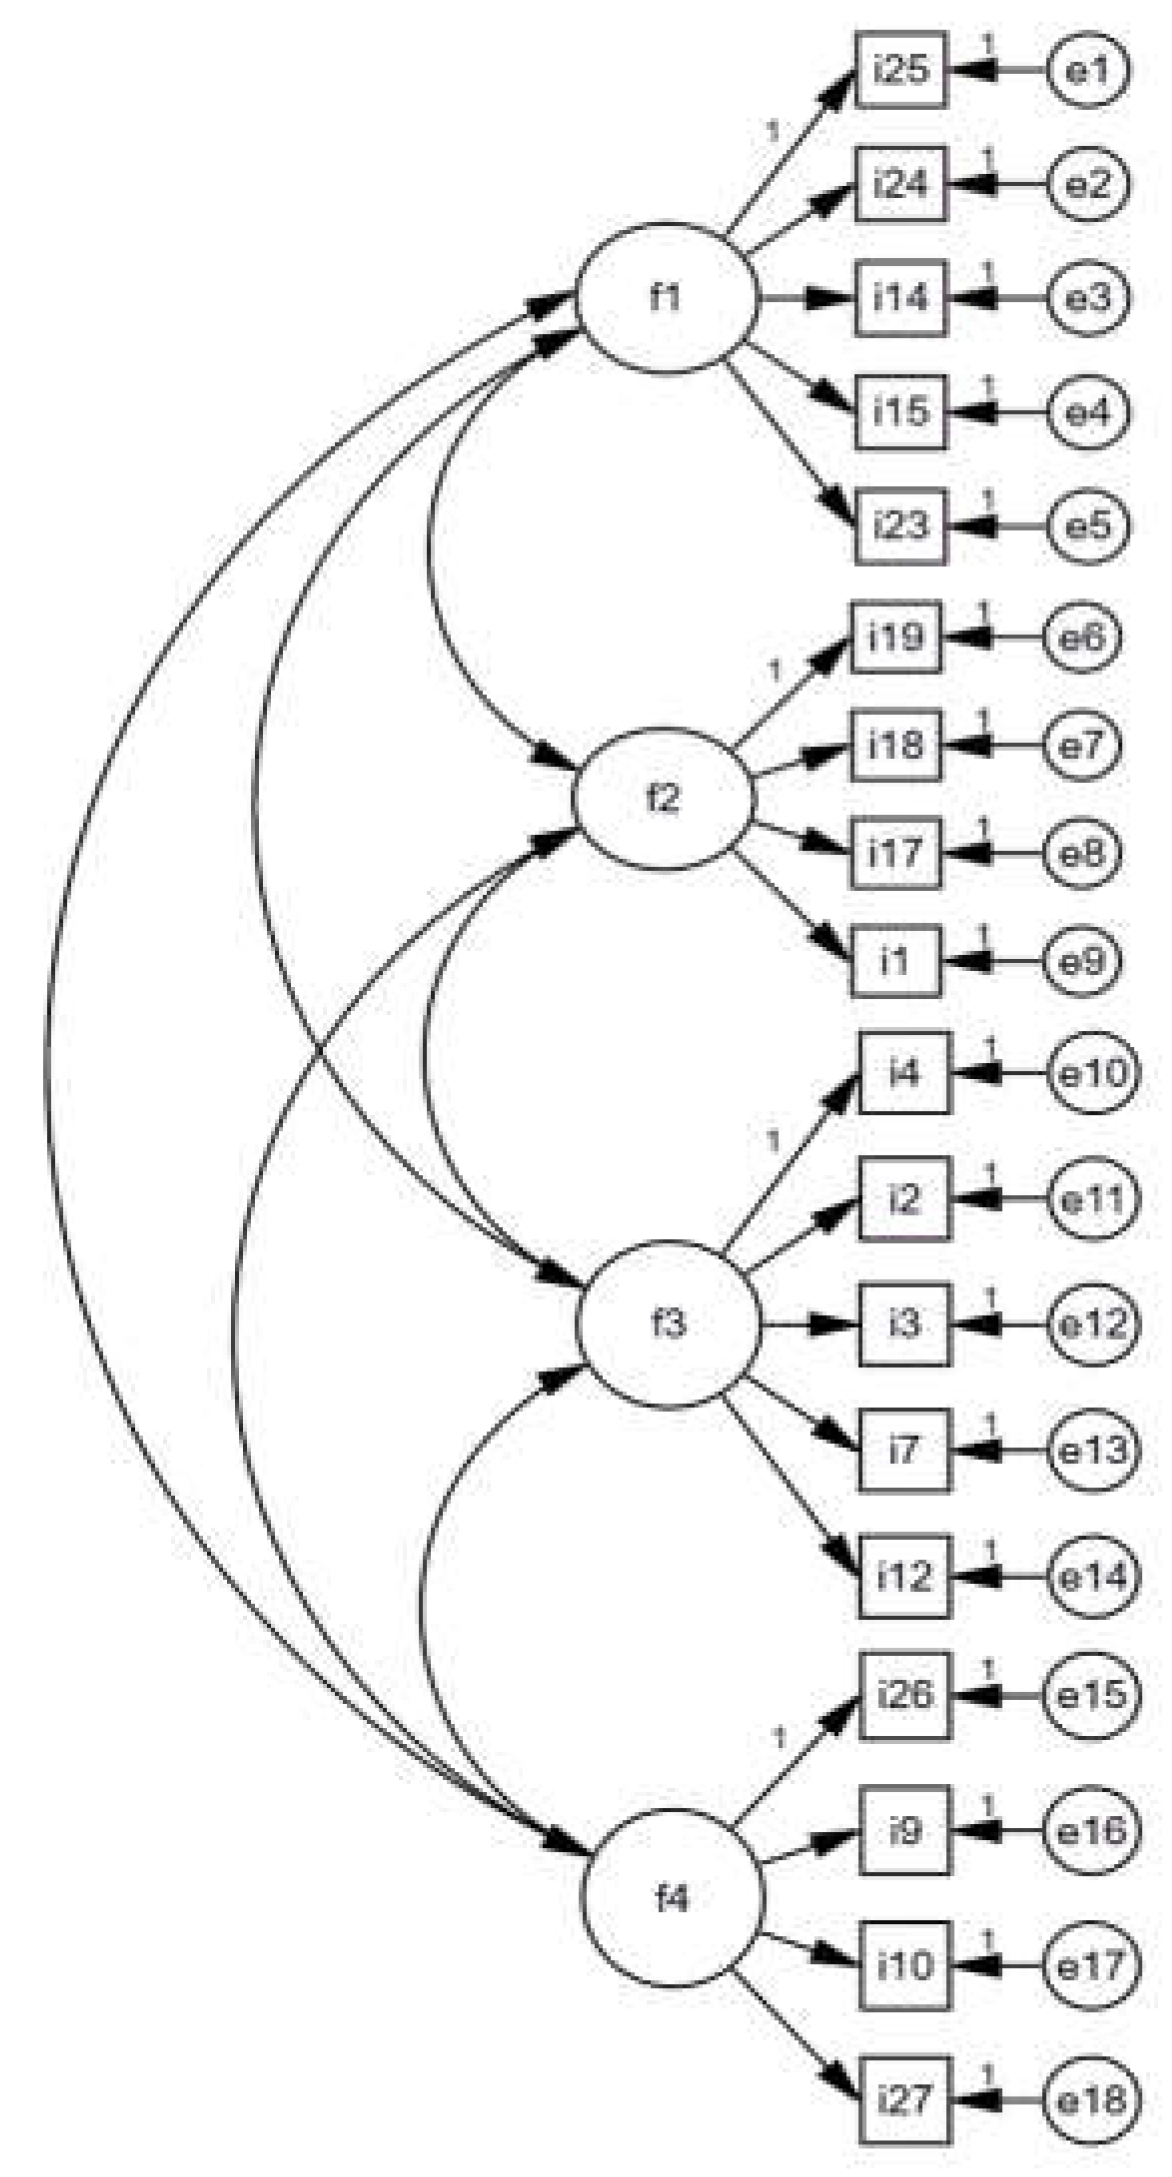
Figure 2.
USIMS: Factor 4 scores of the Groups (Cutoff point 2.5 was accepted as the middle value.).
Figure 2.
USIMS: Factor 4 scores of the Groups (Cutoff point 2.5 was accepted as the middle value.).
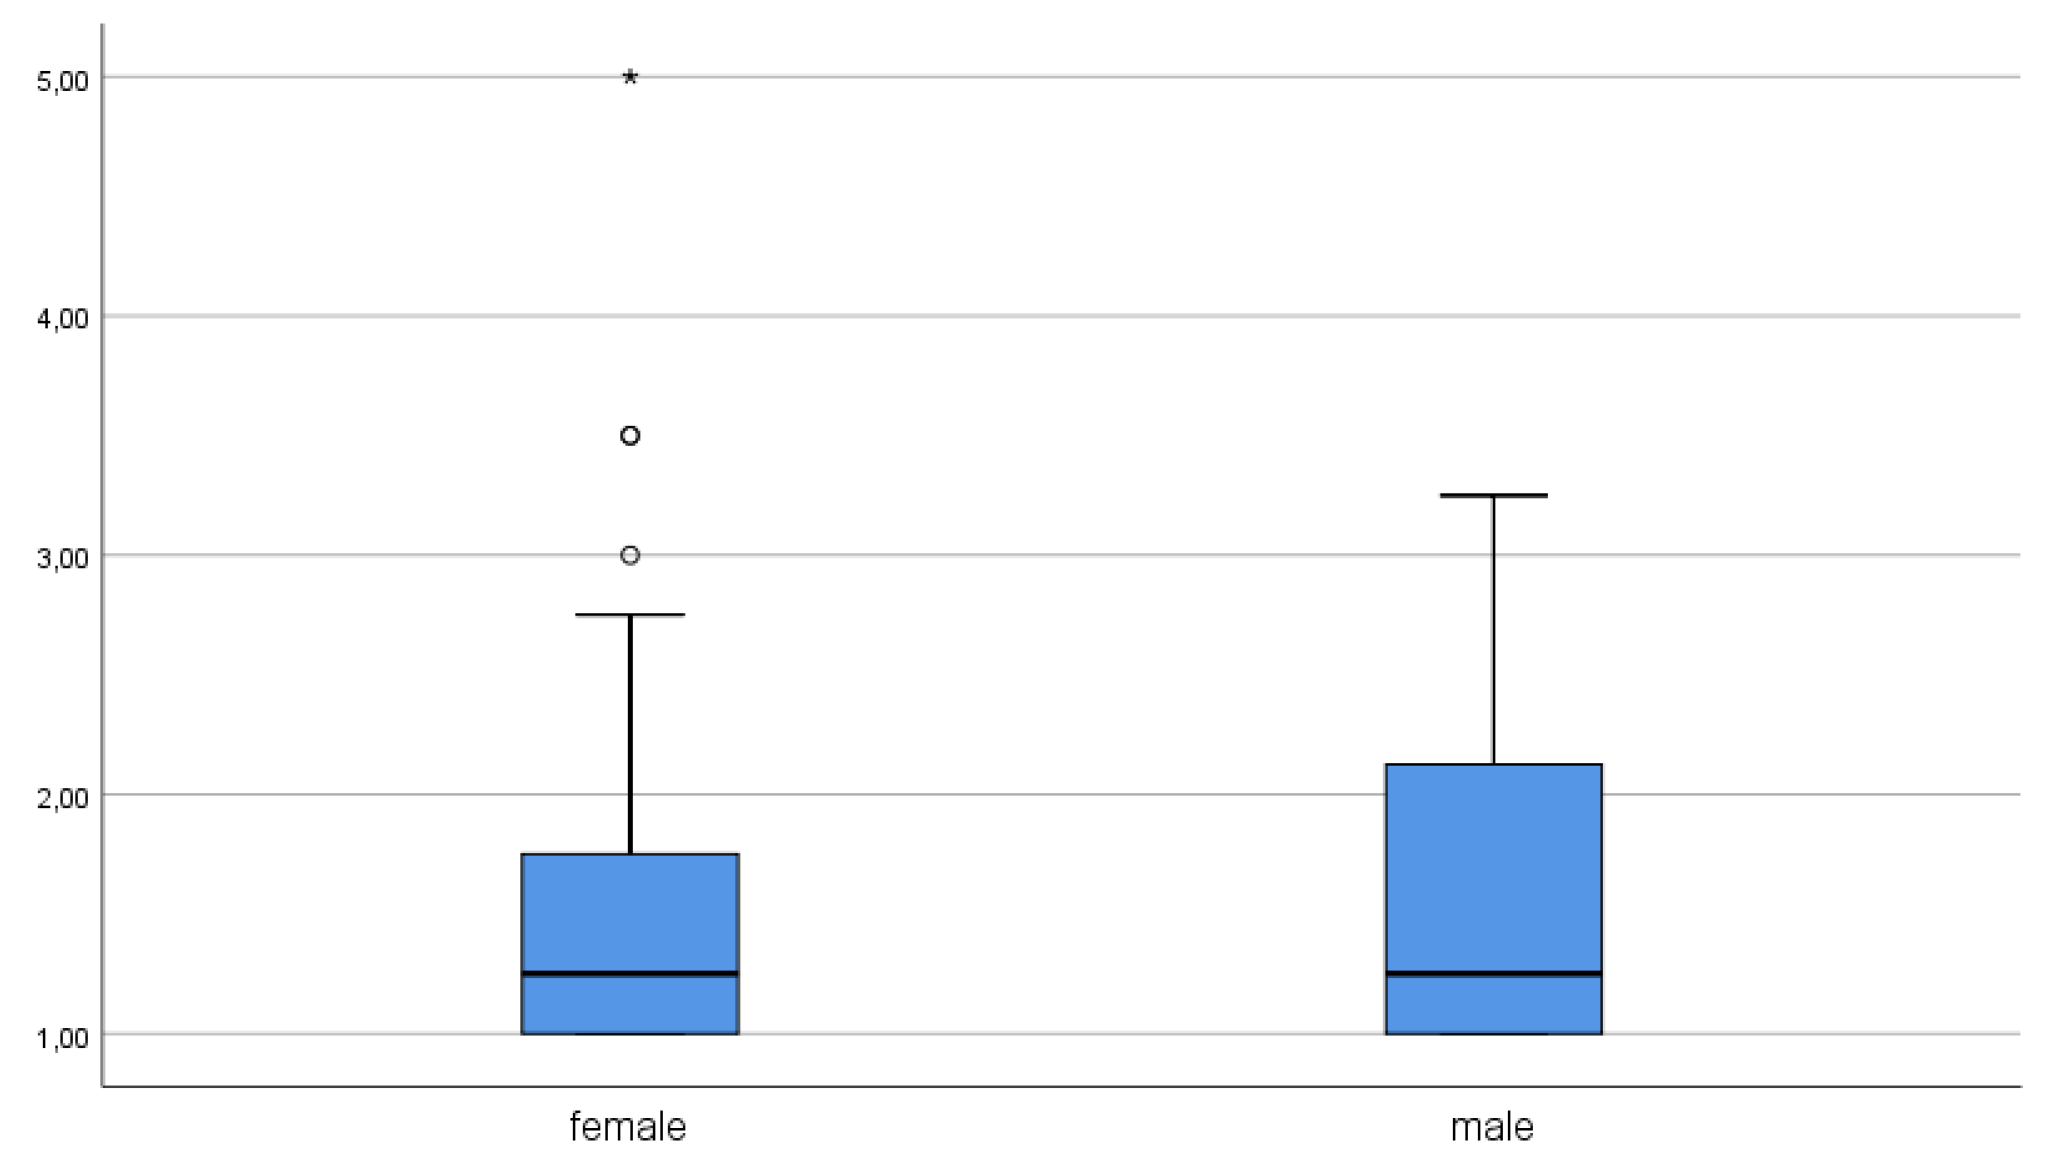
Figure 3.
USIMS: Factor 3 Scores of the Groups (Cutoff point 2.5 was accepted as the middle value).
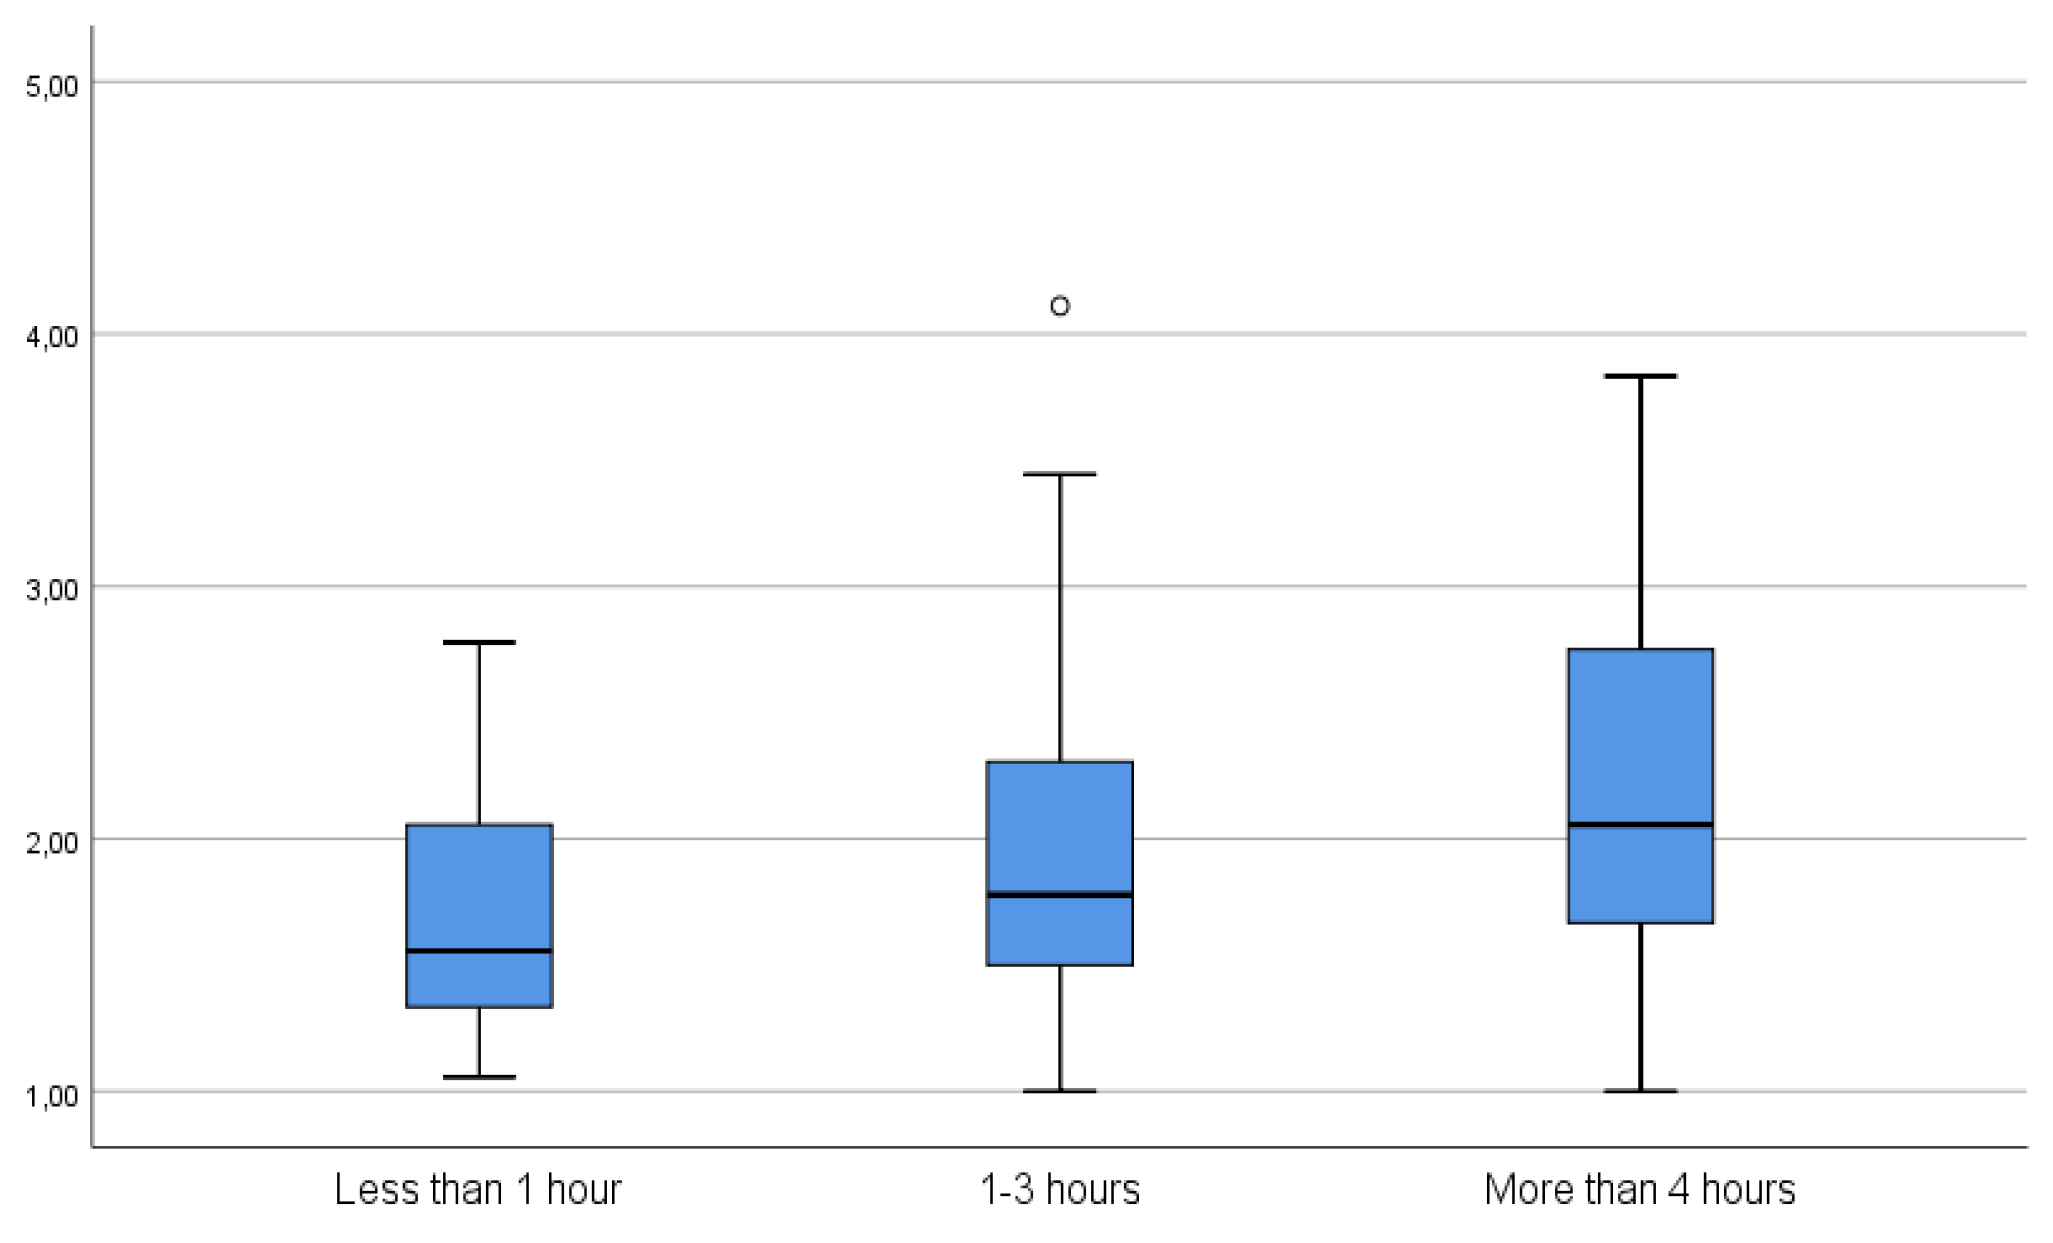

Table 1.
USIMS Factor Structure and Explained Variance Ratio.
| USIMS | Eigenvalue | Variance | Cummulative Variance |
|---|---|---|---|
| Factor 1 | 5.66 | 31.46 | 31.46 |
| Factor 2 | 2.22 | 12.37 | 43.83 |
| Factor 3 | 1.36 | 7.57 | 51.41 |
| Factor 4 | 1.10 | 6.16 | 57.57 |
Table 2.
USIMS Item Factor Loads, Item Total Correlations and Cronbach Alpha Values.
|
Factor |
New Item Nu. |
Items | Factor Load | Item Total Correlation |
Cronbach Alpha |
|---|---|---|---|---|---|
|
F1 |
1 | Q25: It is known and said that I easily believe what I am told. | ,86 | ,78 | ,84 |
| 2 | Q24: People often say I'm easily influenced. | ,80 | ,74 | ||
| 3 | Q14: I believe easily, I give up quickly. | ,79 | ,76 | ||
| 4 | Q15: My personality and ideas may change at any time. | ,68 | ,72 | ||
| 5 | Q23: I want my wishes to be immediate, I am known as hasty. | ,53 | ,61 | ||
| F2 | 6 | Q19: When I get into crowds, I want everyone to pay attention to me. | ,80 | ,78 | ,80 |
| 7 | Q18: I am self-centered, I want immediate gratification. | ,75 | ,79 | ||
| 8 | Q17: I always want to be trusted and liked. | ,70 | ,72 | ||
| 9 | Q1: I make every event striking or exaggerate. | ,52 | ,56 | ||
| F3 | 10 | Q4: I am an exciting, fun person. | ,76 | ,63 | ,75 |
| 11 | Q2: I have a good understanding of fashion and I attach great importance to appearance. | ,70 | ,70 | ||
| 12 | Q3: My clothes and mannerisms are remarkable. | ,69 | ,76 | ||
| 13 | Q7: I am popular, I am wanted person. | ,68 | ,74, | ||
| 14 | Q12: Routine work bores me, and I avoid things that are not adventure or excitement. | ,55 | ,60 | ||
| F4 | 15 | Q26: My relatives argue among themselves because of me. | ,68 | ,56 | |
| 16 | Q9: When I'm bored, I fake illness. | ,63 | ,57 | ||
| 17 | Q10: My conversations are colorful and exciting, but I lie even if I don't want to. | ,59 | ,52 | ,56 | |
| 18 | Q27: I get offended or stubborn easily, then carry on as if nothing is wrong. | ,55 | ,58 | ||
| Total | .87 |
Explanation: As a result of the EFA, the USIMS scale form, consisting of 18 items and 4 factors, was rated on a 5-point Likert type as “Never”, “Rarely”, “Sometimes”, “Often”, “Always”. A minimum of “1” and a maximum of “5” points can be obtained from each item.
Table 3.
Relationship between USIMS and Factors.
| Subscales/Scale | F1 | F2 | F3 | F4 |
|---|---|---|---|---|
| F1 | 1 | |||
| F2 | ,52 | 1 | ||
| F3 | ,26 | ,46 | ,1 | |
| F4 | ,56 | ,62 | ,36 | 1 |
| USIMS | ,79 | ,82 | ,70 | ,76 |
Table 4.
Discriminant Validity of USIMS.
| Scale/Dimensions | Group | N | X | SS | Sd | t | p |
|---|---|---|---|---|---|---|---|
| F1 | Upper Group | 86 | 5.76 | .77 | 170 | 25.47 | ,000 |
| Lower Group | 86 | 16.17 | 3.70 | ||||
| F2 | Upper Group | 86 | 4.37 | .48 | 170 | 26.23 | ,000 |
| Lower Group | 86 | 11.50 | 2.47 | ||||
| F3 | Upper Group | 86 | 7.90 | 1.41 | 170 | 31.79 | ,000 |
| Lower Group | 86 | 17.41 | 2.38 | ||||
| F4 | Upper Group | 86 | 4.00 | .00 | 170 | 21.05 | |
| Lower Group | 86 | 8.77 | 2.10 | ||||
| USIMS | Upper Group | 86 | 24.59 | 2.83 | 170 | 29.46 | ,000 |
| Lower Group | 86 | 49.77 | 7.40 |
Table 5.
Pearson Correlation Value of Scales.
| Scales | N | X | r | p |
|---|---|---|---|---|
| USIMS & USNORM | 320 | 35.48 | ,68 | ,000 |
| 320 | 44.64 |
Table 6.
Average USIMS Scores of Groups.
| Groups | X | SS | d |
|---|---|---|---|
| USIMS – Female (n=264) | 1.95 | .60 | - |
| USIMS – Male (n=56) | 2.04 | .66 | |
| Total (n=320) | 1.97 | .61 | |
| Significant Factor | |||
| USIMS: F4 – Female (n=264) | 1.42 | .54 | 0,29ab |
| USIMS: F4 – Male (n=56) | 1.60 | .66 | |
The range is between 1-5.aReference group was calculated as USIMS: F4 female total X1-X2/SDFemalebReference group was calculated as USIMS: F4 male total X1-X2/SDMale
Table 7.
Average USIMS Scores of Daily Social Media Usage Groups.
| Groups of Daily Use of Social Media | X | SS | d |
|---|---|---|---|
| Group 1: USIMS – Less than 1 hour (n=41) | 1.66 | .43 | 0,93ac0,50ab0,44bc |
| Group 2: USIMS – 1-3 hours (n=180) | 1.91 | .56 | |
| Group 3: USIMS – More than 4 hours (n=99) | 2.19 | .68 | |
| Total (n=320) | 1.97 | .61 |
The range is between 1-5.aReference group1 was calculated as USIMS – less than 1 hour of daily use X1-X2/SDLess than 1 hour bReference group2 was calculated as USIMS – 1-3 hours of daily use X1-X2/SD1-3 hours cReference group3 was calculated as USIMS – more than 4 hours of daily use X1-X2/SDMore than 4 hours
Table 8.
Average USIMS Scores of Groups of Live Chat Frequency.
| Groups | X | SS | d |
|---|---|---|---|
| USIMS – Live Chat Frequency/Never (n=77) | 1.80 | .64 | 0.55ad 0.33ac 0.32bd 0.26cd |
| USIMS – Live Chat Frequency/Rarely (n=115) | 1.96 | .57 | |
| USIMS – Live Chat Frequency/Sometimes (n=71) | 2.00 | .56 | |
| USIMS – Live Chat Frequency/Often (n=57) | 2.16 | .65 | |
| Significant Factor | |||
| USIMS: F3 – Live Chat Frequency/Never (n=77) | 2.18 | .85 | 0.74ad 0.52bd 0.27ac |
| USIMS: F3 – Live Chat Frequency/Rarely (n=115) | 2.40 | .72 | |
| USIMS: F3 – Live Chat Frequency/Sometimes (n=71) | 2.41 | .82 | |
| USIMS: F3 – Live Chat Frequency/Often (n=57) | 2.81 | .83 | |
The range is between 1-5.aReference group was calculated as USIMS: Live Chat Frequency/Never total X1-X2/SD Never bReference group was calculated as USIMS: Live Chat Frequency/Rarely total X1-X2/SD Rarely cReference group was calculated as USIMS: Live Chat Frequency/Sometimes total X1-X2/SD Sometimes dReference group was calculated as USIMS: Live Chat Frequency/Often total X1-X2/SD Often aReference group was calculated as USIMS: F3- Live Chat Frequency/Never total X1-X2/SD Never bReference group was calculated as USIMS: F3- Live Chat Frequency/Rarely total X1-X2/SD Rarely cReference group was calculated as USIMS: F3- Live Chat Frequency/Sometimes total X1-X2/SD Sometimes dReference group was calculated as USIMS: F3- Live Chat Frequency/Often total X1-X2/SD Often
Table 9.
Average USIMS Scores of ‘Like’ Happiness Groups.
| Groups of ‘Like’ Happiness | X | SS | d |
|---|---|---|---|
| USIMS – ‘Like’ Happiness/Yes (n=159) | 2.08 | .65 | 0,41ac 0,36ab 0.11bc |
| USIMS – ‘Like’ Happiness/Undecided (n=72) | 1.88 | .43 | |
| USIMS – ‘Like’ Happiness/No (n=87) | 1.82 | .61 |
The range is between 1-5.aReference group1 was calculated as USIMS – ‘Like’ Happiness/Yes X1-X2/SDYes bReference group2 was calculated as USIMS – ‘Like’ Happiness/Undecided X1-X2/SDUndecided cReference group3 was calculated as USIMS – ‘Like’ Happiness/No X1-X2/SDNo
Table 10.
Average Factors Scores of ‘Like’ Happiness Groups.
| Groups of ‘Like’ Happiness | X | SS | d |
|---|---|---|---|
| F1 – ‘Like’ Happiness/Yes (n=159) | 2.15 | .97 | 0,37ab |
| F1 – ‘Like’ Happiness/Undecided (n=72) | 1.99 | .94 | |
| F1 – ‘Like’ Happiness/No (n=87) | 1.81 | .82 | |
| F2 – ‘Like’ Happiness/Yes (n=159) | 1.98 | .84 | 0.29ac 0.53ab |
| F2 – ‘Like’ Happiness/Undecided (n=72) | 1.60 | .54 | |
| F2 – ‘Like’ Happiness/No (n=87) | 1.73 | .87 | |
| F3 – ‘Like’ Happiness/Yes (n=159) | 2.53 | .81 | 0.30ac 0.20ab |
| F3 – ‘Like’ Happiness/Undecided (n=72) | 2.38 | .66 | |
| F3 – ‘Like’ Happiness/No (n=87) | 2.26 | .93 | |
| F4 – ‘Like’ Happiness/Yes (n=159) | 1.54 | .59 | 0.28ac 0.32ab |
| F4 – ‘Like’ Happiness/Undecided (n=72) | 1.37 | .45 | |
| F4 – ‘Like’ Happiness/No (n=87) | 1.37 | .60 |
The range is between 1-5.aReference group1 was calculated as F1 – ‘Like’ Happiness/Yes X1-X2/SDYes bReference group2 was calculated as F1 – ‘Like’ Happiness/No X1-X2/SDNo aReference group1 was calculated as F2 – ‘Like’ Happiness/Yes X1-X2/SDYes bReference group2 was calculated as F2 – ‘Like’ Happiness/Undecided X1-X2/SDUndecided cReference group3 was calculated as F2 – ‘Like’ Happiness/No X1-X2/SDNo aReference group1 was calculated as F3 – ‘Like’ Happiness/Yes X1-X2/SDYes bReference group2 was calculated as F3 – ‘Like’ Happiness/Undecided X1-X2/SDUndecided cReference group3 was calculated as F3 – ‘Like’ Happiness/No X1-X2/SDNo aReference group1 was calculated as F4 – ‘Like’ Happiness/Yes X1-X2/SDYes bReference group2 was calculated as F4 – ‘Like’ Happiness/Undecided X1-X2/SDUndecided cReference group3 was calculated as F4 – ‘Like’ Happiness/No X1-X2/SDNo
Table 11.
Average USIMS Scores of ‘Relationship Breakdown on Social Media’ Groups.
| Groups | X | SS | d |
|---|---|---|---|
| USIMS – Relationship Breakdown on Social Media/Yes (n=60) | 2.38 | .70 | 0.81ab |
| USIMS – Relationship Breakdown on Social Media/No (n=257) | 1.87 | .54 | |
| F1 – Relationship Breakdown on Social Media/Yes (n=60) | 2.51 | 1.06 | 0,96ab |
| F1 – Relationship Breakdown on Social Media/No (n=257) | 1.92 | .87 | |
| F2 – Relationship Breakdown on Social Media/Yes (n=60) | 2.22 | .99 | 0.87ab |
| F2 – Relationship Breakdown on Social Media/No (n=257) | 1.74 | .74 | |
| F3 – Relationship Breakdown on Social Media/Yes (n=60) | 2.89 | .86 | 0.69ab |
| F3 – Relationship Breakdown on Social Media/No (n=257) | 2.32 | .77 | |
| F4 – Relationship Breakdown on Social Media/Yes (n=60) | 1.75 | .76 | 0.56ab |
| F4 – Relationship Breakdown on Social Media/No (n=257) | 1.39 | .49 |
The range is between 1-5. aReference group was calculated as USIMS- Relationship Breakdown/Yes total X1-X2/SDYes bReference group was calculated as USIMS- Relationship Breakdown/No total X1-X2/SDNo aReference group was calculated as F1- Relationship Breakdown/Yes total X1-X2/SDYes bReference group was calculated as F1- Relationship Breakdown/No total X1-X2/SDNo aReference group was calculated as F2- Relationship Breakdown/Yes total X1-X2/SDYes bReference group was calculated as F2- Relationship Breakdown/No total X1-X2/SDNo aReference group was calculated as F3- Relationship Breakdown/Yes total X1-X2/SDYes bReference group was calculated as F3- Relationship Breakdown/No total X1-X2/SDNo aReference group was calculated as F4- Relationship Breakdown/Yes total X1-X2/SDYes bReference group was calculated as F4- Relationship Breakdown/No total X1-X2/SDNo
Disclaimer/Publisher’s Note: The statements, opinions and data contained in all publications are solely those of the individual author(s) and contributor(s) and not of MDPI and/or the editor(s). MDPI and/or the editor(s) disclaim responsibility for any injury to people or property resulting from any ideas, methods, instructions or products referred to in the content. |
© 2025 by the authors. Licensee MDPI, Basel, Switzerland. This article is an open access article distributed under the terms and conditions of the Creative Commons Attribution (CC BY) license (http://creativecommons.org/licenses/by/4.0/).
Copyright: This open access article is published under a Creative Commons CC BY 4.0 license, which permit the free download, distribution, and reuse, provided that the author and preprint are cited in any reuse.


