
Submitted:
31 December 2024
Posted:
03 January 2025
You are already at the latest version
Abstract
This paper examines the transformative effects of decarbonization on electricity market design, emphasizing the challenges and opportunities posed by the rapid integration of renewable energy sources such as wind and solar. It analyzes the evolution of key wholesale market segments—including day-ahead, real-time, capacity, long-term purchase agreements, ancillary services, and transmission markets—highlighting their critical roles in managing the variability of renewable energy generation through efficient price signals and resource coordination. Variable renewable energy integration introduces significant operational challenges, including overgeneration risks, ramping capacity demands, forecast inaccuracies, and transmission constraints. Addressing these issues requires enhanced market flexibility, dynamic pricing mechanisms, and advanced real-time balancing strategies. This paper assesses these challenges, offering strategies to align generation with demand and optimize market outcomes. As electricity systems evolve, legacy market structures must adapt to incorporate carbon-free resources while maintaining grid reliability and economic sustainability. By exploring case studies such as Chile and California, the paper demonstrates the importance of targeted innovations in market design, regulatory frameworks, and operational technologies. It advocates for a holistic approach to ensure a reliable, affordable, and equitable transition to a decarbonized energy future.
Keywords:
decarbonization
; renewable energy integration
; electricity market design
; resilient grids
; clean energy dynamics
; energy transition
; power shift
; future-proof energy
1. Introduction
The primary objective of decarbonization is to
significantly reduce CO2 equivalent emissions (CO2e) into the atmosphere,
recognizing them as the principal driver of climate change. Decarbonizing the
economy involves replacing conventional CO2-emitting fossil fuel (FF)
technologies with renewable energy (RE) technologies like solar, wind, nuclear,
and fossil fuel technologies equipped with carbon capture and storage (CCS).
It also demands energy efficiency and reduced CO2 emissions related to Land
Use, Land-Use Change and Forestry (LULUCF), and other human activities [1] 1
Decarbonization strategies shape energy markets in
a variety of impactful ways. Civil society and regulatory frameworks can play a
crucial role by leveraging public pressure and implementing mandatory
regulations, such as Renewable Energy Targets (RET), Renewable Portfolio
Standards (RPS), or Clean Electricity Standards (CES). These policies often
create markets for Renewable Energy Certificates (RECs) or Clean Electricity
Certificates (CECs) and push for the phased retirement of fossil fuel plants.
CO2 taxes, making FF-based energy more expensive, are strong incentives for
investing in cleaner energy technologies and energy efficiency. Similarly,
cap-and-trade systems create a market for carbon allowances, allowing emissions
reductions to happen where they are most economically viable. This top-down
approach helps guide the overall direction and pace of the transition to
sustainable energy.
On a more individualized level, CO2 quotas or
licenses make consumers and businesses directly accountable for their carbon
emissions, fostering energy-saving behaviors and cleaner energy choices.
However, such a system may be complex to administer. Mandated energy efficiency
improvements offer another path toward reduced emissions across various
sectors. Though they can be costly, subsidies for renewable energy, such as
feed-in tariffs or premiums, help lower the financial barriers to clean energy
adoption.
Finally, investments in research and development
are essential to spur innovation in energy generation, energy storage solutions
(ESS), systems integration and operation, and efficiency, unlocking long-term
solutions and accelerating the transition to a decarbonized future.
Each instrument’s impact varies, affecting market
dynamics, investment decisions, and the pace of transition towards a
decarbonized energy future.
The expected evolution of the power sector should
be characterized by the gradual substitution of FF generation, especially those
lacking CCS, with renewable sources like solar photovoltaic (PV), wind,
nuclear, and other low CO2e emission technologies.
Historically, the power system was designed for
baseload plants to meet demand on continuous high-output operations. Thermal
power stations, including coal, geothermal, and nuclear, typically exhibit
availability factors ranging between 70% and 90% or higher [2]. In contrast, renewables such as solar and wind
offer variable output contingent upon weather, daylight, and wind conditions,
resulting in minute, hourly, daily, seasonal, and yearly variations in energy
supply. The increasing variability and uncertainty in power generation—both
from utility-scale sources and a growing share of Distributed Energy Resources
(DERs)—across different geographic regions and temporal scales necessitates a
more adaptive and responsive power system infrastructure.
This transition also occurs with a growing
electrification trend across households, industry, and transportation. As
CO2-emitting technologies phase out, they are being replaced by cleaner
alternatives powered by electricity, as is happening with the introduction of
electric vehicles (EVs).
Thus, the primary challenges for power system
development and operation involve incorporating, integrating, and managing
increasing shares of variable renewable energy (VRE) and distributed generation
(DG) sources. While traditional market structures are centralized,
decentralization via DERs like rooftop solar, batteries, and microgrids
disrupts this model. This shift introduces a more sizable number of generation
units, several with small plate capacity and variable output profiles,
geographically dispersed and out of the reach of the System Operator (SO), all
while the SO (Independent Systems Operators -ISOs- and Regional Transmission
Organizations -RTOs-) - must ensure system reliability [3–6] 2
To address these challenges, expanding transmission infrastructure, ESS,
accommodating VRE, and implementing resource-enhancing technologies, such as
advanced communication and operational and control technologies that facilitate
the coordinated dispatch of all resources to match supply and demand in
real-time, are crucial. The historical baseload paradigm relying on large,
centralized plants has been challenged to evolve into a more flexible system
capable of adapting to demand and renewable generation variability.
Electricity markets are pivotal in facilitating
trade and resource allocation by providing a structured framework for valuing
and pricing tradable items. They can develop organically or designed to enable
the transfer of ownership rights. In the electric power industry, various
electricity market structures exist. Some rely on competitive bidding to
determine market-based prices, while others depend on administratively set
prices.
Physical and financial markets exist in electricity
and other markets. Physical electricity markets encompass the infrastructure,
institutions, and participants in, for example, trading energy and related
services like capacity and ancillary services. They are distinguished and
identified by location-based physical attributes and system conditions.
Locational Marginal Prices (LMPs) represent energy prices at specific grid
nodes and times (spatial distribution of electricity prices). Trades can occur
in real-time spot markets to balance instantaneous supply and demand of energy
and forward markets for future delivery, depending on market constructs
timeframes ranging from 30 minutes to multiple years. Market design aims to
efficiently manage grid constraints and electrical losses while matching
generation with load across the transmission system. Both spot and forward
physical markets are essential for reliable grid management, planning, and
investors’ decisions.
In contrast, financial electricity markets, also
known as futures and derivatives, center around trading financial instruments
whose values derive from underlying physical electricity prices. 3 A derivatives transaction doesn’t typically involve the transfer of any
physical product – just money. Electricity futures and similar derivatives
enable market participants to mitigate or hedge price risks, like LMPs, within
a competitive electricity market. These futures contracts, being legally
binding and negotiable, stipulate the future delivery of a commodity. In many
instances, physical delivery doesn’t occur, and the closure of the futures
contract is executed through buying or selling on or around the delivery date.
Financial instruments include derivatives, securities, options, swaps, forward
and futures, and insurance products linked to energy assets [7,8]. These markets have distinct structures,
institutions, participants, and products influenced by financial supply and
demand drivers. Participants may use financial markets for risk management,
speculation, or portfolio optimization without owning physical assets. These
markets provide flexibility and liquidity.
The key distinction between physical and financial
electricity markets remains in the nature of the traded products and
participants’ motivations. Recognizing this difference is vital for the
electricity market’s design and analysis. EIA data shows that 2021 US electric
industry sales to ultimate customers reached USD 422 billion, while for the
Americas, the energy derivative market size, mainly the US, by notional value,
registered by the World Federation of Exchanges for CME Group was USD 33
trillion, what underscores the difference in market size between the physical
market and the derivatives market, with the last being about 80 times bigger [9].
Flexibility has become essential in decarbonized
markets, as the fluctuating output from VRE sources requires energy storage
(ES), demand response (DR), and flexible generation to maintain grid stability.
To accommodate the growth of VRE and distributed energy resources (DERs),
significant investments in grid infrastructure, including transmission
upgrades, ES, more granular pricing, flexible markets, and advanced smart
metering and management technologies, are crucial.
Decarbonization also calls for comprehensive policy
and regulatory reforms, such as RPS, carbon pricing, and streamlined
permitting, to facilitate the efficient integration of renewable energy. These
regulatory shifts have and continue to influence market dynamics and investment
decisions, steering capital away from traditional FF infrastructure towards RE
projects and technologies.
The rise of decentralized energy producers,
prosumers, and smart grid technologies is disrupting traditional centralized
electricity markets, fostering competition and innovation. The need for
flexibility—through ES, DR, and adaptable generation—becomes critical as VRE
expands. This transition is poised to reshape industrial activity, job markets,
and the future of energy infrastructure.
To effectively navigate the complexities of
decarbonizing electricity markets, this paper adopts a conceptual framework
that integrates key components driving market evolution and operational
adaptation. The framework centers on three interconnected pillars: the
integration of VRE, the transformation of market structures, and the role of
policy and technological innovation. These pillars interact dynamically,
shaping how markets address challenges such as intermittency, grid flexibility,
and financial sustainability while pursuing decarbonization goals. By linking
operational challenges with economic and environmental objectives, this
framework provides a cohesive lens to analyze the evolving dynamics of
electricity markets, emphasizing the importance of holistic strategies to
ensure reliability, affordability, and sustainability in the energy transition.
This approach also highlights feedback loops where policy and technological
advancements influence market outcomes, fostering resilience in an increasingly
decentralized and renewable-powered energy landscape.
This paper analyzes trends on the impact of
decarbonization on wholesale electricity markets, on markets where supply and
demand dynamics, bilateral agreements, and administrative price-setting models
determine prices. However, the decarbonization of the energy matrix is not the
only driver of electricity markets [10]. As
economies worldwide transition toward low-carbon energy sources, electricity
markets must adapt to accommodate these new realities. While this analysis
primarily emphasizes the effects of decarbonization on competitive physical
wholesale electricity markets, it is essential to briefly mention the
interconnected nature of financial markets, given their significant role in
hedging risk and supporting investment in the evolving energy landscape.
The results emphasize that existing market designs,
pricing mechanisms, and grid infrastructure must adapt to integrate VRE while
ensuring reliability and affordability efficiently. DERs are disrupting market
structure, and price volatility is expected to increase, as VRE can cause
significant price drops during periods of overgeneration and low demand, as
well as sharp spikes during shortages. This volatility impacts power plant
revenues, with FF generators seeing reduced operating hours and declining revenues,
while VRE projects, supported by long-term contracts and evolving market
incentives, become more economically viable. The paper also underscores the
role of policy and regulatory frameworks, such as carbon pricing and RET, RPS,
REC, and CES, in shaping market dynamics and investment patterns. Additionally,
the transition towards a low-carbon energy system is introducing new market
players and creating opportunities for innovation. Still, it also poses
economic challenges, including the risk of stranded assets in the fossil fuel
sector.
To explore the transformative impact of
decarbonization on electricity market design, this paper adopts a mixed-methods
approach, combining qualitative and quantitative analysis within a cohesive
conceptual framework. The research draws on case studies to highlight regional
challenges and opportunities in integrating high shares of VRE. Pri-mary data
is sourced from open-access repositories, policy reports, and peer-reviewed
lit-erature from leading energy institutions. The analysis focuses on three interconnected
pil-lars: the integration of VRE, the transformation of market structures, and
the role of policy and technological innovation. These pillars interact
dynamically, addressing challenges such as intermittency, grid flexibility, and
financial sustainability while pursuing decar-bonization goals. The conceptual
framework synthesizes trends in market dynamics, op-erational challenges, and
policy adaptations, illustrating how market design, renewable integration, and
system flexibility interact to shape the future of decarbonized energy
sys-tems. This approach provides a comprehensive, evidence-based evaluation of
electricity market trends, emphasizing the importance of holistic strategies to
ensure reliability, af-fordability, and sustainability while fostering
resilience in an increasingly decentralized and renewable-powered energy
landscape.
2. Wholesale Electricity Markets
The design of electricity markets varies across
countries and regions, yet a common overarching framework prevails. This
framework typically encompasses energy, capacity, ancillary services,
transportation, storage, Long Term Purchase Agreements (LTPA) or Power Purchase
Agreements (PPA), and distribution markets, some of which operate at wholesale
and retail levels. Retail markets pertain to selling electricity directly to
consumers in distribution markets. In contrast, wholesale markets predominantly
revolve around electricity transactions among generation and transmission
sectors, electric utilities, and electricity traders before the final sale to
consumers or large consumers, typically at high voltages. In contrast, retail
electricity markets center around the sale of electricity within an electricity
distribution grid, often at lower voltages, targeting end consumers, including
households, commercial establishments, and smaller industrial consumers. The
local distribution company and third-party aggregators or suppliers utilizing
the distribution grid commonly manage this sale.
Historically, real-time operations in the energy
sector were defined by the constant variation of demand, where capable
generation units adapted their output in a process known as load following to
accommodate these ongoing demand shifts. ISO/RTOs utilize a centralized
economic dispatch based on generators/demand bids, or power plants' operational
costs merit order, to optimize the use of these generators and minimize
real-time operational costs.
Key wholesale market segments include bilateral
long-term contracting, day-ahead scheduling, real-time dispatch, capacity
auctions, ancillary services procurement [11],
and transmission markets. When the conditions enable competitive markets, each
segment establishes prices through competitive mechanisms based on supply and
demand fundamentals. Well-designed and complete markets provide incentives and
price signals to attract investment in a flexible, low-carbon resource mix
aligned with policy goals. Wholesale electricity markets are generally
organized into several segments where prices are determined:
- Electricity energy markets - Long-term power purchase agreements, day-ahead markets, and real-time/balancing markets facilitate the buying and selling of electricity for final consumption.
- Reliability/Capacity markets - Capacity obligations are purchased through centralized auctions and bilateral contracts to ensure adequate generation and demand-side resources are available to meet system reliability requirements.
- Ancillary services markets - Grid resources bid or agree on bilateral contracts to provide essential reliability services like frequency regulation, operating reserves, voltage support, and black start.
- Transmission markets - Prices for transmission networks, like access rights, are determined to efficiently manage grid congestion and losses.
2.1. Day-Ahead and Real-Time/Balancing Markets
Day-ahead and real-time wholesale electricity
markets facilitate reliable grid management and transparent pricing. In the
day-ahead market, generators offer their availability, and buyers bid on their
demands for the next day, resulting in financially binding schedules and
prices. Then, in real-time, actual generator dispatch and pricing are
determined every 5-15 minutes based on market design and precise system
conditions. The day-ahead projections provide price certainty for participants
to plan, while the real-time market ensures supply and demand are balanced.
These organized markets dynamically coordinate competitive resources on the
complex challenges of electric grid operations.
Some electricity systems that utilize day-ahead and
real-time market structures are: PJM - Covers parts of the Mid-Atlantic and
Midwest US states [12,13]; ISO New England
(ISO-NE) - Covers the six states in New England [14];
California ISO (CAISO) - Covers most of California [15];
New York ISO (NYISO) - Covers New York state [16]; Electricity Reliability Council of Texas
(ERCOT) - Manages most of Texas [17]; EU
European Union’s Day-ahead and intraday electricity markets,4 where Power Exchanges
organize trading and operate these markets [18];
Europe - Countries like Germany, the UK, and the Nordic [19]; Australia [20,21];5 Norway [22];6
Singapore [23];7
Canada, Alberta and Ontario [24–26];8 New Zealand [27,28]. In the US [29],
restructured competitive wholesale markets have dominated in the Northeast,
Mid-Atlantic, Texas, and parts of the Midwest.9
Meanwhile, traditional cost-based utility dispatch, explained below, continues
to be used across much of the Southeast, Southwest, and Northwest, as well as
some isolated systems where vertically integrated utilities have persisted
after deregulation. Thus, most utilities and retail choices have generally
embraced day-ahead and real-time market structures in large market-oriented
economies with larger interconnected systems and diverse resources.
While ISO/RTO runs day-ahead (or other time
intervals) and in real-time/balancing electricity markets, some general
features or main architectural characteristics, which vary according to market
design rules, are:
Day-Ahead Markets:
- Operate the day before electricity delivery (hence “day-ahead”).
- Participants submit bids to buy or offers to sell electricity for each hour of the next day.
- The system operator matches supply and demand for each hour to determine the market clearing price at the minimum cost, safeguarding system reliability and electricity transmission constraints.
- Provides price signals for generators and load-serving entities to plan their operations and bidding for the next day.
- Results in financial commitments to buy or sell electricity at the day-ahead price.
Real-Time/Spot Markets:
- Operate in real time as electricity is delivered, with intervals that can be 5 minutes.
- The ISO/RTO uses it to balance differences between day-ahead schedules and real-time demand/generation at the minimum cost, safeguarding system reliability and electricity transmission constraints.
- Prices fluctuate minute-to-minute based on actual system conditions.
- Generators are paid the real-time price for any extra electricity produced.
- Load-serving entities pay the real-time price for any extra electricity consumed.
- Provides price signals to incentivize generators to follow dispatch instructions.
Key Differences:
- Day-ahead prices are based on expected conditions and bids, whereas real-time prices reflect actual conditions.
- Day-ahead markets provide financial certainty, while real-time markets balance physical differences.
- Day-ahead markets have higher trade volumes, while real-time markets ensure reliability.
- Day-ahead prices are generally less volatile than real-time prices.
The actual physical operation of balancing
electricity supply and demand often deviates from the projections made in the
day-ahead electricity market. These disparities can arise due to unforeseen
shifts in supply or demand conditions that differ from the anticipated
scenarios envisioned during the day-ahead electricity market forecasting and
closure.
In summary, the day-ahead market facilitates
forward price discovery and financial commitments, while the real-time market
ensures the physical balance of supply and demand. Together, these markets
contribute to an efficient and reliable wholesale electricity market.
2.2. Capacity Market
A capacity market is a pivotal mechanism ensuring
an ample supply of future generation, encompassing potential demand-side
capacity aligned with projected needs. Its core mission is to stimulate
investments in new capacity and secure commitments through auctions, often
scheduled three or more years ahead. Participants receive capacity payments
for pledging their capacity, irrespective of actual energy dispatch.
In the United States, some ISOs/RTOs feature
capacity market mechanisms. However, it’s crucial to note that not all
ISOs/RTOs in the US adopt capacity markets; some rely solely on energy markets [30].10
PJM’s capacity market, known as the Reliability Pricing Model (RPM), stands out
prominently [31]. Operated by PJM
Interconnection, the largest wholesale electricity market operator in the US,
RPM plays a critical role in ensuring a reliable and secure electricity supply.
RPM operates through periodic auctions designed to
procure commitments from generators, load-serving entities, large consumers,
and other resources to provide a specific amount of generation capacity in the
future, typically three years ahead.
Participants in RPM auctions commit to delivering
capacity during specified future periods, assuring the grid operator of
sufficient resources, especially during peak periods. The RPM, as a capacity
market, serves to provide investment signals, with the auction process
intending to send price signals encouraging new investments where and when
needed for system reliability.
Generators that clear the auction and commit to
providing capacity receive compensation, regardless of whether they produce
electricity during the contracted period. In PJM, the RPM may also allow
demand-side resources, like demand response programs, to participate, offering
a comprehensive approach to meeting capacity needs.
Some ISO/RTOs, such as PJM, incorporate a penalty
structure enforcing capacity commitments. Resources committed to supply
capacity face financial penalties if unavailable during the delivery year.
This structure ensures resources meet their reliability obligations, with
potential penalties serving as a crucial incentive for standing behind auction
commitments [32].
The capacity mechanisms in the EU [33] have evolved as tools to ensure adequate
electricity generation capacity is available to meet demand, especially during
peak times. They have been a subject of regulatory development since the early
2000s, with key moments in 2003 and 2009 and a significant overhaul in the 2019
electricity market reform. Initially introduced to address the "missing
money" problem—where energy-only markets did not provide sufficient
incentives for investment in new capacity—the EU has progressively aimed to limit
their use on a perceived risk of potential market distortions. In response to
the energy crisis following Russia's invasion of Ukraine, the EU implemented
several emergency measures, and the European Commission proposed comprehensive
electricity market reforms in March 2023, which were agreed upon by EU member
states in December 2023, where among the Key elements is the support for
long-term capacity mechanisms aligned with decarbonization goals.
Chile, which pioneered the liberalization of
electricity markets in the 1980s [34],
established a payment mechanism for capacity, currently a power sufficiency
mechanism, to ensure sufficient generation capacity is available to satisfy the
maximum demand for the electrical system. This capacity payment is determined
based on each plant’s contribution to system reliability, availability during
peak demand periods, and the overall needs of the electrical system to maintain
an adequate reserve margin. However, the capacity payment is not made
irrespective of whether a generator unit is called in the day-ahead operations
planned dispatch. Instead, the system coordinator calculates the capacity
payment annually to adjust for changes in the electricity market, demand
forecasts, and the entry or exit of generation units [35].11
The debate over electricity market design
—specifically between energy-only models with scarcity pricing and
energy-plus-capacity markets—remains complex and contentious, with several
critical points of dispute [36–49]:
- Market Efficiency: Supporters of capacity markets argue that these mechanisms ensure sufficient generation capacity to meet peak demand, thereby maintaining grid reliability. Critics contend that capacity markets can distort price signals, potentially leading to costly overinvestment in unnecessary capacity.
- Cost to Consumers: Proponents believe capacity markets promote long-term price stability and secure supply, benefiting consumers in the long run. Detractors, however, argue that these markets increase consumer costs by compensating generators for potential capacity rather than actual production, which may not always be economically justified.
- Impact on Renewable Energy: Capacity markets can, some argue, facilitate renewable integration by ensuring a reliable backup capacity. Yet, others warn that capacity markets tend to favor traditional fossil fuel generators, potentially slowing the transition to cleaner energy sources.
- Complexity of Market Design: Advocates assert that capacity markets can be tailored to meet specific regional needs and policy goals, helping to stabilize prices that might otherwise become volatile under scarcity pricing alone. Conversely, critics argue that capacity markets add unnecessary complexity to electricity markets, creating opportunities for manipulation by market participants.
- Impact on Innovation: Capacity markets may provide revenue certainty, potentially encouraging investment in new technologies. However, some argue they may stifle innovation by favoring established technologies and existing market structures over more disruptive advancements.
While capacity markets may offer stability and
reliability, they also bring concerns about costs, complexities, and potential
drawbacks for market power, innovation, and renewable energy integration.
This controversy reflects broader debates about how
best to ensure electricity reliability, affordability, and sustainability in
evolving power markets. The appropriateness of capacity markets often depends
on specific regional circumstances and policy priorities, where we should
acknowledge that both energy-only and energy-plus-capacity markets are subject
to market power and imperfections, which need to be addressed in any market
design.
Notwithstanding, dynamic modeling that integrates
energy and capacity pricing can offer significant benefits, capturing the
effects of long-term investment decisions and technological advancements. While
simpler market structures have the advantage of lower transaction costs, they
often impose constraints, such as setting upfront capacity prices to zero,
which can reduce optimization variables and welfare compared to more flexible
systems that allow for dynamic energy and capacity pricing.
Innovation incentives and risk allocation are vital
considerations in any market design, whether it follows an energy-only or
energy-plus-capacity framework. These factors should be explicitly accounted
for, as they influence market adaptability and encourage new technologies.
Setting prices optimally in complex markets is
challenging, yet arbitrarily constraining prices—such as eliminating capacity
pricing—can lead to even more significant losses in welfare. Thus, with a
broader range of pricing options, the theoretical advantages of
energy-plus-capacity markets may yield tangible benefits if these market
designs can navigate real-world challenges effectively. In this way, markets
with greater flexibility and nuanced pricing mechanisms can better support
long-term goals of stability, innovation, and welfare.
While both market designs face challenges, a
well-designed market might aim to maximize social welfare, particularly when
considering long-term, dynamic effects. However, the effectiveness of either
approach ultimately depends on the specific implementation and how it addresses
real-world market complexities.
2.3. Long-Term Purchase Agreements
In general, Long-Term Purchase Agreements (LTPA)
are bilateral contracts between buyers and sellers, facilitating the purchase
of electricity over extended periods, typically one year or longer. These
agreements are voluntary and privately negotiated, existing externally to
ISO/RTO markets, where ISO/RTO does not have direct involvement.
Nevertheless, ISO/RTO considers the impact of LTPA
on scheduling, resource dispatch, and market prices. Load-serving entities and
large consumers utilize these agreements to secure generating capacity and
energy, aligning with their anticipated demand projections.
In PJM, generators engaged in the ISO/RTO capacity
market may offer surplus capacity not committed in LTPA to ISO/RTO Reliability
Pricing Model (RPM) auctions.
During day-ahead market scheduling, resources bound
by LTPA submit contracted MW amounts on their offers/bids, which ISO/RTO
utilizes for dispatch purposes. In real-time operations, resources under
long-term contracts can be self-scheduled or economically dispatched. LMPs
remain unaffected by the nature of bilateral transactions under long-term
agreements.
Thus, while the practice is that ISO/RTO
acknowledges the existence of LTPA, they refrain from direct negotiation or
regulation of these external transactions. However, ISO/RTO incorporates the
quantities from these agreements in its scheduling and dispatch processes to
uphold system reliability.
2.4. Ancillary Services Market
Ancillary Services (AS) help manage the various
technical challenges that arise in generating, transmitting, and distributing
electricity; the Ancillary Services Market, sometimes called the Reliability
Market,12
is a crucial component of electricity markets, providing essential support
services to ensure the power system’s reliability, stability, and flexibility.
The provision of AS is critical to real-time grid
operations. Operators continuously monitor the grid and, based on system
conditions, call upon resources that provide AS to address specific needs.
These services specifically target frequency control, voltage support, and grid
stability issues, operating within short timeframes, even microseconds,
extending beyond electricity generation and delivery. By swiftly addressing
sudden shifts in demand, like the loss of sizeable industrial consumption,
unforeseen outages, or disruptions, AS plays a pivotal role in averting voltage
instability, frequency deviations, and other potential challenges that might
escalate to a system-wide blackout, thereby enhancing grid reliability.
AS are typically acquired through auctions or
competitive bidding processes facilitated by ISO/RTO. The system operator
conducts competitive auctions to secure AS that align with operational
requirements. Participants, encompassing generators, demand response
providers, and resources such as energy storage facilities capable of instantly
or rapidly delivering energy, submit economic offers detailing the quantity and
price of their services. The operator compiles aggregate supply curves from
these offers and identifies clearing quantities and prices at the intersections
with demand requirements. Subsequently, service providers receive dispatch
instructions, prompting them to stand by or activate services based on
real-time system conditions.
Regulation resources respond to automated signals
to stabilize fluctuations, ensuring a continuous balance in the system. In
parallel, reserve resources stand ready for contingencies. Regulation markets
undergo frequent clearings with pricing dynamically adjusted in real-time,
whereas reserve markets generally feature longer clearing intervals with fixed
pricing. Payments are determined by both market clearing prices and the energy
supplied upon activation. Aligning AS commitments with energy market dispatch
enables the system operator to uphold reliability efficiently and
cost-effectively.
The specific payment structure is contingent on the
type of AS and the governing market rules. In some markets, participants
offering AS receive compensation for their contributions, possibly in capacity
payments, energy payments, or a combination of both.
AS are intricately linked with energy markets.
Resources such as flexible generators, energy storage facilities, or demand
response units can provide energy and AS. This integration fosters a more
streamlined and coordinated operation of the entire power system.
2.5. Cost Base Centralized Systems
In theory, a system with a centralized dispatch
based on reported marginal costs holds the potential to replace conventional
day-ahead and real-time electricity markets.
In this model, generators would submit their
short-run marginal costs directly to the system operator instead of
participating in market auctions. These declared costs reflect the expenses of
producing each facility’s next megawatt (MW) of power. An auditing process for
submitted generator marginal costs would be essential to ensure transparency
and prevent manipulation. Incentives and penalties based on accuracy would
guarantee the integrity of cost declarations.
The overarching goal of the ISO would be to
minimize total system production costs. This entails dispatching the
lowest-cost resources to meet demand requirements and ensure reliability. The
system operator would employ security-constrained unit commitment and economic
dispatch algorithms to schedule resources, aligning with forecasted load across
various time horizons and resource availability, from years and months to
day-ahead and real-time.
While generators undergo central dispatch in merit
order, prioritized by their declared marginal costs, ranging from the lowest to
the highest, market clearing prices would be removed, and generators would
receive compensation based on a price defined by the reported marginal costs of
the most expensive dispatched unit for the energy exchanged during the actual
dispatch. Depending on the design of government rules, load-serving entities,
and aggregators would then remit average rates to final consumers, encompassing
total production costs. Alternatively, prices for large energy consumers or
load-serving entities might be predetermined through bilateral contracts with
power generators or aggregators. In such cases, the real-time system marginal
cost, determined by declared costs, becomes the basis for the price on power
exchanges between producers facing deficits in their long-term agreements and
supply commitments with significant energy consumers or load-serving entities.
As crucial for grid stability, it could also be
procured based on systems costs, long-term auctions, central dispatch, and
energy. Competing investment in new resources could be achieved through
long-term planning processes, capacity payments, private investment
initiatives, auctions, and procurement mechanisms overseen by the SO or a
regulatory body.
Some countries and regions that use or have used
electricity dispatch systems based on declared marginal costs rather than
market pricing are France [50–52]; vertically
and former vertically integrated utilities in the US - like the Southeastern US
– Regions [53] served by utilities like
Southern Company [54], Duke Energy [55], and Tennessee Valley Authority [56], Western US [57]
including Colorado, Wyoming, and Montana, Hawaii [58,59]13 as an isolated
island system, Alaska [60,61], parts of the
Midwest [62] Missouri and Oklahoma; Chile [63];14
Argentina [64]; Peru [65]; 15
China, which has been transitioning from a planned dispatch approach to a more
market-oriented system but still relies heavily on a regulated cost-based
dispatch model in many regions [66,67].
In the past, some hydro-heavy systems have
effectively used centralized optimization relying on generator cost
submissions, as was the case of Norway, which later transitioned to a wholesale
market system. However, in the last three decades, a centrally optimized
security-constrained economic dispatch, relying on audited marginal cost
declarations, has led in many places to the new day-ahead and real-time market
price signals. Still, smaller systems use effective centralized dispatch based
on marginal costs. Nonetheless, large and diverse markets generally rely on
competitive day-ahead and real-time pricing, like the US, market-based pricing,
and Norway, which also depends on competitive pricing via Nord Pool’s
Day-ahead/Intraday markets.
2.6. Transmission Markets
The transmission market plays a critical role in
ensuring the efficient delivery of electricity, especially as renewable energy
sources become more integrated into the grid. Transmission facilitates the flow
of electricity from remote generation sites to consumption centers, maintaining
system reliability and market efficiency. By connecting renewable-rich regions
with consumption hubs, the transmission market enables the full utilization of
distant generation sources, such as hydro, wind, and solar. It reduces regional
price disparities by alleviating congestion and allowing electricity to flow to
areas of higher demand.
The classification and regulation of transmission
lines vary across jurisdictions and are influenced by several key factors.
Voltage levels and their impact on the system play a critical role, with
higher-voltage lines typically subject to stricter open-access regulations due
to their significant contributions to grid reliability and regional
connectivity. Investment structures also shape regulatory approaches, such as
the funding source—whether public or private—and the mechanisms for cost
recovery and risk allocation influence market dynamics and policy decisions.
Additionally, market design elements such as nodal versus zonal pricing,
congestion management strategies, and system operation requirements are pivotal
in determining how transmission networks are organized and managed, reflecting
each jurisdiction's unique needs and priorities.
Also, transmission lines are typically
characterized by their capacity, exclusivity, or shared usage and their role in
linking various regions or connecting major consumption hubs with significant
production centers.
- (a)
-
Open Access Interconnection Lines are essential infrastructure for interregional power exchanges and market integration. They provide non-discriminatory access to all qualified market participants, usually under regulated tariffs. Examples include:
- US interstate transmission lines under FERC Order 888 [68].
- European cross-border interconnectors are regulated by EU Regulation 714/2009 [69].
- Chile’s north-south interconnection system, Sistema Eléctrico Nacional (SEN) [70].
- Australian interstate connectors in the National Electricity Market (NEM) [71].
- (b)
- Dedicated Transmission Lines (Generator Lead Lines) connect specific generation facilities to the main grid or load centers. Usually funded and owned by the generator, these lines often have limited third-party access. Examples include lines that connect remote renewable projects, large thermal power plants, and mining operations.
- (c)
- Shared Access (Limited Participation) lines serve multiple users under restricted access schemes. Costs for these lines are typically shared among pre-defined users, and private agreements with possible regulatory oversight often govern them. Examples include shared infrastructure for mining companies or industrial parks.
- (d)
- Hybrid Access Lines: These lines blend dedicated use with open access requirements, where the primary capacity is reserved for an anchor user, but excess capacity is available for others through open access provisions. This often requires regulatory approval and may include compensation mechanisms for the original investor.
- Transmission Market Structures: Financial Instruments vs. Centralized Expansion
Energy markets utilizing Transmission Rights and
Financial Instruments, such as those in the US (PJM, ERCOT, CAISO, MISO), use
financial products like Congestion Revenue Rights (CRRs) or Financial
Transmission Rights (FTRs) to allow market participants to hedge against
congestion costs. The Nord Pool region in Europe uses similar mechanisms to
hedge against transmission congestion. This decentralized approach incentivizes
efficient grid use and encourages investment in reducing congestion.
Australia’s NEM operates with LMPs and is moving toward adopting financial
transmission rights.
In contrast, markets with Centralized Transmission
Expansion (Postage Stamp System), such as Chile, Brazil, and Mexico, manage
transmission centrally. A “postage stamp” system is used, where all users share
costs equally regardless of location or contribution to congestion. In these
systems, a central authority plans and oversees transmission expansion,
ensuring grid reliability and capacity for renewable integration.
Examples:
- Chile: The Coordinador Eléctrico Nacional (CEN) centrally plans transmission expansions, applying uniform tariffs across all users [72]Error! Reference source not found..
- Brazil: Transmission is centrally regulated by Agência Nacional de Energia Elétrica (ANEEL), with expansion carried out through public auctions [73].
- Mexico: Centro Nacional de Control de Energía (CENACE) manages grid operations and expansion, using a postage stamp system to allocate transmission costs [74].
Key Differences:
- Decentralized Markets: The US and parts of Europe use financial instruments (FTRs/CRRs) to manage congestion, offering flexibility for market participants to hedge against transmission risks.
- Centralized Markets: Chile, Brazil, and Mexico rely on centralized planning with uniform cost distribution and without financial tools for hedging congestion risks.
- System Reliability and Congestion Management
Tools such as congestion charges and LMPs manage
grid congestion, ensuring efficient use of transmission capacity. Financial
instruments like FTRs allow market participants to hedge against congestion
risks. Interregional coordination is critical in planning investments
supporting electricity flows across broader regions, facilitating RE
integration, and maintaining grid stability.
- Transmission Market Evolution
Technological advancements in transmission and
other technologies, such as DERs and ES, reshape the transmission market.
Future developments must incorporate smart grid technologies, adapt to the
changing energy mix, and improve planning for uncertainty and risk management.
Market operators are also considering cross-border integration to optimize
resources across wider areas.
Market structures vary globally, from decentralized
financial instruments like FTRs in the US to centralized planning and
cost-sharing models like Chile and Brazil.
3. Decarbonization in Electricity Market and Trends
The Energy Transition (ET) is producing comparable
trends across energy markets, which include increased plate capacity and
operational reserve requirements, greater demand for flexibility and ramping
capacity, changes in system demand, overgeneration curtailment risks, with
instances of zero or negative prices, forecast-increasing challenges, and risks
of increased price volatility. These challenges are becoming more prominent as
the integration of VRE accelerates.
- Larger Capacity and Operating Reserves per GWh
As VRE penetration increases, substantial capacity
and supporting infrastructure —and consequently significant investment— are
required to meet demand, underscoring the economic and infrastructural
challenges of integrating high levels of VRE. This situation necessitates
innovative policy design to avoid inefficiencies, excessive redundancies, and
unwarranted system costs.
OECD and NEA [75]
demonstrate that increasing shares of VRE, such as solar and wind, require
substantially higher capacity to produce the same electricity as conventional
thermal power plants due to lower load factors and capacity credits. As VRE
penetration increases to 10%, 30%, 50%, and 75%, the required installed
capacity and associated investments grow substantially. Total system costs,
encompassing grid infrastructure, balancing, and connection expenses, also
escalate with higher VRE shares, ranging from less than USD 10 per MWh at 10%
VRE to over USD 50 per MWh at 75% VRE. These costs can be significantly
influenced by the availability of system flexibility, such as interconnections
and flexible hydropower resources, which help mitigate the challenges
associated with VRE integration.
- Chile’s Case Study
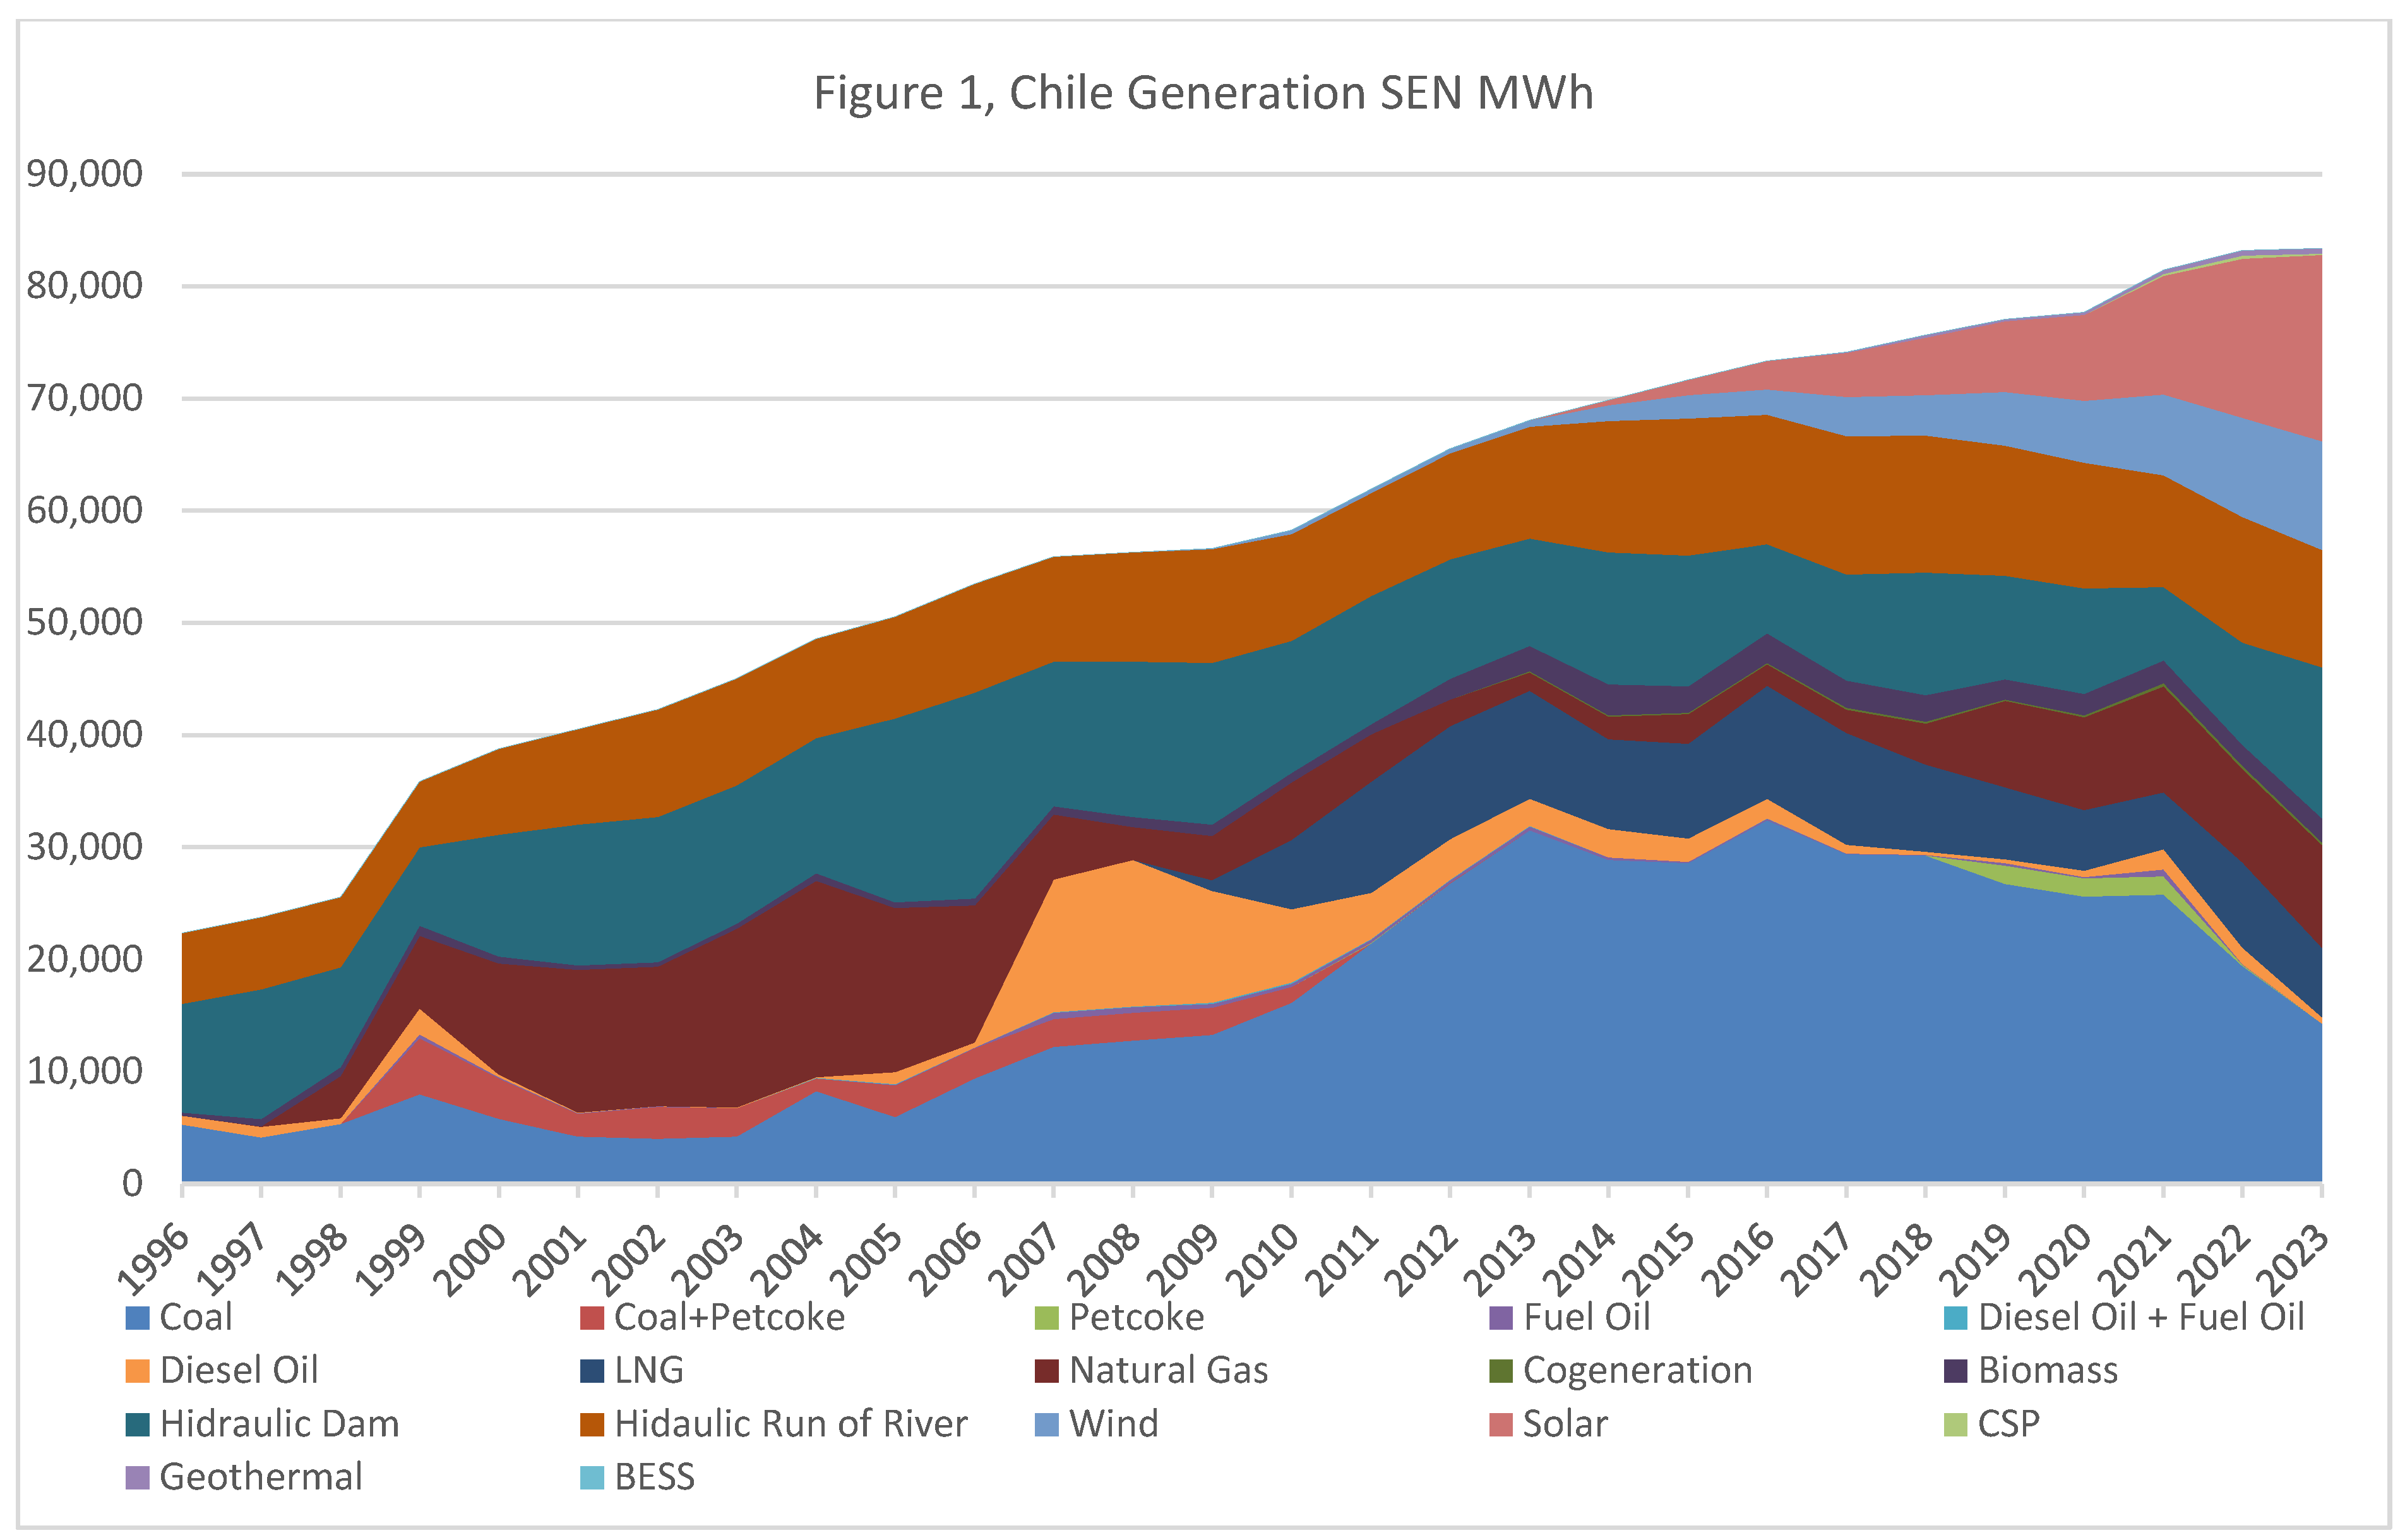
Chile has made significant strides in expanding its
VRE generation capacity over the past two decades. Installed plate capacity has
grown from around 10 GW in 2000 to 33 GW in 2023, a threefold increase
reflecting the country’s efforts to meet rising electricity demand and enhance
energy security while addressing climate change objectives with increasing
shares of VRE.
As of the first quarter of 2024, 66.1% of Chile’s
electricity comes from renewable sources, with renewable energy, different from
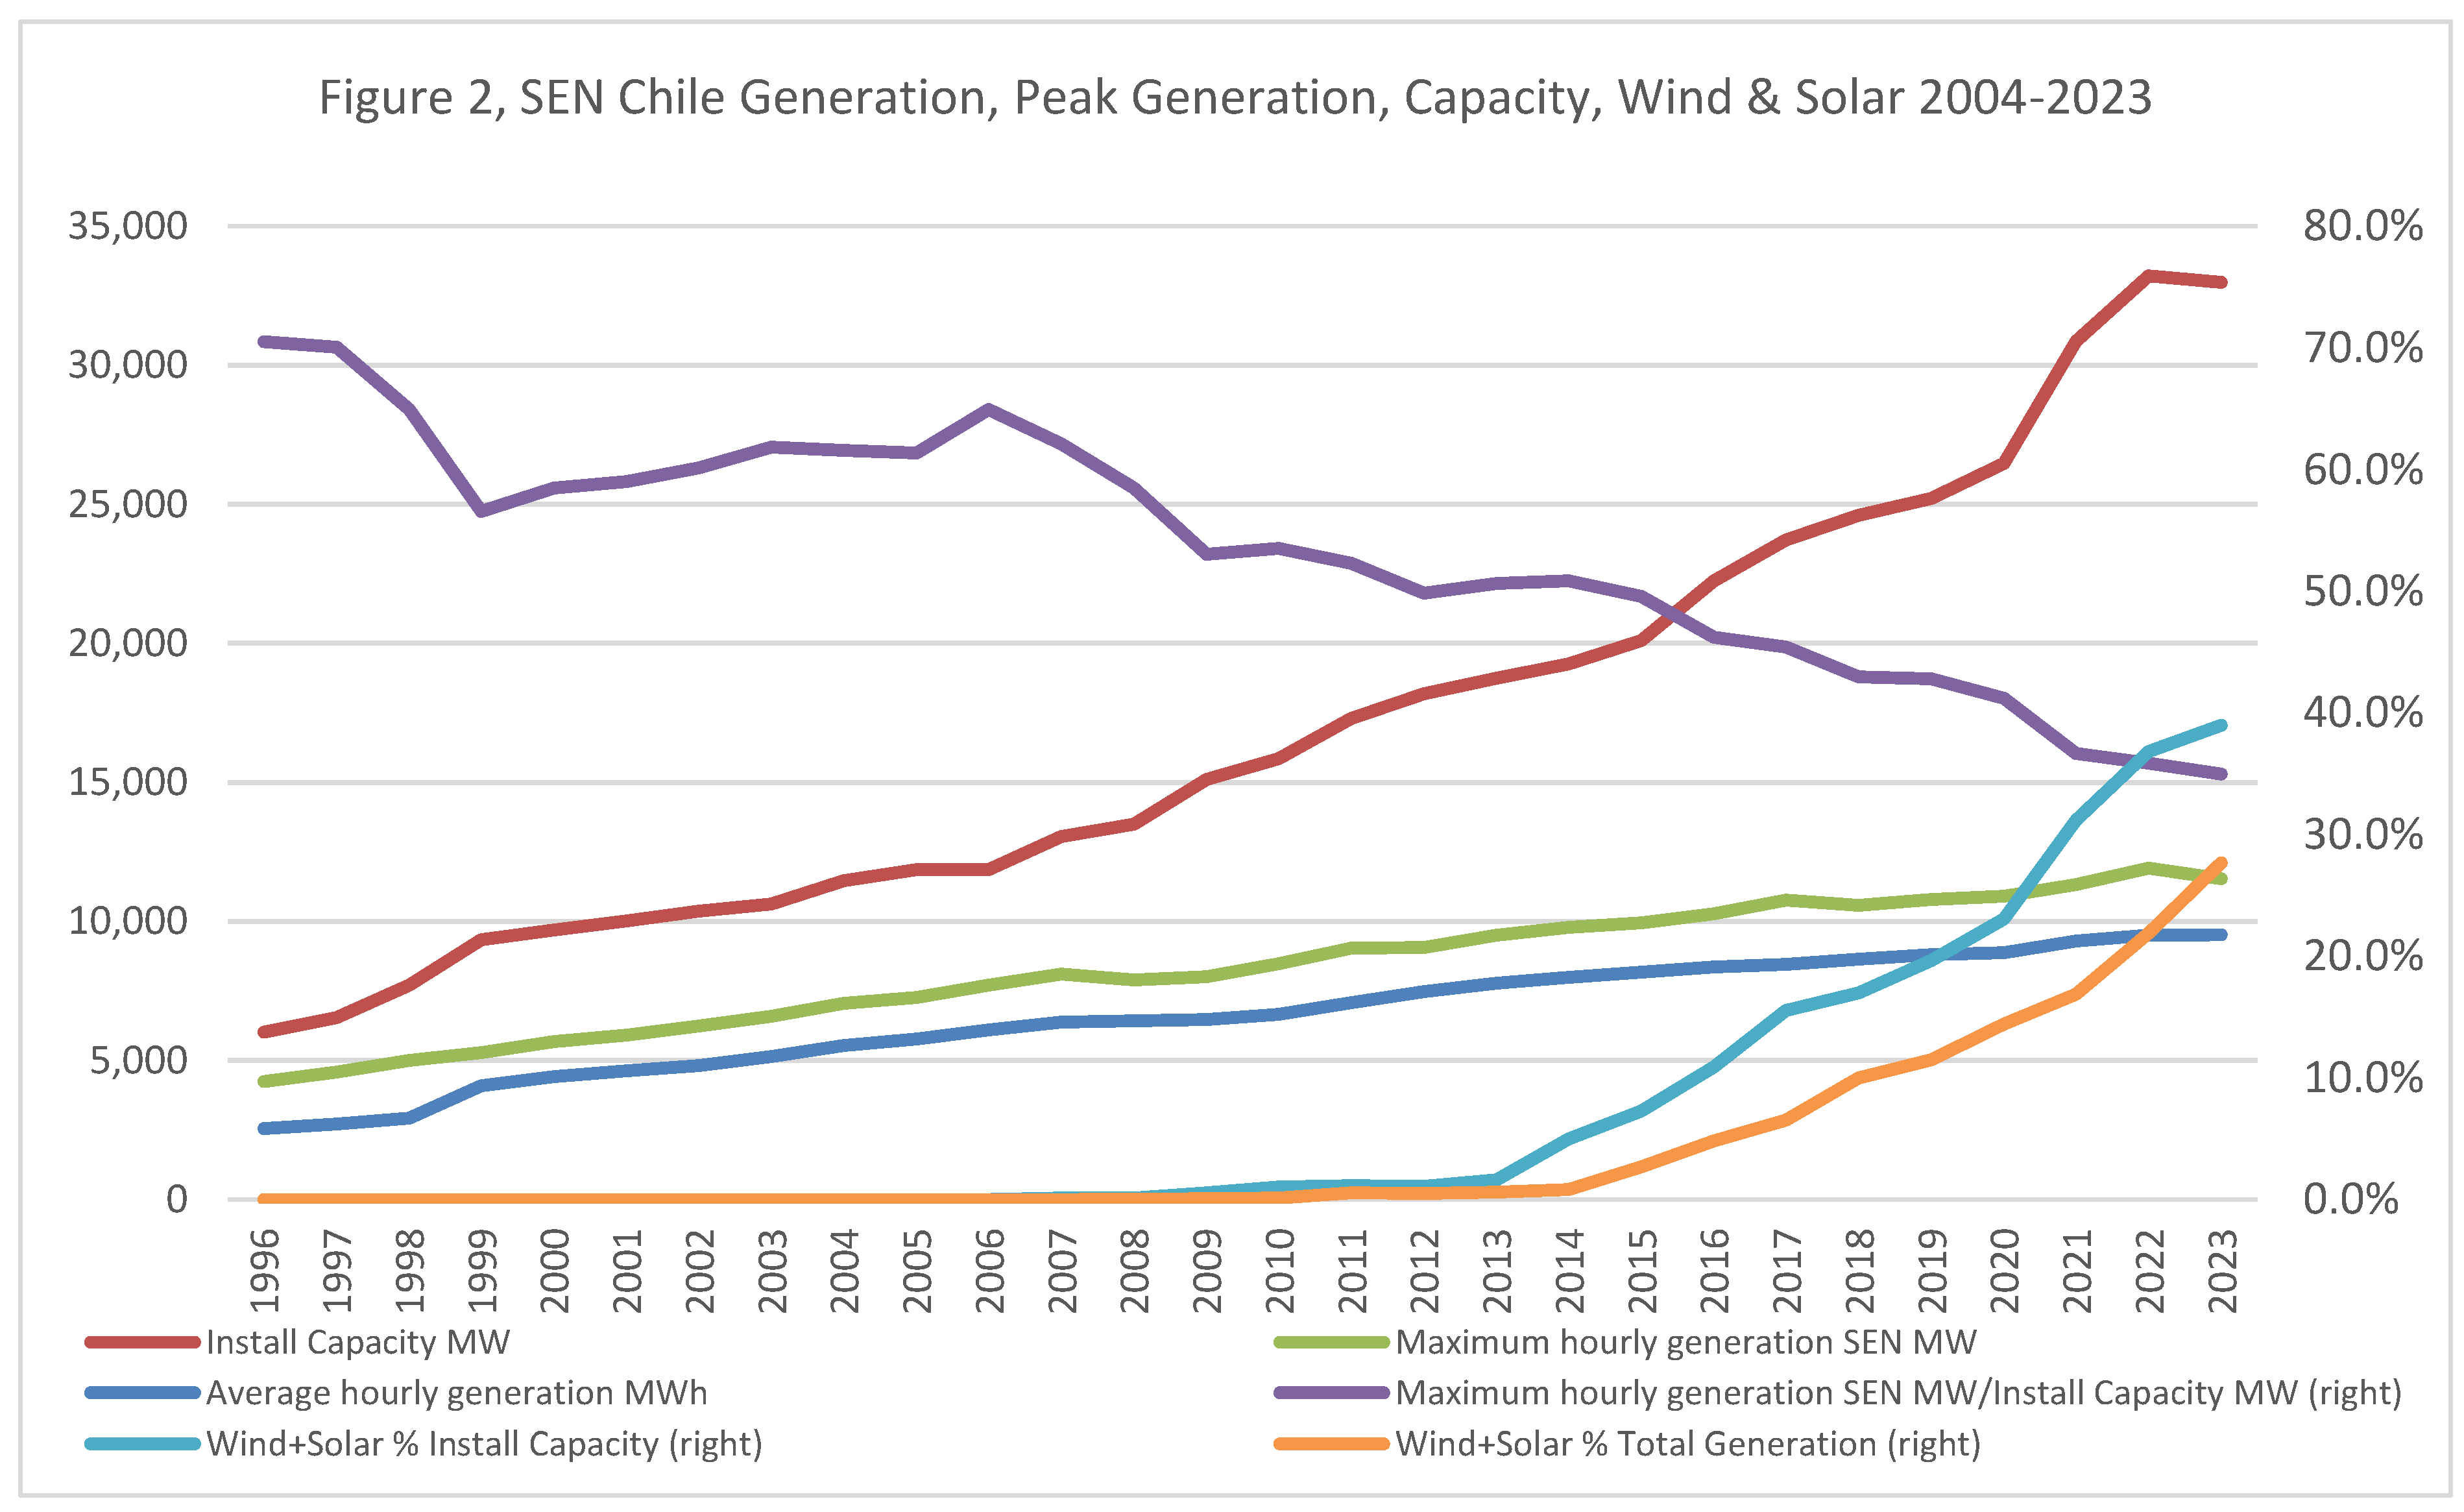
large hydropower plants, contributing 40.7%, up from 2% in 2010. In 2023, wind
and solar alone accounted for 40% of installed capacity and 28% of total
electricity generation, see Figures 1 and 2.
This substantial share highlights the effectiveness of policies and market
dynamics in promoting VRE, helping reduce greenhouse gas emissions, and
leveraging Chile’s abundant natural resources.
However, integrating these VRE sources into the
grid comes with challenges, particularly in ensuring the reliability and
stability of the power supply. Chile’s power system has experienced a
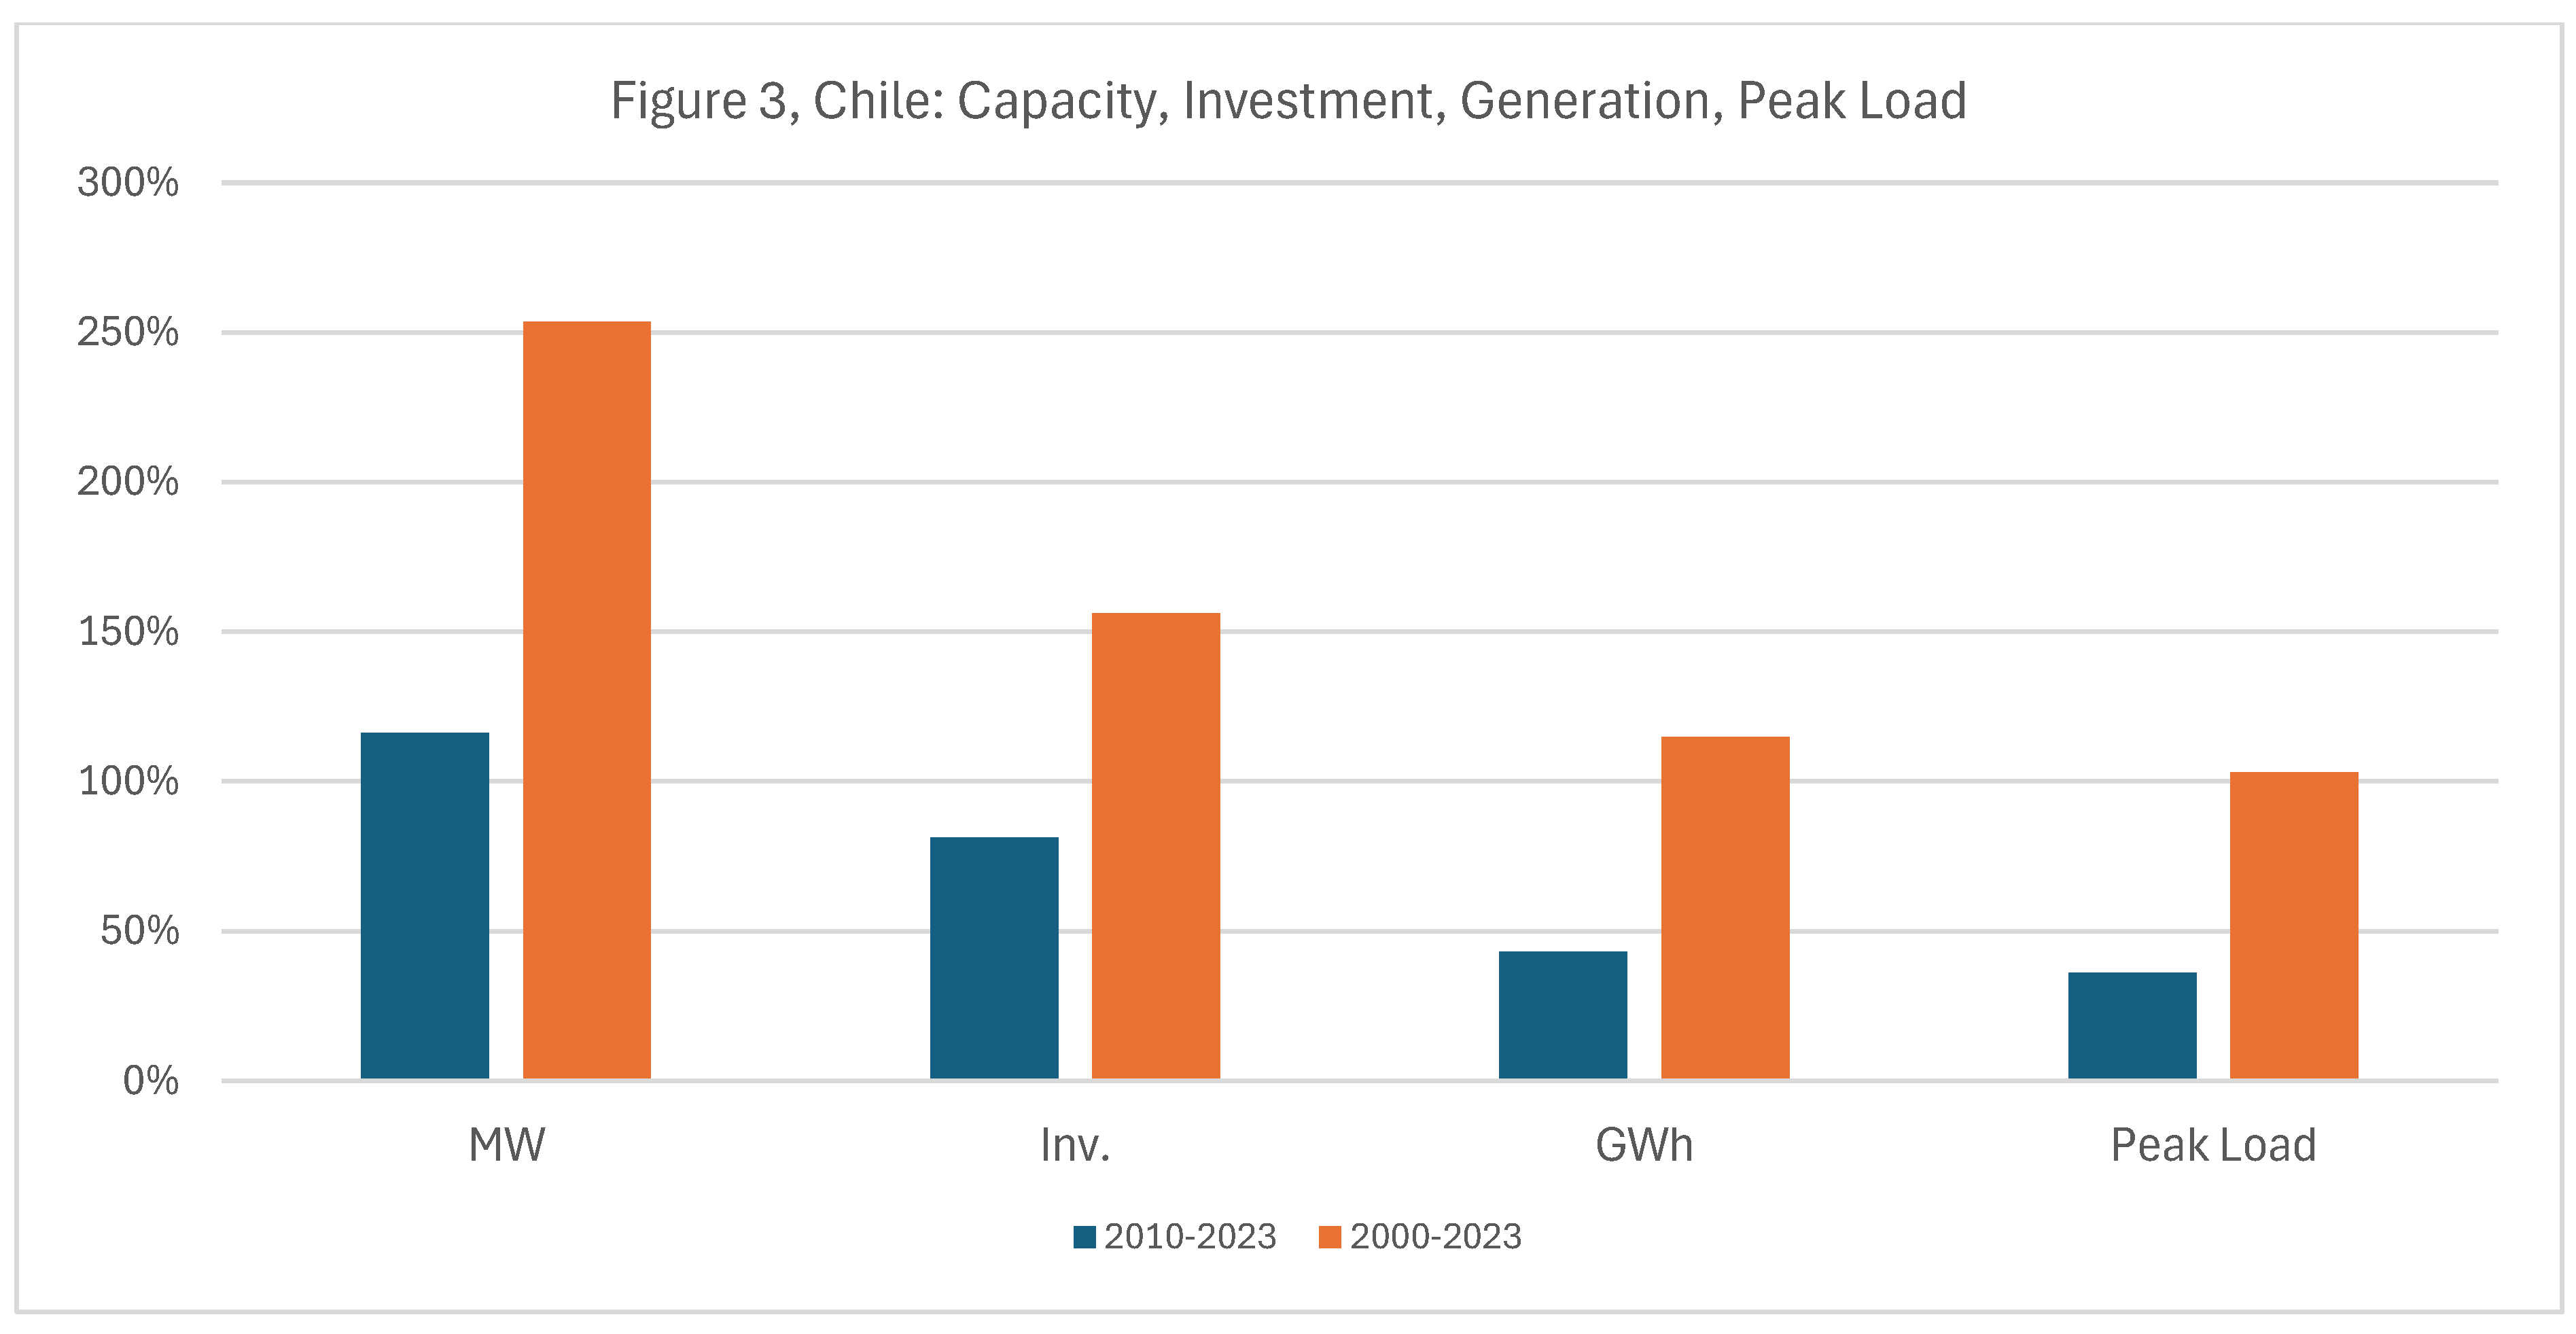
significant increase in spare capacity (Figure 3),
measured as the ratio of peak generation to installed capacity. This ratio has
climbed from approximately 40% in the early 2000s to 65% in 2023. Thus, while
peak generation has increased by 103% and annual generation by 115%, installed
capacity has grown by 254% since 2000 (or 36%, 43%, and 116%, respectively,
since 2010), indicating a growing buffer between plate capacity and peak demand
[76].
This capacity increase is primarily attributable to
the intermittent nature of wind and solar power, which is unavailable 24/7 and
must be complemented with other generation sources, storage, backup, or reserve
capacity to maintain grid stability. But the requirement for this complementary
capacity comes at a cost. While the naked average investment cost per MW of
installed capacity has decreased by 28% since 2000, when calculated at new
replacement value (NRV), the average investment cost to be amortized per MWh of
generation has increased by 26% over the same period. Interestingly, despite
this increase in investment cost per MWh, the weighted average of the Levelized
Cost of Electricity (LCOE) has decreased by 14% since 2000. The EIA has noticed
[77] that the LCOE is a limited measure
because it only reflects the cost to build and operate a plant, not the value
of the plant to the grid.
This scenario presents a growing challenge in many
markets. As the share of VRE increases, with its characteristic zero marginal
cost, it becomes increasingly difficult to secure a stable stream of revenues
to finance investment costs, and merchant power plants must increasingly shift
to revenues that need to be secured by AS markets, capacity markets, and LTPA.
This situation underscores the need for innovative market designs and policy
frameworks to ensure the long-term financial viability of the power system
while continuing to integrate higher proportions of VRE.
Source: Figure with open data from Comisión
Nacional de Energia (www.cne.cl) and Coordinador Eléctrico Nacional
(www.coordinador.cl), Chile.
Chile’s increasingly diverse electricity generation
mix, less reliant on imported FF, enhances its energy security from FF
geopolitical risks, like foreign FF market price manipulation, but requires
sophisticated grid management and operational strategies.
Source: Figure with open data from Comisión
Nacional de Energia (www.cne.cl) and Coordinador Eléctrico Nacional
(www.coordinador.cl), Chile.
Source: Figure with open data from Comisión
Nacional de Energia (www.cne.cl) and Coordinador Eléctrico Nacional
(www.coordinador.cl), Chile.
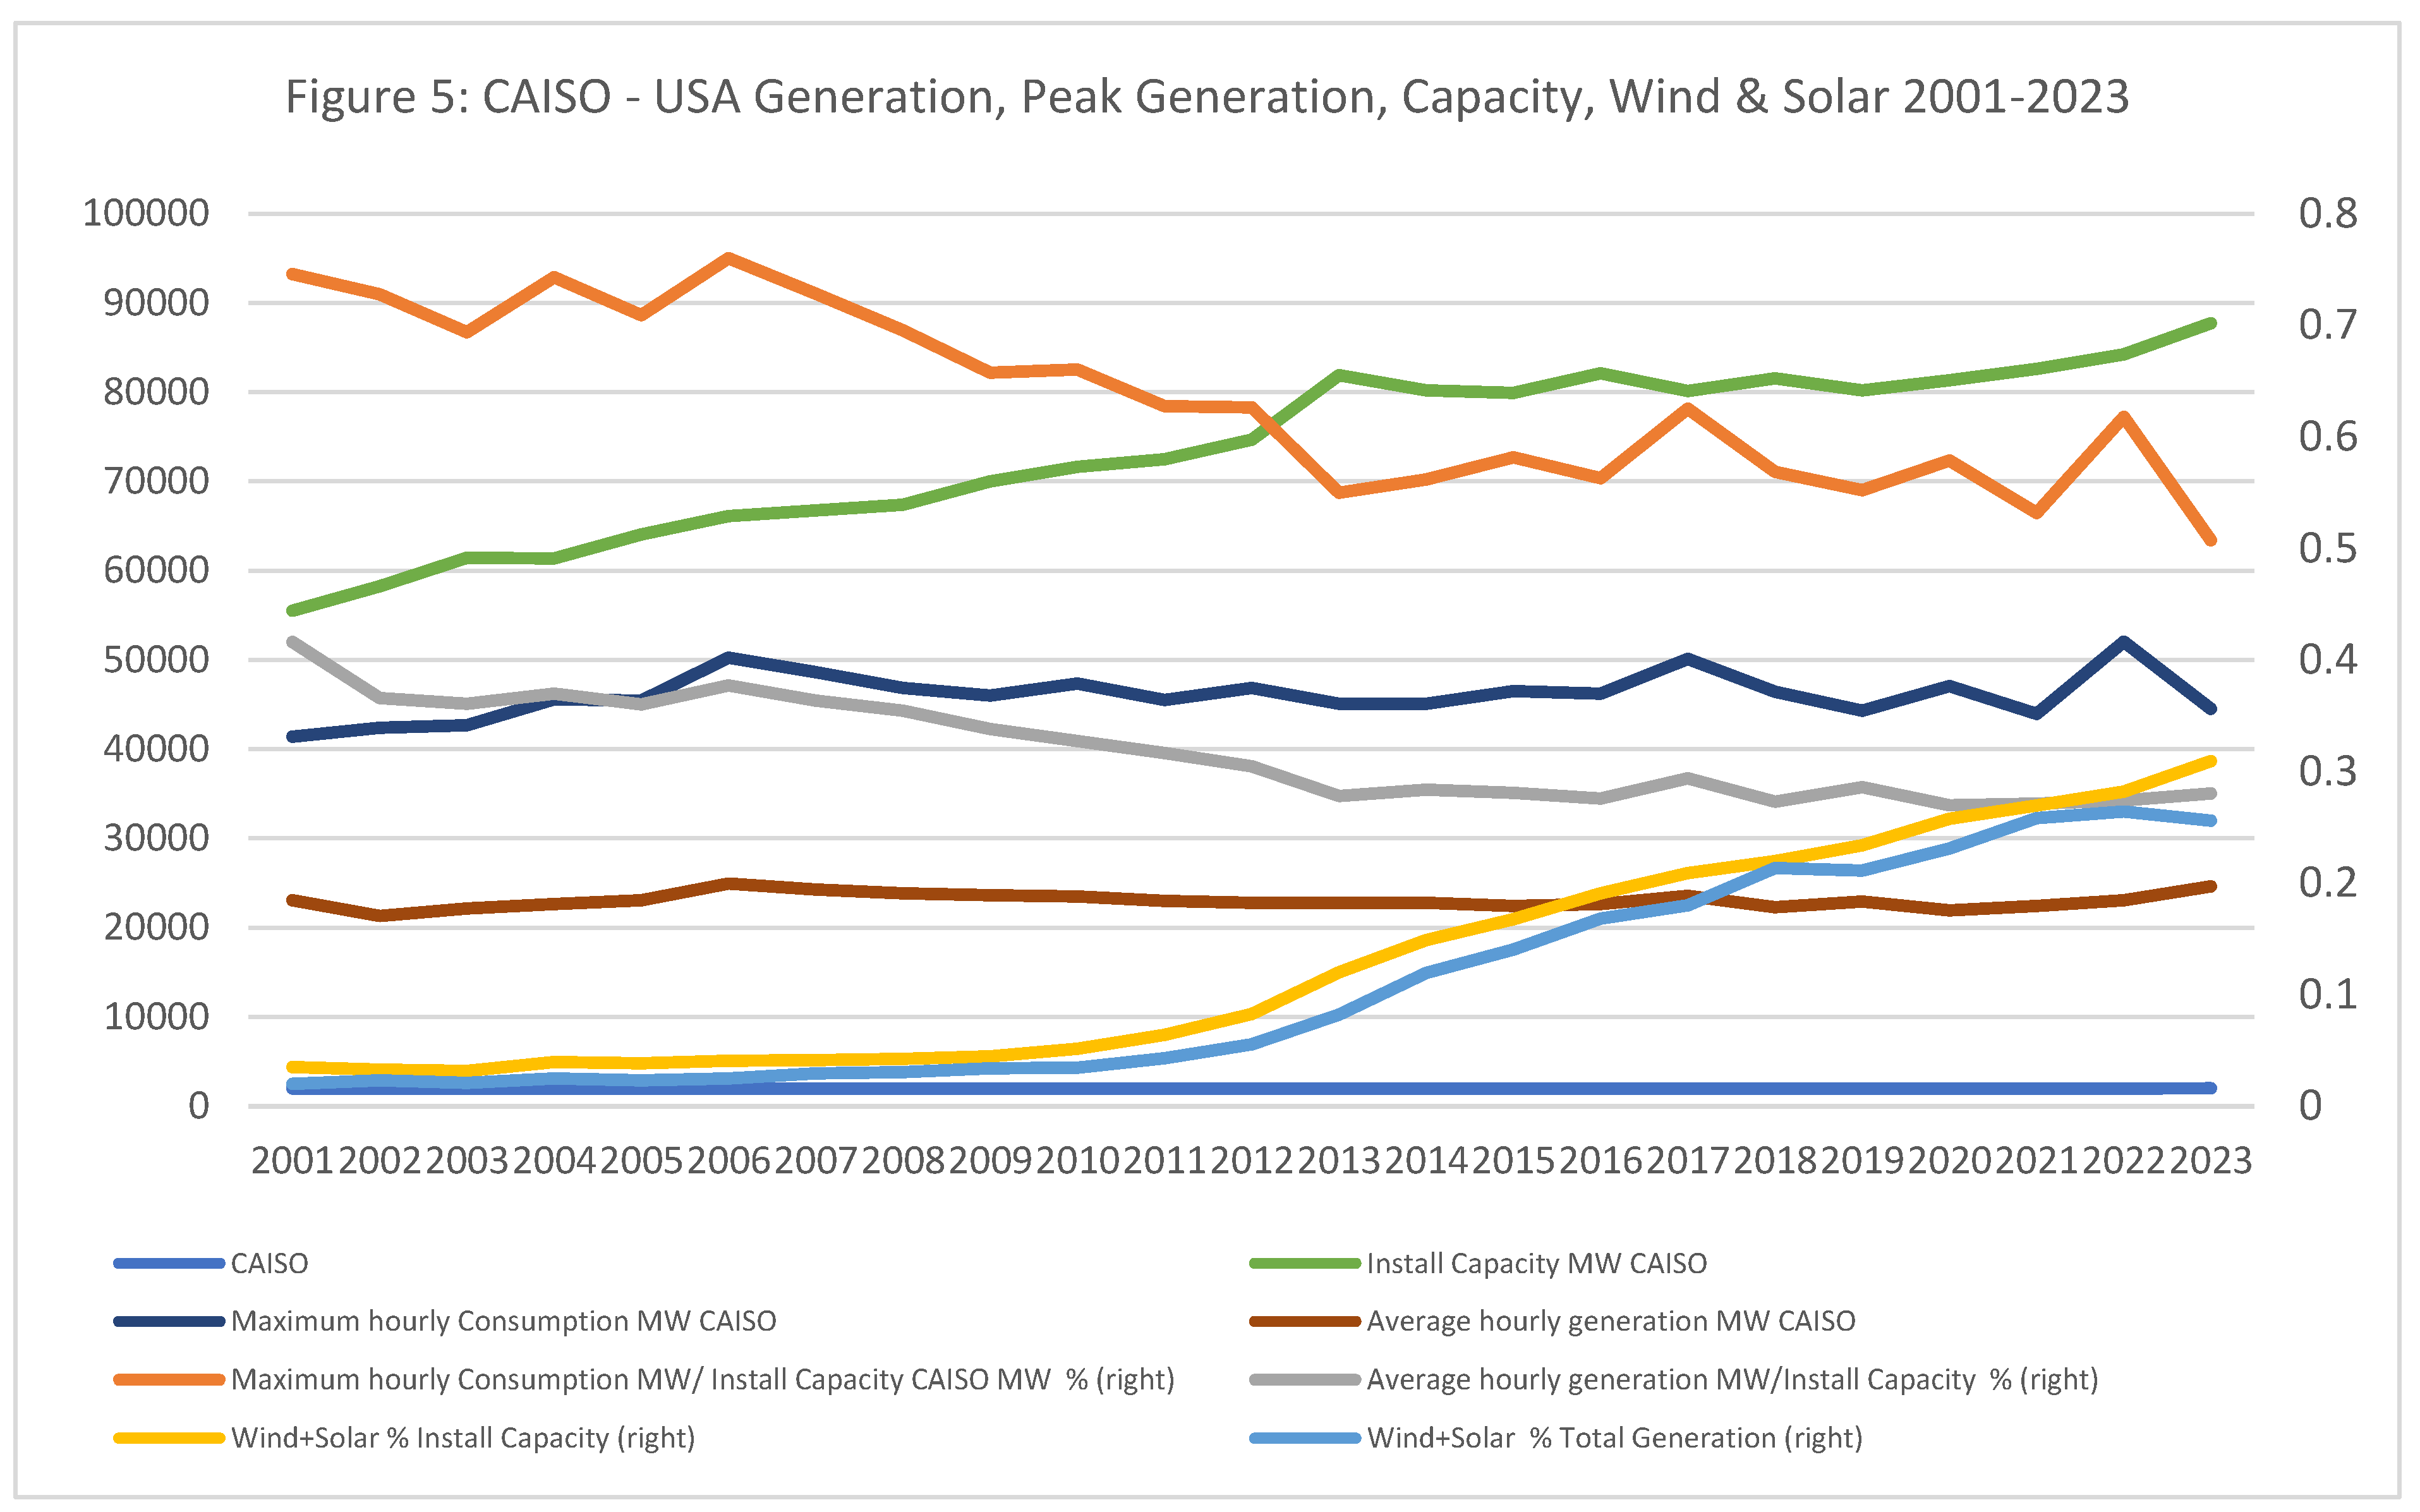
- CAISO Case Study
Over the past two decades, California has
significantly expanded its VRE capacity, reflecting global trends in
sustainable ET. Figure 4 shows that CAISO
installed capacity has grown from 55.5 GW in 2001 to nearly 88 GW in 2023, a
notable increase driven by the State’s ambition to meet electricity demand
while addressing climate objectives. The increasing share of solar and wind
explains this growth, which accounted for over 30% of installed capacity by
2023, compared to just 3.5% in 2001. Also, Figure
4 further illustrates the gradual reduction in the reliance on nuclear
and FF, with renewables, particularly solar PV, playing an increasing role in
CAISO’s energy mix.
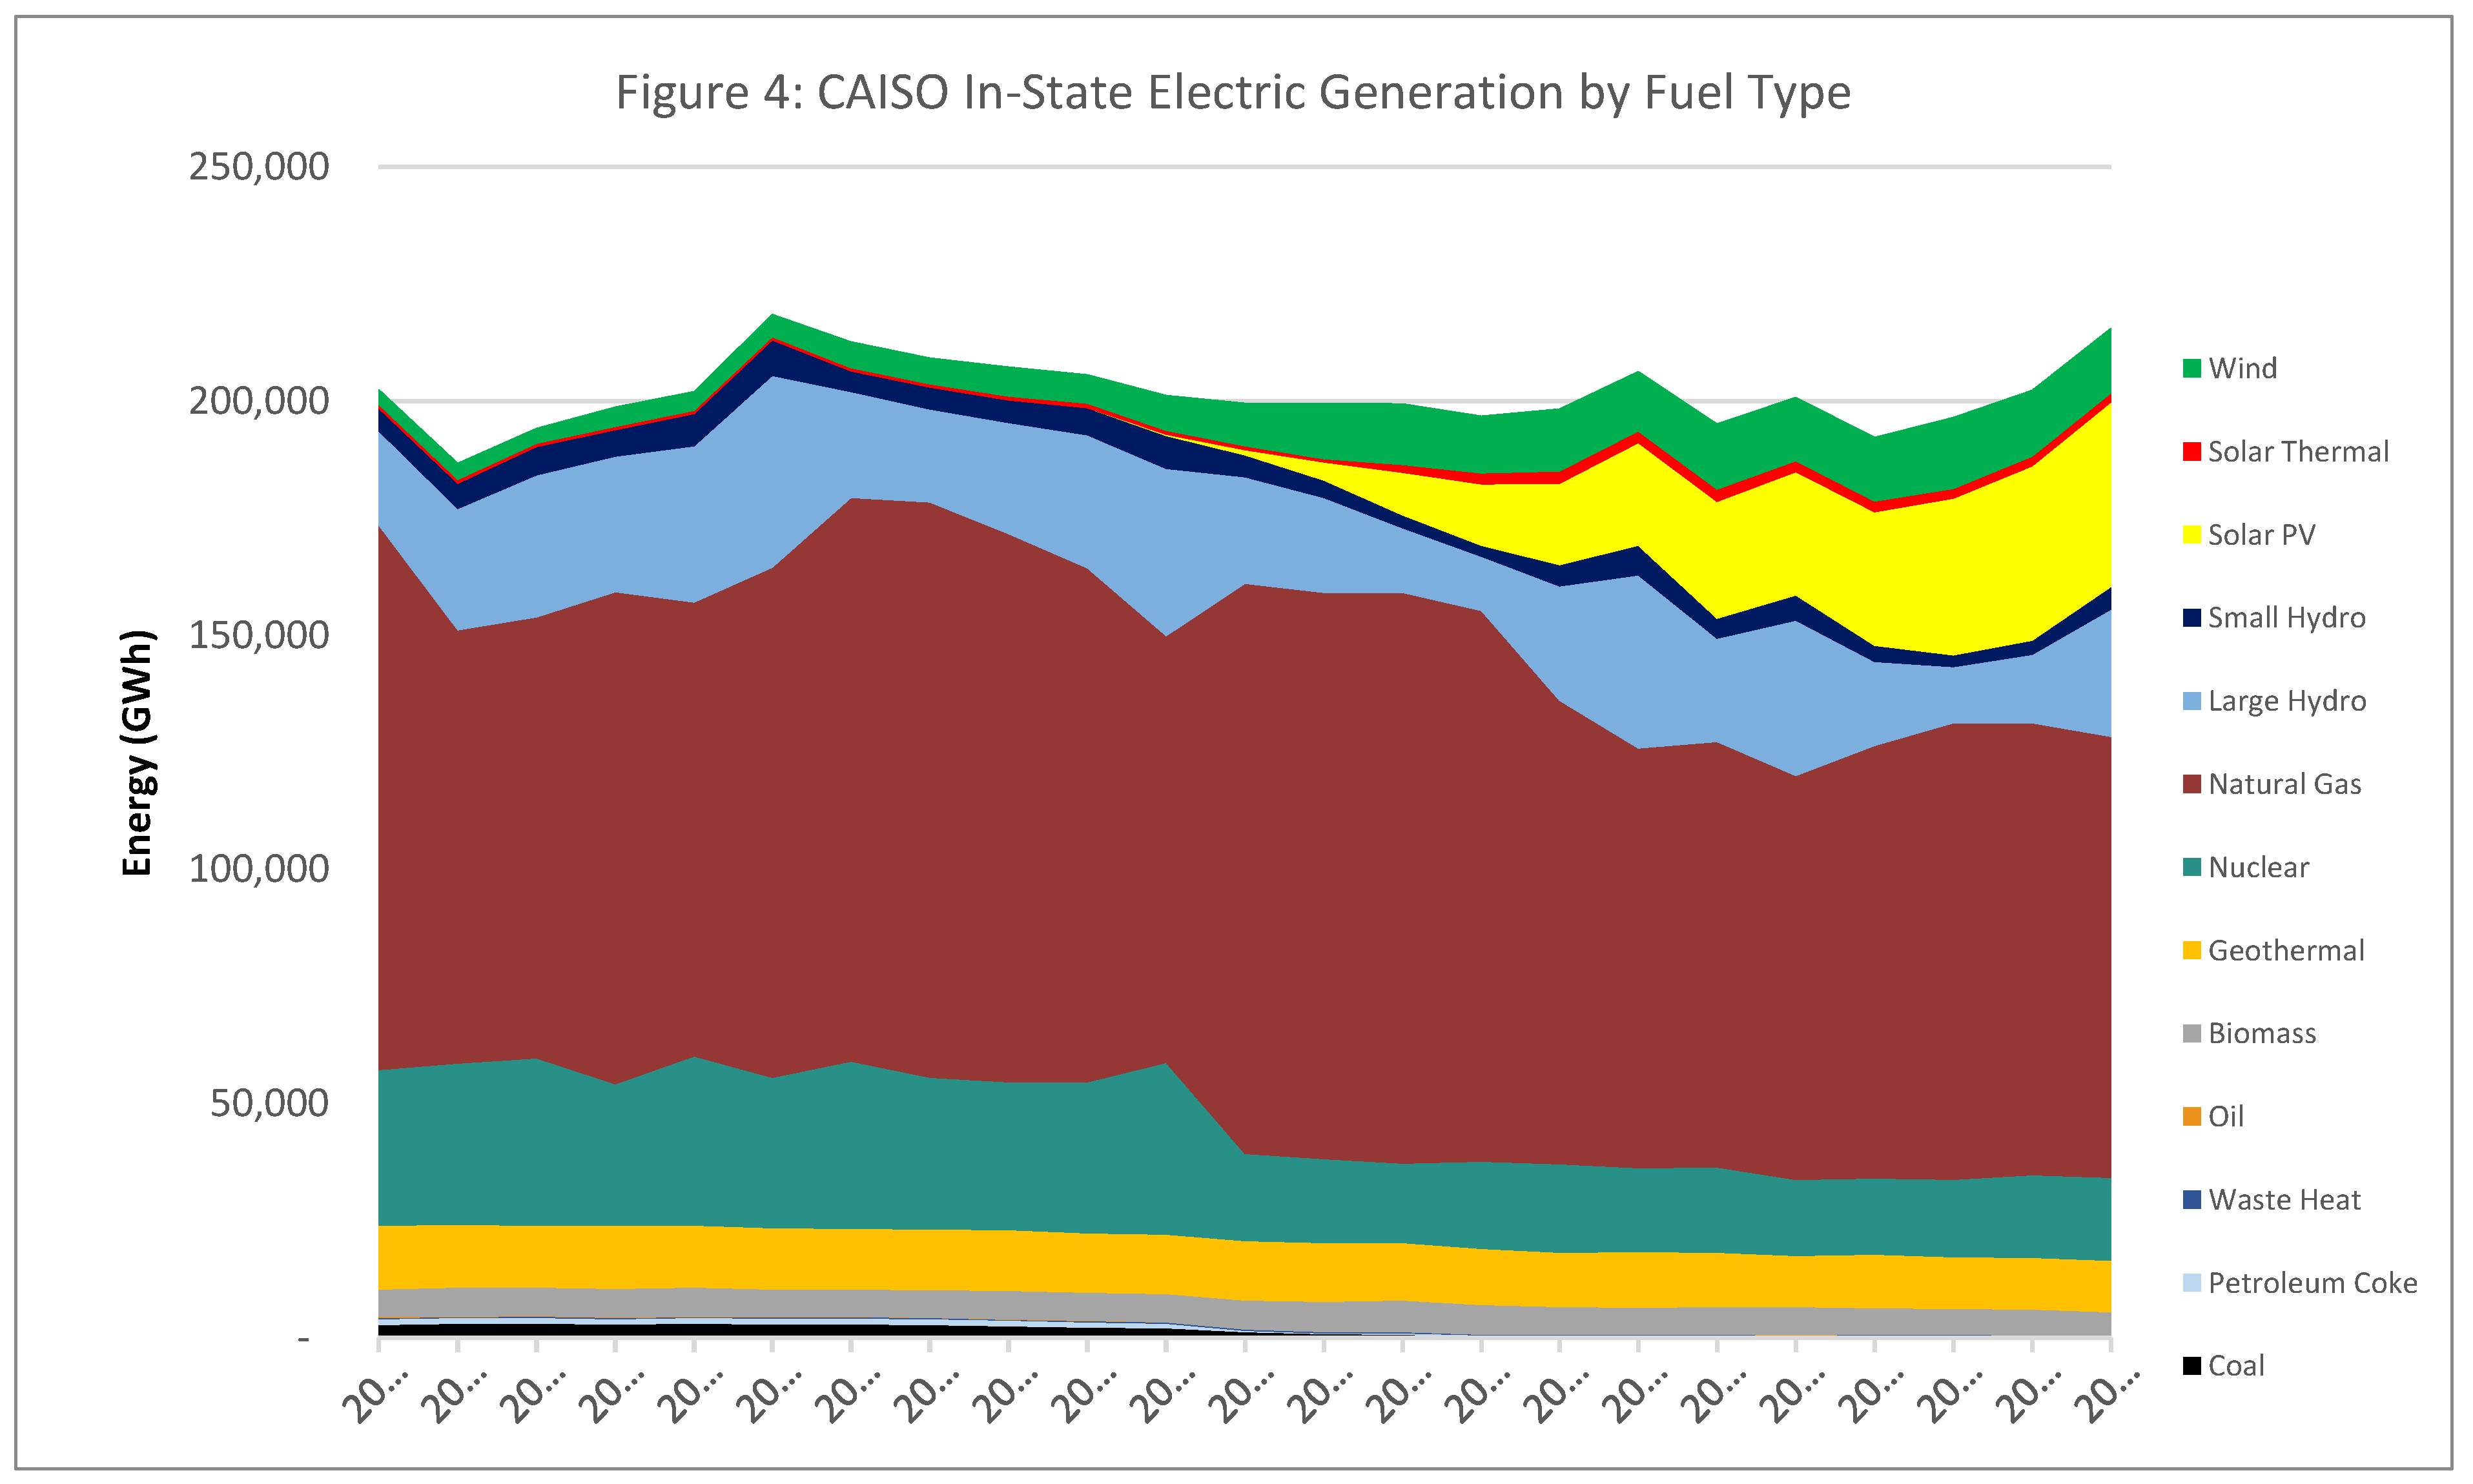
Source: Figure with open data from CAISO Quarterly
Fuels and Energy Reporting Regulations, US.
As of 2023, wind and solar contributed 26% of total
electricity generation, marking a substantial shift from traditional FF
sources. Figure 5 further illustrates the
gradual reduction in the reliance on FF and nuclear, with renewables,
particularly solar PV, playing an increasing role in CAISO’s energy mix.
Source: Figure with open data from CAISO Quarterly
Fuels and Energy Reporting Regulations, US.
Despite the rise in VRE capacity, integrating these
resources into the grid remains challenging. CAISO’s power system requires
substantial backup and reserve capacity to compensate for the intermittent
nature of VRE, as illustrated by the increased spare capacity over time. Peak
generation as a percentage of installed capacity has decreased, signaling
growing buffer plate capacity —essential to ensure grid stability. In 2001, the
ratio of peak consumption to installed capacity was 75%, whereas by 2023, it had
dropped to 51%, reflecting significant capacity increases to accommodate VRE
intermittency.
As in Chile, California’s experience also provides
key insights for other regions seeking to diversify their energy mix and reduce
reliance on imported FF. However, SEN-Chile and CAISO, with different market
constructs, face similar challenges related to grid management, storage, and
flexible generation investment, as well as developing innovative market designs
to support continued growth in renewable energy.
- Ramping Capacity Needs and Operating Reserves
The increasing integration of VRE sources and DERs
introduces significant variability in energy production, demanding a more
flexible power system and better forecasting. While market designs are evolving
to accommodate VRE, new plants often benefit from existing system capabilities
without fully accounting for the additional costs they impose, such as expanded
operating reserves, transmission upgrades, and enhanced operational
capabilities to manage higher VRE penetration.
For example, some of these system costs associated
with VRE integration include:
- Balancing costs: The expenses for ancillary services needed to stabilize the grid include load-following and managing unforeseen fluctuations.
- Capacity costs: Backup generation and storage are required during low VRE output periods to ensure reliability.
- Transmission and distribution costs: Upgrading grid infrastructure to accommodate the increasing number of small power plants, DG systems, and behind-the-meter VRE sources.
- Operational costs: Coordinating a diverse and larger array of power generators, energy storage, prosumers, and demand management systems.
- Curtailment costs: Managing surplus generation when VRE output exceeds demand, leading to curtailment or the need for investment in energy storage.
Addressing these challenges requires thoughtful
planning and policy design to optimize renewable energy integration while
maintaining system reliability and controlling costs.
As a result, while increasing shares of VRE are
aimed at contributing to reducing greenhouse emissions, the stability and
security of energy supply, with characteristics of a public good, along with
the expansion of transmission lines and other services needed to operate an
electrical system, with an increasing share of VRE, are not always fully
compensated by VRE investors. These renewable sources, such as DERs, are
typically more dispersed and smaller than traditional energy sources, further
complicating system management.16
This new landscape necessitates crucial flexibility
and pricing schemes that assist with quickly ramping output up or down to
accommodate fluctuations in supply and demand, anticipated or not. Traditional
baseload power plants, designed to provide constant output, often struggle with
this requirement for rapid ramping. Consequently, there is a growing need for
flexible generation resources, ESS, DR programs, and adaptive grid
infrastructure.
[78] provides a
comprehensive analysis of thermal unit statistics in the United States,
examining historical operating costs of hundreds of conventional electrical
generation units and identifying key factors influencing costs associated with
providing flexibility services. These factors allow for estimating indirect
ignition costs, load following costs, and increased unit unavailability
resulting from more frequent cycling, focusing on coal and gas plants (combined
cycle, simple cycle, and aero-derivative). [79]
also review hydropower plants' start and stop costs by highlighting the
increased operational stresses and costs from frequent start and stop cycles
due to intermittent renewable energy sources. It categorizes cost estimation
approaches into economic and technical-economic types, emphasizing the need for
comprehensive, auditable models that integrate material and non-material costs.
Future research should aim to develop representative models for various
components and aggregate these to estimate system-level costs. [80] quantify the costs incurred by conventional
power plants in Germany due to increased VRE penetration, finding notable
increases in direct and indirect ignition costs with higher VRE penetration.
And, [81] examine the impact of greater VRE
penetration on the startup frequency of conventional thermal units, concluding
that total operating hours of thermal units decrease in scenarios with higher
renewable penetration, primarily due to changes in the generation portfolio,
such as the phase-out of nuclear plants. These studies collectively provide
valuable insights into the complex relationship between increasing VRE
penetration and conventional power plants' operational patterns and costs,
highlighting the need for a nuanced understanding of power system flexibility
in ET.
Table 1
highlights the operational characteristics of various power generation
technologies, showing significant differences in flexibility, start-up and
shut-down costs, and wear and tear costs.17
These differences influence their suitability for different roles within the
power grid, from steady baseload generation to dynamic peaking and backup
power.
As Table 1 illustrates, the flexibility and response time of the different technologies and start-up and shutdown costs vary significantly across technologies, with nuclear and coal having the highest due to their complexity and safety requirements. Natural gas, hydro, and diesel are lower, reflecting simpler and quicker processes. And, on Wear and Tear Costs, nuclear, wind, and solar have the lowest wear costs due to fewer mechanical stresses and steady operations. Hydropower has higher wear costs due to mechanical wear from water flow, while coal and natural gas have moderate wear costs due to thermal and mechanical stresses. This underscores the importance of considering system costs and operational flexibility when planning for a future of decarbonized energy.
Historically, baseload generation has relied on stable, continuous-output technologies like nuclear and coal, which efficiently meet the grid's constant demand but lack flexibility. In contrast, peaking power has been best served by flexible and fast-ramping technologies such as natural gas, hydro, and, recently, battery storage, which can quickly respond to demand spikes and shut down during low-demand periods. Diesel generators excel with their rapid start-up capabilities for backup and emergency power, providing immediate support during outages or unexpected demand surges. Each technology plays a distinct role in ensuring a balanced and reliable electricity supply.
- Chile’s Case Study
For Chile, Figures 6, 7, and 8, on a 24-hour window time frame for January 1st, 2000, 2010, and 2023, depict the hourly electricity generation by technology. In 2000, the electricity generation mix was dominated by coal, hydro (dam and run-of-river), and natural gas, with relatively small contributions from other sources such as diesel and biomass. In 2010, the mix saw a significant increase in natural gas and a diversified contribution from coal, hydro, and a tiny but growing share of renewables like wind and biomass—when the transition towards increasing participation of VREs began. In 2023, the generation mix showed a substantial increase in solar and wind energy contributions alongside a significant presence of flexible generation and incipient BESS. Figures 6 to 8 illustrate that the demand for power sources that can quickly accommodate solar and wind generation variability in 2023 is evident.
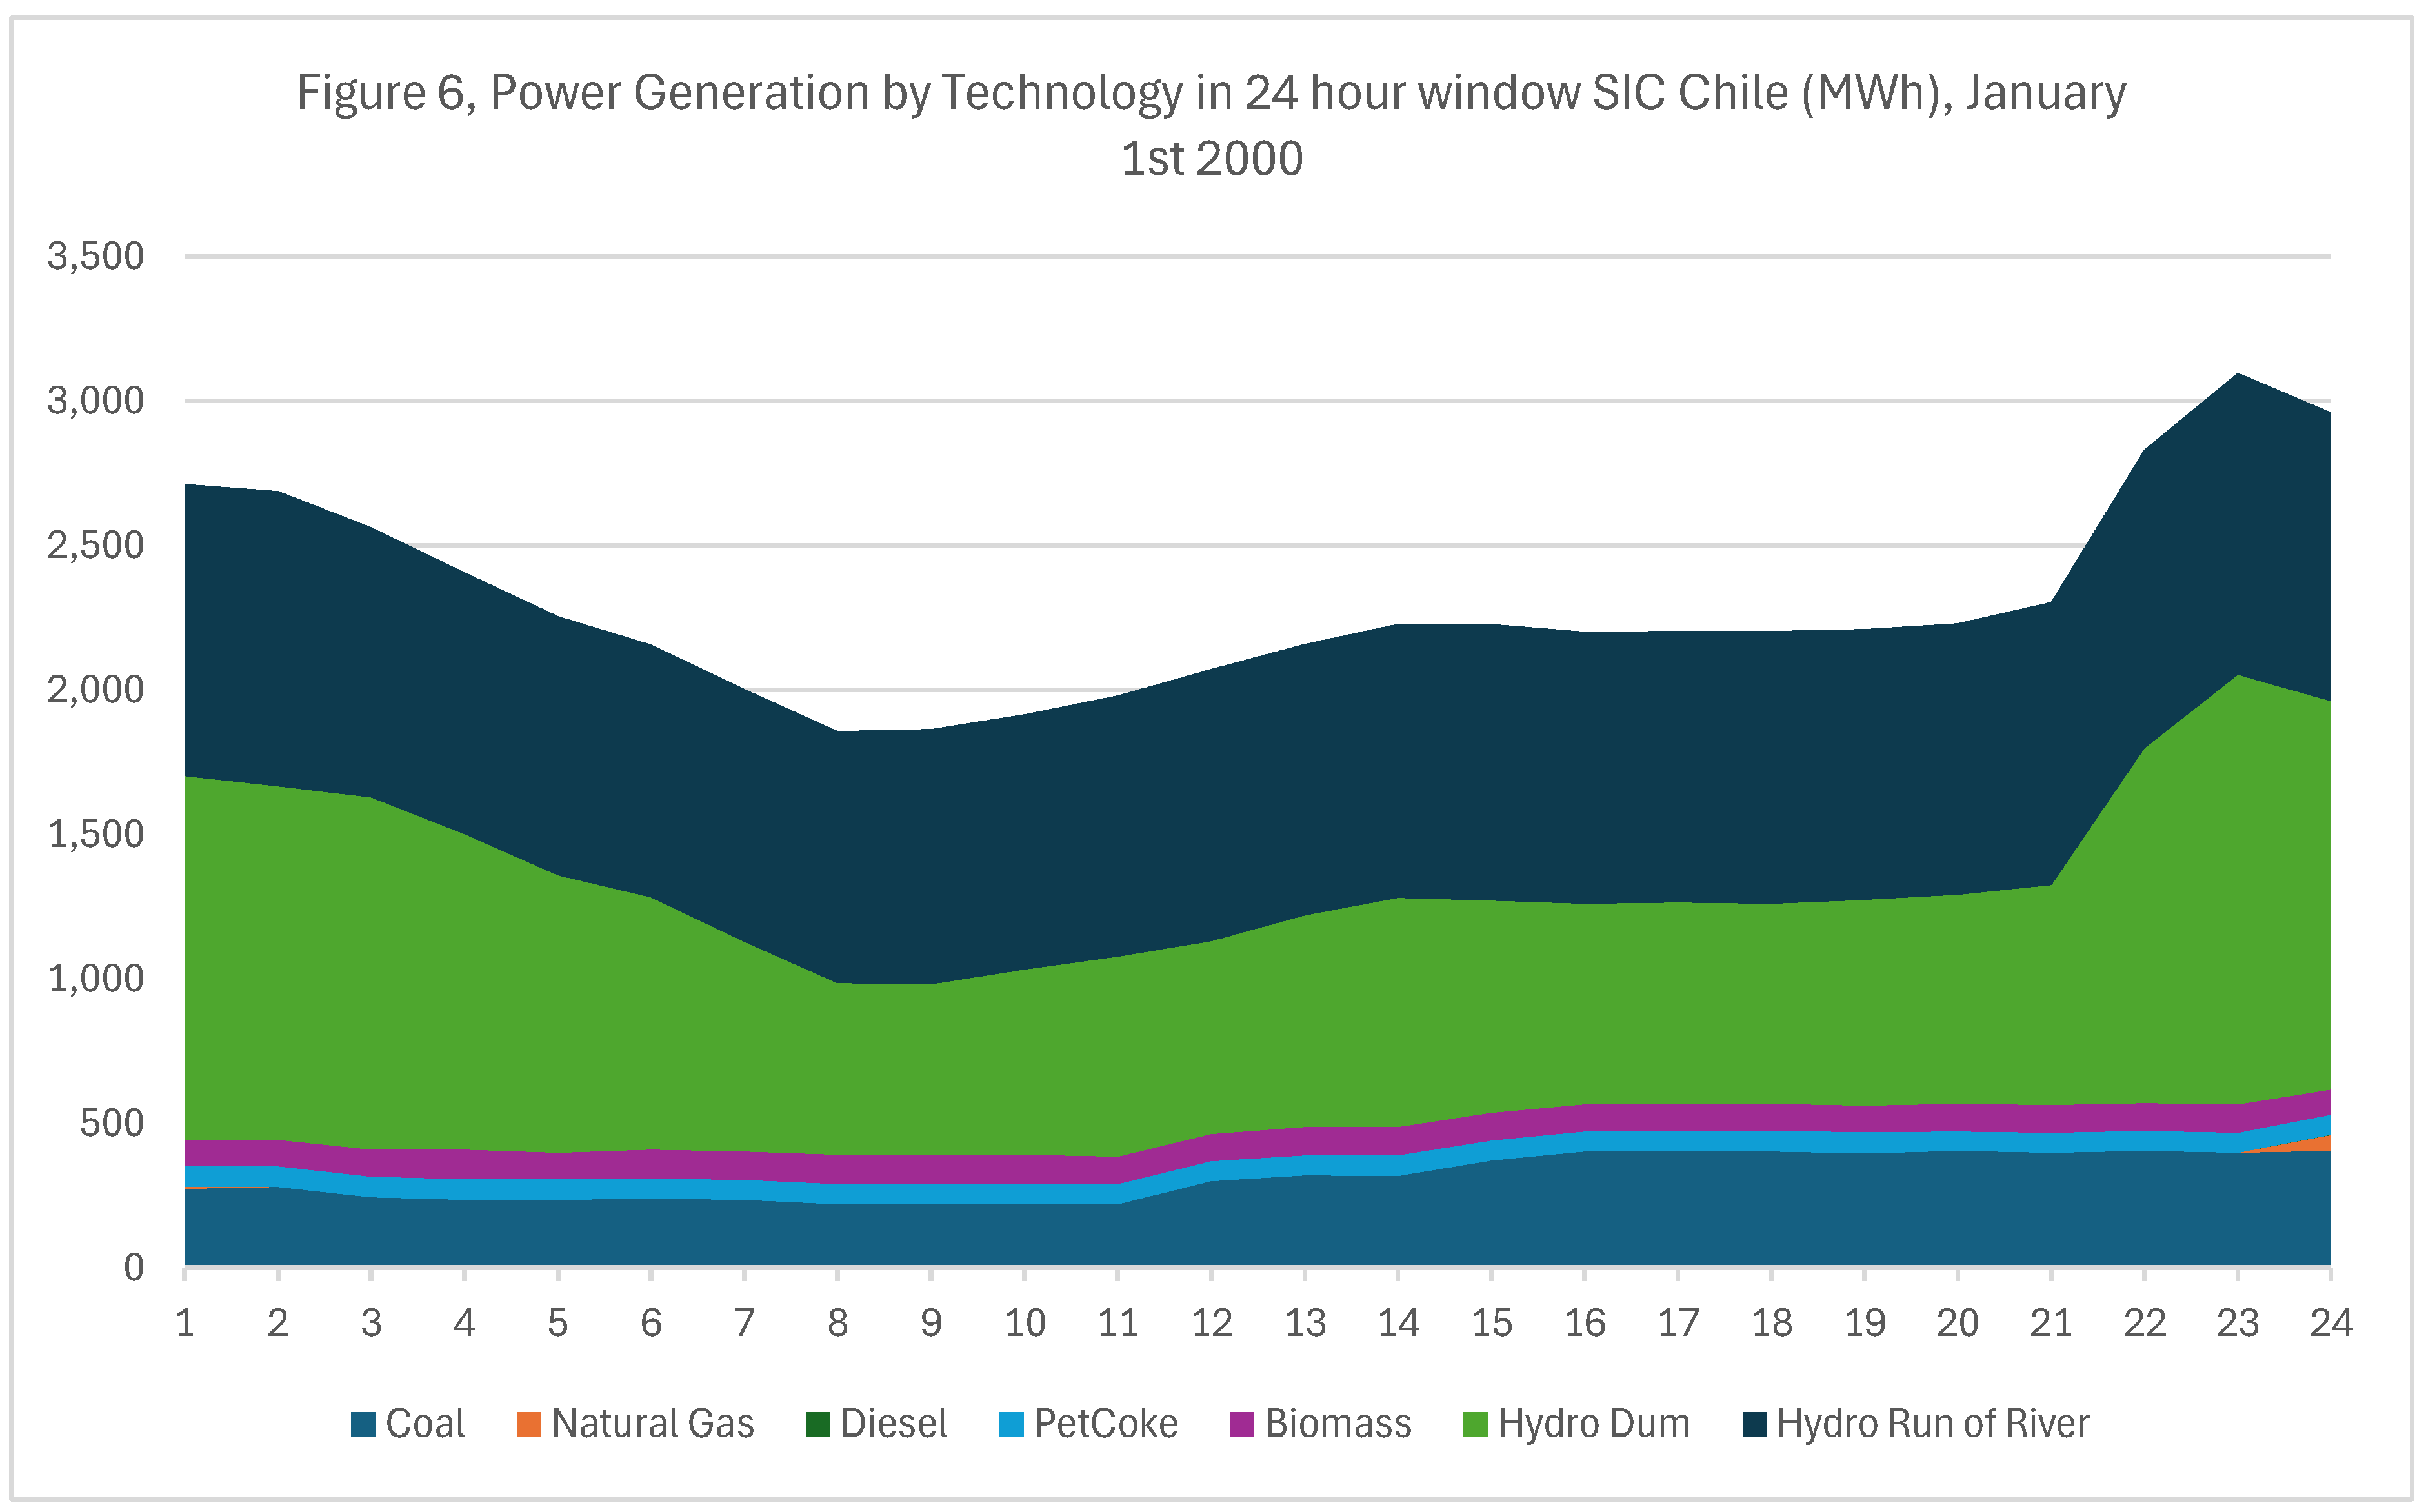
Source: Figure with open data from Coordinador Eléctrico Nacional (www.coordinador.cl), Chile.
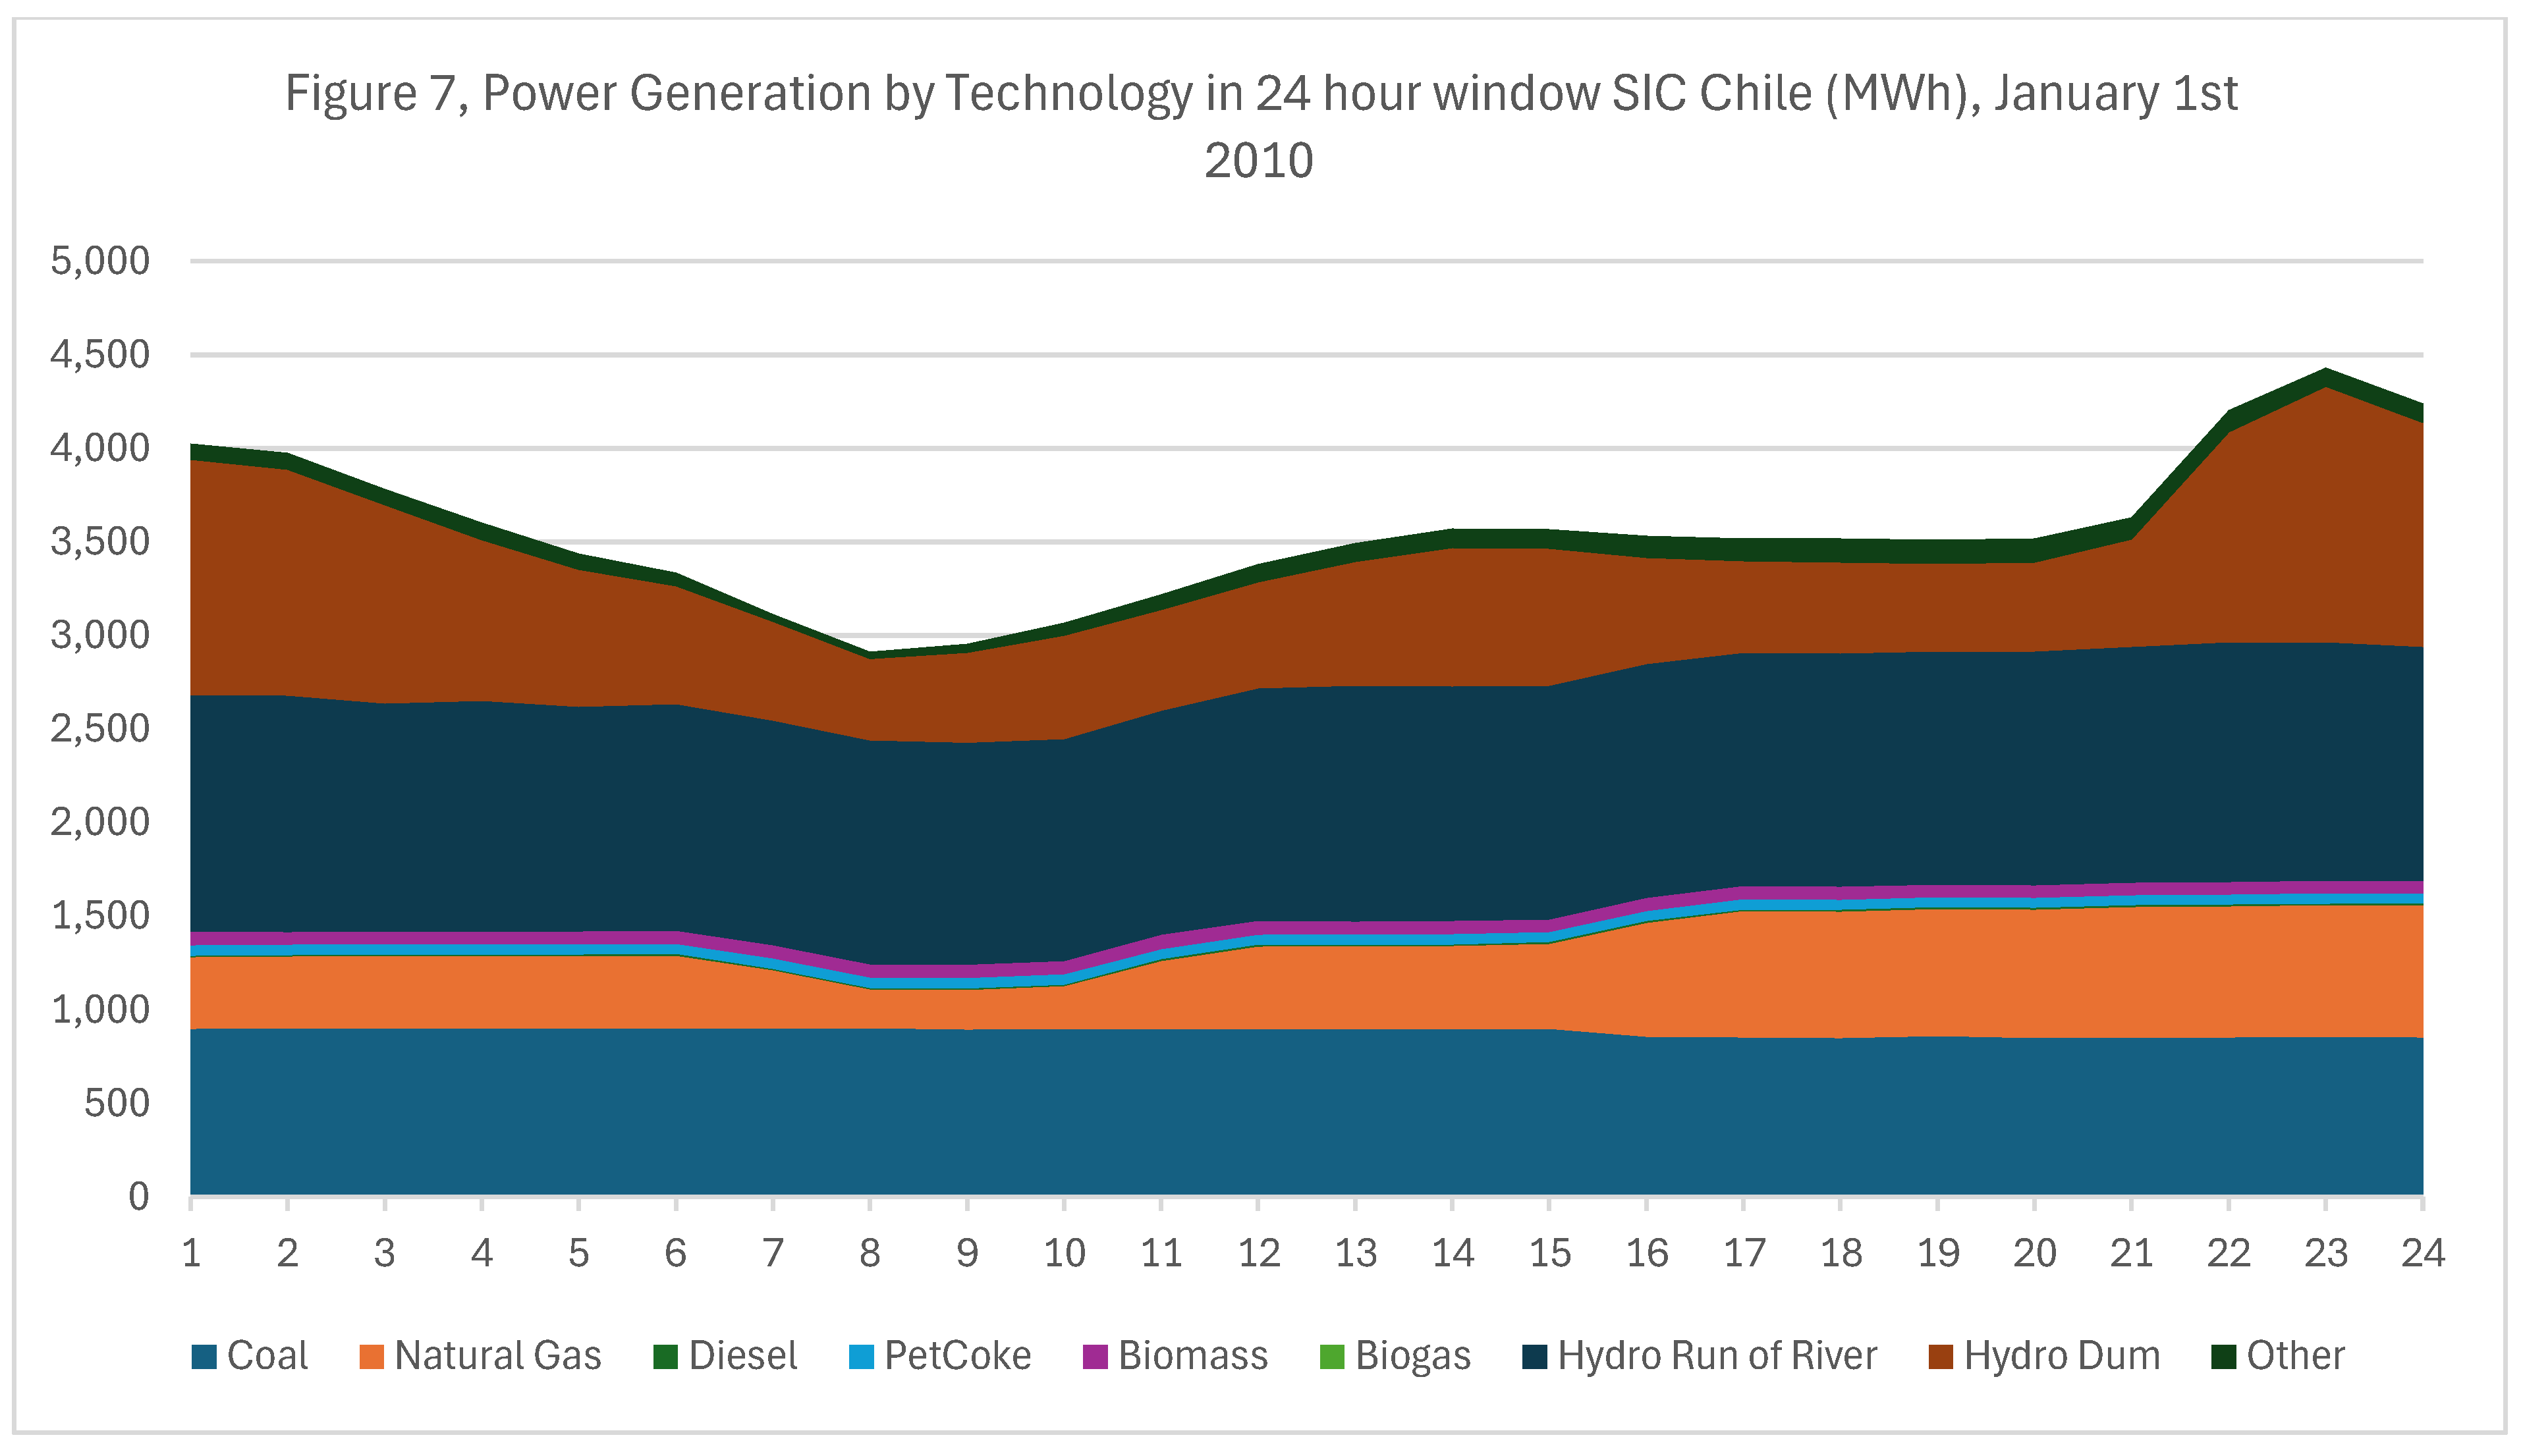
Source: Figure with open data from Coordinador Eléctrico Nacional (www.coordinador.cl), Chile.
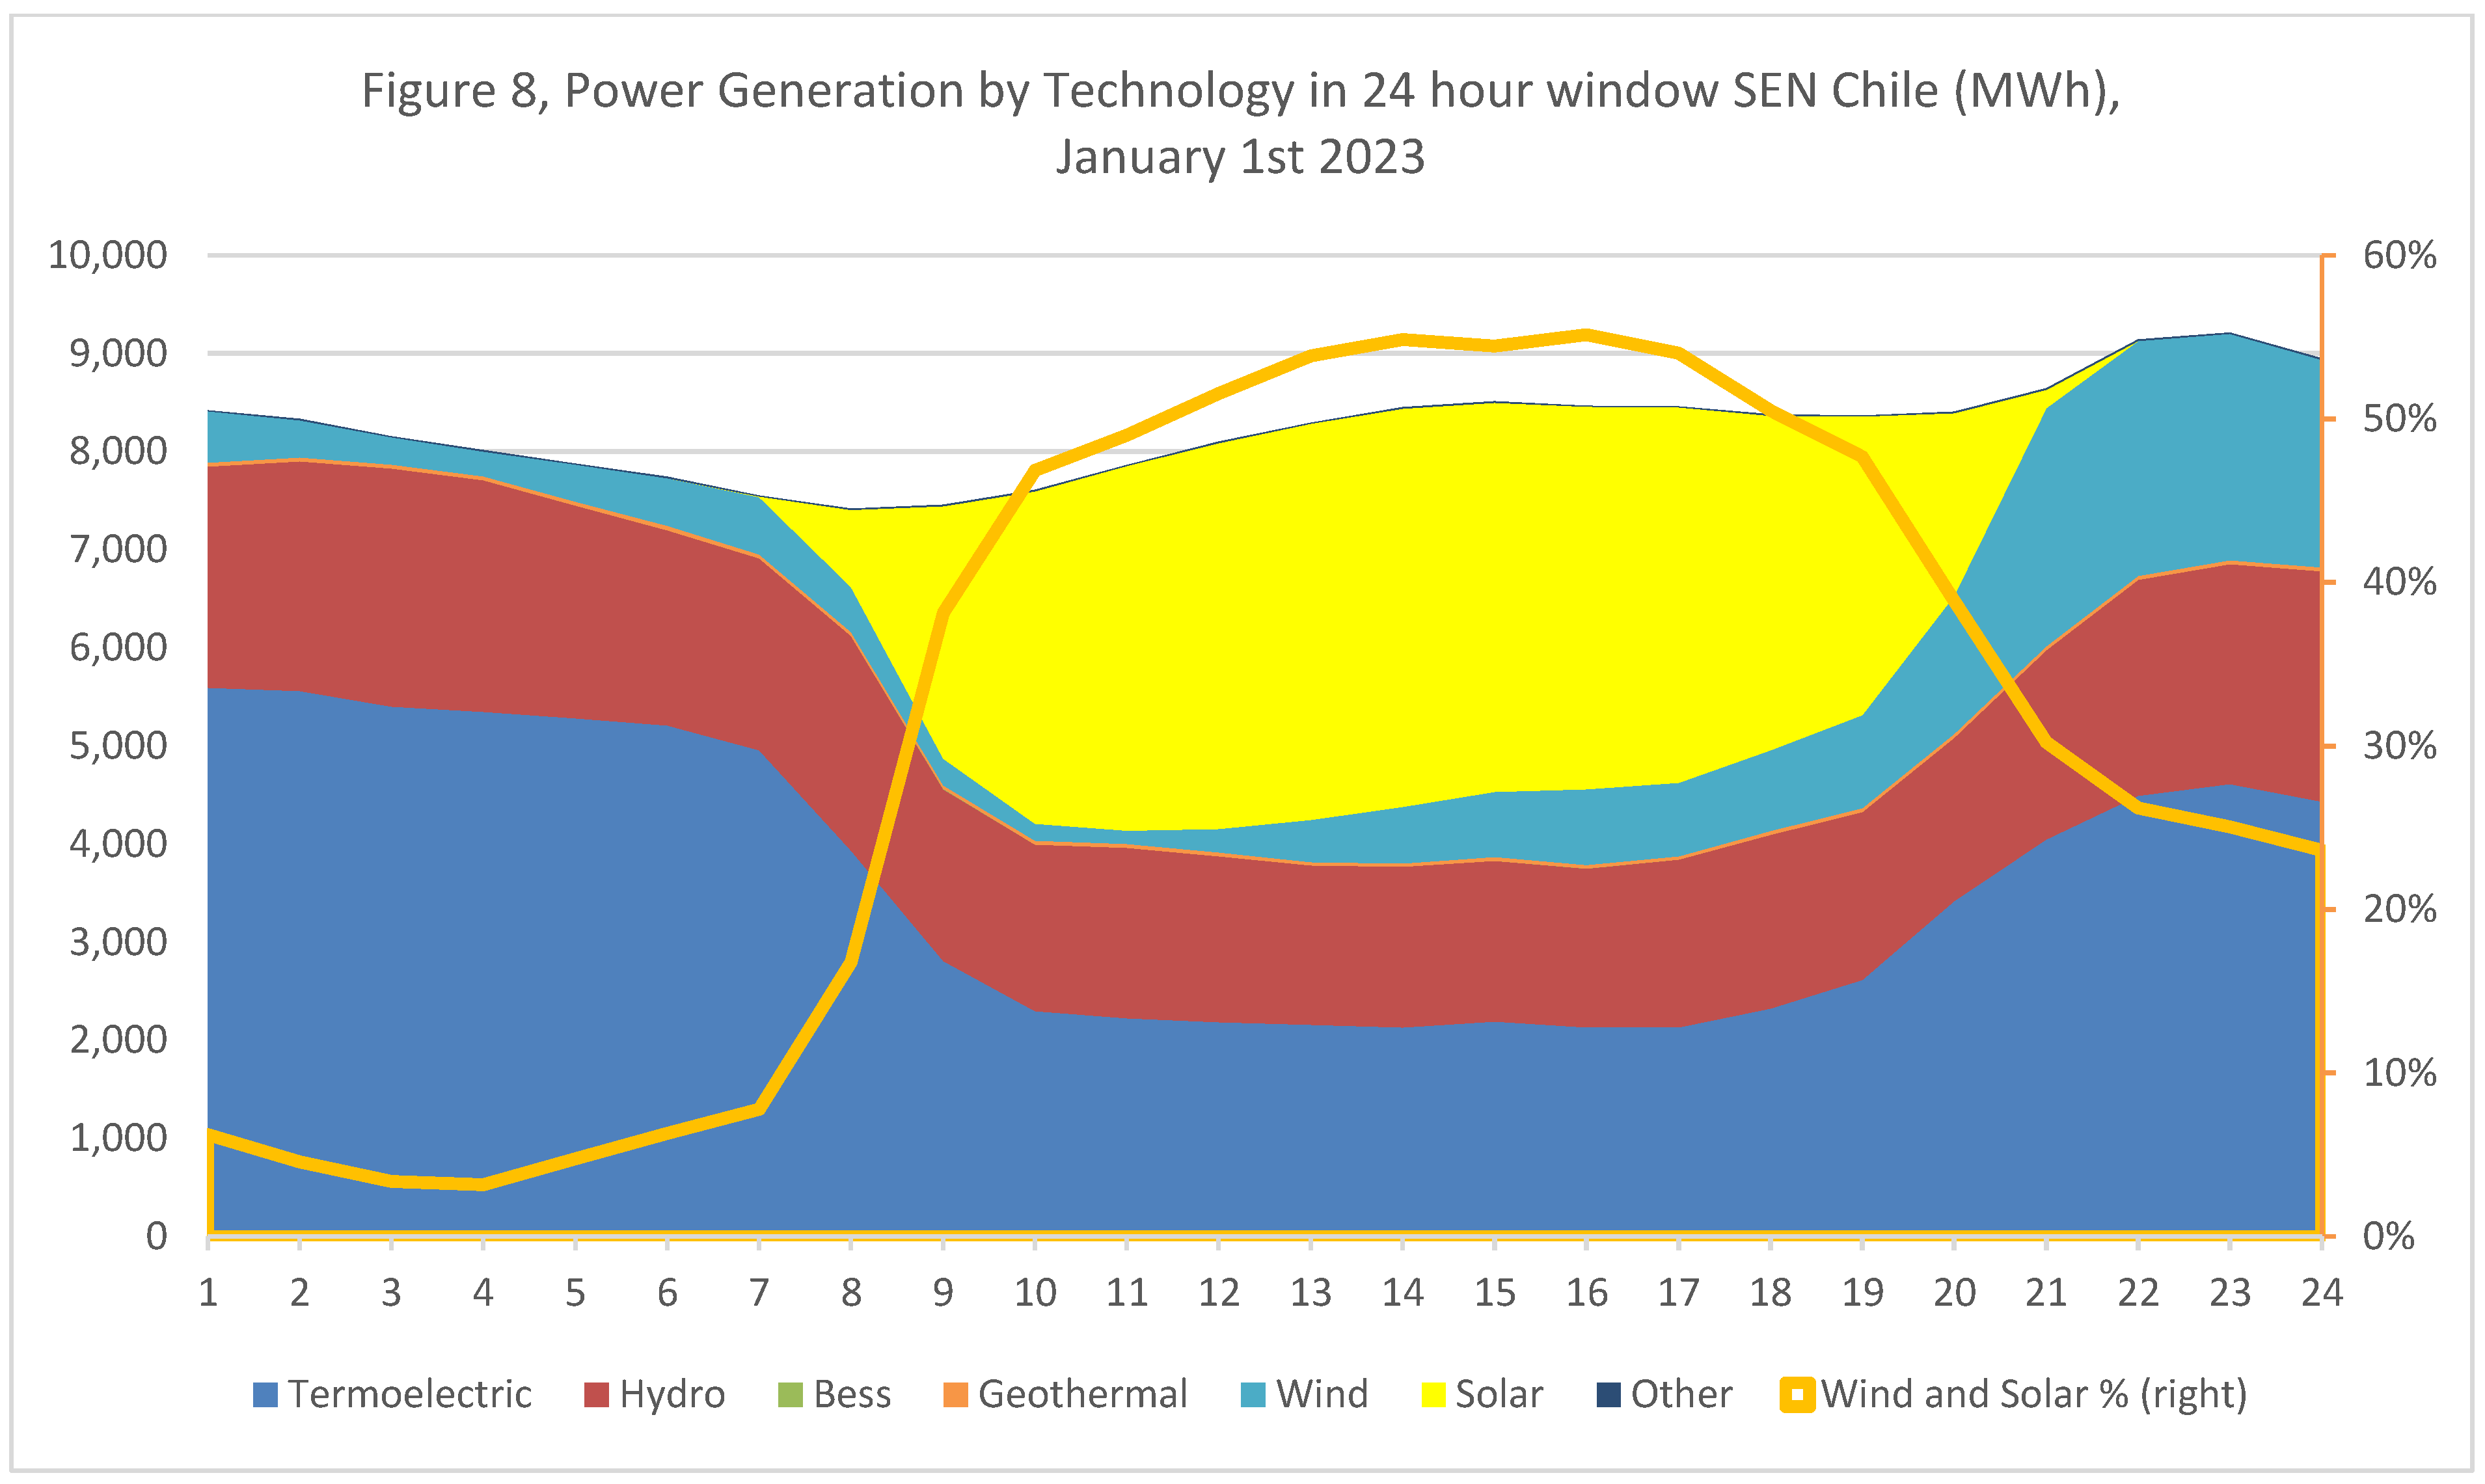
Source: Figure with open data from Coordinador Eléctrico Nacional (www.coordinador.cl), Chile.
From the significant penetration of solar and wind energy, which creates pronounced fluctuations in the residual demand faced by natural gas, coal, and large hydropower plants, Figures 6 to 8 highlight the challenges faced in 2023 by the Chilean electric system. The system had to manage a morning ramp of 3,000 MW within 3 hours and an evening ramp of 2,000 MW as solar output decreased, partially offset by wind generation. On average, solar and wind contributed 52% of the electricity generation at 10:00 AM and 7:00 PM. Interestingly, while the system's peak daily demand between 8:00 PM and 10:00 PM necessitated an additional generation increase of 736 MW, the VRE ramping capacity needs exceeded the system ramping capacity needed to satisfy the system’s daily peak load.
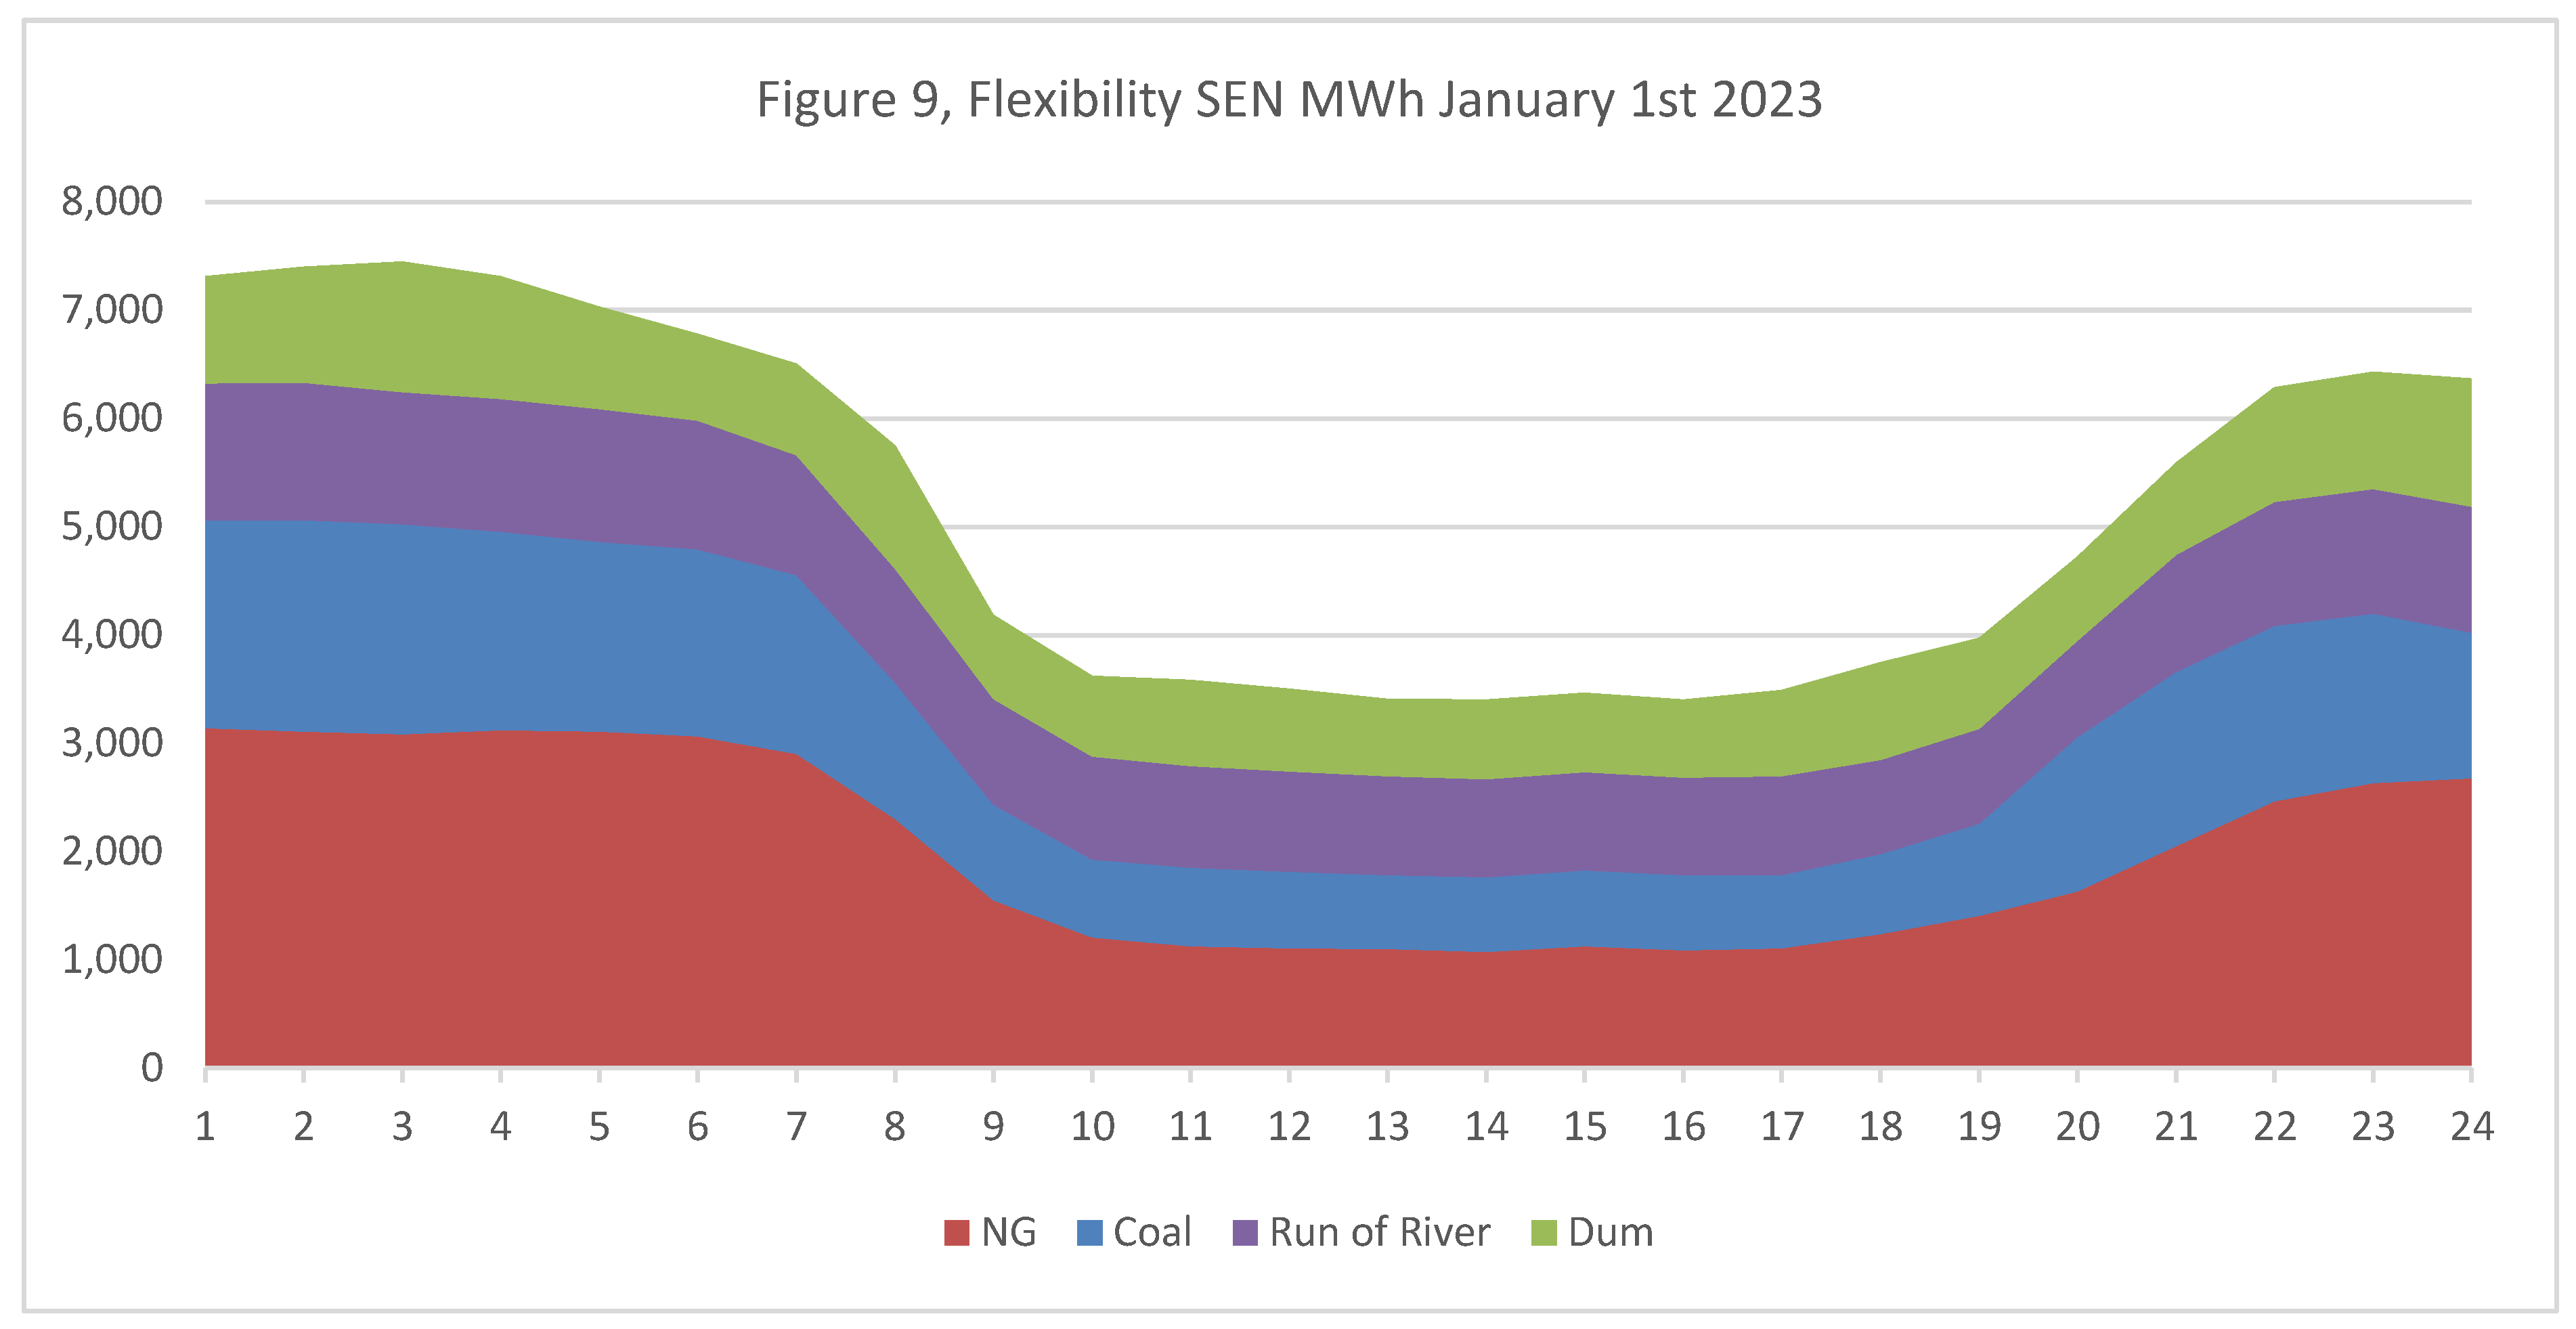
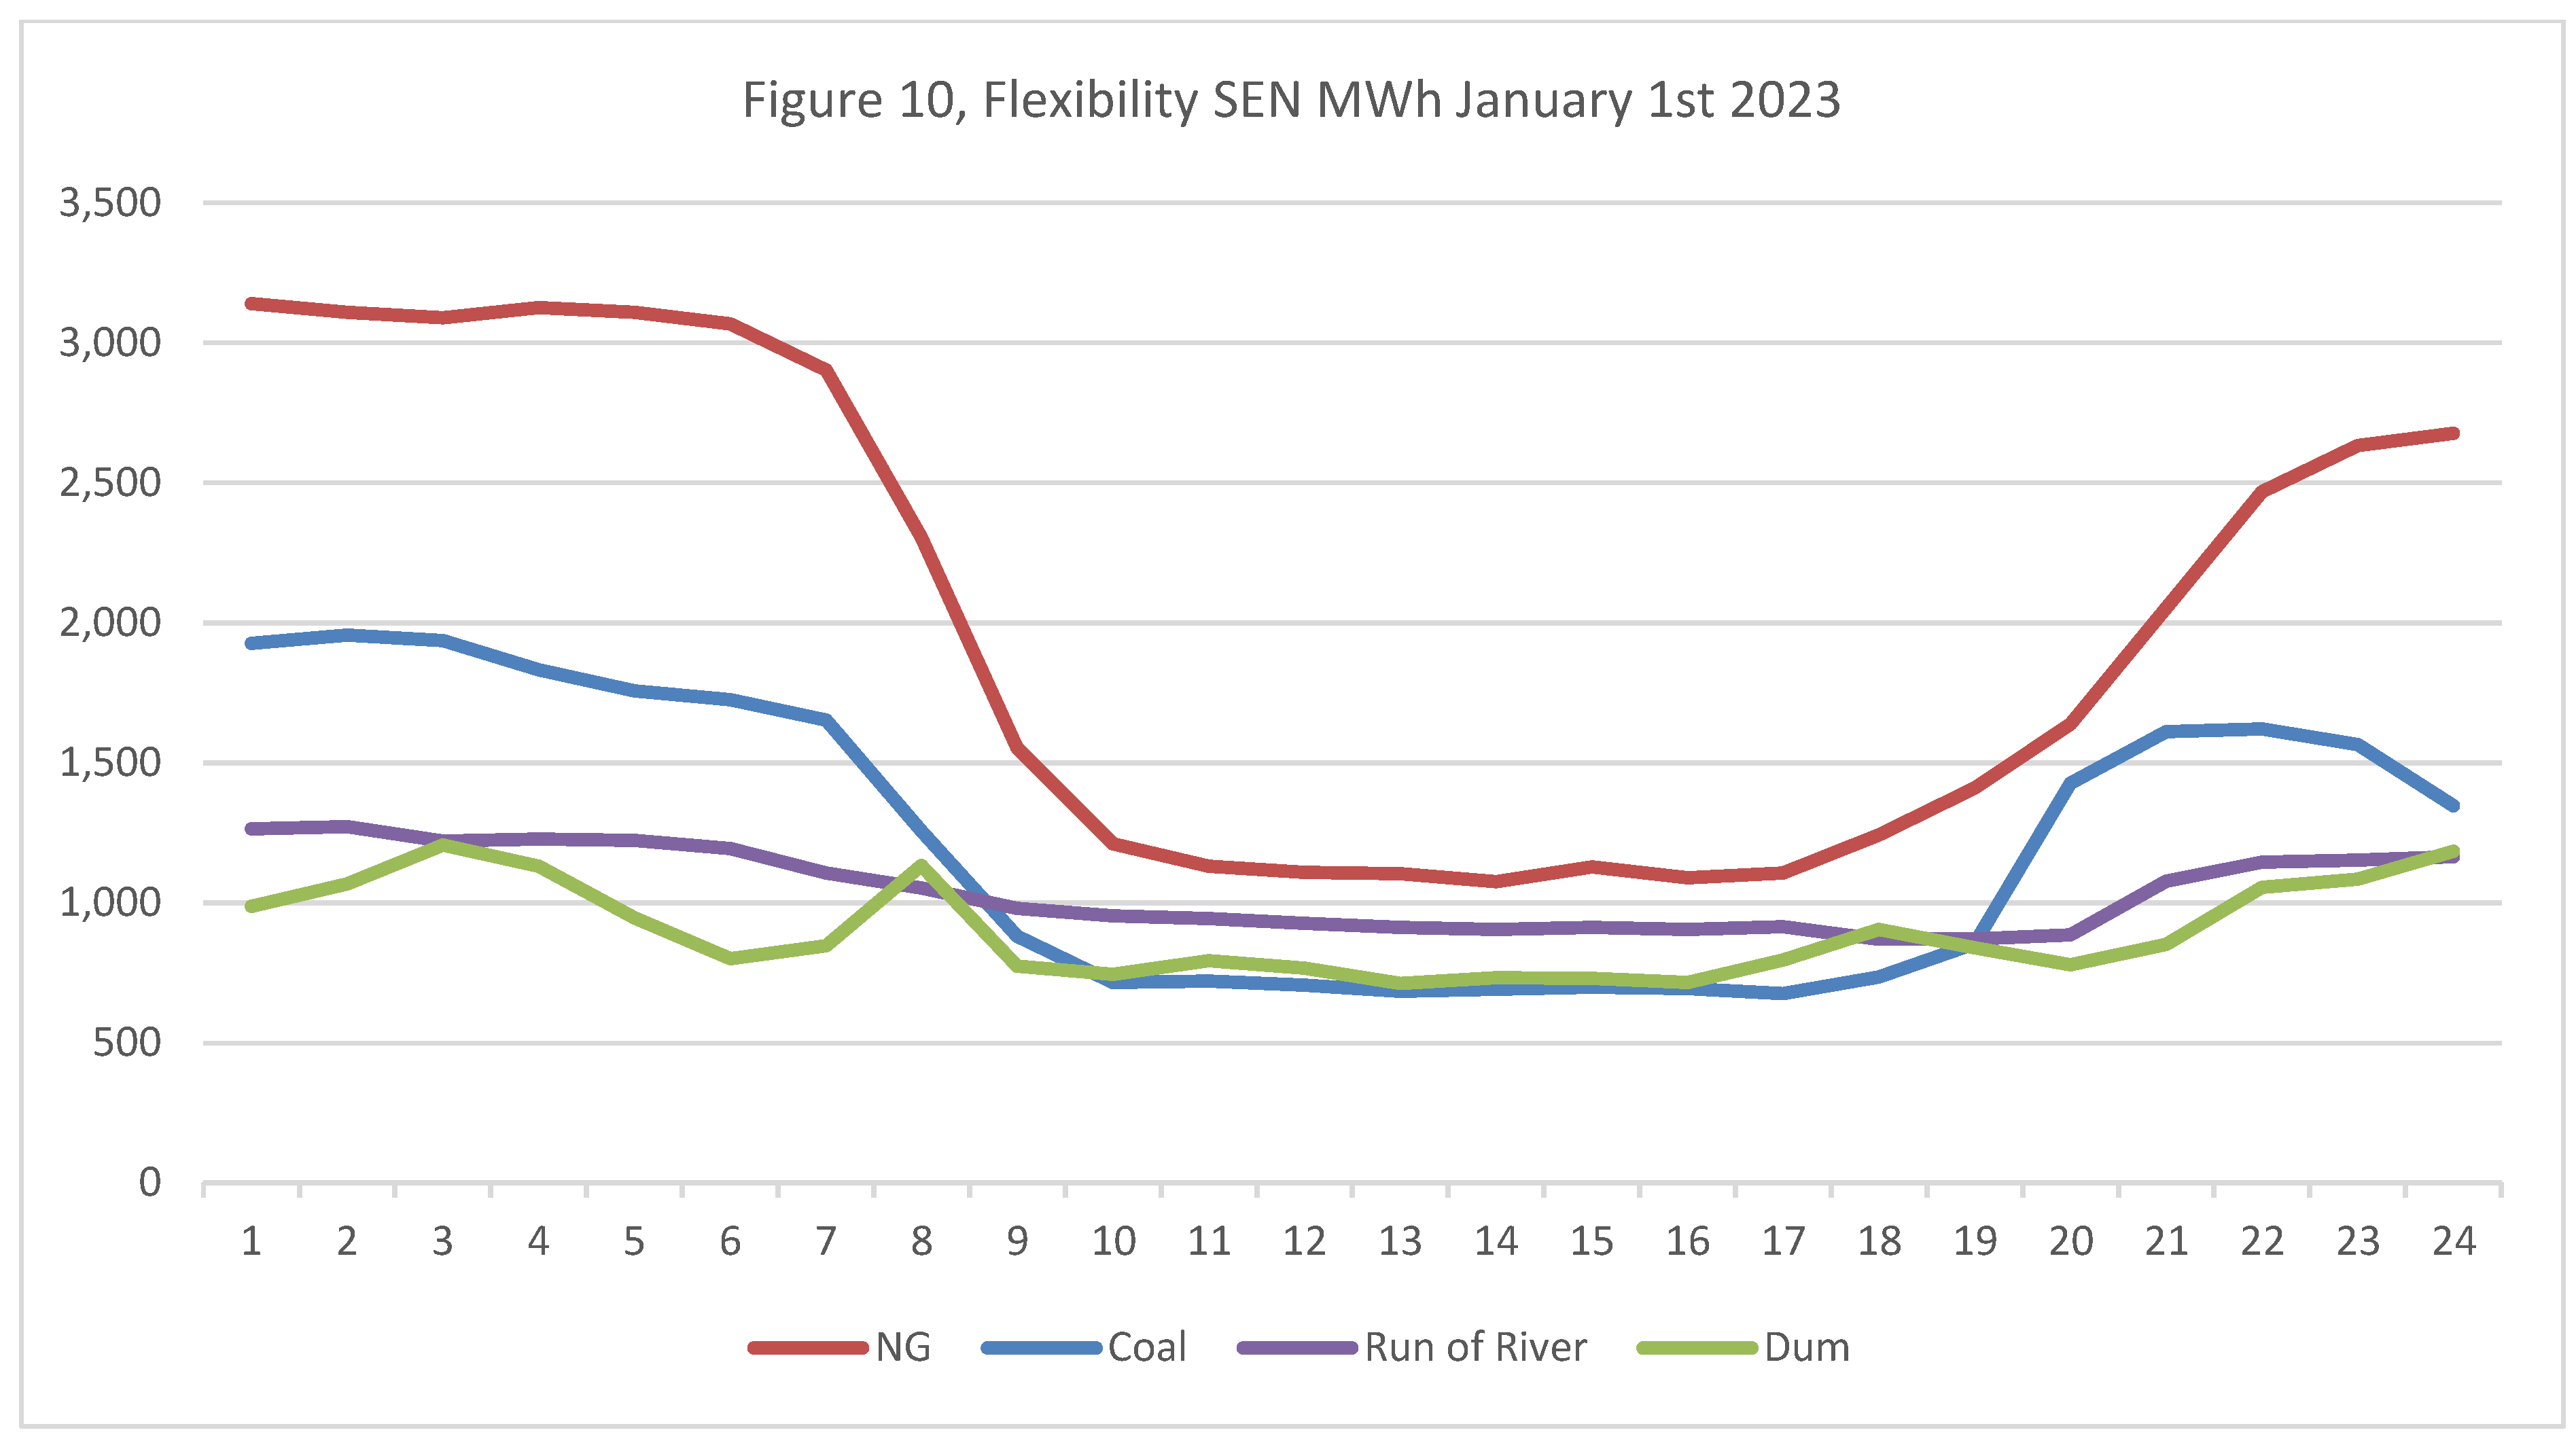
Figures 9 and 10 illustrate the daily variations in power generation by different technologies, reflecting the critical role of flexibility in maintaining grid stability amidst increasing renewable energy integration. To meet demand, peak load, VRE following, and ramping requirements, the system primarily relies on conventional FF technologies, including LNG power plants and, to a lesser extent, coal power plants and some hydropower plants. These conventional technologies are essential for providing flexibility to accommodate the variability in renewable energy production. The use of fast-response gas turbines, although effective, incurs high marginal costs, emphasizing the need for more sustainable flexibility solutions such as competitive BESS, and demand response mechanisms.
Source: Figure with open data from Coordinador Eléctrico Nacional (www.coordinador.cl), Chile.
Source: Figure with open data from Coordinador Eléctrico Nacional (www.coordinador.cl), Chile.
As net demand in Figure 9 illustrates, ramping capacity use has increased significantly in the Chilean electric system due to solar and wind power integration, following VRE supply fluctuations exceeding the resources needed to follow the daily system load fluctuations. VRE has created notable volatility in the net or residual demand curve faced by natural gas, coal, and hydropower plants, often called the "duck curve." The cost implications of this ramping are important.
- Caiso Case Study
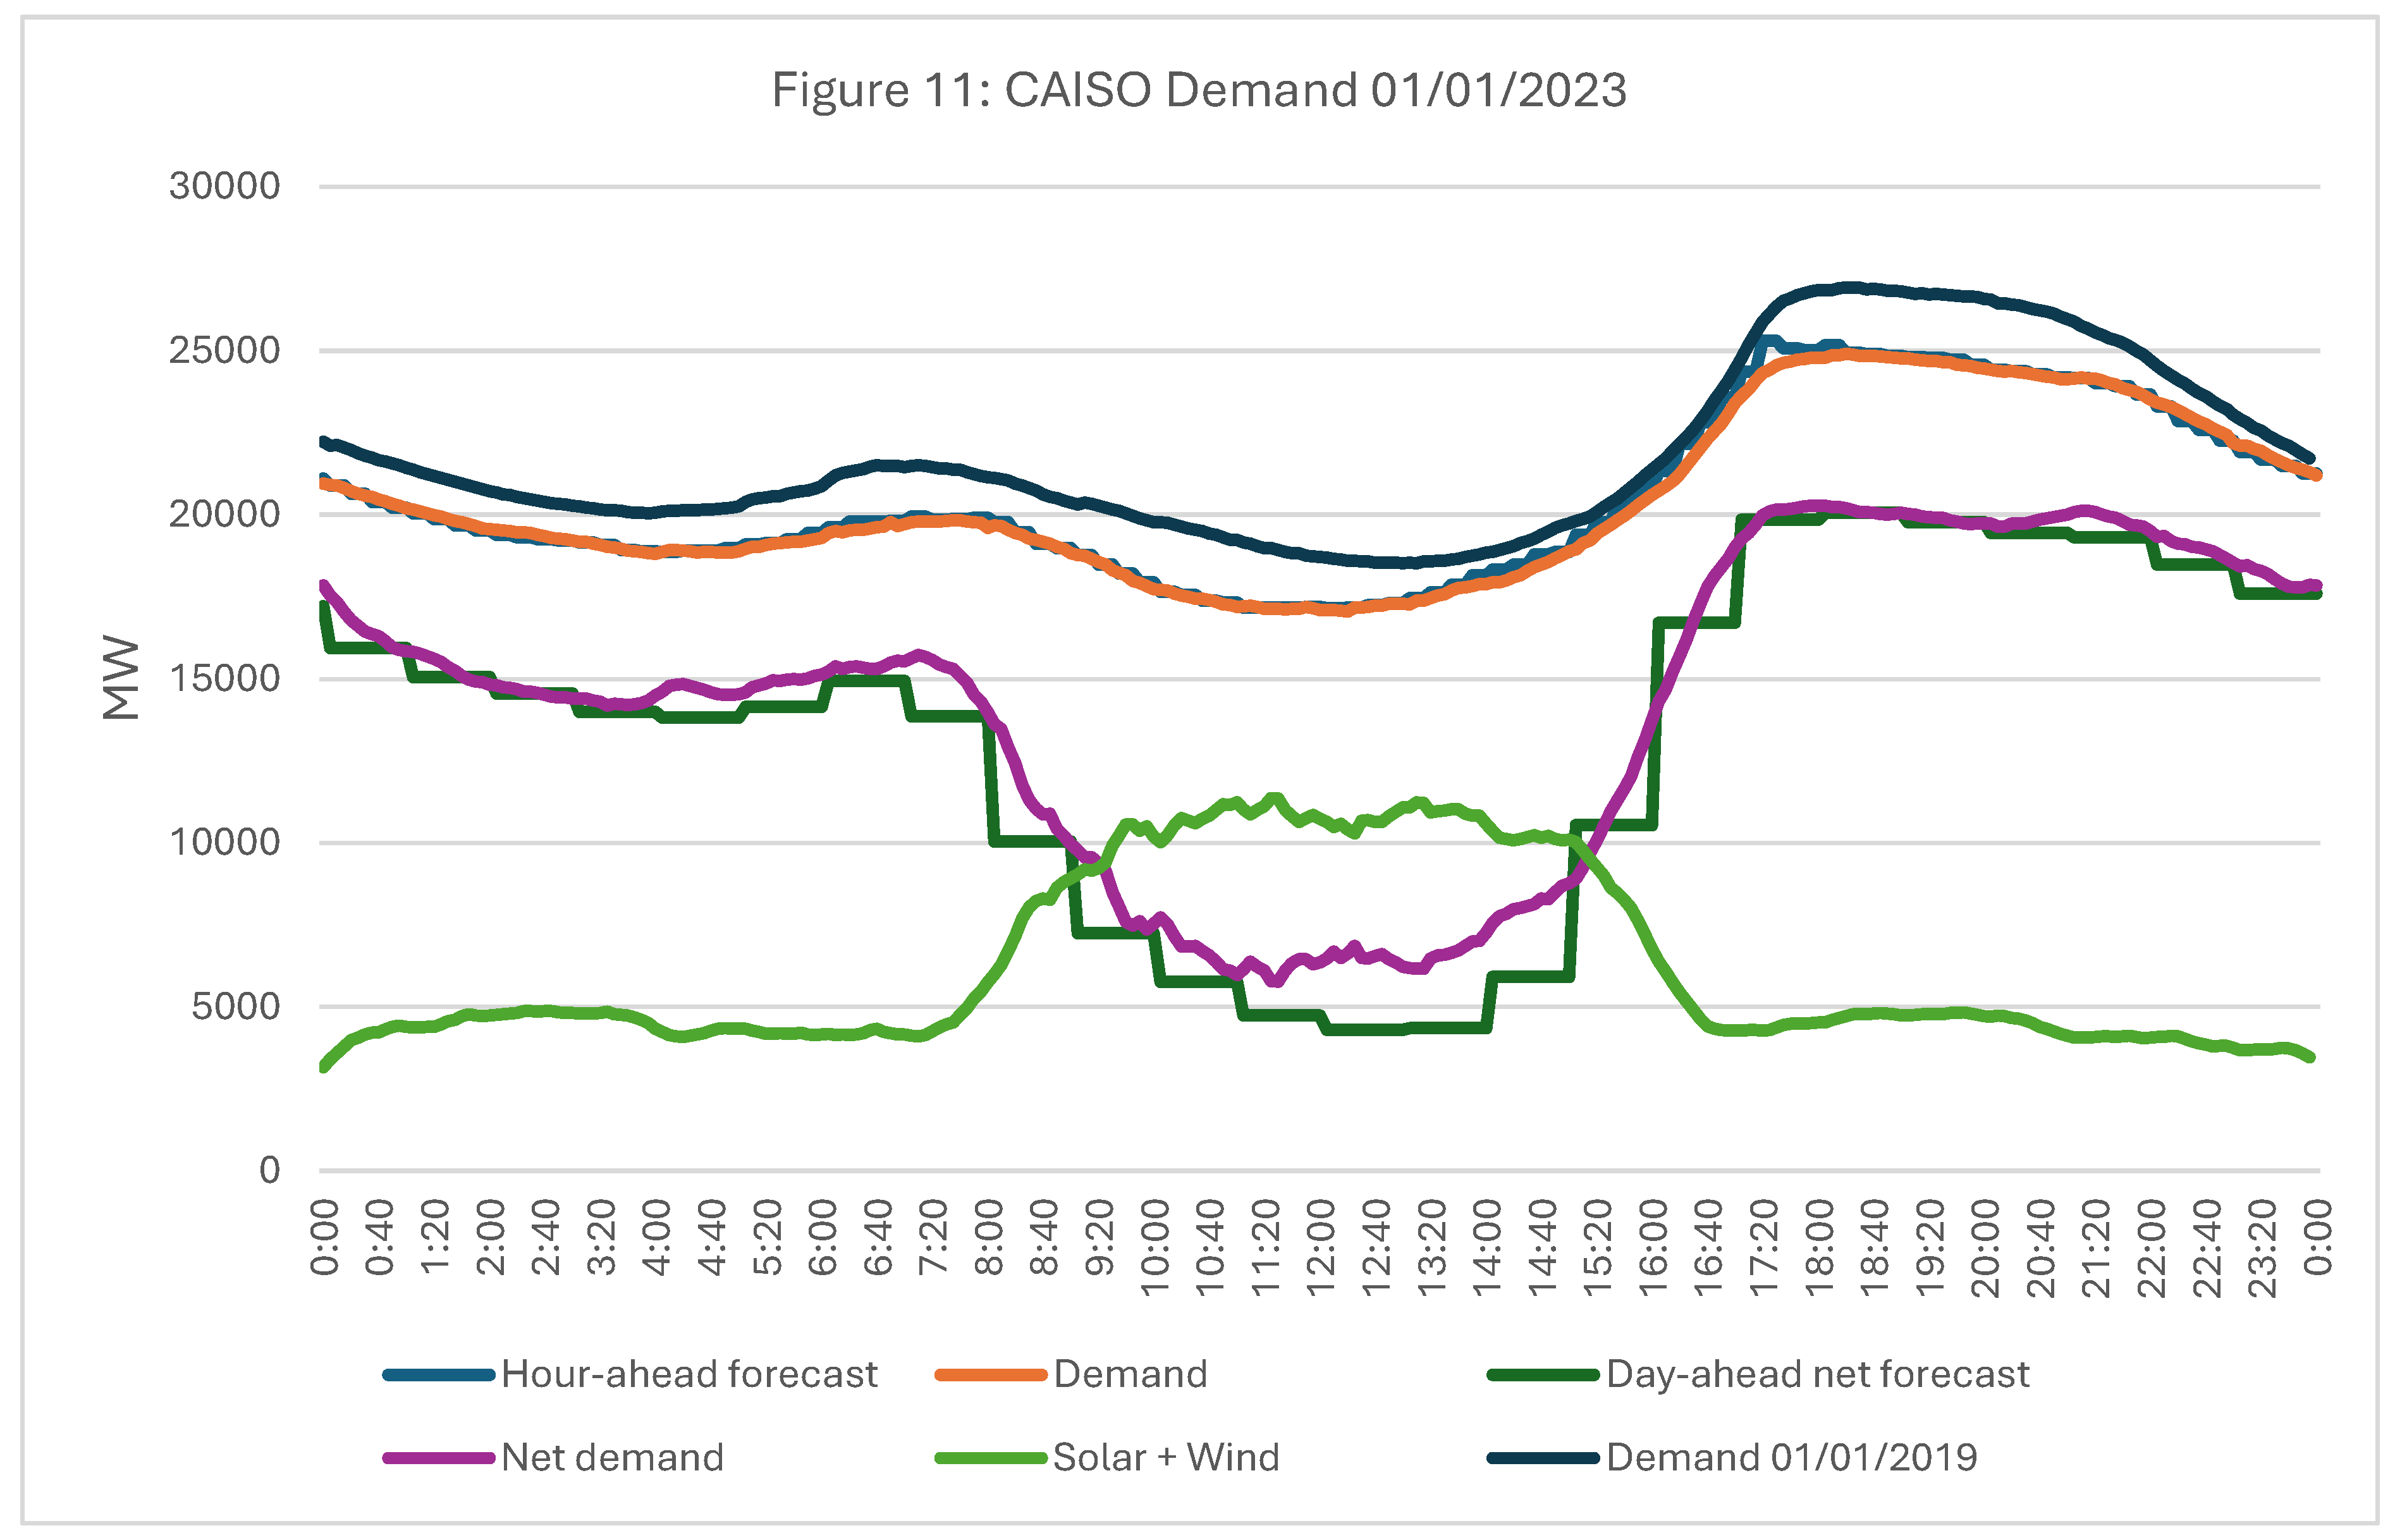
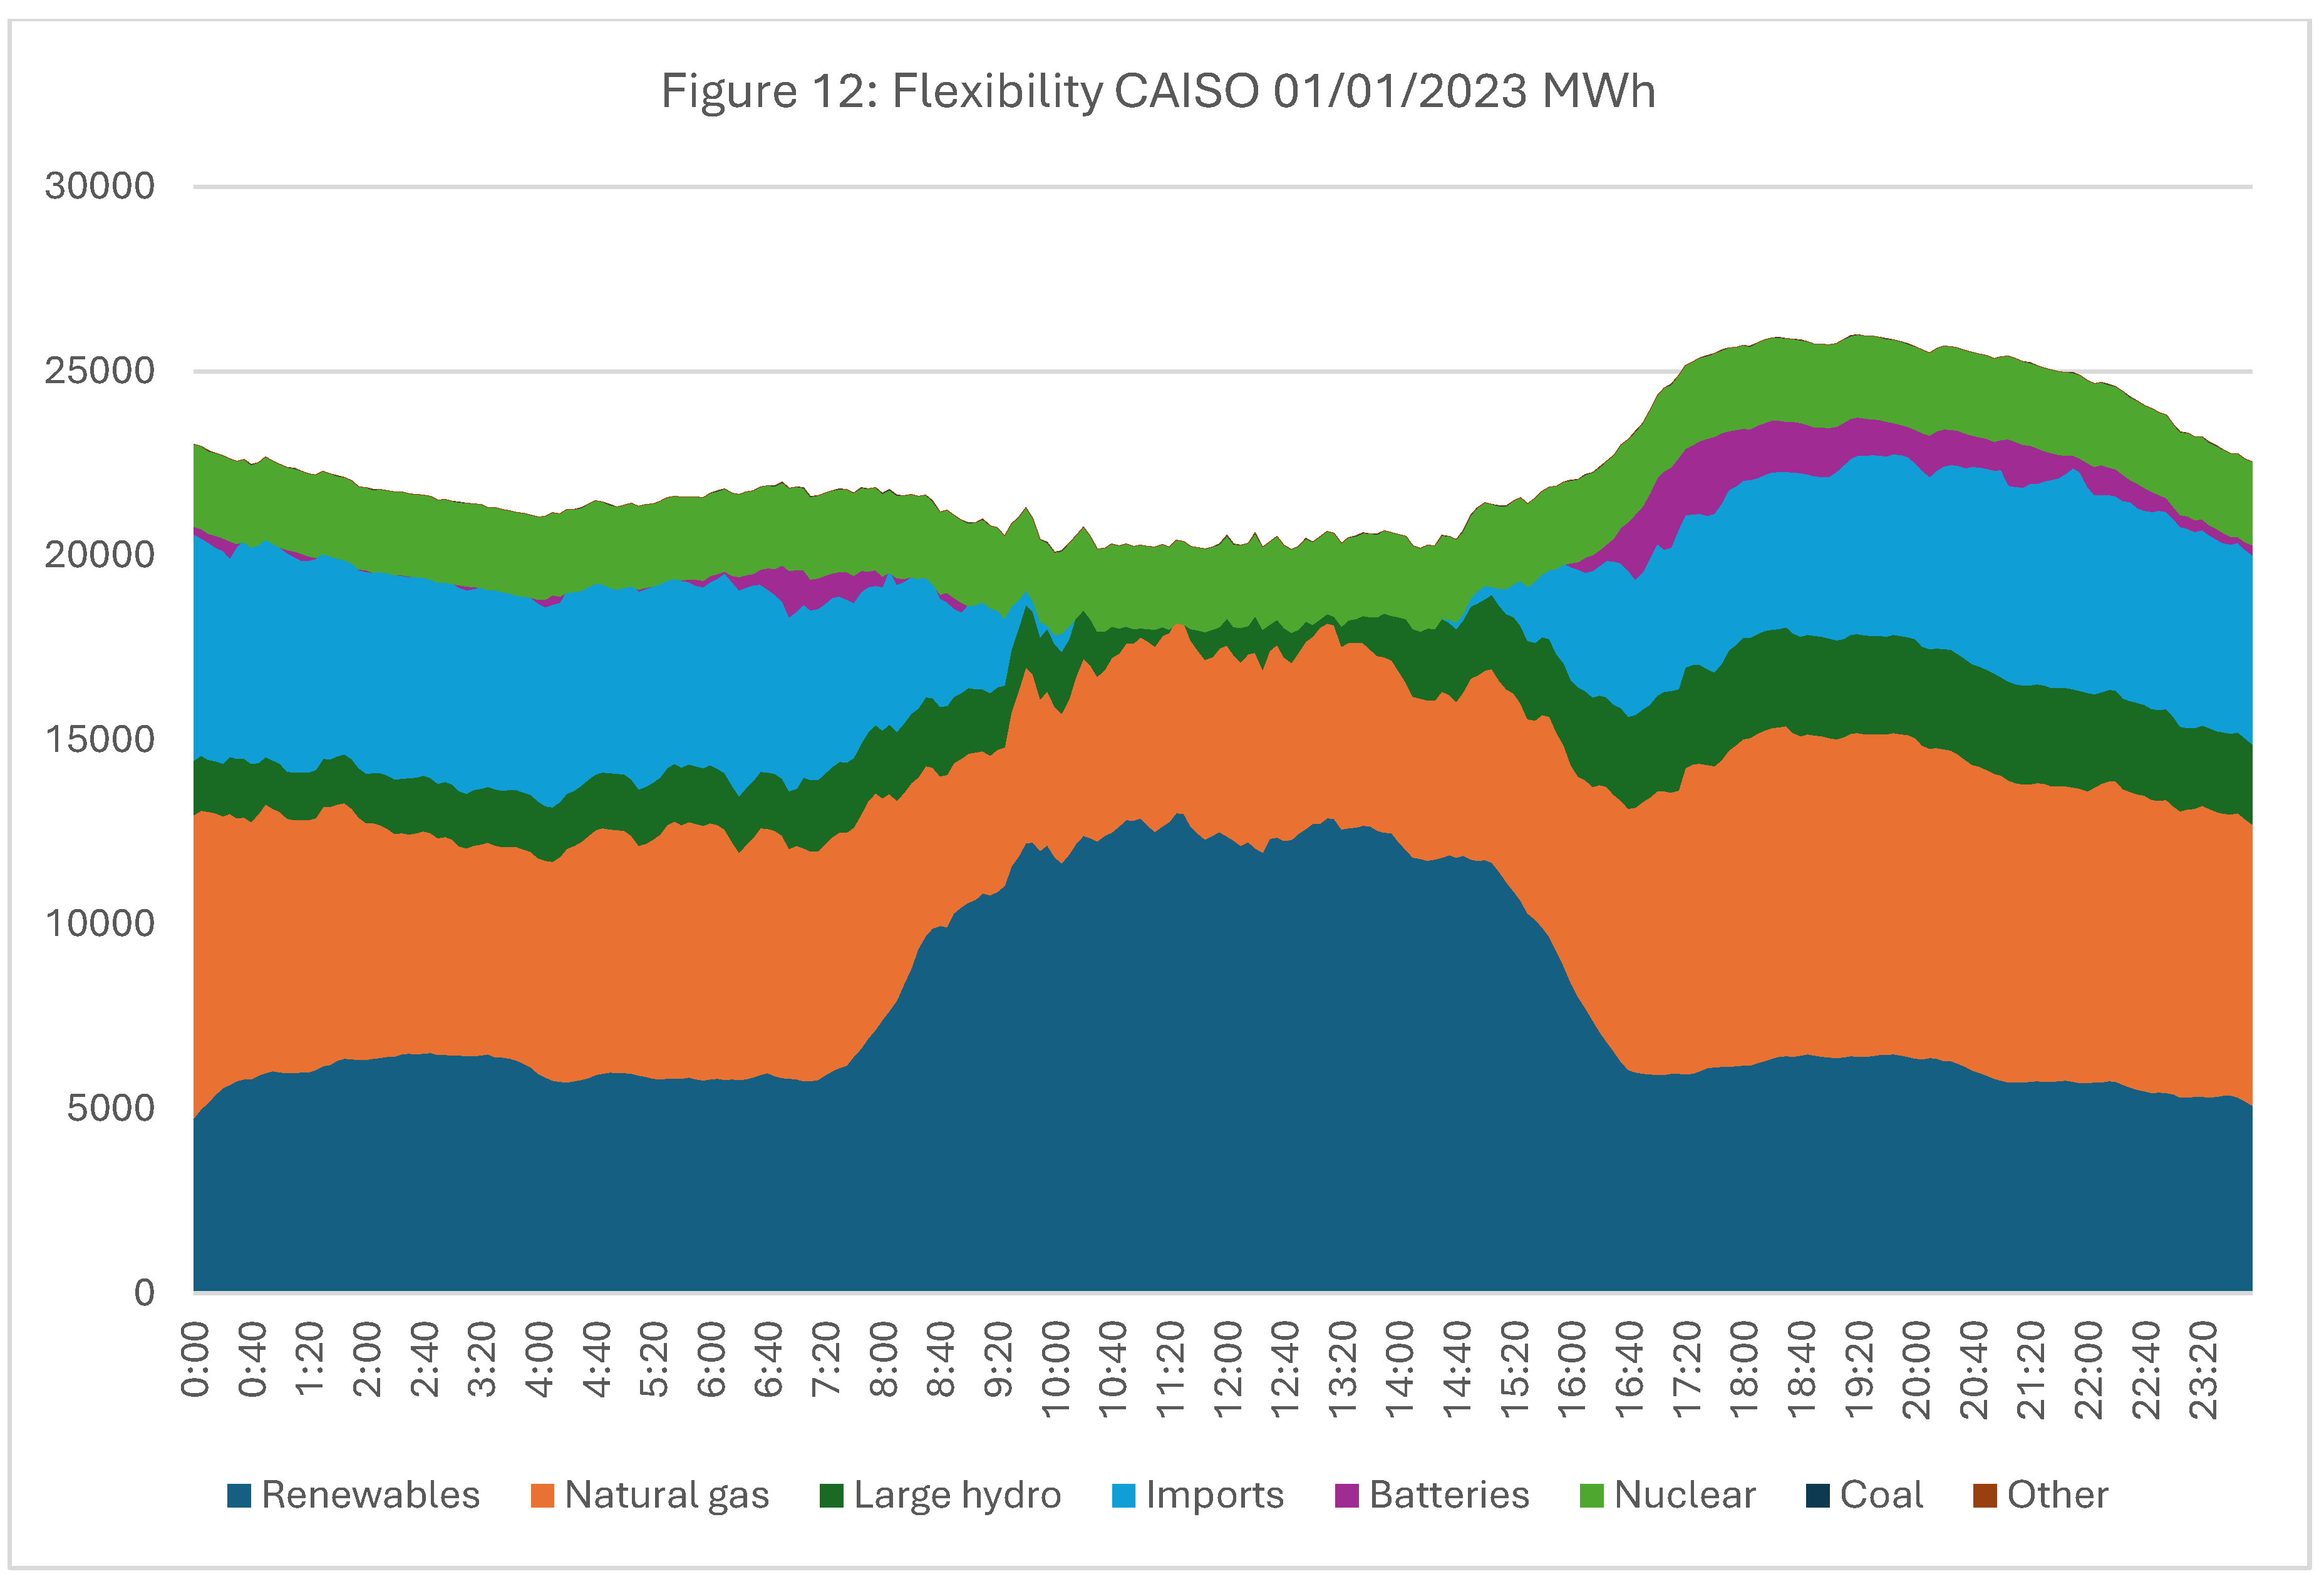
For CAISO, Figures 11 and 12, for January 1st, 2023, depict hourly electricity demand, forecasts, net demand, and flexibility providers by technology.
Source: Figure with open Net Demand 01/01/2023 data from CAISO, US.
CAISO demand has been steadily declining due to the increase in behind-the-meter (BTM) photovoltaic (PV) production, as shown in Figures 11 and 12. In the morning, the electric system faced a ramp-down of 8,000 MW in less than three hours, followed by a ramp-up of 11,000 MW in the evening as PV output decreased. Between 10:00 AM and 7:00 PM, solar and wind supplied an average of 52% of the electricity. These ramping capacity needs are further exacerbated by BTM PV production, which reduces demand during daylight hours, intensifying the need for ramping both in the morning and evening. At peak production, renewable sources like wind and solar can supply more than 65% of market demand.
Source: Figure with open Supply 01/01/2023 data from CAISO, US.
In CAISO, flexibility for ramping up and down is primarily provided by a combination of natural gas power plants, large hydropower, energy imports, and battery storage, as illustrated in Figures 11 and 12. These resources play a critical role in meeting fluctuating demand, particularly during rapid changes in renewable generation.
Fascinatingly, on April 8, 2024, a solar eclipse highlighted contrasting approaches to managing solar generation drops between California and Texas. In CAISO, battery storage systems played the primary role, switching from charging (2.6 GW) to discharging (2.7 GW) to compensate for the roughly 27% drop in solar output (from 14.5 GW to 9.1 GW), while curtailment of excess solar temporarily disappeared. In contrast, ERCOT, which experienced a more severe 94% solar reduction (13.8 GW to 0.8 GW), relied mainly on natural gas generation, which ramped up from 19 GW to 27+ GW. This difference exemplifies broader grid transition strategies: California leverages energy storage charged by excess renewables, while Texas and other regions depend primarily on natural gas for grid balancing.
As Chile, CAISO, and ERCOT cases illustrate, the dependency on conventional FF for flexibility further complicates the transition to a fully RE system, highlighting the importance of developing regulatory frameworks to manage new technologies, electronics, and storage costs efficiently, where ramping requirements with fast-response solutions can have high-levelized costs, impacting the overall economics of the power system [86,87].
Further, the transition from an electromechanical system to an electromagnetic one, especially in a system dominated by Inverter Based Resources (IBRs), indeed requires significant shifts across multiple levels of grid planning, operation, and regulatory frameworks. In electromechanical systems dominated by synchronous machines, conventional FF, or hydropower plants, the inherent physical characteristics of these machines, such as inertia, provide natural stability to the power grid. However, as the energy system integrates more power electronics and digital control through IBRs like solar PV, wind, and battery storage, the traditional methods for ensuring grid stability are no longer sufficient.
The transition towards a more renewable-based energy system highlights the need for a flexible and adaptive power grid. As VRE becomes more prevalent, the role of flexible generation resources, energy storage, demand response, and advanced grid infrastructure becomes increasingly important. These elements are crucial for ensuring grid reliability and resilience in the face of the inherent variability of renewable energy sources. Chile's 2000, 2010, and 2023 figures (Figures 6–10) and CAISO (Figures 11 and 12) vividly depict the significant shifts in the energy mix, emphasizing the growing need for technologies to support and stabilize VRE integration.
Ramping Capability and Risk of Market Power
The energy transition, characterized by increasing shares of VRE sources, leads to greater generation volatility— both anticipated and unanticipated—creating a critical need for technologies with ramping capabilities, much more significant than in systems primarily characterized by FFs, large hydro, and nuclear baseload generation. Units with ramping capabilities, such as natural gas turbines, hydroelectric plants, BESS, diesel generators, and, to a lower extent, coal plants, can adjust output in response to changes in residual demand through scheduled operations, on-the-spot adjustments or as ancillary services (e.g., a faster response such as frequency regulation and spinning reserves). Where demand response and, to some extent, VRE can also provide some of these adjustments. The residual or net demand for ramping and ancillary services that flexible power units and BESS face is the net demand, market demand minus the supply provided by VRE and other inflexible baseload generation or committed supply on the day ahead [88,89,90].18
In this context, flexible units with ramping capabilities can engage in a market where those who are unresponsive to price fluctuations or committed in advance to fixed outputs cannot participate. The elasticity of residual demand for these flexible power units is crucial, where the more significant the need for and the fewer the units capable of providing ramping—especially considering the inflexibility of VRE and other baseload generation—the more inelastic becomes the residual demand, enhancing the market power of flexible power units and BESS. A more significant and inelastic residual demand allows these units to influence market prices more effectively, as the grid has fewer alternatives when adjusting their output. Market power can be enhanced when demand and net demand are highly variable, and a VRE supply is hard to predict, where the influence of flexible power units and BESS can be more impactful on prices. Transmission constraints and conditions affecting demand and power equipment performance can further enhance local market power. Here, regulation is crucial in enabling as many technologies and agents to participate in ramp-following and ancillary services as possible [91].
Overgeneration and curtailment Risk
The increasing share of VRE, supported by economic incentives and limited transmission capacity and ES, introduces the risk of overgeneration and curtailment during high renewable output and low demand. Such conditions have resulted in zero or negative locational marginal prices (LMPs) where excess energy cannot always be immediately utilized. While this market response reflects the underlying incentives schemes and supply-demand dynamics, effective management strategies—including ES, curtailment mechanisms and rules, improved grid infrastructure, and well-designed VRE incentives—are essential to mitigate wasted energy and ensure grid reliability.
In the United States, overgeneration risk is observed, but with regional variations due to the diverse structure of US electricity markets. Some US markets, particularly those with high wind penetration, like the Midwest, have experienced negative pricing during periods of high renewable generation and low demand [92]. The frequency and impact of overgeneration vary significantly across different ISOs and RTOs [93]. Where VRE subsidies, state-level RPS, and federal tax incentives have all played a role in encouraging RE growth and contributing to these market dynamics for utility-scale and BTM solar PV and other RE deployment. According to [94], almost half of VRE generation capacity growth since 2000 is associated with state RPS requirements in the US, and the combined demand for clean electricity from RPS and Clean Energy Standards (CES) policies will grow from roughly 500 TWh in 2024 to 1700 TWh by 2050. Additionally, some markets have implemented or are reforming their AS and capacity markets to ensure sufficient flexible resources are available to manage variability [95].
For example, CAISO has faced significant challenges with the "duck curve" phenomenon, leading to periods of potential overgeneration from solar during midday and steep ramp-up requirements in the evening [96].19 ERCOT has also experienced similar challenges with high wind penetration [97].
In 2023, CAISO faced increased price volatility, marked by a 73% rise in negative prices due to oversupply from growing solar and wind generation, while high price spikes diminished amid milder weather and fewer extreme demand events. Further, in the CAISO and WEIM areas, total downward dispatch in 2023 increased by 9.5 percent and 18.2 percent, respectively, relative to 2022. In both areas, most of the downward dispatch was economic. Economic downward dispatch accounted for about 2,688 GWh (95.5 percent) of curtailment during the year, while self-scheduled curtailment accounted for about 53 GWh (2 percent). Exceptional dispatch curtailments for self-scheduled and economic bid resources remained low at about 2.4 GWh (less than 1 percent). The roughly 70 GWh (2.5 percent) of remaining curtailment came from “other” economic and self-scheduled curtailment.
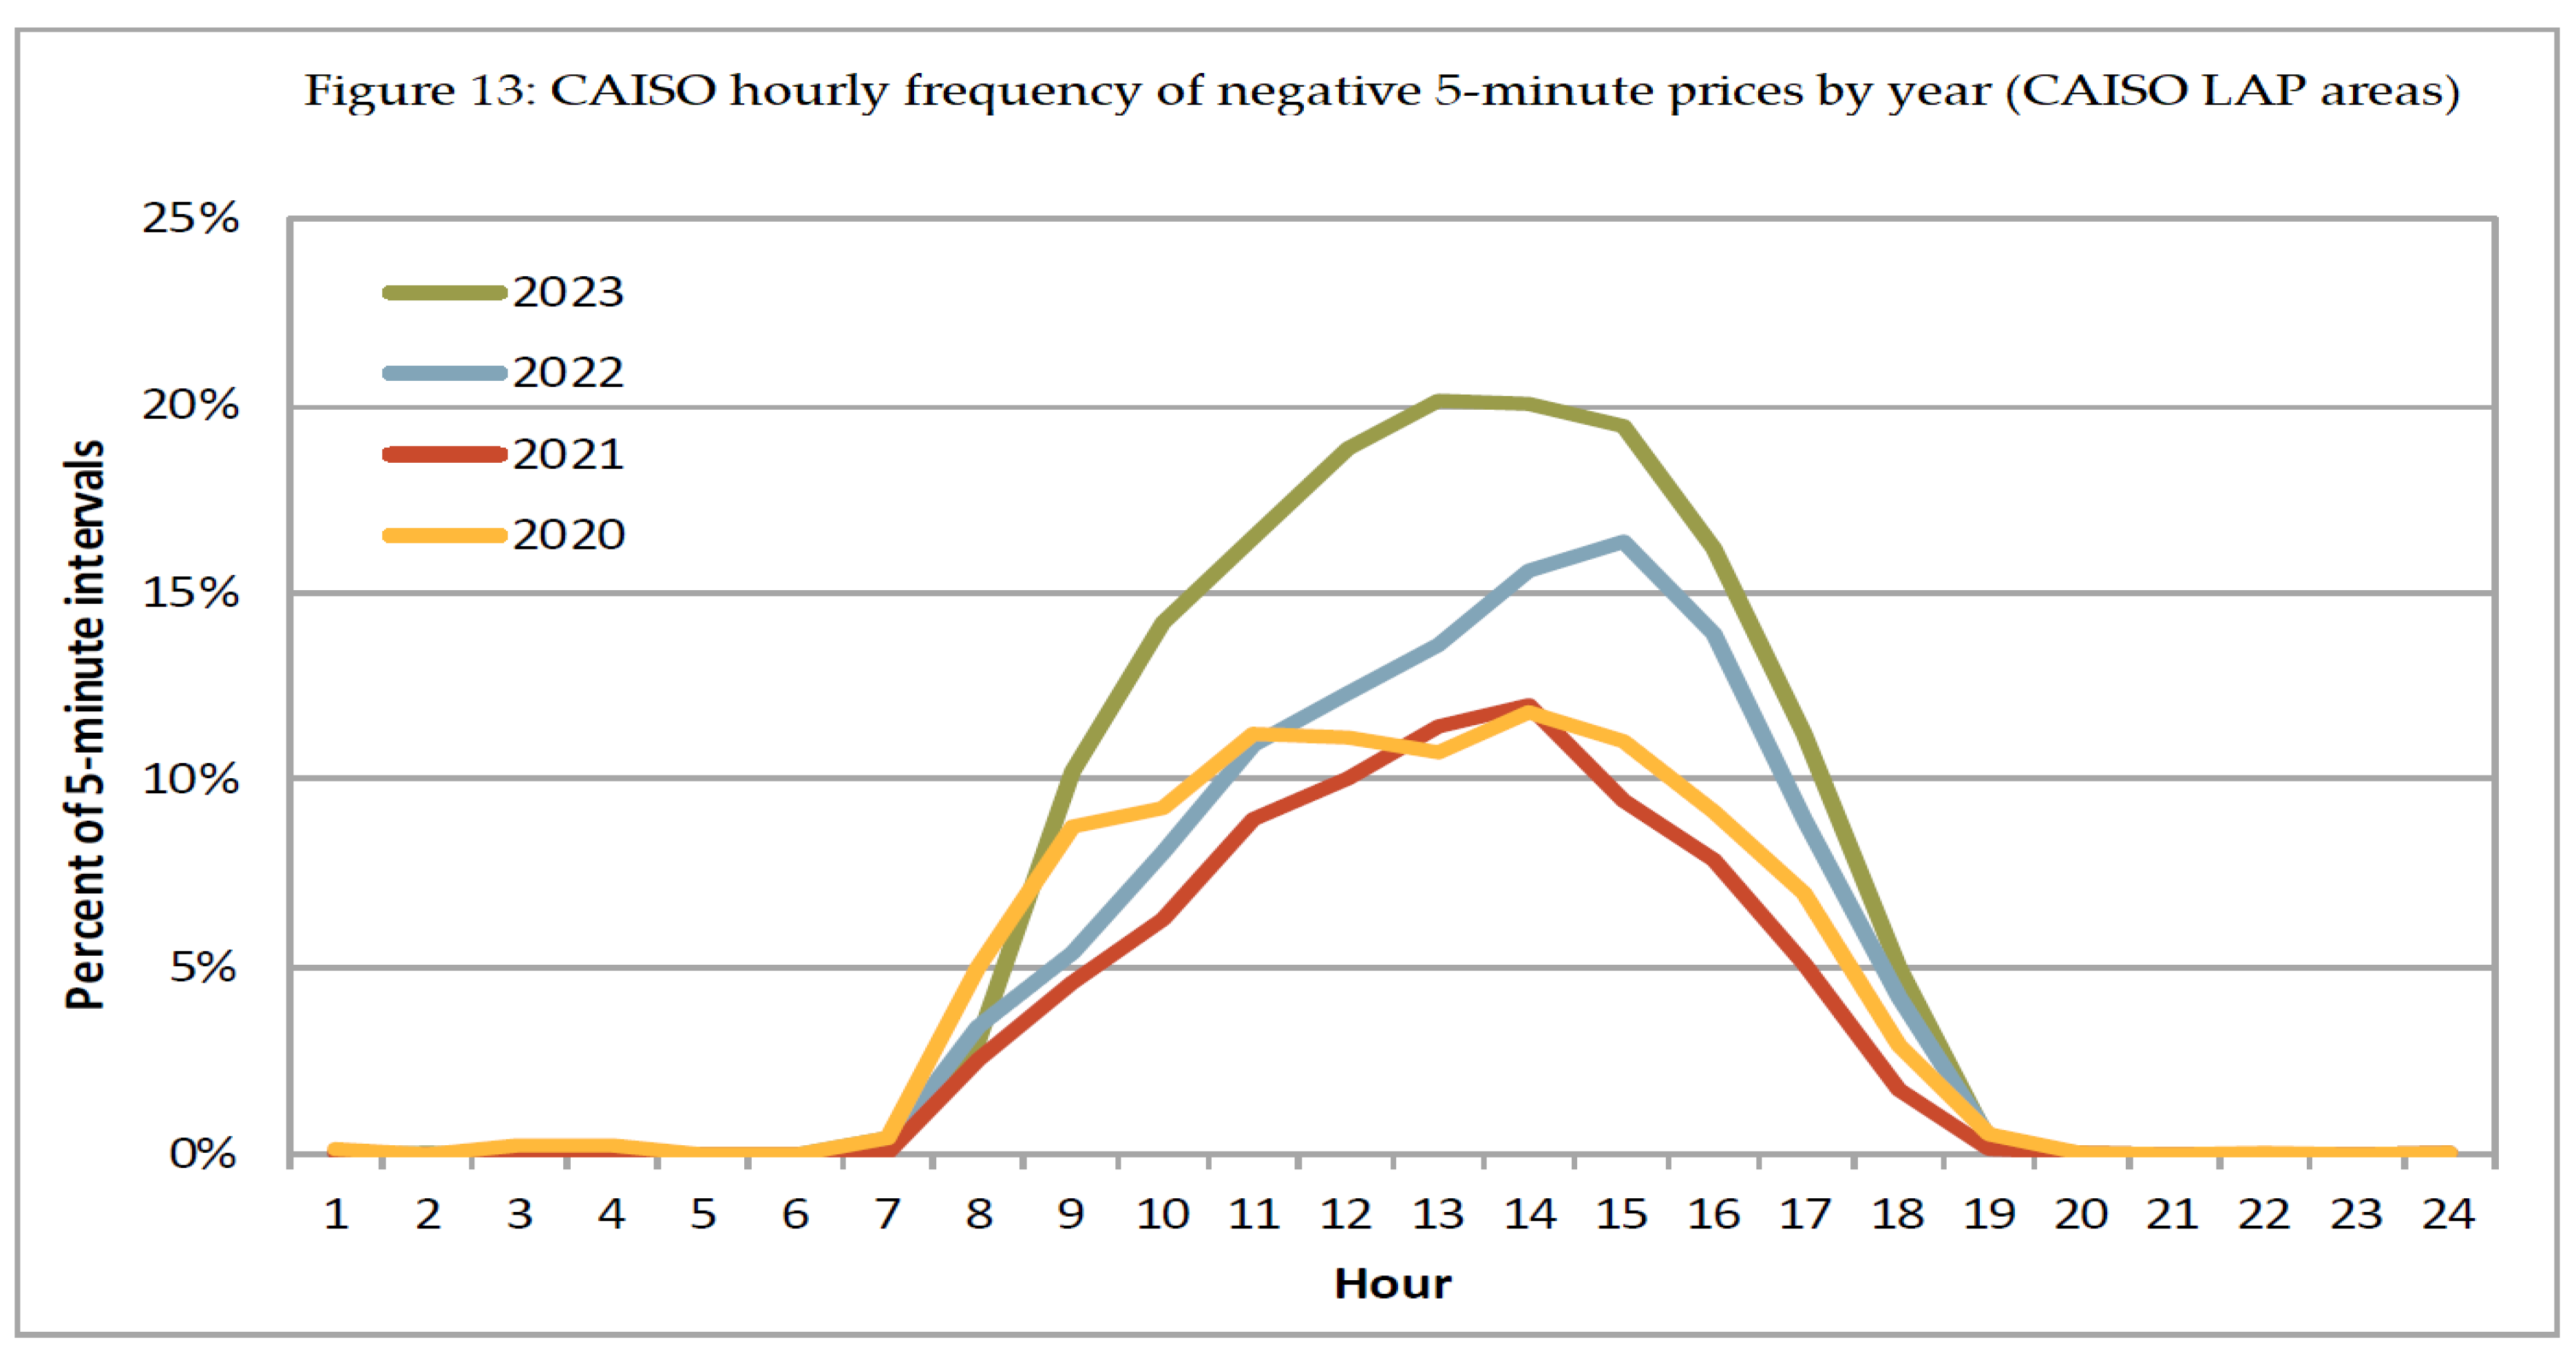
Source: [98] Figure 2.11 from “Annual Report on Market Issues and Performance,” Department of Market Monitoring, CAISO July 29, 2024.
The PJM Interconnection often commits more generation capacity than is ultimately needed, partly due to the Minimum Offer Price Rule (MOPR) and its interaction with the Variable Resource Requirement (VRR) curve in the Base Residual Auction (BRA). The MOPR, designed to mitigate buyer-side market power, establishes a price floor for specific resources, often clearing additional capacity beyond the VRR curve's target. When the MOPR sets the clearing price, PJM procures all resources subject to the MOPR at that price, even if their combined capacity exceeds system reliability needs. To respect lower-priced offers from non-MOPR resources, PJM further commits additional capacity, leading to over-procurement. While this ensures reliability and peak demand readiness, it can result in overgeneration during off-peak periods. During off-peak periods, the excess capacity procured in the capacity market might remain online due to inflexible generation commitments or economic pressures to operate.20 This oversupply can force grid operators to curtail renewable resources (e.g., wind or solar) due to their lack of dispatchability, as thermal generators may have minimum operating thresholds that require them to remain online. Thus, overgeneration pressures market prices downward and may force the curtailment of renewable resources due to their non-dispatchable nature, lack of ES, and transmission constraints, causing economic inefficiencies, such as higher consumer costs and underutilization of committed resources. This dynamic highlight the trade-off between ensuring reliability and avoiding the unintended economic consequences of excess capacity procurement [99,100,101,102,103,104,105,106].21,22
While facing overgeneration risk challenges, US markets have implemented various measures to address these issues, including improved forecasting, more flexible ramping products, and market rule changes to accommodate VRE [107]. Areas with transmission limitations exacerbate local overgeneration problems, particularly in regions with rapid RE growth, such as West Texas and the Southwest Power Pool (SPP) region. Such transmission constraints also affected the implementation and refinement of Ramp Products [108,109,110].
In the European Union, substantial subsidies and support schemes for renewable energy have accelerated the deployment of technologies like wind and solar, increasing the risk of overgeneration [111,112,113,114,115,116,117,118,119]. In 2023, negative hours reached a record 6,870 in European markets, compared to just 569 in 2022—a staggering increase of 1,107% [120]. This overgeneration has led to negative electricity prices or LMPs, particularly when supply from these variable renewable sources exceeds demand. For instance, in Q3 2023 alone, there were 3,064 hours of negative wholesale prices, and in October, a record 1,685 hours of negative prices were observed. While these policies have significantly expanded renewable capacity, they underscore the need for enhanced grid flexibility, improved transmission infrastructure, and energy storage solutions to manage excess supply during high renewable output and lower demand.
In Chile, zero marginal location costs have become increasingly common. While these were once rare occurrences, typically triggered by extreme events like heavy rains leading to the release of water from hydroelectric reservoirs, they have become a regular and daily phenomenon in recent years, particularly in nodes with large installed solar capacity facing transmission constraints. Small energy projects (≤ 9 MW of capacity) benefit from a stabilized price (PE) that often exceeds the locational marginal cost, and they also benefit from having precedence in system dispatch over utility-scale power plants. Also, their revenues are not negatively impacted when there is excess supply. This situation further incentivizes an oversupply and curtailment, dropping local marginal prices to zero, as the Cardones node exemplifies in Figure 14.
Figure 14 illustrates the locational marginal costs for the Chilean SEN electric system on May 26, 2024, at four locations, showing that the Cardones node reaches a zero marginal cost during peak solar PV generation. This reflects overgeneration and transmission constraints that necessitate the curtailment of solar energy. According to [121], these losses amounted to 9.72% of the output from VRE plants throughout 2023, nearly a tenth of their total generation. In the first quarter of 2024, wasted energy surged to more than 18% of the country's wind and solar production. This data underscores the urgent need for storage solutions, grid upgrades to manage surplus power and prevent economic losses, and reassess incentives for future small power plants (≤ 9 MW). However, the timeline for building new high-voltage transmission lines lags the construction pace of renewable generation projects—a critical issue, especially as small power plants face an incentive to flood the market given the PE, which expires in 2034.
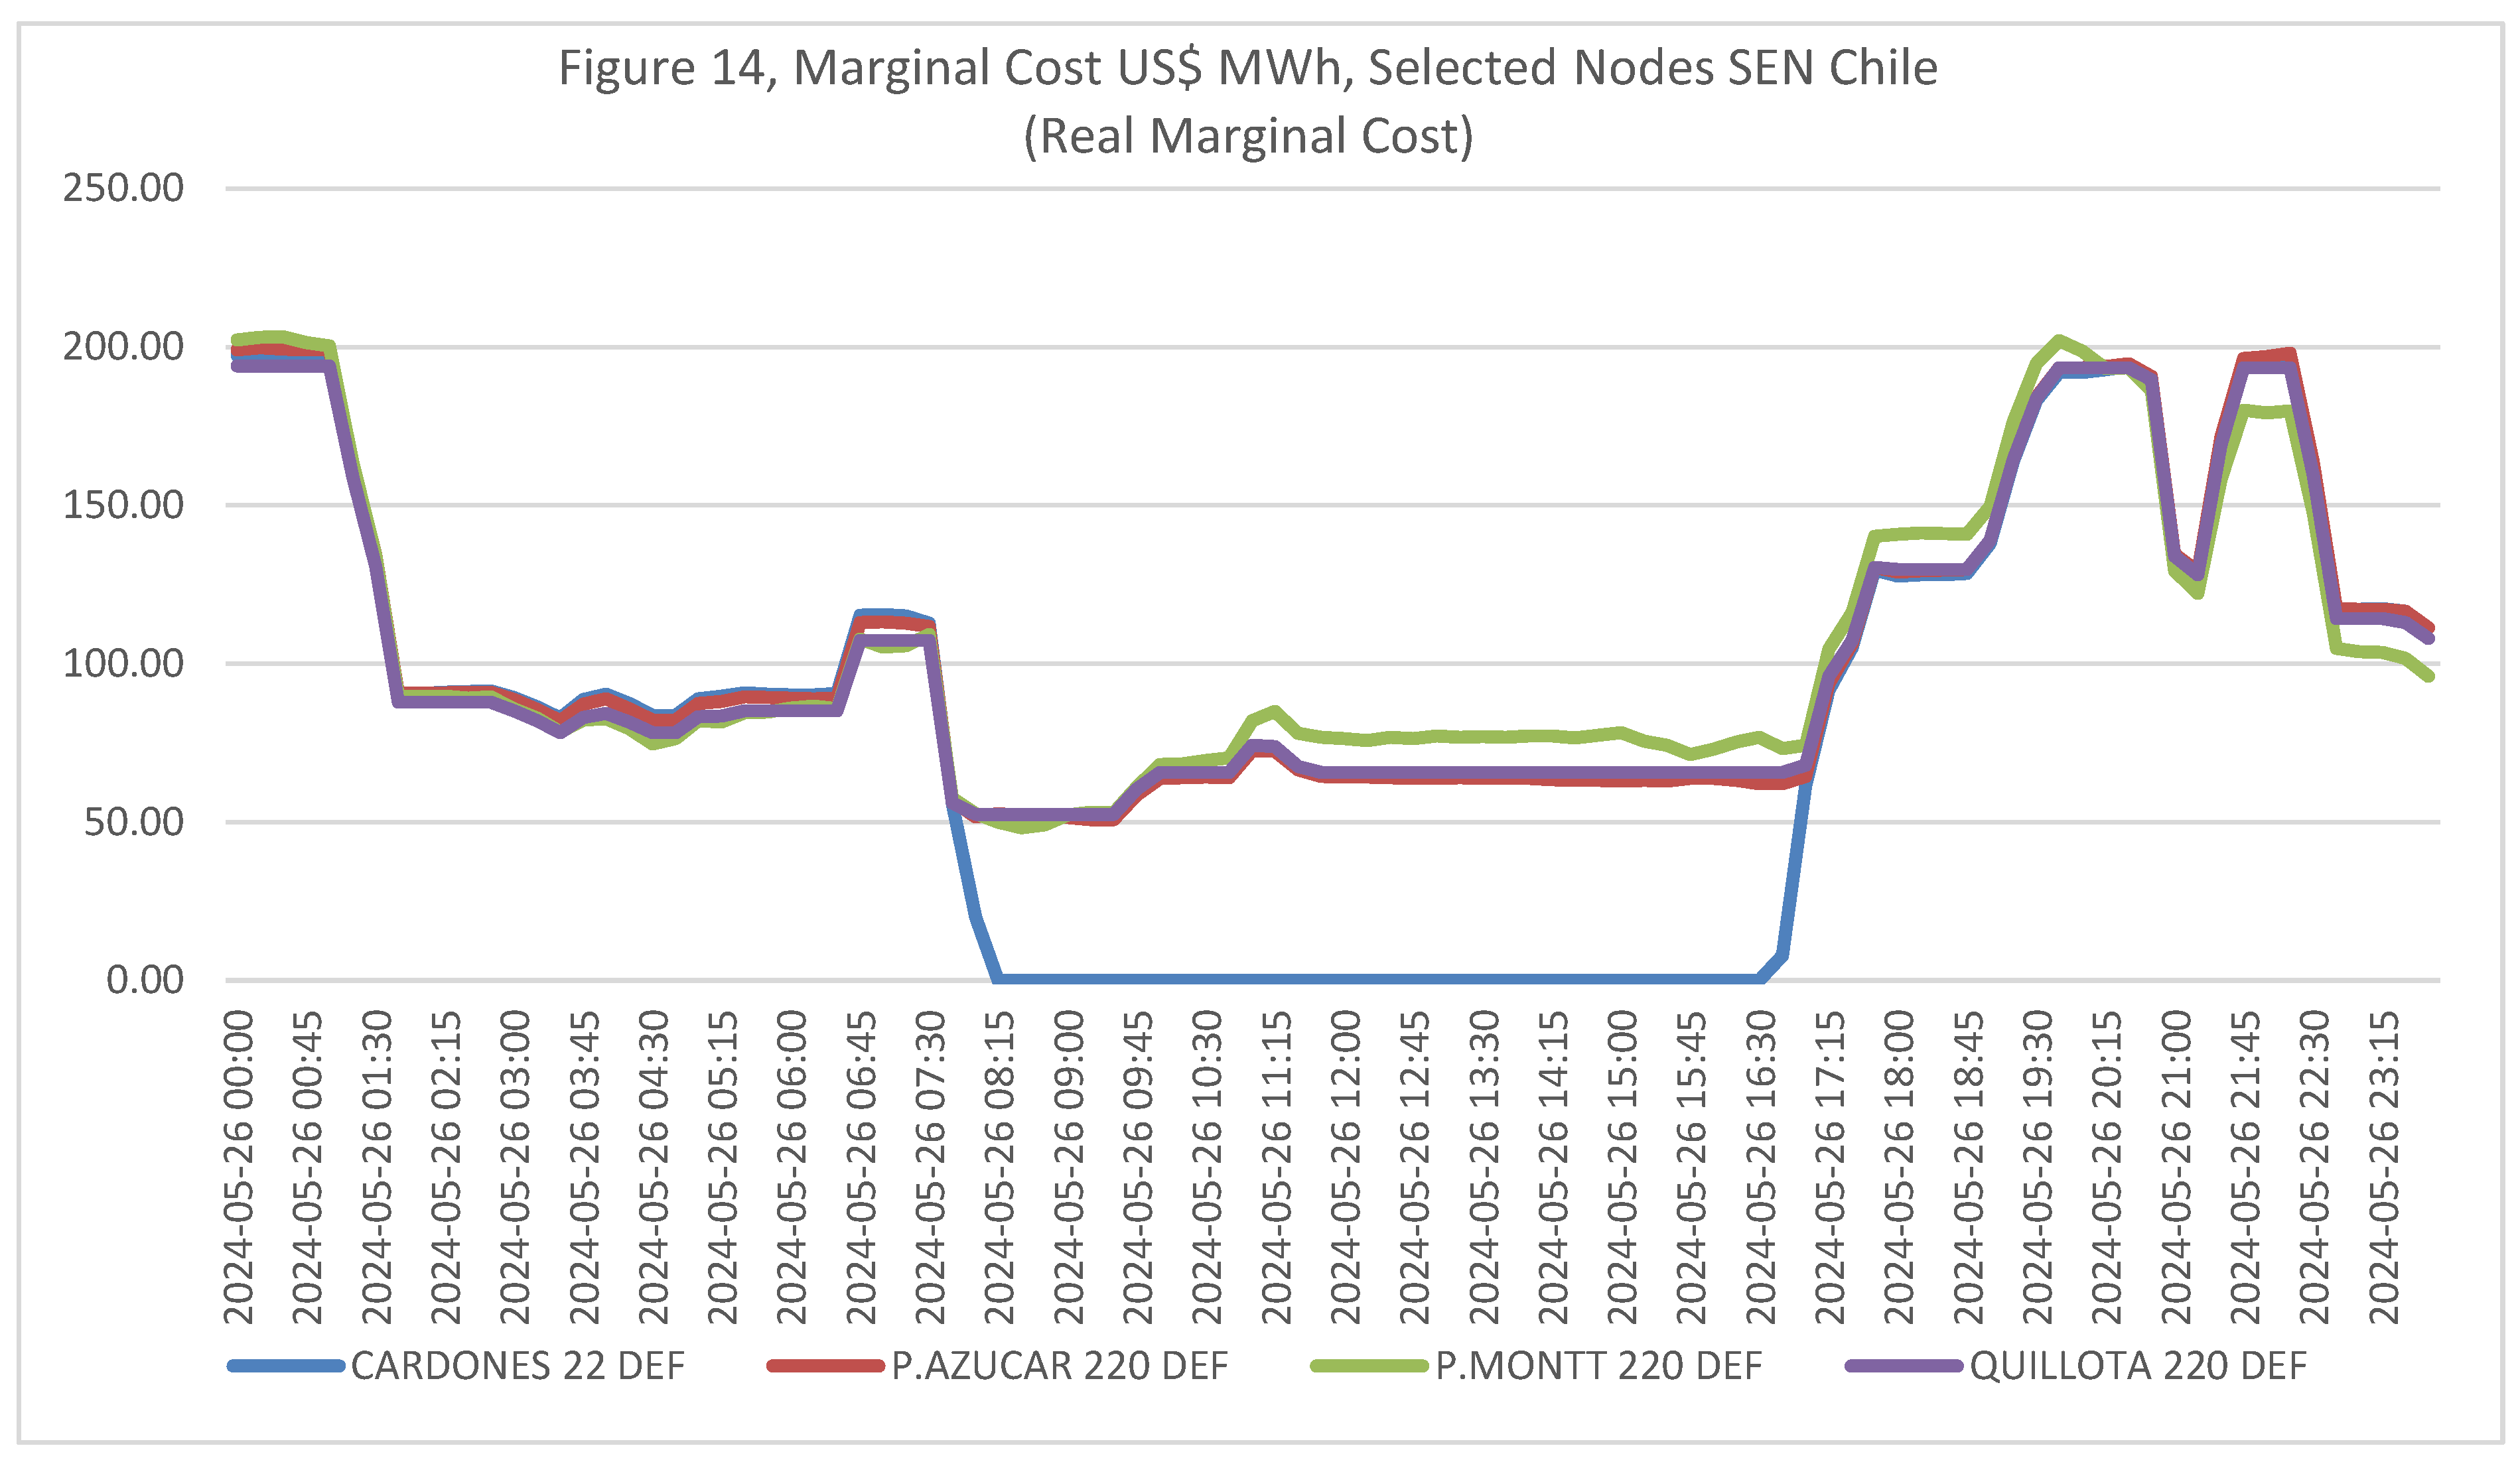
Source: Figure with open data from Coordinador Eléctrico Nacional (www.coordinador.cl), Chile.
These situations in the US, EU, and Chile highlight the global nature of the challenges associated with the incentive schemes and market design when integrating high levels of VRE into electricity grids and markets. They also underscore the need for continued innovation in market design, incentive schemes, grid operations, and energy storage technologies to manage increasing levels of VRE [122].
- Discrepancies within day-ahead and real-time markets
The actual physical operation of balancing electricity supply and demand often deviates from projections made in the day-ahead electricity market. These discrepancies arise from unforeseen shifts in supply or demand conditions that differ from the scenarios anticipated during day-ahead forecasting and market closure. Several factors contribute to these unexpected changes, including the inherent variability of renewable energy resources, the behavior of market participants, the design and mechanisms of the market, force majeure events, and the regulatory framework in place. The market impact of these deviations is influenced by the drivers of supply and demand and their respective elasticities [123], which shape the system's ability to adapt to such fluctuations. Thus, the impact of unexpected discrepancies on the real-time/balancing market depends on the flexibility of demand and supply, the presence of responsive demand-side management programs, the variability of renewable resources, and the effectiveness of market design and regulatory frameworks.
This underscores that forecast precision is vital in enhancing system and cost efficiency. Moreover, the same degree of forecasting error, whether overestimating or underestimating, can lead to unevenly higher operational costs when addressing real-time energy demand [124].
In the case of PJM, which runs a day-ahead and a real-time energy market, with a total installed capacity of 196,380.2 MW as of 31 December 2023, the discrepancies between day-ahead and real-time demand averaged 21,589 MWh in 2023 and 14,818 MWh in 2022, with a median of 22,606 MWh and 15,527 MWh, and a standard deviation of 3,787 MWh and 2,346 MWh, respectively [125]. Thus, on average, day-ahead scheduling was planned for 19% and 14% more generation than what was required in real-time in 2023 and 2022, respectively, which can be influenced by the grid and operational constraints but also the conservative approach of the RPM to prioritize the security of supply.
In the case of Chilean SEN, the ISO centrally plans the dispatch of power plant units based on informed demand commitments and audited marginal costs, with a total installed capacity of 33,831.6 MW as of 31 December 2023, the discrepancies between day-ahead and real-time demand averaged -68.4 MWh in 2023 (against an average planned demand of 9,346.03 MWh) and -103.6 MWh in 2022 (against an average planned demand of 9,448.1 MWh), with a median of -58.3 MWh and -93.1 MWh, and a standard deviation of 267.6 MWh and 268.3 MWh, respectively [126]. Thus, on average, Chilean ISO, contrary to PJM, day-ahead scheduling underestimated the real-time demand by 0.73% in 2023 and 1.11% in 2022, indicating a slight but consistent underestimation of demand in their planning process.
- Chile’s Case Study
Figure 15 for 2023 depicts the disparities between scheduled and actual generation for Chile`s SEN system as a percentage deviation. The deviation between planned and actual generation ranges from a minimum of -15% to a maximum of 13%, with a standard deviation of 2.83, an average of -0.73, a median of -0.62, and a Mean Absolute Percentage Error (MAPE) of 2.23%. Scheduled generation exceeded actual generation by 2,797 hours, while it fell short by 4,294 hours. The bias where scheduled generation fell short of actual generation triggers the operation of fast response units, which in the SEN are typically gas turbines and diesel engines. Which, in turn, triggers high locational marginal costs, influencing the payments for energy transfers between power generators within the ISO.
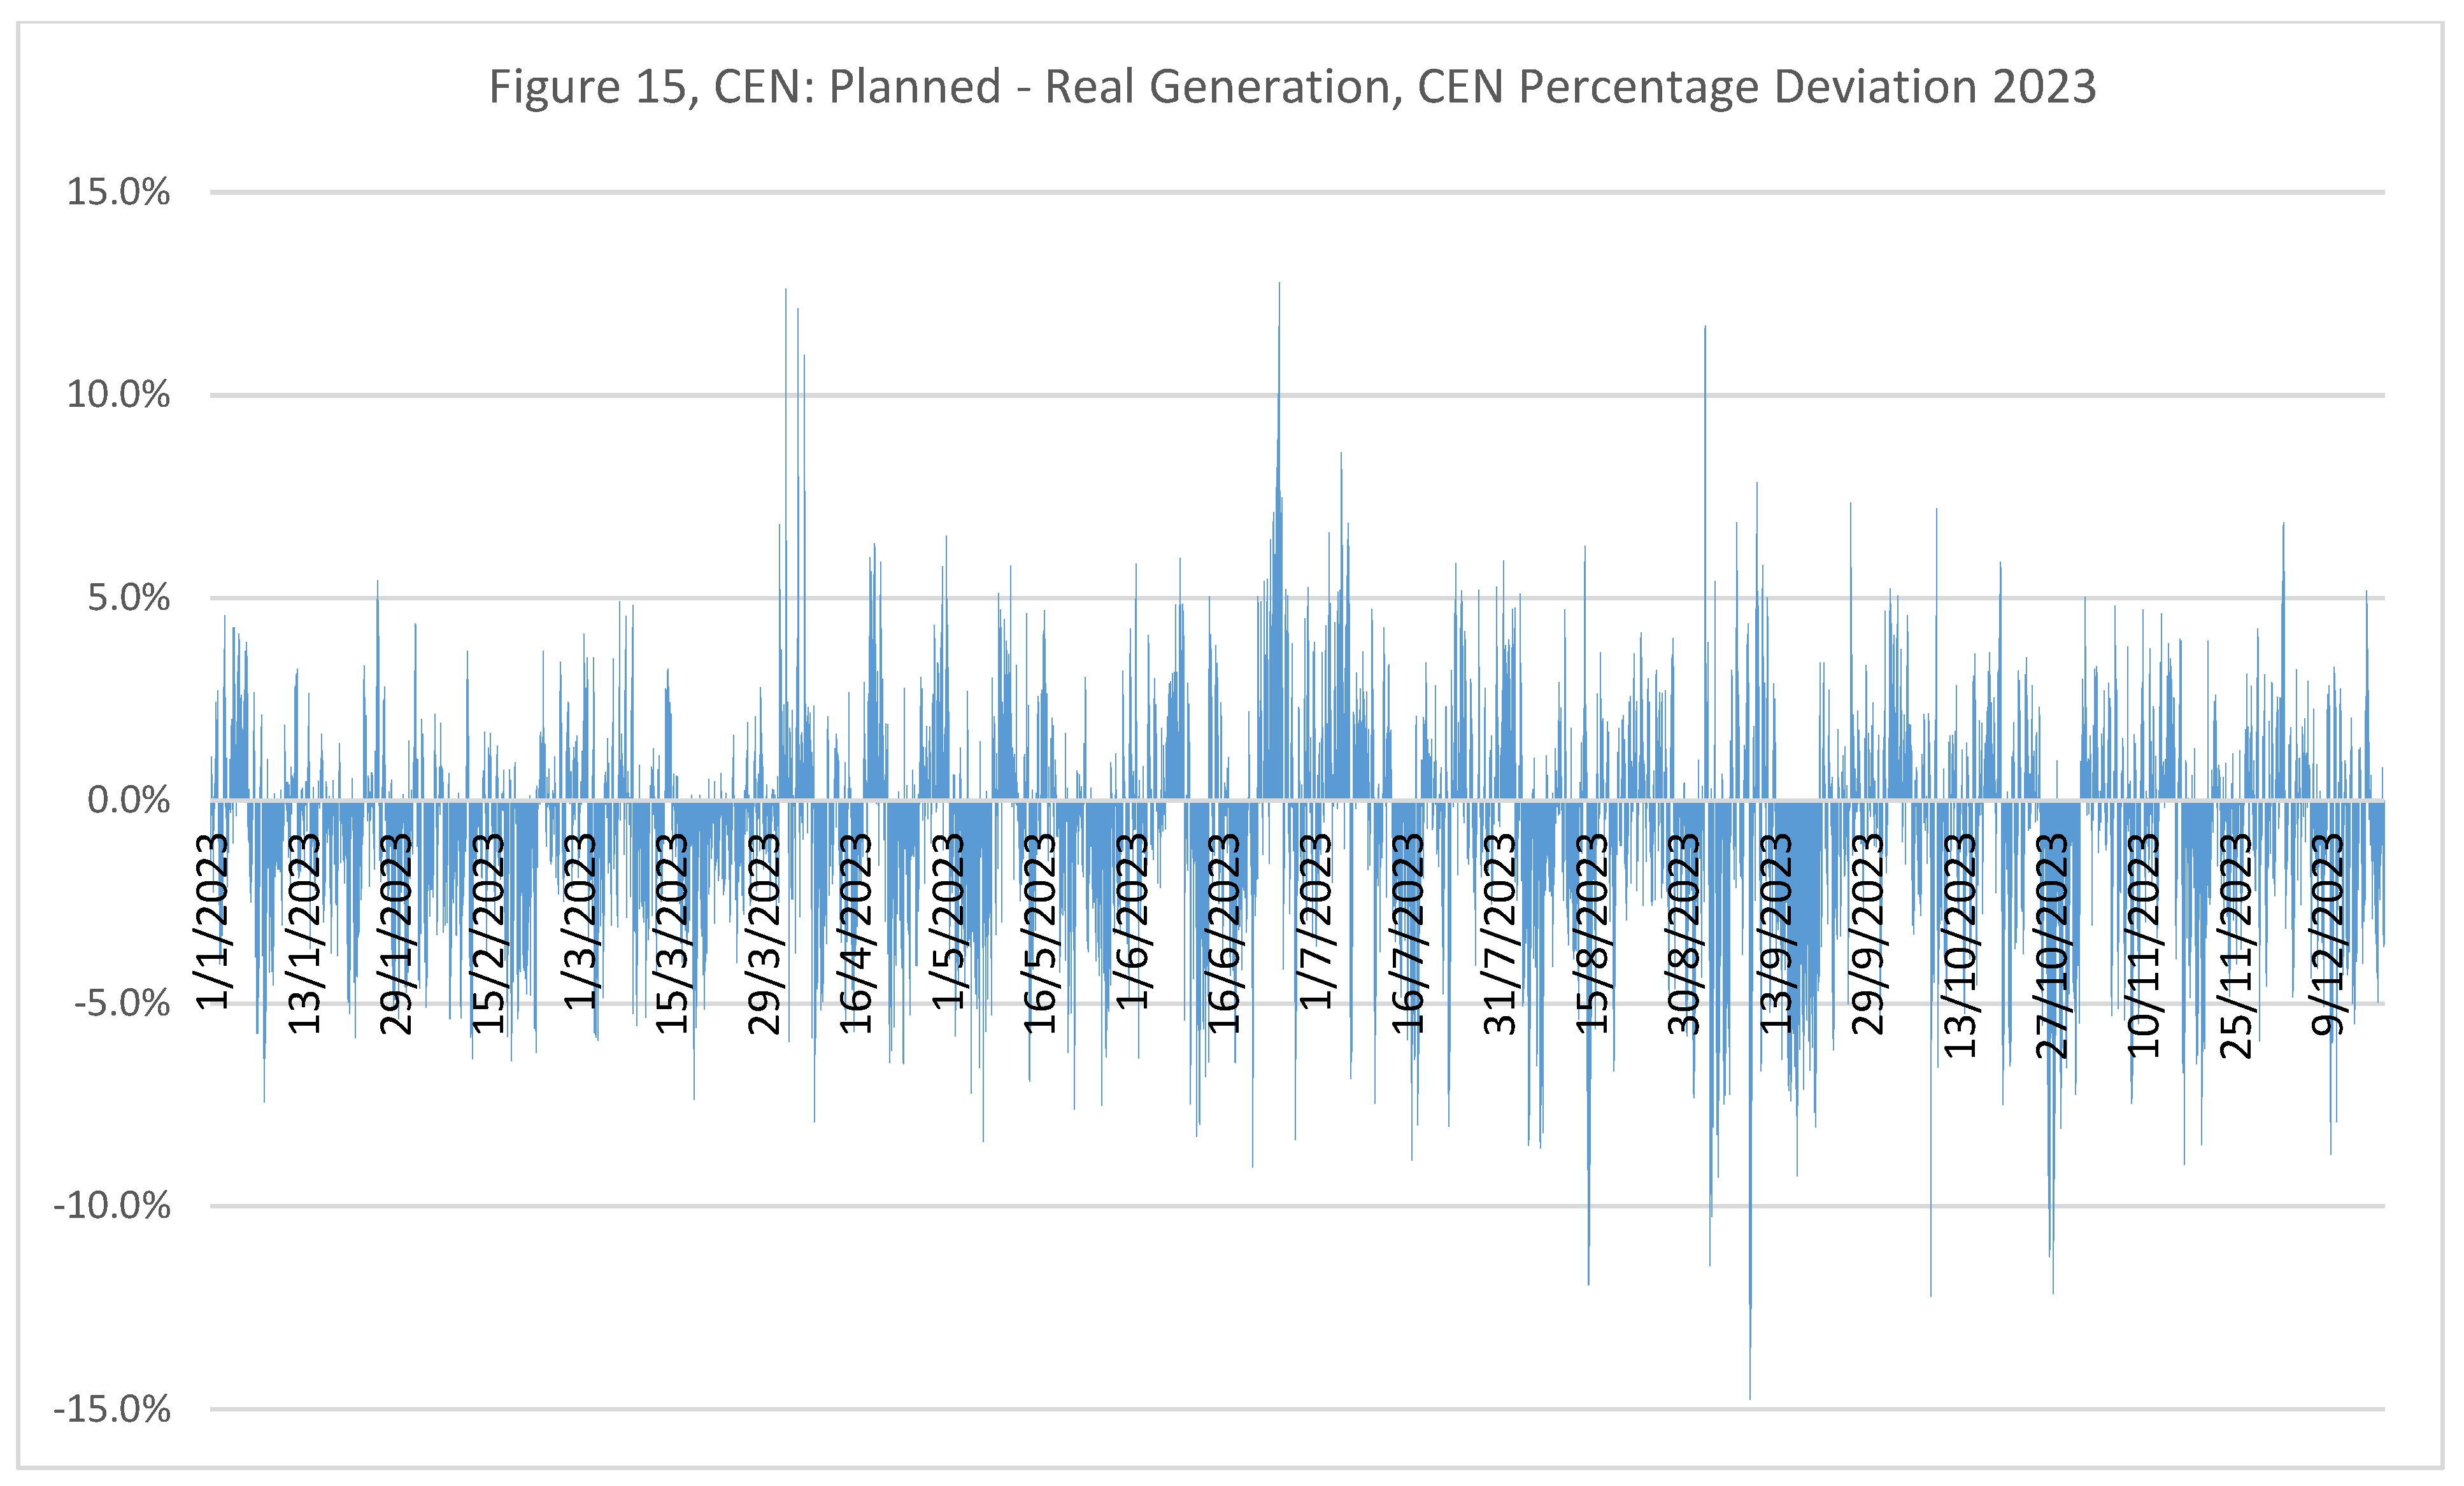
Source: Figure with open data from Coordinador Eléctrico Nacional (www.coordinador.cl), Chile.
For the Chilean SEN system, on May 26, 2024, specifically for the Cardones Node, Figure 16 illustrates the deviation between the scheduled locational marginal cost (USD/MWh) and the actual locational marginal cost (USD/MWh), with discrepancies reaching up to 100%.
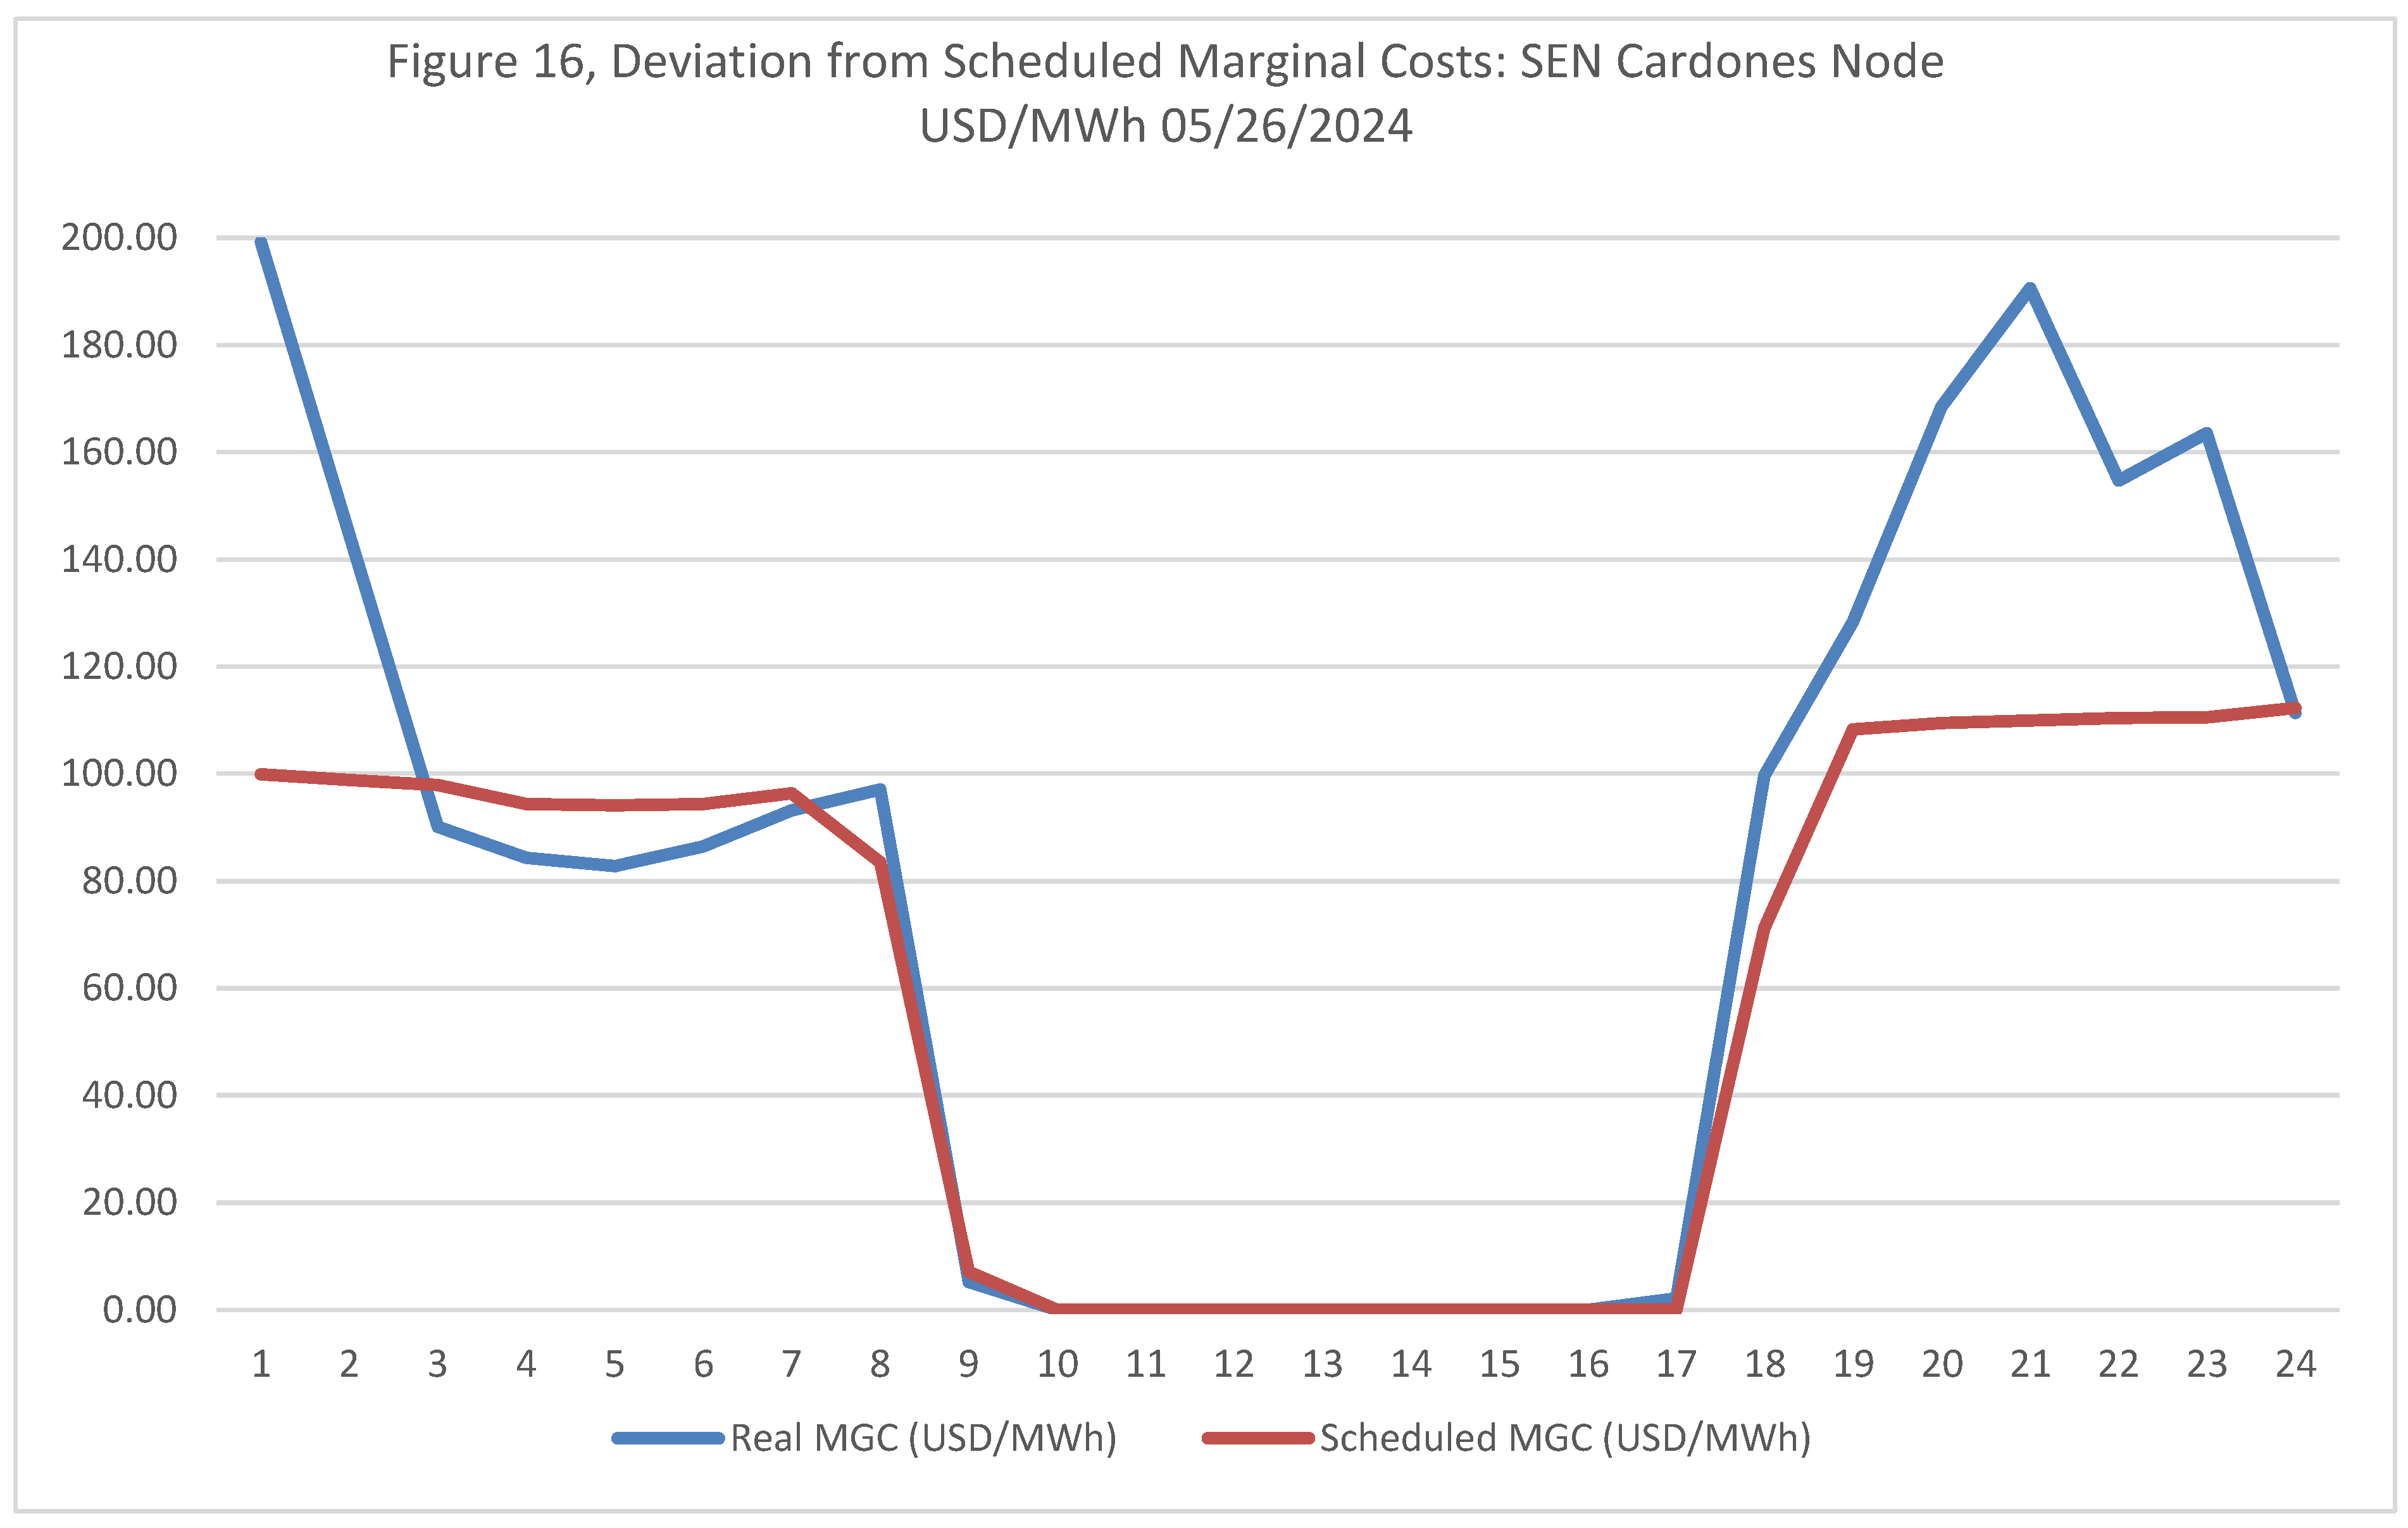
Source: Figure with open data from Coordinador Eléctrico Nacional (www.coordinador.cl), Chile.
In the case of ERCOT, the increasing penetration of wind and solar generation has led to larger swings in real-time electricity prices. As the percentage of wind and solar generation in the electricity mix has increased, price volatility, measured in a 15-minute interval for price changes exceeding +/- $25/MWh, has increased, too [127]. These fluctuations can be further exacerbated by forecast inaccuracies and biases in system operational practices, which contribute to inefficient resource allocation and elevated operational costs.
When ISOs underestimate generation needs, as seen in the Chilean SEN system, fast-response units like gas turbines or diesel engines must be called on demand to maintain grid balance, leading to higher locational marginal prices and increased operational costs. As the share of VRE grows, forecast errors can further heighten the need for flexibility, making it essential for grids to integrate responsive and flexible resources to manage price volatility effectively.
Precise next-day energy demand and supply forecasts ensure that day-ahead scheduling matches real needs, reducing operational costs. However, inaccuracies in forecasts or ISO`s operational practices, either conservative or because of overestimation, underestimating power needs, or force majeure situations, increase operational expenses by causing less or more than the necessary unit commitments. As is in the case of PJM, which conservatively tends to overcommit, or in Chile, where ISO tends to under-commit, requiring costly quick-response units.
In systems with increasing shares of VRE, the transition to renewable energy emphasizes the critical need for advanced forecasting and grid flexibility. ES, DR, and improved market mechanisms with accurate price signals will help ensure stability as renewable adoption continues to rise. Despite improvements in forecasting techniques, uncertainty remains, requiring a flexible and responsive resource mix to maintain system balance. Evolving electricity markets to provide the right incentives and granularity will support a resilient grid with diverse energy sources and services.
4. Implications of Decarbonization for Electricity Market Design
Decarbonizing the electric system involves phasing out CO2-emitting technologies in favor of zero or low-emission technologies aligned with the NetZero goals by 2050. This necessitates the widespread adoption of renewables such as solar and wind, storage technologies, Carbon Capture and Storage (CCS), nuclear, and other low-CO2 emitting technologies in the power sector. Simultaneously, the electrification of transportation and production processes, shifting away from internal combustion engines and other CO2-emitting technologies, will further increase electricity consumption.
This section underscores the multifaceted implications of decarbonization on electricity market design, focusing on how transitioning to a low-carbon power system reshapes market structures, operations, and financial dynamics. Key areas such as day-ahead and real-time markets, capacity and ancillary services, transmission, centralized dispatch, and financial instruments are examined, highlighting the transformative shifts required to support a clean energy future.
- 1)
- Day-Ahead and Real-Time/Balancing Markets: Decarbonization significantly impacts day-ahead and real-time/balancing electricity markets, requiring enhanced flexibility, forecasting, and market design. The variability and uncertainty of increased VRE requires flexible generation, ramping capabilities, and operating reserves, supported by improved weather and climate forecasting for day-ahead planning. However, real-time markets must address persistent uncertainties and risks of overgeneration, where oversupply may lead to zero or negative LMPs. Strengthened transmission networks and innovative technologies like dynamic line ratings can alleviate constraints and optimize renewable integration. The evolving resource mix, replacing baseload FF plants with renewables, DER, storage, hydrogen, and flexible nuclear, necessitates upgraded scheduling, operational, and dispatch approaches. Granular pricing intervals, advanced ICT, smart metering, and control technologies enable markets to better align with system dynamics, balancing flexibility and revenue adequacy. These reforms, coupled with mechanisms to mitigate oversupply and incentivize ancillary services, are essential for integrating high shares of renewables across day-ahead and real-time markets.
- 2)
- Capacity Market: Decarbonization fundamentally reshapes capacity markets, necessitating adaptations to ensure grid reliability and resource adequacy amid increased reliance on VRE and DER. The low marginal costs and weather-dependent nature of VRE stress reserve margins threaten the financial sustainability of conventional power plants, with reduced hours of operation and, as such, leading to higher average energy costs, which require support that can come from capacity market revenues. These markets must integrate emerging resources like ES, DR, and DER while valuing their contributions to reliability. Shorter development timelines for renewables and batteries offer flexibility in capacity procurement but require alignment with the slower expansion of transmission infrastructure. As renewable sources with lower capacity factors replace baseload and FF plants, capacity markets must procure more nameplate capacity and embrace multi-year commitments with updated performance requirements to incentivize flexible and reliable resources. Enhanced forecasting and interregional transmission coordination will be essential for addressing grid bottlenecks and optimizing capacity procurement. Decarbonization’s dual impact—driving up capacity prices due to reduced reserve margins and downward energy price pressures from low-cost renewables—requires holistic market redesigns to ensure revenue adequacy for conventional and emerging technologies, securing grid stability in a low-carbon future.
- 3)
- Long-term Purchase Agreements: Decarbonization significantly reshapes LTPA, making them a part of the equation to secure financing for capital-intensive renewable projects while introducing new complexities. As VRE with zero marginal costs increases, LTPA provides revenue certainty but faces challenges like shorter contract terms due to rapid technological advancements and the risk of stranded assets. Hybrid structures combining RE with ES, hydrogen, or DERs might become more common to enhance flexibility and capacity commitments. Corporate renewable PPA may perhaps increase, expanding access to LTPA. However, evolving risks such as counterparty challenges from utilities with high-carbon assets and pricing pressures from declining clean technology costs necessitate more dynamic agreements, often with renegotiation clauses or price adjustments. Despite these shifts, LTPA remains critical for securing investment in a renewable-focused energy landscape.
- 4)
- Ancillary Services Market: Decarbonization fundamentally transforms ancillary services markets, increasing demand for services like operating reserves, frequency regulation, ramping, and reactive power to manage the variability and dispersion of RE. Faster response times and higher accuracy become critical, necessitating new ancillary services such as capacity synchronization, stability support, and congestion relief. Emerging resources like battery storage, advanced inverters, intelligent appliances, and electric vehicles are poised to play a significant role, requiring smarter grids and operations. Co-optimization of ancillary services and energy dispatch can leverage shared flexibilities, but market designs must evolve to introduce new products and compensation mechanisms for advanced technologies. Prices in ancillary services markets are likely to experience greater volatility, with potential spikes due to flexibility scarcity and the need for faster, more dynamic responses. Significant upgrades in ancillary services markets are essential to ensure system stability and reliability in a high-renewables grid.
- 5)
- Centralized Dispatch System: Decarbonization introduces significant complexity to centralized dispatch systems based on declared marginal costs, as the variability of VRE and DG challenges traditional supply-demand balancing. The predominance of low or zero-marginal-cost resources, coupled with overgeneration risks during periods of high renewable output and low demand, necessitates enhanced curtailment, load flexibility, and revenue mechanisms to ensure financial sustainability. Long-term planning becomes critical for capital-intensive projects like nuclear, pumped hydro, and transmission while managing security constraints and diverse generation profiles, such as DERs requiring advanced algorithms.23 Integrating advanced technologies and additional ancillary services through dynamic auctions will be essential to maintaining system stability. Declining marginal costs and clearing prices in merit-order dispatch systems could undermine conventional generators' revenues, raising the need for innovative capacity and ancillary service procurement strategies. Ultimately, while a centralized dispatch system could coordinate an efficient zero-carbon grid, success hinges on addressing flexibility needs, optimizing marginal costs, and leveraging competitive electricity generation to deliver transparent, dynamic price signals.
- 6)
- Transmission Markets: Decarbonization places unprecedented demands on transmission markets, highlighting their central role in integrating renewable energy and ensuring the energy transition's success. Utility-scale renewables, often sited far from demand centers, require robust and flexible transmission systems to deliver energy efficiently, reduce congestion, and prevent renewable curtailment. However, the rapid deployment of renewable generation outpaces the slower transmission infrastructure development, creating significant bottlenecks and curtailing clean energy's full potential. This disconnect undermines economic viability, exacerbates grid stability challenges, and necessitates sophisticated planning and investment. Modern grids must adapt to bidirectional power flows, integrate DER, and lose the natural inertia from traditional power plants, requiring advanced control systems and AS. Solutions such as grid-enhancing technologies, dynamic line ratings, strategically deployed energy storage, and innovative market mechanisms like financial transmission rights are helping optimize current infrastructure and incentivize investment. Addressing this challenge requires earlier and proactive transmission planning, updated regulatory frameworks for fair cost allocation, and enhanced coordination between transmission and distribution systems. Accelerating transmission development through technical, policy, and market reforms is essential to achieving a sustainable and decarbonized energy future.
- 7)
- Effects of Power Sector Decarbonization on Power Plant Revenues: Decarbonization fundamentally reshapes power plant revenues, creating challenges and opportunities depending on the resource type and market participation. VRE introduces increased market variability, with low or even negative prices during high output periods, reducing traditional FF plants’ revenues as their operating hours decline. Price volatility and regulatory costs, like carbon pricing, further pressure FF plants, which may need to shift from a baseload to a more flexible peaking role with less predictable but higher short-term earnings during low renewable output periods. Capacity markets and ancillary services offer new revenue streams for flexible resources like gas peakers, hydropower, and storage, rewarding their ability to stabilize the grid amidst renewable variability. Renewable plants benefit from LTPA and priority dispatch, but overgeneration risks and curtailment can undermine their earnings without sufficient storage or demand-side flexibility. As storage and DR technologies become cost-effective, competition in capacity and ancillary markets intensifies. Adapting to these dynamics by embracing flexibility, advanced technologies, and new market roles will be essential for sustaining power plant profitability in a decarbonized energy system.
- 8)
- Implications of Decarbonization on financial or derivatives markets and prices: Decarbonization significantly impacts financial and derivatives markets by increasing the demand for risk management tools to address heightened variability and uncertainty in energy output and prices. Integrating VRE introduces sharper price fluctuations, reflected in energy derivatives such as futures and options, which traders and investors use to hedge against market volatility. Capacity derivatives may adjust to shifts in reserve margins and the growing influence of weather-dependent resources. At the same time, AS markets could drive new financial instruments like options or swaps to manage risks tied to grid stability. Transmission congestion, a frequent challenge in renewable-heavy systems, heightens the relevance of instruments like CRRs and FTRs to hedge against localized price spikes. LTPA and its associated financial products could also evolve and be influenced by shifting technology costs and market structures. Additionally, derivatives tied to centralized dispatch systems may reflect the uncertainties of marginal costs and renewable integration efficiency. Decarbonization prompts the development of sophisticated financial tools to manage risks, ensure market stability, and capitalize on emerging opportunities in a transitioning energy landscape.
- 9)
- Emerging Technologies: The transformation of electricity markets necessitates a comprehensive approach integrating cutting-edge technologies and innovative market designs. Artificial intelligence and machine learning [129] can significantly enhance market forecasting and operational optimization, particularly for managing VRE uncertainties and DERs. Digital twin technologies offer crucial virtual simulation capabilities for testing grid scenarios, VRE integration strategies, and market responses.
Blockchain, too, presents transformative potential for decentralizing energy trading and settlement [130], enabling peer-to-peer (P2P) energy trading and Virtual Power Plants (VPPs) [131].24 With widespread smart meter deployment, prosumers—individuals or businesses producing and consuming energy—can directly buy and sell electricity, circumventing traditional utility intermediaries.
Policy frameworks must actively facilitate the integration and aggregation of DERs by adopting adaptive market mechanisms that incentivize grid flexibility, enable local and peer-to-peer energy transactions, implement dynamic pricing models, and establish dedicated local flexibility markets for trading ramping capabilities and load-following resources. Hybrid market structures are essential to achieve this balance, combining centralized reliability with the innovation potential of decentralized systems. Achieving successful implementation requires holistic policy reforms, including comprehensive data-sharing protocols, robust cybersecurity measures to safeguard the system, and incentives to drive innovation and technological advancement.
Pioneering regions in Europe [132,133], Australia [134,135], Japan [136], and the US [137] are making progress in these approaches, highlighting the potential of digital and decentralized technologies to reshape electricity market operations. Policymakers and market regulators must proactively design adaptive frameworks that accommodate technological disruption while maintaining grid stability and advancing sustainable energy transitions.
Blockchain and decentralized energy platforms fundamentally reimagine electricity market infrastructure by shifting from centralized, top-down coordination to a more distributed, peer-to-peer transactional model. This technological innovation enables direct energy trading between producers and consumers, potentially disrupting traditional market operators and grid management systems. The core breakthrough lies in creating transparent, verifiable, and instantaneous transaction settlement mechanisms that allow granular participation from small-scale energy producers like residential solar owners. Real-world examples, such as LO3 Energy's Vermont Green program [138], demonstrate how these platforms create micro-markets that traditional grid systems cannot accommodate, enabling net-metered solar customers to sell renewable energy credits to local businesses. Major energy companies are taking notice, with Energy Web [139,140,141] boasting over 100 partnerships, including industry giants like Tepco, Siemens, Shell, and Exelon. Technologically, this is achieved through blockchain-based ledgers, decentralized operating systems, and innovative consensus mechanisms that ensure network integrity. These platforms address the decentralization of electricity networks, encompassing a wide range of distributed energy resources from smart appliances and climate control systems to residential solar+battery installations and electric vehicles. They envision a networked electricity ecosystem where grid operators, consumers, and diverse energy assets interact and collaborate. While significant challenges remain—including technological scalability, complex regulatory landscapes, and market integration—the growing momentum suggests this represents more than a speculative concept. Instead, it signals a potential fundamental transformation of energy infrastructure, shifting from a traditional top-down, unidirectional utility model to a bottom-up, democratic marketplace that empowers individual actors with greater economic agency, technological flexibility, and sustainability potential.
The European Commission placed the accent on energy security after Russia invaded Ukraine. In March 2023, it proposed significant reforms to the EU's electricity market design to enhance consumer protection, boost renewable energy integration, and improve industrial competitiveness [142]. These reforms were adopted by the EU member states on May 21, 2024, and entered into force on July 16, 2024. A central focus of these reforms is ensuring affordability, reliability, and resilience in an energy system increasingly dominated by VRE. Key measures include enhanced support for Contracts for Difference (CfDs) to stabilize revenues for renewable energy producers and incentivize clean energy investments, alongside promoting PPA to allow industrial and consumer actors to hedge against price volatility while directly supporting capacity expansion. Capacity mechanisms have been refined to align with decarbonization goals, incorporating new flexibility services to address grid stability issues. Cross-border market integration has also been expanded, facilitating the efficient use of renewable resources across the EU and reducing congestion and regional price disparities.
Additionally, the reforms prioritize demand-side flexibility through dynamic pricing and incentivized demand response programs, empowering consumers to participate actively in grid balancing. These measures are complemented by support for advanced grid technologies, such as smart grids and AI-driven forecasting tools, to optimize grid operations. Collectively, these reforms position the EU as a leader in designing electricity markets that balance reliability, affordability, and sustainability, offering a model for regions pursuing similar transitions.
The transition to decarbonization and increasing RE integration fundamentally reshapes electricity markets, catalyzing profound transformations in pricing, resource allocation, and market design. VRE introduces unprecedented price volatility, characterized by complex dynamics of overgeneration (triggering low or negative prices) and subsequent shortages causing dramatic price spikes. This volatility, coupled with DERs, progressively displaces traditional baseload power generation, dramatically elevating the strategic value of flexible resources like ES, DR mechanisms, and fast-ramping generation technologies.
Traditional revenue models are being challenged as conventional power generation paradigms erode. Concurrently, renewable energy sources benefit from sophisticated mechanisms like LTPA, capacity markets, and innovative business models like VPPs. The decentralization of energy production and escalating demand for ancillary services underscore the critical importance of grid modernization, granular pricing strategies, and market designs that leverage emerging technologies.
Market structures are dynamically evolving to balance scarcity pricing—which incentivizes system flexibility—with capacity markets that provide generation revenue certainty. LTPA offers financial stability but potentially limits real-time market responsiveness, creating a complex optimization challenge between long-term predictability and short-term adaptive capabilities. Integrating variable renewable energy, distributed energy resources, and flexibility requirements within centrally dispatched systems presents intricate challenges for grid operators seeking to maintain simultaneous system stability and economic efficiency.
These multifaceted dynamics epitomize the broader transformation of electricity markets, highlighting the intricate interplay between policy incentives, technological innovation, and adaptive market mechanisms in orchestrating a comprehensive transition to a low-carbon energy future.
5. Conclusion
This study explores the transformative impact of large-scale VRE integration on electricity markets, emphasizing the challenges and opportunities posed by decarbonization. The findings highlight the disruptive influence of VRE, such as wind and solar, on traditional market operations, necessitating substantial shifts across technical, economic, and policy domains.
Key insights include:
- Market Dynamics and Flexibility: The variability and uncertainty introduced by VRE challenge traditional market structures, driving a shift toward markets that value flexibility. Resources capable of rapid response, such as energy storage and demand-side solutions, are becoming pivotal in maintaining system balance and reliability.
- Forecasting and Real-Time Operations: Accurate forecasting and responsive real-time operations are essential to bridge the gaps between day-ahead schedules and actual conditions. Improved forecasting techniques are critical to reducing costly system imbalances caused by discrepancies in renewable output.
- Generation Mix and Investment Patterns: A significant transition is evident, with traditional FF-based generation giving way to VRE, ES, and DER. Investment patterns are shifting towards grid modernization and technologies that enable VRE integration.
- Transmission and Overgeneration: Transmission constraints and overgeneration issues are highlighted as critical bottlenecks. Overgeneration leads to curtailment and wasted clean energy, undermining renewable project economics. The study stresses the importance of expanded transmission infrastructure, better integration of storage solutions, and refined renewables incentive schemes to address these challenges.
- Capacity and Ancillary Services Markets: Decarbonization redefines capacity markets, which should prioritize flexible resources like storage and DR over a model designed to favor traditional baseload generators. Ancillary services markets are evolving to address the challenges posed by high VRE penetration, such as frequency regulation, ramping, and voltage support.
- Economic Dynamics and Policy Focus: The transition to VRE has implications for investment costs, Levelized Cost of Electricity (LCOE), and system costs. Policymakers must incentivize clean energy adoption, encourage energy efficiency, and support the adoption and research into emerging technologies while addressing the system`s costs, the public good nature of energy security, and system flexibility.
- Financial Markets and Instruments: VRE variability underscores the importance of financial tools like LTPA, carbon pricing, and derivatives for managing risks and stabilizing revenues. These instruments and the adoption of new technologies, like Blockchain and Smart Contracts, will play a growing role in adapting to the evolving electricity market landscape.
Concluding Implications:
The study emphasizes the critical need for updated market designs, regulatory reforms, and infrastructure investments to support a VRE-dominated system. Enhanced forecasting, greater system flexibility, and optimized transmission planning are essential to ensure reliability and economic efficiency. It highlights the evolving roles of capacity and ancillary services markets, as well as financial instruments, in addressing the challenges of integrating VRE while maintaining system stability.
Economically, decarbonization disrupts traditional market structures with increased price volatility, necessitating granular pricing mechanisms and incentives for flexibility. Financially, the shift directs investments toward clean technologies, energy storage, and grid modernization, with greater reliance on financial instruments like derivatives and LTPAs to mitigate risks and stabilize revenues. Legally, contract frameworks must adapt to address curtailment risks, enhance financial stability for energy producers, and include flexible pricing and renegotiation mechanisms to align with dynamic market conditions. Capacity market agreements and ancillary service contracts should clearly define flexibility and reliability obligations, especially for hybrid resources like storage-integrated renewables.
The study also calls for innovative legal frameworks to support emerging technologies, such as blockchain-based smart contracts for peer-to-peer energy trading, ensuring regulatory compliance and efficient dispute resolution. Together, these economic, financial, and legal transformations underscore the need for cohesive strategies to facilitate a stable, sustainable, and equitable energy transition.
Funding
This research received no external funding.
Data Availability Statement
No new data were created or analyzed in this study, and all data used can be found in the cited references. Data sharing is not applicable to this article. The original contributions presented in this study are included in the article/supplementary material. Further inquiries can be directed to the corresponding author.
Acknowledgments
Previous versions of this paper were presented at the 9th ELAEE, Latin American Meeting on Energy Economics: "Energy Transition, Latin American Energy Markets and Development Paths: Decarbonizing the World Economy," Pontifical Catholic University of Rio de Janeiro, Rio de Janeiro, Brazil, July 28 to 31, 2024; the 45th IAEE International Conference “Energy Sustainability, Security, Efficiency and Accessibility in a Time of Transition,” Boğaziçi Üniversitesi, Istanbul, Turkey, 25 - 28 June 2024; and Energy & Resources Law Association Annual Conference “Navigating the Critical Path: Charting Excellence in Energy and Resources Law,” The Westin, Brisbane, Australia, 16-18 October 2024. Thanks for the valuable comments from the participants at these events.
Conflicts of Interest
The author declare no conflicts of interest.
| 1 | Global greenhouse gas emissions can also be broken down by the economic activities that lead to their production: 25% is from electricity and heat production, 14% from transport, 6% from residential and commercial buildings, 21% from industry, 24% from agriculture, forestry, and other land use, and 10% from other energy uses. |
| 2 |
In the US the concept of Independent System Operators (ISOs) emerged in response to Orders Nos. 888/889, from 1996, where the Federal Energy Regulatory Commission proposed it as a means for addressing the need to provide non-discriminatory access to transmission within existing tightly integrated power pools. Following this, Order No. 2000, from 1999, encouraged the voluntary establishment of Regional Transmission Organizations (RTOs) to oversee the transmission grid regionally across North America, encompassing Canada. Order No. 2000 outlined twelve specific characteristics and functions that an entity must fulfill to qualify as a RTO.
RTOs play a role similar to ISOs. Both ISOs and RTOs emerged in the US following the restructuring of traditionally vertically integrated utility companies. Their autonomy is crucial for ensuring reliable system coordination, efficient market operations, transparent planning, and impartial access to the grid, eliminating conflicts of interest.
Notable examples of ISOs/RTOs in North America include:
|
| 3 | Financial instrument or derivatives in the electric industry are contracts which derive their value from an underlying financial asset, commodity, index, market metric, or other measurable event like a weather or climate event. In the electricity sector, derivatives include forwards, futures, swaps, options, securities and insurance based on electricity prices. |
| 4 | The day-ahead market operates through a daily blind auction, where market participants submit locational orders to buy or sell electricity for each hour of the next day. This auction matches supply and demand to determine a locational market clearing price. The intraday market allows for continuous trading, enabling adjustments closer to the delivery time, enhancing flexibility. Both markets are integrated across European borders. Clearing houses ensure the fulfillment of transactions, mitigating counterparty risks and ensuring secure, reliable operations. |
| 5 |
Australian Energy Market Commission (AEMC) (2023). In the Australian electricity market, where generators submit locational offers indicating the price and quantity of electricity they are willing to produce over 5-minute intervals to the system operator, Australian Energy Market Operator (AEMO). AEMO runs the security-constrained economic dispatch model every 5 minutes to determine which generators will be dispatched in merit order from lowest to highest offer price to meet forecast electricity demand over the next interval. The objective is to meet demand reliably at least cost. There are five regions corresponding to state boundaries, each with its own regional reference node for pricing purposes. For financial settlement purposes, the 5-minute dispatch prices are averaged to form a 30-minute spot price that all generation in each trading interval receives. While the 5-minute dispatch prices are location-specific, the 30-minute spot price used for financial settlement may be aggregated to a regional level. This centralized dispatch process relies on generator offers that reflect their short-run marginal costs of supplying the next increment of electricity to the grid. By coordinating generator dispatch decisions every 5 minutes based on their economic offers, AEMO aims to meet demand at high efficiency and low prices.
On September 2021, AEMC implemented the rule which transition the settlement interval for the electricity spot price from 30 minutes to five minutes. This adjustment was aimed to offer a more precise signal regarding the value of investments in fastresponse technologies, including batteries, emerging gas peaking plants, and demand response strategies.
|
| 6 | Generators submit bids and offers based on their short-run marginal costs into the Nord Pool day-ahead and intraday markets. Based on supply and demand fundamentals, Nord Pool calculates hourly market clearing prices for the following day. |
| 7 | In 2003 launched hourly and, half-hourly day-ahead and real-time markets, where the price of electricity in the wholesale electricity market changes every half-hour. |
| 8 | Over the past decades the provinces of Alberta and Ontario have undertaken varying degrees of deregulation within their electric industries. Although both provinces maintain electricity markets, notable distinctions exist between their respective systems. in Alberta, the competitive landscape is prevalent in the generation sector, while transmission and distribution operate under rate regulation. On the other hand, Ontario employs a hybrid model where the Ontario Power Authority, now consolidated with the IESO, manages functions such as contracting for supply, integrated system planning, and regulated pricing for a substantial portion of Ontario's generation and load. |
| 9 |
Seven Regional Transmission Organizations (RTOs) operate wholesale electricity markets in the United States:
Of these, only ERCOT remains fully under state jurisdiction, as its footprint is contained within Texas. The other six RTOs fall under Federal Energy Regulatory Commission (FERC) oversight.
|
| 10 | In the US, currently, four out of the seven RTOs - MISO, PJM, NYISO, and ISO-NE - administer capacity markets through their footprint. These markets secure future resource adequacy commitments to meet peak demand forecasts. The other three RTOs (CAISO, SPP, ERCOT) fulfill capacity needs through alternative mechanisms and do not operate formal capacity market constructs. |
| 11 | Decreto Supremo No. 70 of 2023 (DS 70) from Ministerio de Energía [35], introduced relevant changes in the recognition and compensation of energy storage systems and hybrid plants with storage capacity. Among the most important modifications, a methodology was incorporated to evaluate and recognize the power capacity of stand-alone energy storage systems, and rules were established to determine payment for capacity specifically for renewable energy plants equipped with storage capacities, and the availability of data and studies was improved to more accurately identify the peak hours that determine the calculation and payment for capacity. |
| 12 |
Reliability Markets:
|
| 13 | The State of Hawaii Public Utilities Commission oversees four electric utility firms involved in generating, acquiring, transmitting, distributing, and selling electric energy within the State. Hawaii's six primary islands operate independent electrical grids without interconnection. Together, HECO, MECO, and HELCO are collectively referred to as the "HECO Companies" and cater to approximately 95% of the State's population. KIUC, situated on Kauai, serves the remaining 5%. Notably, the islands of Niihau and Kahoolawe lack electric utility services. |
| 14 | As of December 2023, the national electric system, Sistema Eléctrico Nacional (SEN), has an installed capacity of 33,831.6 MW. 62.7% of the installed capacity corresponds to renewable sources (21.9% hydraulic, 26.4% solar, 13.7% wind, 2.2% biomass, and 0.3% geothermal), while 35.1% corresponds to thermal sources (11.0% coal, 15.7% natural gas and 8.4% oil). |
| 15 | The Committee for Economic Operation of the System (Comité de Operación Económica del Sistema Interconectado Nacional, COES SINAC) is the ISO responsible for coordinating dispatch, managing transmission, and operating wholesale electricity markets. For the most part, Peru relies on marginal cost-based economic dispatch of generation resources to meet electricity demand efficiently. Generators submit information on availability, technical parameters, and short-run marginal costs to COES for the unit commitment and dispatch processes from one day ahead to real-time. Some spot energy and capacity and ancillary services markets provide revenue streams for generators based on marginal costs and auction clearing prices. |
| 16 | For example, as of May 2024, the Chilean electricity system SEN had a total of 1,008 electricity generating plants. Of these, 740 were defined as small distributed generation facilities (with a capacity of up to 9 MW), with an average installed capacity of 3.2 MW. And this is without counting micro installations behind the meters, such as solar PV rooftop installations, which in the case of Chile are still in their infancy. As a reference, in 2010 the power system had about 150 units. |
| 17 | Start-up Costs refer to the expenses incurred to bring a power plant from a non-operational state to an operational state; Shut-down Costs refer to the costs associated with ceasing the operation of a power plant and transitioning it to a non-operational state; and wear and tear costs refer to the costs related to the wear and tear of equipment during operation, often expressed as a cost per megawatt-hour of electricity generated. The wear and tear costs consider not only physical degradation but also operational expenses such as fuel consumption and maintenance due to frequent cycling. |
| 18 | Demand, Residual Demand, and Elasticities: Market demand can be expressed as P=a−bQ, where P is the price, Q is the total quantity, and a and b are constants. Residual demand, which flexible power units and BESS face, is the market demand minus the supply provided by VRE and other inflexible baseload generation. The elasticity of market demand is given by ϵm=−bP/Q, and the residual demand elasticity for flexible power units, BESS, and demand response (leaders) is ϵr=−bP/Qr, Qr is the flexible generators output, where Qr = Q – Qs, and Qs is output by unflexible generators. When residual demand becomes more inelastic (lower elasticity), as fewer units can provide flexibility, these units have greater market power because they can change prices without significantly reducing the quantity demanded. This situation arises when few competitors or alternatives are available to ISOs/RTOs, or the grid. |
| 19 | CAISO [96] experienced a reduction in energy demand in 2023, attributed to milder summer conditions as compared to previous years, and an increase in behind-the-meter (BTM) photovoltaic (PV) generation. This trend has continued from 2020, reflecting how decentralized solar generation and changing weather patterns are influencing overall energy consumption across the state. |
| 20 | Generators may bid at negative prices to avoid costly shutdown and restart cycles of their plants, effectively paying consumers to take excess electricity off the grid. This practice is particularly relevant for nuclear and coal-fired plants with high operational transition costs, as running at a temporary loss during low-demand periods is more economical than cycling the plant. Additionally, renewable generators may also face the incentive to continue producing during negative pricing periods when production tax credits and renewable certificates can offset these losses.. |
| 21 | On PJM Interconnection overcommitment see [99–105]. |
| 22 |
On December 1, 2023, the United States Court of Appeals for the Third Circuit upheld PJM Interconnection, L.L.C.’s latest minimum offer price rule (Focused MOPR), rejecting challenges to both the substance of the rule and FERC’s approval. The Focused MOPR went into effect after the FERC Commissioners deadlocked and failed to issue a timely order. The Third Circuit stated that judicial review of FERC's action, whether actual or constructive, follows the same deferential standards under the Federal Power Act (FPA) and the Administrative Procedure Act (APA). The court found FERC's acceptance of the Focused MOPR was not arbitrary and capricious, as it was supported by substantial evidence, including arguments from then-Chairman Glick and Commissioner Clements.
The Focused MOPR mitigates buyer-side market power in two scenarios: when a capacity resource can exercise market power and when a resource receives state subsidies likely preempted by the FPA. It replaced the Expanded MOPR adopted in 2019 and took effect by law on September 29, 2021, after FERC failed to act on PJM's filing within the statutory deadline. Requests for rehearing were deemed denied by law on November 29, 2021, prompting several entities to seek appellate review.
On appeal, the court held that its review must follow the same standards as if FERC had issued an order. The court determined that the Joint Statement from FERC Commissioners supporting the Focused MOPR was reasoned and based on the record, addressing concerns about inflated prices, state policy changes, auction results, and states' potential abandonment of the capacity market. The court dismissed arguments that the Joint Statement ignored investors' reliance on existing PJM market mechanisms and confirmed that the Focused MOPR effectively balances the risks of over- and under-mitigation. The Third Circuit concluded that FERC's constructive acceptance of the Focused MOPR was neither arbitrary nor capricious and was backed by substantial evidence. See [106].
|
| 23 | Central Dispatch Systems are not exempt from controversy regarding declared marginal costs, particularly concerning the complex interplay between generators' fuel procurement strategies and their influence on both declared marginal and system marginal costs. A critical question emerges: Do natural gas combined cycle (NGCC) natural gas "take or pay" contracts inherently establish a must-run generation condition with a fuel opportunity cost of zero? See, for example, [128]. |
| 24 | A VPP represents a sophisticated networked ecosystem of DERs that extends far beyond traditional solar and battery storage. This innovative platform integrates an expanding array of technologies, including grid-interactive efficient appliances, smart buildings, electric vehicle charging infrastructure, and thermal energy storage systems. By leveraging sophisticated control mechanisms, aggregators, utilities, and grid operators can collaboratively and remotely modulate these distributed resources under mutually agreed contractual frameworks. The primary objectives encompass optimizing clean energy generation, enhancing grid reliability, and delivering essential grid services—all while preserving end-user comfort and operational productivity. Through an intricate integration of advanced software and hardware technologies, VPPs transcend conventional energy management paradigms by transforming diverse, decentralized energy assets into cohesive, dynamically responsive grid resources capable of providing utility-scale capabilities from behind-the-meter installations. |
References
- IPCC (2014). Climate Change 2014: Mitigation of Climate Change. Contribution of Working Group III to the Fifth Assessment Report of the Intergovernmental Panel on Climate Change [Edenhofer, O., R. Pichs-Madruga, Y. Sokona, E. Farahani, S. Kadner, K. Seyboth, A. Adler, I. Baum, S. Brunner, P. Eickemeier, B. Kriemann, J. Savolainen, S. Schlömer, C. von Stechow, T. Zwickel and J.C. Minx (eds.)]. Cambridge University Press, Cambridge, United Kingdom and New York, NY, USA. EPA (2023). https://www.epa.gov/ghgemissions/global-greenhouse-gas-emissions-data#:~:text=Carbon%20dioxide%20(CO2)%3A,agriculture%2C%20and%20degradation%20of%20soils (Accessed 12/12/2023).
- EPRI (2021). “US-REGEN Documentation.” https://us-regen-docs.epri.com/v2021a/assumptions/electricity-generation.html#existing-fleet (Accessed 11/15/2023).
- FERC (2023). “RTOs and ISOs,” https://www.ferc.gov/power-sales-and-markets/rtos-and-isos (Accessed 11/29/2023).
- FERC (1996). “Order No. 888.” https://www.ferc.gov/industries-data/electric/industry-activities/open-access-transmission-tariff-oatt-reform/history-oatt-reform/order-no-888 (Accessed 11/29/2023).
- FERC (1996). “Order No. 889.” https://www.ferc.gov/industries-data/electric/industry-activities/open-access-transmission-tariff-oatt-reform/history-of-oatt-reform/order-no-889-1 (Accessed 11/29/2023).
- FERC (1999). “Order No. 2000.” chrome-extension://efaidnbmnnnibpcajpcglclefindmkaj/https://www.ferc.gov/sites/default/files/2020-06/RM99-2-00K_1.pdf (Accessed 11/29/2023).
- Intercontinental Exchange, Inc. operates global financial exchanges for electricity markets, North American & European Power Futures. See [6] ICE https://www.ice.com/energy/power (Accessed 12/12/2023).
- Denga, S.J.; and Oren, S.S. (2006). “Electricity derivatives and risk management,” Energy Vol 31, pp. 940–953. chrome-extension://efaidnbmnnnibpcajpcglclefindmkaj/https://oren.ieor.berkeley.edu/pubs/Deng%20and%20Oren-86.pdf (Accessed 12/12/2023).
- World Federation of Exchanges (2022). “WFE Derivatives Report 2021,” April 2022. chrome-extension://efaidnbmnnnibpcajpcglclefindmkaj/https://www.world-exchanges.org/storage/app/media/2021%20Annual%20Derivatives%20Report.pdf (Accessed 1/30/2024).
- Bublitz, A.; Keles, D.; Fichtner, W. (2017). An analysis of the decline of electricity spot prices in Europe: Who is to blame? Energy Policy, 107, 323-336. https://www.sciencedirect.com/science/article/abs/pii/S0301421517302598 (Accessed September 14, 2023).
- Raineri, R.; Rios, S.; Schiele, D., 2006. "Technical and economic aspects of ancillary services markets in the electric power industry: an international comparison," Energy Policy, Elsevier, vol. 34(13), pages 1540-1555, September.
- PJM Markets and Operations (2023). “PJM Markets and Operations.” https://www.pjm.com/markets-and-operations (Accessed 11/27/2023).
- PJM`s Energy Markets (2023). “PJM`s Energy Markets.” https://learn.pjm.com/three-priorities/buying-and-selling-energy/energy-markets (Accessed 12/11/2023).
- ISO New England Markets and Operations (2023). https://www.iso-ne.com/markets-operations (accessed 11/27/2023).
- California ISO Markets and Operations (2023). https://www.caiso.com/market/Pages/default.aspx (Accessed 11/27/2023).
- New York ISO Markets (2023). https://www.nyiso.com/markets (Accessed 11/27/2023).
- ERCOT Market Information (2023). https://www.ercot.com/mktinfo (Accessed 11/27/2023).
- EPEXSpot (2014). “Basics of the Power Market,” https://www.epexspot.com/en/basicspowermarket (Accessed June 10, 2024).
- ENTSO-E Market (2023). https://www.entsoe.eu/ (Accessed 11/27/2023); EPEX SPOT Market (2023). https://www.epexspot.com/ (Accessed 11/27/2023); Nord Pool Markets (2023). https://www.nordpoolgroup.com/ (Accessed 11/27/2023).
- Australian Energy Market Commission (AEMC) (2023). https://www.aemc.gov.au/energy-system/electricity/electricity-market/how-power-dispatched-across-system#:~:text=AEMO's%20central%20dispatch%20engine%20orders,generators%20to%20meet%20expected%20demand. (Accessed 11/20/2023).
- Australian Energy Market Operator -AEMO- (2023). https://aemo.com.au/ (Accessed 11/27/2023). https://www.aemc.gov.au/energy-system/electricity/electricity-market/spot-and-contract-markets.
- Energy Facts Norway (2023). https://energifaktanorge.no/en/norsk-energiforsyning/kraftmarkedet/ (Accessed 11/21/2023).
- Energy Market Authority of Singapore (2023). https://www.ema.gov.sg/our-energy-story/energy-market-landscape/electricity (Acceded 11/17/2023).
- Independent Electricity System Operator (IESO) (2023). Markets and Related Programs https://www.ieso.ca/ (Accessed 10/15/2024).
- Alberta Electric System Operator (AESO) (2023). Guide to understanding Alberta’s electricity market https://www.aeso.ca/aeso/understanding-electricity-in-alberta/continuing-education/guide-to-understanding-albertas-electricity-market/ (Accessed 10/15/2024).
- Canada Energy Regulator -CER- (2024). “Provincial and Territorial Energy Profiles – Canada,” https://www.cer-rec.gc.ca/en/data-analysis/energy-markets/provincial-territorial-energy-profiles/provincial-territorial-energy-profiles-canada.html (Accessed 10/15/2024).
- Ministry of Business, Innovation and Employment (2015). “Chronology of New Zealand Electricity Reform,” Energy Markets Policy, Energy & Resources Branch of Ministry of Business, Innovation and Employment, August 2015, https://www.mbie.govt.nz/assets/2ba6419674/chronology-of-nz-electricity-reform.pdf (Accessed 12/11/2023).
- Transpower (2023). https://www.transpower.co.nz/ (Accessed 11/20/2023).
- FERC (2023). “Electric Power Markets.” https://www.ferc.gov/electric-power-markets (Accessed 11/27/2023).
- American Public Power Association (2023). “Wholesale Electricity Markets and Regional Transmission Organizations,” Electricity Markets Issue Brief. https://www.publicpower.org/policy/wholesale-electricity-markets-and-regional-transmission-organizations-0 (Accessed 11/30/2023).
- PJM (2023). “Capacity Market (RPM),” https://www.pjm.com/markets-and-operations/rpm#:~:text=PJM's%20capacity%20market%2C%20called%20the,energy%20demand%20in%20the%20future. (Accessed 11/29/2023).
- PJM (2023). “PJM Manual 18: PJM Capacity Market, Revision: 58,” Effective Date: November 15, 2023. Prepared By Capacity Market & Demand Response Operations. https://www.pjm.com/~/media/documents/manuals/m18.ashx (Accessed 12/4/2023).
- Hancher, L.; de Hauteclocque, A.; Huhta, K.; Malgorzata, S. (Editors) (2022). "Capacity mechanisms in the EU energy markets: law, policy, and economics," Energy Union Law, Book edited by Leigh Hancher, Adrien de Hauteclocque, Kaisa Huhta, Sadowska Malgorzata. https://fsr.eui.eu/publications/?handle=1814/75007 (Accessed 10/15/2024).
- Raineri, R. (2006). “Chile: Where it all started,” chapter 3 in the Book Electricity Market Reform: An International Perspective, Fereidoon P. Sioshansi and Wolfgang Pfaffenberger editors. Chapter 3, pg. 77-108. Series: Global Energy Policy and Economics, Elsevier 2006.
- Ministerio de Energía Chile (2023). “Decreto Supremo No. 70 de 2023 (DS 70).”.
- Cramton, P.; & Stoft, S. (2005). A Capacity Market that Makes Sense. The Electricity Journal, 18(7), 43-54. https://www.sciencedirect.com/science/article/abs/pii/S1040619005000850 (Accessed September 12, 2023).
- Joskow, P. L. (2008). Capacity payments in imperfect electricity markets: Need and design. Utilities Policy, 16(3), 159-170. https://www.sciencedirect.com/science/article/abs/pii/S0957178707000926 (Accessed September 12, 2023).
- Newbery, D. (2016). Missing money and missing markets: Reliability, capacity auctions and interconnectors. Energy Policy, 94, 401-410. https://www.sciencedirect.com/science/article/abs/pii/S0301421515301555 (Accessed September 14, 2023).
- Hogan, W. W. (2005). On an "Energy Only" Electricity Market Design for Resource Adequacy. Center for Business and Government, John F. Kennedy School of Government, Harvard University, September 23, 2005. https://scholar.harvard.edu/whogan/files/hogan_energy_only_092305.pdf (Accessed September 22, 2023).
- Bushnell, J.; Flagg, M.; Mansur, E. (2017). Capacity Markets at a Crossroads. Energy Institute at Haas Working Paper 278, April 2017. https://www.haas.berkeley.edu/wp-content/uploads/WP278Updated.pdf (Accessed September 22, 2023).
- Hogan, W. W. (2013). Electricity Scarcity Pricing Through Operating Reserves. Economics of Energy & Environmental Policy, 2(2), 65-86. https://www.pserc.cornell.edu/empire/2_2_a04.pdf (Accessed September 22, 2023).
- Levin, T.; & Botterud, A. (2015). Electricity market design for generator revenue sufficiency with increased variable generation. Energy Policy, 87, 392-406. https://www.sciencedirect.com/science/article/abs/pii/S0301421515300999 (Accessed September 24, 2023).
- Grubb, M.; Newbery, D. (2018). UK Electricity Market Reform and the Energy Transition: Emerging Lessons. The Energy Journal, 39(6), pp. 1-26. https://www.jstor.org/stable/26606242 (Accessed September 24, 2023).
- Simshauser, P. (2018). On intermittent renewable generation & the stability of Australia's National Electricity Market. Energy Economics, 72, 1-19. https://www.sciencedirect.com/science/article/abs/pii/S0140988318300562 (Accessed September 24, 2023).
- de Vries, L.; Heijnen, P. (2008). The impact of electricity market design upon investment under uncertainty: The effectiveness of capacity mechanisms. Utilities Policy, 16(3), 215-227. https://www.sciencedirect.com/science/article/abs/pii/S0957178708000027 (Accessed September 26, 2023).
- Bajo-Buenestado, R. (2017). Welfare implications of capacity payments in a price-capped electricity sector: A case study of the Texas market (ERCOT). Energy Economics, 64, 272-285. https://www.sciencedirect.com/science/article/abs/pii/S0140988317301032 (Accessed September 26, 2023).
- Schwenen, S. (2014). Market design and supply security in imperfect power markets. Energy Economics, V. 43, May 2014, Pages 256-263. https://www.sciencedirect.com/science/article/abs/pii/S0140988314000395 (Accessed September 26, 2023).
- Brown, D. P. (2018). Capacity payment mechanisms and investment incentives in restructured electricity markets. Energy Economics, 74, 131-142. https://www.sciencedirect.com/science/article/abs/pii/S0140988318302068 (Accessed September 28, 2023).
- Bhagwat, P. C.; Iychettira, K. K.; Richstein, J. C.; Chappin, E. J.; De Vries, L. J. (2017). The effectiveness of capacity markets in the presence of a high portfolio share of renewable energy sources. Utilities Policy, 48, 76-91. https://www.sciencedirect.com/science/article/pii/S0957178716300406#:~:text=A%20decline%20or%20no%20growth,14 (Accessed September 28, 2023).
- Commission de Regulation de L`Energie (2023). “Wholesale electricity market.” https://www.cre.fr/en/Electricity/Wholesale-electricity-market/wholesale-electricity-market (Accessed 11/21/2023).
- Guénaire, M.; Dufour, T.; George, E.; Assayag, S.; Nouel, G.L. (2020). “Electricity regulation in France: overview,” in Practical Law, Thomson Reuters. chrome-extension://efaidnbmnnnibpcajpcglclefindmkaj/https://www.gide.com/sites/default/files/electricity_regulation_in_france_overview_7-629-75671.pdf (Accessed 11/21/2023).
- des Comptes,C. (2022). “Organization oe the electricity markets,” Rapport public thématique, public policy evaluation, July 2022. https://www.ccomptes.fr/system/files/2022-10/20220705-Organisation-electricity-markets-summary.pdf (Accessed 11/27/2023).
- FERC (2023). “Electric Power Markets.” https://www.ferc.gov/electric-power-markets.
- Southface Institute, Vote Solar (2018). “Understanding the Electricity System in Georgia”, Draft prepared by Southface Institute and Vote Solar, May 2018. https://www.southface.org/wp-content/uploads/2018/05/Georgia-Electricity-System-Primer-May-2018-Draft.pdf (Accessed 11/27/2023).
- WRAL NEWS (2023). “Big electricity users push for competition in NC energy market.” NC State Capitol Bureau, State Capitol news. https://www.wral.com/story/big-electricity-users-push-for-competition-in-nc-energy-market/20943043/ (Accessed 11/28/2023).
- Tennesse Valley Authority (2023). https://www.tva.com/ (Accessed 27/11/2023).
- FERC (2023). “Electric Power Markets.” https://www.ferc.gov/electric-power-markets.
- State of Hawaii, Public Utilities Commission (2023). [55] “Electric Utilities,” https://puc.hawaii.gov/energy/ (Accessed 11/29/2023).
- Hawaiian Electric (2023). https://www.hawaiianelectric.com/ (Accessed 11/29/2023).
- Alaska Energy Authority (2023). https://www.akenergyauthority.org/ (Accessed 29/11/2023).
- Alaska Power Association (2023). https://alaskapower.org/ (Accessed 11/29/2023).
- FERC (2023). “Electric Power Markets.” https://www.ferc.gov/electric-power-markets (Accessed 11/27/2023).
- Coordinador Eléctrico Nacional -CEN- (2023). https://www.coordinador.cl/ (Accessed 11/29/2023);
- Becker, E. (2020). “Análisis del Mercado Eléctrico Argentino: Impacto de la regulación en su funcionamiento,” Departamento de Economía- Universidad Nacional del Sur Trabajo de grado de la Licenciatura en Economía. chrome-extension://efaidnbmnnnibpcajpcglclefindmkaj/https://repositoriodigital.uns.edu.ar/bitstream/handle/123456789/5378/Becker%2C%20Eleonora_%20Tesis%20de%20Grado%202020.pdf?sequence=1&isAllowed=y (Accessed 11/21/2023).
- Comité de Operación Económica del Sistema Interconectado Nacional COES SINAC (2023). https://www.coes.org.pe/portal/ (Accessed 11/29/2023).
- Yongping, Z.; Feng, Z.; Linan, P.; Yang, Y. (2023). “The current state of China’s electricity market,” China Dialogue, September 1, 2023. https://chinadialogue.net/en/energy/the-current-state-of-chinas-electricity-market/ (Accessed 11/29/2023).
- Hove, A. (2023). “China’s new capacity payment risks locking in coal,” China Dialogue, November 23, 2023. https://chinadialogue.net/en/energy/chinas-new-capacity-payment-risks-locking-in-coal/ (Accessed 11/29/2023).
- Federal Energy Reulatory Commissionn (2006). “Order No. 888: Promoting Wholesale Competition Through Open Access Non-discriminatory Transmission Services by Public Utilities; Recovery of Stranded Costs by Public Utilities and Transmitting Utilities” https://www.ferc.gov/industries-data/electric/industry-activities/open-access-transmission-tariff-oatt-reform/history-oatt-reform/order-no-888 (Accessed 18/10/2024).
- European Union (2009). “Regulation (EC) No 714/2009 of the European Parliament and of the Council of 13 July 2009 on conditions for access to the network for cross-border exchanges in electricity and repealing Regulation (EC) No 1228/2003,” (Text with EEA relevance). http://data.europa.eu/eli/reg/2009/714/oj (Accessed 10/18/2024).
- Araneda, J.C. (2021). “El Sistema Eléctrico Chileno,”Coordinador Eléctrico Nacional, Encuentro virtual de la Región Iberoamericana de CIGRE (e-RIAC) “Desafíos de la operación en la Región Iberoamericana. Una mirada postpandémica". chrome-extension://efaidnbmnnnibpcajpcglclefindmkaj/https://www.cigre.cl/wp-content/uploads/2021/07/Sistema-Electrico_CHILE__e_RIAC_2021.pdf (Accessed 10/18/2024).
- Energy Networks Australia (2021). “Guide to Australia's Energy Networks,” www.energynetworks.com.au/assets/uploads/Guide-to-Australias-Energy-Networks_2021-1.pdf (Accessed 10/18/2024).
- Coordinador Eléctrico Nacional (2024). “Coordinador Eléctrico impulsa licitación de obras de ampliación del sistema de transmisión por más de US$ 34,5 millones,” November 13, 2024. https://www.coordinador.cl/novedades/coordinador-electrico-impulsa-licitacion-de-obras-de-ampliacion-del-sistema-de-transmision-por-mas-de-us-345-millones/ (Accessed 10/18/2024).
- Agência Nacional de Energia Elétrica (ANEEL) (2024). “Transmissão,” https://www.gov.br/aneel/pt-br/assuntos/transmissao (Accessed 10/18/2024).
- Centro Nacional de Control de Energía (CENACE) (2024) . “Quiénes Somos,” https://www.cenace.gob.mx/CENACE.aspx (Accessed 10/18/2024).
- NEA (2019). “The Costs of Decarbonisation: System Costs with High Shares of Nuclear and Renewables,” OECD Publishing, Paris. https://www.oecd-nea.org/jcms/pl_15000/the-costs-of-decarbonisation-system-costs-with-high-shares-of-nuclear-and-renewables?details=true (Accessed November 27, 2024).
- Ethan Howland E. (2023). “PJM it will remain profitable to sell PJM capacity that you can’t deliver,” Utility Dive, Published Sept. 28, 2023. https://www.utilitydive.com/news/pjm-interconnection-board-capacity-market-proposal-ferc-reliability/695037/ (Accessed November 25, 2024).
- Energy Information Administration (2023). “Levelized Costs of New Generation Resources in the Annual Energy Outlook 2023,” https://www.eia.gov/outlooks/aeo/electricity_generation/pdf/AEO2023_LCOE_report.pdf#:~:text=URL%3A%20https%3A%2F%2Fwww.eia.gov%2Foutlooks%2Faeo%2Felectricity_generation%2Fpdf%2FAEO2023_LCOE_report.pdf%0AVisible%3A%200%25%20 (Accessed 11/30/2023).
- NREL (2012), “Power Plant Cycling Costs,” conducted by the National Renewable Energy Laboratory (NREL). https://www.nrel.gov/docs/fy12osti/55433.pdf (Accessed November 29, 2024).
- Savin, O.S.; & Badina, C.; Baroth, J.; Charbonnier, S.; Berenguer, C. (2020). Start and Stop Costs for Hydro Power Plants: A Critical Literature Review. Proceedings of the 29th European Safety and Reliability Conference (ESREL) 342-349. 10.3850/978-981-14-8593-0_4102-cd. [CrossRef]
- Van den Bergh, K.; Delarue, E. (2015). Cycling of conventional power plants: Technical limits and actual costs. Energy Conversion and Management, 97, 70-77. https://doi.org/10.1016/j.enconman.2015.03.026 (Accessed Noveember 10, 2024). [CrossRef]
- Schill, W.P.; Pahle, M.; Gambardella, C. (2016). “On Start-up Costs of Thermal Power Plants in Markets with Increasing Shares of Fluctuating Renewables,” Deutsches Institut für Wirtschaftsforschung, Berlin. https://d-nb.info/115301274X/34 (Accessed Noveember 10, 2024).
- Xu, T; Birchfield, A.B.; Gegner, K.M.; Shetye, K.S.; Overbye, T.J. (2017). “Application of Large-Scale Synthetic Power System Models for Energy,” Proceedings of the 50th Hawaii International Conference on System Sciences. Pg 3123-3129. URI: http://hdl.handle.net/10125/41535 (Accessed November 20, 2023).
- Coordinado Eléctrico Nacional (2022), “Resumen Ejecutivo Estudio de Desgaste de SSCC.” https://www.coordinador.cl/mercados/documentos/servicios-complementarios/estudio-de-costos-de-desagste-sscc/2022-estudio-de-costos-de-desagste-sscc/ (Accessed November 18, 2023).
- Coordinado Eléctrico Nacional (2024), “Estudio de costos de los servicios complementarios sistema eléctrico nacional 2024-2027.” https://www.coordinador.cl/mercados/documentos/servicios-complementarios/estudio-de-costos-de-sscc/estudio-de-costos-sscc-2024/ (Accessed November 20, 2024).
- EIA (2020). “About 25% of US power plants can start up within an hour.” https://www.eia.gov/todayinenergy/detail.php?id=45956 (Accessed November 20, 2024).
- National Renewable Energy Laboratory (NREL). (2018). "Operational Analysis of the Eastern Interconnection at Very High Renewable Penetrations;".
- US Energy Information Administration (EIA) (2019). "Annual Energy Outlook 2019 with projections to 2050.".
- Huang, C.; Han, D.; Yan, Z.; Li, Y.; Sun, C.; Jia,Q. (2022). “Bidding strategy of energy storage in imperfectly competitive flexible ramping market via system dynamics method,” International Journal of Electrical Power & Energy Systems, Volume 136, 107722, ISSN 0142-0615, https://doi.org/10.1016/j.ijepes.2021.107722. [CrossRef]
- Ela, E.G.; O'Malley, M. (2015). “Scheduling and Pricing for Expected Ramp Capability in Real-Time Power Markets,” August 2015, Power Systems, IEEE Transactions on 31(3):1-11. DOI: 10.1109/TPWRS.2015.2461535. [CrossRef]
- Harvey, S. (2020). “System Market Power: HASP Based Mitigation Design Discussion,”Member, California ISO Market Surveillance Committee, Western Imbalance market, July 30, 2020. https://www.caiso.com/documents/systemmarketpowermitigationdiscussion-harvey-presentation-july30_2020.pdf (Accessed October 20, 2024).
- IEA (2019). “Status of Power System Transformation 2019 Power system flexibility,” May 2019. chrome-extension://efaidnbmnnnibpcajpcglclefindmkaj/https://iea.blob.core.windows.net/assets/00dd2818-65f1-426c-8756-9cc0409d89a8/Status_of_Power_System_Transformation_2019.pdf (Accessed September 27, 2024).
- Wiser, R.; Mills, A.; Seel, J.; Levin, T.; Botterud, A. (2017). "Impacts of Variable Renewable Energy on Bulk Power System Assets, Pricing, and Costs." Lawrence Berkeley National Laboratory.
- Federal Energy Regulatory Commission (FERC). (2020). "State of the Markets Report 2019." Federal Energy Regulatory Commission, March 19, 2020), https://www.ferc.gov/sites/default/files/2020-04/2019StateoftheMarketsReport.pdf.
- Barbose, G. (2024). "US States Renewables Portfolio & Clean Electricity Standards: 2024 Status Update." Lawrence Berkeley National Laboratory. https://emp.lbl.gov/publications/us-state-renewables-portfolio-clean-0 (Accessed September 15, 2024).
- Federal Energy Regulatory Commission (2024). “2023 State of the Markets,” Office of Energy Policy and Innovation, March 21, 2024, Staff Report.
- California ISO (2024). “Department of Market Monitoring: 2023 Annual Report on Market Issues & Performance,” July 29, 2024.
- Neeley, J. (2021). “Understanding Negative Prices in the Texas Electricity Market”, R Street Institute, 2021. Available online at: https://www.rstreet.org/commentary/understanding-negative-prices-in-the-texas-electricity-market/.
- CAISO (2024). “Annual Report on Market Issues and Performance,” Department of Market Monitoring, CA ISO July 29, 2024.
- Monitoring Analytics, LLC (2018). “State of the Market Report for PJM 2017,” Independent Market Monitor for PJM, 8 March 2018.
- Levin, T.; Botterud, A. (2015). “Electricity market design for generator revenue sufficiency with increased variable generation,” Energy Policy, 2015, vol. 87, issue C, pg. 392-406.
- Wilson, J. (2021). “Over-Procurement of Generating Capacity in PJM: Causes and Consequences,” Wilson Energyy Economics, report Prepared For Sierra Club Natural Resources Defense Council. chrome-extension://efaidnbmnnnibpcajpcglclefindmkaj/https://wilsonenec.com/dev/wp-content/uploads/2021/10/Wilson-Overprocurement-of-Capacity-in-PJM.pdf (Accessed October 7, 2024);
- Hogan, W. (2022). Electricity Market Design and Zero-Marginal Cost Generation. Current Sustainable/Renewable Energy Reports. 9. 1-12. 10.1007/s40518-021-00200-9. [CrossRef]
- Hogan, M. (2017). “Follow the missing money: Ensuring reliability at least cost to consumers in the transition to a low-carbon power system,” The Electricity Journal, Volume 30, Issue 1, January–February 2017, Pages 55-61. https://www.sciencedirect.com/science/article/pii/S1040619016302512#sec0035 (Accessed October 7, 2024);
- Milstein, I.; Tishler, A. (2019). “On the effects of capacity payments in competitive electricity markets: Capacity adequacy, price cap, and reliability,”. Energy Policy, June 2019, pg. 370-385. https://www.sciencedirect.com/science/article/pii/S0301421519301119 (Accessed October 7, 2024);
- Lavin, L.; Murphy, S.; Sergi, B.; Apt, J. (2020). "Dynamic operating reserve procurement improves scarcity pricing in PJM," Energy Policy, Volume 147, 111857. https://www.sciencedirect.com/science/article/pii/S0301421520305747 (Accessed October 7, 2024).
- Shrestha, S.; O'Konski, K. (2023). “Third Circuit Upholds FERC’s Approval of PJM’s Focused MOPR,” Troutman Pepper, Posted in Market Policy, December 11, 2023. https://www.troutmanenergyreport.com/2023/12/third-circuit-upholds-fercs-approval-of-pjms-focused-mopr/ (Accessed February 24, 2024).
- Federal Energy Regulatory Commission (2024). “2023 State of the Markets,” Office of Energy Policy and Innovation, March 21, 2024, Staff Report.
- Federal Energy Regulatory Commission (2024). “2023 State of the Markets,” Office of Energy Policy.
- Federal Energy Regulatory Commission (2024). Innovation, March 21, 2024, Staff Report.
- US Department of Energy (2023). “National Transmission Needs Study,” October 2023.
- Jowett, P. (2024). “Negative electricity prices registered in nearly all European energy markets,” PV Magazine, 10 April 2024. https://www.pv-magazine.com/2024/04/10/negative-electricity-prices-registered-in-nearly-all-european-energy-markets/ (Accessed June 14, 2024).
- European Commission. (2024, March 22). “Report on energy prices and costs in Europe,” March 22, 2024 (COM(2024) 136 final). https://eur-lex.europa.eu/legal-content/EN/TXT/PDF/?uri=CELEX:52024DC0136 (Accessed Octyobeer 10, 2024); and.
- AleaSoft Energy Forecasting (2024). “European electricity markets react to increased wind energy production with price declines,” June 17. https://aleasoft.com/decreases-european-market-prices-increase-wind-energy/ (Accessed October 7, 2024).
- Horsch, A.; Aust, B. (2020). “Negative market prices on power exchanges: Evidence and policy implications from Germany.” The Electricity Journal, Volume 33, Issue 3, April 2020, 106716, https://www.sciencedirect.com/science/article/pii/S1040619020300087 (Accessed October 10, 2024).
- Council of European Energy Regulators (CEER) (2023). "Status Review of Renewable Support Schemes in Europe for 2020 and 2021," Council of European Energy Regulators (CEER) Report, Renewables Work Stream of Electricity Working Group Ref: C22-RES-80-04 28 September 2023. https://www.ceer.eu/wp-content/uploads/2024/04/RES_Status_Review_in_Europe_for_2020-2021.pdf (Accessed October 10, 2024).
- De Vos, K. (2015). "Negative Wholesale Electricity Prices in the German, French and Belgian Day-Ahead, Intra-Day and Real-Time Markets," The Electricity Journal, Volume 28, Issue 4, May 2015, Pages 36-50. https://www.sciencedirect.com/science/article/pii/S1040619015000652#:~:text=Pages%2036%2D50-,Negative%20Wholesale%20Electricity%20Prices%20in%20the%20German%2C%20French%20and%20Belgian,Day%20and%20Real%2DTime%20Markets&text=Negative%20prices%20are%20a%20correct,caused%20by%20renewable%20support%20mechanisms. (Accessed October 10, 2024).
- International Energy Agency (IEA) (2024). “Woorld Energy Outlook Special Report: Batteries and Secure Energy Transitions.” https://iea.blob.core.windows.net/assets/cb39c1bf-d2b3-446d-8c35-aae6b1f3a4a0/BatteriesandSecureEnergyTransitions.pdf (Accessed October, 2024).
- Joos, M.; Staffell, I. (2018). "'Short-term integration costs of variable renewable energy: Wind curtailment and balancing in Britain and Germany," Renewable and Sustainable Energy Reviews, Volume 86, April 2018, Pages 45-65. https://www.sciencedirect.com/science/article/pii/S1364032118300091 (Accessed October 3, 2024).
- Nicolosi, M. (2010). Wind power integration and power system flexibility–An empirical analysis of extreme events in Germany under the new negative price regime. Energy Policy, 38(11), 7257-7268. https://www.sciencedirect.com/science/article/abs/pii/S0301421510005860 (Accessed September 28, 2023).
- European Commission (2024). “Quarterly report On European electricity markets with focus on annual overview for 2023,” Market Observatory for Energy, DG Energy Volume 16 (issue 4, covering fourth quarter of 2023).
- Evol Services (2024), “Pérdidas De Energía Aumentan Y Alcanzan Más Del 18% De Producción Eólica Y Solar Del País En El Primer Trimestre.” https://services.evol.energy/2024/04/15/perdidas-de-energia-aumentan-y-alcanzan-mas-del-18-de-produccion-eolica-y-solar-del-pais-en-el-primer-trimestre/ (Accessed 25 July 2024).
- IEA (2019). “Status of Power System Transformation 2019 Power system flexibility,” May 2019. chrome-extension://efaidnbmnnnibpcajpcglclefindmkaj/https://iea.blob.core.windows.net/assets/00dd2818-65f1-426c-8756-9cc0409d89a8/Status_of_Power_System_Transformation_2019.pdf (Accessed September 27, 2024).
- Csereklyei, Z. (2020). “Price and income elasticities of residential and industrial electricity demand in the European Union,” Energy Policy, Volume 137, Page 111079, February 2020. https://doi.org/10.1016/j.enpol.2019.111079 (Accessed January 1st, 2024). [CrossRef]
- Wang, Y.; Wu, L. (2017). “Improving economic values of day-ahead load forecasts to real-time power system operations,” IET Generation, Transmission and Distribution, pg. 4238-4247, 06 September 2017. https://doi.org/10.1049/iet-gtd.2017.0517 (Accessed February 22, 2024). [CrossRef]
- Monitoring Analytics, LLC (2024). “2023 Annual State of the Market Report for PJM.” www.monitoringanalytics.com/reports/PJM_State_of_the_Market/2023/2023-som-pjm-vol2.pdf (Accessed June 6, 2024).
- Coordinador Electrico Nacional (2024). “Operational Data for 2022 and 2023 from Coordinador Electrico Nacional, Desviación de la Demanda Programada,” https://www.coordinador.cl/ Data retrieved on June 1st, 2024.
- Adhikari, U. (2019). “Solving Price Volatility in Renewable Energy Wholesale Markets Renewable Energy Procurement,” The Sol Source, Third Quarter 2019, 05 Nov 2019, pg. 6-9. chrome-extension://efaidnbmnnnibpcajpcglclefindmkaj/https://www.solsystems.com/wp-content/uploads/2019/11/Sol_SOURCE_Q3.pdf (Accessed June 15, 2024).
- García Bernal, N. (2021). "Condición de inflexibilidad del GNL en el Sistema Eléctrico Nacional,” Biblioteca del Congreso Nacional de Chile, Asesoría Técnica Parlamentaria, June 2021. https://obtienearchivo.bcn.cl/obtienearchivo?id=repositorio/10221/32301/1/BCN___Condicion_de_inflexibilidad_del_GNL.pdf (Accessed 12/19/2023).
- Gaamouche, R.; Chinnici, M.; Lahby, M.; Abakarim, Y.; Hasnaoui, A. (2022). Machine Learning Techniques for Renewable Energy Forecasting: A Comprehensive Review. In: Lahby, M., Al-Fuqaha, A., Maleh, Y. (eds) Computational Intelligence Techniques for Green Smart Cities. Green Energy and Technology. Springer, Cham. https://doi.org/10.1007/978-3-030-96429-0_1 (Accessed November 3, 2024). [CrossRef]
- Vionis, P.; Kotsilieris, T. (2024). “The Potential of Blockchain Technology and Smart Contracts in the Energy Sector: A Review.” Applied Sciences, 14(1), 253. https://doi.org/10.3390/app14010253. [CrossRef]
- US Department of Energy (). “Virtual Power Plants.” https://www.energy.gov/lpo/virtual-power-plants (Accessed November 10, 2024).
- Fournely, C.; Pečjak, M.; Smolej, T.; Türk, A.; Neumann, C. (2022). "Flexibility markets in the EU: Emerging approaches and new options for market design," 18th International Conference on the European Energy Market (EEM), Ljubljana, Slovenia, 2022, pp. 1-7, doi: 10.1109/EEM54602.2022.9921138. https://xflexproject.eu/wp-content/uploads/2023/09/9_Flexibility-markets-in-the-EU-Emerging-approaches-and-new-options-for-market-design.pdf (Accessed December 9, 2024). [CrossRef]
- European Commission. (2020). "Clean Energy for All Europeans Package". Official Publications. https://energy.ec.europa.eu/topics/energy-strategy/clean-energy-all-europeans-package_en#electricity-market-design (Accessed December 9, 2024).
- Australian Renewable Energy Agency -ARENA- (2017). “Virtual power plant in South Australia Stage 1 milestone report,” July 31st, 2017. https://arena.gov.au/assets/2017/02/VPP-SA-Public-Milestone-1-Report-Final-for-issue.pdf (Accessed December 9, 2024).
- Australian Renewable Energy Agency -ARENA- (2018). “Virtual power plant in South Australia Stage 2 public report,” June 15, 2018. (Accessed December 9, 2024). https://arena.gov.au/assets/2017/02/virtual-power-plants-in-south-australia-stage-2-public-report.pdf (Accessed December 9, 2024).
- TEPCO (2018). “TEPCO looks to the transformative potential of blockchain by investing in Electron, a UK energy technology company,” Announcement Jan 19, 2018. https://www.tepco.co.jp/en/announcements/2018/1473674_15434.html (Accessed December 3, 2024).
- Losanova, S. (2024). “What is a Virtual Power Plant (VPP)?” Greenlancer. https://www.greenlancer.com/post/virtual-power-plants-vpps (Accessed December 3, 2024).
- EPRI (2024). “Vermont Green P2P Trading,” EPRI Tech Portal. https://techportal.epri.com/demonstrations/demo/ubig/7FzJj6XWufc3QP08AqlfzC (Accessed December 3, 2024).
- Energy Web (2024). “About Energy Web,” https://www.energyweb.org/about (Accessed December 3, 2024).
- Kraken (2022). “What is Energy Web Token? (EWT),” Kraken Learn team, Jan 19, 2022. https://www.kraken.com/learn/what-is-energy-web-token-ewt (Accessed December 3, 2024).
- Energy Web (2020. “LO3 Energy Updates Pando Platform, Migrates To Energy Web Chain,” Medium.com Sep 24, 2020. https://medium.com/energy-web-insights/lo3-energy-updates-pando-platform-migrates-to-energy-web-chain-d709ae0e5311 (Accessed December 3, 2024).
- European Commission (2023). “Electricity market design,” Energy, Climate change, Environment. https://energy.ec.europa.eu/topics/markets-and-consumers/electricity-market-design_en?utm_source=chatgpt.com (Accessed November 7, 2024).

Table 1.
Typical Generator Ramp Rates, Start-up and Shut-down Costs and Wear Cost.
| Fuel Type | Ramp Rate (% of rated capacity per min)* | Start-up Costs (USD/ MW/ start)* | Shut-down Costs (USD/ MW/ shutdown)* | Start-up Time (hours)* | Shut-down Time (hours)* | Minimum On Time (hours)* | Minimum Off Time (hours)* | Cost of Wear and Tear (USD/MWh-h) For Primary and secondary frequency control ** |
|---|---|---|---|---|---|---|---|---|
| Coal | 0.6-8 | 100-250 | 10-25 | 4-9 | 2-9 | 0-12 | 0-12 | 1.087-1.760 |
| Natural Gas | 0.8-30 | 20-150 | 2-15 | 2-4 | 1-4 | 0-2 | 0-1 | 1.243-1.824 |
| Nuclear | 0-5 | 1000 | 1000 | 24 | 24 | Days | Days | 0.029 |
| Hydro | 15-25 | 0-5 | 0-0.5 | 0-1 | 0-1 | 0-1 | 0-1 | 2.722-4.714 Dum;0.029 Run of River |
| Wind | Non-dispatchable | - | - | - | - | - | - | 0.006-0.070 |
| Solar | Non-dispatchable | - | - | - | - | - | - | 0.006-0.235 PV 0.017 CSP |
| Battery Storage | 0-100 | Varies | Varies | < 0.25 | < 0.25 | < 1 | < 1 | 0.042 (PV+BEES) |
| Diesel | 2-5 | 5-20 | 1-5 | 0.25-0.5 | 0.17-0.33 | 1-2 | 1-2 | 0.043 |
| Source: *[82]; ** [83,84,85]. | ||||||||
Disclaimer/Publisher’s Note: The statements, opinions and data contained in all publications are solely those of the individual author(s) and contributor(s) and not of MDPI and/or the editor(s). MDPI and/or the editor(s) disclaim responsibility for any injury to people or property resulting from any ideas, methods, instructions or products referred to in the content. |
© 2025 by the authors. Licensee MDPI, Basel, Switzerland. This article is an open access article distributed under the terms and conditions of the Creative Commons Attribution (CC BY) license (http://creativecommons.org/licenses/by/4.0/).
Copyright: This open access article is published under a Creative Commons CC BY 4.0 license, which permit the free download, distribution, and reuse, provided that the author and preprint are cited in any reuse.


