Submitted:
16 December 2024
Posted:
17 December 2024
You are already at the latest version
Abstract
This study examines energy storage within the frameworks of production-side and consumption-side energy storage concepts. The theoretical advantages of consumption-side energy storage over production-side energy storage are initially discussed. Subsequently, the topic is supported by a simulation study, and the resulting analyses are presented. The simulation investigates the feasibility and applicability of consumption-side energy storage under varying conditions through diverse scenarios, incorporating economic analyses for these scenarios. Furthermore, it evaluates the widespread impact of consumption-side energy storage when adopted by 5M, 10M, 20M, and 40M consumers across separate scenarios. The widespread impact analysis focuses on shifting peak-period energy consumption to night-period consumption. This shift’s effects on reducing energy production requirements and alleviating transmission line loads are analyzed, along with the economic advantages derived from deferring energy infrastructure investments. The analysis centers exclusively on residential consumers, as a preliminary study, referring to the energy storage systems they utilize as Residential Energy Storage Systems (RESS). These systems are assumed to be organized and managed by Energy Provider Companies rather than individual consumers. The study also addresses the potential costs associated with implementing RESS. The simulation-based widespread impact analysis highlights significant outcomes: reducing the need for new power plants, mitigating the risk of overloading transmission lines, shifting peak-period consumption to night periods, enhancing the utilization of renewable energy resources, delivering economic benefits to energy providers and consumers, and achieving positive environmental impacts. From these outcomes obtained, very striking inferences are produced that may affect the future energy policies of many countries, especially the USA.
Keywords:
energy storage
; residential energy storage
; Lithium Iron Phosphate batteries
; LiFePO4 batteries
; energy economy
; energy planning
; energy future
; sustainable energy
; renewable energy
1. Introduction
This article aims to highlight the substantial
benefits that could be achieved through the successful implementation and
widespread organization of consumption-side energy storage. The most
significant of these benefits include limiting peak demand, eliminating
overloading in energy transmission lines, reducing the need for new power
plants and transmission lines—thus deferring necessary investments—and
minimizing environmental harm.
Expecting consumers to independently organize widespread
consumption-side energy storage is not feasible under current conditions.
However, this can be made viable through alternative organizational models. The
U.S. energy system employs various operational models, including Vertically
Integrated Utilities, Deregulated Markets, Municipal Utilities, and
Cooperatives [1,2,3,4,5]. The widespread
organization of consumption-side energy storage could be facilitated by the
relevant subunit of Vertically Integrated Utilities, retail energy providers
(REP) in deregulated markets, or suitable entities in other models. In this
study, the entity responsible for organizing consumption-side energy storage is
referred to generally as an Energy Provider Company (EPC).
Achieving the widespread impact of consumption-side
energy storage and realizing the anticipated significant benefits primarily
depends on analyzing the feasibility of energy storage systems for consumers.
To analyze this feasibility, this research is supported by a two-phase
simulation study.
In the first phase of the simulation, various
scenarios are developed to address how energy storage systems intended for
consumer use can be organized and how their economic dimensions can be managed.
Economic analyses are conducted based on these scenarios, considering the
potential costs of energy storage systems and contributions from EPCs,
consumers, external sponsors, and the effects of grants and interest rates
provided by external sponsors.
In the second phase, scenario-based analyses are
performed to demonstrate the substantial benefits that could be obtained in the
event of significant widespread adoption of consumption-side energy storage.
These scenarios assume varying numbers of consumers using energy storage
systems—5M, 10M, 20M, and 40M. For each scenario, analyses are conducted on the
amount of power shifted from peak to night hours, the reduction in transmission
line load, the decrease in energy production requirements, and the resulting
economic gains from deferred investments in new energy infrastructure.
The simulation focuses on energy storage in
residential areas within the context of consumption-side energy storage, as
peak-hours energy consumption in the U.S. is highest in residential sectors [6,7,8]. The energy storage systems utilized in
residential areas are referred to as Residential Energy Storage Systems (RESS).
The motivation for this study stems from the author's previous publication,
which emphasized that residential energy storage must be organized by Energy
Provider Companies rather than individual consumers to be a viable method [9].
It is well established that energy storage
encompasses a wide range of types and applications. Some energy storage systems
contribute to the production side, while others provide benefits to the
consumption side. Studies on production-side energy storage are typically
categorized in the literature under terms such as "grid-scale" or
"large-scale" energy storage [10,11,12,13,14,15,16,17,18].
Conversely, research on consumption-side energy storage systems is generally
found under the terms "user-side" or "demand-side" energy
storage systems [19,20,21,22,23]. When a widespread
adoption of consumption-side energy storage is achieved, it can substantially
reduce energy consumption during peak hours. The immense benefits targeted in
this study largely derive from this reduction in peak consumption. Therefore,
this article classifies energy storage systems as either production-side or
consumption-side as a novel concept.
There is no specific study in the literature yet to
classify energy storage systems in this way and then compare these two classes.
The reason for this gap can be explained by the fact that consumption side
energy storage systems are not used sufficiently and therefore a noticeable
widespread effect has not been formed. The biggest factor behind this situation
is undoubtedly related to that these systems are not profitable enough yet and
cannot amortize themselves in a reasonable period of time [24]. As a result, consumption-side energy storage
applications are mostly limited to applications emphasizing consistent and
reliable energy needs.
On the production side, large-scale energy storage
systems undeniably contribute significantly to improving the efficiency of
power plants and maintaining grid stability. However, in theory, implementing energy
storage on the consumption side—where consumers acquire storage systems
tailored to their needs—holds the potential for even greater benefits. Beyond
the advantages listed earlier, when energy outages occur due to reasons such as
natural disasters, overloads or unexpected failures, having energy storage
systems in homes can provide significant benefits in terms of preventing
consumers from being victimized and protecting energy companies from
compensation. In addition, energy storage on the consumption side also prepares
the necessary infrastructure to a large extent for the widespread use of
renewable energy. Because an energy storage system can be transformed into a
Solar Energy System by simply adding solar panels [25,26]
and even into a Microgrid system [27,28,29,30] if
the necessary infrastructure is prepared.
Chapter 1 compares production-side and
consumption-side energy storage, highlighting the advantages of
consumption-side energy storage. Chapter 2 delves into the fundamental
characteristics of Residential Energy Storage Systems (RESS) within the
consumption-side energy storage concept. This chapter also explains why the
simulation study excludes commercial and industrial consumers. Chapter 3
evaluates the economic feasibility of RESS. Chapter 4 describes the
simulation's organization and the functions of its modules. Chapter 5 analyzes
the simulation results to underscore the importance of consumption-side energy
storage.
In the conclusion section, the striking conclusions
obtained from these analyses are listed under the following headings and
presented to the attention of the scientific world, energy companies and the
authorities that determine energy policies in the USA and other countries of
the World.
- Shifting energy consumption during peak hours to the night,
- Preventing overloading of energy lines,
- Reducing the need for production plants,
- Obtaining significant economic gains by postponing the required energy investments.
- More effective use of renewable energy sources,
- Extra economic benefits that may arise for Energy Provider companies (EPC) and consumers,
- Environmental effects
2. Comparison of Production-Side and Consumption-Side Energy Storage
Production-side energy storage systems can be
considered a different type of power generation facility. Like other power
plants, they rely on energy transmission and distribution networks to deliver
stored energy to consumers [31,32,33,34,35]. In
contrast, consumption-side energy storage systems are located within consumer
premises, either avoiding the use of energy transmission lines entirely or
utilizing a limited local network [36,37,38,39,40].
Production-side energy storage systems generally involve large-capacity
systems, whereas consumption-side energy storage systems consist of numerous
small-capacity units. The capacity of a consumption-side energy storage system
is tailored to the consumer's energy consumption requirements.
The fundamental characteristics and benefits of
production-side and consumption-side energy storage are addressed separately
below.
Energy storage on the production side increases the
efficiency of power plants, ensures that excess energy is stored and utilized,
and maintains the stability of the energy network by contributing to the
increase in production when consumption increases [41,42,43].
When an energy production plant owner installs a
large-scale energy storage system in addition to the energy production plant,
he can increase the efficiency of the power plant both physically and
economically. For example, short-term interruptions in solar and wind energy
production plants are prevented with the contribution of energy storage systems
and the energy produced is made continuous and stable [44,45,46,47,48,49,50]. The excess energy produced at night or the
energy that would normally be sold cheaply is stored to sold during the hours
when energy prices are high, thus increasing the efficiency of energy
production plants economically [51,52]. All
the applications mentioned above have benefits in maintaining the stability of
the energy system [53,54]. Especially during
peak hours when energy consumption increases a lot, the provision of energy to
the grid by large-scale energy storage systems in addition to energy production
plants is an important benefit in preventing grid collapses [55,56].
In consumption-side energy storage, the previously
mentioned benefits, such as improving both the physical and economic efficiency
of power plants and enhancing the stability of the energy grid, are already
directly or indirectly present. Additionally, numerous other advantages discussed
in the introduction, such as reducing peak consumption, alleviating the load on
energy transmission lines, and postponing energy investments, can also be
achieved. Among these benefits, a reduction in environmental harm is also
notable. By deferring new energy investments, the need for additional land is
reduced, which helps minimize the use of natural and agricultural areas for
energy production. As a result, this approach makes a significant contribution
to the preservation of nature.
Consumption-side energy storage enables consumers
to store cheap nighttime energy purchased from the grid or energy generated
on-site, which can then be used during peak hours. This reduces demand on power
plants during peak hours and prevents overloading of energy transmission lines [57,58]. In other words, since the need for new
power plants and transmission lines is determined by peak consumption levels,
if consumers utilize stored energy during peak hours instead of relying on the
grid, the demand for new power plants and transmission lines is minimized.
Consumption-side energy storage systems come in
varying capacities. For instance, if a significant number of households store
all the energy needed for daytime or evening peak hours during nighttime, this
process effectively shifts nighttime energy production to daytime consumption.
Such applications help utilize surplus energy produced at night more
effectively. Hydropower plants, geothermal power plants, and wind turbines can
benefit significantly from this advantage.
3. Consumption-Side Energy Storage and Residential Energy Storage Systems (RESS)
In this study, the analysis of consumption-side
energy storage focuses on residential consumers, with the energy storage
systems installed in their homes referred to as Residential Energy Storage
Systems (RESS). Initially, commercial and industrial consumers were not
prioritized for consumption-side energy storage. The primary reason for
excluding commercial areas is the decline in consumption during peak hours in
many commercial settings. Additionally, as commercial areas mainly consist of
stores and offices, finding suitable spaces for RESS installation may be more
challenging.
Industrial areas, however, present significant
potential for consumption-side energy storage applications. However, the energy
storage systems in industrial areas need to be approached differently from
those in residential areas. This is because industrial consumers are generally
high-power users with direct access to cheaper energy.
The feasibility of implementing a RESS depends on
energy prices and the system's cost. Although the technology required for RESS
is now sufficiently mature and can be considered commonplace, and all functions
required for the operation of a RESS can already be performed by a smart
inverter, it does not seem feasible to expect the implementation of RESS to be
organized by residential consumers. This is due to residential consumers
lacking access to cheap energy, the ability to acquire RESS systems at low
costs, and sufficient knowledge on the topic. However, as proposed in the
author's previous study [9], if RESS
deployment is organized by Energy Provider Companies (EPC), significant
benefits can be achieved for EPCs, residential consumers, and the national
economy. Furthermore, RESS could provide substantial advantages in overcoming
temporary energy crises caused by natural disasters or unforeseen failures.
Humanity now lives in an era heavily dependent on energy, and stored energy
that ensures uninterrupted energy comfort has become a critical factor.
According to the proposed concept, EPCs can make
RESS feasible by storing cheap energy obtained during night periods in RESS
units installed in residential areas and selling this energy back to
residential consumers during peak periods at peak-period prices. This approach
enables EPCs to achieve approximately 62% higher profits than standard
practices (Table 1). For this model to be
sustainable, EPCs allocate a portion of the additional economic revenue
generated toward RESS costs, share another portion with consumers hosting RESS
units, and retain the remainder for themselves. Alternatively, EPCs and
consumers may seek support from external sponsors to facilitate this
organization.
The most critical and costly component of a RESS
device is the battery. The battery's cost and lifespan directly impact the
feasibility of RESS. While various battery types can be used in RESS
applications, the most suitable alternatives are Lithium-Ion (Li-Ion) and
Lithium Iron Phosphate (LiFePO4) batteries. Comparing these two types, Lithium
Iron Phosphate (LiFePO4) batteries are more favorable for RESS applications in
terms of both cost and cycle life. Thus, this simulation study uses LiFePO4
batteries.
Based on the cycle life of LiFePO4 batteries, agreements between energy provider companies and residential consumers who agree to use RESS are expected to last 10–12 years. This duration aligns with the average lifespan of LiFePO4 batteries, which ranges from 2,000 to 10,000 cycles, assuming one charge-discharge cycle per day. EPCs require this critical duration to generate sufficient revenue to cover RESS costs and achieve the desired economic benefits. Although the energy density of LiFePO4 batteries is not as high as Li-Ion batteries, finding enough space for batteries in residential areas is not as critical an issue as it is in electric vehicles. Additionally, LiFePO4 batteries are more attractive for RESS applications due to their lower costs, longer lifespan compared to Lithium-Ion batteries, lower risk of explosion, and reduced environmental impact [59,60,61,62].
4. Economic Analysis of the Applicability of RESS
The number of years it will take for a RESS to pay for itself depends on the daily consumption amount, energy prices and the production cost of the RESS device. RESS usage does not seem economically viable for consumers with very low consumption power. However, when we look at the statistics, the average electrical energy consumption in the peak period for consumers in residential areas in the USA is 11.8 kWh [6,7,8,65]. This amount is sufficient for RESS application.
In Table-1, considering the average energy purchase and sale prices in the USA, it is seen at what prices an Energy Providing Company (EPC) buys electrical energy from producers during the day, night and peak periods and at what price it sells to consumers and how much profit they make on a daily basis. In Table-1, the daily average energy consumption amount for residential consumers is also seen. Although these data may vary depending on grid areas, seasons, and special circumstances in the USA, they can provide an idea of the applicability of a RESS [66,67,68].
Based on the data in Table 1, an EPC that purchases energy at nighttime rates, stores it in a RESS, and sells it during peak periods achieves an average profit margin 62% higher than their normal margin. If this practice continues for the lifespan of the LiFePO4 batteries used in the RESS, which is approximately 10–12 years (4380 days), the financial outcomes over a 12-year RESS agreement are summarized in Table 2.
Another important factor affecting the feasibility of RESS (Residential Energy Storage Systems) is the potential cost of the devices. The main components of a RESS include LiFePO4 batteries, inverters/chargers, switching systems, cooling fans, necessary measurement components, displays, and essential metal parts. Among these components, LiFePO4 batteries and inverters/chargers are undoubtedly the most expensive.
According to recent market statistics, LiFePO4 battery prices are expected to drop below $75 per kWh by 2030 [69,70,71]. Considering the high-volume purchases anticipated for RESS applications, a price of $70/kWh for LiFePO4 batteries can be assumed.
Inverter/charger prices vary depending on their power ratings and estimated usage duration. For a 5 kW inverter/charger with an expected service life of 12 years, the average market price in bulk purchases ranges between $1000 and $2500. However, it is more appropriate for inverters/chargers in RESS systems to be integrated as embedded units within the system rather than standalone devices. Therefore, lower prices than those mentioned above are possible. Additionally, given the high number of RESS units expected to be deployed over the long term, bulk purchasing of materials will likely result in significant cost reductions. As a result, the cost of an inverter/charger is estimated at $800.
The remaining budget for switching systems, cooling fans, necessary measurement components, displays, essential metal parts, miscellaneous components, and labor can be set at $700.
Thus, the total cost of a RESS with a storage capacity of 10–15 kWh and an inverter power rating of 5 kW is expected to range between $2200 and $2500. For instance, as shown in Table-3, a calculation based on the daily average energy consumption of a residential consumer during peak periods (11.8 kWh) yields a RESS cost of $2420, which falls within the $2200–$2500 range.
For consumers with higher consumption than the average, the profit margins presented in Table 2 also increase, making higher RESS costs manageable. Additionally, since the costs of components like switching systems, fans, measurement tools, displays, metal parts, and labor expenses do not vary significantly, there may be partial economic advantages. However, the same cannot be said for consumers with low power consumption. For these users, the high cost of RESS remains significant compared to the lower profit margins. Therefore, it would be more suitable to propose RESS applications for residential consumers with peak-period consumption exceeding 10 kW.
Based on Table 2, a RESS generates $4000 additional profit over 12 years. Table 3 shows an average RESS cost of $2420, indicating that these profits can comfortably cover the system's cost. To ensure sustainability, profit-sharing between residential consumers and EPCs is recommended. Even if consumers see no direct financial benefits, uninterrupted energy supply remains a significant advantage. Offering residential consumers, a 5%–10% discount on bills for adopting RESS could make the system more attractive and sustainable. Simulations suggest discounts in the bills could range from 0% to 13%, depending on different scenarios.
5. Simulation of Energy Storage in Residential Areas and Widespread Impact Analysis
5.1. Objective of the Simulation:
The objective of this simulation is to generate various outcomes based on different scenarios to analyze the potential benefits for both EPCs (Energy Providing Companies) and consumers when energy storage systems are installed in residential areas. Additionally, the simulation aims to evaluate the possible national benefits resulting from the widespread impact created when the number of such systems reaches the desired level.
5.2. General Data Used in the Simulation:
5.2.1. General Information About Electric Consumer Accounts:
5.2.2. General Information About Electric Consumer Accounts:
Table 5 presents the production and consumption data in the United States, both in aggregate and for each grid area separately. It also includes data on daytime, peak, and nighttime consumption by residential, commercial, and industrial consumers (with the assistance of ChatGPT). [63,75]. The table reveals a high degree of similarity in the production-to-consumption ratios across the grid areas in the United States, indicating that RESS analysis results can be generalized nationwide.
5.2.3. Energy Prices, RESS Costs, and Economic Return Criteria
The energy prices, RESS costs, and economic return criteria used in the simulation are drawn from the detailed discussion in Chapter 4. Inflation and the time value of money over the years have been disregarded in these calculations.
5.2.4. Scenarios and Calculations for Widespread Impact Analysis
For the widespread impact analysis, it is assumed that RESS adoption will progress incrementally, starting with 5 million consumers, then reaching 10 million, 20 million, and finally 40 million consumers. With 130 million residential consumers in total, 40 million represents 30% of the total consumers on average. [76,77,78].
5.2.5. Determination of Load Capacity on Energy Transmission Lines and Future Projections
The current average peak period consumption is approximately 730 GW, resulting in an average 90% load on key transmission lines (with the assistance of ChatGPT) [65,79,80,81]. Based on this data, the maximum capacity of key transmission lines is set at 812 GW. To better evaluate the widespread impact of RESS, it is assumed that this critical load level will increase by 10–11% in the coming years, reaching 900 GW. This increase is projected to occur in approximately 13.66 years (with the assistance of ChatGPT) [82,83].
5.2.6. Economic Data on Energy Production and Transmission Investments
When general data on transmission line investments in the United States and previously constructed projects are examined, a generalization can be made as seen below [63,84,85,86,87,88,89].
Energy production investment per 1 GW: $600 million, requiring 1 year.
Energy transmission capacity increase per 1 GW: $300 million, requiring 2 years.
5.3. Functions of Simulation Modules (Parts)
5.3.1. Part-1
This part calculates the number of consumers and their average consumption power during peak periods for residential, commercial, and industrial areas (Figure 4.1). The total consumption power is calculated by multiplying the average consumption power per consumer by the number of consumers and then converting the units from kW to GW. Scenarios for future years are generated by adjusting the average power per consumer and the number of consumers. Additionally, the "Rate of Increase in Total Consumption" coefficient can be directly modified to adjust total consumption figures.
5.3.2. Part 2-3
The applicability of RESS depends on energy prices and the cost of RESS. In Part-2 (Figure 4.2a), energy prices and the daily amount of money paid for energy by a Residential consumer with an average consumption power according to these prices, and the average daily economic gain obtained by EPCs from a consumer with an average consumption power are considered. In addition, the daily extra economic income obtained by EPCs when they use the RESS system and buy electricity at night price and sell it at day price is calculated. Using this information and assuming that the average life of LiFePO4 batteries is approximately 12 years, Consumers' Bill for Peak Period, Conventional Annual Revenue of EPC for Peak Period, Annual Revenue of EPC for Peak Period with RESS Application, Total Profit of the EPC for the RESS Application values are calculated. The Total Profit of the EPC for the RESS Application value is accepted as the highest possible profit amount and this value is used as a reference value in calculating other profit rates.
In Part-3, an estimated RESS cost is calculated by taking into account the prices of the components that make up the RESS (Figure 4.2b). The RESS cost is a criterion that significantly affects the attractiveness of the RESS application. For this reason, the factors that affect the RESS cost are also added to the simulation. Thus, it is analyzed how the changes in the RESS cost affect the economic gains of EPCs and Residential consumers.
Since the Dept of the Discharge (DoD) rate in LiFePO4 batteries varies between 85%-95% on average, the DoD rate is accepted as 90% in the simulation and the calculated LiFePO4 battery capacity is multiplied by the coefficient 1.11.
Part-3 also includes scenarios on how organizations can be made to cover the RESS costs. How each scenario affects the profit rates of the EPC and the consumer is analyzed. The results of different scenarios are shown in Table-6. The profit rate of the EPCs is kept 20% higher than the profit rate of the consumers. Because even if the consumers do not have any economic gain, the continuous energy comfort they will obtain thanks to the RESS application is accepted as a separate gain. The highest profit rate for the EPC and the consumer is seen when they receive full support in the form of a grant from the external sponsor for the RESS cost. Even if the grant rate is reduced to 50%, higher profit rates are obtained compared to the other scenarios. The External Sponsor can be government support or a financial institution.
The government grant can be 100% or partial grant. In scenario-4, it is assumed that a financial institution that covers the RESS cost receives back the capital it invested with 20% interest. In scenarios 7-8 and 9, different options produced by the EPC and the consumer to cover the RESS cost with their own means and the profit rates they obtain for these options are seen (Table 6).
5.3.3. Part-4
The number of consumers using RESS, the total power of RESS, the rate of RESS application affecting the Peak Period and Night Period consumption are discussed in this part.
In the simulation, the average consumption power of consumers in residential areas is assumed to be 2.4 kW. The energy capacity of a RESS that can provide this power during a 5-hour peak period is also found as 13.32 kWh in Part-3. However, since the rate of RESS affecting the total power (GW) in peak and night periods and the rate of affecting the total load (GW) of power lines are discussed in this part, the average power value (kW) is used instead of the amount of energy stored by RESS. Instead of converting the power of RESSes from kW to GW, this value is entered as one in a million when the number of RESS users is entered into the simulation, so the result is again found in GW.
The number of Residential consumers using the RESS system and the total power obtained depending on this number (in GW) are given in Figure 4.3. In addition, how much the consumption power in the daytime period decreases and how much the nighttime period power increases thanks to the RESS connected to the energy system is calculated in this part both in quantity and in ratio (Figure 4.3).
5.3.4. Part-5
In this part, the reduction in the production power and the loading rate on the energy lines and the savings obtained in energy investments are shown accordingly (Figure 4.4). The investment amount required to increase the capacity of the energy lines by 1 GW is accepted as $300M and the required time is accepted as 2 years. The investment required for a 1 GW increase in energy production is accepted as $500M and the time is accepted as one year. Thanks to this part, how RESS affects investments in the near future is analyzed.
6. Analysis of Simulation Results
Simulation results are presented in Table 6, Table 7 and Table 8 according to three scenario groups. The changes made in each scenario group are explained at the top of the tables.

Table 6.
First group scenarios.
|
Scenarios: Sc-1a, Sc-1b, Sc-1c, Sc-1d, Sc-1e Average Peak Pd Consumption/per consumer: 2.4 kW, The Number of the Residential Area Consumer: 130 million Increase rate in total consumption: 0%, The number of the RESS user is increased as 0 – 5M – 10M -20M – 40M | |||||
| Power values (GW) and Ratios (%) | Sc-1a | Sc-1b | Sc-1c | Sc-1d | Sc-1e |
| Peak Pd Energy Consumption Power for Residential Consumers (GW) | 312.00 | 300.00 | 288.00 | 264.00 | 216.00 |
| Amount of decrease in Energy Consumption Power during Peak Period for Residential Consumers (%) | 0.00 | 3.86 | 7.692 | 15.38 | 30.77 |
| Night Pd Energy Consumption Power for Residential Consumers (GW) | 165.2 | 171.9 | 178.5 | 191.9 | 218.5 |
| The amount of increase in the energy consumption power during the night period for Residential Consumers (%) | 0.00 | 4.04 | 8.07 | 16.14 | 32.28 |
| Loading rate on Energy Lines (%) | 86.85 | 85.35 | 83.85 | 80.85 | 74.85 |
| Total Generation Power Required for Peak Period (GW) | 715.6 | 703.3 | 690.9 | 666.2 | 616.8 |
| Total Generation Power Required for Night Period (GW) | 170.2 | 177.0 | 183.9 | 197.6 | 225.1 |
| Increase in Power Quantity (GW) | 0.00 | 0.00 | 0.00 | 0.00 | 0.00 |
| Needed Investment for the New Transmission Lines (Billion $) | 0.00 | 0.00 | 0.00 | 0.00 | 0.00 |
| Needed Year for the New Transmission Lines Setting (Year) | 0.00 | 0.00 | 0.00 | 0.00 | 0.00 |
| Needed Investment for the New Power Plants (Billion $) | 0.00 | 0.00 | 0.00 | 0.00 | 0.00 |
| Needed Year for the New Power Plants Setting (Year) | 0.00 | 0.00 | 0.00 | 0.00 | 0.00 |
| Needed Total Investment (Billion $) | 0.00 | 0.00 | 0.00 | 0.00 | 0.00 |
According to the first group scenarios presented in Table-6, as the number of consumers using RESS in Residential areas increases, the peak period consumption power decreases by 30.77%, while the night period consumption increases by 32.28%. In other words, approximately 30% of the peak period consumption power in Residential areas is shifted from the peak period to the night period. This change causes the required energy production power in Peak Period to gradually decrease from 715.6 GW to 616.8 MW. This situation causes a total decrease of 13.8% in energy production and 12% in the loading of power lines.
According to the second group scenarios presented in Table-7, it is seen how much the increase in consumption in the Peak Period in Residential areas in the coming years will probably increase energy production and how much extra load will occur on energy lines. In addition, the estimated budget amounts to be allocated for new energy production plants and energy transmission lines and the estimated durations required depending on these increases are seen.
The second group scenarios are prepared to show the advantages that the third group scenarios will provide. In the second group scenarios, it is seen how the new investment needs arising from new energy plants and new energy transmission lines can be reduced and accommodated depending on the use of RESS in the next scenario.
In the third group scenarios, the consumption power is increased by 20%. Accordingly, it is seen that the 2024 energy production capacity determined as 800GW is 98.77GW more than normal and the existing energy lines are insufficient.
Assuming that the annual growth rate changes by 1%-1.5 [90,91], it is estimated that the higher consumption amount of 20% mentioned in the simulation will be reached within 15-20 years. The time required for the construction of the energy transmission lines needed in the simulation is found to be 19.75 years. The budget to be allocated for the new energy transmission lines that need to be established to carry the 98.77GW consumption increase in question is found to be 29.63 billion. Similarly, it is seen that a period of 9.88 years and a budget of 49.39 billion are needed for energy production plants. (These calculations ignore the value that money will lose over the years due to inflation).
In the third group of scenarios, the number of Residential consumers using RESS is gradually increased to 5M, 10M, 20M and 40M, and it is seen that the need for new energy transmission lines and energy plants decreases at each stage, and accordingly, the costs to be spent decrease and the time required for installation also decreases. When it is assumed that 40M Residential area consumers use RESS, it is seen that a 20% increase in energy consumption can be absorbed.
7. Conclusions and Planned Studies
This paper aims to highlight the immense economic benefits that can be achieved by successfully implementing consumer-side energy storage and reaching 40 million consumers to create a widespread impact. The simulation developed for this purpose consists of two main sections:
In the first section, scenario-based analyses demonstrate how consumer-side energy storage, which is not typically economically viable, can become feasible through various organizational strategies. These analyses consider electricity prices, the costs and lifetimes of potential storage systems, possible organizational options, and estimated economic benefits for both consumers and EPCs (Energy Providing Companies). The focus is on consumer-side energy storage systems in residential areas, referred to as RESS (Residential Energy Storage Systems).
The second section conducts a widespread impact analysis. In these analyses, it is assumed that the number of RESS users gradually increases to 5 million, 10 million, 20 million, and finally 40 million. For each scenario, the following metrics are calculated:
The amount of power shifted from peak periods to nighttime.
The reduction in load on energy transmission lines.
The decrease in energy production requirements.
Additionally, the potential economic gains and time savings associated with deferring the need for new energy generation plants and transmission lines are analyzed.
The conclusions derived from analyzing the simulation results are listed below. This is followed by a discussion of how consumer-side energy storage can be implemented and an overview of further studies planned as a continuation of this work.
7.1. Conclusions Derived from the Simulation Results
a) While the organization of RESS applications by consumers alone is not economically feasible, the applications become viable when organized by EPCs. Simulation results demonstrate that RESS applications can provide additional economic benefits for both EPCs and consumers, making the systems both feasible and sustainable.
b) In addition to economic benefits, the advantage of having stored energy can significantly enhance living comfort for consumers. Energy storage systems can minimize consumer grievances caused by power outages resulting from natural disasters, unexpected failures, or overloads. Reducing these grievances also benefits EPCs, as customer satisfaction increases, and the compensation amounts they sometimes need to pay to consumers are reduced.
c) Simulation results indicate that when approximately 30% of residential area consumers (around 40 million consumers) adopt RESS, 96 GW of power, which contributes to overloading during peak hours, can be shifted to nighttime. Increasing nighttime consumption enables more efficient economic use of renewable energy sources like hydroelectric, wind, and geothermal energy, which often operate at lower utilization rates during off-peak periods due to reduced demand.
d) A RESS system already includes an inverter/charger and a battery bank. By adding photovoltaic (PV) panels, it can easily be converted into a solar PV energy system. If smart inverters are considered during the organization of RESS systems, these systems can also be transformed into microgrid systems. Thus, RESS applications can serve as a significant catalyst for the transition to renewable energy. Additionally, the initial economic gains from deferring investments can largely be converted into permanent benefits. Besides residential systems, energy storage systems can also be organized for commercial and industrial sectors. Overall, these consumer-side energy storage systems can extend the timeline for new energy investments for many years. If combined with the microgrid concept, it is theoretically possible that future investments to increase energy transmission capacity may no longer be necessary in the United States.
e) Simulation results show that shifting 96 GW of power from peak to nighttime reduces the energy generation capacity needed during peak periods by an average of 13.8% and significantly alleviates the load on transmission lines. These reductions defer the need for new energy generation plants and transmission lines. According to the simulation, if 40 million residential consumers adopt RESS, investments of approximately $30 billion in transmission lines (required within the next 20 years) and $50 billion in energy generation plants (required within the next 10 years) can be postponed. Considering the average profitability rates in U.S. markets, even if the government covers all RESS costs for these 40 million consumers, the deferred costs and permanent savings would largely offset the expenses.
f) Deferring and minimizing investments in new energy generation plants and transmission lines also reduces environmental concerns such as carbon emissions and the occupation of public and agricultural lands.
7.2. Planned Studies
In this article, in order to maintain the integrity of the subject, the superiority of consumption-side energy storage over production-side energy storage has been emphasized, the applicability of energy-side energy storage has been tried to be proven, and the dimensions of the economic gains that can be obtained when widespread effects occur have been tried to be shown. Therefore, not all the details have been sufficiently covered in the article. It is planned to address these details in future studies.
Initially, it is aimed to conduct a more detailed analysis of possible organizational scenarios for consumer-side energy storage and their economic dimensions. Although a RESS (Residential Energy Storage System) can be built with a smart inverter and a battery bank, it is necessary to develop a prototype system that can perform the same functions at a lower cost. A RESS device primarily consists of LiFePO4 batteries, an inverter/charger, switching systems, cooling fans, necessary measurement components, displays, and essential metal parts. If the goal is to enable RESS to be converted into a Solar PV or microgrid system when needed, the inverter must be selected accordingly. This factor directly impacts the cost of the RESS. Considering all these aspects, it is intended to approach this subject as a lab study and subsequently as a research paper.
The economic analyses presented in this paper do not account for the depreciation of money over time due to inflation. Moreover, it is planned to explore in a separate study how the time required to achieve widespread adoption of RESS might affect the overall impact and the substantial savings from deferred investments.
A separate investigation is needed to analyze how RESS applications should be implemented in different grid regions. There are significant differences between U.S. grid regions in terms of energy management, the types of energy companies, and the characteristics of their transmission systems. Consequently, the extent to which each grid region is affected by overloads can vary. These factors also influence the amount of savings achieved from deferred investments. Hence, it is planned to address these details through a separate simulation study.
The availability of inexpensive nighttime energy is a crucial criterion for consumer-side energy storage. When widespread adoption of RESS is achieved, a significant increase in nighttime energy consumption is expected. The batteries of rapidly growing electric vehicle fleets are also typically charged during nighttime periods, benefiting from lower energy costs. Therefore, it is planned to analyze the impact of electric vehicles during the widespread adoption phase of RESS.
In addition to the short-term research goals outlined above, it is planned to investigate the long-term contributions of the consumer-side energy storage concept to smart grid developments. For instance, one of the smart grid goals is to benefit from the energy stored by electric vehicles during times when peak consumption increases very suddenly [92,93,94,95]. A RESS designed in accordance with the micro grid system and capable of transferring the energy in electric vehicles to the grid when necessary, can provide significant support to the Smart grid system in this regard.
Funding
This research received no external funding.
Data Availability Statement
The original contributions presented in the study are included in the article, further inquiries can be directed to the corresponding author.
Conflicts of Interest
The author declares no conflicts of interest.
References
- U.S. Energy Information Administration (EIA). Electricity Explained: How Electricity Is Delivered to Consumers. U.S. Department of Energy. Last modified March 2023. https://www.eia.gov/energyexplained/electricity/delivery-to-consumers.php (Accessed December 14, 2024).
- Joskow, Paul L. Vertical Integration and Long-Term Contracts: The Case of Coal-Burning Electric Generating Plants. Journal of Law, Economics, and Organization 1985, 1, 33–80.
- Borenstein, Severin, and James Bushnell. The U.S. Electricity Industry after 20 Years of Restructuring. Annual Review of Economics 2015, 7, 437–463.
- Michaels, Robert J. Vertical integration and the restructuring of the US electricity industry. SSRN 2006. Available online: https://papers.ssrn.com/abstract=595565 (Accessed December 14, 2024).
- MacKay, Alexander, and Ignacia Mercadal. Deregulation, Market Power, and Prices: Evidence from the Electricity Sector. MIT Center for Energy and Environmental Policy Research, 2022.
- U.S. Energy Information Administration (EIA). Electricity Use in Homes. Available online: https://www.eia.gov/energyexplained/use-of-energy/electricity-use-in-homes.php (Accessed December 8, 2024).
- U.S. Energy Information Administration (EIA). Hourly Electric Grid Monitor. Available online: https://www.eia.gov/electricity/gridmonitor/dashboard/electric_overview/US48/US48 (Accessed December 8, 2024).
- U.S. Energy Information Administration (EIA). Energy Consumption Ratios in the USA. Available online: https://www.eia.gov/energyexplained/electricity/use-of-electricity.php (Accessed December 8, 2024).
- Kiray, Vedat. An Opinion on Minimizing the Need for Agricultural and Public Areas While Renewable Energy Production Capacity Is Increasing Rapidly. Frontiers in Energy Research 2023, 11, 1285190.
- Luo, Xiaohu, et al. Energy Storage Technologies for Modern Power Systems: A Comprehensive Review. IEEE Access 2020, 7, 125–132.
- Shrestha, Badri, et al. Battery Technologies for Grid-Level Large-Scale Electrical Energy Storage. Springer Energy Reports 2021, 6, 85–104.
- Brushett, Fikile R., et al. Flow Batteries for Grid-Scale Energy Storage: Challenges and Future Prospects. MIT News 2023.
- Department of Energy. 2022 Grid Energy Storage Technology Cost and Performance Assessment. Available online: https://www.energy.gov/eere/analysis/2022-grid-energy-storage-technology-cost-and-performance-assessment (Accessed December 14, 2024).
- Schimpe, Michael, et al. Energy Storage Systems for Renewable Energy Integration. Renewable Energy 2016, 99, 398–403.
- Zakeri, Behnam, and Sanna Syri. Electrical Energy Storage Systems: A Comparative Life Cycle Cost Analysis. Renewable and Sustainable Energy Reviews 2015, 42, 569–596.
- U.S. Grid-Scale Energy Storage Market Sets Record. Renewable Energy Magazine. Available online: https://www.woodmac.com/press-releases/q3-us-grid-scale-energy-storage-market-sets-new-record/ (Accessed December 14, 2024).
- National Renewable Energy Laboratory (NREL). Grid-Scale U.S. Storage Capacity Could Grow Five-Fold by 2050. Available online: https://www.nrel.gov/news/program/2021/grid-scale-storage-us-storage-capacity-could-grow-five-fold-by-2050.html (Accessed December 14, 2024).
- IRENA (International Renewable Energy Agency). Electricity Storage and Renewables: Costs and Markets to 2030. Abu Dhabi: IRENA, 2017. Available online: https://www.irena.org/publications/2017/Oct/Electricity-storage-and-renewables-costs-and-markets (Accessed December 14, 2024).
- Bakare, Mutiu Shola, Abubakar Abdulkarim, Mohammad Zeeshan, and Aliyu Nuhu Shuaibu. A Comprehensive Overview on Demand Side Energy Management Towards Smart Grids: Challenges, Solutions, and Future Direction. Energy Informatics 2023, 6, 1.
- Mulleriyawage, U.G.K., and W.X. Shen. Impact of Demand Side Management on Optimal Sizing of Residential Battery Energy Storage System. Renewable Energy 2021, 172, 1250–1266.
- Elio, Joseph, Patrick Phelan, Rene Villalobos, and Ryan J. Milcarek. A Review of Energy Storage Technologies for Demand-Side Management in Industrial Facilities. Journal of Cleaner Production 2021, 307, 127322.
- Ding, Yixing, Qingshan Xu, and Yu Huang. Optimal Sizing of User-Side Energy Storage Considering Demand Management and Scheduling Cycle. Electric Power Systems Research 2020, 184, 106284.
- Zhang, Hongye, Li Kang, and Jinjian Cai. Optimal Configuration of User-Side Energy Storage Considering Load Response and Demand Management. In Proceedings of the 2021 IEEE 4th International Conference on Electronics Technology (ICET), Chengdu, China, 8–12 May 2021; pp. 1168–1177.
- NREL Blog. When Does Energy Storage Make Sense? Available online: https://www.nrel.gov/state-local-tribal/blog/posts/when-does-energy-storage-make-sense-it-depends.html (Accessed December 14, 2024).
- Kiray, Vedat. A Research Study to Increase Usage of PVs in Residential Areas. Frontiers in Energy Research 2021, 9, 680304.
- Kiray, Vedat, Taner Topal, Lütfü Şağbanşua, and İsmail Atacak. A Modelling Study of Renewable and Stored Energy Sharing and Pricing Management System Developed for Multi-Apartment Complexes. In Proceedings of the IEEE PES Innovative Smart Grid Technologies Europe, Istanbul, Turkey, 12–15 October 2014; pp. 1–6.
- Hartono, B.S., Yan Budiyanto, and Rudy Setiabudy. Review of Microgrid Technology. In Proceedings of the 2013 International Conference on QiR, Yogyakarta, Indonesia, 25–28 June 2013; pp. 127–132.
- Mahmoud, Magdi S., Mohamed Saif Ur Rahman, and Fouad M. AL-Sunni. Review of Microgrid Architectures–A System of Systems Perspective. IET Renewable Power Generation 2015, 9, 1064–1078.
- Zhou, Xuesong, Tie Guo, and Youjie Ma. An Overview on Microgrid Technology. In Proceedings of the 2015 IEEE International Conference on Mechatronics and Automation (ICMA), Beijing, China, 2–5 August 2015; pp. 76–81.
- Garg, Vijay Kumar, and Sudhir Sharma. Overview on Microgrid System. In Proceedings of the 2018 Fifth International Conference on Parallel, Distributed and Grid Computing (PDGC), Solan, India, 20–22 December 2018; pp. 694–699.
- Viswanathan, Vilayanur, Kendall Mongird, Ryan Franks, Xiaolin Li, Vincent Sprenkle, and Richard Baxter. 2022 Grid Energy Storage Technology Cost and Performance Assessment. Energy 2022, 202.
- Gür, Turgut M. Review of Electrical Energy Storage Technologies, Materials, and Systems: Challenges and Prospects for Large-Scale Grid Storage. Energy & Environmental Science 2018, 11, 2696–2767.
- Hittinger, Eric, J.F. Whitacre, and Jay Apt. What Properties of Grid Energy Storage Are Most Valuable? Journal of Power Sources 2012, 206, 436–449.
- Denholm, Paul, Jennie Jorgenson, Marissa Hummon, Thomas Jenkin, David Palchak, Brendan Kirby, Ookie Ma, and Mark O'Malley. Value of Energy Storage for Grid Applications. NREL Technical Report 2013, NREL/TP-6A20-58465.
- Castillo, Anya, and Dennice F. Gayme. Grid-Scale Energy Storage Applications in Renewable Energy Integration: A Survey. Energy Conversion and Management 2014, 87, 885–894.
- Gagliano, Antonio, and Francesco Nocera. Analysis of the Performances of Electric Energy Storage in Residential Applications. International Journal of Heat and Technology 2017, 35, S41–S48.
- Aznavi, Sima, Poria Fajri, Reza Sabzehgar, and Arash Asrari. Optimal Management of Residential Energy Storage Systems in Presence of Intermittencies. Journal of Building Engineering 2020, 29, 101149.
- Walker, Awnalisa, and Soongeol Kwon. Analysis on Impact of Shared Energy Storage in Residential Community: Individual Versus Shared Energy Storage. Applied Energy 2021, 282, 116172.
- Kampouris, K.P., Vasiliki Drosou, Constantine Karytsas, and Michalis Karagiorgas. Energy Storage Systems Review and Case Study in the Residential Sector. In IOP Conference Series: Earth and Environmental Science 2020, 410, 012033.
- Demir, Salih, and Vedat Kiray. Analysis of Storage Energy Usage in Residential Areas With Regard to Smart Grids and National Economy. In Proceedings of the 2015 Twelve International Conference on Electronics, Computer and Computation (ICECCO), Abuja, Nigeria, 10–12 September 2015; pp. 1–4.
- Argyrou, Maria C., Paul Christodoulides, and Soteris A. Kalogirou. Energy Storage for Electricity Generation and Related Processes: Technologies Appraisal and Grid Scale Applications. Renewable and Sustainable Energy Reviews 2018, 94, 804–821.
- Kyriakopoulos, Grigorios L., and Garyfallos Arabatzis. Electrical Energy Storage Systems in Electricity Generation: Energy Policies, Innovative Technologies, and Regulatory Regimes. Renewable and Sustainable Energy Reviews 2016, 56, 1044–1067.
- Ho, Wai Shin, Sandro Macchietto, Jeng Shiun Lim, Haslenda Hashim, Zarina Ab Muis, and Wen Hui Liu. Optimal Scheduling of Energy Storage for Renewable Energy Distributed Energy Generation System. Renewable and Sustainable Energy Reviews 2016, 58, 1100–1107.
- Ghiassi-Farrokhfal, Yashar, Fiodar Kazhamiaka, Catherine Rosenberg, and Srinivasan Keshav. Optimal Design of Solar PV Farms With Storage. IEEE Transactions on Sustainable Energy 2015, 6, 1586–1593.
- Lai, Chun Sing, Youwei Jia, Loi Lei Lai, Zhao Xu, Malcolm D. McCulloch, and Kit Po Wong. A Comprehensive Review on Large-Scale Photovoltaic System With Applications of Electrical Energy Storage. Renewable and Sustainable Energy Reviews 2017, 78, 439–451.
- Akeyo, Oluwaseun M., Vandana Rallabandi, Nicholas Jewell, and Dan M. Ionel. The Design and Analysis of Large Solar PV Farm Configurations With DC-Connected Battery Systems. IEEE Transactions on Industry Applications 2020, 56, 2903–2912.
- Atherton, J., Rahul Sharma, and J. Salgado. Techno-Economic Analysis of Energy Storage Systems for Application in Wind Farms. Energy 2017, 135, 540–552.
- Kong, Junhyuk, Sung Tae Kim, Byung O. Kang, and Jaesung Jung. Determining the Size of Energy Storage System to Maximize the Economic Profit for Photovoltaic and Wind Turbine Generators in South Korea. Renewable and Sustainable Energy Reviews 2019, 116, 109467.
- Akrami, Ehsan, Aslan Gholami, Mohammad Ameri, and Majid Zandi. Integrated an Innovative Energy System Assessment by Assisting Solar Energy for Day and Night Time Power Generation: Exergetic and Exergo-Economic Investigation. Energy Conversion and Management 2018, 175, 21–32.
- Zhang, Xinjing, Chao Chris Qin, Eric Loth, Yujie Xu, Xuezhi Zhou, and Haisheng Chen. Arbitrage Analysis for Different Energy Storage Technologies and Strategies. Energy Reports 2021, 7, 8198–8206.
- Pusceddu, Elian, Behnam Zakeri, and Giorgio Castagneto Gissey. Synergies Between Energy Arbitrage and Fast Frequency Response for Battery Energy Storage Systems. Applied Energy 2021, 283, 116274.
- Núñez, Fernando, David Canca, and Ángel Arcos-Vargas. An Assessment of European Electricity Arbitrage Using Storage Systems. Energy 2022, 242, 122916.
- Datta, Ujjwal, Akhtar Kalam, and Juan Shi. Battery Energy Storage System to Stabilize Transient Voltage and Frequency and Enhance Power Export Capability. IEEE Transactions on Power Systems 2018, 34, 1845–1857.
- Datta, Ujjwal, Akhtar Kalam, and Juan Shi. Battery Energy Storage System Control for Mitigating PV Penetration Impact on Primary Frequency Control and State-of-Charge Recovery. IEEE Transactions on Sustainable Energy 2019, 11, 746–757.
- Sagara, Mitsuki, Masahiro Furukakoi, Tomonobu Senjyu, Mir Sayed Shah Danish, and Toshihisa Funabashi. Voltage Stability Improvement to Power Systems With Energy Storage Systems. In Proceedings of the 2016 17th International Conference on Harmonics and Quality of Power (ICHQP), Belo Horizonte, Brazil, 16–19 October 2016; pp. 7–10.
- Zuo, Hao, Yun Teng, Songqing Cheng, Peng Sun, and Zhe Chen. Distributed Multi-Energy Storage Cooperative Optimization Control Method for Power Grid Voltage Stability Enhancement. Electric Power Systems Research 2023, 216, 109012.
- Parra, David, Stuart A. Norman, Gavin S. Walker, and Mark Gillott. Optimum Community Energy Storage System for Demand Load Shifting. Applied Energy 2016, 174, 130–143.
- Barzin, Reza, John JJ Chen, Brent R. Young, and Mohammed M. Farid. Peak Load Shifting With Energy Storage and Price-Based Control System. Energy 2015, 92, 505–514.
- Zhao, Qun-fang, Shu-qiong Zhang, Min-yi Hu, Chang Wang, and Guang-hui Jiang. Recent Advances in LiFePO4 Cathode Materials for Lithium-Ion Batteries. International Journal of Electrochemical Science 2021, 16, 211226.
- Sayfutdinov, Timur, and Petr Vorobev. Optimal Utilization Strategy of the LiFePO4 Battery Storage. Applied Energy 2022, 316, 119080.
- Newton, Graham N., Lee R. Johnson, Darren A. Walsh, Bing Joe Hwang, and Hongxian Han. Sustainability of Battery Technologies: Today and Tomorrow. ACS Sustainable Chemistry & Engineering 2021, 9, 6507–6509.
- Zhu, Shaoqing, Aoming Huang, and Ye Xu. Improving Methods for Better Performance of Commercial LiFePO4/C Batteries. International Journal of Electrochemical Science 2021, 16, 210564.
- U.S. Energy Information Administration (EIA). Electric Power Monthly. Available online: https://www.eia.gov/electricity/monthly/ (Accessed November 21, 2024).
- U.S. Energy Information Administration (EIA). Electricity Data Browser. Available online: https://www.eia.gov/electricity/data/browser/ (Accessed December 14, 2024).
- U.S. Energy Information Administration (EIA). Hourly Electricity Consumption Varies Throughout the Day and Across Seasons. Available online: https://www.eia.gov/todayinenergy/detail.php?id=42915 (Accessed December 8, 2024).
- U.S. Energy Information Administration (EIA). Electric Sales, Revenue, and Average Price. Available online: https://www.eia.gov/electricity/sales_revenue_price/ (Accessed December 12, 2024).
- U.S. Energy Information Administration (EIA). Annual Sales to Ultimate Customers by State and Sector, 2010–2023. Available online: https://www.eia.gov/electricity/data/state/ (Accessed December 12, 2024).
- U.S. Energy Information Administration (EIA). Average Prices of Electricity to Ultimate Customers. Available online: https://www.eia.gov/totalenergy/data/annual/ (Accessed December 12, 2024).
- Reuters. Battery Cell Prices Fall to Record Low in September, Says Report. Available online: https://www.reuters.com/markets/commodities/battery-cell-prices-fall-record-low-september-says-report-2024-10-30/ (Accessed December 12, 2024).
- International Energy Agency (IEA). Trends in Electric Vehicle Batteries. Available online: https://www.iea.org/reports/global-ev-outlook-2024/trends-in-electric-vehicle-batteries (Accessed December 12, 2024).
- Fortune Business Insights. Lithium Iron Phosphate Battery Market Size, Share & Industry Analysis. Available online: https://www.fortunebusinessinsights.com/lithium-ion-li-ion-phosphate-batteries-market-102152 (Accessed December 12, 2024).
- U.S. Energy Information Administration (EIA). Energy Consumption: Residential, Commercial, and Industrial Sectors. Available online: https://www.eia.gov/totalenergy/data/monthly/ (Accessed December 12, 2024).
- U.S. Energy Information Administration (EIA). Residential Energy Consumption Survey (RECS). Available online: https://www.eia.gov/consumption/residential/ (Accessed December 12, 2024).
- Federal Energy Regulatory Commission (FERC). Electricity Markets and Reliability. Available online: https://www.ferc.gov/industries-data/electric (Accessed December 14, 2024).
- Henderson, Michael I., Damir Novosel, and Mariesa L. Crow. Electric Power Grid Modernization Trends, Challenges, and Opportunities. In IEEE Proceedings, November 2017.
- U.S. Energy Information Administration (EIA). Electricity Data. Available online: https://www.eia.gov/electricity/data.php (Accessed December 12, 2024).
- U.S. Energy Information Administration (EIA). Demand-Side Management Program. Available online: https://www.eia.gov/electricity/data.php (Accessed December 12, 2024).
- North American Electric Reliability Corporation (NERC). 2019 Long-Term Reliability Assessment. Available online: https://www.nerc.com/pa/RAPA/ra/Pages/default.aspx (Accessed December 12, 2024).
- International Energy Agency (IEA). Electricity Networks: Time to Accelerate Investment. Available online: https://www.iea.org/reports/investment-in-electricity-networks (Accessed December 1, 2024).
- U.S. Energy Information Administration (EIA). Electricity Explained: Data and Statistics. Available online: https://www.eia.gov/energyexplained/electricity/data-and-statistics.php (Accessed December 1, 2024).
- Henderson, Michael I., Damir Novosel, and Mariesa L. Crow. Electric Power Grid Modernization Trends, Challenges, and Opportunities. IEEE Transactions 2017, November.
- Department of Energy (DOE). Annual U.S. Transmission Data Review. Available online: https://www.energy.gov/oe/articles/annual-us-transmission-data-review-march-2018 (Accessed December 14, 2024).
- U.S. Energy Information Administration (EIA). Form EIA-411, Coordinated Bulk Power Supply and Demand Program Report. Available online: https://www.eia.gov/electricity/data/eia411/ (Accessed December 14, 2024).
- Power-Grid. Underground vs. Overhead: Power Line Installation-Cost Comparison and Mitigation. Available online: https://www.power-grid.com/td/underground-vs-overhead-power-line-installation-cost-comparison/ (Accessed December 14, 2024).
- Statista. Electricity Transmission Lines Under Construction in the United States as of September 2023, by Cost. Available online: https://www.statista.com/statistics/1413981/united-states-electricity-transmission-lines-under-construction-by-cost/ (Accessed December 4, 2024).
- Statista. Transmission and Distribution Operating Expenses for Major Investor-Owned Electric Utilities in the United States from 2006 to 2022. Available online: https://www.statista.com/statistics/619905/transmission-and-distribution-operating-expenses-for-major-electric-utilities-in-the-us/ (Accessed December 14, 2024).
- Transmission Agency of North Carolina (TANC). Understanding Transmission. Available online: https://www.tanc.us/understanding-transmission/transmission-qanda/ (Accessed December 4, 2024).
- Giron, Rachel. Struggles on the Path to Renewable Energy: Lessons from SunZia. Natural Resources Journal 2014, 54, 81–106.
- MISO Energy. Transmission Cost Estimation Guide for MTEP22. Available online: https://cdn.misoenergy.org/20220208%20PSC%20Item%2005c%20Transmission%20Cost%20Estimation%20Guide%20for%20MTEP22_Draft622733.pdf (Accessed December 14, 2024).
- U.S. Energy Information Administration (EIA). Electricity Use in the United States Is Projected to Grow Slowly. Available online: https://www.eia.gov/energyexplained/electricity/use-of-electricity.php (Accessed December 14, 2024).
- U.S. Energy Information Administration (EIA). Electricity Demand and Growth Projections. Available online: https://search.usa.gov/search?utf8=%E2%9C%93&affiliate=eia.doe.gov&query=Electricity+Demand+and+Growth+Projections&search= (Accessed December 14, 2024).
- Sultan, Vivian, Arun Aryal, Hao Chang, and Jiri Kral. Integration of EVs into the Smart Grid: A Systematic Literature Review. Energy Informatics 2022, 5, 65.
- Sharma, S. A Comprehensive Review of Demand-Side Management in Smart Grid With Electric Vehicles. Electrical Engineering 2024, May.
- National Renewable Energy Laboratory. Electric Vehicles Play a Surprising Role in Supporting Grid Resiliency. NREL News 2023, June.
- Smart Energy International. Managing Peak Demand and Grid Flexibility: The Role of Renewable Energy, VPPs, and Vehicle-to-Grid Technology. Smart Energy International 2023, August.
Figure 4.1.
Total consumption calculation for different consumer types.
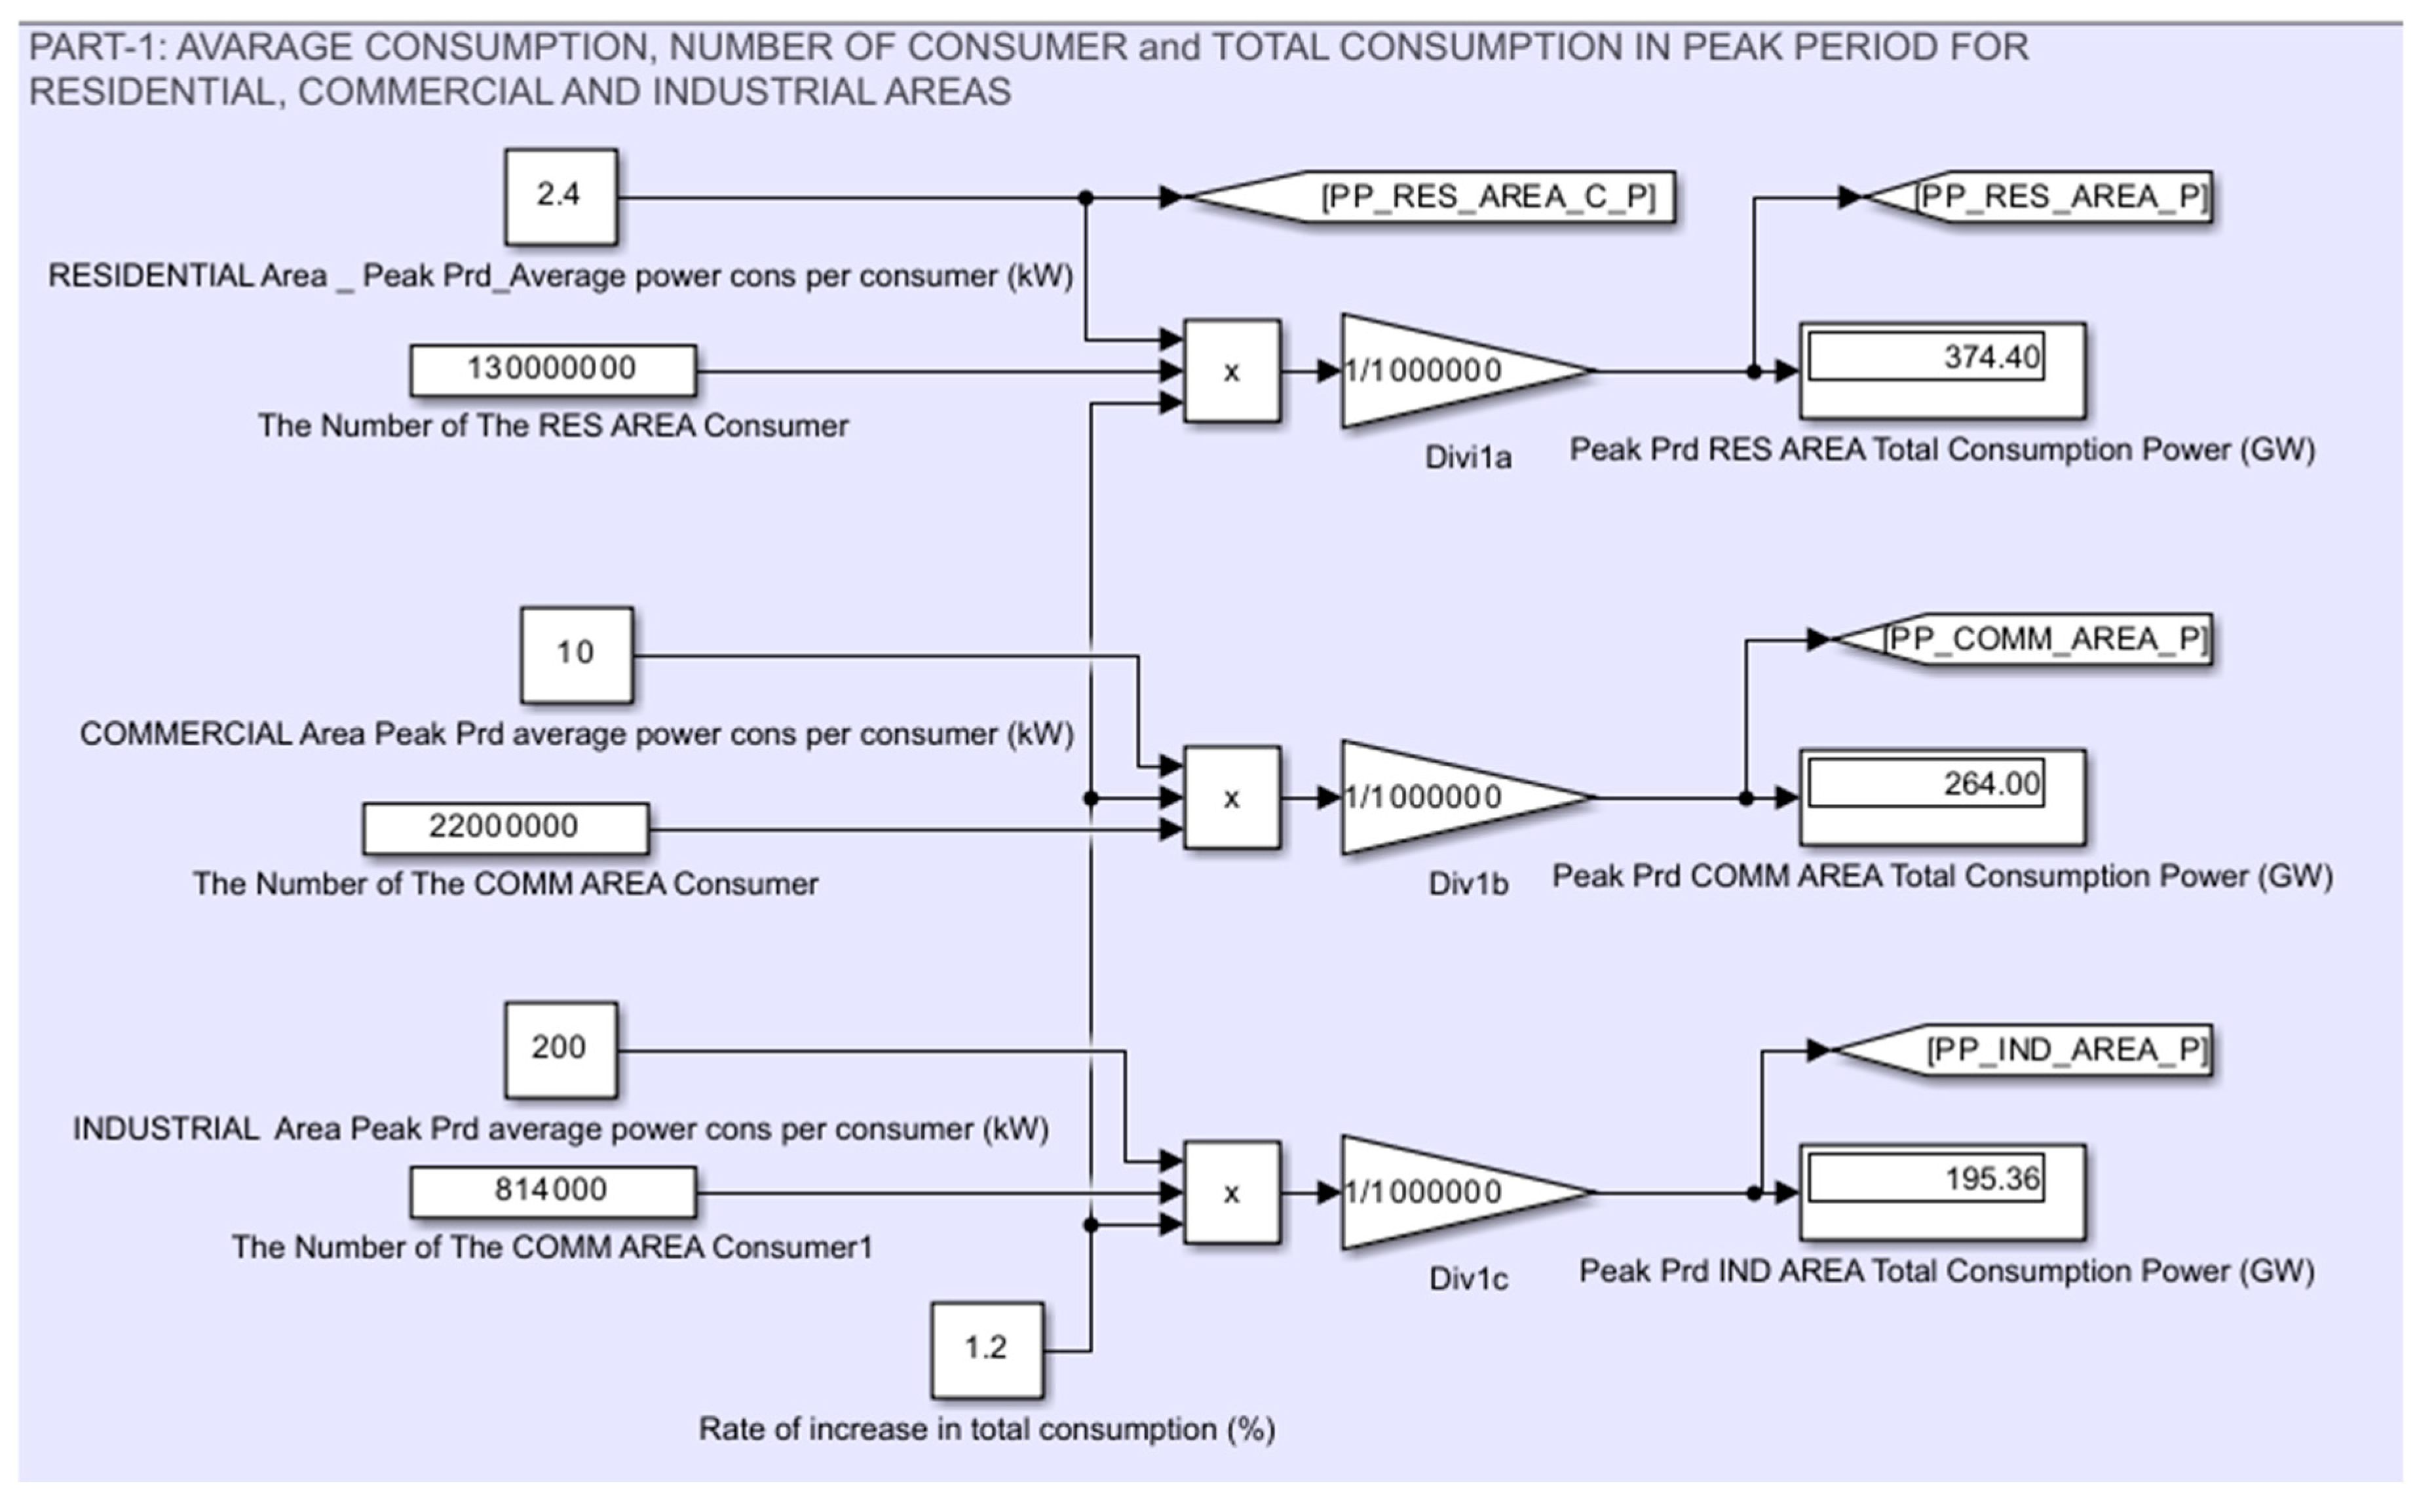
Figure 4.2a.
Some calculations for RESS.
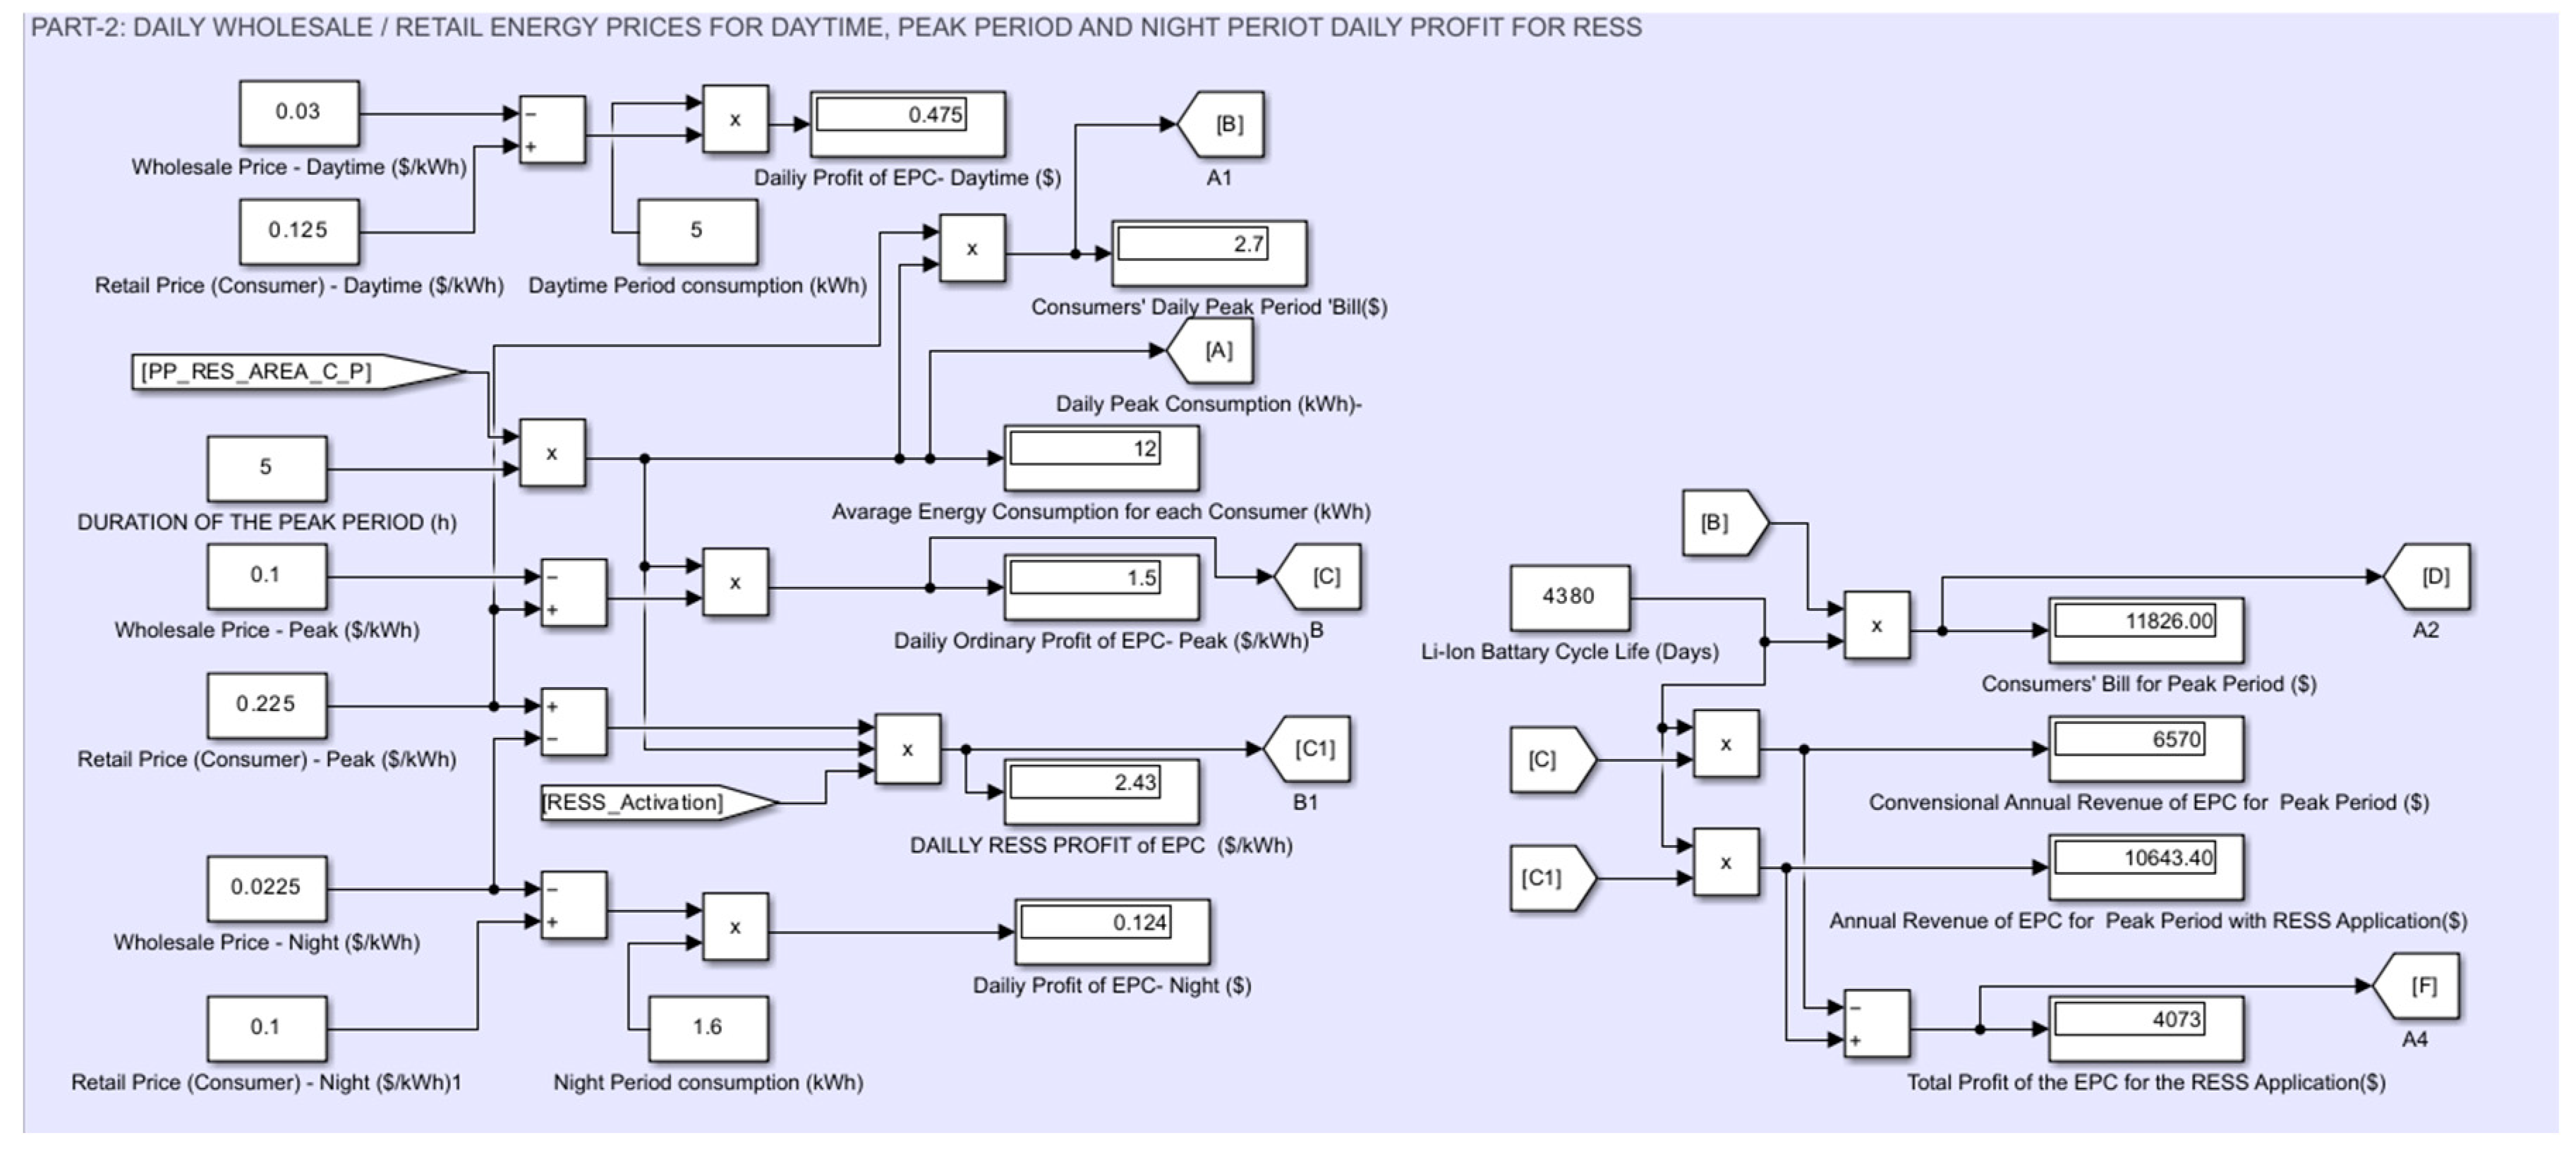
Figure 4.2b.
Scenarios for RESS organization.
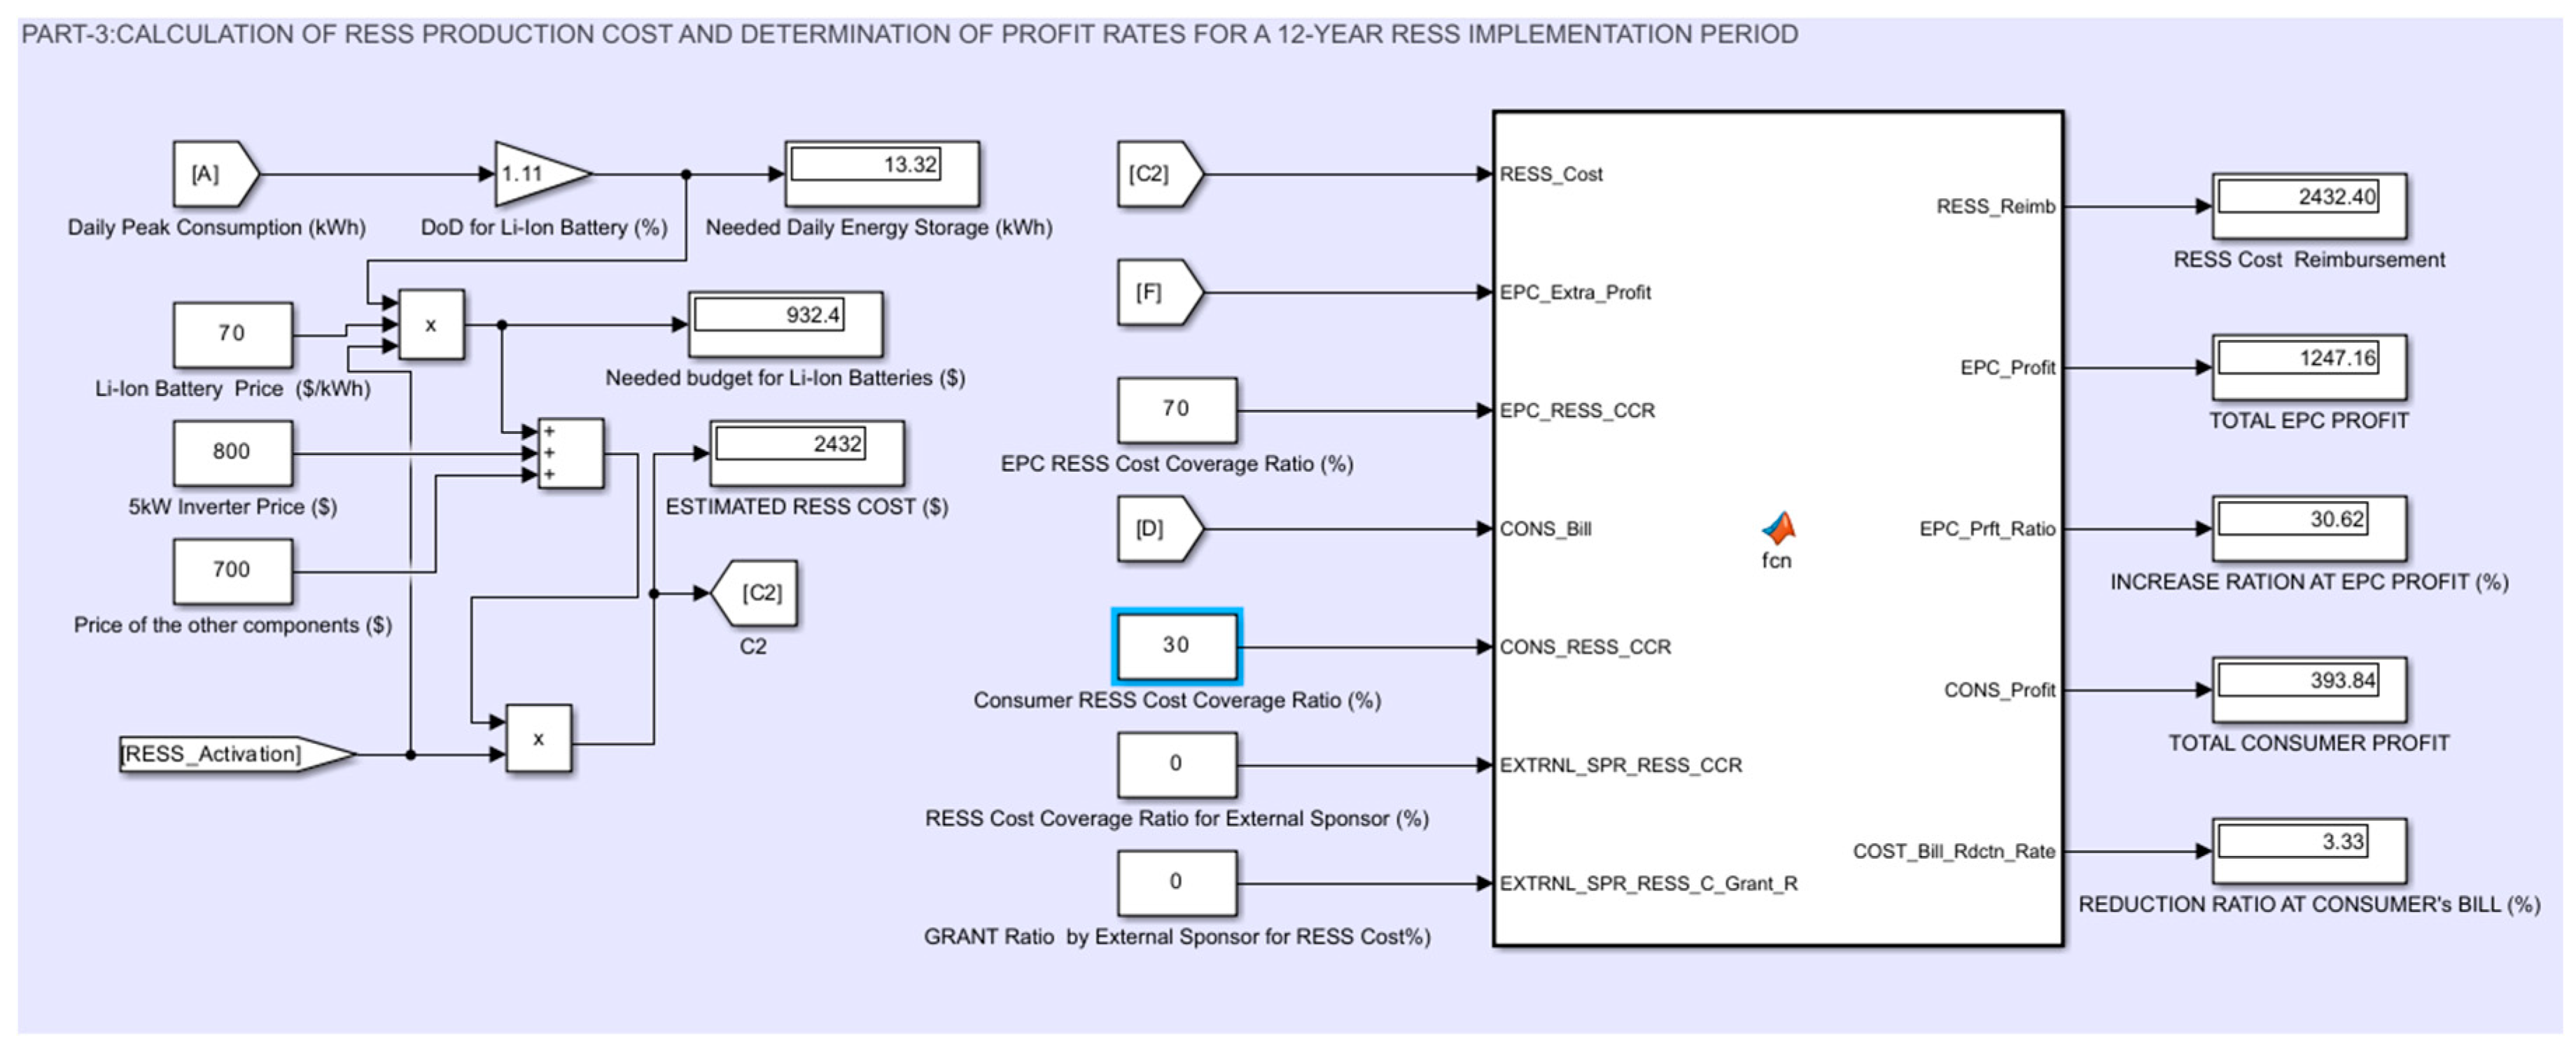
Figure 4.3.
Shifted power amounts and rates from peak hours to night hours depending on RESS usage.
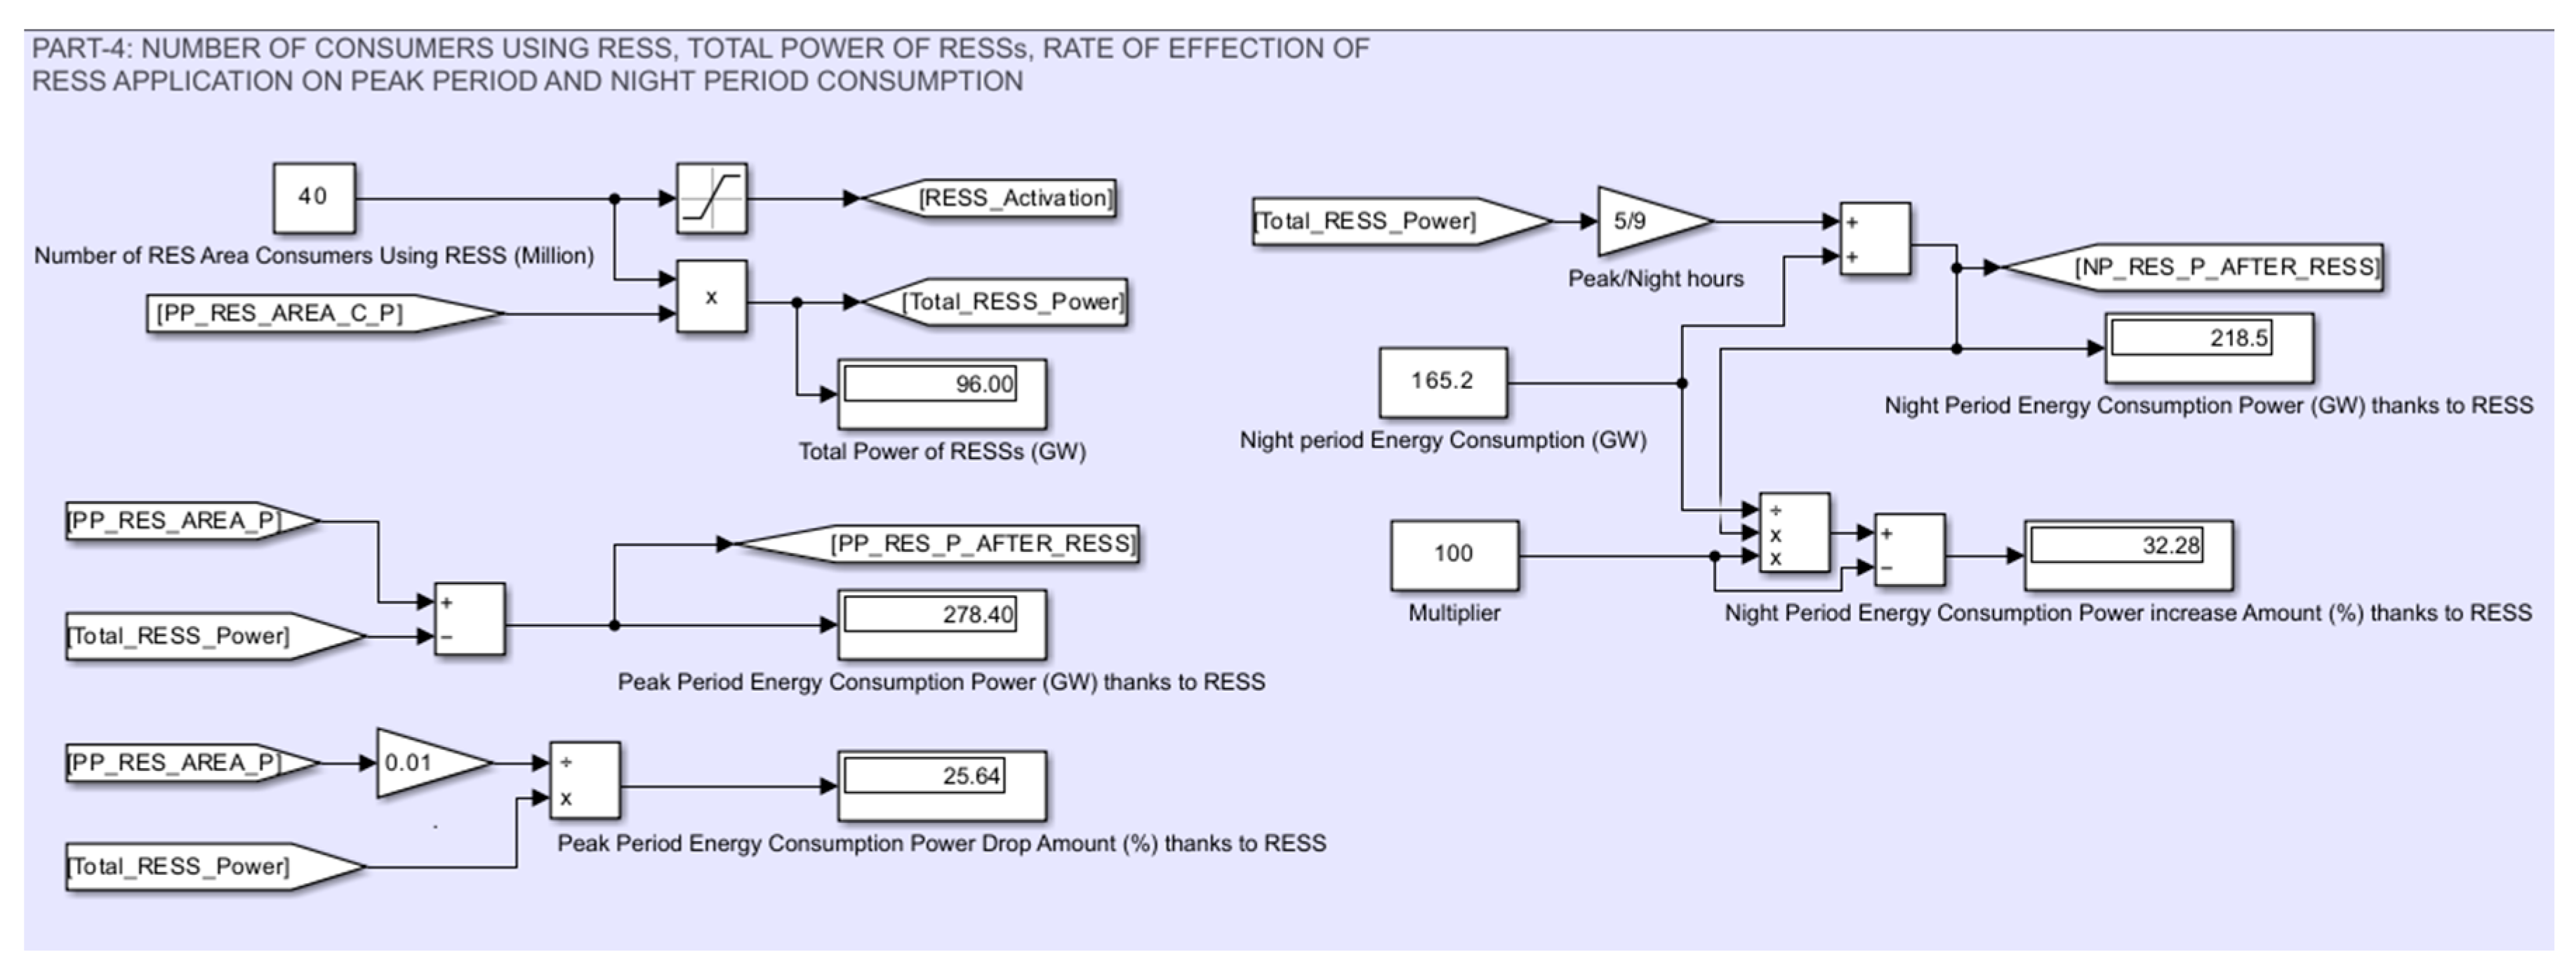
Figure 4.4.
Economic gains due to reduction of consumption in peak period.
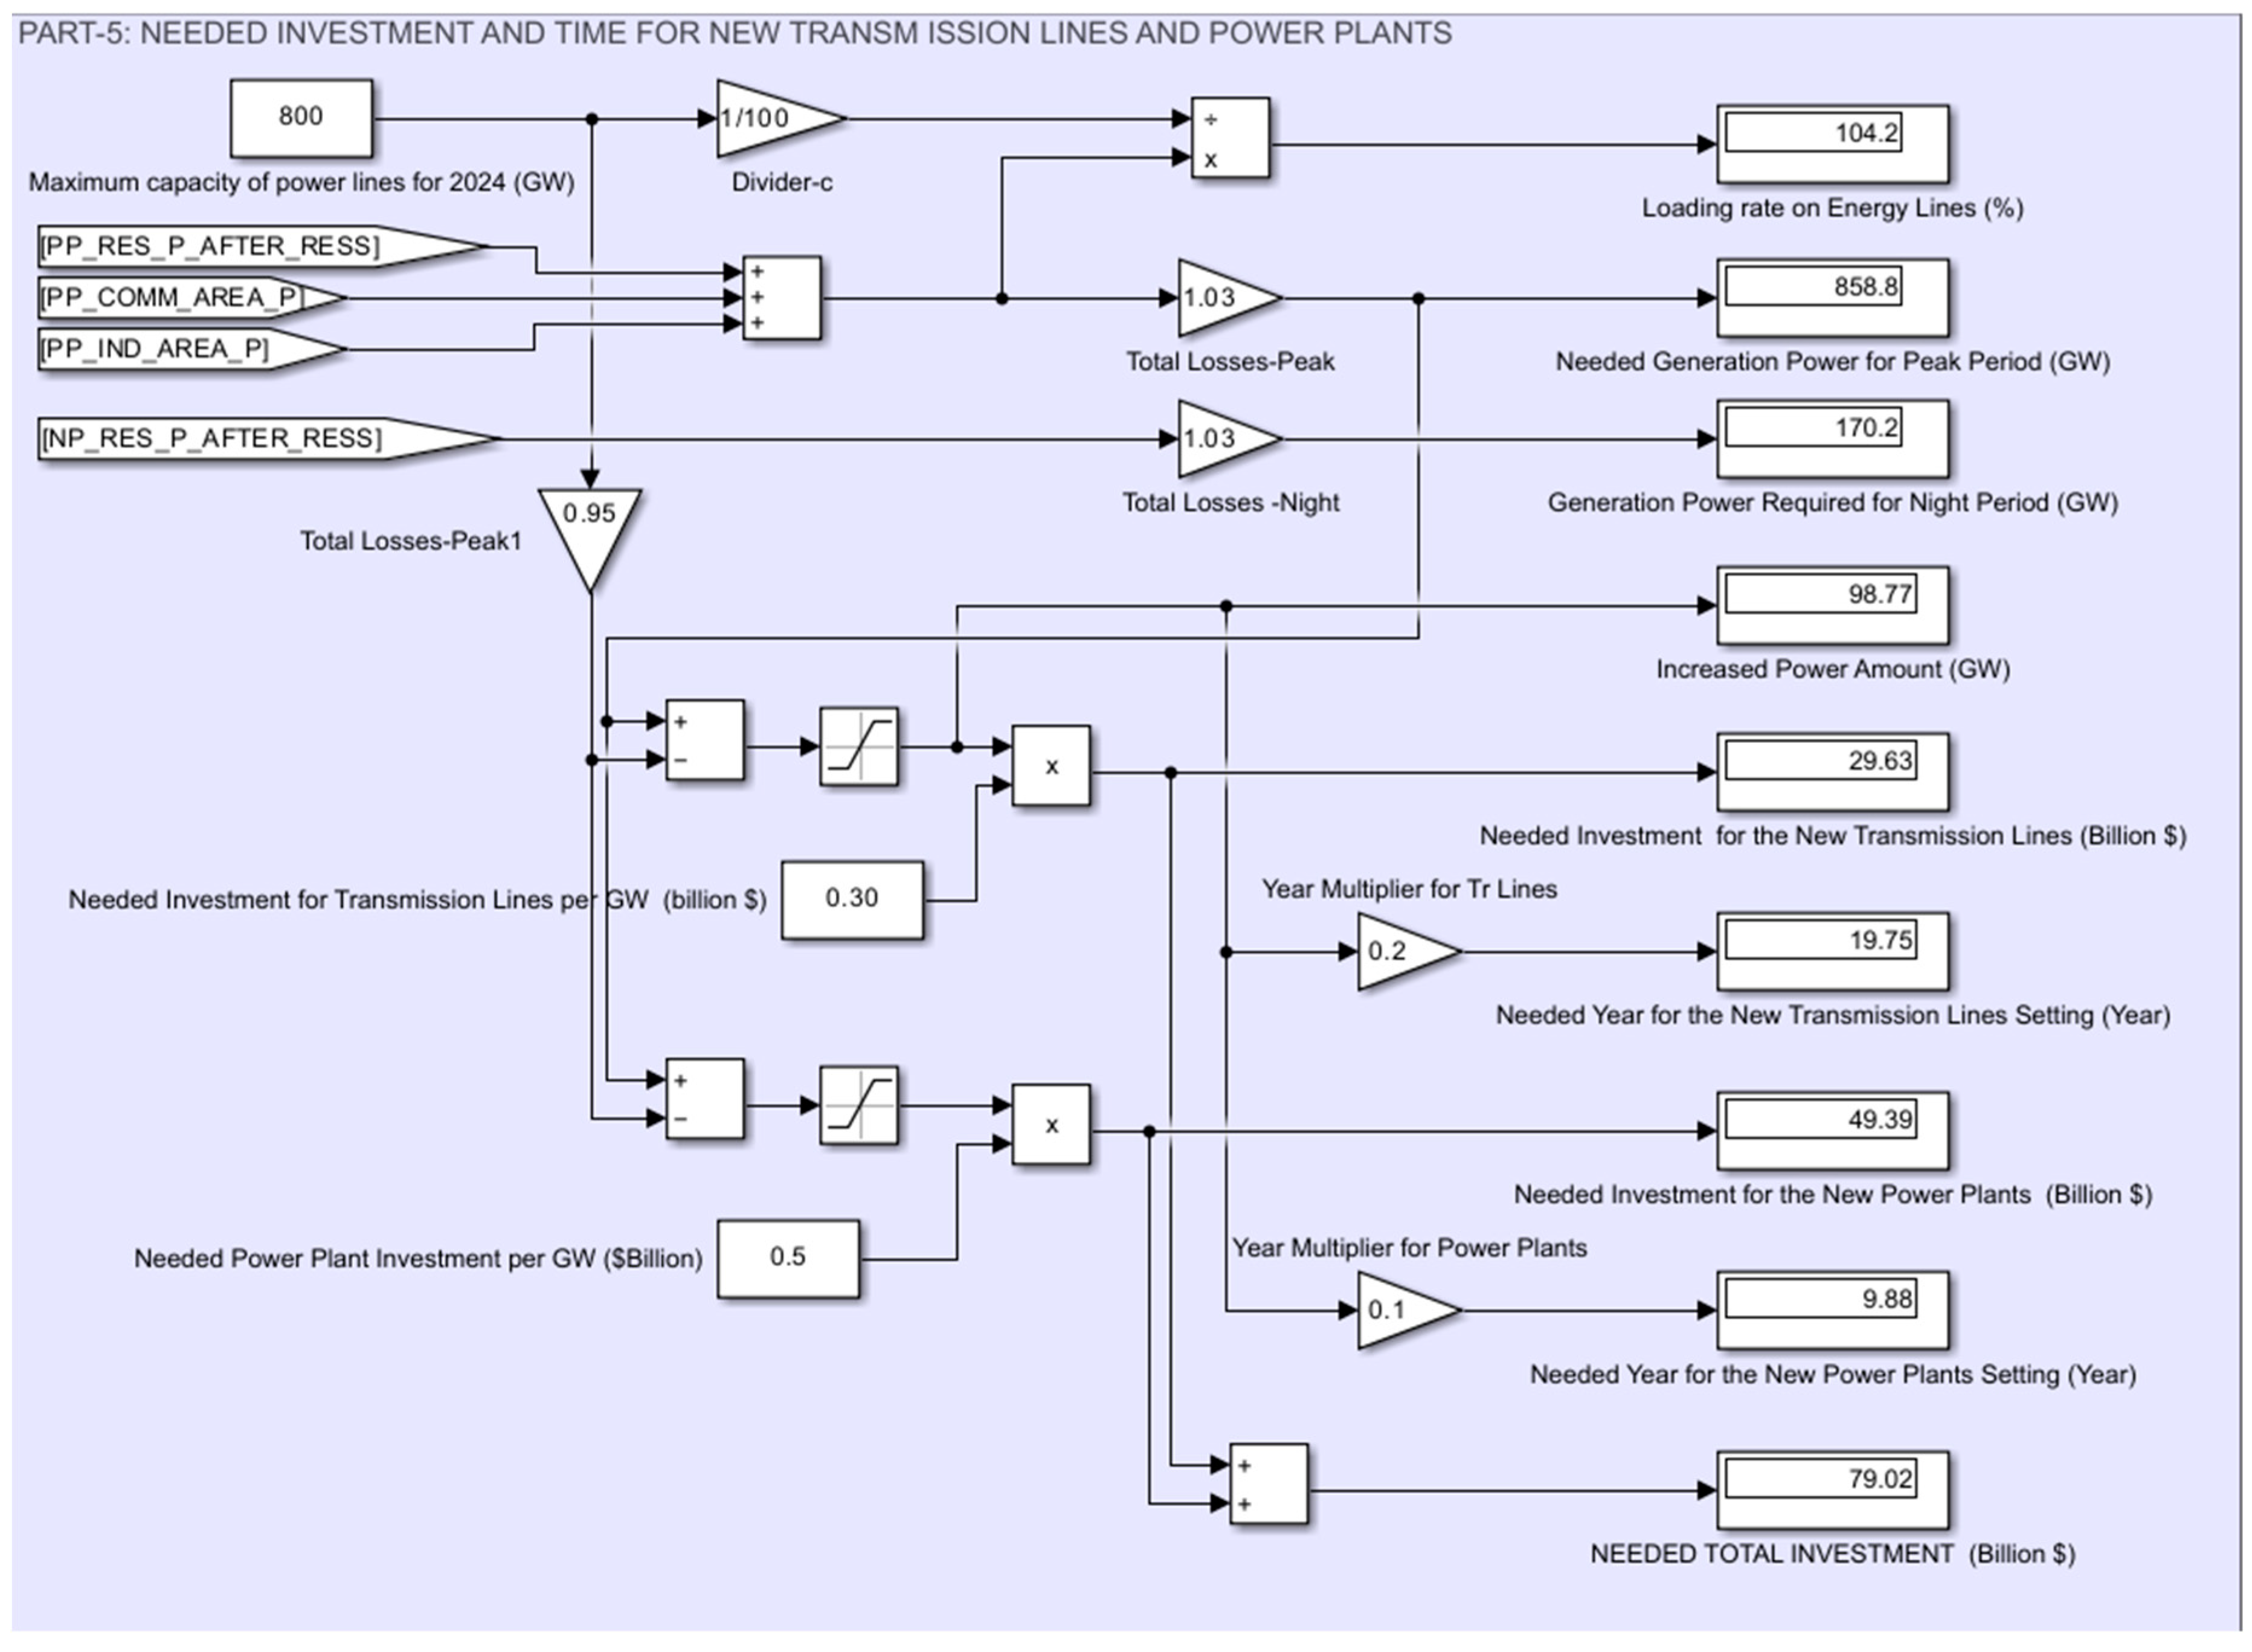
Table 1.
Energy prices and profits of EPCs during different periods.
| Period | Wholesale Price | Retail Price | Average Profit | |
|---|---|---|---|---|
| Current Application | Daytime | $20-$40 per MWh | 10-15 cents/kWh | 5-10 cents/kWh |
| Peak | $50-$150 per MWh (5 cent-15 cent per kWh) | 15-30 cents/kWh | 10-15 cents/kWh | |
| Night | $15-$30 per MWh (1.5 cent-3 cent per kWh) | 8-12 cents/kWh | 5-8 cents/kWh | |
|
RESS Application |
Peak | - | 15-30 cents/kWh | 20.25 cents/kWh |
| Night | $15-$30 per MWh (1.5 cent-3 cent per kWh) | - |
The daily amount that a Res Consumer pays to an EPC is 11.8 * 22.5 cents = $2,655. The EPC receives 11.8 * 12.5 cents = $1,475 in daily income from this Residential Consumer. Thanks to the RESS system, EPC earns 11.8*20.25 cents = $2.39 daily from Res Consumer. Thanks to RESS, EPC earns $2.39-$1.475 = $0.915 extra daily income from Res Consumer.
Table 2.
Financial outcomes of EPCs with RESS integration over a 12-year period.
| Application Type | Economic profit rates of EPCs | Daily | 12 years (4380 days) |
|---|---|---|---|
| Normal Operations | The daily and 12-year amount a Res Consumer pays to an EPC | $2.655 | $11,629 |
| The income that an EPC receives from a Res Consumer on a daily basis and over a 12-year period | $1.475 | $6,461 | |
| RESS Operations | The income that EPC receives from Res Consumer on a daily basis and over a 12-year period. | $2.39 | $10.468 |
| Total amount of extra income earned by EPC daily and for 12 years |
$10,468 - $6,461 = $4006 (accepted as $4000) |
||
Note: Inflation and the time value of money are excluded from these calculations.
Table 3.
Component costs of a RESS system.
| RESS Components | Total Price | Explanation |
|---|---|---|
| LiFePO4 Battery | 920$ | for 13.11 kWh |
| Inverter/Charger | 800$ | for 5kW |
| Other components: Switching system, cooling fans, necessary measuring components and displays, necessary metal parts and installation |
700$ | |
| Total price | 2420$ |
Table 4.
Number of consumers.
| Consumer Type | Number of Consumers |
|---|---|
| Residential area | 128 million |
| Commercial area | 20 million |
| Industrial area | 800,000 |
| Total number of consumers | 154 million |
Daily average peak period consumption for residential consumers: 11.8 kWh. Daily average peak period power for residential consumers: 2.625 kW.
Table 5.
Average power generation and consumption in the United States.
| Generation Power (GW) | General | WECC | MRO | ERCOT | SERC | RF | NPCC |
|---|---|---|---|---|---|---|---|
| Daytime | (670 GW) | 150 GW | 95 GW | 80 GW | 120 GW | 140 GW | 85 GW |
| Peak Period | (730 GW) | 170 GW | 100 GW | 90 GW | 130 GW | 150 GW | 90 GW |
| Nighttime | (590 GW) | 110 GW | 90 GW | 75 GW | 110 GW | 130 GW | 75 GW |
| Consumption Power (GW) | |||||||
| Daytime (Total): | 667.5 GW | ||||||
| Residential: | 260 GW | 57.5 GW | 37.5 GW | 32.5 GW | 47.5 GW | 52.5 GW | 32.5 GW |
| Commercial: | 240 GW | 57.5 GW | 32.5 GW | 27.5 GW | 42.5 GW | 47.5 GW | 32.5 GW |
| Industrial: | 167.5 GW | 35 GW | 27.5 GW | 22.5 GW | 27.5 GW | 37.5 GW | 17.5 GW |
| Peak Period (Total): | 730 GW | ||||||
| Residential: | 290 GW | 60 GW | 40 GW | 40 GW | 55 GW | 60 GW | 35 GW |
| Commercial: | 270 GW | 55 GW | 35 GW | 35 GW | 50 GW | 55 GW | 35 GW |
| Industrial: | 170 GW | 40 GW | 27 GW | 22.5 GW | 30 GW | 40 GW | 17 GW |
| Nighttime (Total): | 440.2 GW | ||||||
| Residential: | 165.2 GW | 27.7 GW | 22.5 GW | 22.5 GW | 32.5 GW | 37.5 GW | 22.5 GW |
| Commercial: | 155 GW | 27.5 GW | 22.5 GW | 17.5 GW | 32.5 GW | 32.5 GW | 22.5 GW |
| Industrial: | 120 GW | 22.5 GW | 17.5 GW | 17.5 GW | 22.5 GW | 27.5 GW | 12.5 GW |
Table 6.
Organization scenarios that can be done to cover the RESS cost.
| Scenario | Cost Coverage Ratio for EPC (%) | Cost Coverage Ratio for Consumer (%) | External Sponsor | Increase Ratio at EPC Profit (%) | Redaction Ratio at Consumer’s Bill (%) | |
|---|---|---|---|---|---|---|
| Contribution Ration (%) |
Grant/Interest Ratio (%) |
|||||
| 1 | 0 | 0 | 100 | 100 Grant | 60 | 13.78 |
| 2 | 0 | 0 | 100 | 50 Grant | 42.09 | 9.66 |
| 3 | 0 | 0 | 100 | 0 Grant | 24.17 | 5.55 |
| 4 | 0 | 0 | 100 | (-10) Interest | 20.59 | 4.72 |
| 5 | 20 | 60 | 40 | 0 | 22.56 | 8.88 |
| 6 | 25 | 25 | 50 | 50 | 33.13 | 7.60 |
| 7 | 100 | 0 | 0 | 0 | 40.29 | 0 |
| 8 | 70 | 30 | 0 | 0 | 30.62 | 3.33 |
| 9 | 0 | 100 | 0 | 0 | 8.05 | 11.1 |
Table 7.
Second Group Scenarios.
|
Scenarios: Sc-2a, Sc-2b, Sc-2c, Sc-2d, Sc-2e Average Peak Pr. Consumption/per consumer:2.4 kW, The Number of the Residential Area Consumer:130 million Increase rate in total consumption: 0%, The increase rate in total consumption is increased as 0% - 10% - 15% - 20% | |||||
| Power values (GW) and Ratios (%) | Sc-2a | Sc-2b | Sc-2c | Sc-2d | Sc-2e |
| Peak Pd Energy Consumption Power for Residential Consumers (GW) | 312.00 | 343.20 | 358.80 | 374.40 | 312.00 |
| Amount of decrease in Energy Consumption Power during Peak Period for Residential Consumers (%) | 0.00 | 0.00 | 0.00 | 0.00 | 0.00 |
| Night Pd Energy Consumption Power for Residential Consumers (GW) | 165.2 | 165.2 | 165.2 | 165.2 | 165.2 |
| The amount of increase in the energy consumption power during the night period for Residential Consumers (%) | 0.00 | 0.00 | 0.00 | 0.00 | 0.00 |
| Loading rate on Energy Lines (%) | 86.85 | 95.53 | 99.88 | 104.2 | 86.85 |
| Total Generation Power Required for Peak Period (GW) | 715.6 | 787.2 | 823 | 858.8 | 715.6 |
| Total Generation Power Required for Night Period (GW) | 170.2 | 170.2 | 170.2 | 170.2 | 170.2 |
| Increase in Power Quantity (GW) | 0.00 | 27.21 | 62.99 | 98.77 | 0.00 |
| Needed Investment for the New Transmission Lines (Billion $) | 0.00 | 8.16 | 18.90 | 29.63 | 0.00 |
| Needed Year for the New Transmission Lines Setting (Year) | 0.00 | 5.44 | 12.60 | 19.75 | 0.00 |
| Needed Investment for the New Power Plants (Billion $) | 0.00 | 13.60 | 31.50 | 49.39 | 0.00 |
| Needed Year for the New Power Plants Setting (Year) | 0.00 | 2.72 | 6.30 | 9.88 | 0.00 |
| Needed Total Investment (Billion $) | 0.00 | 21.77 | 50.39 | 79.02 | 0.00 |
Table 8.
Third Group Scenarios.
|
Scenarios: Sc-3a, Sc-3b, Sc-3c, Sc-3d, Sc-3e Average Peak pr. Consumption/per consumer:2.4 kW, The Number of the Residential Area Consumer:130 million Increase rate in total consumption: 20%, The number of the RESS user is increased as 0 -5M – 10M - 20M – 40M | |||||
| Power values (GW) and Ratios (%) | Sc-3a | Sc-3b | Sc-3c | Sc-3d | Sc-3e |
| Peak pd Energy Consumption Power for Residential Consumers (GW) | 374.40 | 362.40 | 350.40 | 326.40 | 278.40 |
| Amount of decrease in Energy Consumption Power during Peak pd for Residential Consumers (%) | 0.00 | 3.205 | 6.41 | 12.82 | 25.64 |
| Night pd energy consumption power for residential consumers (GW) | 165.2 | 171.9 | 178.5 | 191.9 | 218.5 |
| The amount of increase in the energy consumption power during the Night Pd for Residential Consumers (%) | 0.00 | 4.04 | 8.07 | 16.14 | 32.28 |
| Loading rate on Energy Lines (%) | 104.2 | 102.7 | 101.2 | 98.22 | 92.22 |
| Total Generation Power Required for Peak Pd (GW) | 858.8 | 846.4 | 834.1 | 809.3 | 759.9 |
| Total Generation Power Required for Night Pd (GW) | 170.2 | 177.00 | 183.9 | 197.6 | 225.1 |
| Increase in Power Quantity (GW) | 98.77 | 86.41 | 74.05 | 49.33 | 0.00 |
| Needed Investment for the New Transmission Lines (Billion $) | 29.63 | 25.92 | 22.22 | 14.80 | 0.00 |
| Needed Year for the New Transmission Lines Setting (Year) | 19.75 | 17.28 | 14.81 | 9.87 | 0.00 |
| Needed Investment for the New Power Plants (Billion $) | 49.39 | 43.21 | 37.03 | 24.67 | 0.00 |
| Needed Year for the New Power Plants Setting (Year) | 9.88 | 6.64 | 7.41 | 4.93 | 0.00 |
| Needed Total Investment (Billion $) | 79.02 | 69.13 | 59.24 | 39.47 | 0.00 |
Disclaimer/Publisher’s Note: The statements, opinions and data contained in all publications are solely those of the individual author(s) and contributor(s) and not of MDPI and/or the editor(s). MDPI and/or the editor(s) disclaim responsibility for any injury to people or property resulting from any ideas, methods, instructions or products referred to in the content. |
© 2024 by the authors. Licensee MDPI, Basel, Switzerland. This article is an open access article distributed under the terms and conditions of the Creative Commons Attribution (CC BY) license (http://creativecommons.org/licenses/by/4.0/).
Copyright: This open access article is published under a Creative Commons CC BY 4.0 license, which permit the free download, distribution, and reuse, provided that the author and preprint are cited in any reuse.


