
Submitted:
02 January 2025
Posted:
03 January 2025
You are already at the latest version
Abstract
We conducted a theoretical and experimental study on the electro-oxidation of methanol (MOR) on NixPdy nanoparticles. The results are presented in terms of kinetic parameters, surface concentrations and peak currents, showing significant differences between three main compositions: Ni3Pd1, Ni1Pd1 and Ni1Pd3. The kinetic mechanism adopted for accounting the linear voltammetry experiments performed follows the carbonate-palladium oxide pathway of the MOR. Numerical simulations of the kinetic equations, fitted to experimental data obtained at varying methanol concentrations, allowed us to distinguish the adsorption contributions of methanol, water, and OH ions from the nonlinear contribution associated with palladium oxide and carbon dioxide production. The synergistic effects of Ni:Pd nanoalloys on the MOR are then assessed by analyzing the behavior and tendencies of the reaction rate constants for different bulk methanol concentrations. Our results suggest that a higher Pd content favors more efficient oxidation mechanisms, by reducing the formation of intermediate products that cause surface poisoning, such as CO, carbonates or palladium oxide. However, as the proportion of Ni increases, an increase in the concentration of adsorbed OH is observed, which dominates the blocking of active sites even above from the palladium oxide blocking.
Keywords:
electrocatalytisis
; linear voltammograms
; kinetic mechanism
; rate constants
; catalytic efficiency
1. Introduction
Fuel cells are a specialized electrochemical device that convert the stored chemical energy of a fuel into electrical energy. During the process, the anode receives a continuous fuel supply, and the cathode is fed with an oxidant [1]. These fuel cells can produce electrical energy continuously if supplied constantly. Due to their absence of intermediate heat-producing steps or thermodynamic limitations for mechanical work [1], in addition to their low contamination due to the lack of a combustion process [2,3], the fuel cells are advantaged over other electrochemical cells like batteries and even engines and devices that employ fossil fuels.
Reducing the size of the electrocatalysts to the nanoparticle scale significantly alters their thermodynamic and transport properties. The large relative fraction of surface atoms in nanoparticles determines the size dependences of the melting temperature and pressure and, therefore, it has an impact on heat capacities, thermal and electrical conductivities, and, most importantly for this work, chemical potentials, [4,5,6,7,8,9,10]. For instance, quantum confinement modifies the band structure of metallic nanoparticles and nanocrystals, affecting their electronic, conductive, and optical properties. This modification induces anomalous behaviors of the band gap energy at different temperatures [7,8]. In addition, the chemical potential of a nanoparticle is influenced by the surface energy and the surface structure [11,12]. As nanoparticles have a much larger surface area to volume ratio compared to bulk materials their chemical affinity increases and therefore the nanoparticles are more reactive [4,5,7,29,30,31,32,33,34,35]. Notably, the classical equations of chemical kinetics can be used to describe the processes on the surface of nanoparticles [7].
In recent years, considerable progress has been made in developing nanoelectrocatalysts and their synthesis techniques over the past few decades [13,14,26]. Many efforts have been focused on optimizing their performance for alcohol oxidation (methanol, ethanol) and oxygen reduction, see for instance, [14,15,16,17,18,19,20,21].
In the present study, we are interested in the methanol oxidation reaction (MOR), which involves the oxidation of methanol (CH3OH) until carbon dioxide (CO2) as a final product [21,22,23]. However, in the case of Pd-based nano-catalysts, their sensitivity to CO or palladium oxide poisoning can significantly degrade their catalytic performance [18,26]. Hence, it is of primary importance to develop and understand the performance of Pd-based catalysts combined with other metals, like Ni or Cu, since the addition of Ni to Pd can significantly enhance the catalytic activity towards MOR and reduces significantly the costs of practical implementation [22,23,24,25,26].
In the case of bimetallic particles, like the NiPd nanoalloys that we will study here, the evolution of the reactions takes place, apparently, along a bifunctional mechanism [22,24,26,27]. This mechanism is characterized by the synergistic effect of the NiPd composition, which leads to enhanced catalytic performance of NiPd nanocatalysts compared to the monometallic Pd case [22,24].
According to this mechanism, methanol is adsorbed at Pd sites and first dehydrogenated to methoxy. Then, formaldehyde and subsequently formate are then oxidized with the help of adsorbed OH− ions. OH− ions have, in general two sources, one by direct adsorption from the solution and, complementary, as a product of the hydrolysis of previously adsorbed water molecules[14,18,22,24,25,26]. Therefore, the oxidation steps run simultaneously with the hydrolysis of water molecules and the adsorption of OH− radicals at the Ni sites. Notice that these processes compete for the active sites over the nanoparticle’s surface. The last step suggested is the oxidation of adsorbed carbonate which decomposes in carbon dioxide (instantaneously released to the solution) and producing two electrons and protons. This step also yields an oxidation of an active site, therefore having a poisoning effect over the surface [22,24,28].
In this work, we conduct a combined theoretical and experimental investigation of MOR on nickel-palladium electrocatalysts. Using linear voltammetry in an alkaline medium, we examine the performance of catalysts with varying Ni:Pd ratios (3:1, 1:1, 1:3). Our approach aims to elucidate the synergistic effects of nickel and palladium on MOR activity by systematically probing different nanoalloy compositions and analyzing the results obtained through the comparison with a kinetic model of the mechanism. Hence, the synergistic effects are then assessed by analyzing the behavior and tendencies of the reaction rate constants for different bulk methanol concentrations.
Concerning experiments, our work builds upon the findings of Araujo et al. (2020) [27], highlighting the crucial role of Pd-Ni interactions in enhancing MOR performance on Pd-based electrocatalysts. By systematically varying the Ni:Pd ratio, we aim to gain deeper insights into the underlying mechanisms and to have a clue about the optimal nanoparticle composition for maximizing methanol oxidation activity.
The theoretical analysis of the oxidation curves is based on the proposal of a reaction mechanism of the MOR that goes along the lines of the mechanisms reported in the literature [18,22,24,25,26], as already discussed in previous paragraphs. Specifically, in the model mechanism we presented in Ref. [18], the process begins with water and methanol molecules diffusing into the electrode’s pores with a limited number of active sites. Methanol adsorbs onto active metal sites independently of voltage, forming neutral layers. The chemical potentials determine the adsorption affinity and Gibbs energy. Using irreversible thermodynamics, the dynamics are proposed to follow a Langmuir-Hinshelwood-like equation. At equilibrium, the Nernst relation adjusts affinity based on the external potential. This affinity, linked to reaction rates via flow-force relationships, leads to the Butler-Volmer equation, describing current as a function of concentrations and the applied voltage. In this work, we will follow a similar thermodynamic strategy but applied to the chemical mechanism of the new catalyst. In the present case, direct adsorption of OH ions is also included, as suggested in the literature, and the path followed differs from others since it is assumed that bimetallic nanoparticles promote the formation of formate and carbonate as intermediates and, therefore, the poisoning of the active sites occurs by direct oxidation of palladium atoms and not by the formation of carbon monoxide molecules, as assumed in the case of pure Pd-based catalysts [18].
The article is organized as follows: The next Section 2, describes the experimental procedure from synthesis to linear voltammetry followed to obtain the oxidation curves. Then, Section 3 presents the theoretical model starting from the postulation of the mechanism to the formulation of the corresponding set of kinetic equations. Section 4 is then devoted to presenting our results and its discussion in terms of the comparison with the theoretical model. Finally, the conclusions section 5 summarizes our results and contextualizes the study.
2. Experimental
2.1. Materials
Nickel(II) sulfate hexahydrate (99%, Sigma-Aldrich, Darmstadt, Germany), potassium tetrachloropalladate(II) (99%, Sigma-Aldrich, Darmstadt, Germany), polyvinylpyrrolidone (PVP, MW 40,000, Sigma-Aldrich, Darmstadt, Germany), sodium borohydride (98%, Sigma-Aldrich, Darmstadt, Germany), ethylene glycol (99.8%, Sigma-Aldrich, Darmstadt, Germany), Vulcan carbon XC-72R (Cabot, Boston, MA, USA), isopropyl alcohol (96% industrial grade), ethanol (99.7%, Sigma-Aldrich, Darmstadt, Germany), Nafion® (5 wt.% in isopropanol, Sigma-Aldrich, Darmstadt, Germany), potassium chloride (99.7%, Sigma-Aldrich, Darmstadt, Germany), and potassium hydroxide (85%, Sigma-Aldrich, Darmstadt, Germany) were used as received.
2.2. Synthesis
-/C electrocatalysts were synthesized in two steps:
- SynthesisofNinuclei.
- The Ni component was prepared by adding 4 mL of distilled water to a 3-necked round-bottom flask equipped with a condenser. While stirring at room temperature, 3 mL, 2.66 mL, 2 mL, 1.33 mL, and 1 mL of aqueous NiSO46H2O (50 mM) and their corresponding volumes of aqueous PVP (100 mM) surfactant were added. Subsequently, aqueous NaBH4 (100 mM) was added dropwise at a rate of 25 L/min to induce a slow Ni synthesis reaction. After completing NaBH4 addition, the solution was stirred at room temperature for an additional hour.
- Formation of-alloy nanoparticles.
- After adding 4 mL of ethylene glycol (EG) to the flask, it was immersed in a 180∘C silicon oil bath with constant stirring. To synthesize various -/C nanoparticle alloys, a mixture of 1 mL, 2 mL, and 3 mL of K2PdCl4 (50 mM) and their corresponding volumes of PVP (100 mM) surfactant, both dissolved in EG, were added to the stirred solution at a rate of 25 L/min. The reaction mixture was maintained at 180∘C while stirring for 1 hour and then quenched to room temperature in a cold bath. The resulting solutions were washed repeatedly with isopropyl alcohol. To prepare the powder, 0.4 mg of a highly concentrated nanoparticle solution and 1.6 mg of Vulcan carbon were combined in a beaker with a few drops of isopropyl alcohol and sonicated. The mixture was then allowed to dry at room temperature.
2.3. Electrochemical Measurements
The electrochemical properties and electrocatalytic activity of the methanol electrooxidation reaction in alkaline media were investigated using linear sweep voltammetry (LSV). A BioLogic Seyssinet-Pariset, France VSP Potentiostat/Galvanostat served as the electrochemical workstation. The experiments employed a three-electrode electrochemical cell configuration. A glassy carbon electrode (Basi®, West Lafayette, IN, USA, 0.0769 cm2) served as the working electrode. A calomel electrode saturated with KCl (SCE) acted as the reference electrode, and a graphite rod was used as the counter electrode. The catalytic inks were prepared by mixing 1 mg of catalyst powder with 73 L of isopropyl alcohol (dispersant) and 7L of Nafion®(5 wt.% in isopropyl alcohol, Sigma-Aldrich, Darmstadt, Germany) (binder). After stirring, 10L of the ink was pipetted on the working electrode to ensure complete coverage of the glassy carbon surface. Prior to each experiment, the electrolyte solutions were purged with nitrogen gas (Infra, 99.999%) for 10 minutes.
MOR tests were carried out using 0.3M KOH solution with varying ethanol concentrations (0.8 M, 1.0 M, 1.2 M, 1.5 M). Cyclic voltammograms were recorded in a potential range of -0.6 V to 0.8 V vs. NHE (normal hydrogen electrode; referenced to SCE + 0.241 V). A scan rate of 20 mV/s was employed for the electrocatalytic evaluation. Prior to each experiment, the electrolyte solutions were purged with nitrogen gas (Infra, Edo. de México, México 99.999%) for 10 minutes.
3. A Model Mechanism for the Methanol Oxidation Reaction over NiPd
The mechanism proposed here for MOR on NiPd-based catalysts in alkaline conditions corresponds to a bifunctional mechanism that tries to capture the essential steps reported in the literature [22,24,28] and can be summarized as follows: Methanol molecules adsorb onto the surface and then undergo methanol dehydrogenation at the Pd sites, forming methoxy and releasing a proton (H) and an electron (). Then, the methoxy intermediate is oxidized to formaldehyde by intermediation of adsorbed hydroxide ions. Formaldehyde is subsequently oxidized to formate and then to carbonate from which the desorption of is assumed as a direct step accompanied by the formation of palladium oxide and the recovery of a free active site. In chemical notation, the steps assumed are the following:
For the adsorption of methanol, water and OH ions we have the following three reactions:
In these reactions we denote the adsorbed molecules B by M·B. The adsorption and desorption rate constants are, and for methanol, and for water and and for OH ions. Then we have:
- 1. Adsorbed water hydrolysis:
- 2. Methanol dehydrogenation to methoxy ():
- 3. Further dehydrogenation to formaldehyde ():
- 4. Oxidation of formaldehyde () to formate ():
- 5. Oxidation of formate () to carbonate ():
- 6. Decomposition of carbonate () to carbon dioxide:
- 7. Regeneration of Pd active sites:
In this set of equations (4)-(10) the subindexes in the velocity rate constant indicate the number of the oxidation reaction. Thus, corresponds to water hydrolysis, and are the rate constants associated with the methanol and methoxy oxidation steps. and correspond to the rate constants for carbonate formation. is the oxidation of carbonate giving and, finally, is the rate constant associated with the regeneration of Pd active sites. It is worth emphasizing that in the present model reaction, the poisoning of the nanoparticles occurs due to the formation of palladium oxide, in contrast with what was proposed for pure palladium nanocatalysts [18,22,24,28].
4. Kinetics for Linear Voltammetry and Oxidation Current
From the previous mechanism, it is possible to obtain a set of differential equations for the surface concentration by following the laws of non-equilibrium thermodynamics, [18]. Surface concentrations will be denoted by in Mol/m2, and the set of reactions in 1-10 leads to the following set of equations. From the reactions accounting for adsorption processes, we have that the change in time of the surface concentration of water, with notation for shortness, is
whereas for the surface concentration the methanol, , is given by
The time evolution of the surface OH− is given by
In these equations, the first two terms at the right-hand side (RHS) represent the adsorption and desorption of bulk methanol, water, and hydroxyl, having bulk concentrations , and , respectively. counts the number of active sites not occupied by the reacting species and its explicit dependence will be given later. The respective adsorption velocity constants were discussed above. The third terms at the RHS correspond to the first oxidation step of the mechanism, being and the oxidation constants of surface-adsorbed methanol and water. The hydrolysis reaction leads to the formation of surface with the rate . Additionally, (13) contains two terms corresponding to the oxidation of formaldehyde and of formate . The surface concentration of palladium oxide is denoted by . The oxidation processes are induced by an over-potential and modulated by the transfer coefficient . Finally, F is the Faraday constant and the molar thermal energy of the system.
Denoting by the surface concentration of CH3O, we have
where is the oxidation velocity constant of CH3O. The following steps are:
with the surface concentration of formaldehyde (HCHO) and its oxidation velocity constant. Then, we have
where is the surface concentration of HCOO− concentration and the corresponding reaction constant. Carbonate () surface concentration is and therefore follows
The subsequent reaction is the regeneration of active sites from palladium oxide (M·O)
Carbon dioxide gas production is therefore
In the previous reaction mechanism, the oxidation contributions finish at Eq. (17) in which the six electrons produced by methanol oxidation are completed [18]. The subsequent reactions do not influence the oxidation peak and will not be taken into account in the following analysis, since they took place in the cathodic part of the cyclic voltammetry.
In the adsorption steps of methanol, water and OH− ions, the concentration of free surface active sites, , is given by a Langmuir-Hinshelwood-like term
The last term in the previous relation is likely responsible for surface poisoning because of the specific formation of palladium oxides. This poisoning effect differs from the one previously considered during MOR taking place on pure Pd nanoparticles, in which the formation of adsorbed CO was responsible for active sites blocking [18].
The total current observed in a methanol oxidation reaction (MOR) is the result of multiple individual oxidation reactions occurring simultaneously or sequentially at the electrode surface. Each of these steps involves an oxidation reaction, and each oxidation reaction contributes to the overall current. This electrochemical current can be written as the sum of the contributions of the oxidation reactions in the mechanism:
where is the electrode area. In the present case, the current is given by
Using the previous relations and the evolution equation for the applied voltage:
with the sweep rate satisfying , one can calculate how the current changes with time and applied voltage during a linear voltammetry experiment.
5. Results and Discussion
Figure 1 presents the fit (lines) of the experimental data (symbols) obtained using our synthesized NixPdy catalysts (see Section 2). Subplots illustrate results for specific compositions: (a) Ni1Pd3, (b) Ni1Pd1, and (c) Ni1Pd3. The data indicate that nanoparticles with a higher relative proportion of Pd (Ni1Pd3) exhibit superior oxidation performance compared to those with higher Ni content.
The numerical procedure for constructing Figure 1 involves solving the differential equations (11)–(17) and (23) with a fourth-order Runge-Kutta method, followed by the calculation of the total oxidation current using Eq. (22). The dependent variables include the concentrations , , , , , , , , , and . These equations are solved parametrically over a wide range of the fitting parameters: , , , , , , and –. The total simulation time is 35 s, with a maximum time step of s. Initial conditions are set to zero for all variables except .
In the top row of Figure 1 we show the fits for different methanol concentrations, from 0.8 to 1.5, ranging from lowest to highest. The peak current for the Ni1Pd3 case shifts towards lower overpotential values, contrasting with the behavior observed in the other two cases. However, this shift is relatively minor across all cases studied. Notably, for potentials exceeding 0.3 V, the Ni1Pd3 material does not exhibit a significant increase in oxidation, facilitating the alignment of experimental results with the proposed model. This absence of higher-potential oxidation appears linked to a delay in water hydrolysis for materials with higher Ni content.
To confirm this observation, the bottom row of Figure 1 details the contributions of each reactant to the total oxidation current. The reaction involving water, depicted by the green line, demonstrates the delayed production and depletion of water relative to other intermediates contributing to the overall current, as outlined in Eq. (22). The green line for water hydrolysis peaks at different potentials depending on the material composition: 0.31 V for Ni3Pd1, 0.22 V for Ni1Pd1, and 0.185 V for Ni1Pd3. This trend suggests that the delay in water hydrolysis decreases as the oxidation activity increases.
To better understand the progression of key reaction steps in the oxidation process including the role played by hydrolysis it is important to compare the reaction rates in the different processes. Figure 2 displays the adsorption and reaction rate constants used for the fit: in the first row, the adsorption rate constants for surface reactants: methanol, water and OH in , , and , respectively; in the second row the reaction constants for water hydrolysis , methanol oxidation , and methoxy oxidation and finally, in the third row, constants for formaldehyde oxidation , carbonate formation , and carbonate oxidation . The value of the fitting parameters is plotted against methanol concentration to show possible trends.
The second row of Figure 2 shows that the water hydrolysis rate constant for Ni3Pd1 is four times smaller than the corresponding constants for Ni1Pd1 and Ni1Pd3, which exhibit similar maxima positions. The green curve heights also align with the first-row results in Figure 2, where the methanol and water adsorption rates for Ni1Pd3 are higher than for the other two cases. Besides, regarding adsorption rate constants, for Ni3Pd1 is nearly double that of Ni1Pd1 but approximately one-third of the value for Ni1Pd3. This allows to conclude that the influence of water depends crucially on the characteristic time dictated fundamentally by hydrolysis on the constant rather than by adsorption, and that this time is fundamentally affected by the nickel/palladium ratio.
Figure 3 illustrates the surface concentration evolution of all species involved in the methanol oxidation reaction (MOR) as a function of applied voltage. The green line, representing water surface concentration, confirms that Ni3Pd1 nanoparticles adsorb considerably less water than the other two compositions. This observation supports the conclusion that a higher proportion of Pd atoms on the nanoparticle surface enhances water adsorption and accelerates its oxidation rate.
Additionally, this finding suggests that at lower Ni content, the dominant mechanism, characterized by direct OH adsorption (depicted by the orange line in Figure 3, representing OH surface concentration), may compete with the mechanism described in Ref. [18]. In that study, direct OH adsorption was not considered, and surface poisoning was attributed to adsorbed CO formation rather than the formation of palladium oxides, as we will discuss later.
Consistent with previous observations, the rate constants in Figure 2 further clarify the influence of Pd content on methanol adsorption and oxidation. For example, it is clear that for nanoparticles with higher Pd content (Ni1Pd3), methanol adsorption rates are strongly dependent on methanol bulk concentration. Below 1M, the adsorption rate is approximately three times larger compared to the other two compositions, but it decreases by nearly half when the concentration reaches 1.5M. In contrast, Ni3Pd1 and Ni1Pd1 nanoparticles exhibit only a minor increase in adsorption rates with methanol concentration, suggesting a less dynamic response. In the case of OH adsorption rates, for Ni3Pd1 nanoparticles remain constant at , independent of methanol concentration. However, for Ni1Pd3 nanoparticles, the rate starts higher at 0.24 and decreases rapidly to converge with the rate of Ni1Pd3.
The methanol oxidation rate () is comparable for Ni3Pd1 and Ni1Pd3 nanoparticles, both exceeding the rate observed for Ni1Pd1. This highlights the efficiency of these two compositions in oxidizing methanol. For carbonate oxidation, remarkably, Ni1Pd1 nanoparticles exhibit a significantly faster oxidation rate of adsorbed carbonate (), approximately three times higher than in the other two cases (as can be seen in Figure 1, second row, red lines). The maximum of the red line for Ni1Pd1 appears at lower voltages, contributing to a more symmetric oxidation peak compared to the other compositions. The oxidation steps for methanol (), methoxy (), and formaldehyde () are similar across all compositions. However, nickel carbonate is more readily oxidized than palladium carbonate, as evidenced by the general trends in the data.
To further clarify the role of OH in relation to other intermediates, including metal oxides, Figure 4 presents the surface concentrations of formate (magenta), metal oxide (brown), and the combined concentration of all other species (orange), which, as observed in Figure 3, these other species are predominantly constituted by OH. Figure 4 reveals a continuous increase in OH surface concentration, underscoring its significant role in surface poisoning during the anodic reaction. This finding highlights the critical influence of OH adsorption on the reaction’s efficiency and mechanism. Additionally, the presence of palladium oxides shows a slight increase from left to right, suggesting that their contribution to surface poisoning does not significantly impair cell efficiency. Interestingly, a higher Ni content inhibits palladium oxide formation while promoting an increase in OH concentration, which emerges as the primary blocker of active sites. This equilibrium differs from the mechanism proposed in Ref. [18], where surface poisoning was attributed to CO formation rather than OH adsorption or palladium oxide formation. This difference arises from the fact that, the in direct pathway for CO-CO2 formation mechanism, [18], it seems that water adsorption is predominant compared with OH adsorption. Dominant CO formation in MOR against OH adsorption and Pd·O formation as suggested by the mechanism analyzed in this study, has been recently reported in a study analyzing the role of Sb in mitigating CO poisoning in Pd-based MOR catalysts [37]. The authors concluded that, by modifying the electronic properties of Pd and potentially facilitating the removal of adsorbed CO through interactions with adsorbed OH and alkali metal cations, like in the mechanism proposed in[18], the Sb-Pd catalyst demonstrates enhanced activity and durability [37].For the present study, we may conclude that the balance between Ni and Pd plays a pivotal role in modulating the reaction pathway and efficiency.
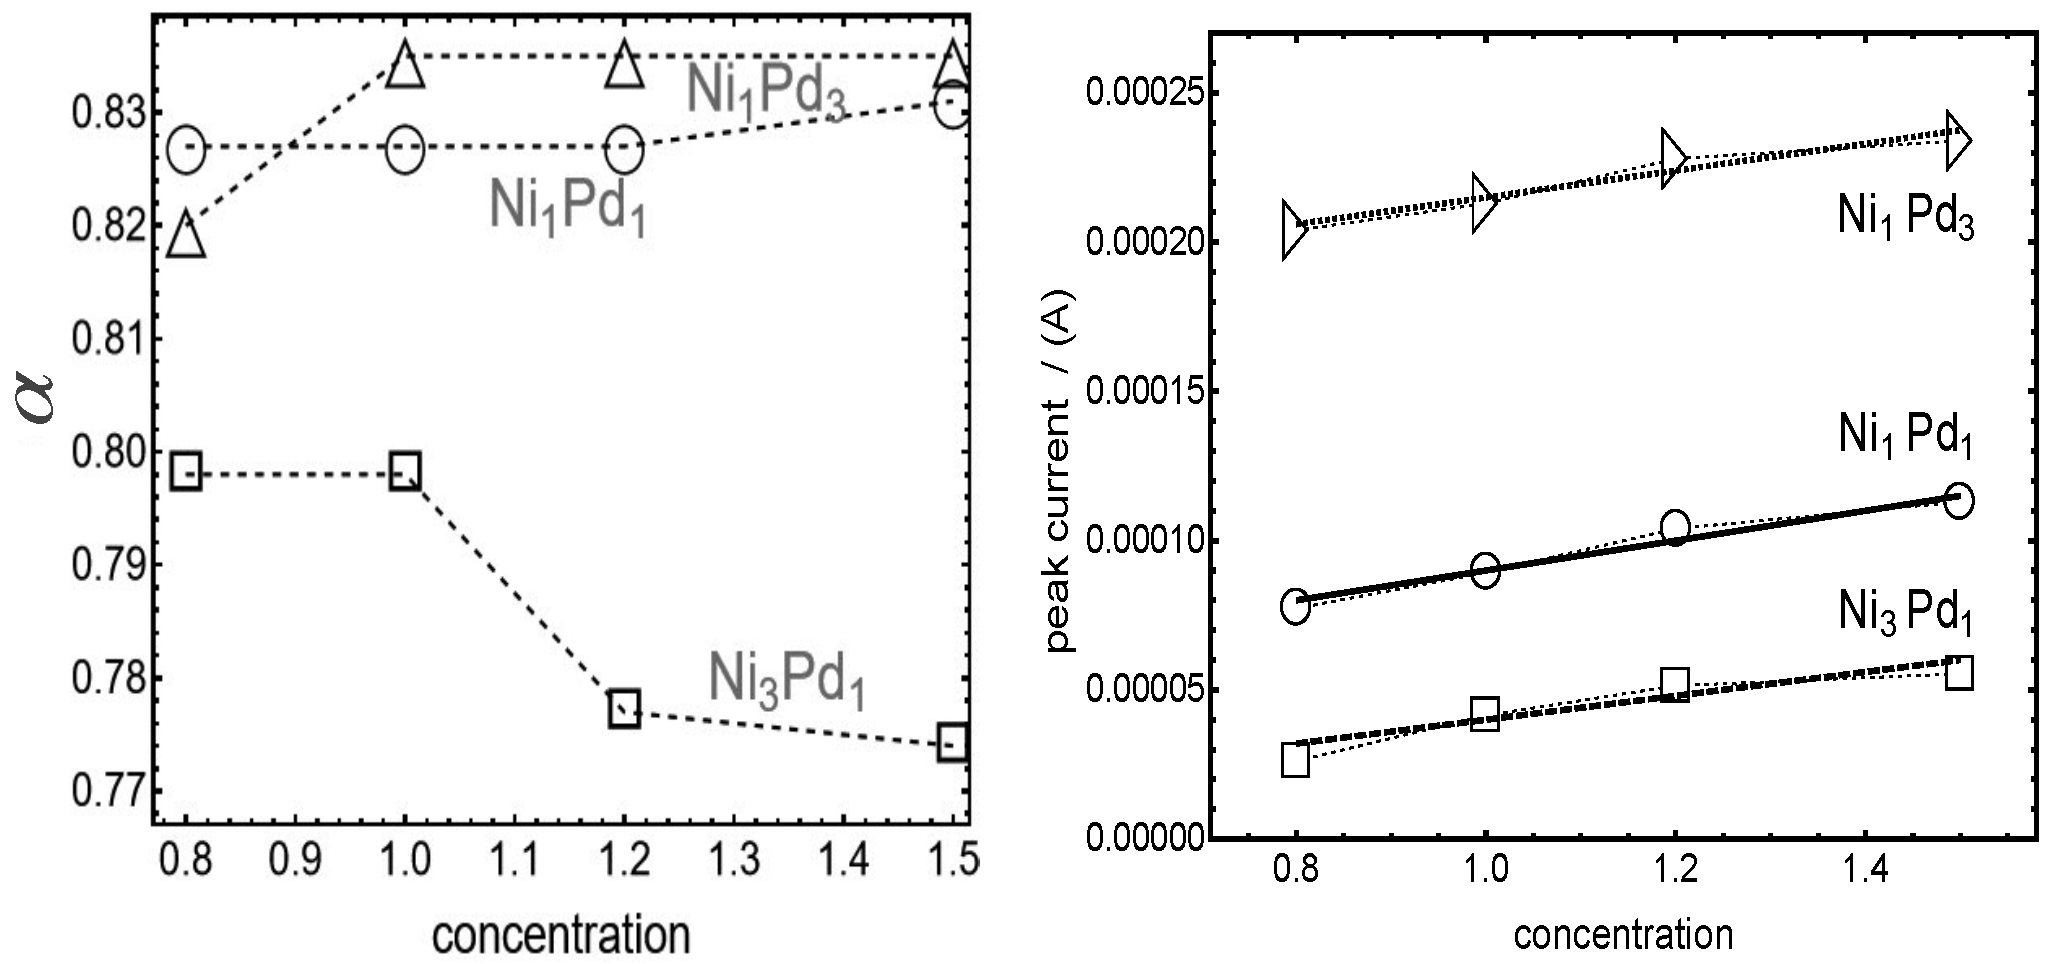
The most significant differences arising from varying proportions of Nickel (Ni) and Palladium (Pd) are highlighted in Figure 5, which displays the transfer parameter () and the peak current for the three types of nanoparticles. Two notable results are evident from the figure.
As first result at the left of Figure 5 we can see that the different Ni/Pd ratios during nanoparticle synthesis lead to distinct energy barrier asymmetries. For Ni3Pd1 nanoparticles, the transfer parameter is notably larger than 0.5, indicating that the energy barrier for the oxidation reaction surpasses that of the reduction reaction. However, the value of for Ni3Pd1 () is lower than the nearly constant observed for both Ni1Pd1 and Ni1Pd3. This suggests that higher Ni proportions on the nanoparticle surface enhance the asymmetry of the oxidation energy barrier compared to nanoparticles with higher Pd proportions. Moreover, the transfer factor of the Ni3Pd1 alloy exhibits greater sensitivity to the surrounding methanol concentration, decreasing as methanol bulk concentration increases.
The second result concerns the linear relationship between the peak current and methanol concentration confirming that the adsorption mechanism can be modeled as a Langmuir-Hinshelwood process, as referenced in the introduction [36]. Furthermore, the slope of this linear trend correlates with the surface energy of the nanoparticles, as detailed in Ref. [36]. This finding supports the notion that variations in surface composition significantly influence the nanoparticles’ catalytic activity and adsorption behavior.
More quantitatively, from Figure 5 is possible to observe that the peak current for Ni1Pd3 is higher, with fluctuations among the four maxima remaining within ±20% of the average peak current, A. In contrast, Ni1Pd1 shows greater variability in peak current, reaching up to ±33% around the average value A. For Ni3Pd1, the average peak current is significantly lower, at A, but the variations are similar to Ni1Pd3, around ±20%. These findings suggest that current variability increases when the relative proportions of Ni and Pd approach equimolar ratios.
6. Conclusions
This study analyzes the impact of the relative proportion of nickel (Ni) and palladium (Pd) in catalytic nanoparticles on the methanol oxidation reaction (MOR). The results are presented in terms of kinetic parameters, surface concentrations and peak currents, showing significant differences between three main compositions: Ni3Pd1, Ni1Pd1 and Ni1Pd3.
It is observed that a higher Pd content on the surface promotes water adsorption and increases its oxidation rate, thereby reducing the need for direct OH adsorption. This trend is evident in the lower concentration of water adsorbed on Ni3Pd1 nanoparticles compared to the other two compositions. Furthermore, the increase in Pd favors mechanisms in which the formation of Pd oxides plays a minor role in surface poisoning, unlike Ni, which increases the concentrations of adsorbed OH, contributing significantly to the blocking of active sites.
The analysis of the rate constants shows that, for Ni1Pd3, the adsorption of methanol depends markedly on its concentration in the medium, being approximately three times higher for concentrations lower than 1 M, compared to the other two compositions. In contrast, the adsorption rate of OH on Ni3Pd1 remains constant. These results suggest that the predominant presence of Pd favors the oxidation of water and reduces the dependence on OH-based mechanisms. On the other hand, nanoparticles with equimolar proportions (Ni1Pd1) stand out for oxidizing adsorbed carbonates approximately three times faster than the other two compositions, which influences the symmetry of the oxidation peaks. Regarding the transfer parameter, Ni3Pd1 shows a higher degree of asymmetry in the oxidation energy barrier, while Ni1Pd1 and Ni1Pd3 have more constant values and closer to 0.83.
The results suggest that a higher Pd content favors more efficient oxidation mechanisms, by reducing the formation of intermediate products that cause surface poisoning, such as CO, carbonates or palladium oxide. However, as the proportion of Ni increases, an increase in the concentration of adsorbed OH is observed, which dominates the blocking of active sites even above from the palladium oxide blocking. This behavior clearly differs from the that observed in the direct methanol-CO mechanism in which carbonate formation is avoided in Pd dominant alloys. This relationship suggests that the surface composition can be tuned to optimize catalytic performance, depending on the desired dominant mechanism.
Finally, the study highlights how the relative proportion of Ni and Pd affects both the kinetic characteristics and the intermediate products, providing a basis for the rational design of catalysts in methanol oxidation applications.
Author Contributions
ASU: experimentation, formal analysis, funding acquisition, methodology, software, visualization, and writing. ALD: conceptualization, formal analysis, writing, review, software, editing and writing the original draft; JTE: experimentation, formal analysis and writing. ISH: conceptualization, funding acquisition, formal analysis, investigation, methodology, supervision, review and writing of the original draft.
Funding
This research was funded by UNAM DGAPA by grant number PAPIIT-IN113523 and LANCAD-UNAM-DGTIC-276.
Institutional Review Board Statement
Not applicable.
Informed Consent Statement
Not applicable.
Data Availability Statement
All data used were taken from published research and are cited in the captions of the figures. ©Mathematica programs (License) used for evaluation of the formulae are available from the authors.
Acknowledgments
ASU acknowledges DGAPA-UNAM and UMDI-J-FC UNAM, for scholarship and support for the postdoctoral position to develop this work; and M. Sc. Manuel Aguilar Franco from the Microscopy Laboratory at CFATA-UNAM for his technical work with the electronic microscope.ALD and ISH acknowledge the UMDI-J-FC UNAM for support under grant number 115377.
Conflicts of Interest
The authors declare no conflict of interest.
References
- EG; G Technical Services Inc. .; U.S. Department of Energy. Fuel cell handbook (seventh edition); Lulu.com: Morrisville, NC, 2016. [Google Scholar]
- Abbas, Q.; Mirzaeian, M.; Hunt, M.R.; Hall, P.; Raza, R. Current State and Future Prospects for Electrochemical Energy Storage and Conversion Systems. Energies 2020, 13. [Google Scholar] [CrossRef]
- Ehteshami, S.M.M.; Chan, S. The role of hydrogen and fuel cells to store renewable energy in the future energy network – potentials and challenges. Energy Policy 2014, 73, 103–109. [Google Scholar] [CrossRef]
- Charles, P. Poole, Jr., F.J.O. Introduction to nanotechnology; John Wiley & Sons: New Jersey, 2003. [Google Scholar]
- A. Edelstein, R. Cammarata, E. Nanomaterials : synthesis, properties, and applications, Second Edition; Taylor and Francis: New York, 1996. [Google Scholar]
- Buffat, P.; Borel, J.P. Size effect on the melting temperature of gold particles. Phys. Rev. A 1976, 13. [Google Scholar] [CrossRef]
- Khairutdinov, R.F. Chemistry of semiconductor nanoparticles. Russ. Chem. Rev. 1998, 67. [Google Scholar] [CrossRef]
- Ekimov, A.I. Quantum Size Effect in Three-Dimensional Microscopic Semiconductor Crystals. JETP Lett. 1981, 34. [Google Scholar] [CrossRef]
- Gleiter, H. Nanostructured materials: basic concepts and microstructure. Acta Materialia 2000, 48. [Google Scholar] [CrossRef]
- Ge, Z.; Cahill, D.G.; Braun, P.V. AuPd Metal Nanoparticles as Probes of Nanoscale Thermal Transport in Aqueous Solution. J. Phys. Chem. B 2004, 49. [Google Scholar] [CrossRef]
- Campbell, C.T.; Mao, Z. Chemical Potential of Metal Atoms in Supported Nanoparticles: Dependence upon Particle Size and Support. ACS Catal. 2017, 12. [Google Scholar] [CrossRef]
- Campbell, C.T.; Mao, Z. Correction to Chemical Potential of Metal Atoms in Supported Nanoparticles: Dependence upon Particle Size and Support. ACS Catal. 2018, 8. [Google Scholar] [CrossRef]
- Yaqoob, L.; Noor, T.; Iqbal, N. A comprehensive and critical review of the recent progress in electrocatalysts for the ethanol oxidation reaction. RSC Adv. 2021, 11. [Google Scholar] [CrossRef]
- Yu, R.; Zhang, Y.; Deng, S.; Zhu, R.; Zhang, S.; Zhang, J.; Zhao, Y.; Xia, Z. Platinum Alloys for Methanol Oxidation Electrocatalysis: Reaction Mechanism and Rational Design of Catalysts with Exceptional Activity and Stability. Catalysts 2024, 14, 60. [Google Scholar] [CrossRef]
- Corti, H.R.; Gonzalez, E.R. Direct Alcohol Fuel Cells: Materials, Performance, Durability and Applications. Direct Alcohol Fuel Cells 2014. [Google Scholar]
- Liang, Z.; Zhao, T.; Xu, J.; Zhu, L. Mechanism Study of the Ethanol Oxidation Reaction on Palladium in Alkaline Media. Electrochim Acta 2009, 54. [Google Scholar] [CrossRef]
- Huang, L.; Zhang, X.; Wang, Q.; Han, Y.; Fang, Y.; Dong, S. Shape-Control of Pt-Ru Nanocrystals: Tuning Surface Structure for Enhanced Electrocatalytic Methanol Oxidation. J Am. Chem. Soc. 2018, 140. [Google Scholar] [CrossRef]
- Maya-Cornejo, J.; Ledesma-Durán, A.; Hernández, S.I.; Santamaría-Holek, I. Competitive Adsorption and Interplay between Methanol and Water During Electro-Oxidation on Pd-Based Electrocatalyst. Journal of The Electrochemical Society 2022, 169, 046505. [Google Scholar] [CrossRef]
- Tian, X.; Lu, X.F.; Xia, B.Y.; Lou, X.W.D. Advanced Electrocatalysts for the Oxygen Reduction Reaction in Energy Conversion Technologies. Joule 2020, 4. [Google Scholar] [CrossRef]
- Carvalho, L.L.; Colmati, F.; Tanaka, A.A. Nickel-palladium electrocatalysts for methanol, ethanol, and glycerol oxidation reactions. International journal of hydrogen energy 2017, 42. [Google Scholar] [CrossRef]
- Wu, L.; Fan, W.; Wang, X.; Lin, H.; Tao, J.; Liu, Y.; Deng, J.; Jing, L.; Dai, H. Methane Oxidation over the Zeolites-Based Catalysts. Catalysts 2023, 13, 604. [Google Scholar] [CrossRef]
- Liu, C.; Yang, F.; Schechter, A.; Feng, L. Recent progress of Ni-based catalysts for methanol electrooxidation reaction in alkaline media. Advanced Sensor and Energy Materials 2023, 2. [Google Scholar] [CrossRef]
- Selepe, C.T.; Gwebu, S.S.; Matthews, T.; Mashola, T.A.; Sikeyi, L.L.; Zikhali, M.; Mbokazi, S.P.; Makhunga, T.S.; Adegoke, K.A.; Maxakato, N.W. Electro-Catalytic Properties of Palladium and Palladium Alloy Electro-Catalysts Supported on Carbon Nanofibers for Electro-Oxidation of Methanol and Ethanol in Alkaline Medium. Catalysts 2022, 12, 608. [Google Scholar] [CrossRef]
- Chowdhurya, S.R.; Ghoshb, S.; Bhattachrya, S.K. Enhanced and synergistic catalysis of one-pot synthesized palladium-nickel alloy nanoparticles for anodic oxidation of methanol in alkali. Electrochimica Acta 2017, 250. [Google Scholar] [CrossRef]
- Majumdar, D.; Bhattacharya, S.K. Recent Developments of Methanol Electrooxidation Using Nickel-based Nanocatalysts. ChemistrySelect 2022, 7. [Google Scholar] [CrossRef]
- Mansor, M.; Timmiati, S.N.; Wong, W.Y.; Zainoodin, A.M.; Lim, K.L.; Kamarudin, S.K. NiPd Supported on Mesostructured Silica Nanoparticle as Efficient Anode Electrocatalyst for Methanol Electrooxidation in Alkaline Media. Catalysts 2020, 10. [Google Scholar] [CrossRef]
- Araujo, R.B.; Mart n-Yerga, D.; dos Santosa, E.C.; Cornell, A.; Pettersson, L.G. Elucidating the role of Ni to enhance the methanol oxidation reaction on Pd electrocatalysts. Electrochimica Acta 2020, 360. [Google Scholar] [CrossRef]
- Sui, L.; An, W.; Feng, Y.; Wang, Z.; Zhou, J.; Hur, S.H. Bimetallic Pd-Based surface alloys promote electrochemical oxidation of formic acid: Mechanism, kinetics and descriptor. Journal of Power Sources 2020, 451. [Google Scholar] [CrossRef]
- Kottayintavida, R.; Ganguly, D.; Gopalan, N.K. Bimetallic NiWO4 as an Efficient Interface Modulator for Pd Towards Enhanced Alcohol Electro-oxidation. Electrocatalysis 2024, 1–13, 1–13. [Google Scholar] [CrossRef]
- Mattarozzi, L.; Cattarin, S.; Comisso, N.; Gerbasi, R.; Guerriero, P.; Musiani, M.; Vázquez-Gómez, L. Preparation of compact and porous Pd-Ni alloys and study of their performances for ethanol oxidation in alkali. Electrochimica Acta 2019, 307, 503–511. [Google Scholar] [CrossRef]
- Obradović, M.D.; Stančić, Z.M.; Lačnjevac, U.Č.; Radmilović, V.V.; Gavrilović-Wohlmuther, A.; Radmilović, V.R.; Gojković, S.L. Electrochemical oxidation of ethanol on palladium-nickel nanocatalyst in alkaline media. Applied Catalysis B: Environmental 2016, 189, 110–118. [Google Scholar] [CrossRef]
- Moraes, L.P.R.; Matos, B.R.; Radtke, C.; Santiago, E.I.; Fonseca, F.C.; Amico, S.C.; Malfatti, C.F. Synthesis and performance of palladium-based electrocatalysts in alkaline direct ethanol fuel cell. International Journal of Hydrogen Energy 2016, 41, 6457–6468. [Google Scholar] [CrossRef]
- Vyas, A.N.; Saratale, G.D.; Sartale, S.D. Recent developments in nickel based electrocatalysts for ethanol electrooxidation. International Journal of Hydrogen Energy 2020, 45, 5928–5947. [Google Scholar] [CrossRef]
- Del Rosario, J.A.D.; Ocon, J.D.; Jeon, H.; Yi, Y.; Lee, J.K.; Lee, J. Enhancing role of nickel in the nickel–palladium bilayer for electrocatalytic oxidation of ethanol in alkaline media. The Journal of Physical Chemistry C 2014, 118, 22473–22478. [Google Scholar] [CrossRef]
- Lović, J.D.; Jović, V.D. Electrodeposited Pd and PdNi coatings as electrodes for the electrochemical oxidation of ethanol in alkaline media. Journal of Solid State Electrochemistry 2017, 21, 2433–2441. [Google Scholar] [CrossRef]
- Santoveña-Uribe, A.; Maya-Cornejo, J.; Estévez, M.; Santamaría-Holek, I. Thermodynamic Analysis of Size-Dependent Surface Energy in Pd Nanoparticles for Enhanced Alkaline Ethanol Electro-Oxidation. Nanomaterials 2024, 14, 1966. [Google Scholar] [CrossRef]
- Košević, M.G.; Nikolić, N.D.; Lović, J.D. A. Versatile Electrodeposition Approach to Controlled Modification of Pd on Sb Towards Efficient Electrocatalysis for Application in Direct Methanol Fuel Cells. Electrocatalysis 2024. [Google Scholar] [CrossRef]
Figure 1.
Upper row: Oxidation curves for MOR of the three compositions considered for the alloy nanoparticles: Ni1Pd1, Ni3Pd1 and Ni1Pd3, and four different bulk methanol concentration, 0.8M, 1.0M, 1.2M and 1.5M. Symbols represent experimental data and lines the theoretical curves obtained by solving Eqs. (11)-(19). Bottom row: Corresponding current contributions to the total MOR for the 1M case of the methanol bulk concentration as a function of the overpotential for the three compositions. The values of the parameters used to fit the curves are given in Figure 2 and Figure 3.
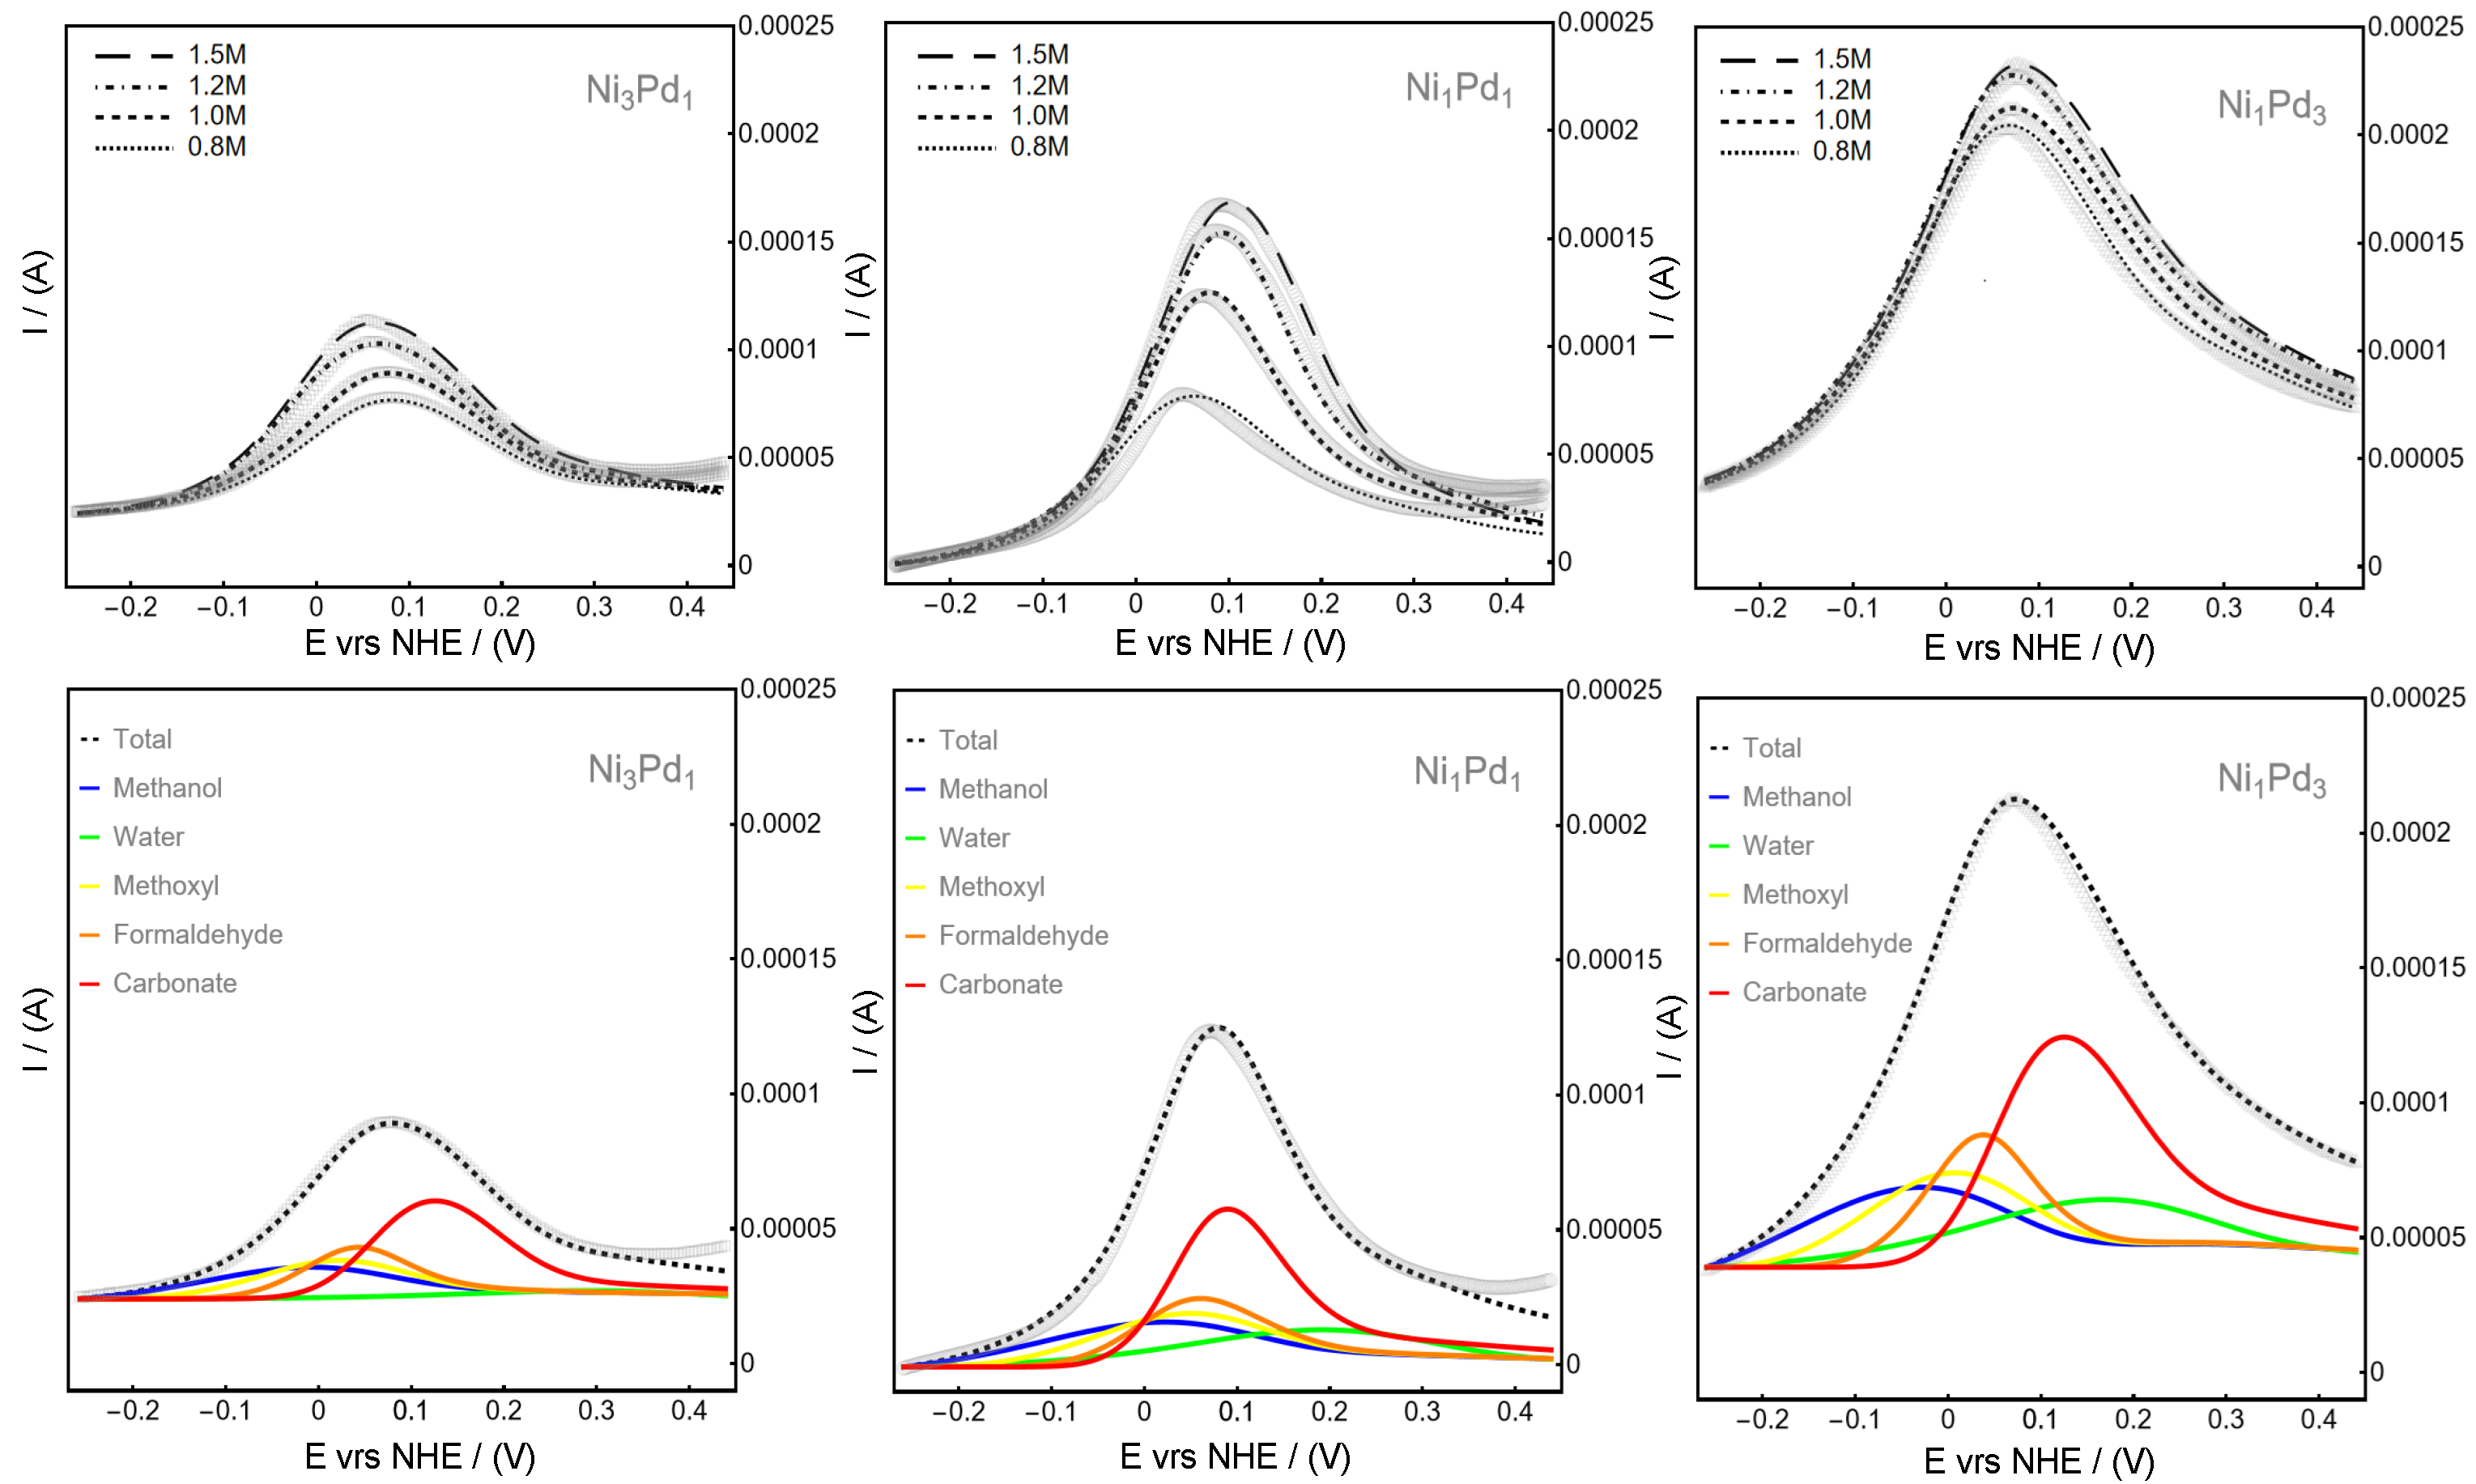
Figure 2.
Bulk methanol concentration dependence of the rate constants used for the fitting of the oxidation curves of the three compositions considered for the alloy nanoparticles: Ni3Pd1 (open squares), Ni1Pd1 (open circles) and Ni1Pd3 (open triangles). Top row: Adsorption rate constants , and . Middle row: Water hydrolysis rate and first two methanol oxidation rate constants and . Bottom row: Rate constants , and .
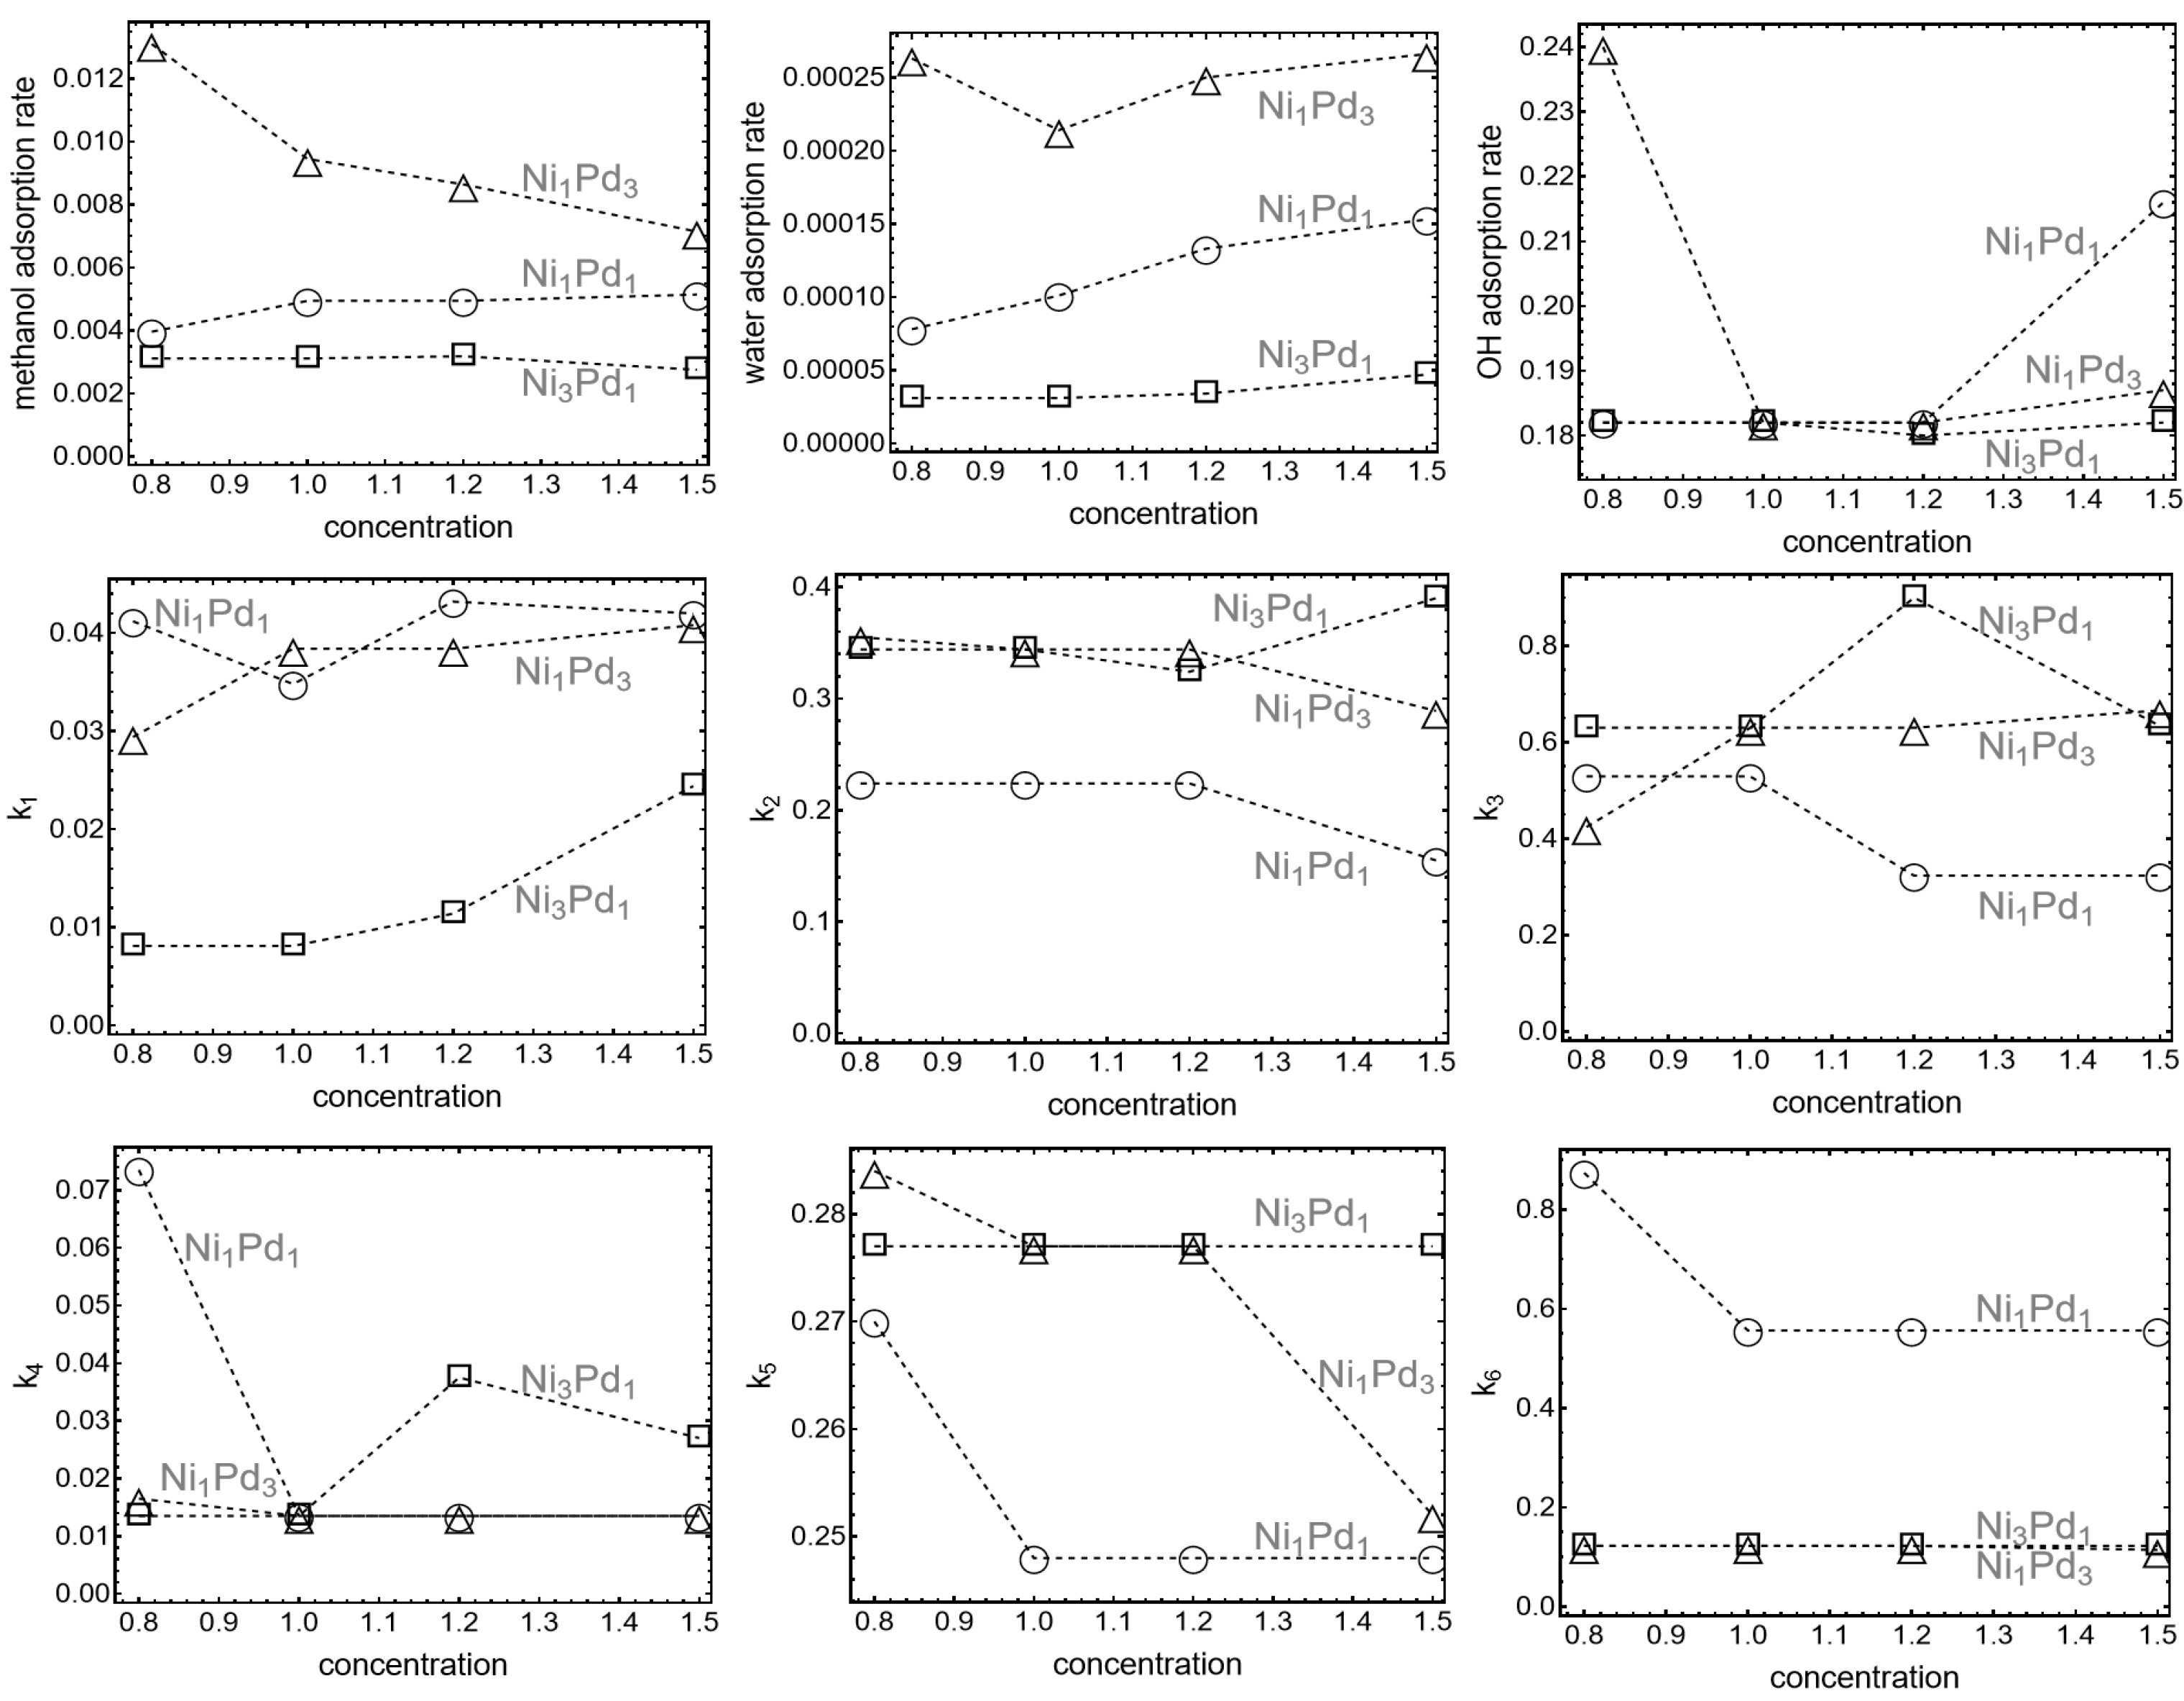
Figure 3.
Surface concentrations of the reagents involved in the production of electric current for the three different cells.
Figure 3.
Surface concentrations of the reagents involved in the production of electric current for the three different cells.
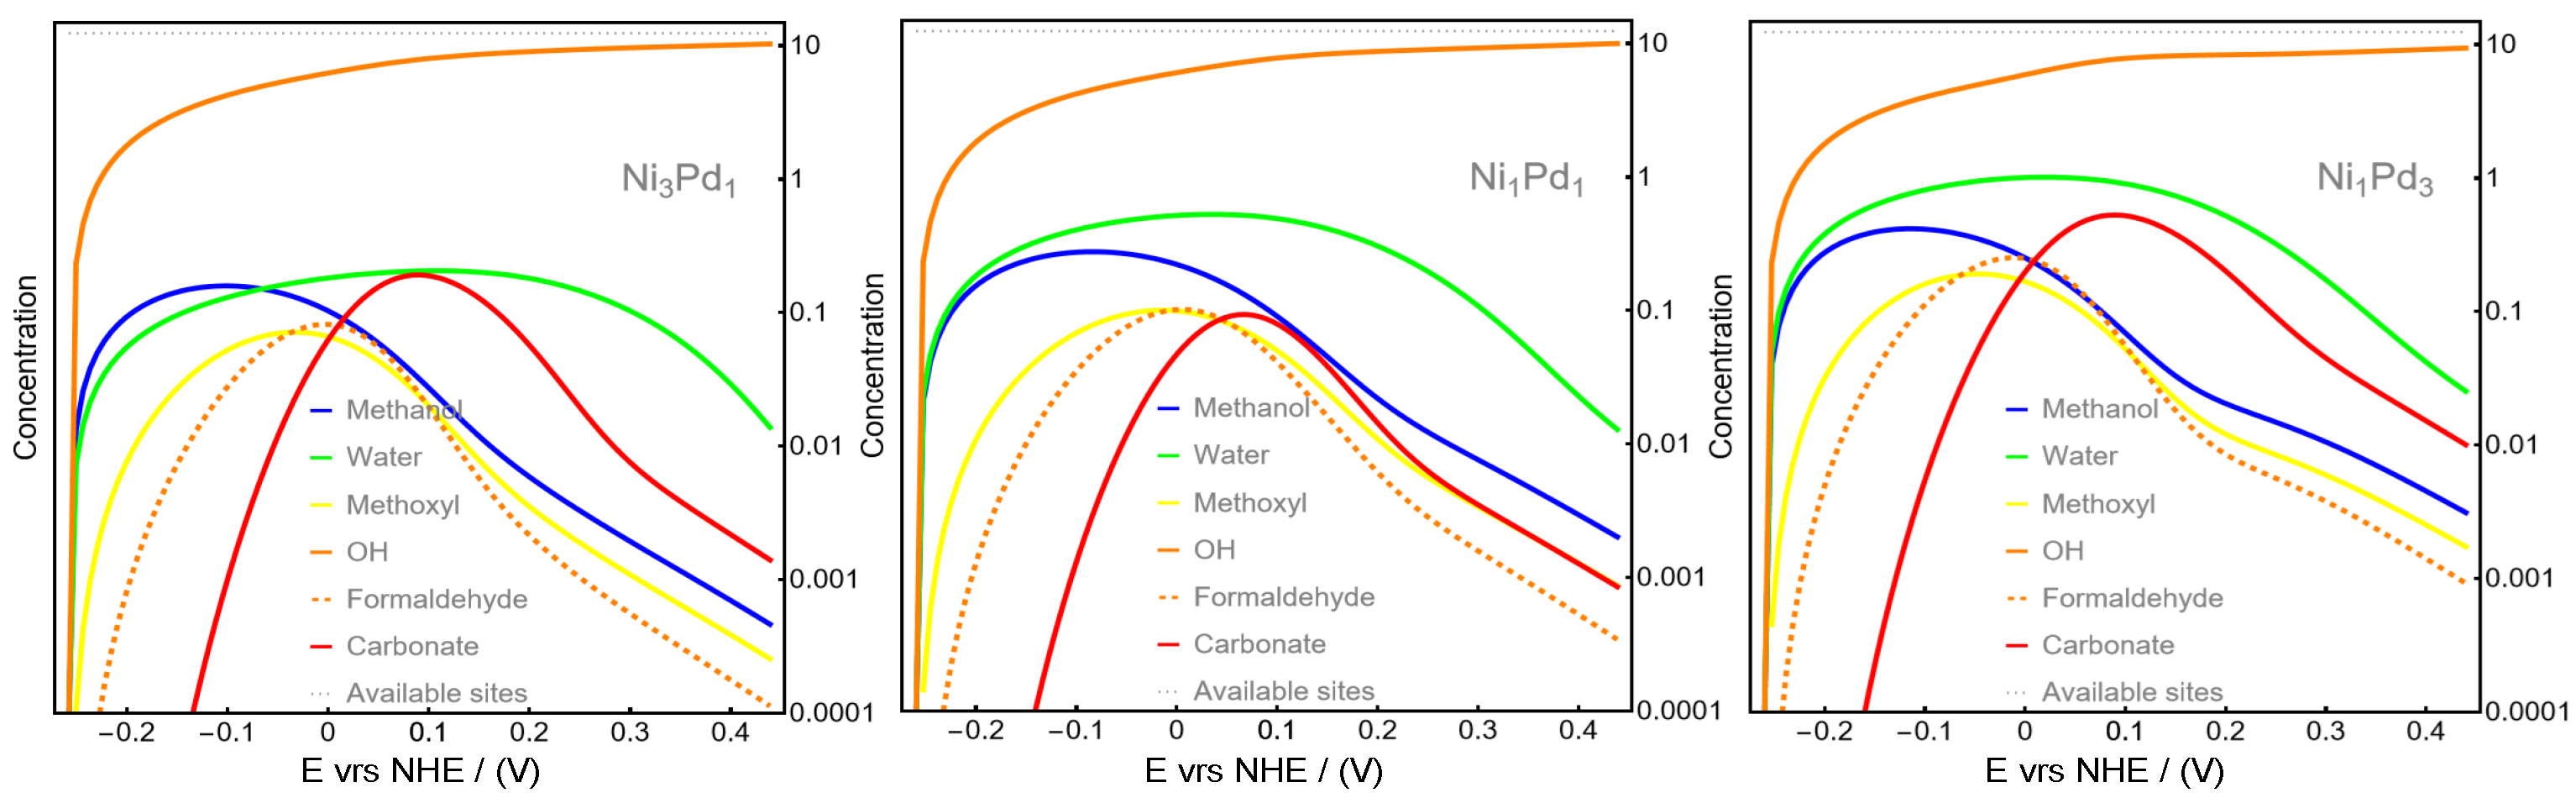
Figure 4.
Surface concentrations of the reagents not involved in the production of electric current for the three different cells. We also included the sum of all remaining concentrations and the total number of active sites to visualize the poisoning.
Figure 4.
Surface concentrations of the reagents not involved in the production of electric current for the three different cells. We also included the sum of all remaining concentrations and the total number of active sites to visualize the poisoning.
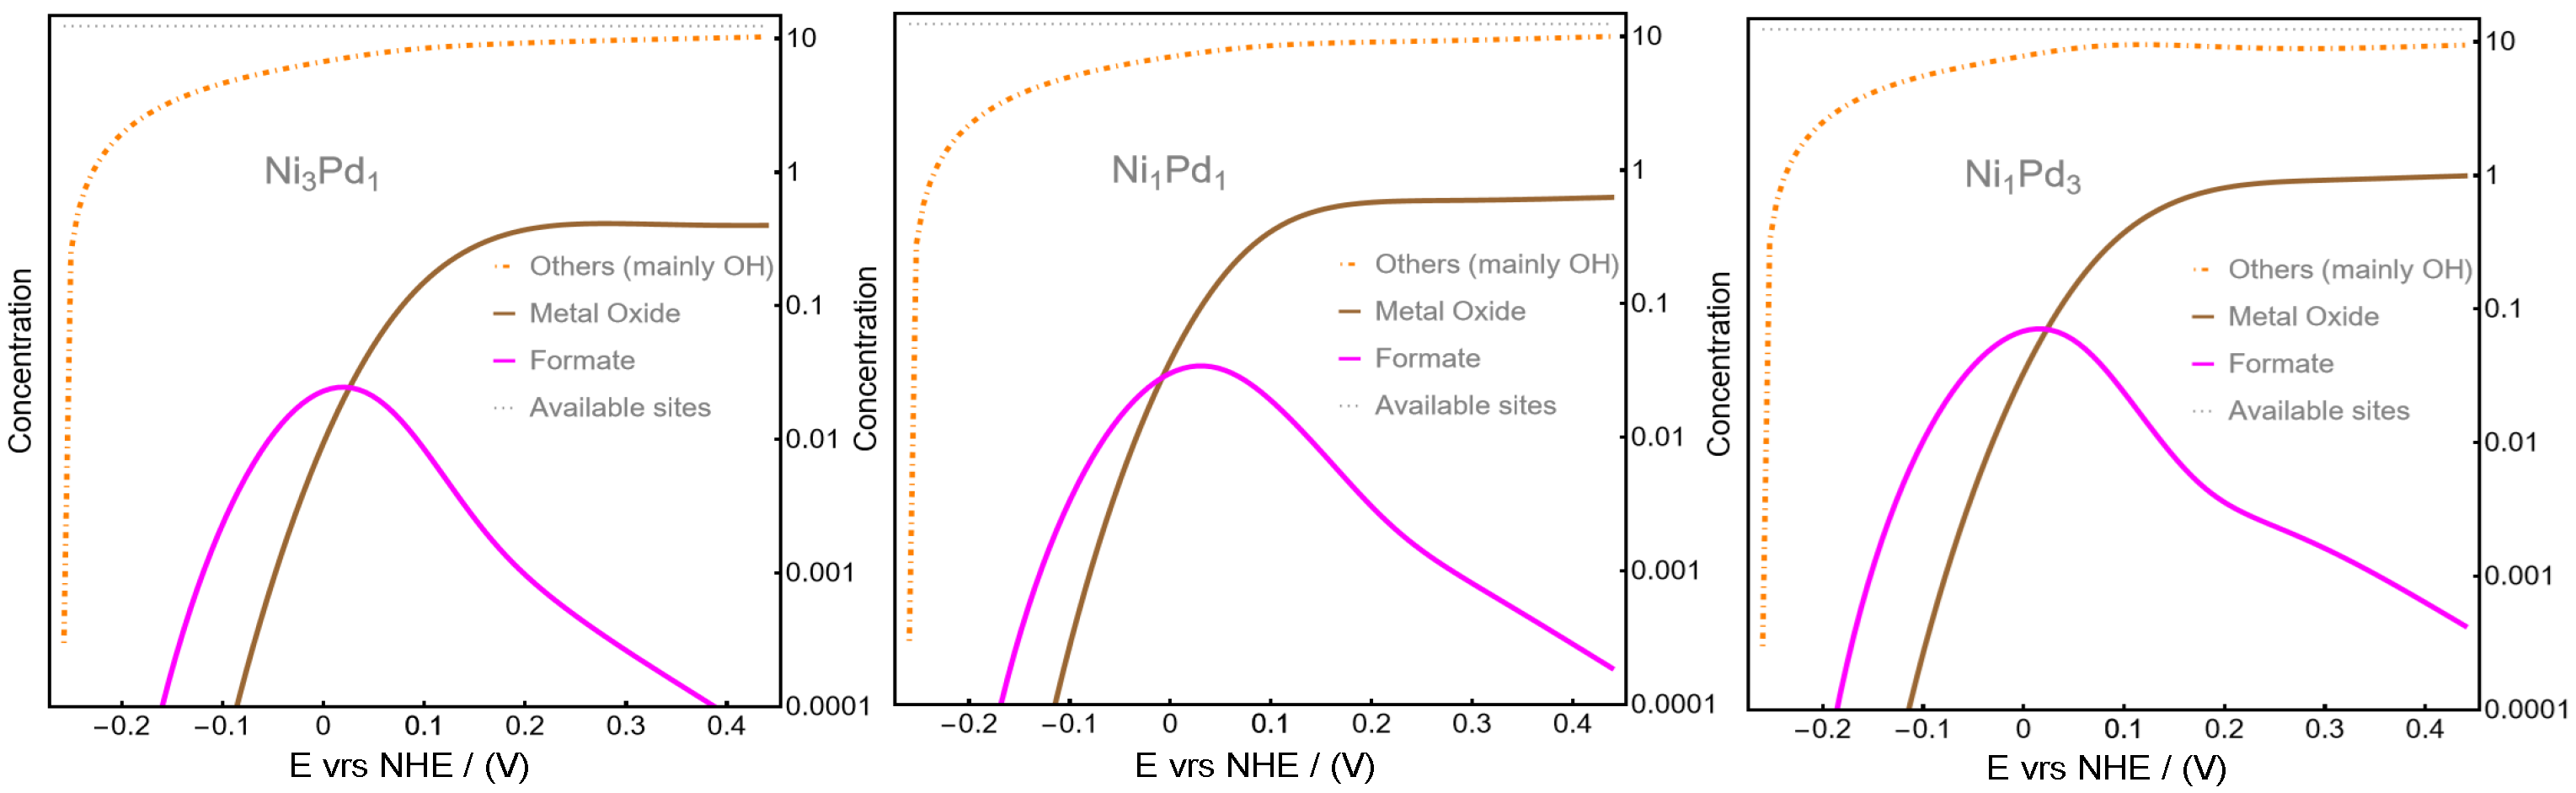
Figure 5.
Left: Transfer parameter as a function of the bulk methanol concentration for the three compositions considered for the alloy nanoparticles: Ni3Pd1, Ni1Pd1 and Ni1Pd3. Right: Peak current in terms of methanol bulk concentration.
Figure 5.
Left: Transfer parameter as a function of the bulk methanol concentration for the three compositions considered for the alloy nanoparticles: Ni3Pd1, Ni1Pd1 and Ni1Pd3. Right: Peak current in terms of methanol bulk concentration.
Disclaimer/Publisher’s Note: The statements, opinions and data contained in all publications are solely those of the individual author(s) and contributor(s) and not of MDPI and/or the editor(s). MDPI and/or the editor(s) disclaim responsibility for any injury to people or property resulting from any ideas, methods, instructions or products referred to in the content. |
© 2025 by the authors. Licensee MDPI, Basel, Switzerland. This article is an open access article distributed under the terms and conditions of the Creative Commons Attribution (CC BY) license (http://creativecommons.org/licenses/by/4.0/).
Copyright: This open access article is published under a Creative Commons CC BY 4.0 license, which permit the free download, distribution, and reuse, provided that the author and preprint are cited in any reuse.


