1. Background and Objective
Earthquakes pose a significant global threat, and their impacts are increasingly evident. While large-scale earthquakes have been relatively rare in South Korea, notable seismic events such as the Gyeongju earthquake in 2016, with recorded magnitudes of 5.1 and 5.8 on the Richter scale, and the Pohang earthquake in 2017, which registered a magnitude of 5.4, have raised concerns. The Gyeongju earthquake, in particular, marked the highest intensity recorded in South Korea since the initiation of earthquake monitoring, highlighting the reality that South Korea can no longer be regarded as a safe zone from seismic events. This realization has prompted the government to implement measures aimed at mitigating seismic hazards.
Due to the unpredictable nature of earthquakes, it is imperative to develop strategies that minimize damage following their occurrence. In 2016, in the aftermath of the Gyeongju earthquake, South Korean municipalities began designating and operating earthquake evacuation sites across the nation. The strategic placement of these evacuation sites is critical for ensuring effective evacuation during emergencies (Chen et al., 2013). In South Korea, earthquake evacuation facilities are classified into outdoor earthquake evacuation sites for temporary use during seismic events and indoor earthquake shelters for prolonged evacuations in instances of extensive damage. Outdoor earthquake evacuation sites include playgrounds, parks, open spaces, and large outdoor parking lots, serving as evacuation points for both local residents and individuals present in the area at the time of an earthquake.
Given the challenges associated with earthquake prediction, various studies have been conducted to identify potential evacuation demands and corresponding needs to minimize damage (Chen et al., 2013; Kim et al., 2016; Xu et al., 2016; Yu & Wen, 2016). The capacity of earthquake evacuation facilities is evaluated based on the resident population density in the area. Adequate capacity signifies that the evacuation site can accommodate a larger number of individuals than the resident population within the designated area. Thus, accurate capacity analysis necessitates comprehensive data on both the area and its population. In South Korea, resident population data is typically compiled at the administrative level using census information at the Dong level (a sub-village level). However, for capacity analysis, it is essential to consider the de facto population that varies throughout the day, such as daytime and nighttime populations, rather than relying solely on static resident population data (Kaveh et al., 2020). The resident population, which reflects static census data, has limitations as it does not account for the dynamic nature of the de facto population (Yu & Wen, 2016). As a result, recent studies increasingly utilize de facto population data derived from mobile location tracking to better predict actual evacuation demands (Deville et al., 2014; Lee et al., 2018; Wu et al., 2018; Yun et al., 2020).
In South Korea, outdoor earthquake evacuation sites were designated following the Gyeongju and Pohang earthquakes in 2016 and 2017. The expedited establishment of these outdoor evacuation sites in 2016 raised concerns regarding spatial inequality and accessibility challenges. In particular, densely populated areas such as central business districts in large cities may experience a deficiency of outdoor evacuation sites. Recent studies utilizing de facto population data have evaluated the accessibility of outdoor earthquake evacuation sites (Kim et al., 2022). These studies typically analyze evacuation site capacity at a specific administrative level—usually district-based—and assess the need for additional facilities in areas where current capacity is insufficient. However, there is a notable lack of comprehensive studies that encompass major metropolitan cities in South Korea.
Approximately eight years have elapsed since the designation of outdoor earthquake evacuation sites in South Korea. At this juncture, it is imperative to verify the actual capacity demand and evacuation feasibility. Based on these findings, a plan should be established to augment the existing network of outdoor earthquake evacuation sites. Furthermore, when formulating supplementary measures, it is crucial to identify areas that require additional evacuation site designations, ones with adequate capacity that may still face challenges in timely evacuation, and to develop specific implementation strategies tailored to each area.
This study aims to analyze the practical utilization of outdoor earthquake evacuation sites designated as primary evacuation facilities throughout the metropolitan city of Daegu, focusing on capacity and accessibility. The objective is to derive improvement measures for the efficient and appropriate designation of outdoor earthquake evacuation sites and to propose methodologies applicable to evacuation site designation planning through this analytical process.
2. Research Methodology
2.1. Study Area
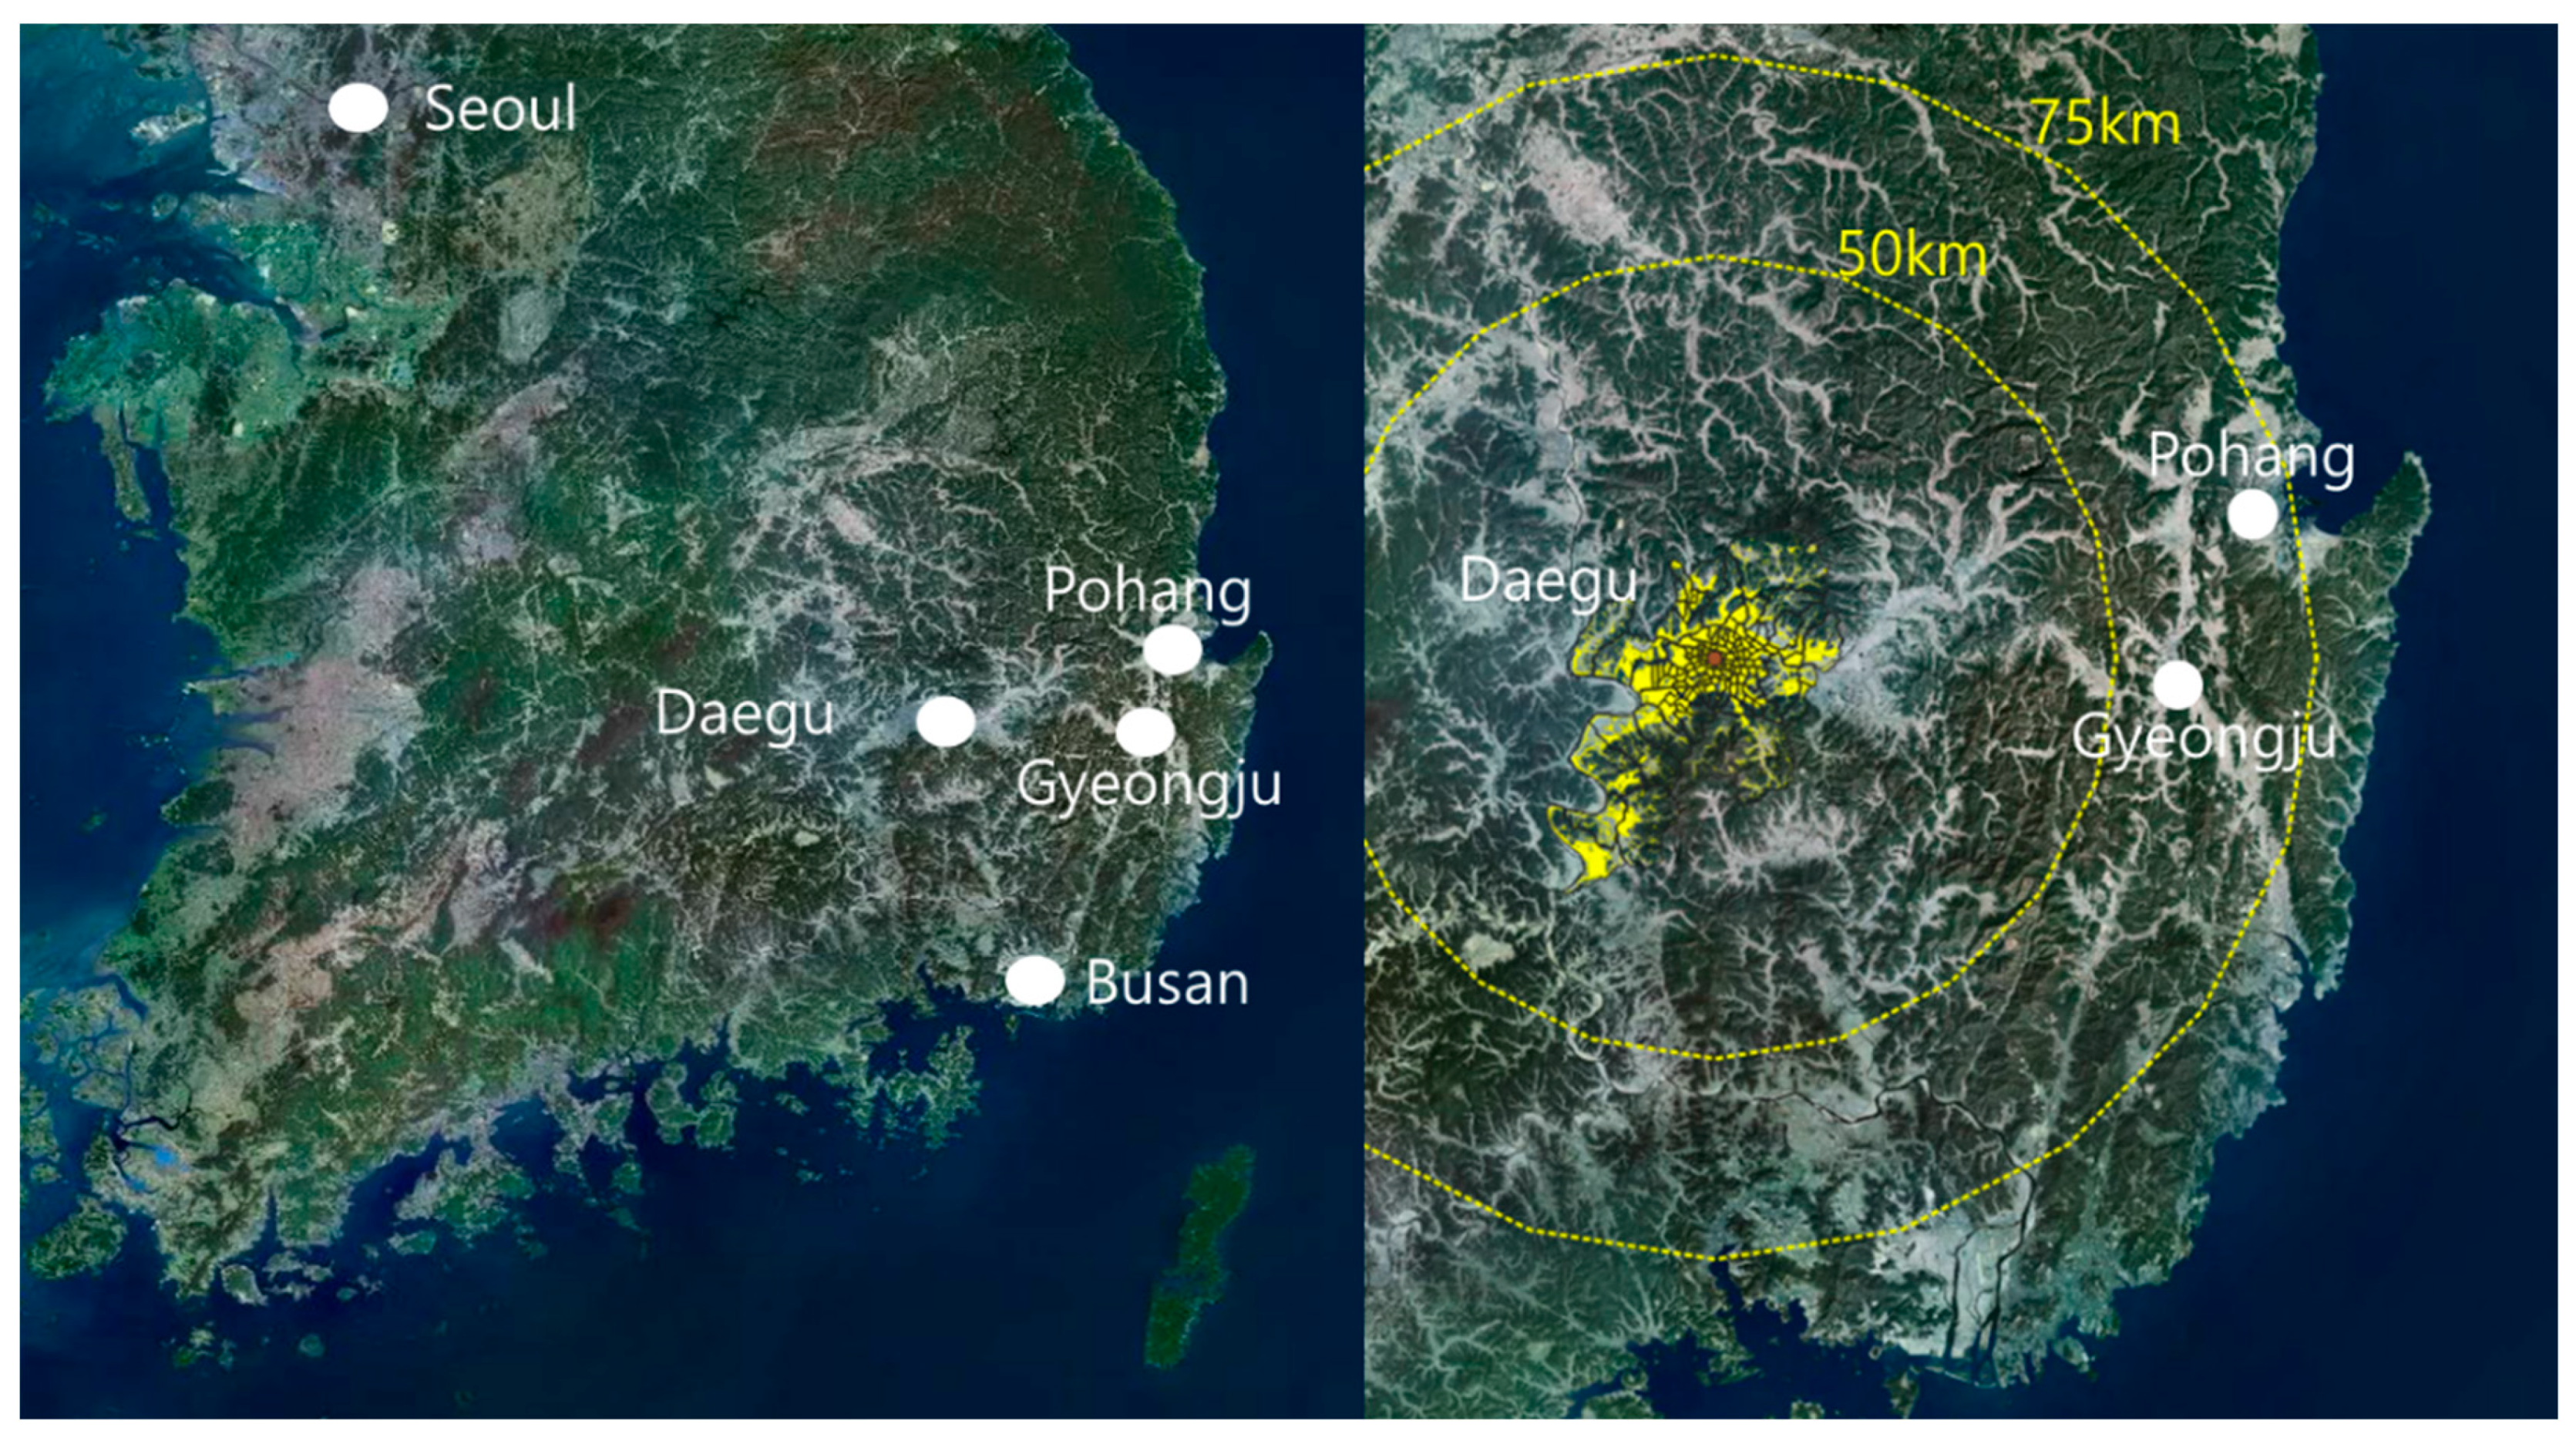
This study concentrates on Daegu Metropolitan City, South Korea (
Figure 1). Daegu is situated near Gyeongju and Pohang, where significant earthquakes occurred in 2016 and 2017, rendering it vulnerable to seismic activity. As a major metropolitan city with a population exceeding 2 million, Daegu is anticipated to sustain considerable damage in the event of an earthquake. As of May 2024, Daegu’s population is approximately 2.35 million, covering an area of about 1,497 square kilometers. The study area includes Daegu Metropolitan City, excluding Gunwi County, which was incorporated into Daegu Metropolitan City in July 2023. As of August 2024, Gunwi County has a population of 23,164 and an area of 614.29 square kilometers. Though incorporated, Gunwi County retains its rural character, prompting its exclusion from this study, which is centered on metropolitan regions. Furthermore, Daegu lies within a basin surrounded by mountains, and encompasses a total area of 880.09 square kilometers, with only 28.9% urbanized, primarily concentrated in the central part.
2.2. Research Method
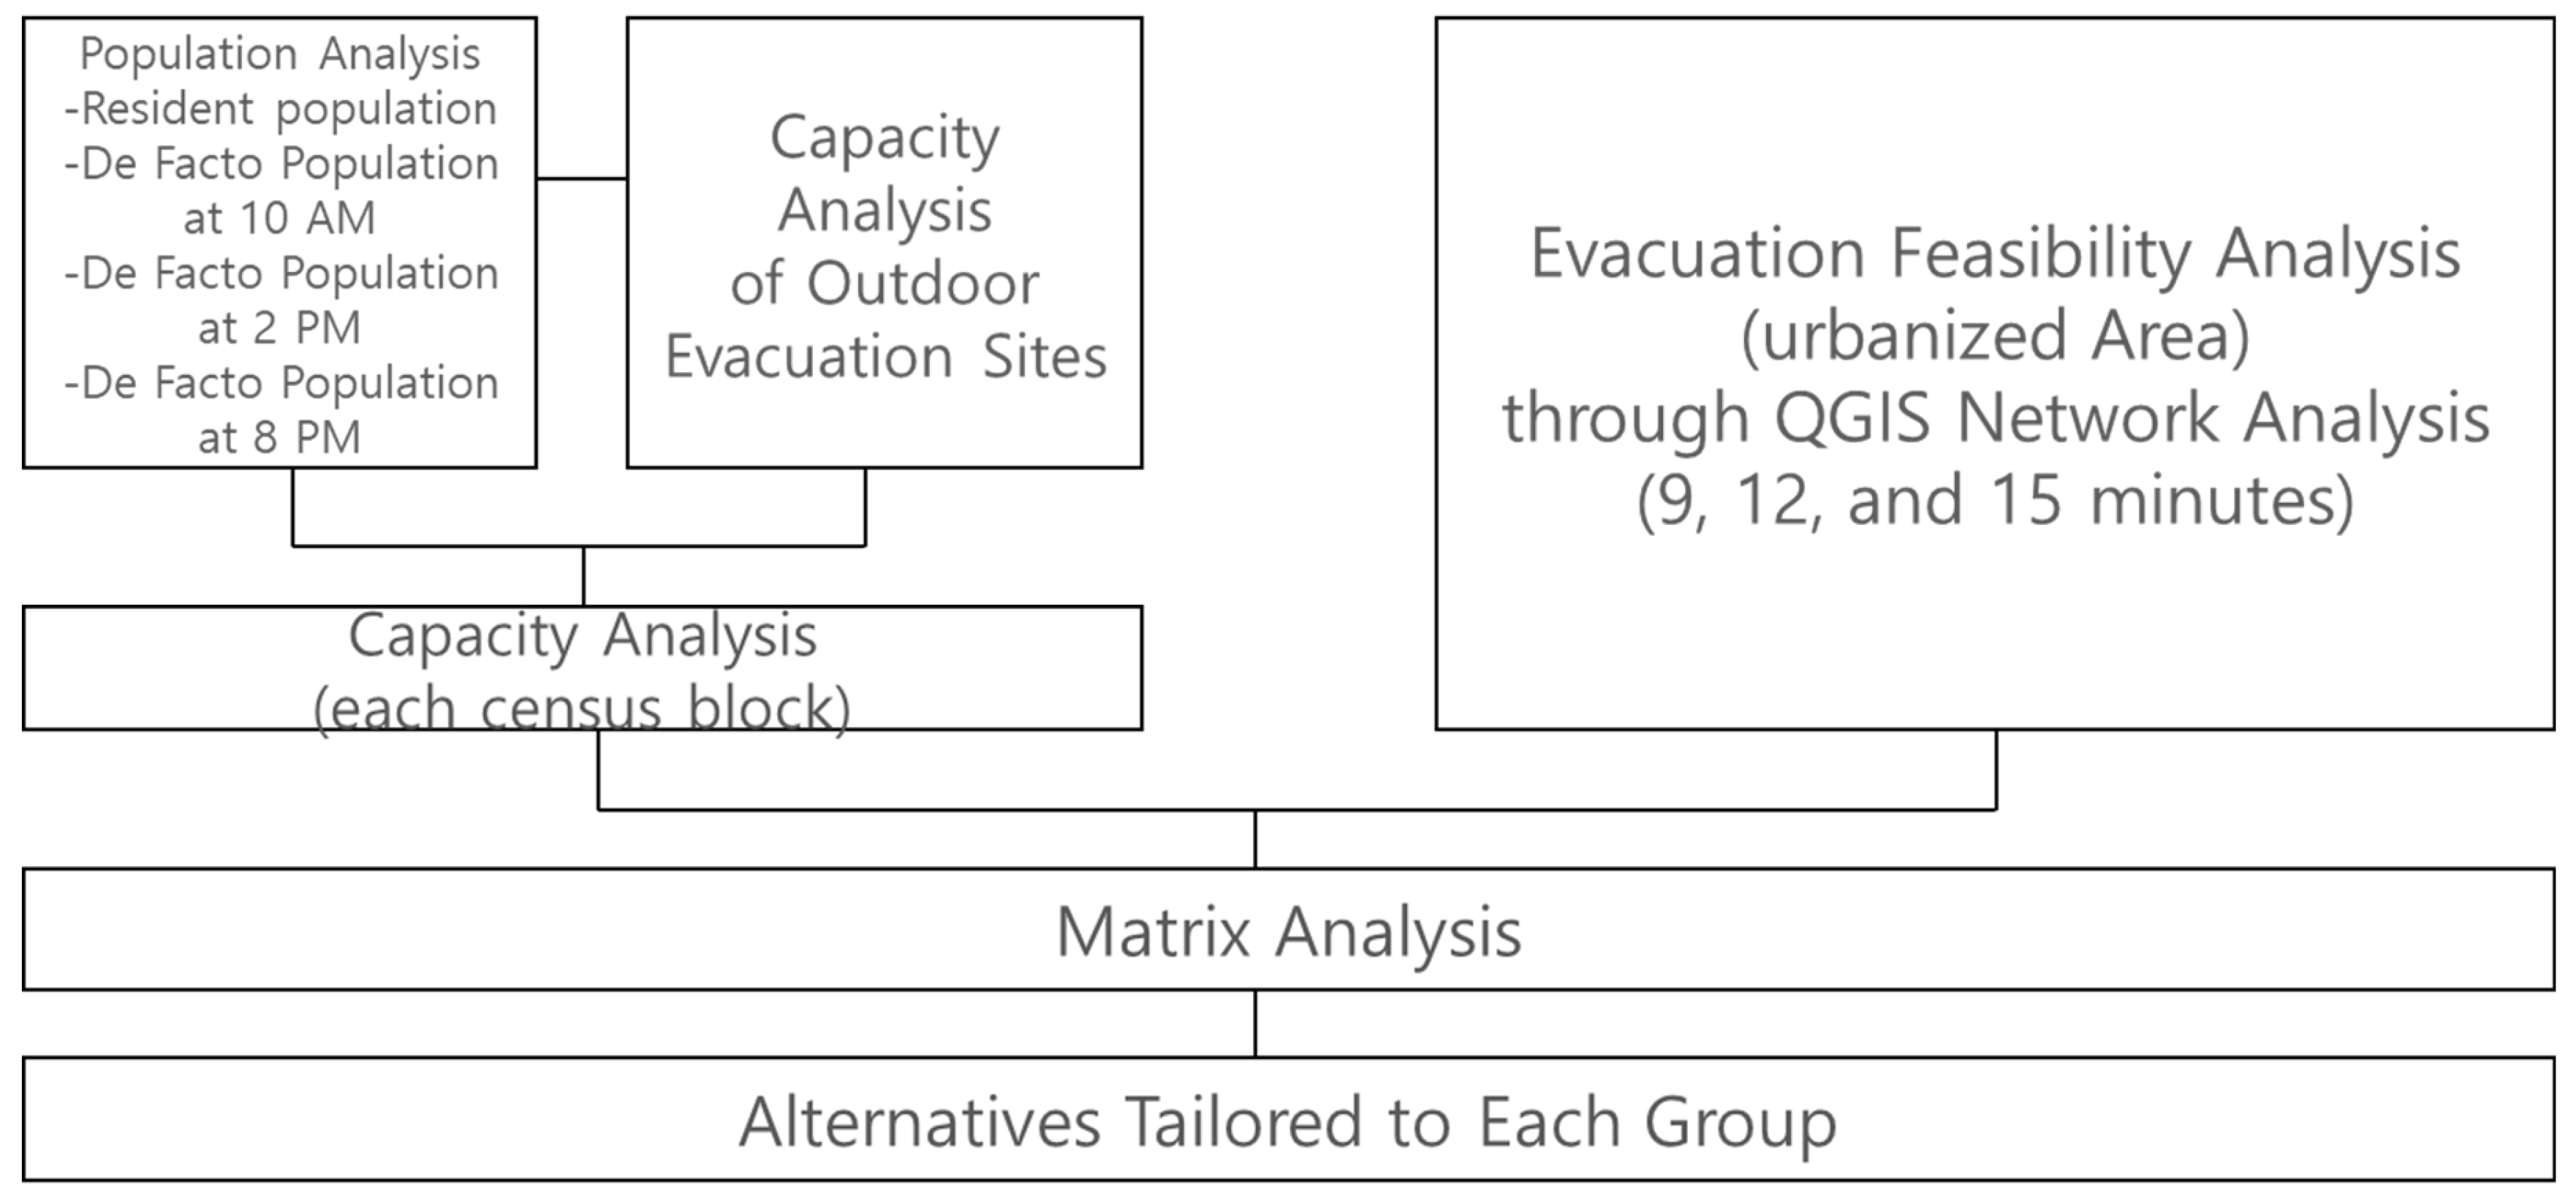
To assess the current capacity of outdoor earthquake evacuation sites in the study area, identify existing issues, and propose improvement measures, it is essential to consider various factors influencing evacuation after an earthquake. The most critical factors include spatial accessibility and the capacity of the evacuation sites (L. Zhao et al., 2017). Therefore, this study first analyzed the de facto population and reviewed evacuation site capacity within the census blocks of the study area, as illustrated in
Figure 2. The analysis evaluated the capacity of the evacuation sites accordingly. Additionally, recognizing that individuals typically evacuate to the nearest earthquake outdoor evacuation site during a seismic event, the accessibility of these evacuation sites was also assessed.
Accessibility was assessed through GIS network analysis, calculating the travel distance to the nearest outdoor earthquake evacuation site. Areas deemed inaccessible were classified into three categories: those inaccessible within 9, 12, and 15 minutes. Findings on evacuation site capacity and feasibility were subsequently used in a matrix analysis to categorize groups and propose tailored alternatives based on each group’s unique characteristics.
2.3. Capacity Analysis
To accurately assess evacuation demand, it is essential to consider the de facto population present in the area during an earthquake, rather than relying solely on the resident population. Therefore, this study examined both the resident population and the time-specific de facto populations to evaluate actual evacuation demand and the capacity of evacuation sites. The maximum and minimum population values within each census block were assessed across four categories: the resident population and the de facto populations at 10 AM, 2 PM, and 8 PM. Although the resident population is constant and not time-dependent, it is included as a reference point to facilitate comparison in the tables. Additionally, the capacity of the outdoor earthquake evacuation sites within each census block was analyzed to evaluate their ability to accommodate the assessed populations.
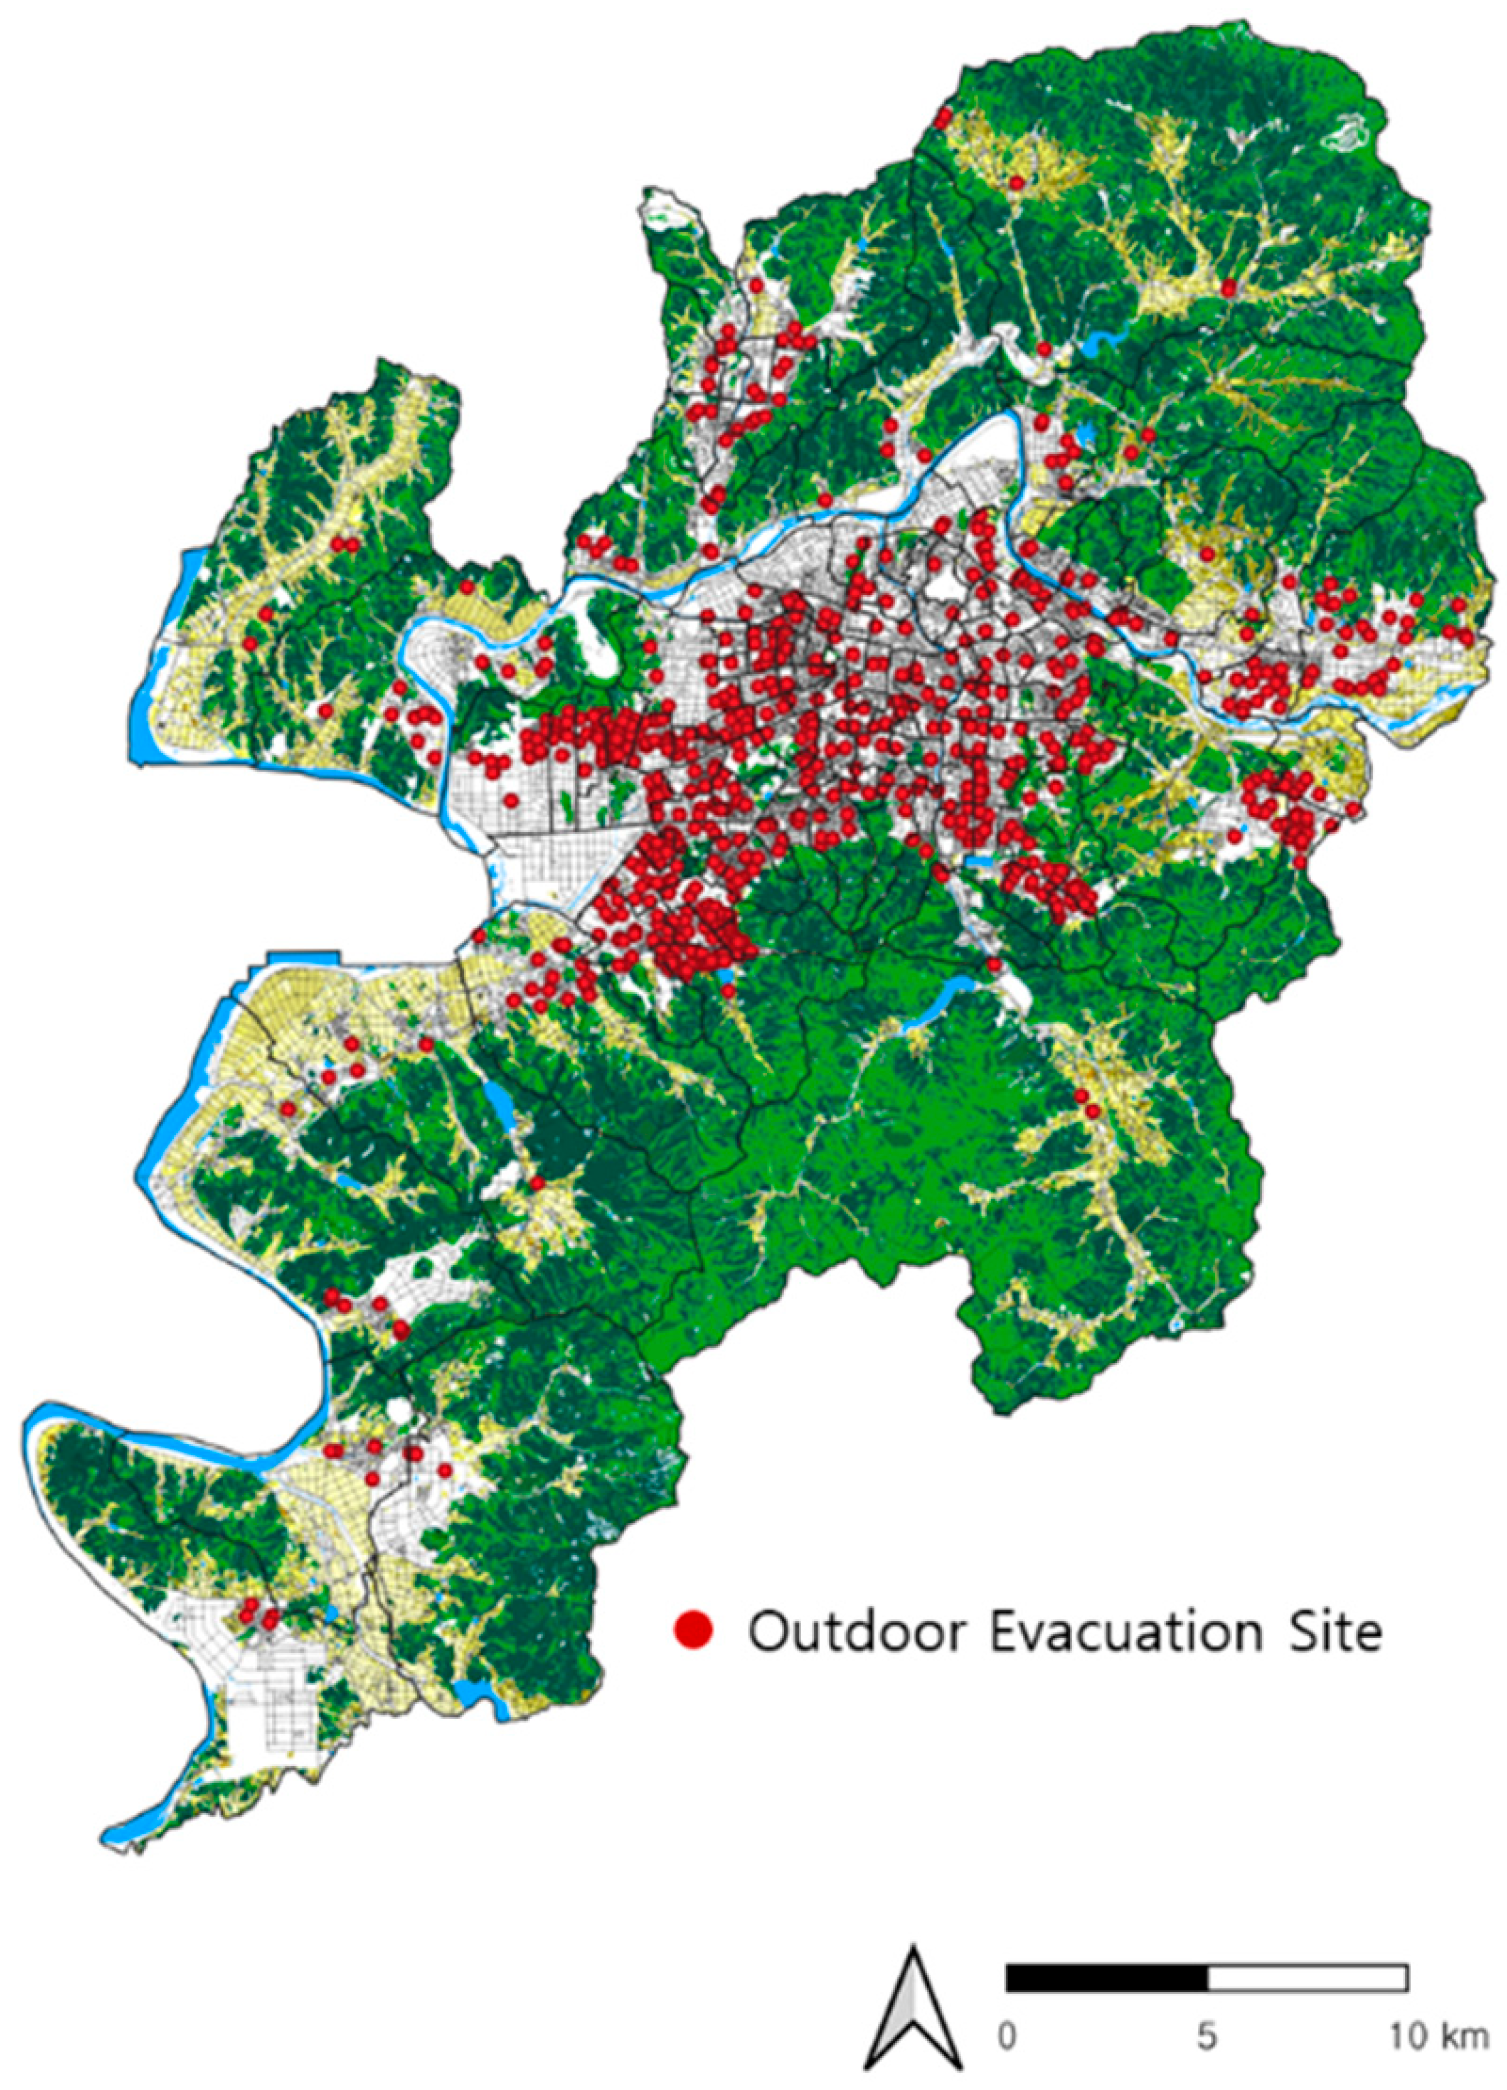
In South Korea, the capacity standard for outdoor earthquake evacuation sites is established at one person per 0.825 square meters. The study area contains a total of 704 outdoor earthquake evacuation sites, with a combined capacity of 8,250,540 individuals. Given that the resident population in the study area is 2,346,855, the overall capacity ratio of outdoor earthquake evacuation sites is 3.52, indicating that the numerical capacity is adequate. Of the 704 evacuation sites in the study area, 357 are situated at sports fields and grounds of elementary, middle, and high schools, as well as colleges and universities, making these the most prevalent type of evacuation site. Additionally, there are 304 parks, 10 sports facilities, 25 parking lots, 5 green spaces, and 3 other locations, such as plazas.
Upon reviewing the capacity of outdoor earthquake evacuation sites, it was found that the capacity was calculated solely based on the total area of the facilities, without considering the impact of existing structures within these sites. To address this limitation, this study introduced adjustment values to improve the accuracy of the analysis. For example, school sports grounds, primarily designed for sports activities, typically lack built structures, making their entire area available for evacuation. In contrast, parks often contain amenities, such as restrooms, which can reduce the usable space for evacuation. Therefore, using the total area of parks as the basis for capacity calculations could result in inaccuracies, necessitating adjustments. To account for this, a capacity ratio of 70% was applied, estimating that approximately 30% of park space is occupied by vegetation and facilities. South Korean urban park design regulations specify that vegetation should cover 60% and facilities 40% of the total area. However, given that temporary evacuation is feasible within tree-covered areas during emergencies, an adjustment ratio of 0.7 was used. In parking lots, parked vehicles reduce the available space for evacuation, making it essential to account for this factor in capacity calculations. Estimating the de facto utilization rate of parking lots, however, presents challenges. Therefore, this study assumed that, on average, 50% of parking spaces would be occupied during an emergency.
The analysis of the de facto population was conducted using Daegu Metropolitan City Service-Population Statistics Analysis Geographic Information System (Daegu Service-Population Statistics), focusing on three specific time points: 10 AM, 2 PM, and 8 PM. These time points were chosen based on the following rationale: 10 AM generally marks the beginning of work following the morning commute; 2 PM represents a transition between morning and afternoon tasks; and 8 PM reflects changes in location as people return home or engage in leisure activities. The average de facto population for May 2024 across 139 administrative districts was estimated using the Daegu Service-Population Statistics, which rely on mobile device location data from cell towers, with scaling applied to approximate the total population in each area.
The census blocks for the resident and de facto populations in the study area do not align precisely due to updates in administrative boundaries. Since the de facto population is aggregated based on these updated boundaries, which are established after the resident population census, it was necessary to use the de facto population census blocks as the reference for this analysis. There are a total of 139 de facto population census blocks in the study area. The analysis considered four types of data across these blocks: the resident population and the de facto populations at 10 AM, 2 PM, and 8 PM. This data was used to evaluate evacuation capacity by comparing the evacuation site capacity within each block to the population. The formula used to calculate capacity is as follows: Capacity = Evacuation site Capacity / Population (a value of 1 or greater indicates sufficient capacity, while a value below 1 signifies insufficient capacity.)
2.4. Evacuation Feasibility Analysis
Evacuation feasibility was assessed by calculating the distance to the nearest evacuation site. To accomplish this, the study employed GIS network analysis to evaluate accessibility to the 704 designated outdoor earthquake evacuation sites within defined time intervals. Given that these sites are intended for immediate use following an earthquake, rapid accessibility is paramount. Therefore, it is crucial for individuals to reach the nearest evacuation site within a minimal timeframe. The analysis determined the time required to access each site, assuming a walking speed of 4 km/h, with intervals set at 9, 12, and 15 minutes. Through this analysis, areas that cannot be reached within these time intervals were identified. While prior studies commonly employed distance thresholds of 500, 1,000, and 1,500 meters to assess accessibility to evacuation facilities (Lee et al., 2015; Kim et al., 2022), this study referenced the civil defense evacuation standard of 667 meters and extended it to a maximum of 1,000 meters, incorporating distance thresholds of 600, 800, and 1,000 meters.
The network analysis was performed using the QGIS Network Analysis tool (QGIS version 3.28) and relied on a road network dataset at a 1:5000 scale provided by the national authority. Every entrance at each of the 704 outdoor evacuation sites in the study area was taken into account to accurately identify the accessible sites within each specified timeframe (
Figure 3). Based on the results, areas accessible within the designated time limits were classified as ’evacuation-feasible areas,’ while those beyond these limits were categorized as ’evacuation-infeasible areas.’
Furthermore, given that the study area is located within a basin bordered by mountainous regions, it was observed that the bordering areas have a low de facto population density, while agricultural lands, such as rice fields, are considered relatively safe after an earthquake. Consequently, the analysis focused on urbanized areas—specifically residential, commercial, and industrial zones—that lie within evacuation-infeasible areas. This focus allowed for an assessment of the proportion of critical urban areas that fall outside evacuation-feasible areas.
2.5. Matrix Analysis
Matrix analysis is commonly used as a strategic tool in business, with the Boston Consulting Group (BCG) matrix being one of the most well-known examples. This approach addresses key issues such as efficient technology development and resource allocation within organizations. The BCG matrix evaluates outcomes in relation to resource inputs, helping companies assess their current situations and make informed decisions. Today, matrix analysis and self-organization mapping are applied across various fields, including patent analysis, design optimization, and disaster and safety risk assessments (Cho & Choi, 2019; Lee, 2009; Jun et al., 2010).
In this study, the primary factors for post-earthquake evacuation are evacuation site capacity and spatial accessibility. To address these factors, an adapted matrix analysis is employed, with the X-axis representing evacuation-infeasible areas and the Y-axis reflecting evacuation site capacity. The analysis is further divided into stages to provide an effective decision-making tool for revising and improving the plans for outdoor earthquake evacuation sites. This approach aims to offer a systematic and efficient method for adjusting the distribution of evacuation sites based on both accessibility and capacity considerations.
3. Results and Discussion
3.1. Verification of Earthquake Outdoor Evacuation Site Capacity
The study identified 704 outdoor earthquake evacuation sites in the study area, with a combined capacity of 8,250,540 individuals. Considering the resident population of 2,346,855, the overall capacity ratio is 3.52, while the adjusted ratio, based on revised standards, is 2.95. Both ratios indicate numerically sufficient capacity across Daegu Metropolitan City (
Table 1).
3.2. Capacity Analysis Based on De Facto Population
The de facto population for each time point across the entire study area is presented in
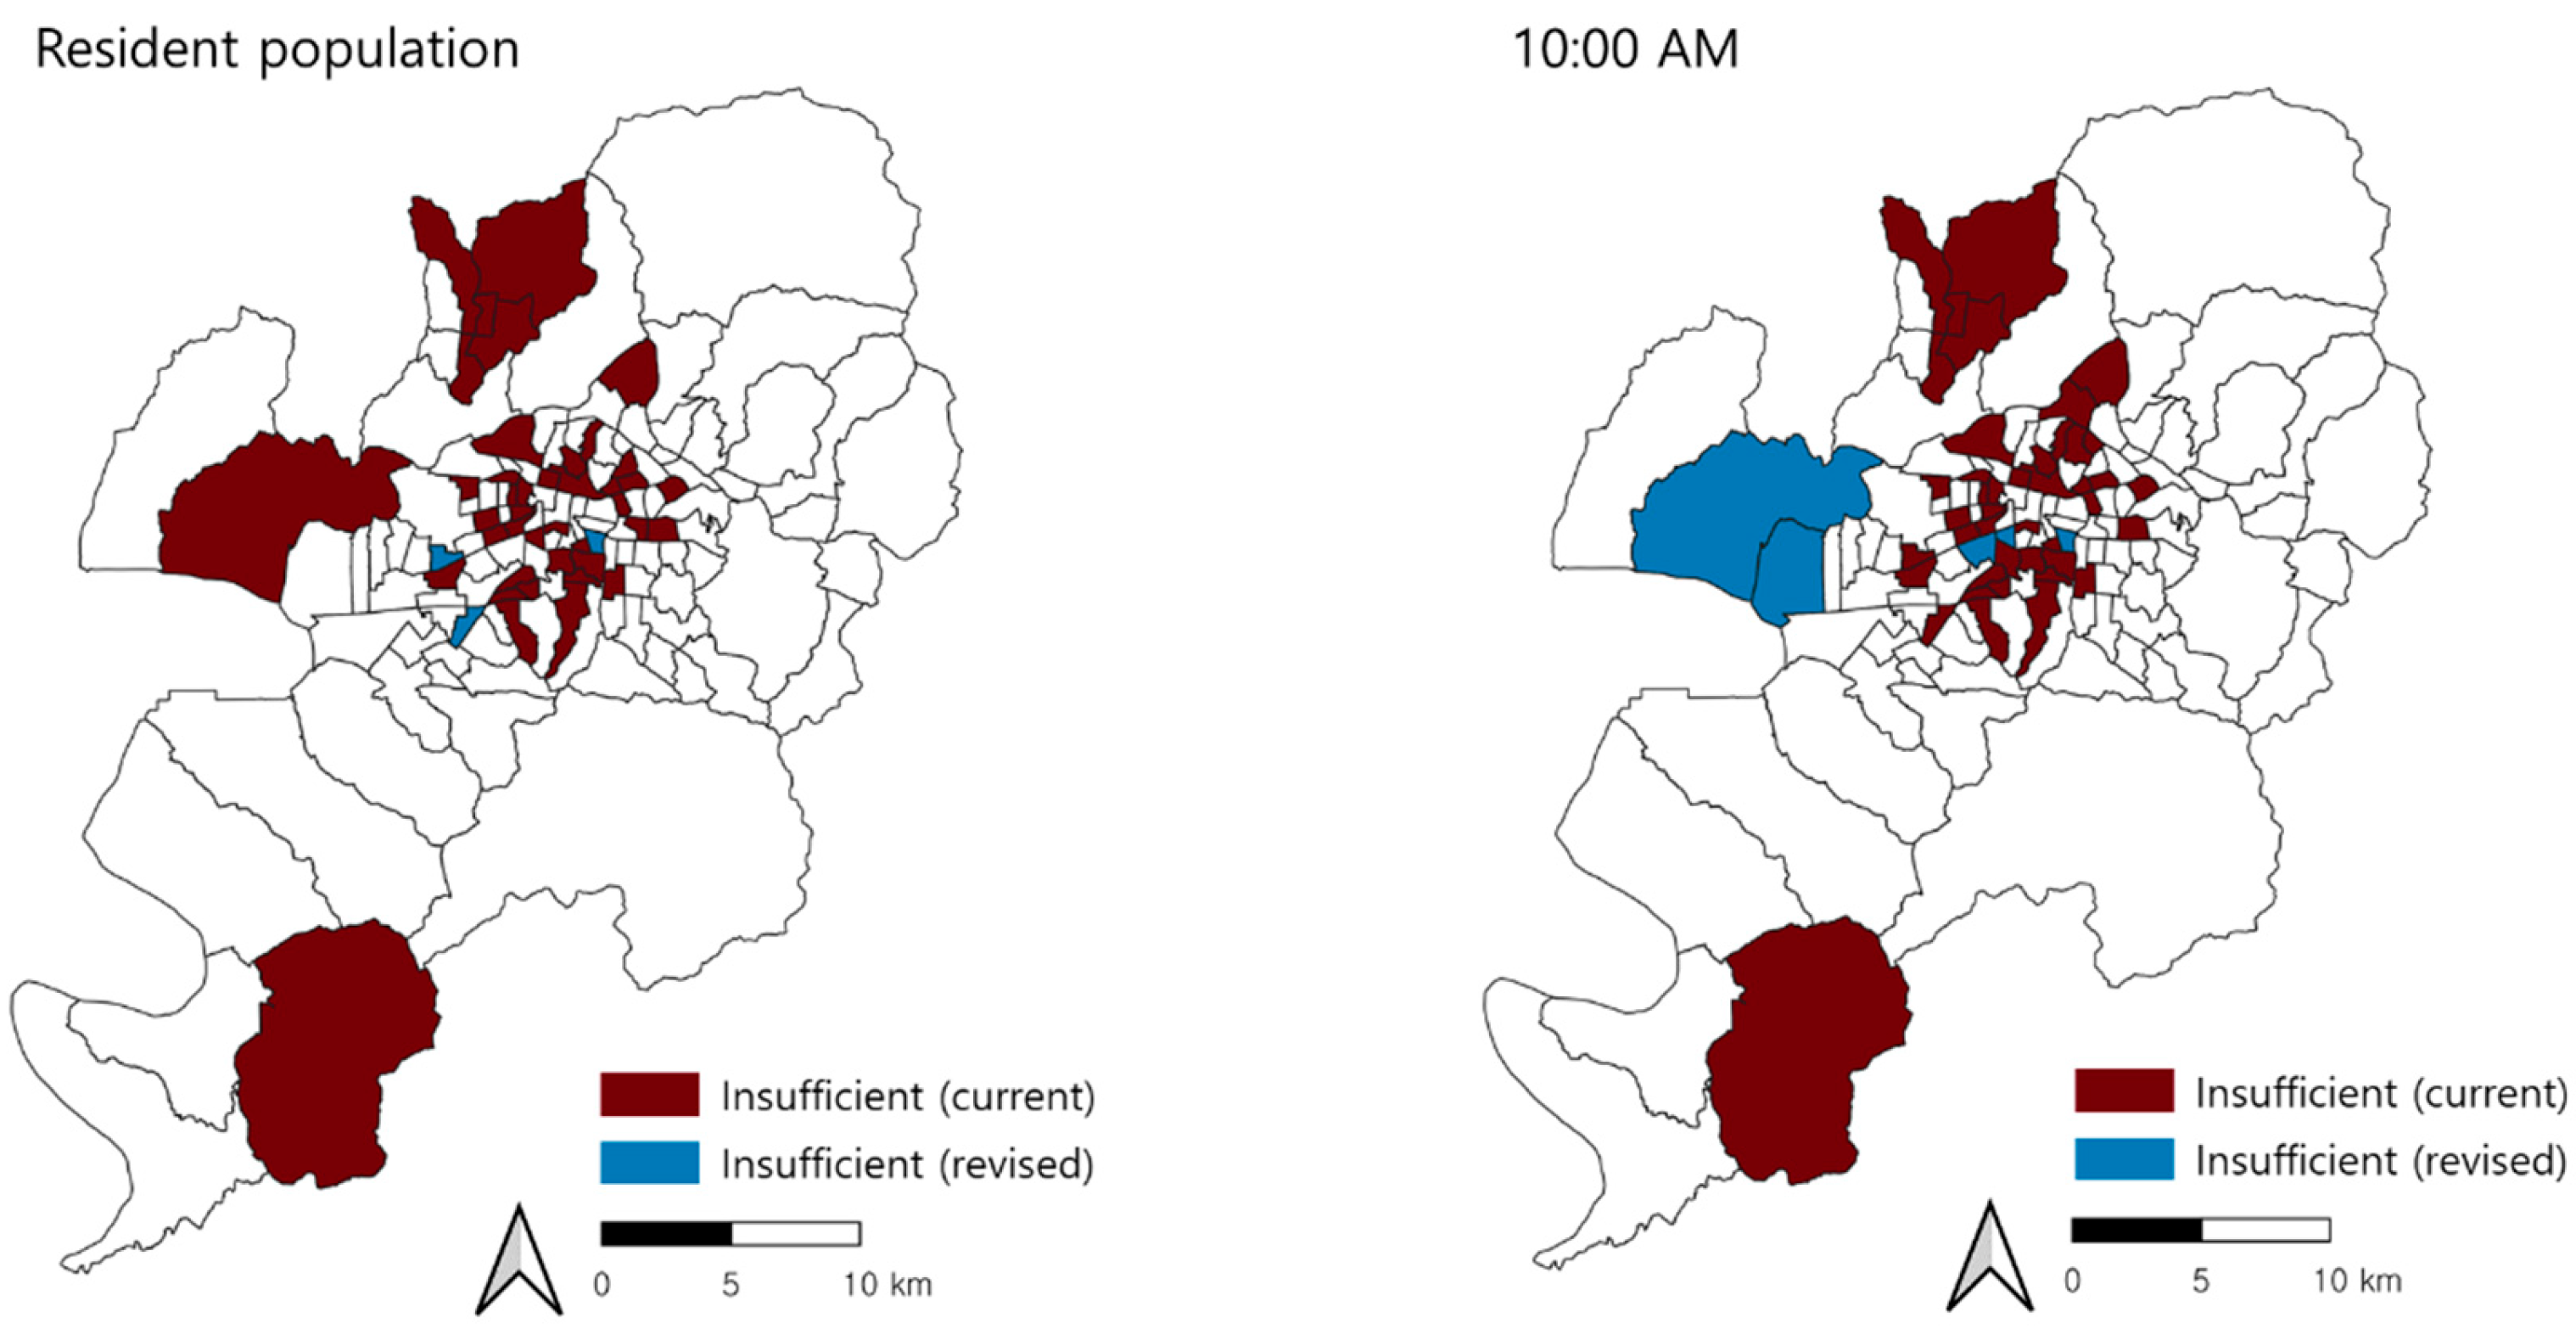
Table 2. With the resident population set at 1.00, the de facto population ratios were 1.09 at 10 AM, 1.08 at 2 PM, and 1.13 at 8 PM. The results indicate that the resident population was highest in 34 blocks, while the de facto populations peaked in 22 blocks at 10 AM, 20 blocks at 2 PM, and 63 blocks at 8 PM. Furthermore, the number of census blocks with a capacity ratio below 1, according to the current standard, was as follows: 41 blocks for the resident population, 43 blocks for the de facto population at 10 AM, 47 blocks at 2 PM, and 46 blocks at 8 PM. Under the revised standard, these figures increased to 44 blocks for the resident population, 48 blocks for the de facto population at 10 AM, 52 blocks at 2 PM, and 50 blocks at 8 PM (
Table 2).
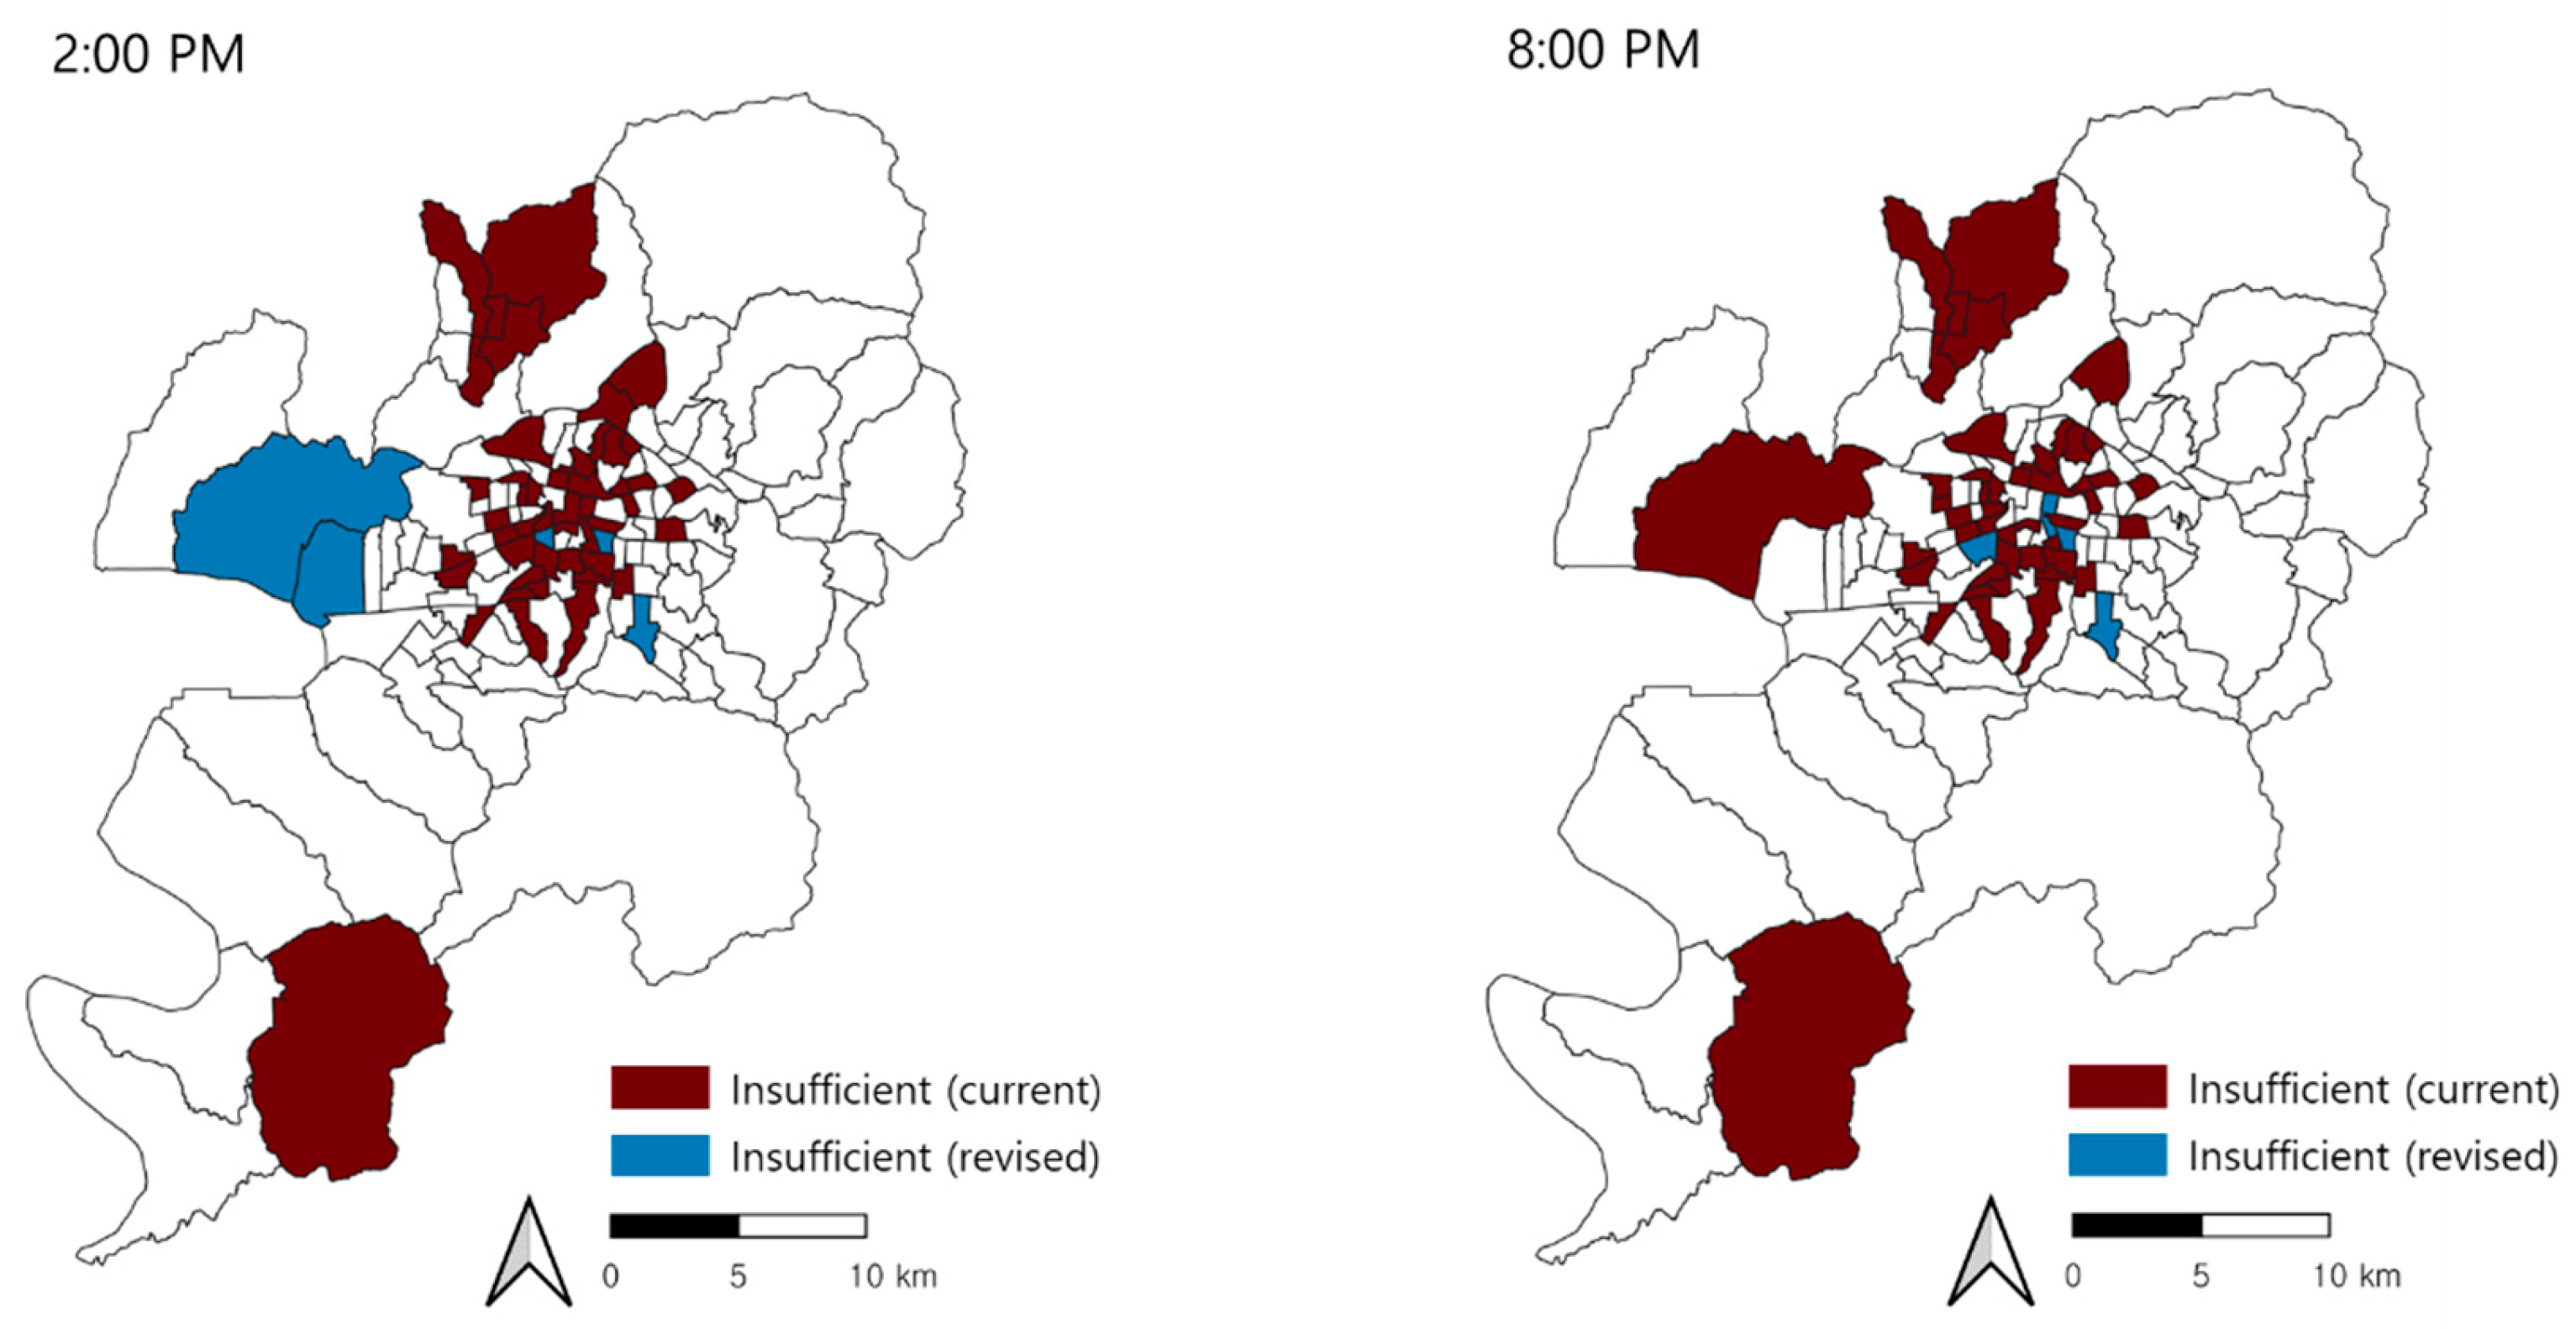
The findings indicate that the study area serves as a hub for administrative, educational, and industrial activities, attracting commuters from surrounding regions and experiencing peak population concentrations at 8 PM. This underscores the need to base the planning of outdoor earthquake evacuation sites on de facto population figures rather than solely on resident population data. Moreover, incorporating adjusted capacity values into the analysis reveals an increase in census blocks with insufficient capacity across all time points. These results highlight the critical importance of accurate occupancy calculations at evacuation sites to ensure urban safety.
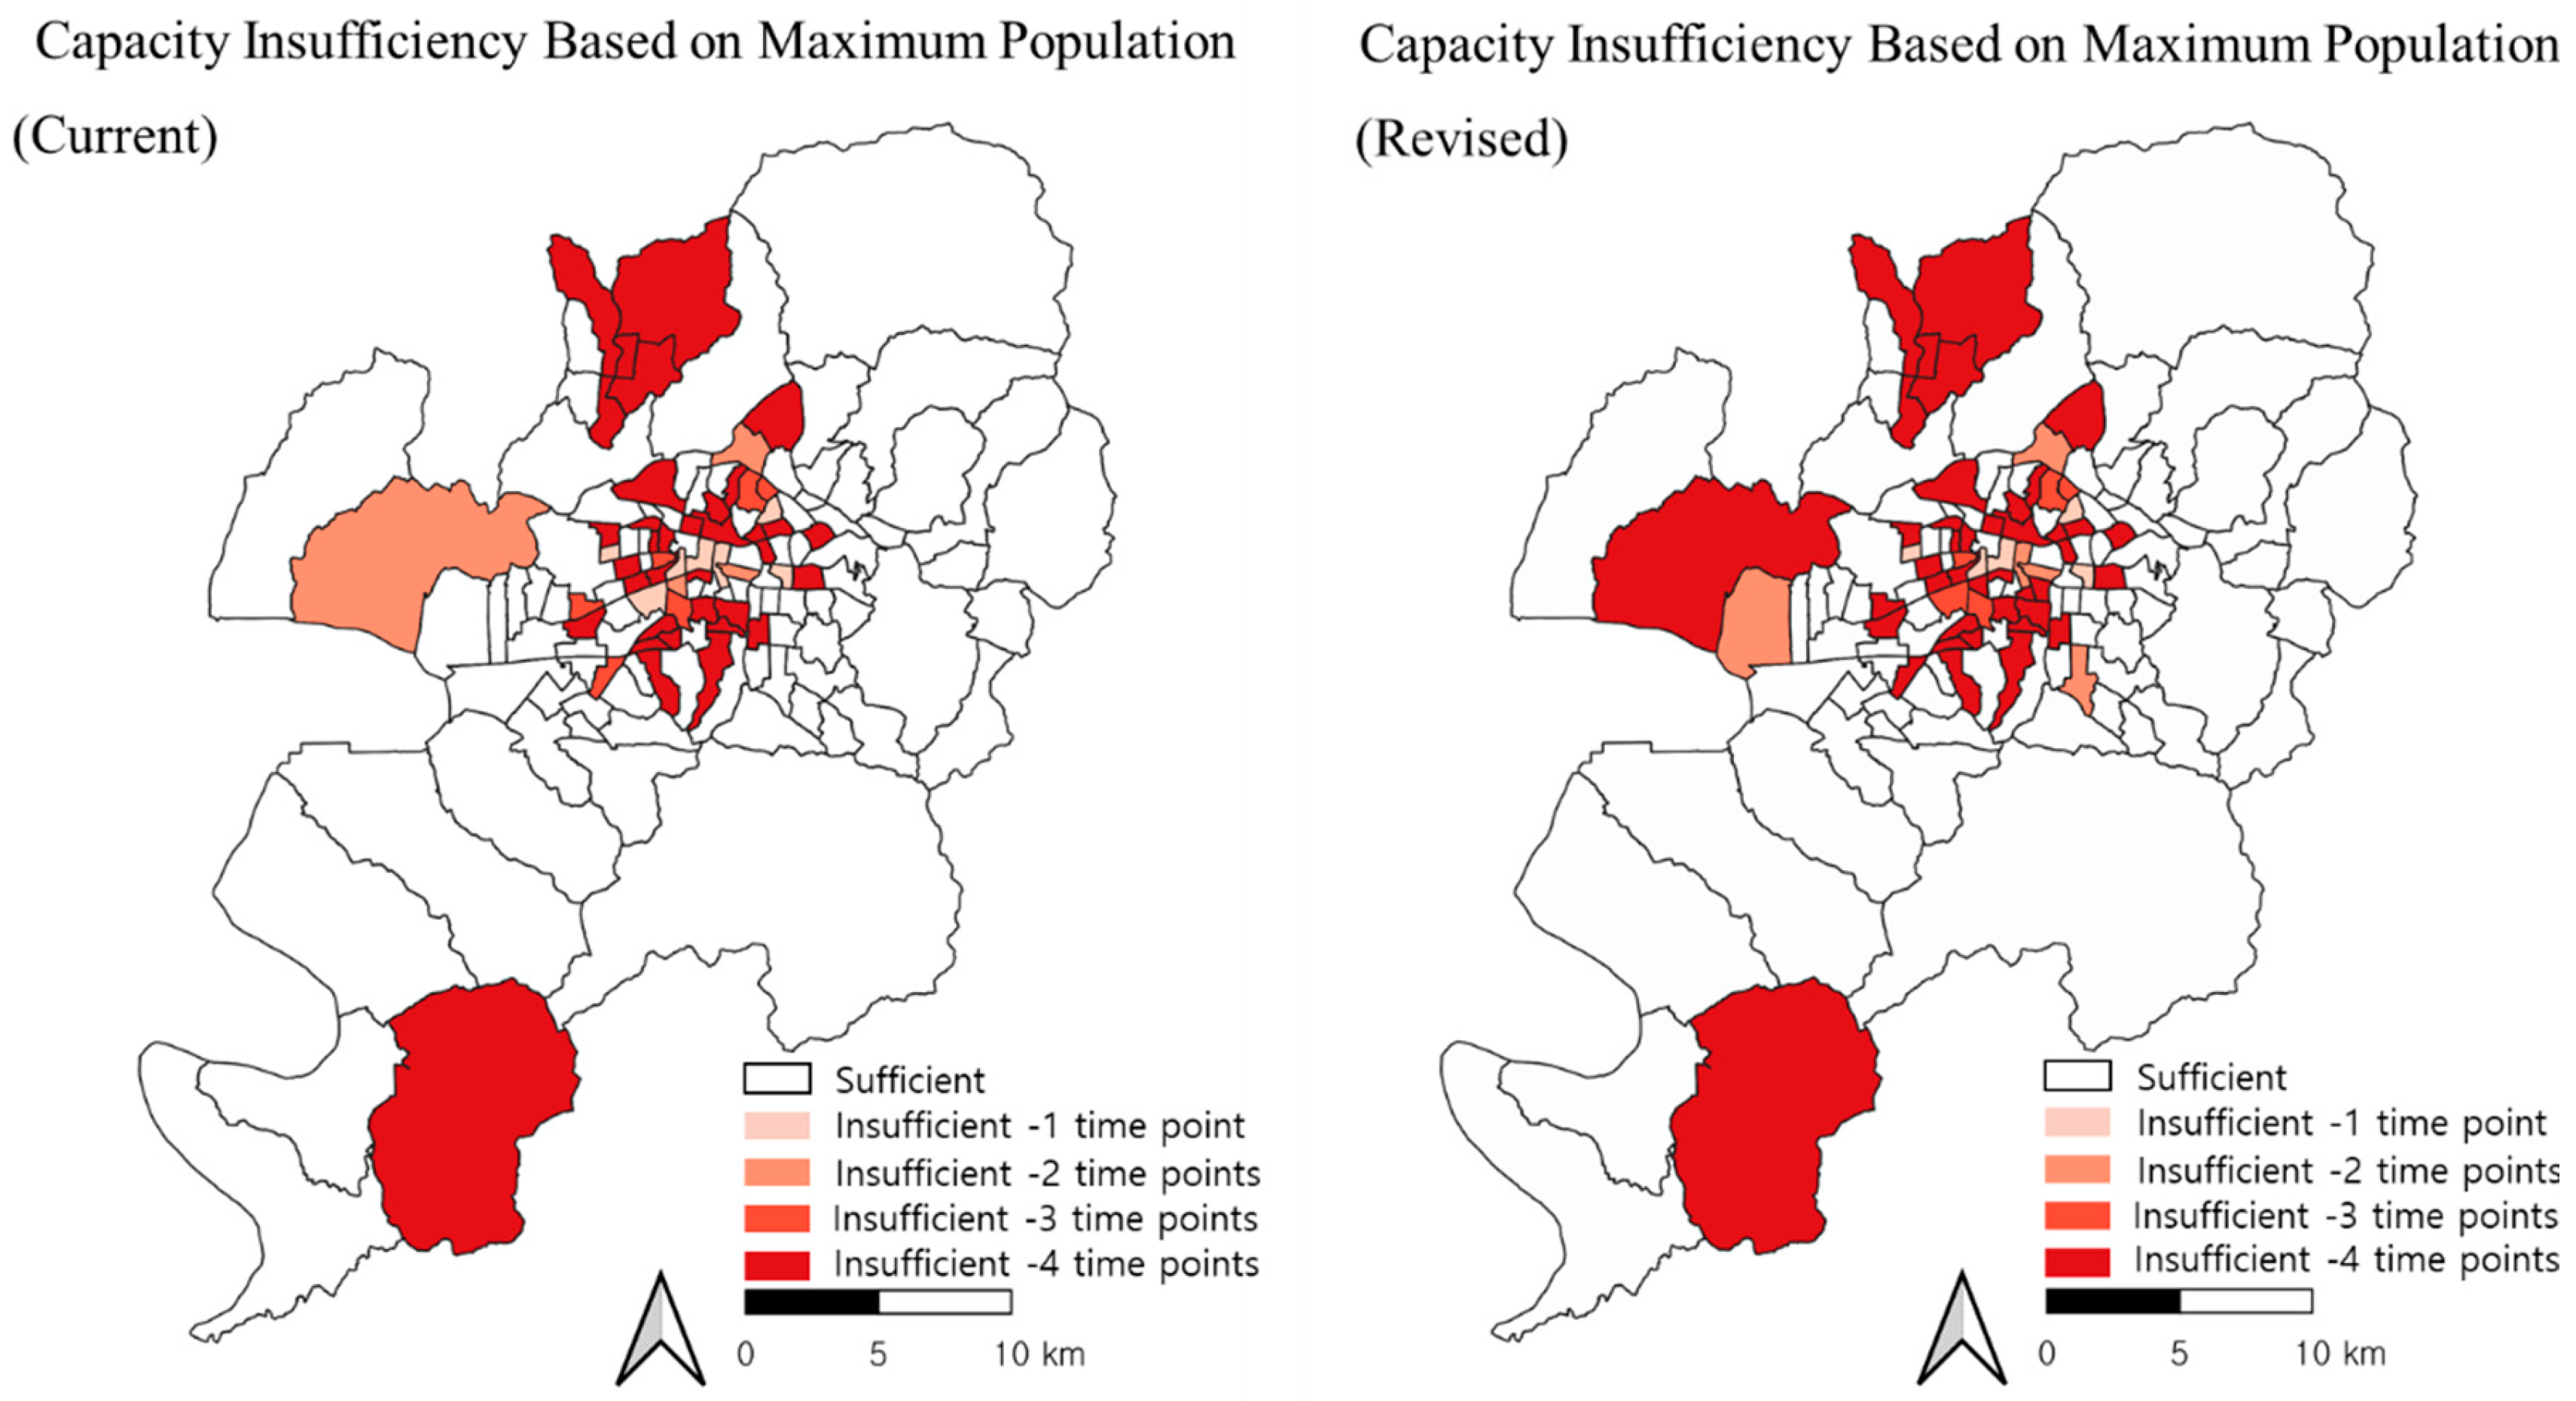
When evaluating capacity based on the maximum de facto population for each census block, the following observations were made: under the current capacity standards, 86 out of 139 census blocks exhibited sufficient capacity across all time points. However, 53 census blocks had a capacity ratio below 1 based on their maximum de facto population, of which 9 blocks lacked outdoor earthquake evacuation sites altogether. Furthermore, 7 blocks demonstrated insufficient capacity at one time point, 4 blocks at two time points, 6 blocks at three time points, and 36 blocks exhibited insufficient capacity across all four time points. Consequently, these 36 blocks indicate a consistent shortfall in the capacity of outdoor earthquake evacuation sites. Notably, areas with insufficient capacity are concentrated in the urbanized central region. Therefore, priority should be given to addressing the needs of these 36 blocks when developing a revised plan for outdoor earthquake evacuation sites.
According to the revised capacity standards, 83 census blocks demonstrated sufficient capacity across all time points, while 56 blocks had a capacity ratio below 1 based on their maximum de facto population. The most significant disparity between the current and revised capacity standards is reflected in the increase in blocks with insufficient capacity across all time points, rising from 36 to 41—an increase of 5 blocks. Furthermore, while only 41 blocks exhibited insufficient capacity based on the resident population among the 139 blocks, this number escalated to 56 when considering the maximum de facto population under the revised capacity standards. Therefore, it is advisable to calculate evacuation site capacity based on the de facto population rather than the resident population when designating outdoor earthquake evacuation sites (
Table 3,
Figure 4 and
Figure 5).
3.3. Analysis of Evacuation-Infeasible Areas
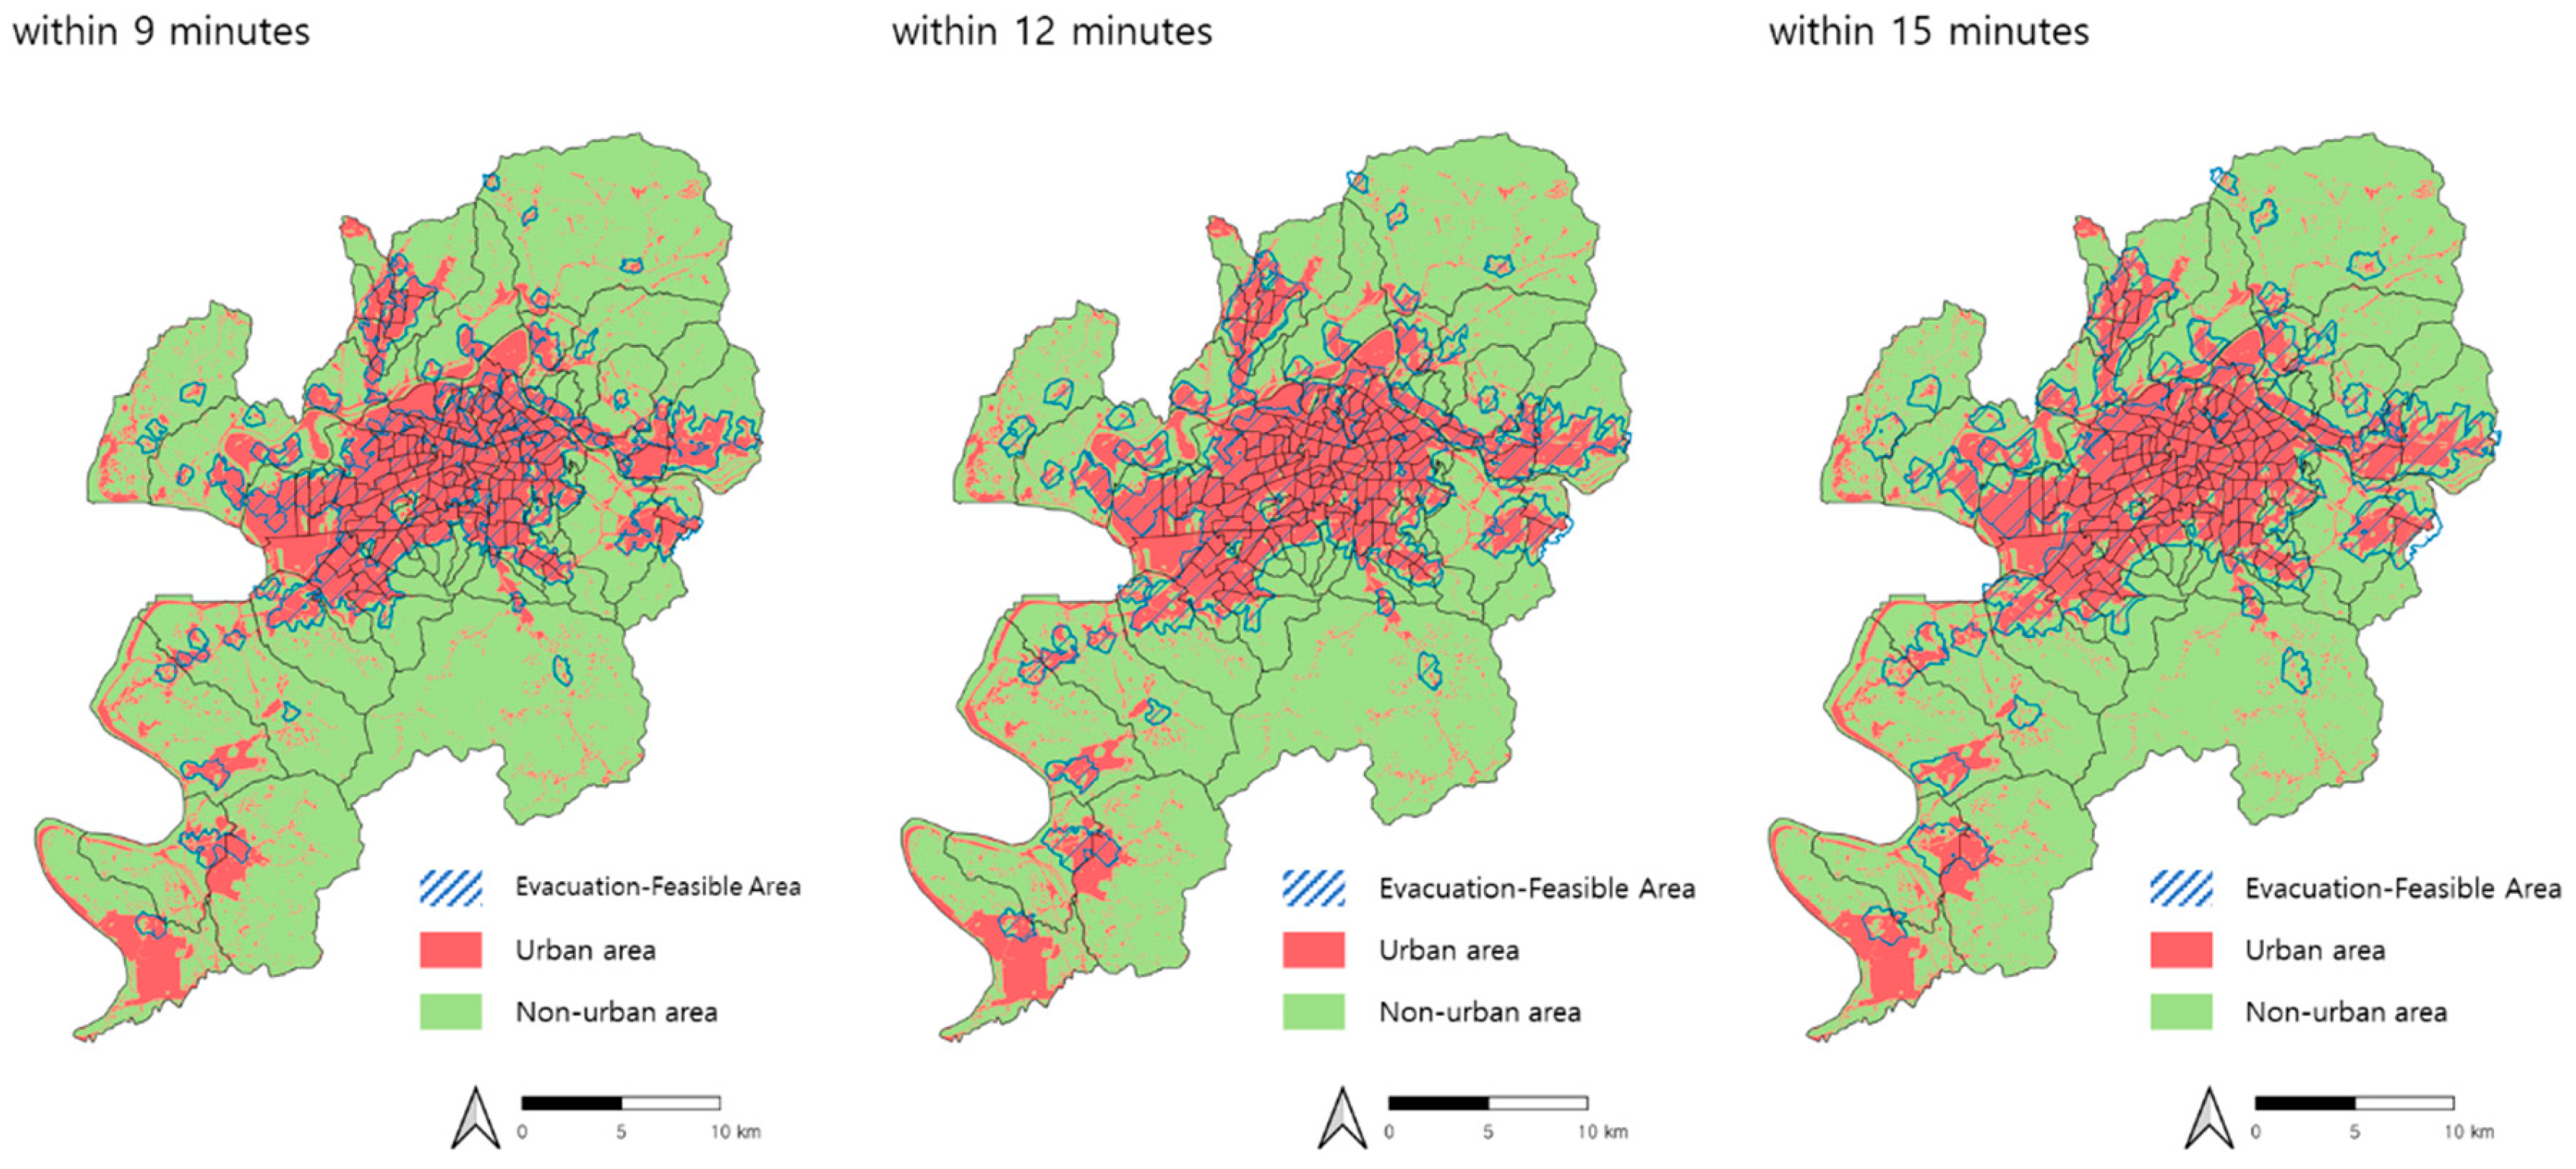
The study area encompasses approximately 28.9% urbanized regions. Among these areas, about 51% are accessible within 9 minutes, representing roughly half of the total target area. Even for the maximum evacuation time of 15 minutes, only 65.9% of the urbanized area is covered. Therefore, while the overall capacity ratio of the study area is 3.25 under current standards and 2.95 based on revised capacity figures, some evacuation sites are located in areas where evacuation is practically impossible (
Table 4,
Figure 6).
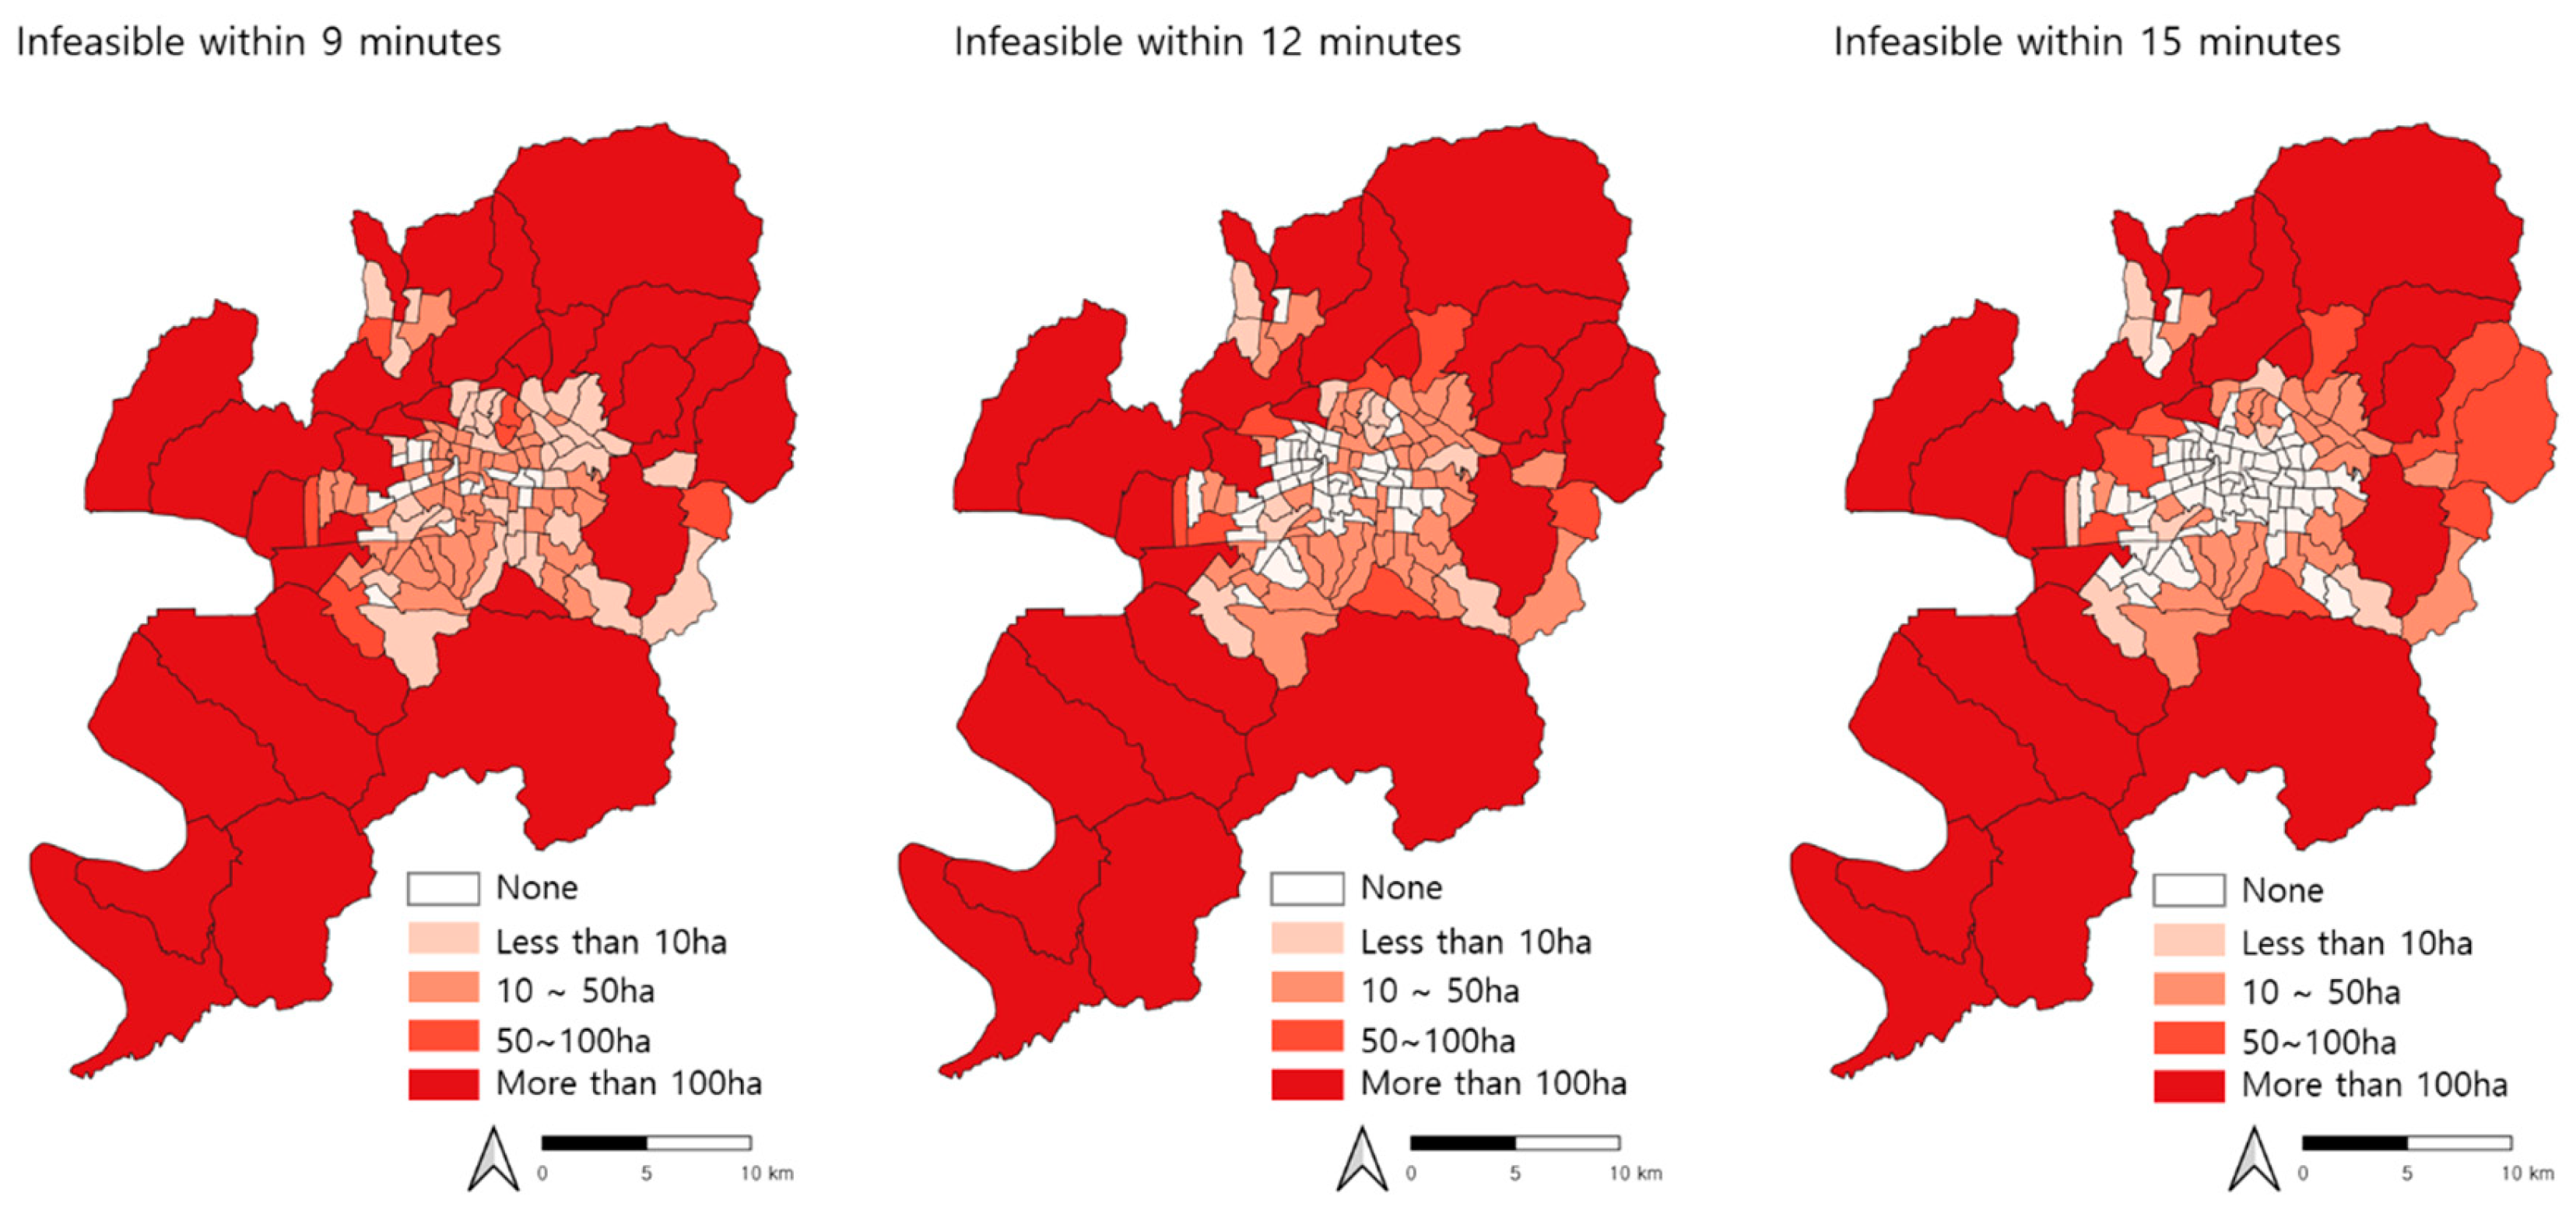
A spatial distribution analysis indicates that as the distance from the center of the study area increases, the number of areas where evacuation is infeasible also rises. To identify urbanized areas that remain evacuation-infeasible within each timeframe, the analysis examined the 139 census blocks. The evacuation-infeasible urban areas were classified into four categories: less than 10 hectares, 10–50 hectares, 50–100 hectares, and over 100 hectares.
Out of the 139 census blocks, 70 contained urban areas measuring less than 10 hectares where evacuation is not feasible within 9 minutes. This number increased to 97 blocks within 12 minutes and 102 blocks within 15 minutes. Most of the identified evacuation-infeasible urban areas were small, measuring less than 10 hectares. However, larger evacuation-infeasible areas exceeding 100 hectares were observed in 29 blocks within 9 minutes, 24 blocks within 12 minutes, and 21 blocks within 15 minutes, with most located on the outskirts of the study area. Therefore, targeted measures are necessary for the 21 blocks where large evacuation-infeasible areas exceeding 100 hectares have been identified (
Table 5,
Figure 7).
Moreover, while the capacity analysis indicated that many census blocks in the central area had a capacity ratio below 1, the evacuation accessibility analysis revealed that the outer census blocks faced more significant challenges. This disparity is likely attributable to the fact that approximately 50% of the evacuation sites are school playgrounds, which are predominantly concentrated in the densely populated central area.
3.4. Matrix Analysis
Determining the capacity of outdoor earthquake evacuation sites based on census block populations involves several challenges. A key issue is that, in the event of an earthquake, individuals are likely to seek refuge at the nearest available evacuation site, which may be located outside their designated census block. Nevertheless, current capacity estimates for evacuation sites typically rely on census block population data. To address this discrepancy, it is essential to conduct a network analysis centered on evacuation sites to identify evacuation-feasible and infeasible areas, as well as to assess the extent of these inaccessible regions. This dual approach is crucial for understanding the practical feasibility of evacuation. By integrating both factors, this study seeks to propose a plan for revising and enhancing outdoor earthquake evacuation sites.
First, the capacity analysis classifies census blocks based on maximum population levels across four distinct time points. Category A represents blocks that can accommodate the maximum population at all four time points; Category B includes blocks that can accommodate populations within a range between maximum and minimum values (at one to three time points); and Category C consists of blocks that cannot accommodate even the minimum population at any of the four time points.
Next, evacuation feasibility is analyzed according to the same criteria used in the evacuation-feasible area analysis. Urban areas are categorized based on the extent of evacuation-infeasible areas: Category 1 indicates that no evacuation-infeasible area is present; Category 2 signifies an evacuation-infeasible area of less than 10 hectares; Category 3 represents an area between 10 and 50 hectares; Category 4 includes areas between 50 and 100 hectares; and Category 5 indicates more than 100 hectares of evacuation-infeasible area (
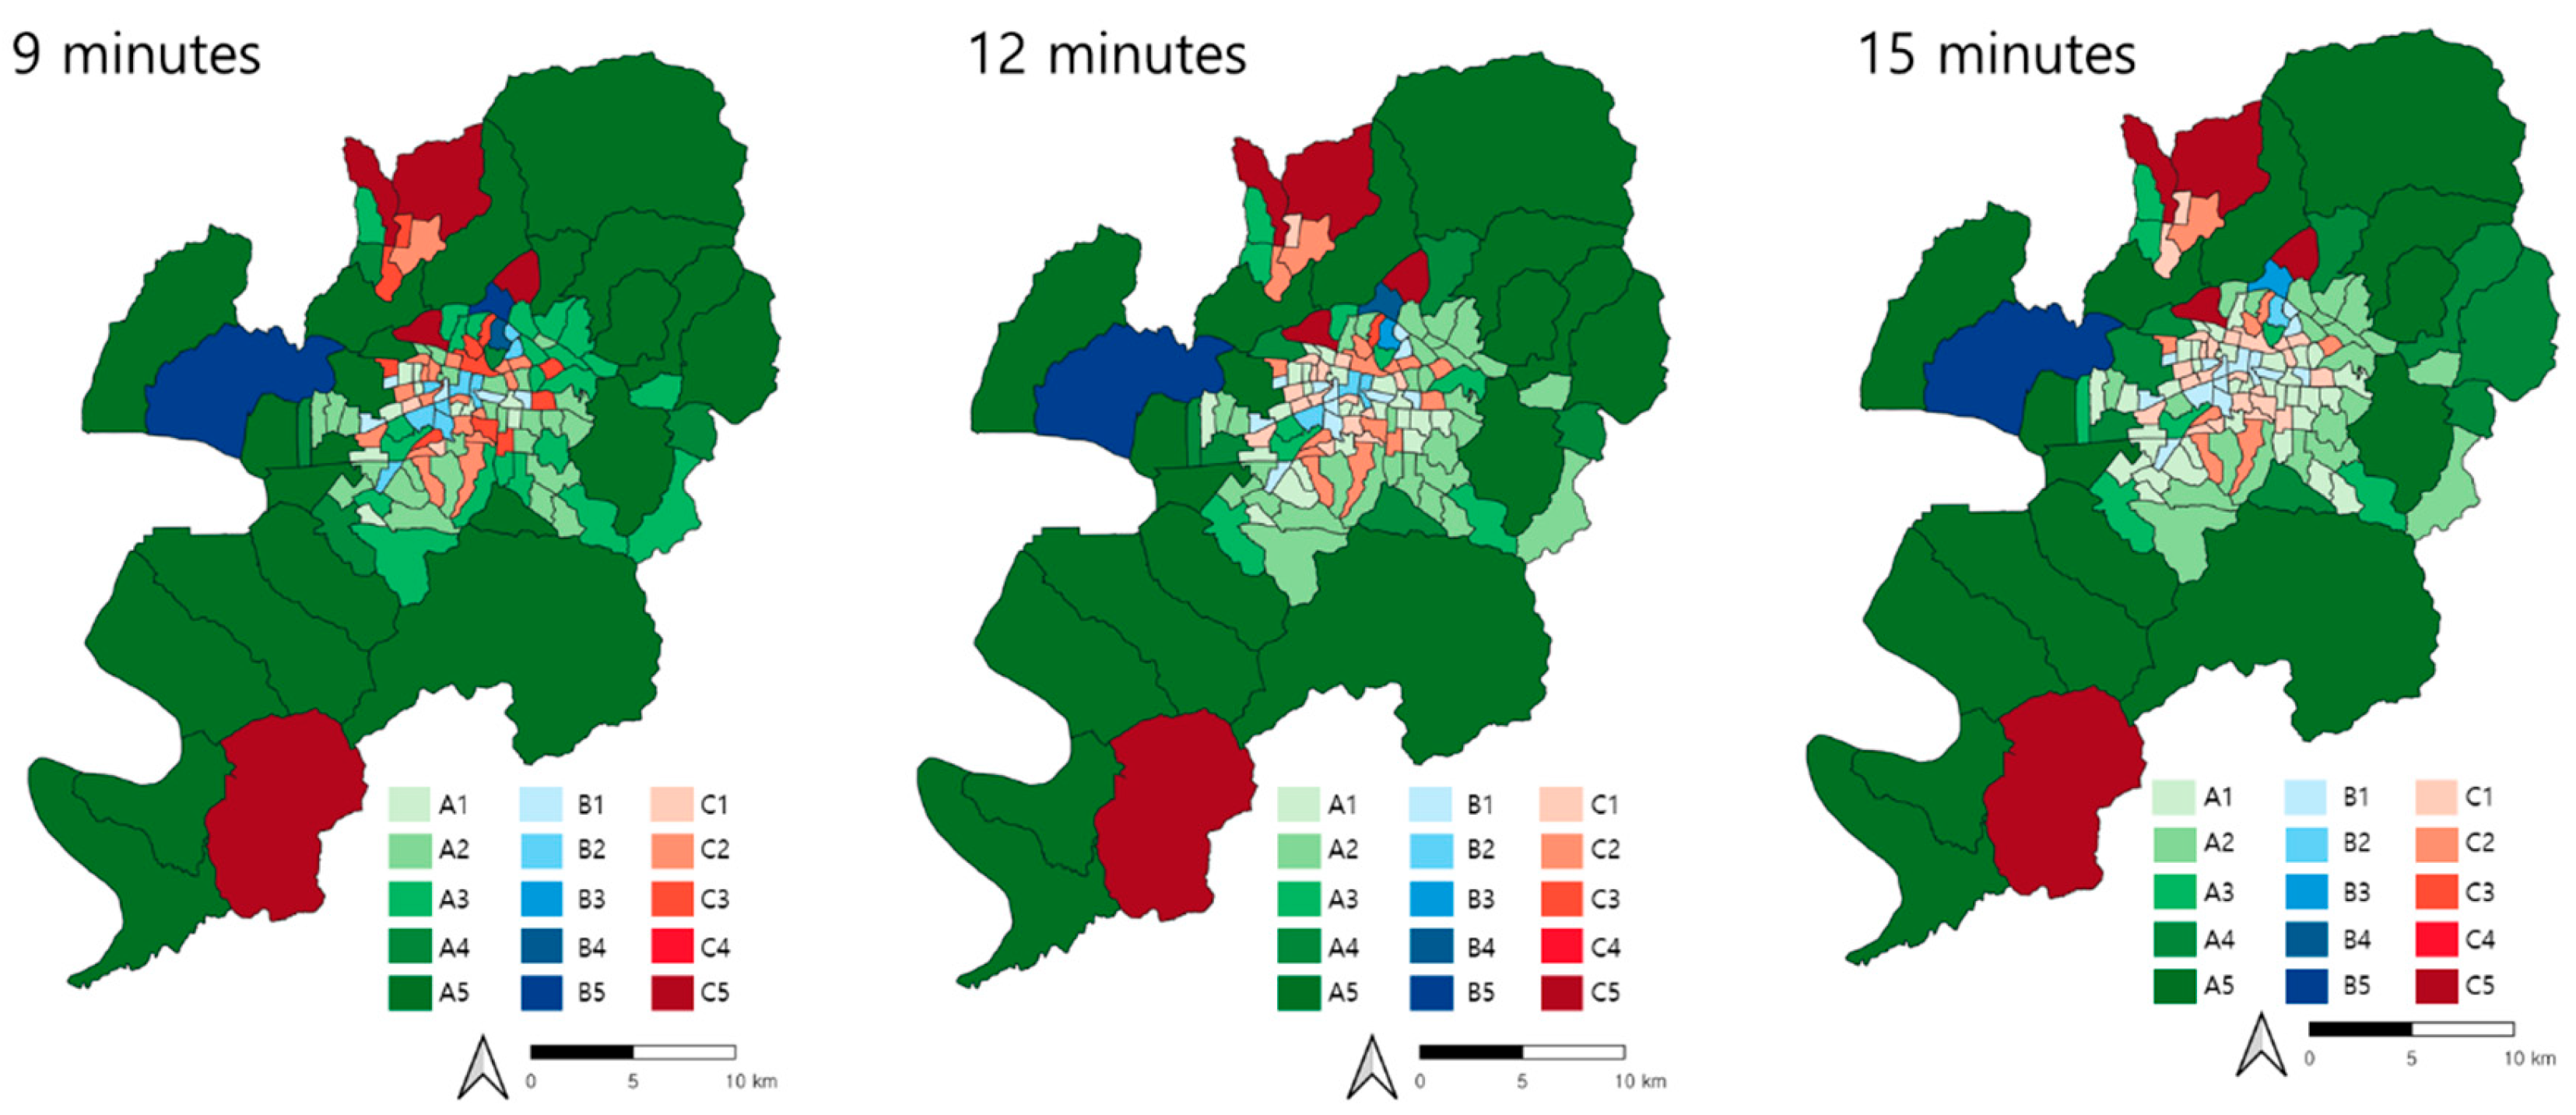
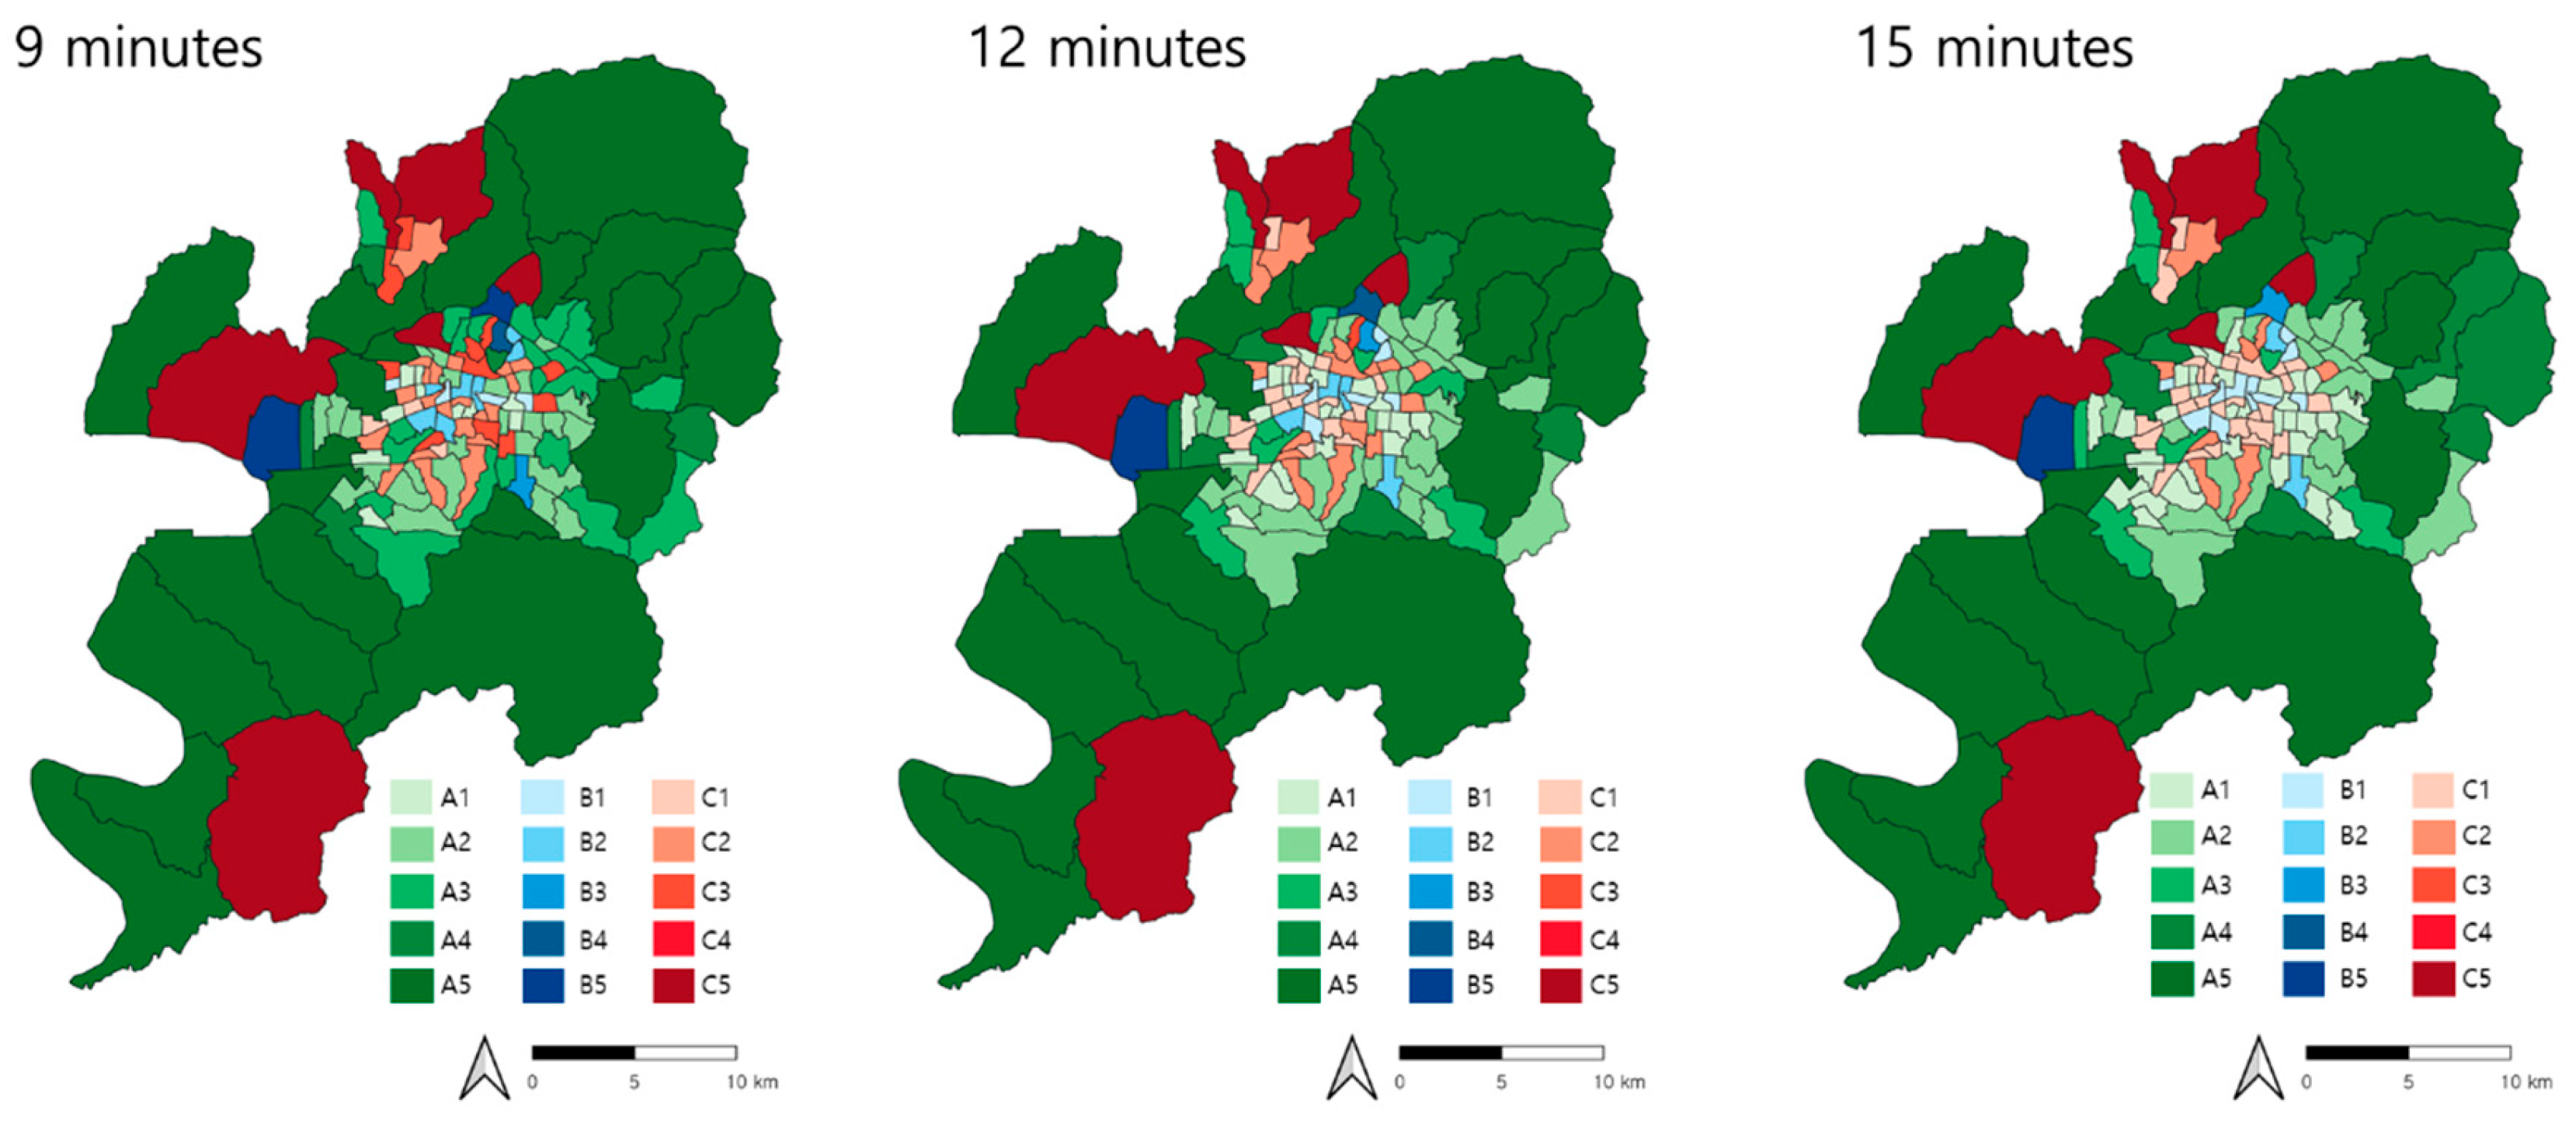
Table 6 and
Table 7,
Figure 8 and
Figure 9).
The analysis evaluated evacuation site capacity based on both current standards and revised standards proposed in this study. Areas with sufficient capacity fall under Group A: A1 and A2, with evacuation-infeasible areas of less than 10 hectares, are the most stable and are thus the lowest priority for modification. In contrast, A3, A4, and A5 have evacuation-infeasible urban areas exceeding 10 hectares, which necessitates a more detailed analysis of evacuation site locations.
Group B represents areas with capacity insufficient for the maximum de facto population but adequate for the minimum population. These areas require additional evacuation sites to accommodate the maximum de facto population. Within this group, B3, B4, and B5 contain extensive evacuation-infeasible urban areas, indicating a need for new evacuation sites in these locations.
Group C consists of areas with insufficient capacity even for the minimum de facto population, requiring urgent expansion of evacuation sites. C5, which has the most extensive evacuation-infeasible urban areas, is identified as the highest priority for intervention, with an even greater need for new evacuation sites than areas B3, B4, and B5.
Based on the maximum evacuation time of 15 minutes and the revised capacity standards, the analysis identifies the following distribution across the 139 census blocks: 83 blocks fall into Group A, 15 blocks into Group B, and 41 blocks into Group C. Within Group A, 10 blocks are classified as A1 and 25 as A2, collectively representing approximately 25.2% of the total blocks. This means that roughly 75% of blocks require modifications to their evacuation site capacity.
Notably, Group C, which lacks the capacity to accommodate even the minimum de facto population, comprises 41 blocks. Within this group, C1 includes 27 blocks, and C2 contains 8 blocks; both can be addressed by adding more evacuation sites, similar to the strategy recommended for Group B. However, C5 requires urgent intervention to enhance the placement and capacity of evacuation sites effectively.
Most C1 and C2 blocks are located in the center of the study area, suggesting that establishing disaster prevention parks could be an effective approach, as these parks could serve not only as recreational spaces for residents but also as outdoor earthquake evacuation sites.
Conversely, the matrix analysis reveals that groups A4, A5, B4, B5, and C5 are characterized by larger areas and are situated on the outskirts of the metropolitan area. Furthermore, the correlation coefficient between average population density and the extent of urbanized areas within these blocks was calculated to be -0.47275, indicating a slight inverse relationship. This finding suggests that while higher population densities are generally associated with more urbanized areas, the correlation is not particularly strong. Although focusing on a single factor may introduce limitations, simplifying these complexities is essential for effective urban planning and disaster management, as cities are comprised of numerous intricate variables.
4. Conclusions
This study analyzed the practical feasibility of outdoor earthquake evacuation sites in Daegu Metropolitan City, which function as primary evacuation facilities during seismic events. By focusing on evacuation site capacity and accessibility, the study aims to propose improvement measures for the efficient designation of these sites and to provide a decision-making tool for effective planning. The findings are expected to be instrumental in guiding modifications and enhancements to the current network of outdoor earthquake evacuation sites, especially at a time when such revisions are critical.
Accurate capacity assessment is essential for the appropriate designation of outdoor earthquake evacuation sites, typically determined by population data and the physical area of these sites. However, assessing population figures necessitates a spatial framework, such as census blocks, which often relies on registered resident data. Since actual living conditions may not always correspond with registered addresses, it is imperative to analyze the de facto population instead. Moreover, during an earthquake, residents are likely to evacuate to the nearest evacuation site, which may not be located within their designated census block. Therefore, evaluating accessibility alongside population data is crucial, employing methods such as network analysis.
The analysis conducted in this study, which examined both resident and de facto populations at three distinct time points, confirmed that capacity assessments should prioritize the de facto population rather than relying solely on resident figures. This conclusion aligns with previous studies and is particularly relevant to the context of Daegu Metropolitan City. By analyzing resident and de facto populations at three different times throughout the day, the study effectively distinguished between areas facing persistent challenges and those experiencing temporary issues. Through accessibility analysis, the study identified both evacuation-feasible and infeasible areas, enabling a comprehensive assessment of evacuation site coverage. This process facilitated the identification of regions that require additional evacuation sites to enhance overall evacuation capacity.
Lastly, by classifying capacity and the extent of evacuation-infeasible areas through a matrix analysis, this study offers a nuanced understanding of the current situation. The groupings based on capacity and physical area can inform planning for modifications and improvements to outdoor earthquake evacuation sites. While the study has limitations—such as its inability to provide precise analyses for each census block or identify optimal alternative locations due to its metropolitan-scale focus— it delivers significant value by conducting a comprehensive analysis of the overall status of the study area and proposing potential scenarios for response planning and strategies.
Acknowledgements
This research was supported by the Bisa Research Grant of Keimyung University in 2023
Conflicts of Interest
I declare that I have no conflicts of interest.
References
- Chen, Z., Chen, X., Li, Q. and Chen, J. (2013) The temporal hierarchy of shelters: A hierarchical location model for earthquake-shelters planning. International Journal of Geographical Information Science, Vol. 27, No.8, pp. 1612-1630. [CrossRef]
- Daegu Metropolitan City Service-Population Statistics Analysis Geographic Information System, http://s4u.daegu.go.kr/analysis#/servicePopulation/adong.
- Kaveh A., Javadi, S.M., and Moghanni R.M. (2020). Emergency management systems after disastrous earthquakes using optimization methods: A comprehensive review.
- u, J., and Wen, J. (2016). Multi-criteria satisfaction assessment of the spatial distribution of urban emergency shelters based on high-precision population estimation. International Journal of Disaster Risk Science, Vol. 7, No. 4, pp. 413-429. [CrossRef]
- Kim Sang-Gyoon, Shin Sang-young, Nam Hyeon-Jung (2022). Analyzing Accessibility of Emergency Shelters Based on Service Population: The Case of Outdoor Evacuation Places for Earthquake in Jung-gu, Seoul.
- Lee, S.H., Goo, S.H., Chun, Y.W., Park, Y.J. (2015). The spatial location analysis of disaster evacuation shelter for considering resistance of road slope and difference of walking speed by age-case study of Seoul, Korea. Journal of Korean Society for Geospatial Information System, Vol.23, No.2, pp.69-77.
- Kim, M.K., Kang, S., Kim, S.P., and Sohn, H.G. (2016). A spatial analysis of shelter capacity using floating population. Journal of the Korean Society of Surveying, Geodesy, Photogrammetry and Cartography, Vol.34, No.1, pp1-10.
- Xu, J., Yin, X., Chen, D., An, J., and Nie, G. (2016). Multi-criteria location model of earthquake evacuation shelters to aid in urban planning, International Journal of Disaster Risk Reduction, Vol.20, pp.51-62. [CrossRef]
- Deville, p., Linard, C., Martin, S., Gilbert M., Stevens, F.R., Gaughan, A.E., et al. (2014). Dynamic population mapping using mobile phone data. Proceedings of the national Academy of Sciences, Vo. 111, No. 45, pp.15888-15893. [CrossRef]
- Lee, W.K., Sohn, S.Y., and Heo, J. (2018). Utilizing mobile phone-based floating population data to measure the spatial accessibility to public transit. Applied geography, Vol.92, pp 123-130. [CrossRef]
- Wu, H., Liu, L., Yu, Y., and Peng, Z. (2018). Evaluation and planning of urban green space distribution based on mobile phone data and two-step floating catchment area method. Sustainability, Vol. 10, No. 1, 214. [CrossRef]
- Yun S.B., Kim, S., Hy, S., Noh, H., Kim, C., Wong, M.S., and Heo, J (2020). Analysis of accessibility to emergency rooms by dynamic population from mobile phone data: Geography of Social inequity in South Korea. PLOS ONE, Vol. 15, No. 4, e0231079. [CrossRef]
- Zhao, L., Li, H., Sun, Y., Huang, R., Hu, Q., Wang, J., and Gao, F. (2017). Planning emergency shelters for urban disaster resilience: An integrated location allocation modeling approach. Sustainability, Vol.9, No. 11, 2098. [CrossRef]
- Jun, S.H., Park, S.S., Shin, Y.G., Jang, D.S., Chung, H.S. (2010). Forecasting Vacant Technology of Patent Analysis System using Self Organizing Map and Matrix Analysis, the Journal of the Korea Contents Association Vol. 10., No.2, 462-480.
- Lee, H.J. (2009). A Plan of the analysis of Basic Design with Matrix form. Journal of the Korean Society of Design Culture, Vol.15, No.4, 457-465.
- Cho, H.U., Choi, S.Y. (2019). Risk-Matrix Analysis on Disasters and Accidents to Establish Investment Directions of Budgeting for Disasters and Safety Management. Journal of the Korean Society of Hazard Mitigation. Vol. 19, No37,165-179.
|
Disclaimer/Publisher’s Note: The statements, opinions and data contained in all publications are solely those of the individual author(s) and contributor(s) and not of MDPI and/or the editor(s). MDPI and/or the editor(s) disclaim responsibility for any injury to people or property resulting from any ideas, methods, instructions or products referred to in the content. |
© 2025 by the authors. Licensee MDPI, Basel, Switzerland. This article is an open access article distributed under the terms and conditions of the Creative Commons Attribution (CC BY) license (http://creativecommons.org/licenses/by/4.0/).