
Submitted:
31 December 2024
Posted:
02 January 2025
You are already at the latest version
Abstract
Sargassum is an important primary producer of rocky bottom communities in coastal ecosystems. Like other parts of the planet, benthic populations of S. natans from Ilha Grande Bay, southeastern Brazil, have been suffering from different forms of natural and anthropogenic disturbances, in particular increasing seawater temperatures. In this study, we focused on understanding the effects of temperature on the photosynthetic performance of S. natans using PAM fluorometry. Measurements in the field revealed the dynamics of effective and maximum quantum yields (ΔF/F’m and Fv/Fm, respectively), as well as the dynamics of photoprotection mechanisms. The stress induced by incubation at 32-35°C, caused a decrease in Fv/Fm by 33% on the first day and approximately 20% on subsequent days. Additionally, direct estimates of the net photosynthesis of S. natans by measurements of dissolved oxygen concentration showed that an increase in temperature inhibited photosynthesis. In the laboratory, using specimens of S. natans and Padina gymnospora, we verified the effect of temperature on the fate of the energy absorbed by the PSII antenna using complementary quantum yields. Exclusively in Sargassum, temperatures in the range of 32 to 35ºC promoted a decline of non-photochemical quenching of chlorophyll fluorescence before the decline of Fv/Fm, indicating that PSII is destroyed in the absence of the NPQ photoprotection.
Keywords:
Brown algae
; Photosynthesis
; PAM fluorometry
; Rapid Light Curves (RLC)
; Complementary Quantum Yields
1. Introduction
The brown macroalgal genus Sargassum (Sargassaceae, Fucales) is one of the most important habitat-forming taxa of shallow coastal environments, occurring along the tropical and warm temperate regions worldwide [1]. Sargassum beds represent several resources for benthic communities, such as food and space for reproduction, nursery, and protection [2,3]. Considering the actual scenario regarding climate and oceanographic events, a deep understanding of the photosynthetic performance of Sargassum under the impact of increasing surface seawater temperatures (SST) is critical for forecasting their responses undergoing global warming, providing better conservation procedures. Observed current ecosystems disruptions, due to global climate changes or local anthropogenic disturbances, deeply affect the survivorship, growth, reproduction, and distribution of marine organisms [4], particularly for sessile life on shallow rocky bottoms, such as macroalgae [5].
There are relevant laboratory and field studies on the effects of temperature and other abiotic factors on the physiology and growth of Sargassum species from different regions, at short temporal scales [6,7,8,9,10]. These studies indicate a negative effect of increasing temperature on Sargassum species, particularly temperatures above 30°C for species in warm-temperate regions and 33°C for tropical species [10,11]. The negative effects of increased temperatures on Sargassum populations are reported by long-term studies. For instance, the frequency of occurrence and the relative cover of Sargassum from populations subjected to heated effluent declined after more than two decades of operation of the Brazilian Nuclear Power Station (BNPS). Yet, the abundance of other brown algal species from that region, Padina gymnospora (Dictyotales), remained high during the same period [12,13]. The decline and disappearance of Sargassum and other Fucales subjected to increasing temperatures are described for other regions of the world [14,15]. Elevated seawater temperature directly or indirectly alters the photosynthetic performance of algae [16], affecting their primary production.
Photosynthesis is highly sensitive to high temperatures and is often inhibited before other cellular functions are impaired due to damage to the PSII and inhibition of Rubisco activity [17,18,19,20] Wang et al., 2018). The effects of increasing temperature, as well as the combined effects of temperature and irradiance on photosynthetic activity and thermal tolerance of different Sargassum species have been described using the pulse amplitude modulated (PAM) fluorometry technique in several studies [7,10,21,22,23,24]. The technique allows instantaneous and non-intrusive measurement of photosynthetic activity in real-time. Besides the maximum quantum yield (Fv/Fm) being used as an indicator of environmental stress [25,26], the induction of Rapid Light Curves (RLC) allows an evaluation of the temperature effect on photosynthetic parameters, such as photosynthetic efficiency (α), maximum electron transport rate (rETRm) and minimum irradiance for photosynthesis saturation (Ek) [27]. RLC measures the effective quantum yield as a function of irradiance. An important piece of information provided by this technique is to estimate the working of a photoprotection mechanism that results in a dissipation of part of the light energy absorbed by PSII antenna in the form of heat, the non-photochemical quenching of chlorophyll fluorescence (NPQ). Furthermore, this approach makes it possible to describe the partitioning of absorbed excitation energy in PSII between three fundamental pathways, the complementary quantum yields [28]: photochemical conversion (YII), regulated thermal energy dissipation related to NPQ (YNPO), and non-regulated energy dissipation as heat and fluorescence, mainly due to closed PSII reaction centers (YNO). Moreover, the influence of temperature on the photosynthetic performance of Sargassum was also studied by measuring dissolved oxygen concentrations in the incubation treatments [21,22,24,29,30,31]. As a general pattern, an increase in temperature inhibited photosynthesis.
In this study, we investigated the effects of increased temperatures on the photosynthetic performance of Sargassum natans, in the Brazilian southeastern coast, using PAM fluorometry and oxygen evolution rates. We focused on revealing the dynamics of the NPQ and the effective quantum yield of PSII (ΦPSII) under field conditions, as well as the behavior of other energy dissipation forms (complementary quantum yields, YII, YNPO, and YNO) under laboratory conditions. In the latter case, we comparatively assessed the effects of different temperatures on the photosynthetic performance of S. natans and Padina gymnospora, another co-occurring brown algal species.
2. Materials and Methods
2.1. Field Studies
Field studies were performed in Ilha Grande Bay (IGB), Rio de Janeiro State, Brazil: a warm temperate Southwestern Atlantic region [32]. Inside IGB, the sole Brazilian Nuclear Power Station (BNPS) has operated since the 1980 decade, and continuously discharges its heated effluent into the inner part of Piraquara de Fora Cove, where it forms a thermal plume [12,33].
The plants considered in this study were identified as Sargassum natans (Linnaeus) Gaillon (Ochrophyta, Fucales), following a phylogenetic concept of species (See Wynne [34]). Adult plants of S. natans were collected at 200 m from the thermal effluent outfall (23o00’47.47’’S and 44º26’40.92’’W) around 4 m deep and below the thermal plume (SST around 22°C) by autonomous diving and brought to the surface for measurements of diurnal variation of the maximum and the effective quantum yields between 10 am and 6 pm.
The photosynthetic quantum efficiency of S. natans was also determined underwater during a four-day experiment under different temperature ranges. For using the thermal plume as a temperature gradient, we chose three sites located at 200 m, 500 m, and 1,200 m (sites 1, 2, and 3, respectively) away from the thermal effluent outfall. During the experiment, site 1 presented temperatures from 31 to 35°C whereas sites 2 and 3 presented temperatures from 28 to 32°C. Adult plants still attached to boulders were collected by autonomous diving around 2 m deep at Sabacu Island (23º00’25.51’’S and 44º23’3.58’’W), located outside the thermal plume. The boulders with plants, kept inside a shaded container with local seawater at around 27ºC, were transported by speedboat to a site inside Piraquara de Fora Cove, near site 3. Plants were cleaned from macroscopic epiphytes and were then positioned 2 m deep overnight. On the next day, the boulders with plants, randomly selected, were transferred to sites 1, 2, and 3 (2 m deep). At each site, the effective quantum yield of the plants of the transplanted boulders was determined underwater four times a day (10:00 h ± 20 min, 12:00 h ± 20min, 14:00 h ± 20 min, and 16:40 ± 20 min) (Supplementary Material, Figure S1) and the maximum quantum yield was measured once each night (between 20:00 and 21:00 h).
Twenty adult plants of S. natans and P. gymnospora were collected by snorkeling in the shallow subtidal rocky bottom (1.0 m deep), outside Piraquara de Fora Cove (22o59’38.0” S and 44o25’53.6” W), SST around 28oC. The plants were cleaned of epiphytes, rinsed in clean seawater, and transported to the laboratory in coolers.
2.2. Laboratory Assays
Apical fragments around 5 cm long of S. natans and P. gymnospora were left in culture chambers to acclimate (12 h photoperiod, 90 μmol photon m−2 s−1) in conical flasks filled with 2,000 mL of Provasoli Enriched seawater (1 mL/L) and constant aeration at 25oC. After 48 hours, the fragments were transferred to a new culture medium and the experiment was set at three different temperatures: 25, 31, and 34oC, maintaining the other culture conditions. The photosynthetic performance of S. natans and P. gymnospora was measured at the beginning of the experiments and after 20, 40, and 120 hours of incubation.
3. Photosynthesis Measurements
3.1. Chlorophyll a Fluorescence
Fluorescence induction was measured using a submersible diving-PAM system (Walz GmbH, Germany), equipped with a blue LED (470 nm) and an 8 mm-diameter standard glass-fiber optic probe (Walz, Effeltricht, Germany), placed 10 mm away from the thalli. An internal halogen lamp provided the actinic illumination for each given irradiance level, as well as the saturating pulses.
The effective quantum yield of PSII, ΦPSII = (F’m - Fs)/F’m, was determined in light-adapted samples at a particular irradiance level, where Fs is the steady-state fluorescence level and F’m is the maximal fluorescence yield induced by a saturating light pulse (6,000 µmol photons.m-2s-1 for 800 ms). To determine the maximum quantum yield of PSII, plants were dark addapted for 30 min before measurements. Thereafter, the minimum fluorescence level (Fo) was detected under the modulated measuring light of the PAM (a weak pulsed light; < 1 μmol photons m-2s-1), whereas the maximum fluorescence level (Fm) was obtained by exposing the plants to a pulse of saturating light (6,000 µmol photons. m-2s-1 for 800 ms) in the presence of modulated light. Variable fluorescence (Fv) was calculated from Fm-Fo, and the maximum quantum efficiency of PSII photochemistry was obtained from the ratio Fv/Fm, which expresses the maximum quantum efficiency of primary photochemistry [26]. The non-photochemical quenching (NPQ = (Fm - F’m) /F’m) reflects energy dissipated as heat-related via energization of thylakoid membranes due to lumen acidification and light-induced xanthophyll cycle operation [35].
Rapid Light Curves (RLCs) were obtained by exposing the plants to eight predefined incremental light intensities for 10 s at each level of irradiance [27], using the software “Wincontrol-3” (Walz GmbH). Different PAR levels used to obtain RLCs were defined using the micro-quantum sensor (Walz GmbH, Effeltrich, Germany) calibrated against a Li-Cor quantum sensor (Li-Cor, Lincoln, NE, USA). The relative Electron Transport Rate (rETR) was obtained by multiplying ΦPSII by the density value of PAR of each light intensity (Beer et al., 2001), and rETR values were fitted to the RLC according to Platt et al. [36].
The fate of the absorbed energy by PSII antenna between photochemical dissipation (YII), regulated non-photochemical dissipation (YNPQ), and non-regulated non-photochemical dissipation passively lost as heat and fluorescence (YNO) was estimated by determining the complementary PSII quantum yields [28], as follows:
YII = (F’m - Fs)/F’m (quantum yield of photochemical energy conversion)
YNPQ = (F/F’m) – (F/Fm) (quantum yield of regulated non-photochemical energy loss)
YNO = F/Fm (quantum yield of non-regulated non-photochemical energy loss)
YII + YNPQ + YNO = 1
3.2. Net Photosynthesis and Respiration
Net photosynthesis and respiration estimates were obtained by measuring dissolved oxygen according to the modified Winkler’s method [37] in DBO bottles (300 mL), under light and dark (wrapped in aluminum foil) conditions, each one containing a 5 cm apical branch of adult plants of S. natans. Adult plants and seawater were collected 2 m deep at Sabacu Island by autonomous diving. The seawater used in the experiment was filtered by 45 µm pores (Millipore®).
One-meter-long PVC tubes were used as a support to anchor the DBO bottles (Supplementary Material, Figure S2). These experimental modules were attached to a ballast and a buoy by a rope to maintain the incubation 2 m deep at sites 1, 2, and 3. After incubation of the DBO bottles for 90 min in light and dark conditions, dissolved oxygen was fixed in 3M manganese chloride solution and alkaline iodine solution (NaOH 8M, NaI 4M) and kept cool in the dark. Twenty-four hours after oxygen fixation, 80 µl of 10M sulfuric acid was added and absorbances were spectrophotometrically determined at 466 nm (Kasvi, model K37-UV-VIS 190-1100 nm). S. natans fragments were oven dried at 60ºC until they reached constant weight. The results were expressed in milligrams of O2 per dry weight in grams and the incubation time in hours.
4. Abiotic Measurements
When photosynthetic performance was determined in plants brought to the surface, PAR was measured as 10 s-averaged values using a portable light meter LI-250A with a spherical quantum sensor LI-193SA (Li-Cor Inc., USA). During the underwater experiment, PAR was measured 2 m deep every 10 min for the four-day experiment using a PAR logger (Odyssey, Christchurch, New Zealand). The PAR sensor was attached to a ballast and kept close to the transplanted fragments of S. natans. In the laboratory experiments, PAR was measured as 10 s averaged values using a portable light meter LI-250A with a flat quantum sensor LI-190SA, cosine-corrected up to 80° angle of incidence (Li-Cor Inc., USA) on the outer surface of the culture flasks.
Seawater temperature was measured with a Hobo Pendant temperature logger (Onset, Cape Cod, USA). In the laboratory, temperature was measured with a mercury thermometer.
5. Statistical Analyses
The significance of differences between treatments was tested using one-way or two-way analysis of variance (ANOVA, Tukey’s post-hoc test) in the R environment [38], p<0.05 was considered significant.
5.1. Assays in the Field
Figure 1 shows the photosynthetic performance of S. natans collected from a depth outside the thermal plume at varying light intensities throughout the day. There was a significant interaction between treatments (ΦPSII and Fv/Fm) and measuring times (p<0.001) (Supplementary Material, Table S1). During the experiment, values of the effective quantum yield (ΦPSII) were equivalent to those obtained after dark adaptation (Fv/Fm), except for measurements taken at noon (ANOVA, F=6.082, p=0.005 and F=9.499, p<0.001, treatment and time, respectively). At noon, ΦPSII corresponded to 59% of the Fv/Fm value, and Fv/Fm decreased by 14% compared to measurements at other times of the day. Determination of the complementary quantum yields showed that at 12:00 hours, 38% of the energy absorbed by the PSII antenna was used to perform photochemistry, whereas 33% of the energy was dissipated in a programmed form as heat (YNPQ) and 29% of the energy was dissipated as non-programmed heat and fluorescence (YNO).
Rapid light curves (Supplementary Material, Figure S3) provided information on the saturation characteristics of electron transport as well as the overall photosynthetic performance of S. natans collected at different daylight intensities as shown in Table 1. Samples collected at 10:00, 14:00, 16:00, and 18:00 h presented essentially the same photosynthetic efficiency (α), which was higher than that at noon (Supplementary Material, Table S1). The highest value of irradiance for the onset of saturation of photosynthetic activity (Ek) was also at noon (Supplementary Material, Table S1).
Figure 2 shows the effect of temperature and photon flux density on the PSII quantum yield of S. natans measured underwater over the course of four days. Regardless of the seawater temperature, an inverse fluctuation between the quantum yield and photon flux density is observed in Figure 2A. Throughout the experiment, plants exposed to the temperature range of 32 to 35ºC (200 m distant from the thermal effluent outfall) showed a lower quantum yield than that presented by plants exposed to temperatures between 28 and 31ºC (500 and 1,200 m distant from the thermal effluent outfall, as temperature ranges were essentially the same in site 2 and 3). Compared to S. natans exposed to lower temperatures, plants incubated at 32-35ºC presented a decrease in the maximum quantum yield (measured at 9 pm) by 33% on the first day and by approximately 20% on the subsequent days. On the fourth day, the sky was overcast, and PAR values were lower than 200 µmol. m-2. s-1. Under these conditions, quantum yield remained constant all day irrespective of temperature.
Underwater Net Photosynthesis and Respiration
Photosynthesis and respiration were differently affected by incubation under distinct temperature ranges (Figure 3). Temperature varied between 30 and 32ºC at 200 m, and between 28 and 29ºC at 500 and 1,200 m away from the thermal effluent outfall (Figure 3B). Temperatures higher than 30ºC (found at 200 m) decrease the photosynthetic activity in Sargassum (ANOVA, F= 6.34, p=0.01), while respiration was not affected.
5.2. Laboratory Assays
Figure 4 illustrates that increasing the cultivation temperature from 25 to 31ºC did not affect the ratio Fv/Fm in S. natans, but this parameter decreased progressively as a function of the incubation time when the temperature was 34ºC. Maximum quantum yield in P. gymnospora was not affected at temperatures between 25 and 34ºC. (Supplementary Material, Table S2)
Figure 5 shows that the increase in PAR promoted an increase in the non-photochemical quenching parameter describing regulated dissipation of excess energy (NPQ), regardless of the seaweed species and of the exposure time to temperatures of 25 and 31ºC. Although this same behavior is observed when P. gymnospora was incubated at 34ºC, NPQ development was drastically reduced and disappeared upon S. natans exposure to 34ºC for 20 and 40 hours. We did not detect any photosynthetic response of S. natans cultured for 120 h at 34ºC.
Figure 6 depicts the RLCs and the fate of excitation energy in PSII of the macroalga P. gymnospora incubated for 20, 40, and 120 hours at temperatures of 25, 31, and 34ºC. Regardless of the cultivation temperature, as well as the incubation time at each temperature, an increase in the relative electron transport rate (rETR) through PSII was promoted by irradiance increase up to the range 250 to 350 µmol photons.m-2.s-1, and a decrease in rETR was observed at higher irradiances (panels 6A, 6C and 6E). Again, irrespective of the cultivation temperature, as well as the incubation time at each temperature, we observed a decrease in the effective quantum yield with irradiance increase presumably due to the development of the non-photochemical processes of energy dissipation, YNPQ and YNO (panels 6B, 6D and 6F).
Figure 7 reveals that S. natans is sensitive to temperatures above 31ºC. Panel 7A shows that the incubation time at 25ºC did not affect the linear region of the RLCs and that the maximum rETR was reached between 250 and 350 µmol photons.m-2.s-1, as previously observed in P. gymnospora. However, incubation for 120 hours at 31ºC resulted in a decrease in the initial slope of the RLC compared to those obtained after incubation for 20 and 40 hours at 31ºC (panel 7C). Exposure of S. natans for 20 hours at 34ºC resulted in a marked decrease in the rate of electron transport through the PSII promoted by the actinic radiation (panel 7E). Together with panel 7F, we verify that increasing the incubation time to 40 hours at 34ºC resulted in almost complete inhibition of the fraction of energy that is photochemically converted in the PSII reaction center (ΦPII). Under these conditions, YII approached zero and no energy was dissipated as heat through the NPQ-regulated photoprotective mechanism (YNPQ). At the same time, we observe a sharp increase in the YNO values that could reflect the inability of S. natans to protect itself against damage from excessive light. Samples submitted to 120 hours at 34ºC did not have any photosynthetic activity.
6. Discussion
Our results clearly show that the photosynthetic activity of S. natans was significantly affected by temperature. Net photosynthetic rates were decreased in algae incubated in the vicinity of the warm water effluent (200 m distance). Likewise, the effective quantum yield was also negatively affected by high temperatures. When manipulating the exposure of S. natans to increased temperatures by incubating plants at closer distances to the thermal effluent outfall, an inverse relation between PAR and the photosynthetic quantum yield of PSII was observed, regardless of temperature. Over the four-day incubation, the quantum efficiency of PSII was maximal in the absence of light (21:00 h), decreased to a minimum towards midday, and recovered in late afternoon to the values recorded in early morning during the diurnal light cycle. Again, NPQ and ΦPSII were inversely related, where ΦPSII decreased with increasing irradiance as more electrons could accumulate at the PSII acceptor side. Then there was a relative increase in NPQ of the energy absorbed by the PSII antenna in the form of thermal energy dissipation [26]. Because of the reduction in the incident light on the fourth day, no dissipation of energy occurred under the two temperature ranges and the quantum yields remained constant all day. It is noteworthy that at a temperature range of 28-31°C (500 and 1,200 m from the thermal effluent outfall), Sargassum showed a substantial difference in Fv/Fm (measured at 21:00 h) compared to exposure to higher temperatures (32-35°C). The stress induced by incubation at 32-35°C caused a decrease in Fv/Fm by 33% on the first day and approximately 20% on the subsequent days. At the beginning of the experiment, regardless of the temperature, quantum yields were very low in the absence of light, probably indicating some sort of stress caused by the transplantation of the macroalgae.
As observed for other Sargassum species [7,21,39], S. natans collected from outside the thermal plume (at 4 m deep and temperature of 22°C along the day) exhibited characteristics of a sun-adapted plant, as evidenced by the daily variation of Fv/Fm and ΦPSII, suggesting the occurrence of dynamic photoinhibition. The initial value of Fv/Fm in the morning was about 0.7, which is comparable to the levels observed for other Sargassum species [7,22,23,39]. Photosynthesis, measured as Fv/Fm and ΦPSII, decreased at noon and then recovered rapidly to the values recorded in the morning, probably due to the combined factors of decreased irradiance and increase in the water column due to the tidal variation between noon and 14:00 h. Over this period time, there was an increase of approximately, 0.6 meters in the water column (Brazilian Navy’s Board of Hydrography and Navigation). The rapid recovery of ΦPSII suggests that the responses of S. natans to high light intensity are linked to dynamic photoinhibition, i.e., a photoprotective mechanism that involves a reversible down-regulation of the PSII activity. Thus, at midday, light-adapted ΦPSII was 41% lower than the one measured for dark-adapted plants (Fv/Fm), due to the inherent impact of non-photochemical quenching (NPQ) reducing the light-adapted quantum yield [40]. These results were reinforced by the photosynthetic performance parameters (rETRmax, alpha, and Ek) obtained from the RLC performed at different times of the day (from 10:00 to 18:00 h). Whereas the rETRmax presented essentially the same value, the decrease in alpha and the increase in Ek support the downregulation of the photosynthetic activity of S. natans at midday. It has been reported that an increase in NPQ can reduce alpha value and avoid damage from high light stress to the PSII [23,41].
High temperature severely inhibited the photosynthetic performance of S. natans under controlled conditions of the laboratory. The use of Fv/Fm as an indicator of stress revealed the thermolability of the photosynthetic apparatus of S. natans at 34°C since incubation for 20 h resulted in a 26.4% decrease in Fv/Fm and a decline of 56.6% after incubation for 40 h. No activity was detected following 120 h incubation at 34°C. By contrast, the photosynthetic activity of P. gymnospora was not affected by cultivation at 34°C, indicating that the plants of P. gymnospora growing in IGB are adapted or acclimated to elevated temperatures, being tolerant to temperatures higher than 30°C, as suggested by Széchy et al. [13].
In algae, high temperature reduces or even inactivates PSII, Rubisco, and Rubisco activase, severely inhibiting photosynthesis [17,18,19]. Thus, the decline in carbon fixation via the Calvin cycle decreases the demand for reducing equivalents from the photosynthetic electron transport chain and absorption of excitation energy exceeds the capacity for its utilization, causing photodamage of the photosynthetic apparatus. In these events, massive production of reactive oxygen species (ROS) causes oxidative stress that destroys cell membrane structures and leads to disorders of intracellular metabolism [42,43]. One of the defense mechanisms underlying the oxidative stress caused by high temperatures consists of a system that includes antioxidant enzymes, such as superoxide dismutase and peroxidases, which can mitigate oxidative damage by removing ROS formed under high-temperature stress [20,24]. Moreover, a multitude of photoprotection mechanisms were selected throughout evolution in plants and algae for their role in preventing damage by the action of ROS. One of the most important protection mechanisms is the dissipation of excessive excitation energy as heat in the light-harvesting complexes of the photosystems, termed NPQ [35]. The general importance of NPQ for the photoprotection of plants and algae is documented by its wide distribution among photosynthetic organisms.
We observed that NPQ induction by increasing irradiance showed a sigmoidal-shaped NPQ pattern in the two brown algae cultured in the laboratory. Neither the induction pattern nor the NPQ capacity was affected by the exposure time (20, 40, and 120 h) to temperatures of 25, 31, and 34 °C, except for S. natans exposed to 34°C. In this case, a virtually total inhibition of NPQ occurrence was observed after incubation for 20 h at 34°C. It is worth noting that the photoprotection (NPQ) mechanism to prevent damage to the photosynthetic apparatus was completely inhibited by high temperature before the complete decrease in Fv/Fm, indicating that the loss of photoprotection preceded photodamage. Thus, the antioxidant enzymes responsible for ROS scavenging [20,24,43,44] are likely unable to cope with the massive increase in ROS caused by the high temperature-induced NPQ inhibition.
After 120 h of S. natans cultivation under non-stressful conditions (25°C, 12 h photoperiod, and 90 μmol photon m−2 s−1 PAR), we found that 12, 44, and 44% of the absorbed energy from 750 μmol photon m−2 s−1 PAR were allocated, respectively, among YII, YNPQ, and YNO. Under the same conditions, we found that P. gymnospora shared 10, 34, and 56% of the energy absorbed by the PSII, respectively, among YII, YNPQ, and YNO. Similar figures were found when P. gymnospora was cultivated for 40 h at 34°C, whereas the fate of excitation energy in PSII among YII, YNPQ, and YNO in S. natans corresponded, respectively, to 1, 4, and 95%. According to Wang et al. [45], a high YNPQ indicates that the photon flux density is excessive and that the plant sample was able to protect itself by dissipation of excessive excitation energy into harmless heat. Without such dissipation, there would be the formation of ROS which causes irreversible damage. In contrast, high YNO indicates that both photochemical and non-photochemical capacities are inefficient.
Our results reinforce that photosynthesis is highly sensitive to high-temperature stress and is often inhibited before other cell functions are impaired, in accordance to other studies [21,22,24,29,30,31]. In fact, photosynthesis in algae is extremely sensitive to high-temperature stress, as it can induce PSII inactivation, and destroy algal membranes and thylakoids, thereby inhibiting photosystem activities [19]. Moreover, high temperatures reduce the activity of Rubisco, limiting photosynthetic carbon assimilation [18,46].
In conclusion, S. natans showed a clear dynamic photoinhibition indicated by the daily variation of Fv/Fm and ΦPSII. It also indicated that the stress induced by incubation at 32-35°C, over four days in the field, caused a decrease in Fv/Fm by 33% on the first day and approximately 20% on subsequent days. In the laboratory, the effect of exposure to different temperatures points to a lower tolerance of S. natans to temperatures above 31ºC, indicated by the significant drop in the rate of electron transport. Unlike Sargassum, P. gymnospora remained with high values of the same fluorescence parameters even at 34°C, indicating to be more equipped to thrive at temperatures higher than those presently occurring. Another result to be highlighted is the NPQ decline of non-photochemical quenching of chlorophyll fluorescence before the decline of maximum quantum yield of PSII, indicating that PSII is rapidly destroyed in the absence of this photoprotection.
Supplementary Materials
The following supporting information can be downloaded at the website of this paper posted on Preprints.org.
Author Contributions
RC: Conceptualization, Methodology, Data acquisition in the field and in the laboratory, Formal analysis, Supervision, Validation, Visualization, Writing original draft, Writing-review; RM: Conceptualization, Data acquisition in the field, Formal analysis, Funding acquisition, Investigation, Methodology in field, Writing-review; JS: Conceptualization, Methodology, Data acquisition in field, Formal analysis, Validation, Visualization, Writing-review; CN: Obtaining, transporting and cultivating macroalgae in the laboratory, Methodology, Writing- review; FR: Methodology, Data acquisition in the laboratory, Formal analysis, Validation, Visualization, Writing original draft, Writing-review; MTS: Resources, Supervision, Validation, Visualization, Writing-review.
Funding
This research received no external funding.
Data Availability Statement
The raw data supporting the conclusions of this article will be made available by the authors on request.
Acknowledgments
To Eletronuclear, for field facilities, Multiuso Laboratory of the Biology Institute of Universidade Federal do Rio de Janeiro, for the oxygen analyses. To Ivan M. Carneiro for assistance in the statistical tests of the laboratory data, and to Arthur Santa Cruz for the assistance with the graphs.
Conflicts of Interest
The authors declare that they have no known competing financial interests or personal relationships that could have appeared to influence the work reported in this paper.
References
- Yip, Z.T.; Quek, R.Z.B.; Huang, D. Historical biogeography of the widespread macroalga Sargassum (Fucales, Phaeophyceae). J. Phycol. 2020, 56, 300–309. [CrossRef]
- Suarez-Castillo, A.N.; Riosmena-Rodriguez, R.; Hernandez-Carmona, G.; Méndez-Trejo, M.D.C; López-Vivas, J.M.; Sánchez-Ortiz, C.; Lara-Uc, M.M.; Torre-Cosio, J. Biodiversity associated to Sargassum forest at the Gulf of California. In: Riosmena-Rodriguez, R (Ed.), In Invertebrates: classification, evolution and biodiversity. Nova Science Publishers, Inc. 2013; chapter 9, pp. 205–223.
- Tano, S.; Eggertsen, M.; Wikström, S.A.; Berkström, C.; Buriyo, A.S.; Halling, C. Tropical seaweed beds are important habitats for mobile invertebrate epifauna. Estuar. Coast. Shelf Sci. 2016, 183, 1-12. [CrossRef]
- Buckley, L.B.; Huey, R.B. How extreme temperatures impact organisms and the evolution of their thermal tolerance. Integr. Comp. Biol. 2016, 56, 98–109. [CrossRef]
- Eggert, A. Seaweed responses to temperature. In Seaweed biology: novel insights into ecophysiology, ecology and utilization. Wiencke, C and Bischof, K eds. Springer, New York, 2012; 32012; pp. 47- 66. [CrossRef]
- Charan, H.; Inomata, E. Decreased irradiance and nutrient enrichment mitigate the negative effect of ocean warming on growth and biochemical compositions of a canopy-forming marine macroalga. J. Mar. Sci. Eng. 2022, 10, 479. [CrossRef]
- Kokubu, S.; Nishihara, G.N.; Watanabe, Y.; Tsuchiya, Y.; Amamo, Y.; Terada, R. The effect of irradiance and temperature on the photosynthesis of a native alga Sargassum fusiforme (Fucales) from Kagoshima, Japan. Phycologia 2015, 54, 235-247. [CrossRef]
- Liu, L.; Lin, L. Effect of heat stress on Sargassum fusiforme leaf metabolome. J. Plant Biol. 2020, 63 , 229–241. [CrossRef]
- Phelps, C.M.; Boyce, M.C.; Huggett, M.J. Future climate change scenarios differentially affect three abundant algal species in southwestern Australia. Mar. Envir. Res. 2017, 126 , 69-80. [CrossRef]
- Urrea-Victoria, V.; Nardelli, A.E.; Floh, E.I.S.; Chow, F. Sargassum stenophyllum (Fucales, Ochrophyta) responses to temperature short-term exposure photosynthesis and chemical composition. Braz. J. Bot. 2020, 43, 733–745. [CrossRef]
- Gouvêa, L.P.; Horta, P.A.; Fragkopoulou, E.; Gurgel, C.F.D.; Peres, LMC; Bastos, E; Ramlov, F.; Burle, G.; Koerich, G.; Martins, C.D.L.; Serrão, E.A.; Assis, J. Phenotypic plasticity in Sargassum forests may not counteract projected biomass losses along a broad latitudinal gradient. Ecosystems 2023, 26, 29-41. [CrossRef]
- Carneiro, I.M.; Széchy, M.T.M;Bertocci, I.; Paiva, P.C. Impact of a nuclear power station effluent on marine forests: A case study in SE Brazil and insights for global warming scenarios. Envir. Poll. 2024, 344, 123323. [CrossRef]
- Széchy, M.T.M.; Koutsoukos, V.S.; Barboza, C.A.M. Long-term decline of brown algal assemblages from southern Brazil under the influence of a nuclear power plant. Ecol. Indic. 2017, 80, 258–267. [CrossRef]
- Bernal-Ibánez, A.; Gestoso, I.; Wirtz, P.; Kaufmann, M.; Serrao, E.A.; Canning-Clode, J.; Cacabelos, E. The collapse of marine forests: drastic reduction in populations of the family Sargassaceae in Madeira Island (NE Atlantic). Reg. Environ. Change. 2021, 21, 71. [CrossRef]
- Phillips, J.A.; Blackshaw, J.K. Extirpation of macroalgae (Sargassum spp.) on the subtropical east Australian coast. Conser. Bio. 2011, 25, 913–921. [CrossRef]
- Gao, G.; Liu, Y.; Lia, X.; Fenga, Z.;Xu, Z.; Wu, H.; Xu, J. Expected CO2-induced ocean acidification modulates copper toxicity in the green tide alga Ulva prolifera. Envir. Exp. Bot. 2017, 135, 63–72. [CrossRef]
- Mathur, S.; Agrawal, D.; Jajoo, A. Photosynthesis: Response to high temperature stress. Photochem. Photobiol. B: Biol. 2014, 137, 116–126. [CrossRef]
- Salvucci, M.E.; Crafts-Brandner, S.J. Inhibition of photosynthesis by heat stress: the activation state of Rubisco as a limiting factor in photosynthesis. Physiol. Plant. 2004, 120, 179-186. [CrossRef]
- Yamamoto, Y. Quality control of photosystem II: the mechanisms for avoidance and tolerance of light and heat stresses are closely linked to membrane fluidity of the thylakoids. Front. Plant Sci. 2016, 7, 1136. [CrossRef]
- Wang, W.; Lin, Y.; Teng, F.; Ji, D.; Xu, Y.; Chen, C.; Xie, C. Comparative transcriptome analysis between heat-tolerant and sensitive Pyropia haitanensis strains in response to high stress. Algal Res. 2018, 29, 104-112. [CrossRef]
- Terada, R.; Vo, T.D.; Nishihara, G.N.; Matsumoto, K.; Kokubu, S.; Watanabe, Y.; Kawaguchi, S. The effect of photosynthetically active radiation and temperature on the photosynthesis of two Vietnamese species of Sargassum, S. mcclurei and S. oligocystum, based on the field and laboratory measurements. Phycological Res. 2016, 64, 230–240. [CrossRef]
- Wang, Y.; Zhong, Z.;Qin, S.; Li, J.; Li, J.; Liu, Z. Effects of temperature and light on growth rate and photosynthetic characteristics of Sargassum horneri. J. Oceanogr. Univ. China 2021, 20, 101-110. [CrossRef]
- Zhong, Z.H.; Wang, Y.; Qin, S.; Zhuang, L.C.; Li, J.J.; Song, W.L.; Liu, Z.Y. Short-term photoacclimation and photoregulation strategies of Sargassum horneri in response to temperature and light. Photosynthetica 2021, 59, 268-276. [CrossRef]
- Zuo, X.; Xu, L.; Luo, L.; Zeng, Y.; Ma, Z.; Wu, M.; Chen, B. Physiological responses of Sargassum fusiforme seedlings to high-temperature stress. Reg. Stud. Mar. Sci. 2023, 62, 102900. [CrossRef]
- Baker, N.R. Chlorophyll fluorescence: a probe of photosynthesis in vivo. Annu. Rev. Plant Biol. 2008, 200859, 89-113. [CrossRef]
- Schreiber, U. Pulse-Amplitude-Modulation (PAM) Fluorometry and Saturation Pulse Method: An Overview. In: Papageorgiou, G.C., Govindjee (eds) Chlorophyll a Fluorescence. Advances in Photosynthesis and Respiration, volume 19. Springer, Dordrecht, 2004; pp.279–319. [CrossRef]
- Ralph, P.J.; Gademann, R. Rapid Light Curves - a powerful tool to assess photosynthetic activity. Aquat. Bot. 2005, 82, 222-237. [CrossRef]
- Klughammer, C.; Schreiber, U. Complementary PS II quantum yields calculated from simple fluorescence parameters measured by PAM fluorometry and the saturation pulse method. PAM Application Notes 2008, 1, 27-35.
- Ito, T.; Borlongan, I.A.; Nishihara, G.N.; Endo, H.; Terada, R. The effects of irradiance, temperature, and desiccation on the photosynthesis of a brown alga, Sargassum muticum (Fucales), from a native distributional range in Japan. J. Appl. Phycol. 2021, 33, 1777-1791. [CrossRef]
- Murakami, H.; Serisawa, Y.; Kurashima, A.; Yokohama, Y. Photosynthetic performances of temperate Sargassum and Kelp species growing in the same habitat. Algae 2004, 19, 207-216. [CrossRef]
- Tsuchiya, Y.; Nishihara, G.N.; Terada, R. Photosynthetic and temperature characteristics of five Sargassum species (Fucales), S. piluliferum, S. patens, S. fusiforme, S. crispifolium, and S. alternato-pinnatum from Kagoshima, Japan, using dissolved oxygen sensor and pulse-amplitude-modulated (PAM) fluorometer. Nippon Suisan Gakkaishi 2012, 78, 189-19. [CrossRef]
- Spalding, M.D.; Fox, H.E.; Allen, G.R.; Davidson, N.; Ferdaña, Z.A.; Finlayson, M.; Halpern, B.S.; Jorge, M.A.; Al Lombana, S.A.; Martin, K.D.; McManus, E.; Molnar, J.; Recchia, C.S.; Robertson, J. Marine ecoregions of the world: A bioregionalization of coastal and shelf areas. BioScience 2007, 57, 573-583. [CrossRef]
- Carneiro, I.M.; Diaz, R.S.; Bertocci, I.; Széchy, M.T.M. The Fucales Index: a new tool for monitoring subtidal rocky habitats, and its application to an Atlantic Bay subjected to nuclear power plant’s effluents. Mar. Poll. Bull. 2021, 172, 112804. [CrossRef]
- Wynne, M.J. Checklist of benthic macroalgae of the tropical and subtropical Western Atlantic: fifth revision. Nova Hedwigia. 2022, 153 (Suppl. l), 1–180.
- Goss, R.; Lepetit, B. Biodiversity of NPQ. J. Plant Physiol. 2015, 172, 13-32. [CrossRef]
- Platt, T.; Gallegos, C.L.; Harrison, W.G. Photoinhibition of photosynthesis in natural assemblages of marine phytoplankton. J. Mar. Res. 1980, 38, 687–701.
- Labasque, T.; Chaumeryb, C.; Aminotc, A.; Kergoat, G. Spectrophotometric winkler determination of dissolved oxygen: reexamination of critical factors and reliability. Mar. Chem. 2004, 88, 53-60. [CrossRef]
- R Core Team, R: A Language and Environment for Statistical Computing. R Foundation for Statistical Computing, Vienna. https://www.R-project.org (accessed on November 1, 2024).
- Yu,Y.; Zhang, Q.S.; Tang, Y.Z.; Li, X.M.; Liu, H.L.; Li, L.X. Diurnal changes of photosynthetic quantum yield in the intertidal macroalga Sargassum thunbergii under simulated tidal emersion conditions. J. Sea Res. 2013, 80, 50-57. [CrossRef]
- Beer, S.B.; Bjork, M.; Gademann, R.; Ralph, P.J. Measurements of photosynthetic rates in seagrasses. In: Short F.T., Coles R. (eds). Global seagrass research methods. Elsevier, Amsterdam, 2001; pp 183–198. [CrossRef]
- Serôdio, J.; Vieira, S.; Cruz, S.; Coelho, H. Rapid light-response curves of chlorophyll fluorescence in microalgae: relationship to steady-state light curves and non-photochemical quenching in benthic diatom-dominated assemblages. Photosynth. Res. 2006, 90, 29–43. [CrossRef]
- Liu, X.; Huang, B. Heat stress injury in relation to membrane lipid peroxidation in creeping bentgrass. Crop Sci. 2000, 40, 503–510. [CrossRef]
- Liang, M-H.; Jiang, J-G.; Wang, L.; Zhu, J. et al. Transcriptomic insights into the heat stress response of Dunaliella bardawil. Enzyme Microb. Technol. 2020, 132, 109436. [CrossRef]
- Das, S.K.; Patra, J.K.; Thatoi, H. Antioxidative response to abiotic and biotic stresses in mangrove plants: a review Int. Ver. Hydrobiol. 2016, 101, 3-19. [CrossRef]
- Wang, L-J.; Loescher, W.; Duan, W.; Li, W-D.; Yang, S-H.; Li, S-H. Heat acclimation induced acquired heat tolerance and cross adaptation in grape cultivars: relationships top photosynthetic energy partitioning. Funct. Plant Biol. 2009, 36, 516–526. [CrossRef]
- Sharkey, T.D. Effects of moderate heat stress on photosynthesis: importance of thylakoid reactions, rubisco deactivation, reactive oxygen species, and thermotolerance provided by isoprene. Plant Cell Environ. 2005, 28, 269–277. [CrossRef]
Figure 1.
A- Diurnal variation of PAR on a pier located 200 m from the thermal effluent outfall, plotted as 10 s-average values. B- Diurnal variation in maximum (black columns) and effective (white columns) quantum yields of Sargassum natans collected at 4 m deep at the site located 200 m from the thermal effluent outfall. Means ± SD (n = 8). Different letters indicate significant differences between quantum yields values (ANOVA, p<0.05).
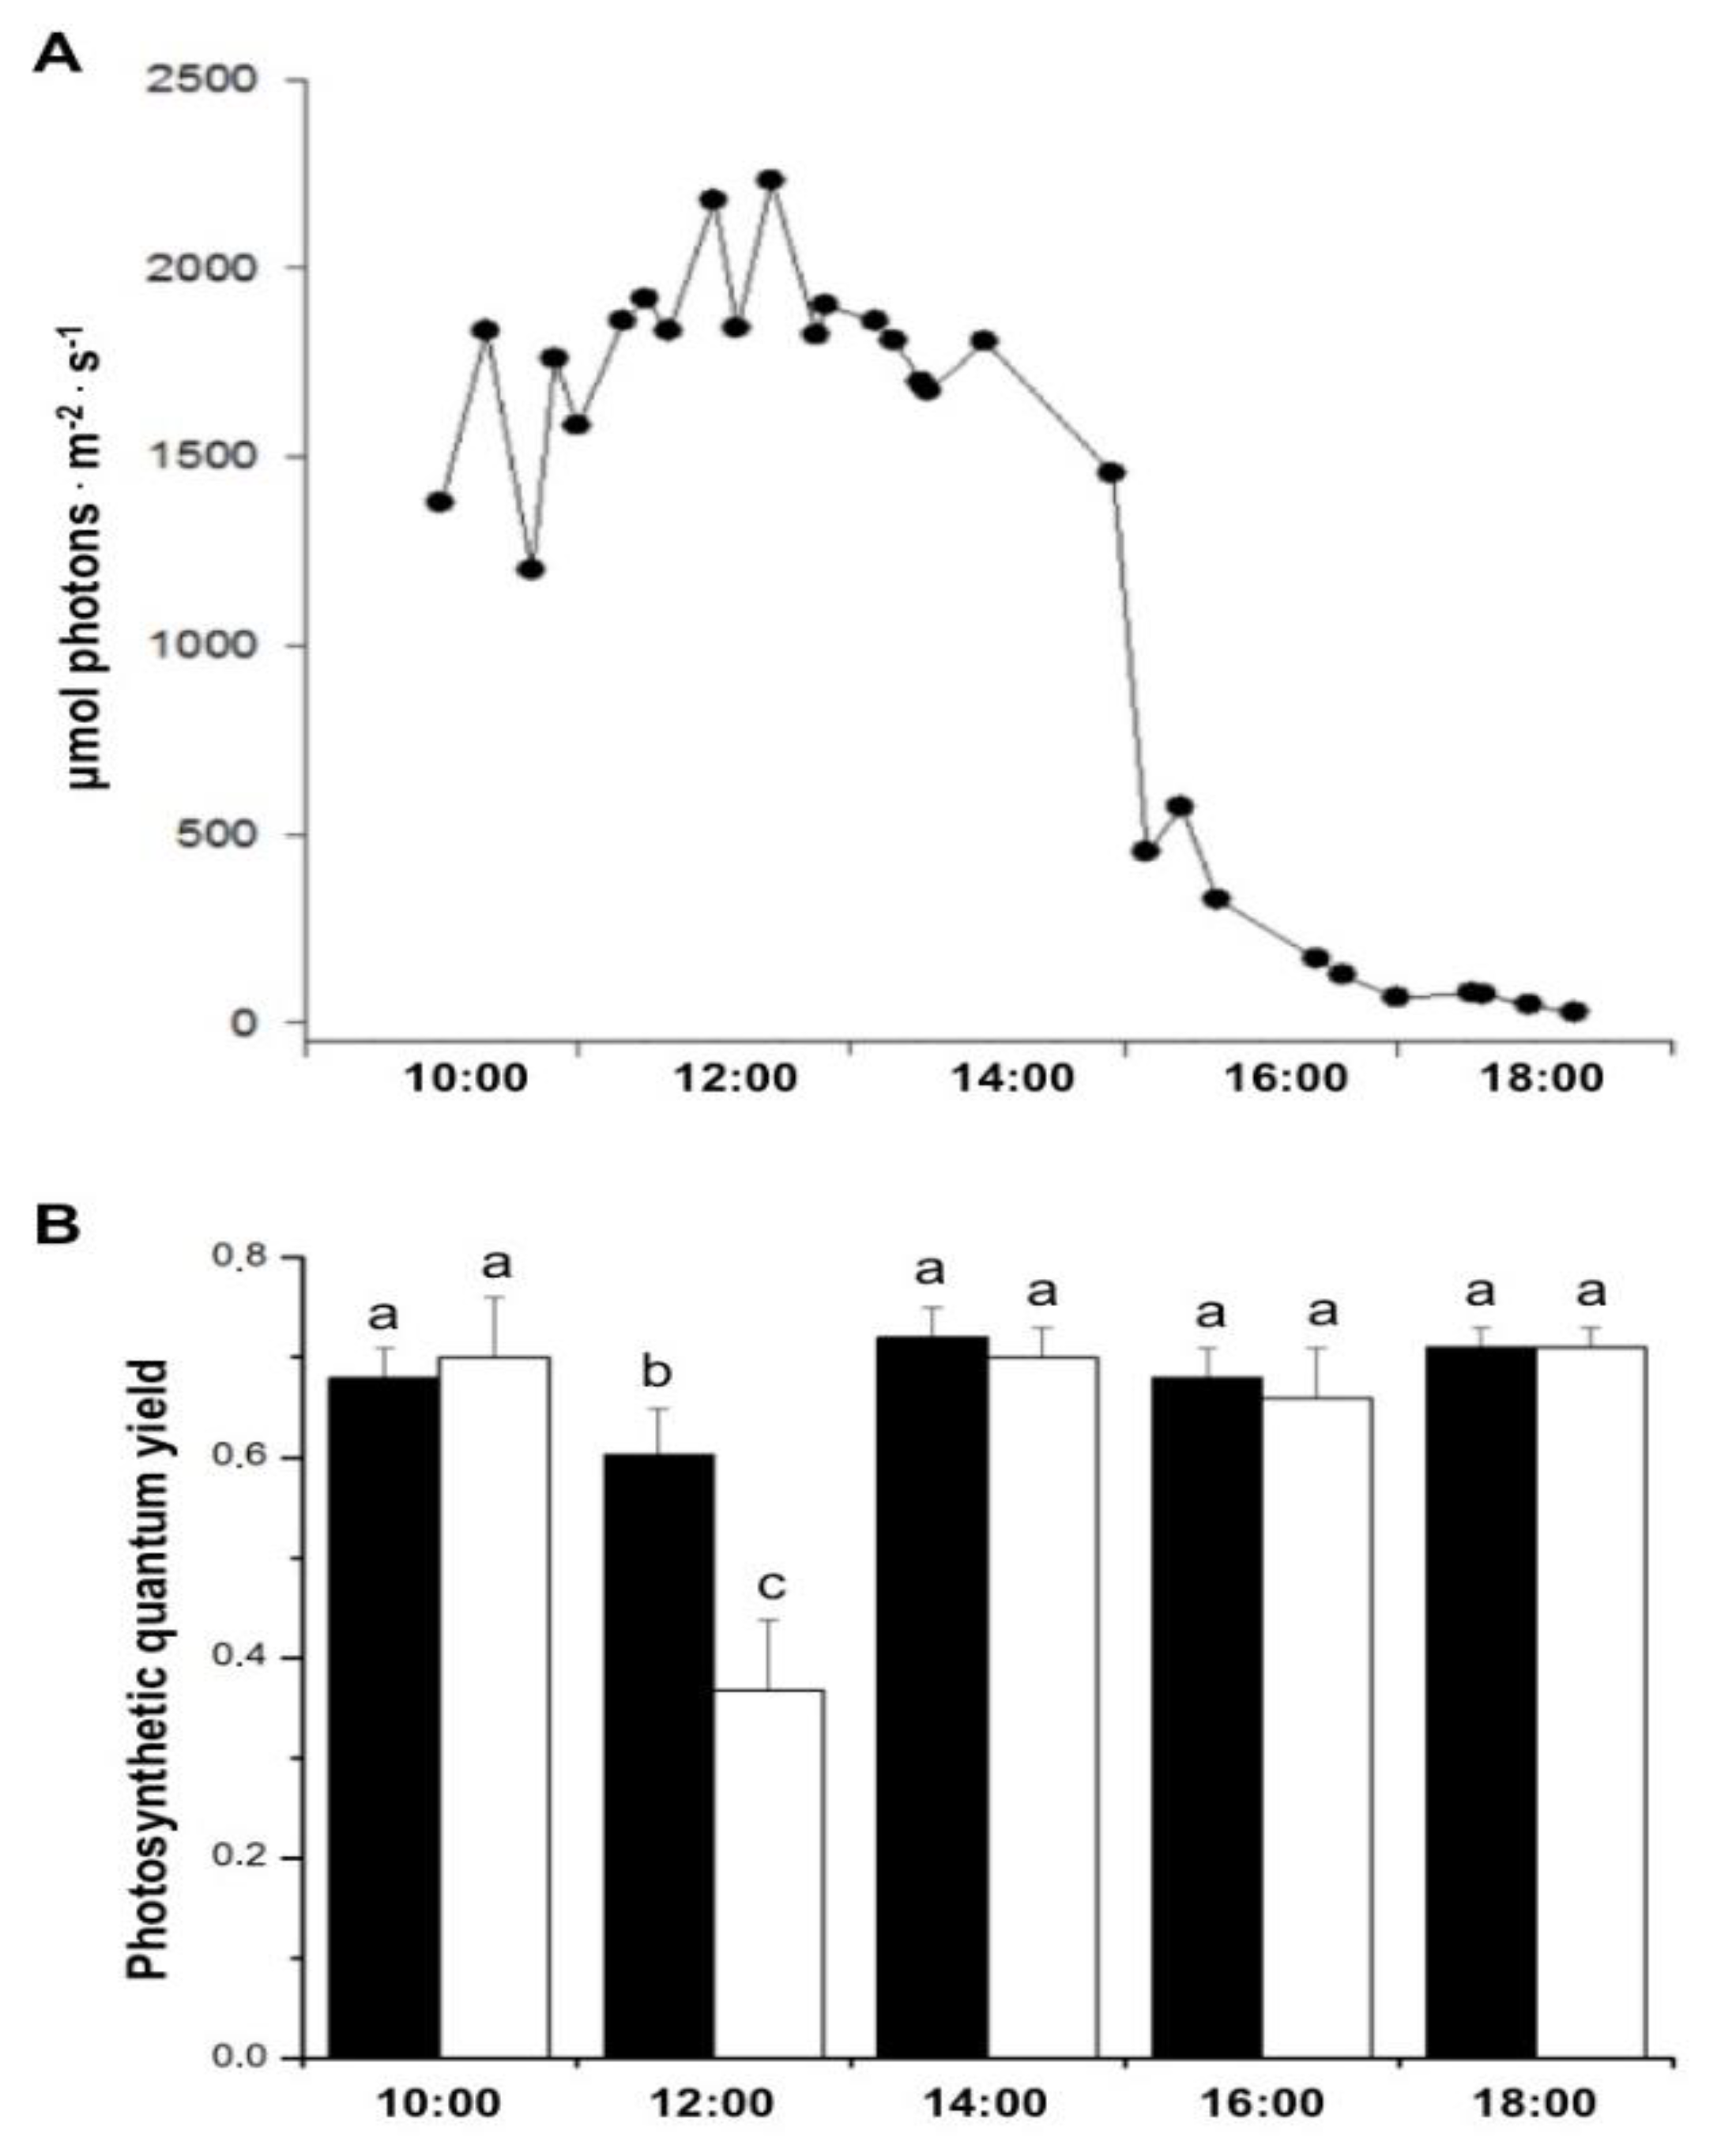
Figure 2.
A- Daily variation of PAR (yellow line) and photosynthetic quantum yield at 2 m deep in sites 1 (blue symbols and line), 2 (black symbols and line) and 3 (red symbols and line), respectively 200, 500 and 1,200 m away from the thermal effluent outfall, throughout four days. At each location, the effective quantum yield was determined four times a day and the maximum quantum yield was measured once each night, and PAR was continuously registered. Means ± SD (n = 10). B- Seawater temperature at sites 1 (blue line), 2 (black line), and 3 (red line) 2 m deep, close to the studied plants, for four days.
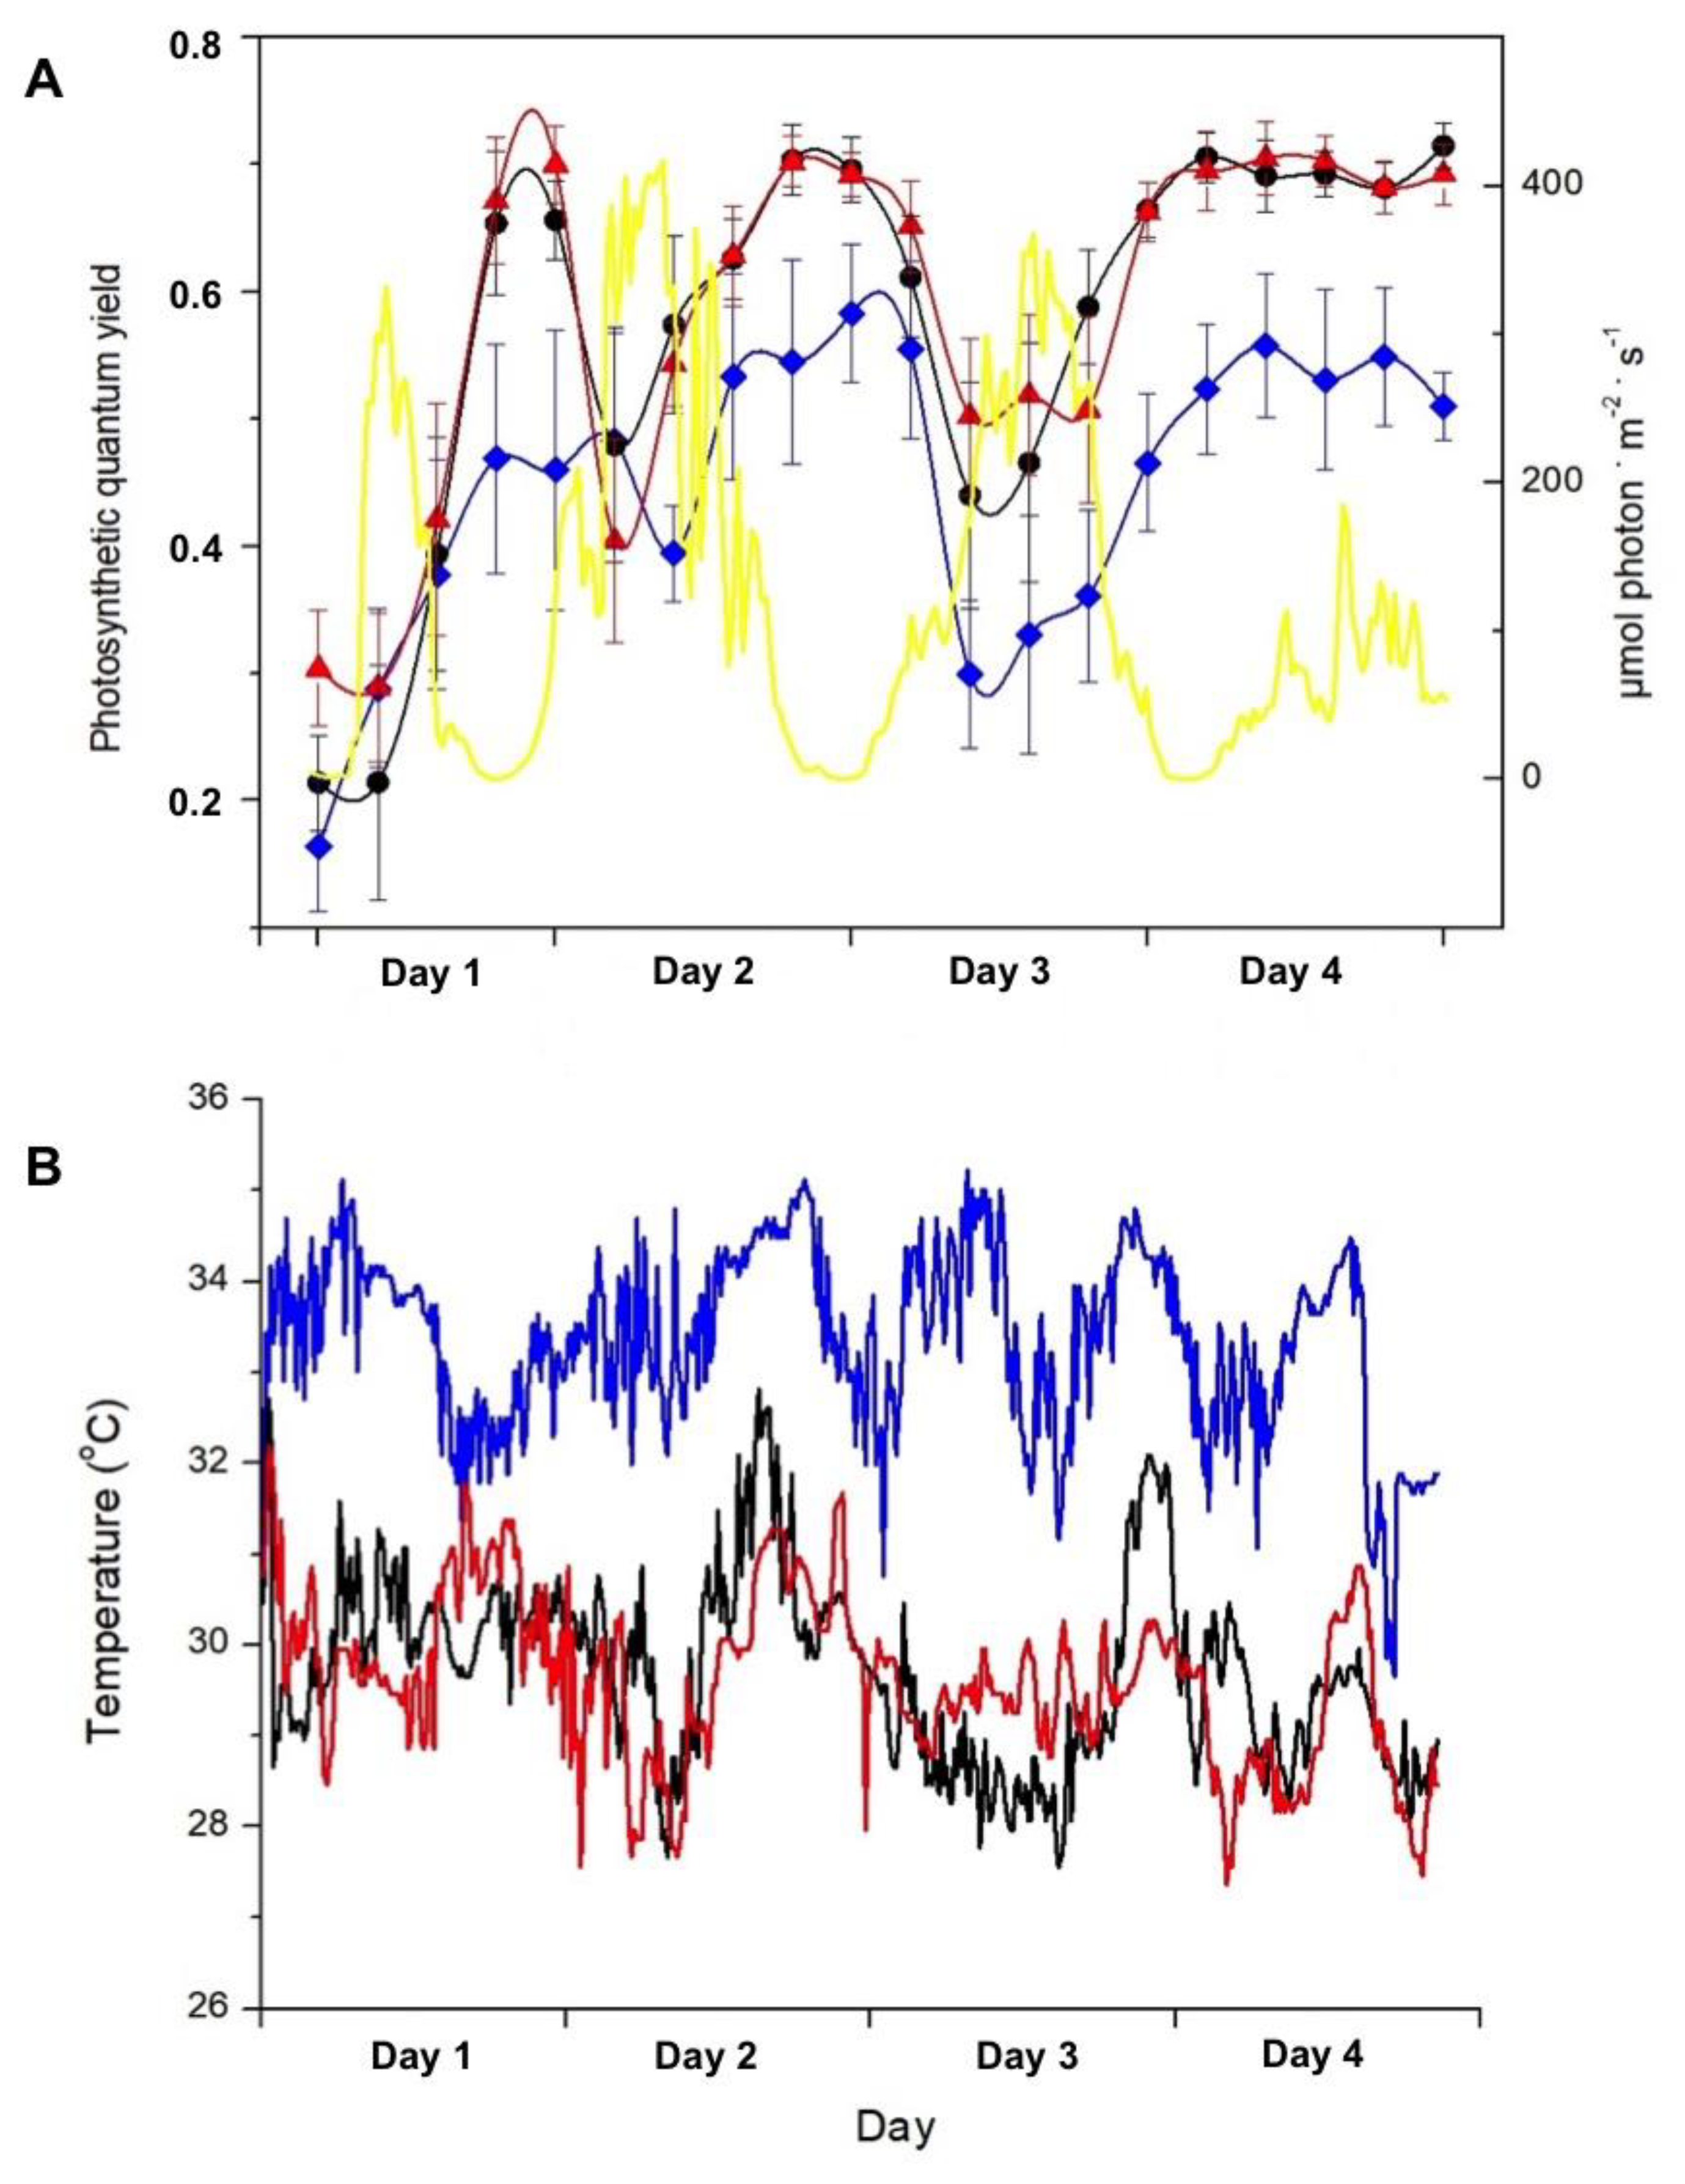
Figure 3.
A- Net oxygen production in the presence of light (white columns) and oxygen consumption in the dark (black columns) after 90 min of incubation of Sargassum natans at sites 1, 2 and 3 in DBO bottles incubated at 2m deep at sites 1, 2, and 3. Means ± SD (n = 5). Different letters indicate significant differences. B- Seawater temperature during the experiment at sites 1 (blue line), 2 (black line), and 3 (red line), respectively 200, 500, and 1,200 m away from the thermal effluent outfall.
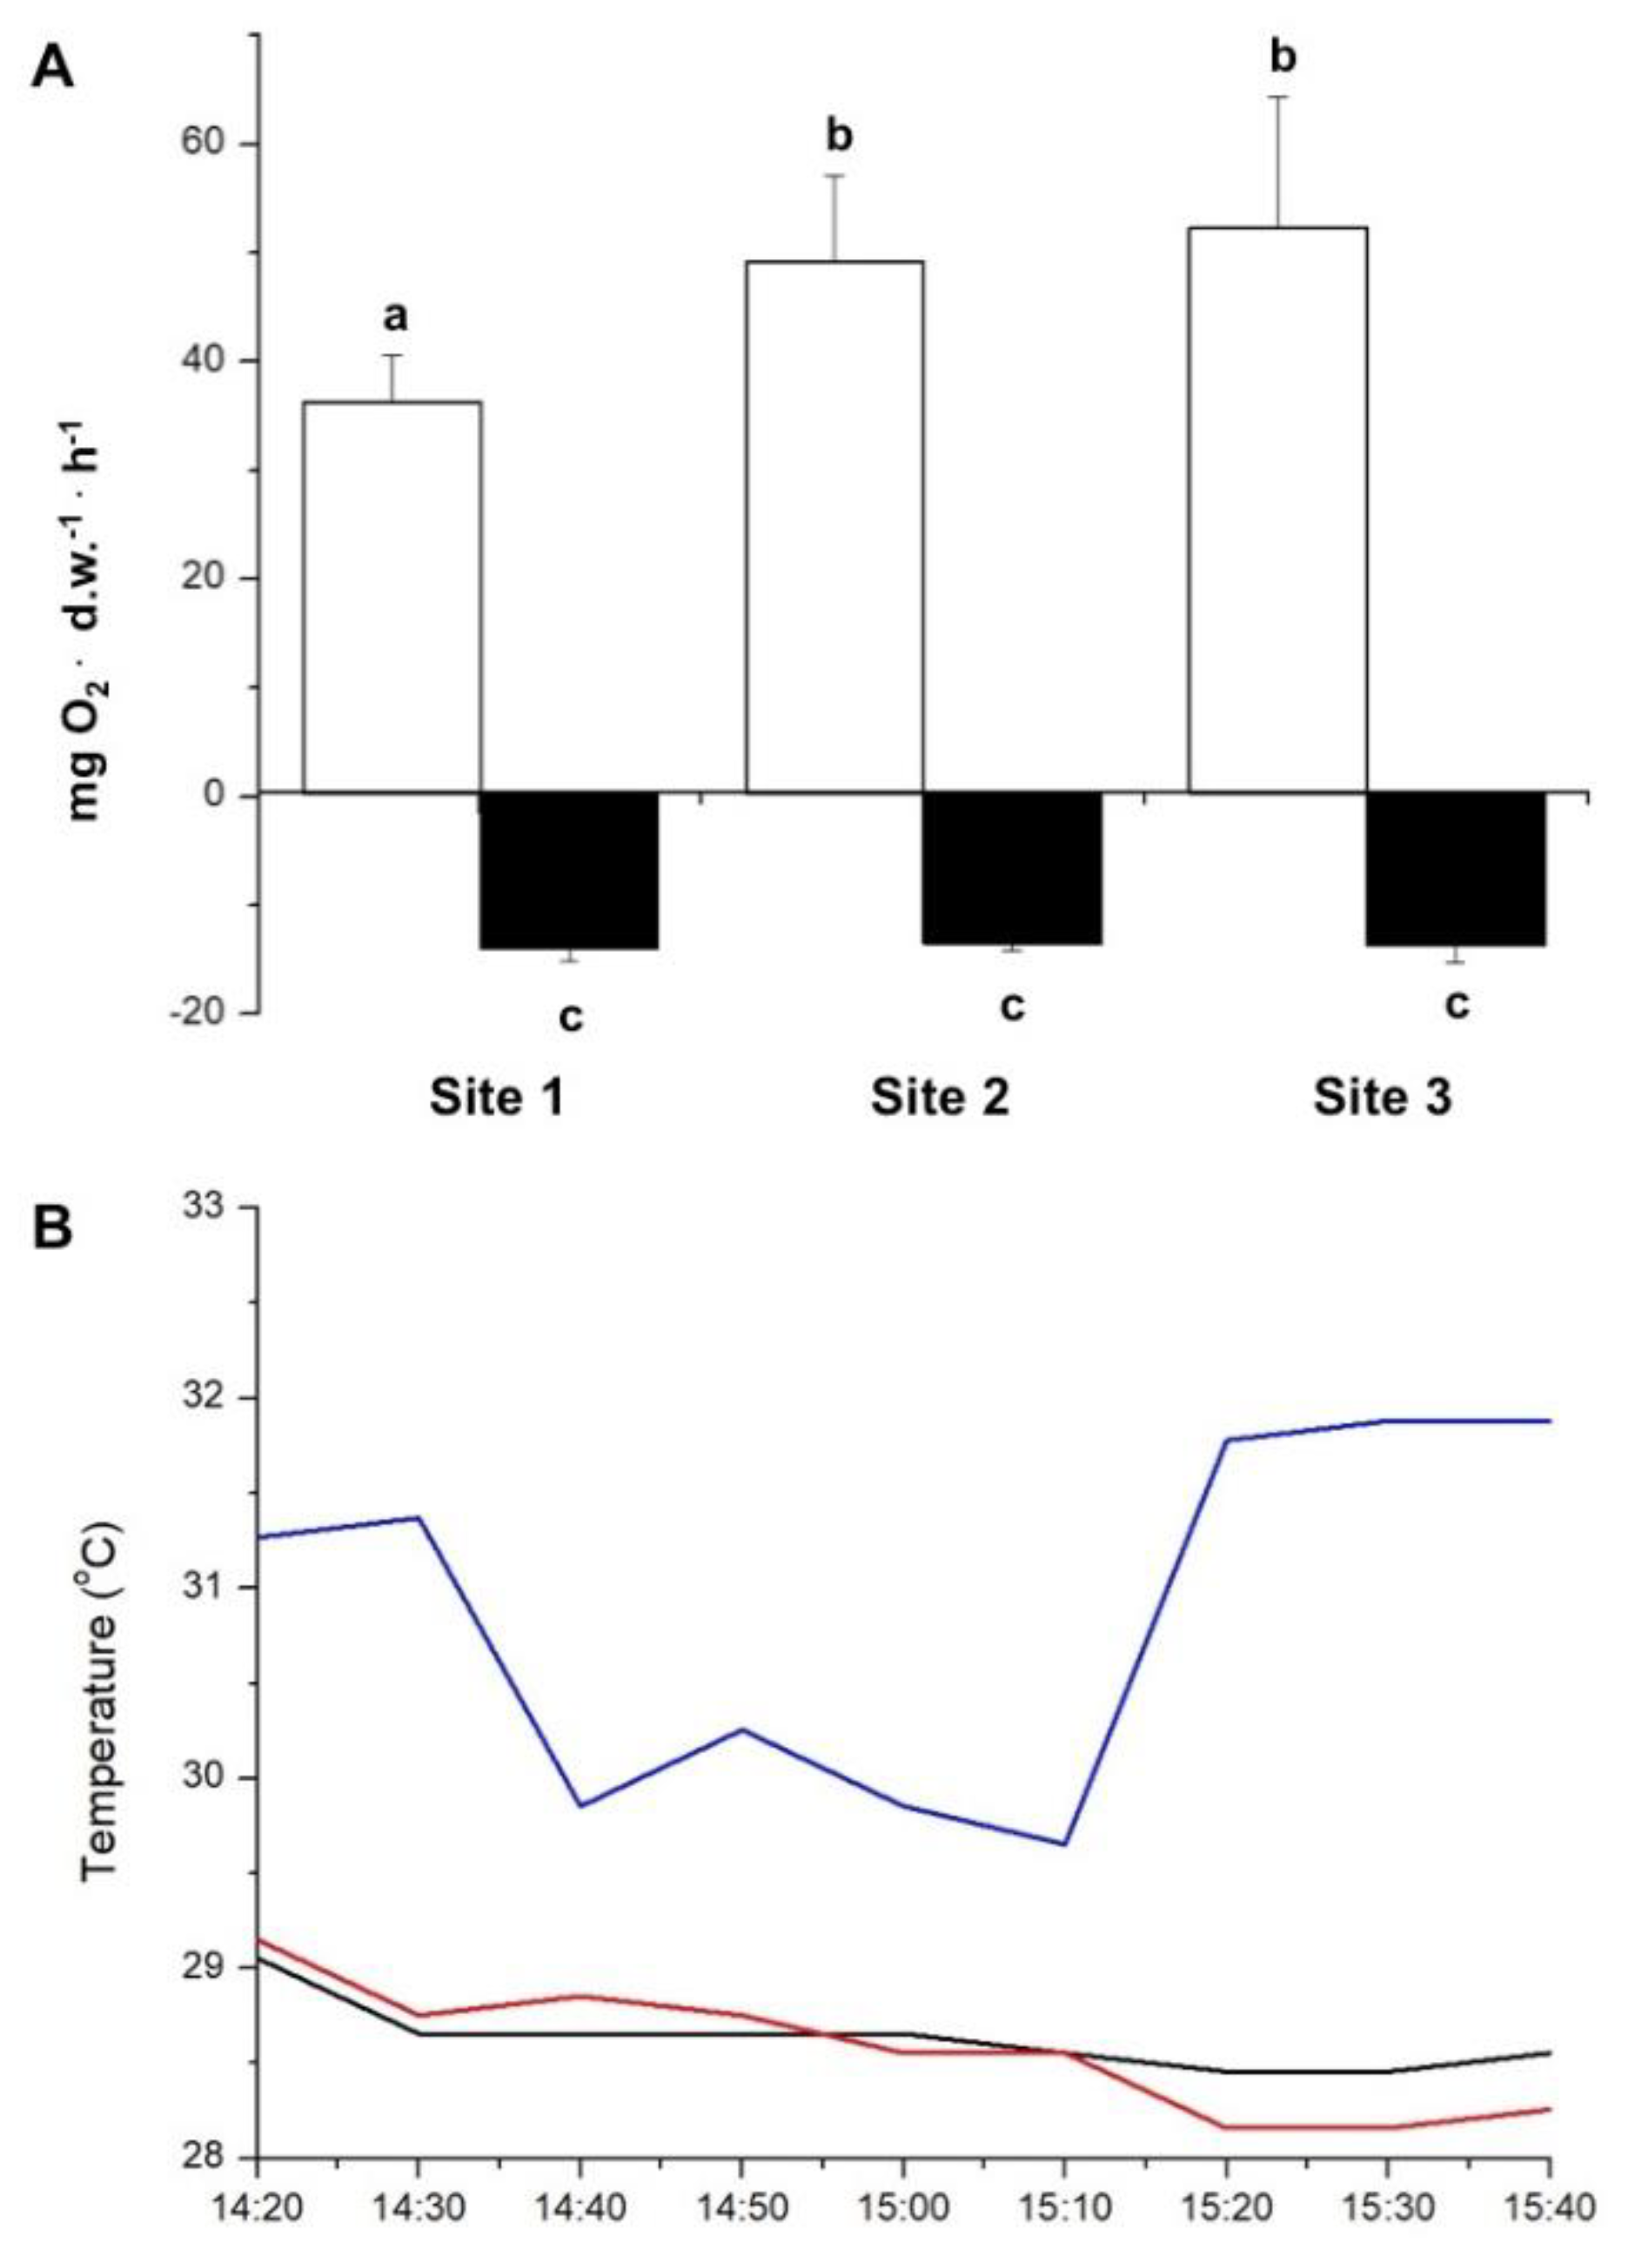
Figure 4.
Effect of temperature on the maximum quantum yield of Sargassum natans (white columns) and Padina gymnospora (black columns). Brown algae were cultured in the laboratory for five days at 25, 31, and 34ºC under 90 µmol photons.m-2.s-1 irradiance. Following 20, 40, and 120 hours of culturing, algae plants were dark-adapted for 30 min and Fv/Fm was determined. Means ± SD (n=3).
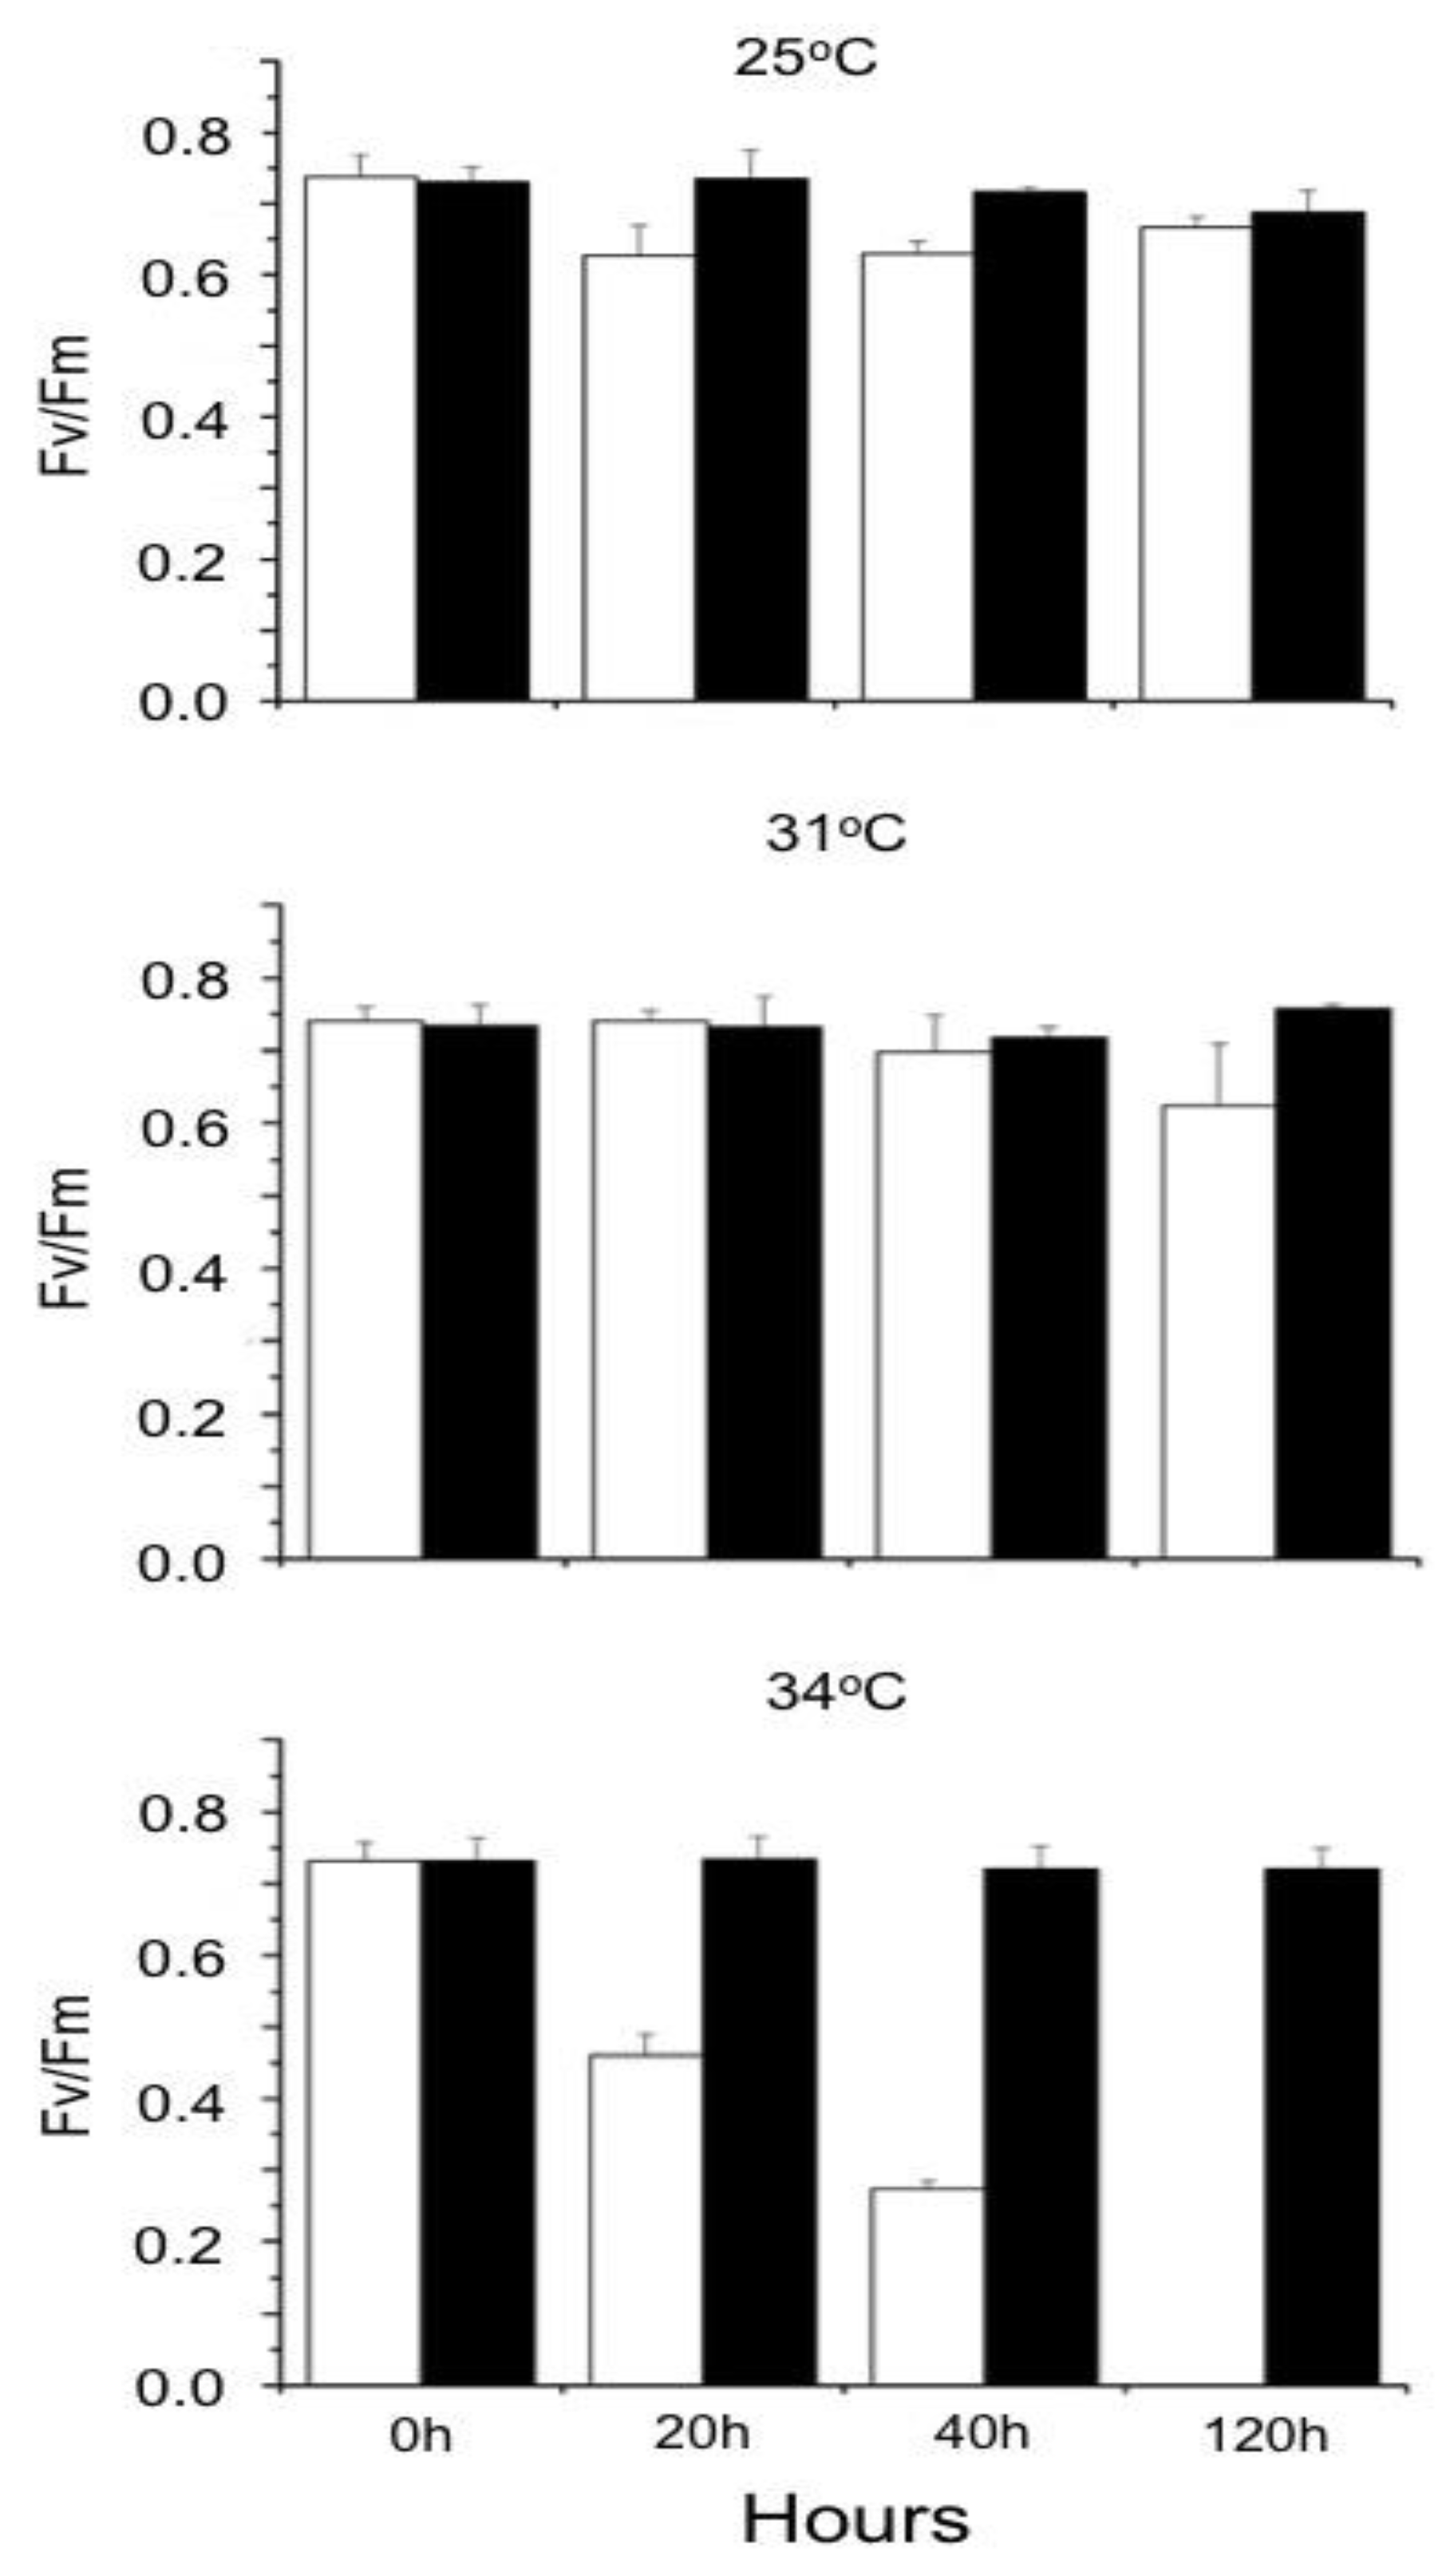
Figure 5.
Influence of temperature on the Non-Photochemical Quenching (NPQ) as a function of photosynthetically active radiation (PAR). Brown algae were cultured at 25, 31, and 34ºC in the laboratory under 90 µmol photons.m-2.s-1 irradiance. Following 20 (black symbols and lines), 40 (green symbols and lines), and 120 (red symbols and lines) hours of culturing, Rapid Light Curves (RLC) were obtained just after the algae samples were taken from the culture vessel. Subsequently, algae were dark-adapted and Fm was obtained for the calculation of NPQ as a function of increasing irradiances. Means ± SD (n=3).
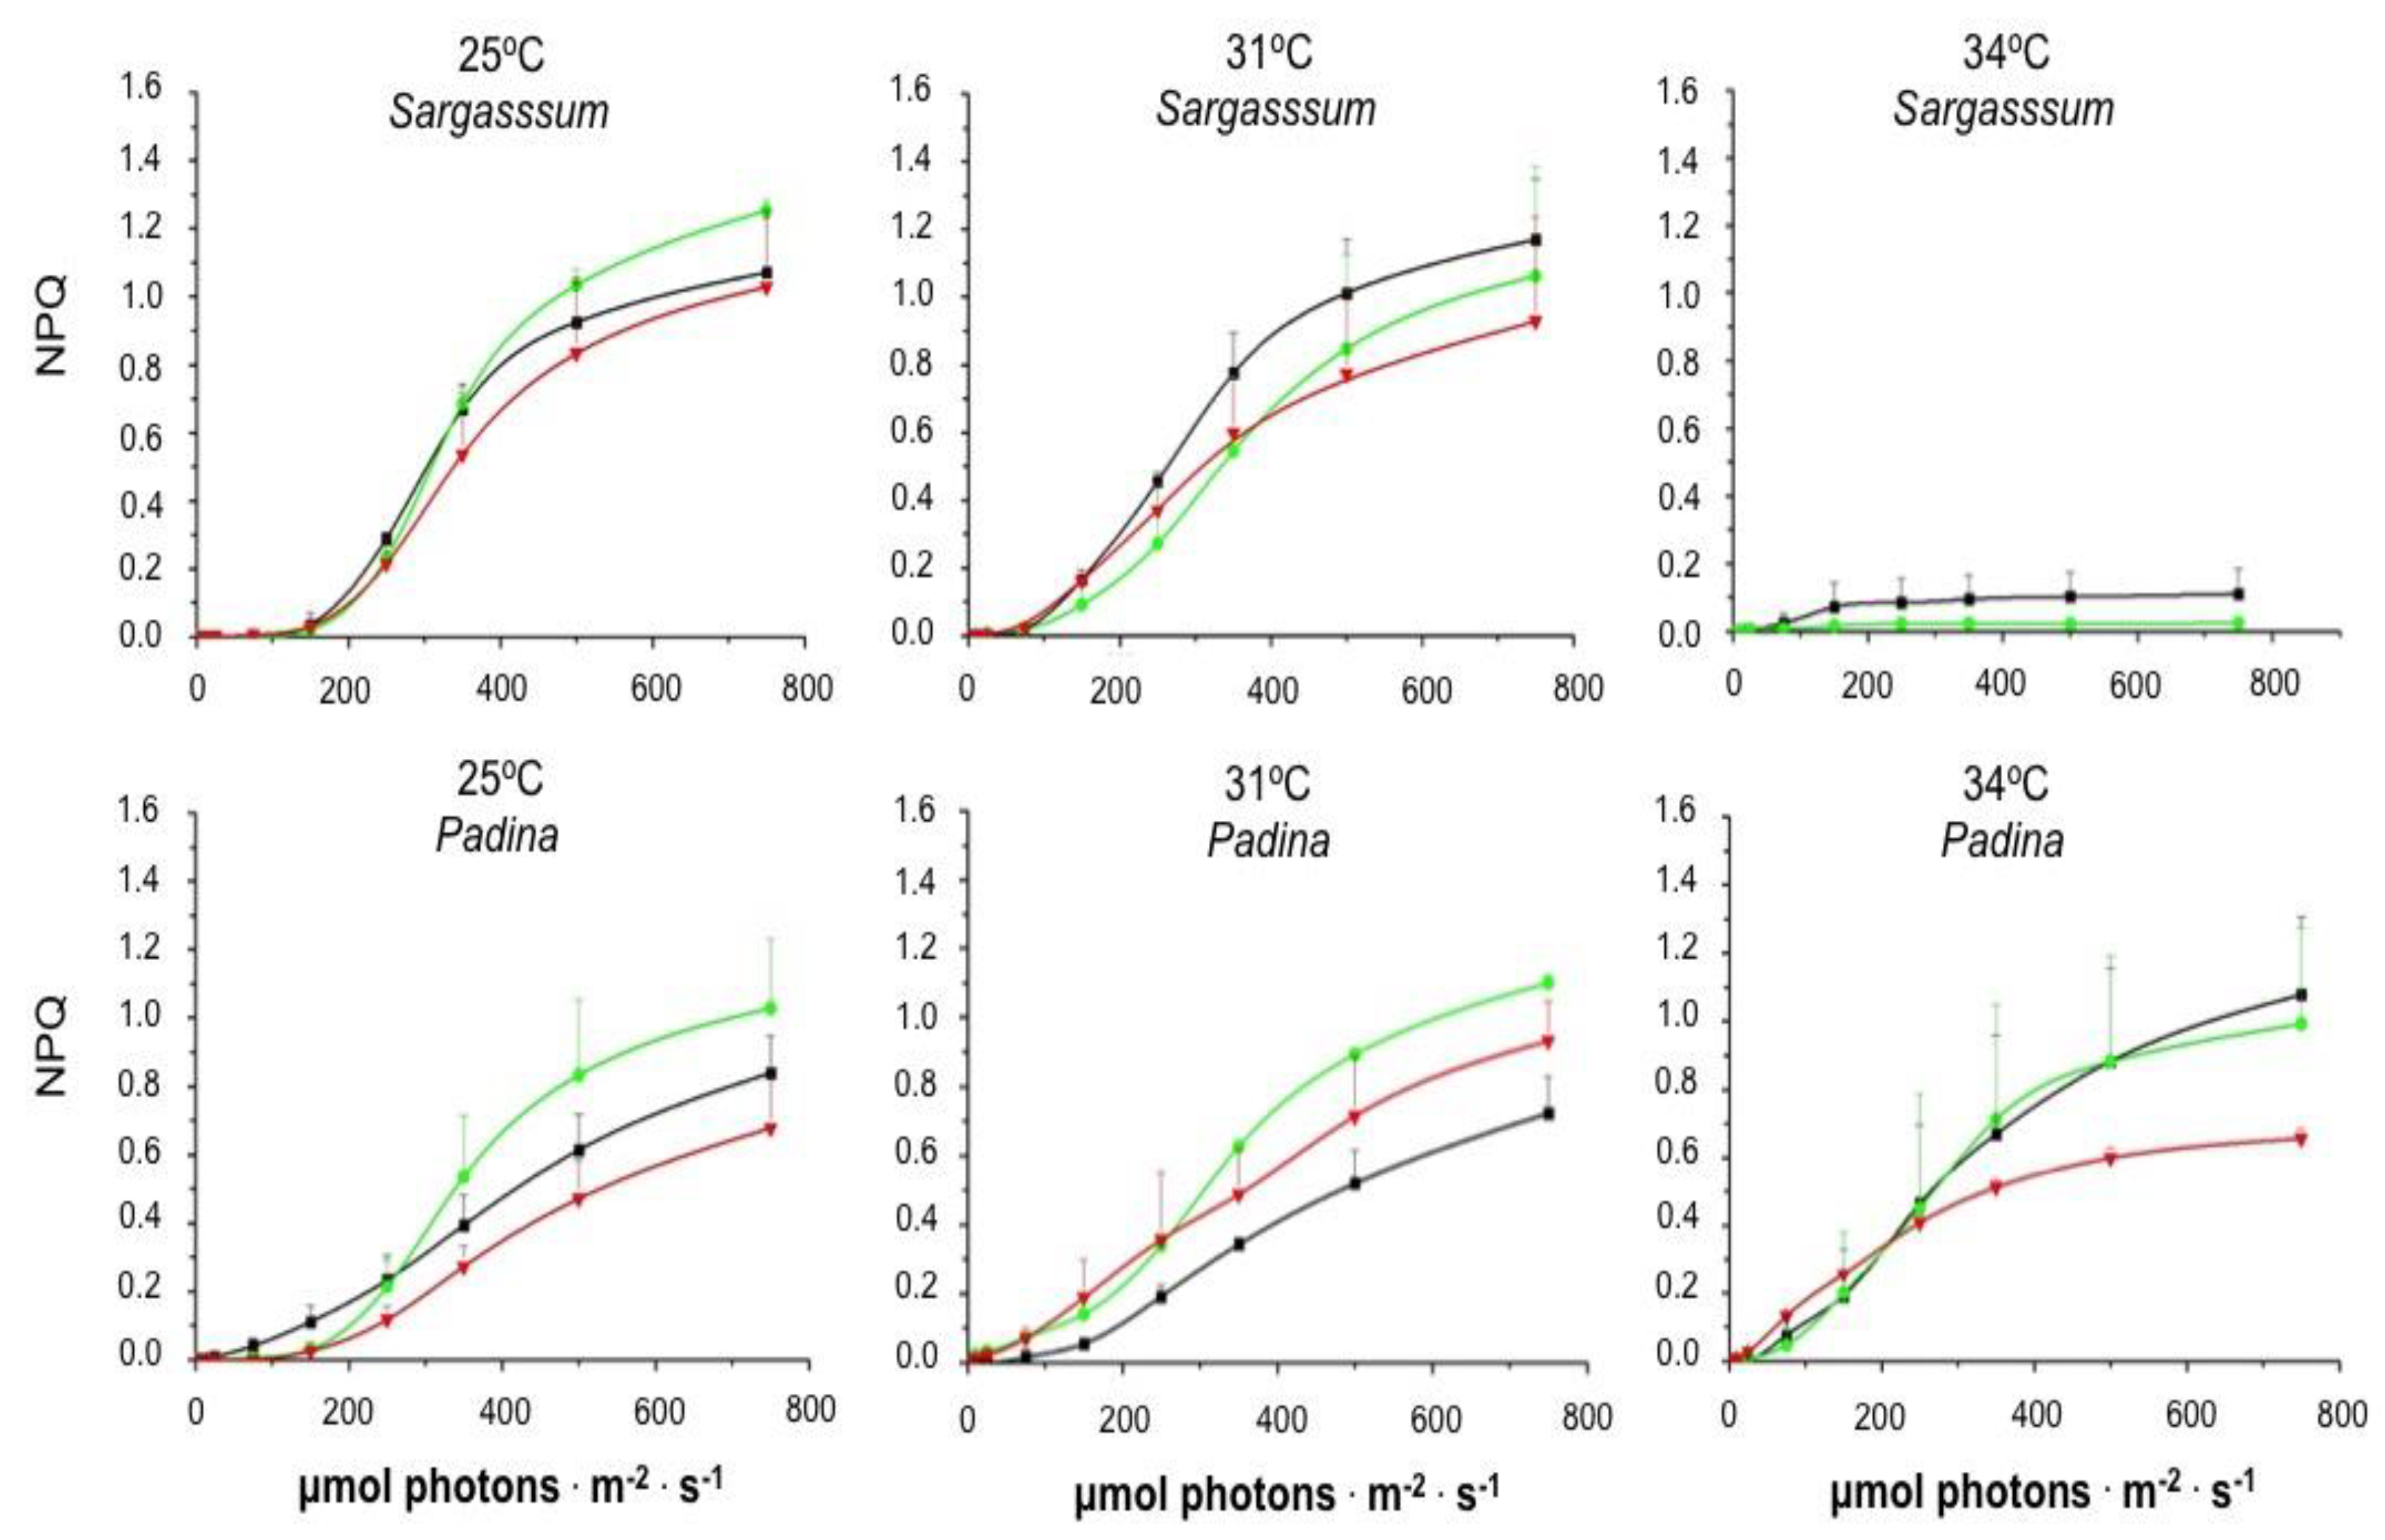
Figure 6.
Influence of temperature on the allocation of the energy absorbed by PSII antenna of Padina gymnospora cultured in the laboratory at distinct temperatures under 90 µmol photons.m-2.s-1 irradiance. Rapid Light Curves (A, C, E) were obtained just after the algae samples were taken from the culture vessel following 20 h (black lines), 40 h (green lines) and 120 h (red lines) of culturing at 25 (A), 31 (C) and 34ºC (E). The complementary quantum yields (YII in navy blue lines, YNPQ in cyan lines, and YNO in pink lines) of cultures at 25 (B), 31 (D) and 34ºC (F). The complementary quantum yield lines represent average values among the three culturing times: 20, 40 and 120 h. Means ± SD (n=3).
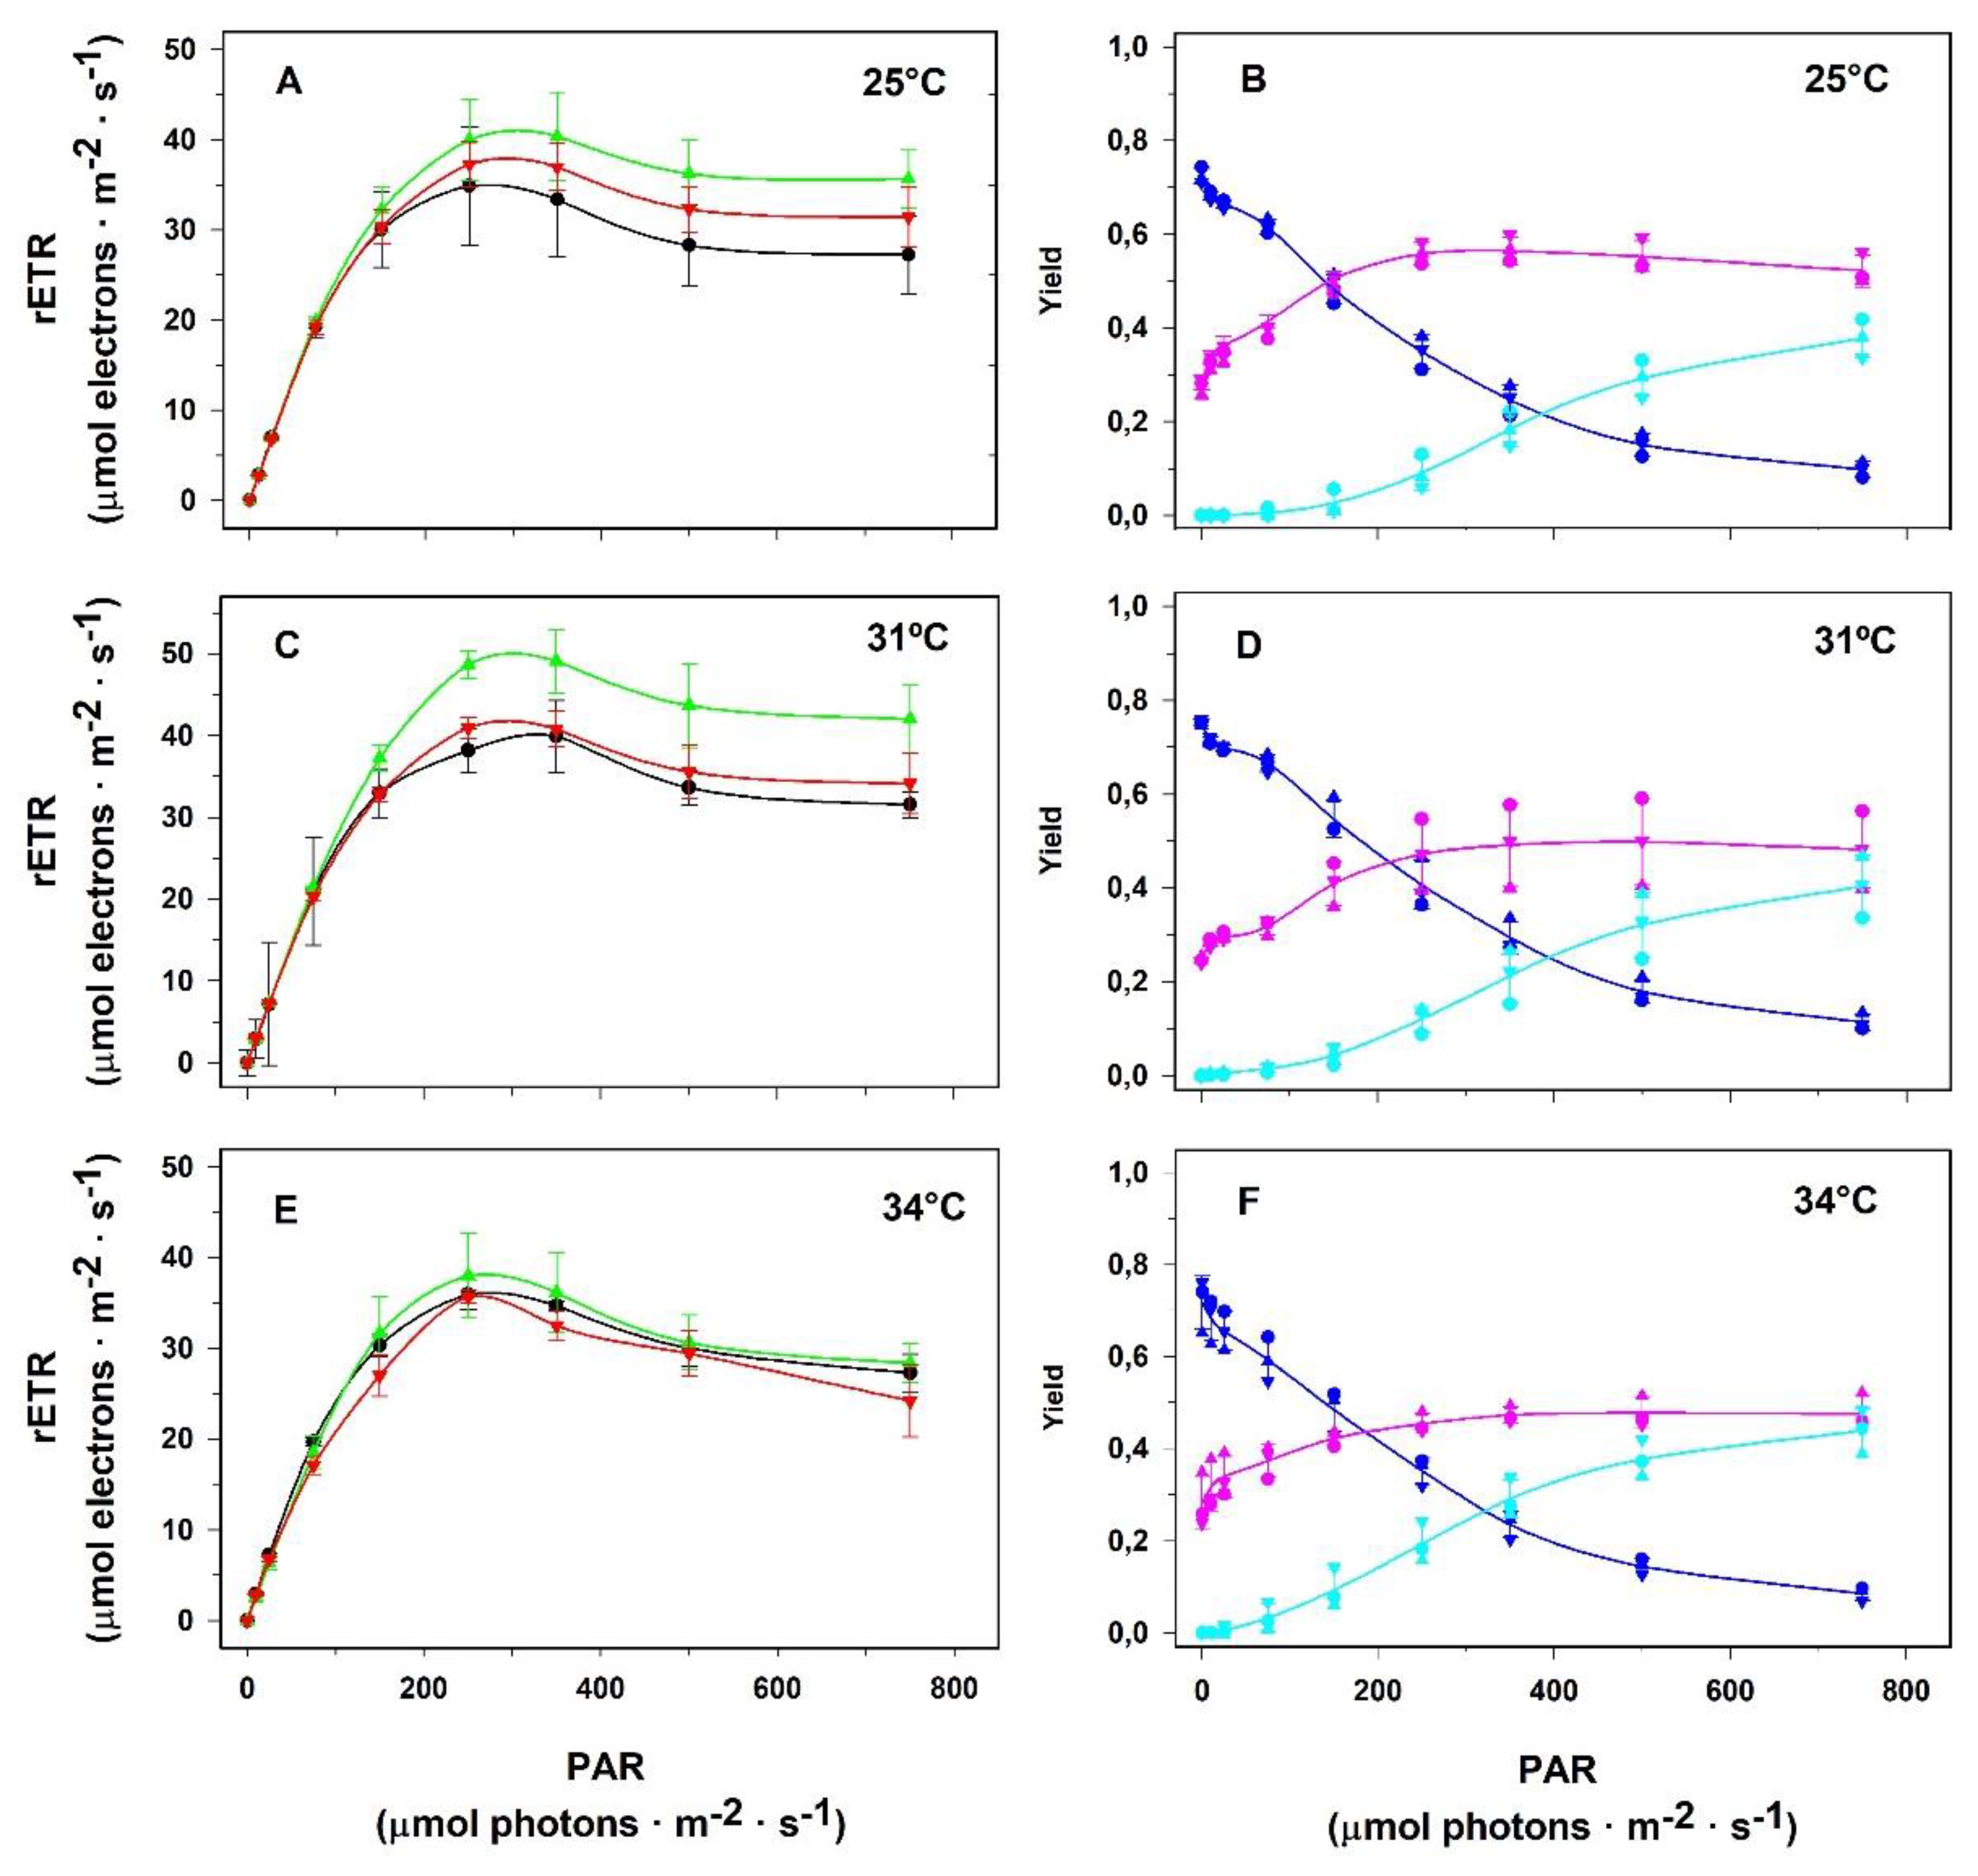
Figure 7.
Influence of temperature on the allocation of the energy absorbed by PSII antenna of Sargassum natans cultured in the laboratory at distinct temperatures under 90 µmol photons.m-2.s-1 irradiance. Rapid Light Curves (A, C, E) were obtained just after the algae samples were taken from the culture vessel following 20 h (black lines), 40 h (green lines) and 120 h (red lines) of culturing at 25 (A), 31 (C) and 34ºC (E). The complementary quantum yields (YII in navy blue lines, YNPQ in cyan lines, and YNO in pink lines) of cultures at 25 (B), 31 (D) and 34ºC (F). The complementary quantum yield lines in B represent average values among the three culturing times: 20, 40 and 120 h. In D the continuous lines represent average values of 20 and 40 h, whereas the dashed lines correspond to 120 h. In F continuous lines represent values of 20 h, whereas the dotted lines correspond to 40 h values. Plants incubated for 120 h at 34ºC did not show any photosynthetic activity. Means ± SD (n=3).
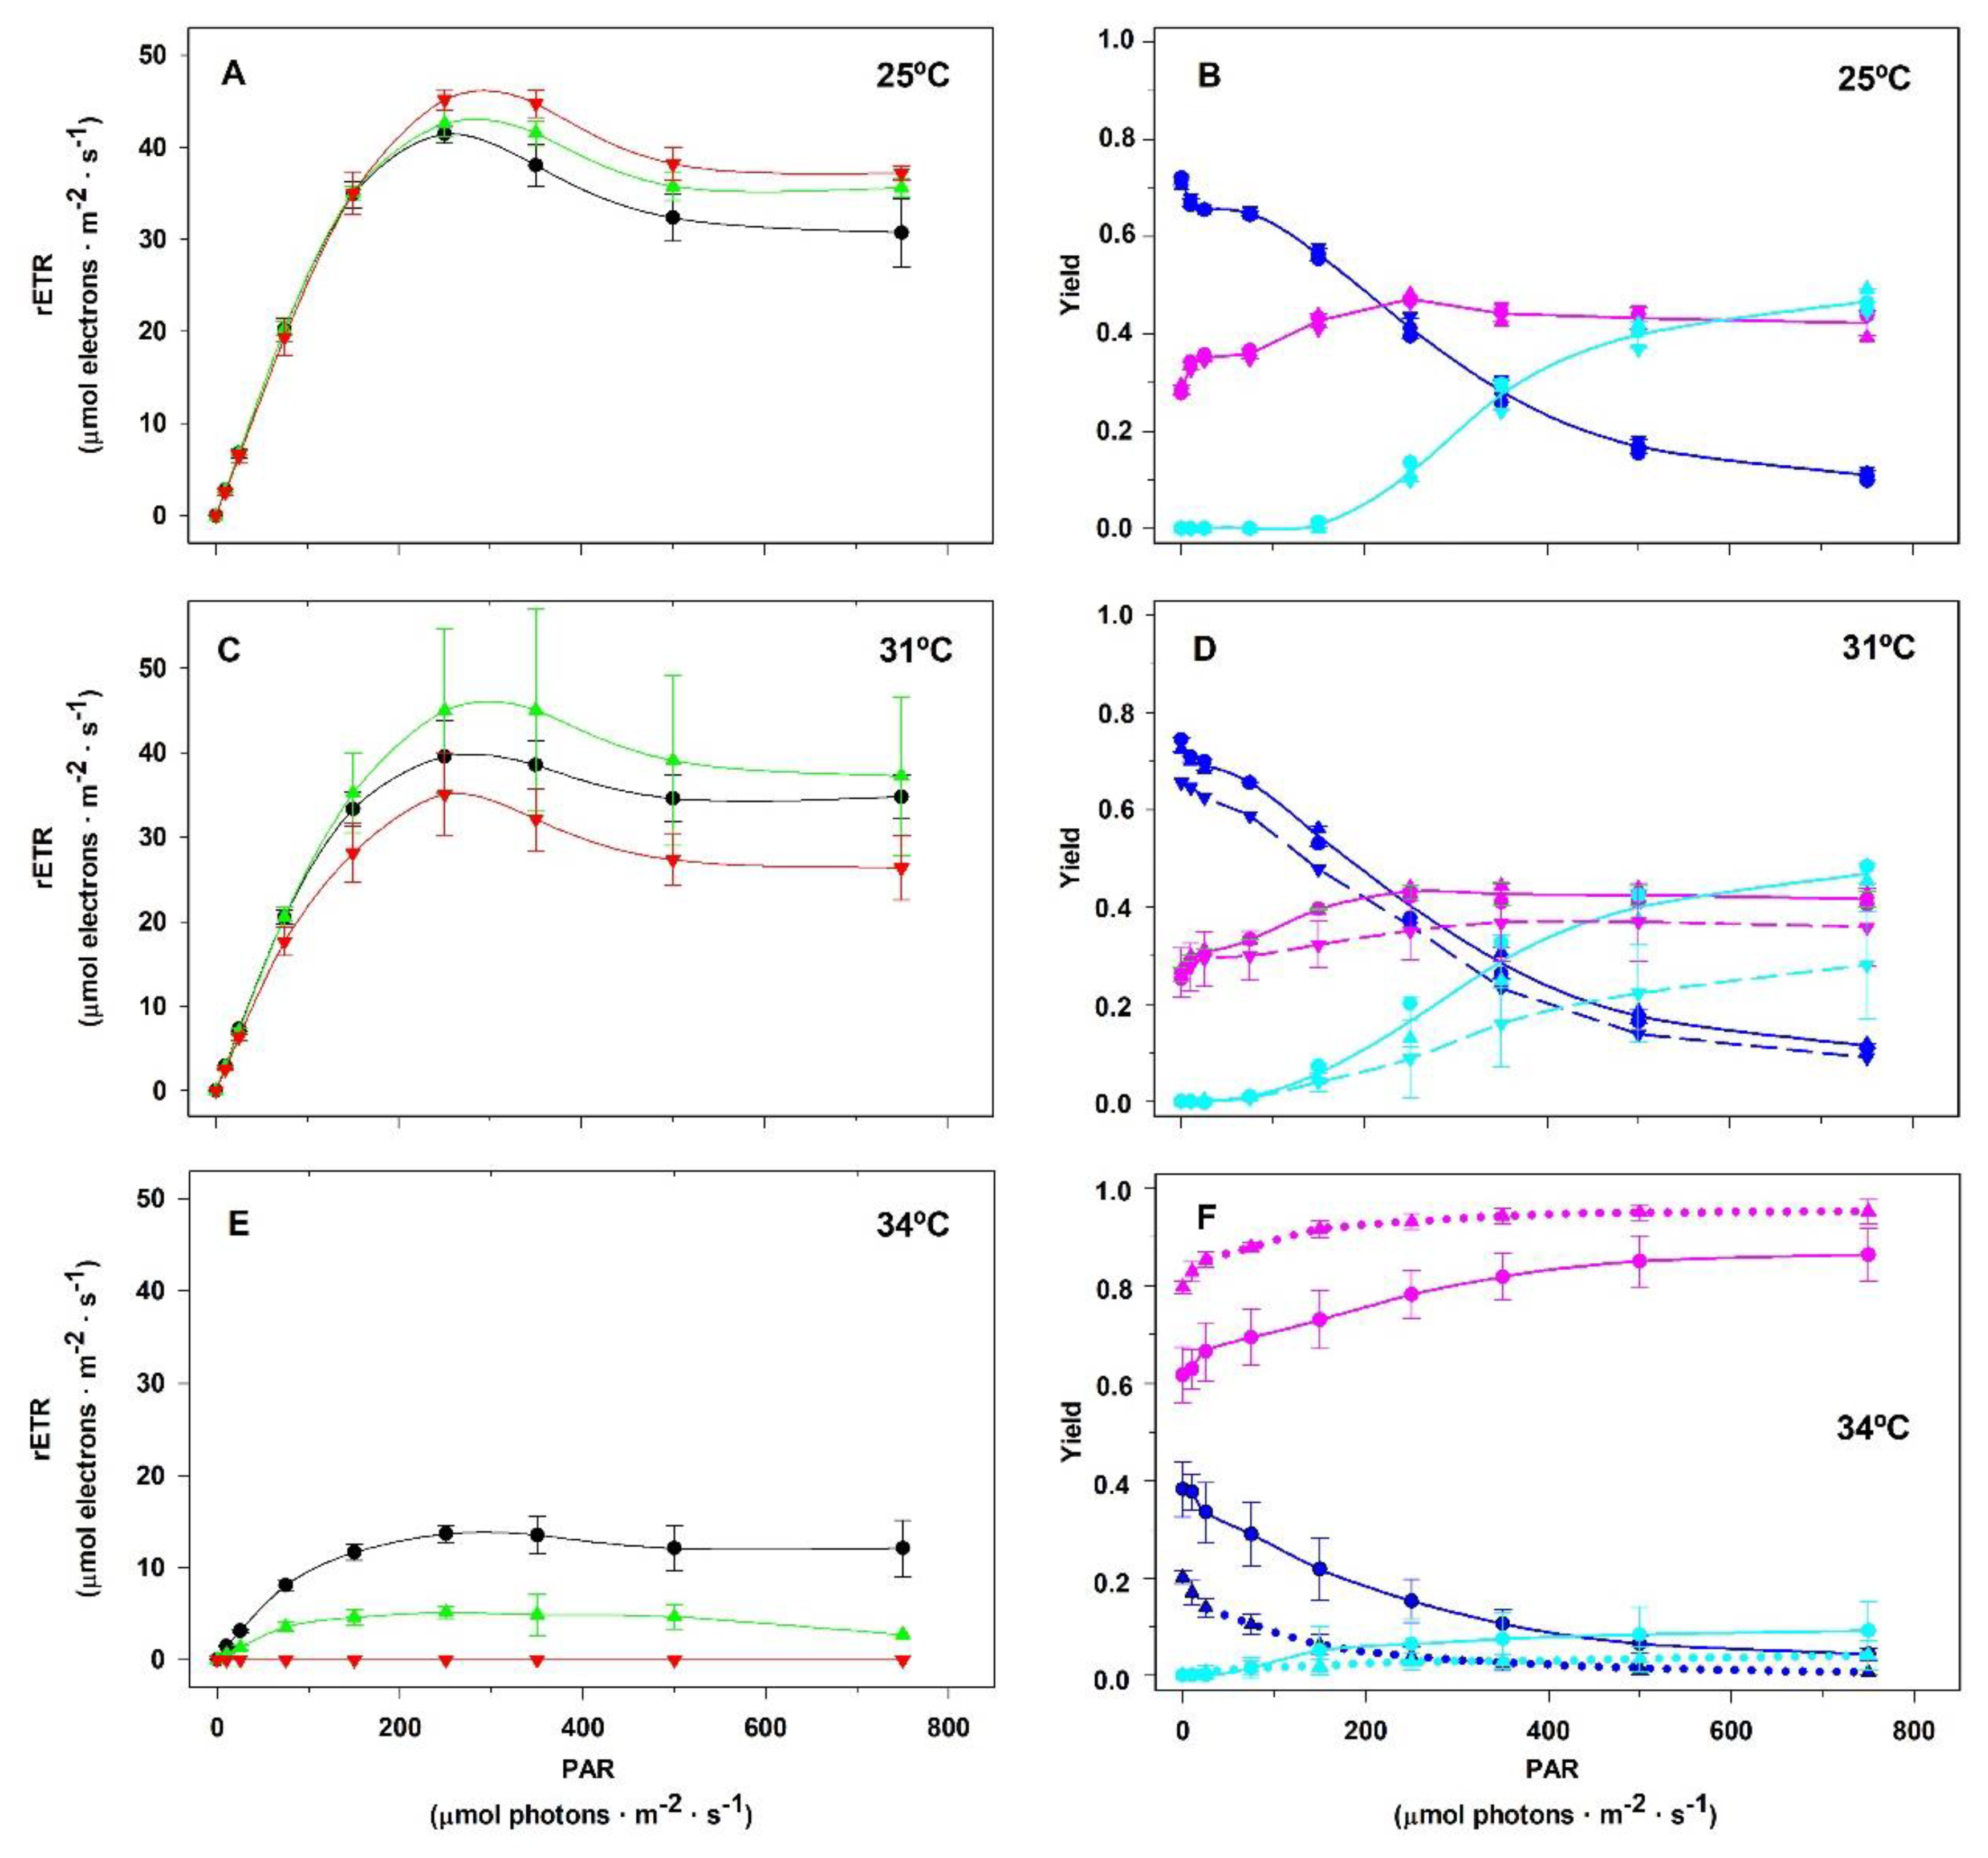

Table 1.
Diurnal variation in the maximum relative electron transport rate (rETRmax), the photosynthetic efficiency (α), and the highest value of irradiance to begin saturation of photosynthetic activity (Ek) of Sargassum natans collected at 4 m deep at different daylight intensities at 10:00, 12:00, 14:00, 16:00, and 18:00 o’clock. The times correspond to GMT -3 (Greenwich Mean Time). Means ± SD (n = 5).
|
Time (h) |
rETRmax (µmol electrons.m-2.s-1) |
α (µmol electrons)/(µmol photons) |
Ek (µmol photons.m-2.s-1) |
| 10:00 | 19.4 ± 2.0 | 0.384 ± 0.035 | 51 ± 4 |
| 12:00 | 17.8 ± 1.5 | 0.227 ± 0.048 | 62 ± 5 |
| 14:00 | 17.8 ± 1.6 | 0.422 ± 0.012 | 42 ± 3 |
| 16:00 | 16.6 ± 1.4 | 0.411 ± 0.019 | 40 ± 4 |
| 18:00 | 16.1 ± 3.3 | 0.409 ± 0.043 | 32 ± 2 |
Disclaimer/Publisher’s Note: The statements, opinions and data contained in all publications are solely those of the individual author(s) and contributor(s) and not of MDPI and/or the editor(s). MDPI and/or the editor(s) disclaim responsibility for any injury to people or property resulting from any ideas, methods, instructions or products referred to in the content. |
© 2025 by the authors. Licensee MDPI, Basel, Switzerland. This article is an open access article distributed under the terms and conditions of the Creative Commons Attribution (CC BY) license (http://creativecommons.org/licenses/by/4.0/).
Copyright: This open access article is published under a Creative Commons CC BY 4.0 license, which permit the free download, distribution, and reuse, provided that the author and preprint are cited in any reuse.


