Submitted:
31 December 2024
Posted:
03 January 2025
You are already at the latest version
Abstract
This study investigated the formation of zinc coatings incorporated with titanium dioxide (TiO2) on magnesium alloys designated as AM50 and AZ91. The coating process involved electrochemical zinc deposition, with and without concurrent electrophoresis of TiO2 particles in the deposited flux. Various analytical techniques were employed, including scanning electron microscopy (SEM), energy dispersive spectroscopy (EDS), X-ray diffraction (XRD), and electrochemical methods. The resulting zinc-TiO2 coating exhibited a titanium concentration approximately double that of the initial electrolyte. Additionally, an unexpected phase transition from rutile to anatase TiO2 was observed at room temperature. Corrosion tests revealed that while the pure zinc-coated alloys exhibited higher corrosion rates compared to their uncoated counterparts, the inclusion of TiO2 in the zinc coating slightly reduced this corrosion rate. The corrosion behavior of both the coated AM50 and AZ91 alloys differed from that of the uncoated alloys.
Keywords:
magnesium alloys
; corrosion
; titanium oxides
; electrodeposition
1. Introduction
The field of orthopedic and dental implantology has seen significant advancements in recent years, with a growing interest in biodegradable materials that can provide temporary support during tissue healing and then gradually dissolve in the body. Among these materials, magnesium alloys have emerged as promising candidates, due to their unique combination of biocompatibility, biodegradability, and mechanical properties similar to natural bone [1]. In particular, two magnesium alloys, AM50 and AZ91, have garnered attention for their potential applications in implantology [2,3].
Magnesium is an essential element in the human body, playing crucial roles in various physiological processes, including bone metabolism and tissue repair [4]. This inherent biocompatibility, coupled with the ability to tailor the degradation rates of magnesium alloys, presents an opportunity to develop implants that can gradually transfer loads to healing tissue, potentially improving the osseointegration process [5].
AM50 and AZ91 alloys, containing aluminum and manganese or aluminum and zinc, respectively, offer distinct advantages in terms of mechanical strength and corrosion resistance [6]. They show a particularly appealing promise for surgical implants such as pins, brackets, staples, and bone-fixing screws, which can dissolve during healing [8] and thus eliminate the need for removal surgery. Magnesium and its compounds are biocompatible and may even enhance bone formation [8]. However, the complex interplay between these alloys and the biological environment necessitates a thorough investigation of their biocompatibility and osseointegration properties [7]. Understanding these interactions is crucial for optimizing implant design and ensuring safe and effective clinical applications.
Two main challenges currently hinder widespread adoption of these implant materials: uncontrolled biodegradation rates, and suboptimal osseointegration. While magnesium shows better osseointegration than titanium, the metal-bone tissue interface remains problematic [10,11,12,13,14,15].
This study proposes a method to accelerate magnesium alloy dissolution by applying a more cathodic metal coating. To improve osseointegration, titanium dioxide (TiO2) particles were incorporated into the coating. TiO2 has demonstrated bactericidal properties and enhanced bone tissue integration [16,17,18], but its impact on magnesium substrate corrosion requires investigation.
Our research compared the morphology and corrosion properties of three systems: uncoated AM50 and AZ91 magnesium alloys, zinc-coated alloys, and zinc-coated alloys with impregnated TiO2 particles.
2. Materials and Methods
Rectangular 20x20x1 mm plates of AM50 and AZ91 alloys (China Royal Group Ltd., Tianjin, China) were ground with diamond paper #340, #500, #1200 and #2000, and then degreased in acetone in an ultrasonic bath and rinsed in distilled water. After drying, a current lead was attached to a specimen and the whole bunch was sealed by a polymer film so that only a 1 cm diameter round window (area 1 cm2) was available to further electrochemical treatment.
Zinc coating was produced in potentiostatic mode in a three-electrode cell under the potential of -1.3V vs. Ag|AgCl during 40 minutes.
The electrolyte contained 100 g/L ZnSO4, 15 g CH3COONa, 50 g/L MgSO4, 200 mL/L glycerol the prepared zinc coating, along with 1 g/L micron-sized particles of TiO2 rutile (Sigma Aldrich), and the electrolyte suspension was shaken for 72 hours.
The corrosion resistance was determined on a potentiostat (Ivium-n-Stat; Ivium Technologies, Eindhoven, Netherlands) by linear polarization resistance (LPR) and Tafel slope extrapolation (TSE) using a three-electrode cell, where an Ag|AgCl electrode served as the reference electrode, and a platinum wire was the counter electrode. All the corrosion tests were performed in 3 wt. % NaCl solution.
The surface morphology and elemental composition were characterized by scanning electron microscope (SEM; TriglavTM TESCAN MAIA3) equipped with an energy dispersive spectroscopy (EDS) analyser (AZteq, Oxford, UK). The Phi-Rho-Z (PROZA) correction method was used for quantization.
An x-ray diffractometer (X’Pert Pro; PANalytical B.V., Eindhoven, Netherlands) with Cu Kα radiation (λ = 0.154 nm) was used with full pattern identification by the X’Pert HighScore-Plus software package (PANalytical B.V.; version 2.2e/ 2.2.5). Materials identification and analysis were performed using the Powder Diffraction FileTM (PDF®; ICDD, USA; v.2, 2009). Phase analysis identification was performed at 40 kV and 40 mA. The XRD patterns were recorded via grazing incidence x-ray diffraction (GIXD) with the geometry α = 1◦ and 5◦ in the 20–80◦ range (step size was 0.05◦ and the time per step was 2 s).
When calculating the scattering of titanium particles, the coding which helps us understand it quantitatively is briefly presented here. In the first step, a mapping analysis was performed using EDS analysis. After receiving the image, a cut was made to a perfect square shape that can be cut into smaller perfect squares. In each small square, the number of particles was counted. Since the size of the squares is fixed, the density of the points is the critical part with which we can examine the scattering. Figure 1 shows the simulation for the cutting and point-counting process. After checking the return density in each subarea, a standard deviation test was performed to estimate the uniformity of the scattering.
Pseudocode:
1. Upload an image to Python as a jpg file.
2. Crop the image to size n*n.
3. Crop the image into K images.
4. Count the dots drawn in each image of size n*n.
5. Create a graph in which the number of dots in each image is recorded.
6. Calculate the standard deviation of the number of dots and the overall average of the dots.
7. Analysis.
3. Results & Discussion
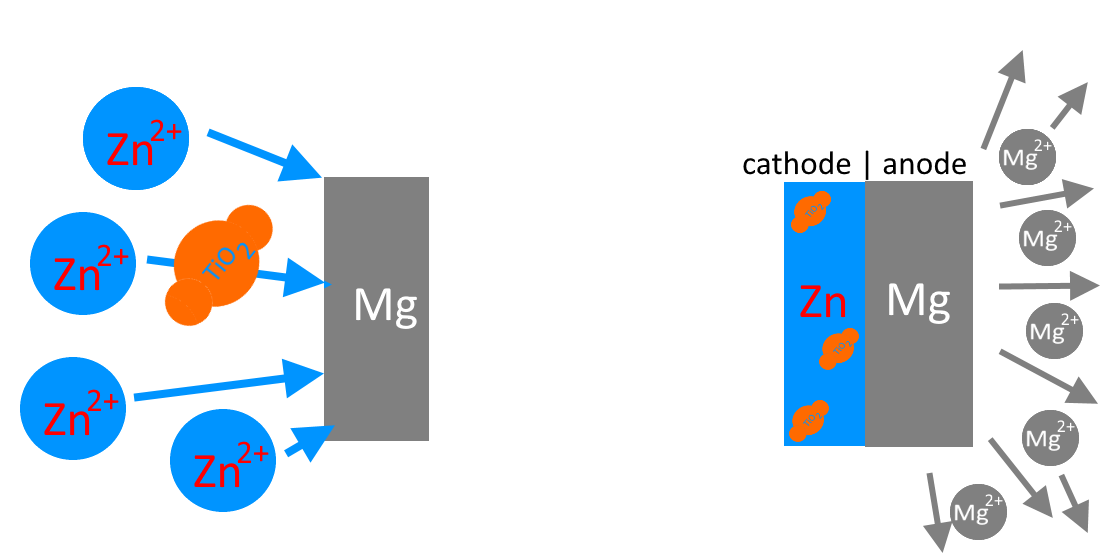
The formation of a zinc-titanium dioxide layer in an electrolyte involves the following processes: (a) reduction of zinc from the electrolyte solution (b) adsorption of TiO2 particles onto the sample surface. The critical aspect is the balance between the rates of these two competing processes.
Since the rate of the first process is quite high, it was important to select the concentration of TiO2 and the particle size to ensure the transfer and deposition of these particles on the sample.
Zn2+→ Zn0
[Zn2+ -TiO2]→ [Zn0 – TiO2] - transport of titanium dioxide particles to the sample surface by zinc cations
The coatings produced on the surface of AM50 are shown in Figure 3. As seen in Figure 3b, the zinc formed a cracked, continuous layer. The cracks were obviously the result of the heteroepitaxial growth of zinc (HCP lattice, d = 0.266 nm) on the magnesium substrate (HCP lattice, d = 0.320 nm) [18].
When titanium dioxide was present in the coating (Figure 3c), the surface appearance changed unexpectedly: TiO2 did not form a distinct surface phase, which would have shown as darker spots in a BSE image. (The atomic mass of titanium is 48 amu, while that of zinc is 65 amu.) Instead, the granular structure of the zinc containing TiO2 (Figure 3c) was considerably finer than that of pure zinc (Figure 3b).
SEM analysis of the electrodeposited coatings on AZ91 substrate is presented in Figure 4. The zinc coating morphology, depicted in Figure 4b, exhibited a continuous layer characterized by distinctive crack formation, analogous to observations made on the AM50 substrate. The incorporation of TiO2 into the coating structure (Figure 4c) resulted in notable grain refinement. Back-scattered electron (BSE) imaging revealed the absence of distinct TiO2 surface phases, which would manifest as regions of lower contrast due to the atomic mass differential between titanium (48 amu) and zinc (65 amu).
The mass ratio of zinc sulfate to titanium dioxide in the electrolyte was ZnSO4:TiO2 = 100:1; the corresponding nominal atomic ratio Zn:Ti = 50:1. According to EDS spectrum and EDS mapping (Figure 5 and Figure 6), the observed ratio was Zn:Ti = 24:1 in AM 50 and Zn:Ti = 46:1 in AZ91. This confirmed that the efficacy of the co-deposition of TiO2 powder in the flux of zinc ions was very high; the surface concentration of titanium in zinc was twice as high as its initial concentration in the electrolyte. As is seen from the Ti mapping image in Figure 5 and Figure 6, titanium was very evenly distributed on the surface.
Figure 7 presents comparative SEM micrographs obtained before and after corrosion testing. While visual inspection at fixed magnification reveals no substantial morphological differences, the scattered signal intensity exhibits notable enhancement across all observation distances. To quantitatively characterize the TiO2 scattering behavior, we analyzed the spatial distribution of reflected light intensity per unit area using EDS mapping. The resulting high-resolution images were processed to account for potential artifacts arising from signal interference, including overlapping effects and background noise. Statistical analysis was performed using Python-based image processing algorithms to isolate and quantify reflection intensities. The standard deviation of these measurements was calculated to enable quantitative comparison of the previously qualitative observations, with results summarized in Table 1.
In the XRD spectra of AM50 and AZ91, the peaks of the XRD pattern were typical for these two alloys before corrosion. The appearance of the Mg and Zn oxide phase (peak growth) after corrosion testing (red spectrum in Figs. 7 and 9) showed an obvious oxidation process of Mg and Zn in the surface layer of the coating. Along with this, the rutile phase remained unchanged, both quantitatively and qualitatively, before and after corrosion testing.
Polarization curves mapping the corrosion of the alloy AM50 in 3 wt. % NaCl at room temperature are shown in Figure 10, and the corresponding corrosion currents and potentials are given in Table 2.
As demonstrated in Figure 10, the application of a zinc coating resulted in a shift of the alloy toward more noble potentials. This behavior aligns with fundamental electrochemical principles, given that zinc exhibits a significantly higher standard electrode potential (Eo = -0.76V) compared to magnesium (Eo = -2.37V) [15]. This electrochemical nobility difference creates a galvanic coupling between the coating and substrate, establishing the theoretical basis for sacrificial protection of the magnesium alloy.
However, the experimental data revealed an interesting contradiction: The corrosion current densities for the zinc-coated specimens were observed to be two to three times greater than those measured for the uncoated AM50 alloy. While the zinc coating provided initial protective benefits through its sacrificial nature, once corrosion initiation occurred, the degradation process proceeded at a substantially accelerated rate compared to the uncoated magnesium alloy. This acceleration can be attributed to the galvanic coupling effect between zinc and magnesium, which, while providing cathodic protection, simultaneously increases the overall corrosion rate.
The polarization curves exhibited characteristic features typical of magnesium alloy corrosion behavior, with cathodic Tafel slopes consistently exceeding their anodic counterparts for all specimens (Figure 10). Both the uncoated and zinc-coated AM50 alloy demonstrated polarization curves characteristic of magnesium alloys under cathodic control [13,14]. However, a notable transition toward mixed control was observed when AM50 was coated with zinc, regardless of TiO2 presence. This observation correlates well with the established theory regarding the corrosion mechanism of magnesium alloys in NaCl solutions, which posits that corrosion initiation occurs through the breakdown of the protective surface film by chloride anions [13]. The zinc coating serves as a partial barrier, moderating the access of chloride ions to the magnesium substrate, thereby altering the corrosion mechanism from predominantly cathodic to a more mixed control process. This transition in corrosion control mechanism provides strong evidence for the development of galvanic corrosion processes in the zinc-coated specimens.
LPR plots (Figure 11) demonstrated results similar to those of Tafel slope extrapolation (Table 2) and confirmed an accelerated corrosion after coating the magnesium alloy with zinc. The presence of TiO2 particles in the zinc layer resulted in a corrosion current slightly smaller than for zinc only, but higher than for the uncoated AM50.
The electrochemical behavior of the AZ91 alloy demonstrated distinctive characteristics that merit detailed examination. A notable shift toward noble potential was observed, aligning with previously established mechanistic frameworks for magnesium alloy corrosion. The corrosion current density measurements revealed substantial differences in degradation kinetics between coated and uncoated specimens [19]. Specifically, the uncoated AZ91 substrate exhibited corrosion current values approximately twice those of the zinc-TiO2 coated samples, providing quantitative evidence for the protective efficacy of the composite coating system.
This enhanced corrosion resistance can be primarily attributed to the elevated aluminum content (mass %) in AZ91 compared to AM50 [20]. The increased aluminum concentration plays a crucial role through multiple mechanisms: first, by promoting the formation of a more stable protective oxide layer (Al2O3) that acts as a passive barrier [21]; second, by contributing to the ennoblement of the electrochemical potential through the formation of intermetallic phases (primarily Mg17Al12) [22]; and third, by modifying the microstructural characteristics of the alloy [23]. These combined effects result in a significant alteration of the system’s overall corrosion behavior, particularly in terms of both initiation and propagation kinetics.
Analysis of the polarization curves (Figure 12) revealed a consistent pattern where cathodic Tafel slopes exceeded their anodic counterparts across all specimen configurations. This characteristic polarization behavior, indicative of cathodic control, aligns with the typical electrochemical responses documented for magnesium alloys. The preservation of this cathodic control mechanism in both uncoated and zinc-electrodeposited AZ91 substrates suggests that while the composite coating modifies the corrosion rates, it does not fundamentally alter the underlying electrochemical reaction mechanisms. This maintenance of cathodic control implies that the rate-determining step in the corrosion process remains associated with the cathodic partial reaction, specifically the reduction of water and evolution of hydrogen, which is characteristic of magnesium alloy corrosion in aqueous environments.
LPR measurements (Figure 13) corroborated the findings obtained through Tafel slope extrapolation analysis (Table 3), validating the observed reduction in corrosion kinetics following zinc electrodeposition on the magnesium alloy substrate. Furthermore, the incorporation of TiO2 particles into the zinc matrix resulted in diminished corrosion current densities, compared to both pure zinc coatings and uncoated AM50 specimens.
4. Conclusions
The incorporation of TiO2 particles into zinc electrodeposits on AM50 and AZ91 magnesium alloys demonstrated remarkable efficiency, with titanium concentrations in the coating exceeding that of the initial electrolyte suspension. Microstructural analysis revealed that TiO2-modified zinc coatings exhibited refined granular morphology, compared to pure zinc deposits.
Electrochemical characterization revealed substrate-dependent corrosion behavior. For AM50, the continuous zinc coating initially provided corrosion resistance; however, once initiated, the corrosion rate accelerated beyond that of the uncoated substrate. Conversely, AZ91 exhibited enhanced corrosion resistance with zinc coating, which was further improved by TiO2 incorporation. Although the TiO2 addition marginally decreased corrosion rates in zinc coatings for both alloys, the AM50 substrate maintained higher degradation rates, compared to its uncoated counterpart.
The surface concentration of titanium dioxide particles exhibited high values for both alloy specimens, as quantified in Table 1. The particle density remained nearly constant between the initial post-deposition state and subsequent corrosion exposure, suggesting robust adhesion characteristics and uniform spatial distribution of the TiO2 particles across the substrate surface. The stability of particles under corrosive conditions can be attributed to the optimization of the electrodeposition parameters, specifically the current density and pulse frequency, which were found to significantly influence the incorporation and anchoring of TiO2 particles within the zinc matrix.
The corrosion mechanism analysis indicated a transition from localized chloride attack on uncoated alloys to predominantly galvanic corrosion in zinc-coated specimens. This modification of the degradation mechanism could enable tailored corrosion rates, which is particularly beneficial for AZ91. Given that AM50 exhibited accelerated dissolution, this property could be advantageously applied in the development of biodegradable magnesium implants where controlled degradation rates are crucial for prosthetic applications.
Author Contributions
Conceptualization, Svetlana Lugovskoy and Harel Cohen.; methodology, Svetlana Lugovskoy.; formal analysis, Aviva Fredj Elias and Harel Cohen; writing Svetlana Lugovskoy, Aviva Fredj Elias.; visualization, Aviva Fredj Elias, Harel Cohen. All authors have read and agreed to the published version of the manuscript.
Acknowledgments
We would like to express our sincere gratitude to Dr. Tamara Brider for SEM images, Dr. A. Kossenko for XRD analysis.
Conflicts of Interest
The authors declare no conflict of interest.
References
- Witte, F. The history of biodegradable magnesium implants: A review. Acta Biomater. 2010, 6, 1680–1692. [CrossRef]
- Gu, X.-N.; Zheng, Y.-F. A review on magnesium alloys as biodegradable materials. Front. Mater. Sci. China 2010, 4, 111–115. [CrossRef]
- Song, G. Control of biodegradation of biocompatable magnesium alloys. Corros. Sci. 2007, 49, 1696–1701. [CrossRef]
- Staiger, M.P.; Pietak, A.M.; Huadmai, J.; Dias, G. Magnesium and its alloys as orthopedic biomaterials: A review. Biomaterials 2006, 27, 1728–1734. [CrossRef]
- Zheng, Y.F.; Gu, X.N.; Witte, F. Biodegradable metals. Mat. Sci. Eng: R 2014, 77, 1-34.
- Agarwal, S.; Curtin, J.; Duffy, B.; Jaiswal, S. Biodegradable magnesium alloys for orthopaedic applications: A review on corrosion, biocompatibility and surface modifications. Mater. Sci. Eng. C 2016, 68, 948–963. [CrossRef]
- Kirkland, N.; Birbilis, N.; Staiger, M. Assessing the corrosion of biodegradable magnesium implants: A critical review of current methodologies and their limitations. 2011, 8, 925–936. [CrossRef]
- Galli, S.; Stocchero, M.; Andersson, M.; Karlsson, J.; He, W.; Lilin, T.; Wennerberg, A.; Jimbo, R. The effect of magnesium on early osseointegration in osteoporotic bone: a histological and gene expression investigation. Osteoporos. Int. 2017, 28, 2195–2205. [CrossRef]
- Castellani, C.; Lindtner, R.A.; Hausbrandt, P.; Tschegg, E.; Stanzl-Tschegg, S.E.; Zanoni, G.; Beck, S.; Weinberg, A.-M. Bone–implant interface strength and osseointegration: Biodegradable magnesium alloy versus standard titanium control. Acta Biomater. 2011, 7, 432–440. [CrossRef]
- Radha, R.; Sreekanth, D. Insight of magnesium alloys and composites for orthopedic implant applications – a review. J. Magnes. Alloy. 2017, 5, 286–312. [CrossRef]
- Huynh, V.; Ngo, N.K.; Golden, T.D. Surface Activation and Pretreatments for Biocompatible Metals and Alloys Used in Biomedical Applications. Int. J. Biomater. 2019, 2019, 1–21. [CrossRef]
- Negahban, A.; Shamsi, M.; Sedighi, M. Advances in the modification of magnesium-based biomaterials to address corrosion and corrosion-fatigue: A review of developments and prospects. J. Mater. Res. Technol. 2024, 30, 4064–4108. [CrossRef]
- Pardo, A.; Merino, M.; Coy, A.; Arrabal, R.; Viejo, F.; Matykina, E. Corrosion behaviour of magnesium/aluminium alloys in 3.5wt.% NaCl. Corros. Sci. 2008, 50, 823–834. [CrossRef]
- Liang, J.; Hu, L.; Hao, J. Preparation and characterization of oxide films containing crystalline TiO2 on magnesium alloy by plasma electrolytic oxidation. Electrochimica Acta 2007, 52, 4836–4840. [CrossRef]
- Wang, P.; Liu, D.-X.; Li, J.-P.; Guo, Y.-C.; Yang, Z. Growth process and corrosion resistance of micro-arc oxidation coating on Mg-Zn-Gd magnesium alloys. Trans. Nonferrous Met. Soc. China 2010, 20, 2198–2203. [CrossRef]
- Nahum, E.Z.; Lugovskoy, A.; Lugovskoy, S.; Sobolev, A. Surface Properties of Ti65Zr Alloy Modified with TiZr Oxide and Hydroxyapatite. Nanomaterials 2023, 14, 15. [CrossRef]
- Jäger, M.; Jennissen, H.P.; Dittrich, F.; Fischer, A.; Köhling, H.L. Antimicrobial and Osseointegration Properties of Nanostructured Titanium Orthopaedic Implants. Materials 2017, 10, 1302. [CrossRef]
- Khan, A.R.; Grewal, N.S.; Zhou, C.; Yuan, K.; Zhang, H.-J.; Jun, Z. Recent advances in biodegradable metals for implant applications: Exploring in vivo and in vitro responses. Results Eng. 2023, 20. [CrossRef]
- Arrabal, R.; Matykina, E.; Pardo, A.; Merino, M.; Paucar, K.; Mohedano, M.; Casajús, P. Corrosion behaviour of AZ91D and AM50 magnesium alloys with Nd and Gd additions in humid environments. Corros. Sci. 2012, 55, 351–362. [CrossRef]
- Song, G.; Atrens, A. Understanding Magnesium Corrosion—A Framework for Improved Alloy Performance. Adv. Eng. Mater. 2003, 5, 837–858. [CrossRef]
- Corrosion of magnesium and its alloys. Corrosion Science. 2009, 51(8), 1733–1737.
- Cao F. et al. Corrosion of ultra-high-purity Mg in 3.5% NaCl solution saturated with Mg(OH)2. Corrosion Science, 2013, 75, 78–99.
- Milz, M.P.; Wirtz, A.; Abdulgader, M.; Kalenborn, A.; Biermann, D.; Tillmann, W.; Walther, F. Corrosion Fatigue Behavior of Twin Wire Arc Sprayed and Machine Hammer Peened ZnAl4 Coatings on S355 J2C + C Substrate. Corros. Mater. Degrad. 2022, 3, 127–141. [CrossRef]
Figure 1.
Simulation for scattering of titanium particles, the point-counting and cutting process
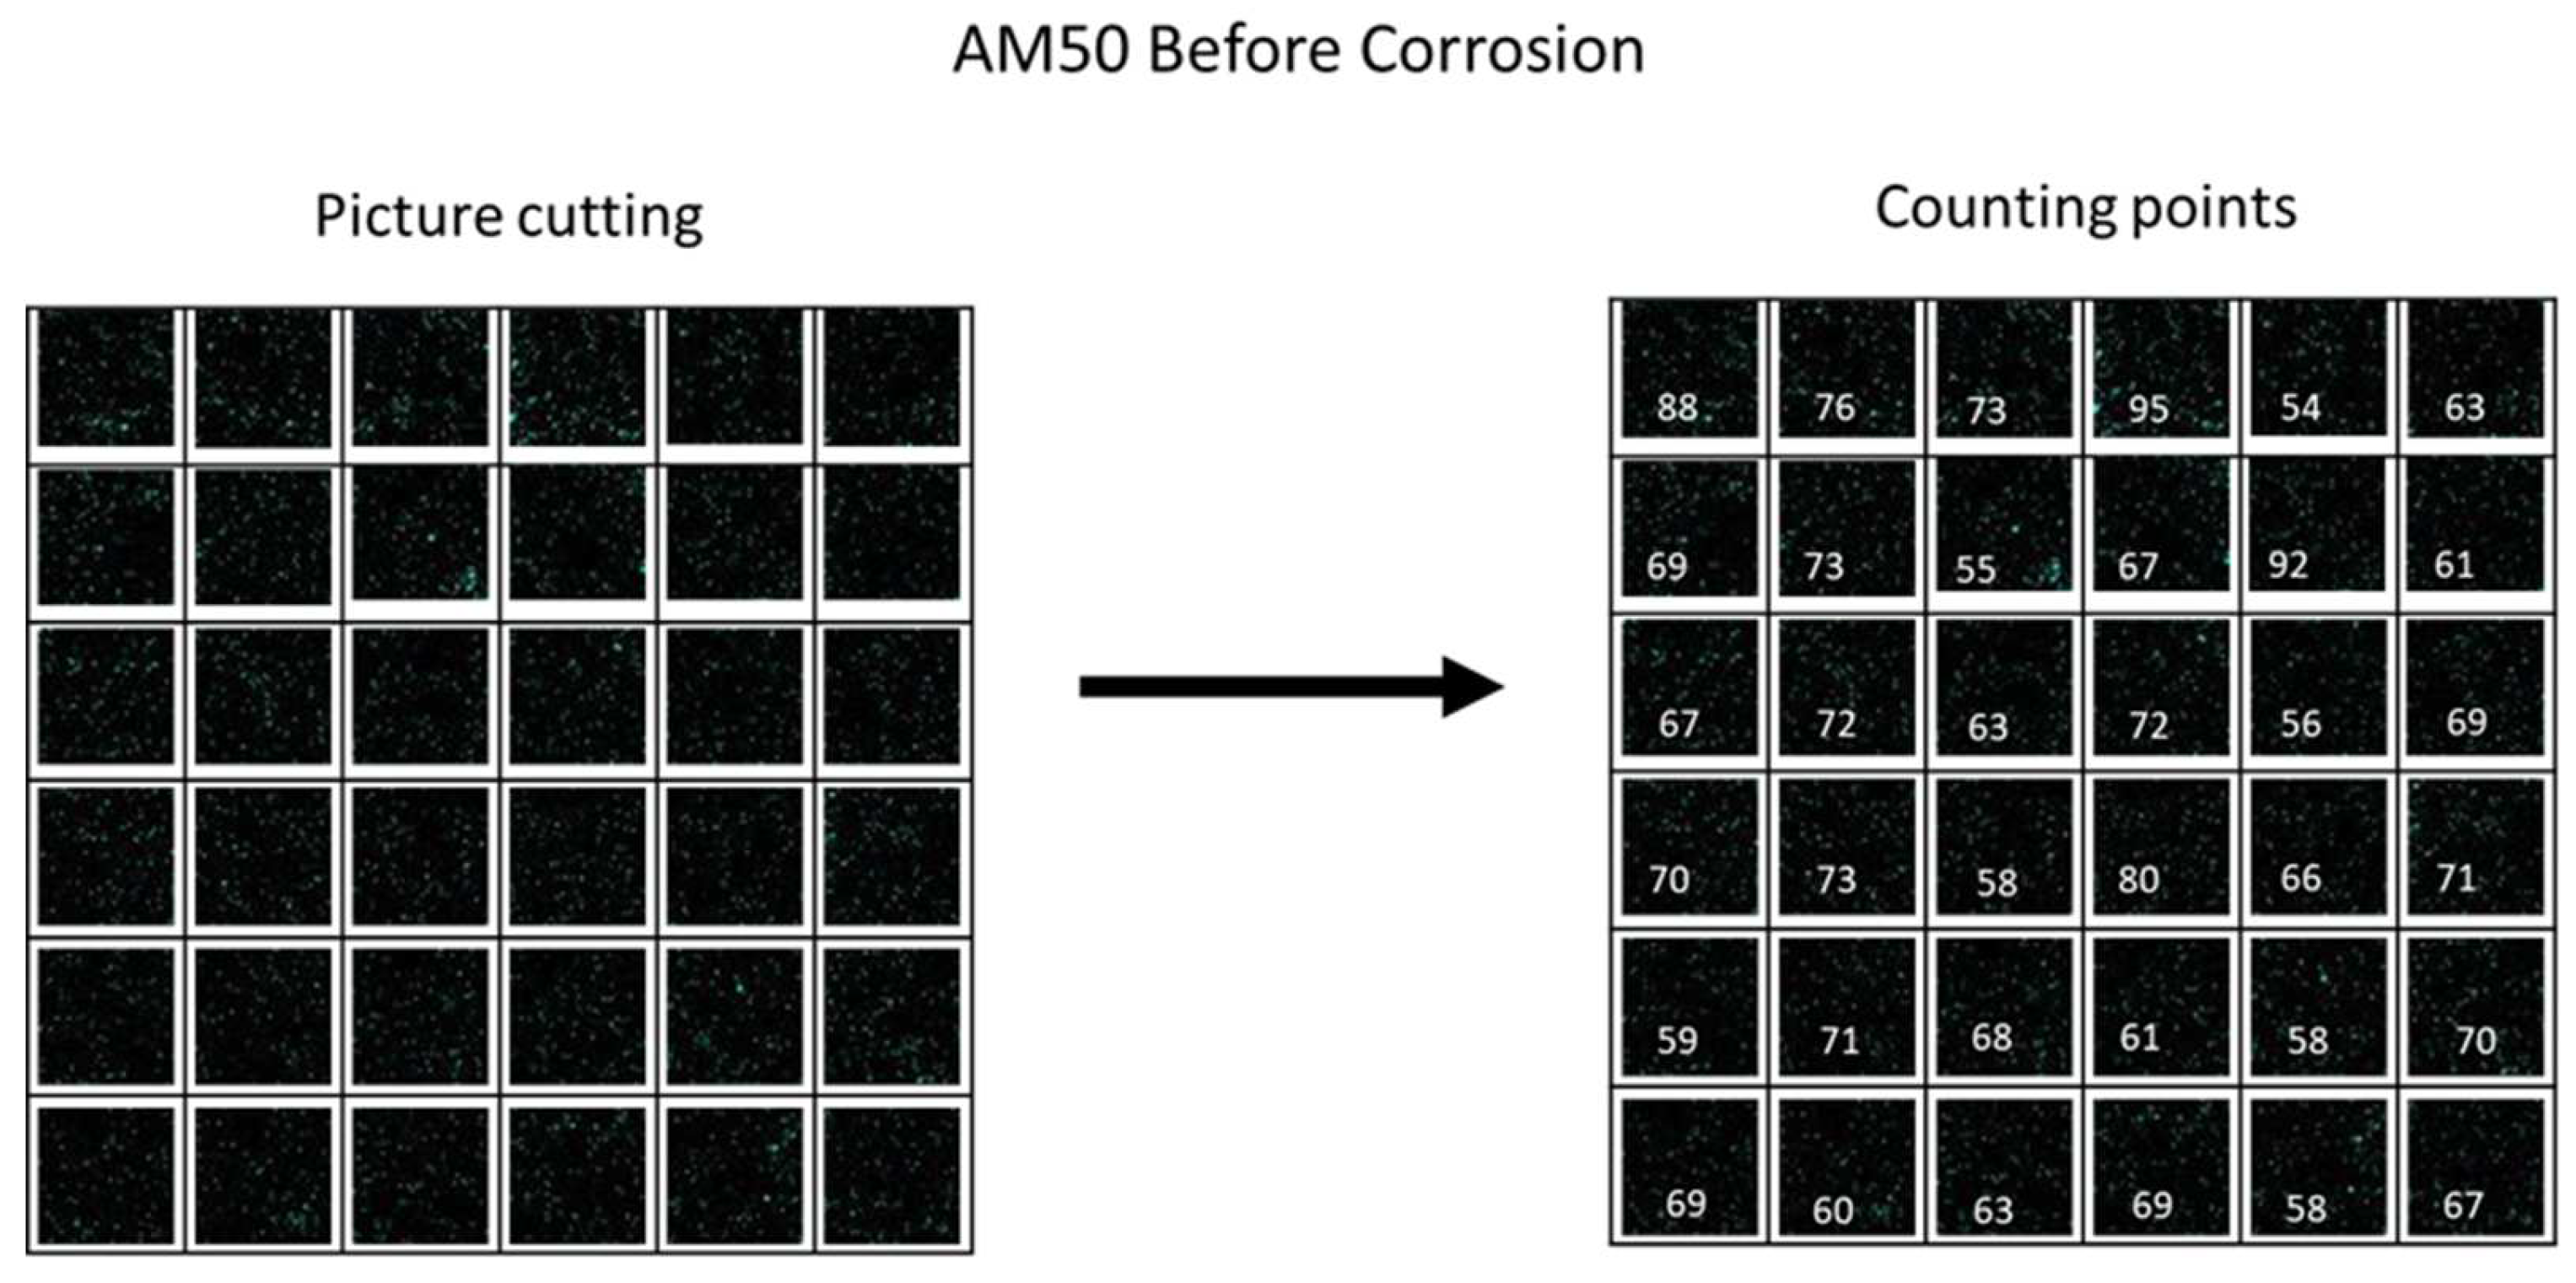
Figure 2.
Schematic of the formation of a coating layer of the titania process
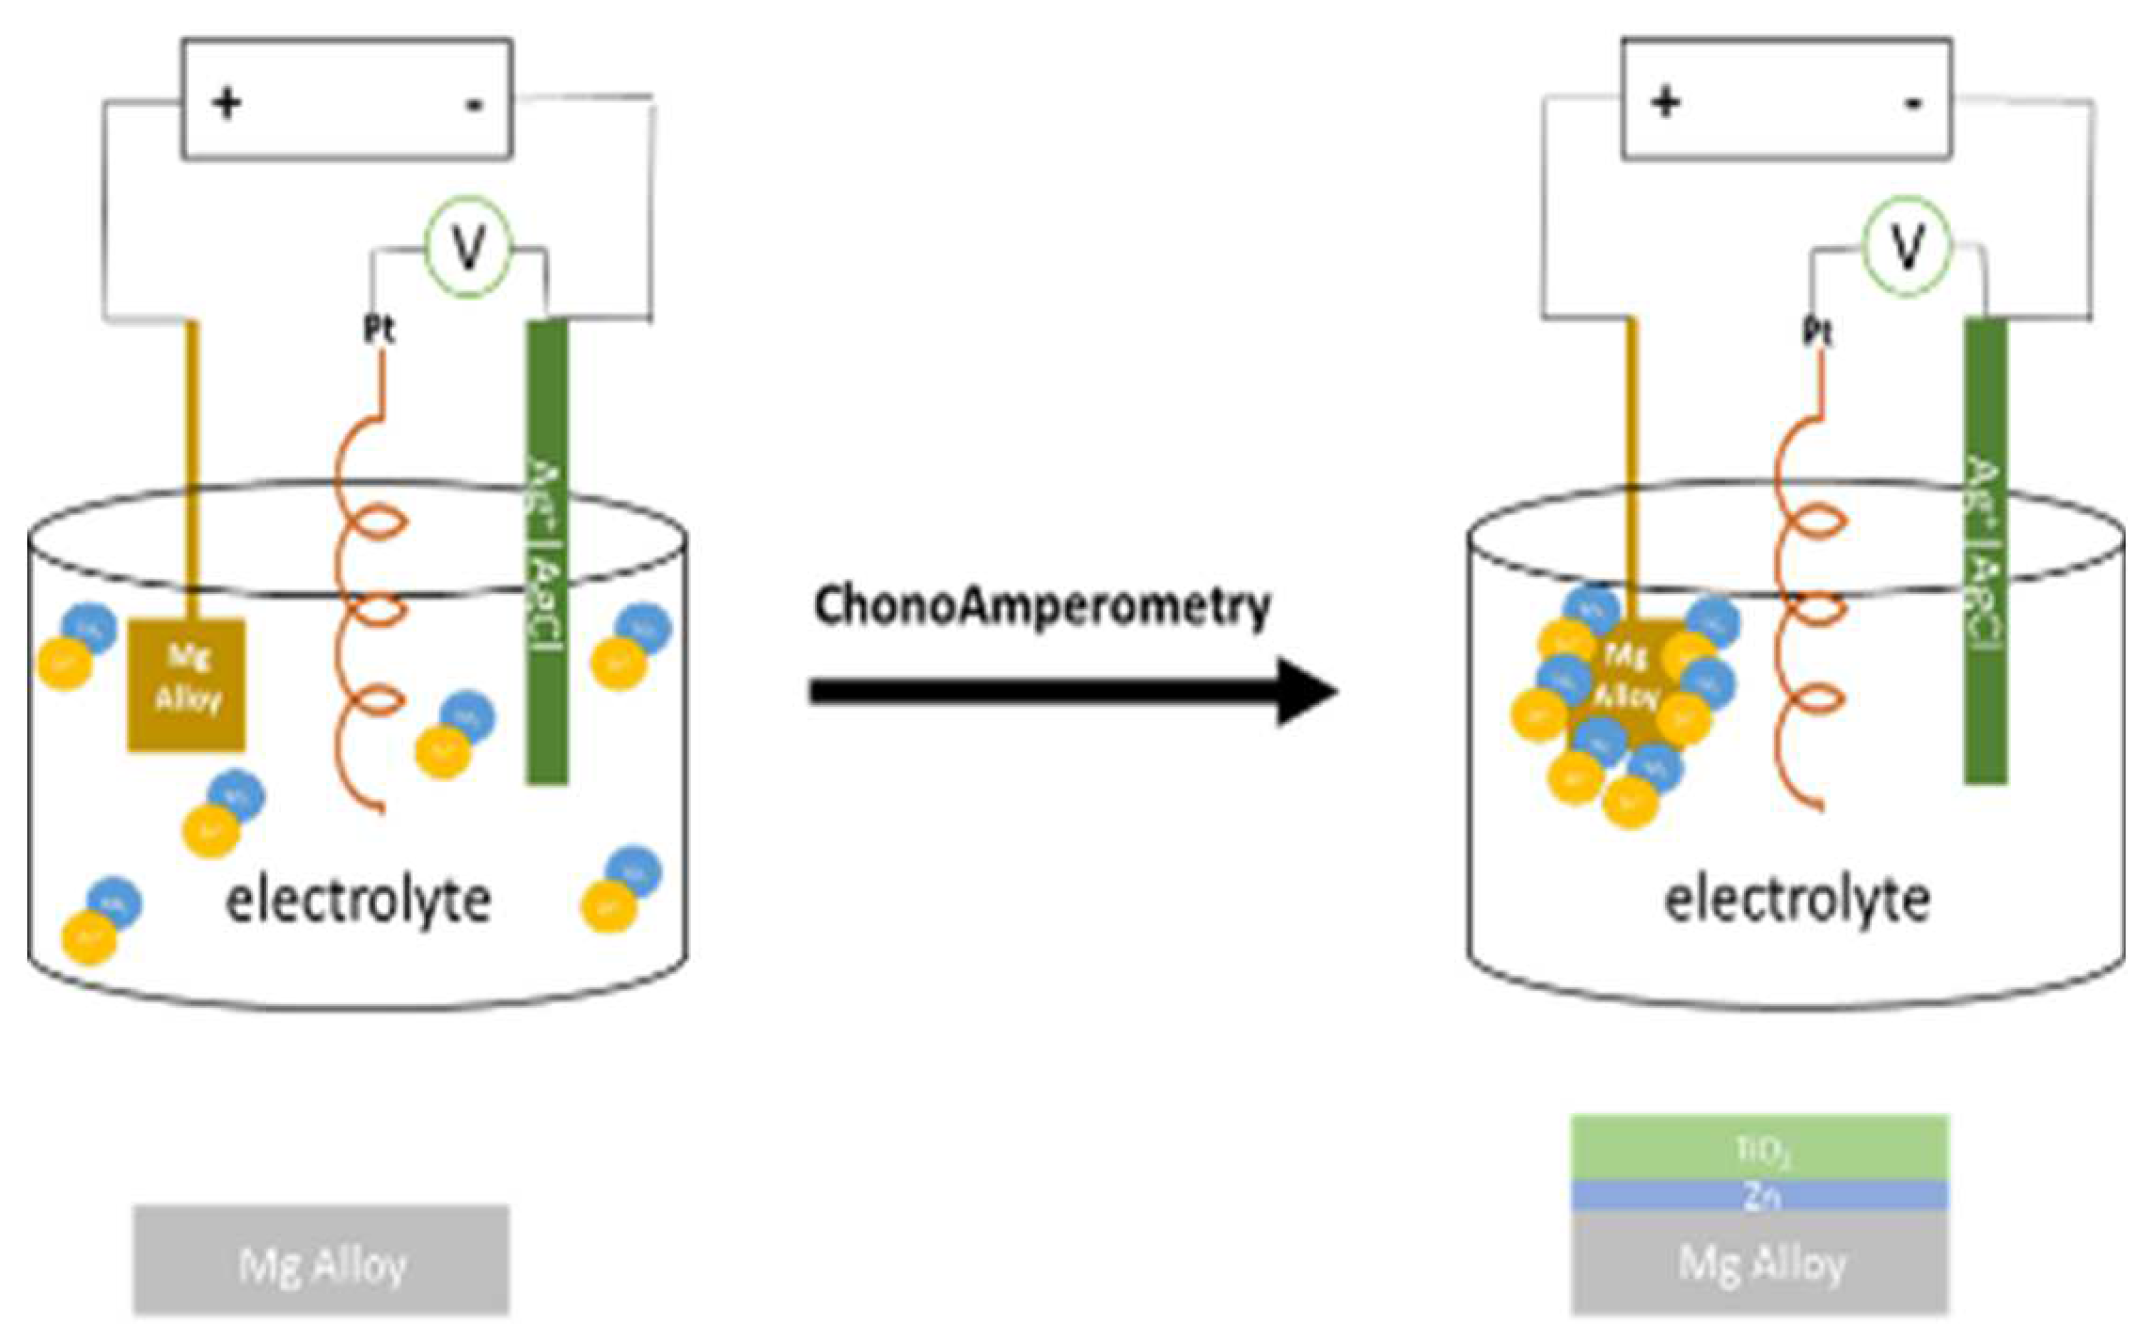
Figure 3.
Secondary electron (left) and back-scattered electron (right) SEM images of the surfaces of (a) uncoated AM50 alloy, (b) zinc-coated AM50 and (c) AM50 coated with zinc containing TiO2. Magnification x1000. Dark spots are inclusions of diamond powder remaining after surface grinding.
Figure 3.
Secondary electron (left) and back-scattered electron (right) SEM images of the surfaces of (a) uncoated AM50 alloy, (b) zinc-coated AM50 and (c) AM50 coated with zinc containing TiO2. Magnification x1000. Dark spots are inclusions of diamond powder remaining after surface grinding.
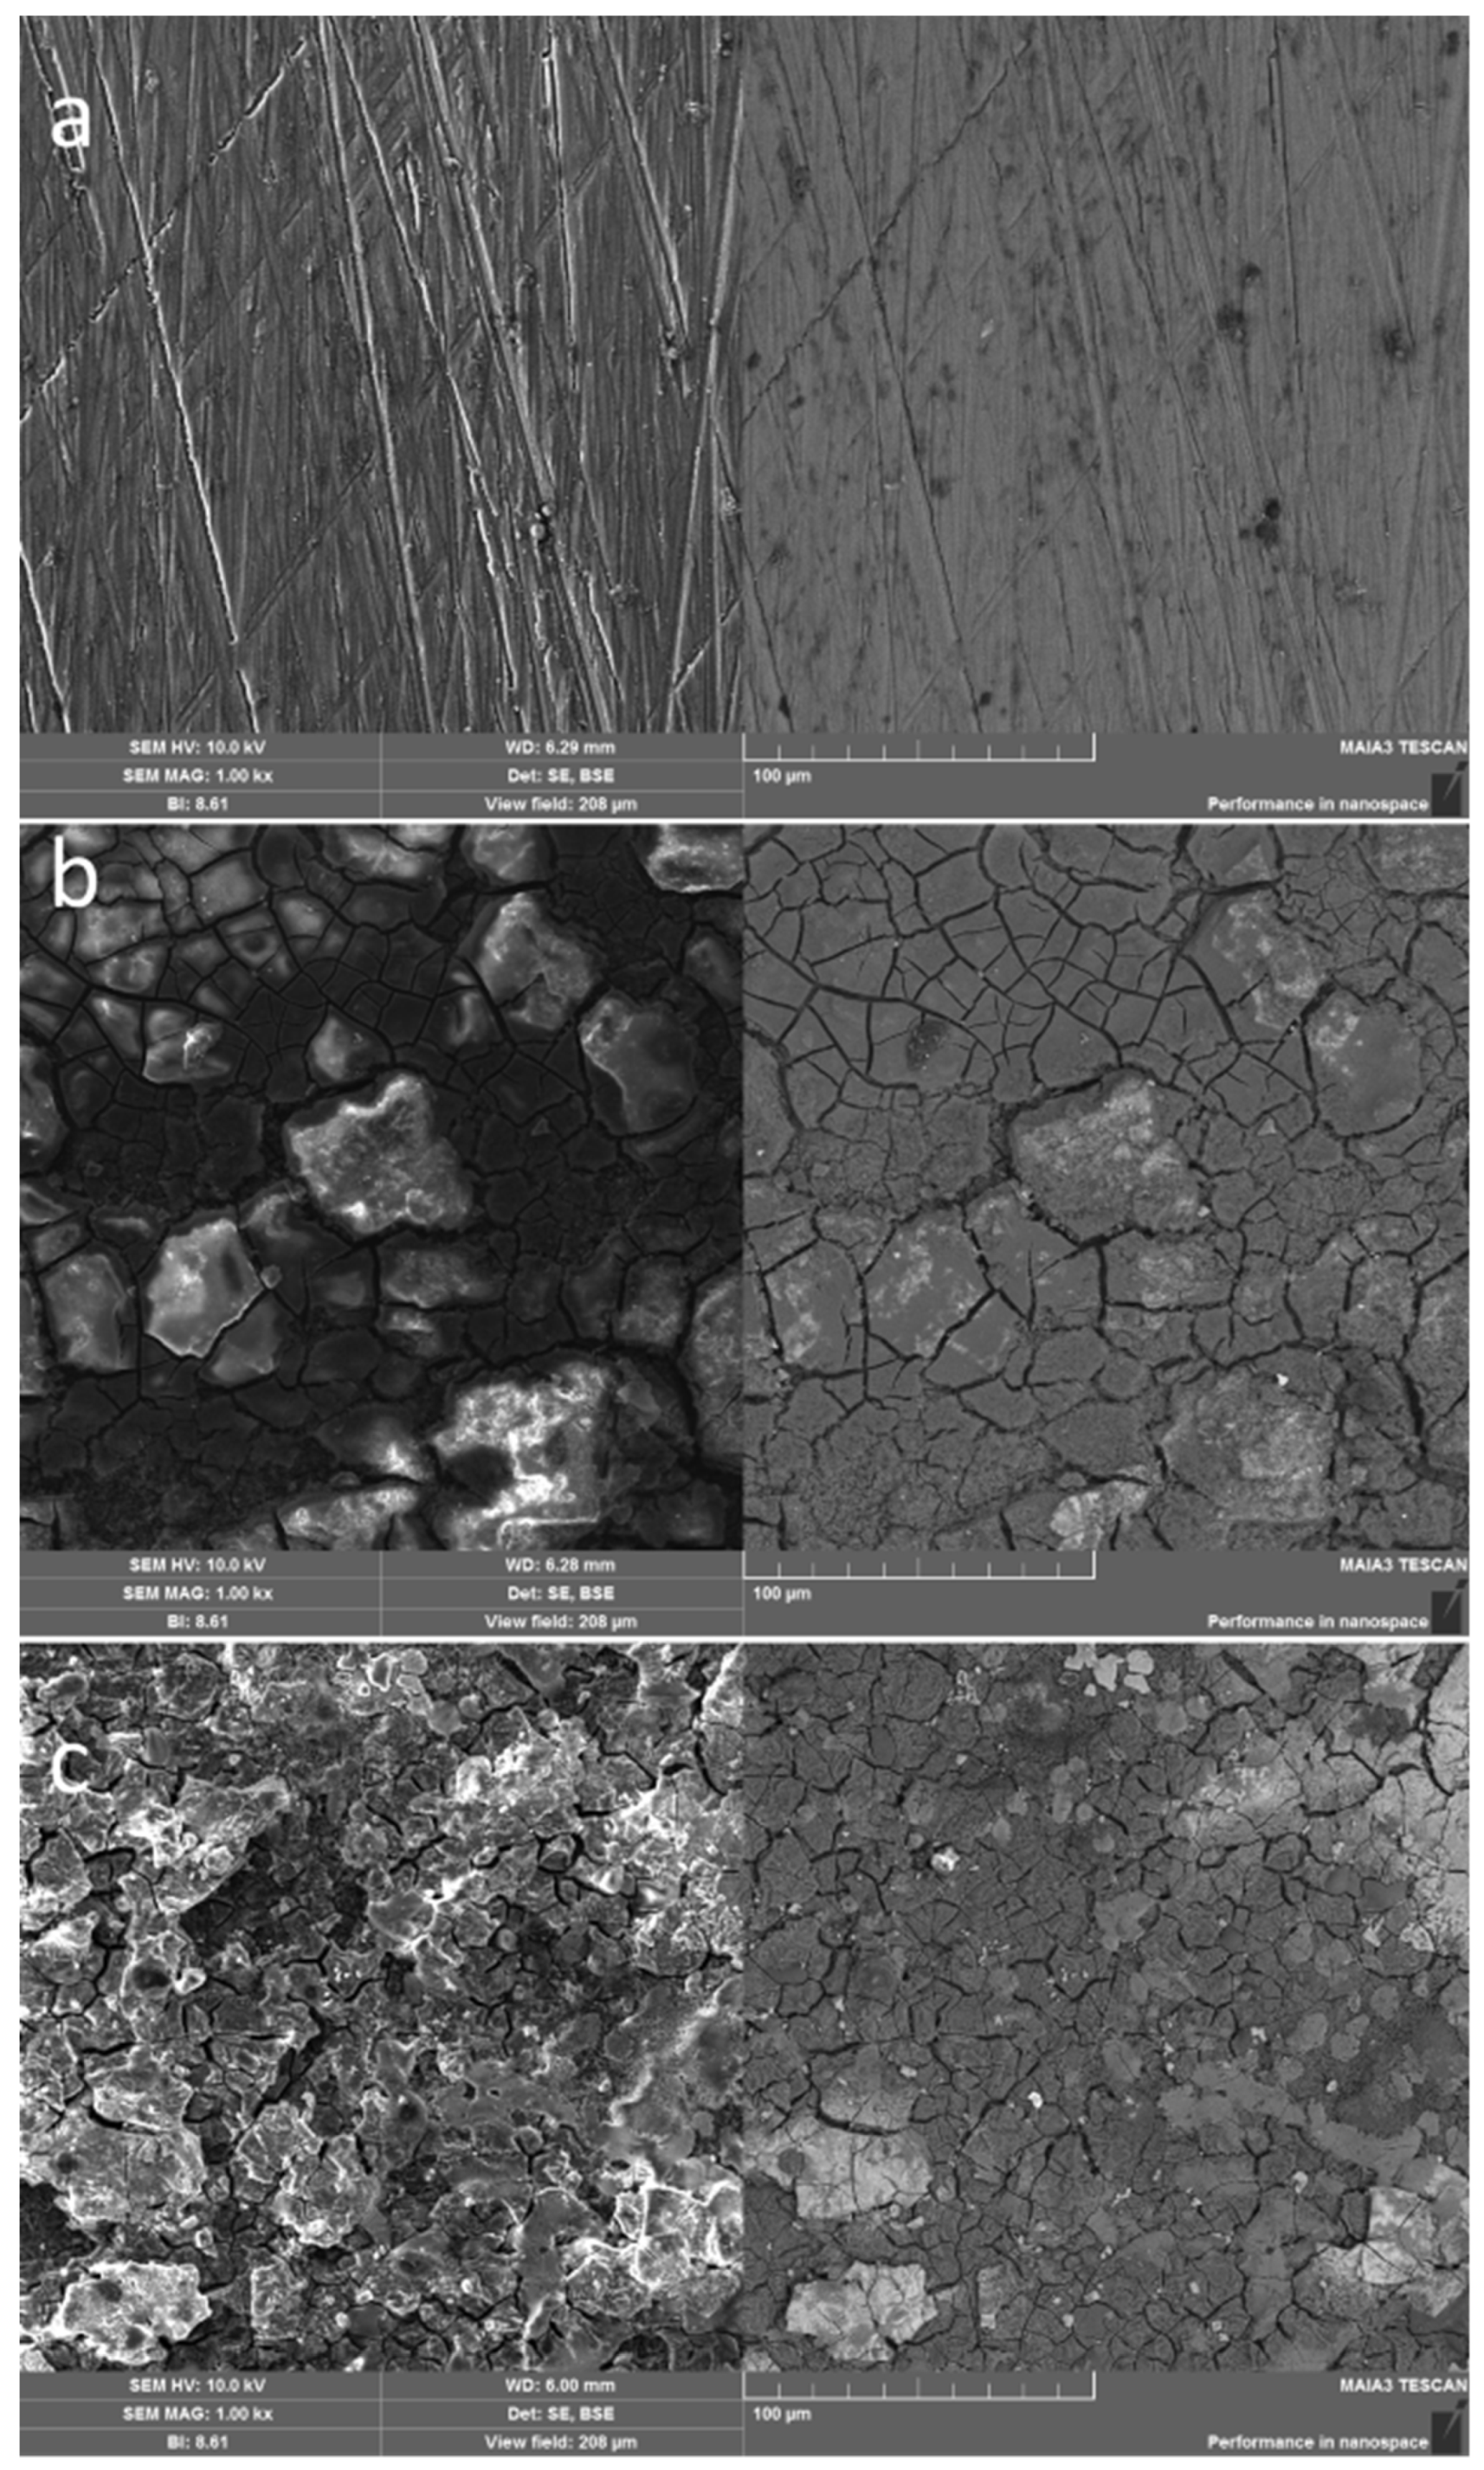
Figure 4.
Secondary electron (left) and back-scattered electron (right) SEM images of the surfaces of (a) uncoated AZ91 alloy, (b) zinc-coated AZ91 and (c) AZ91 coated with zinc containing TiO2. Magnification x1000.
Figure 4.
Secondary electron (left) and back-scattered electron (right) SEM images of the surfaces of (a) uncoated AZ91 alloy, (b) zinc-coated AZ91 and (c) AZ91 coated with zinc containing TiO2. Magnification x1000.
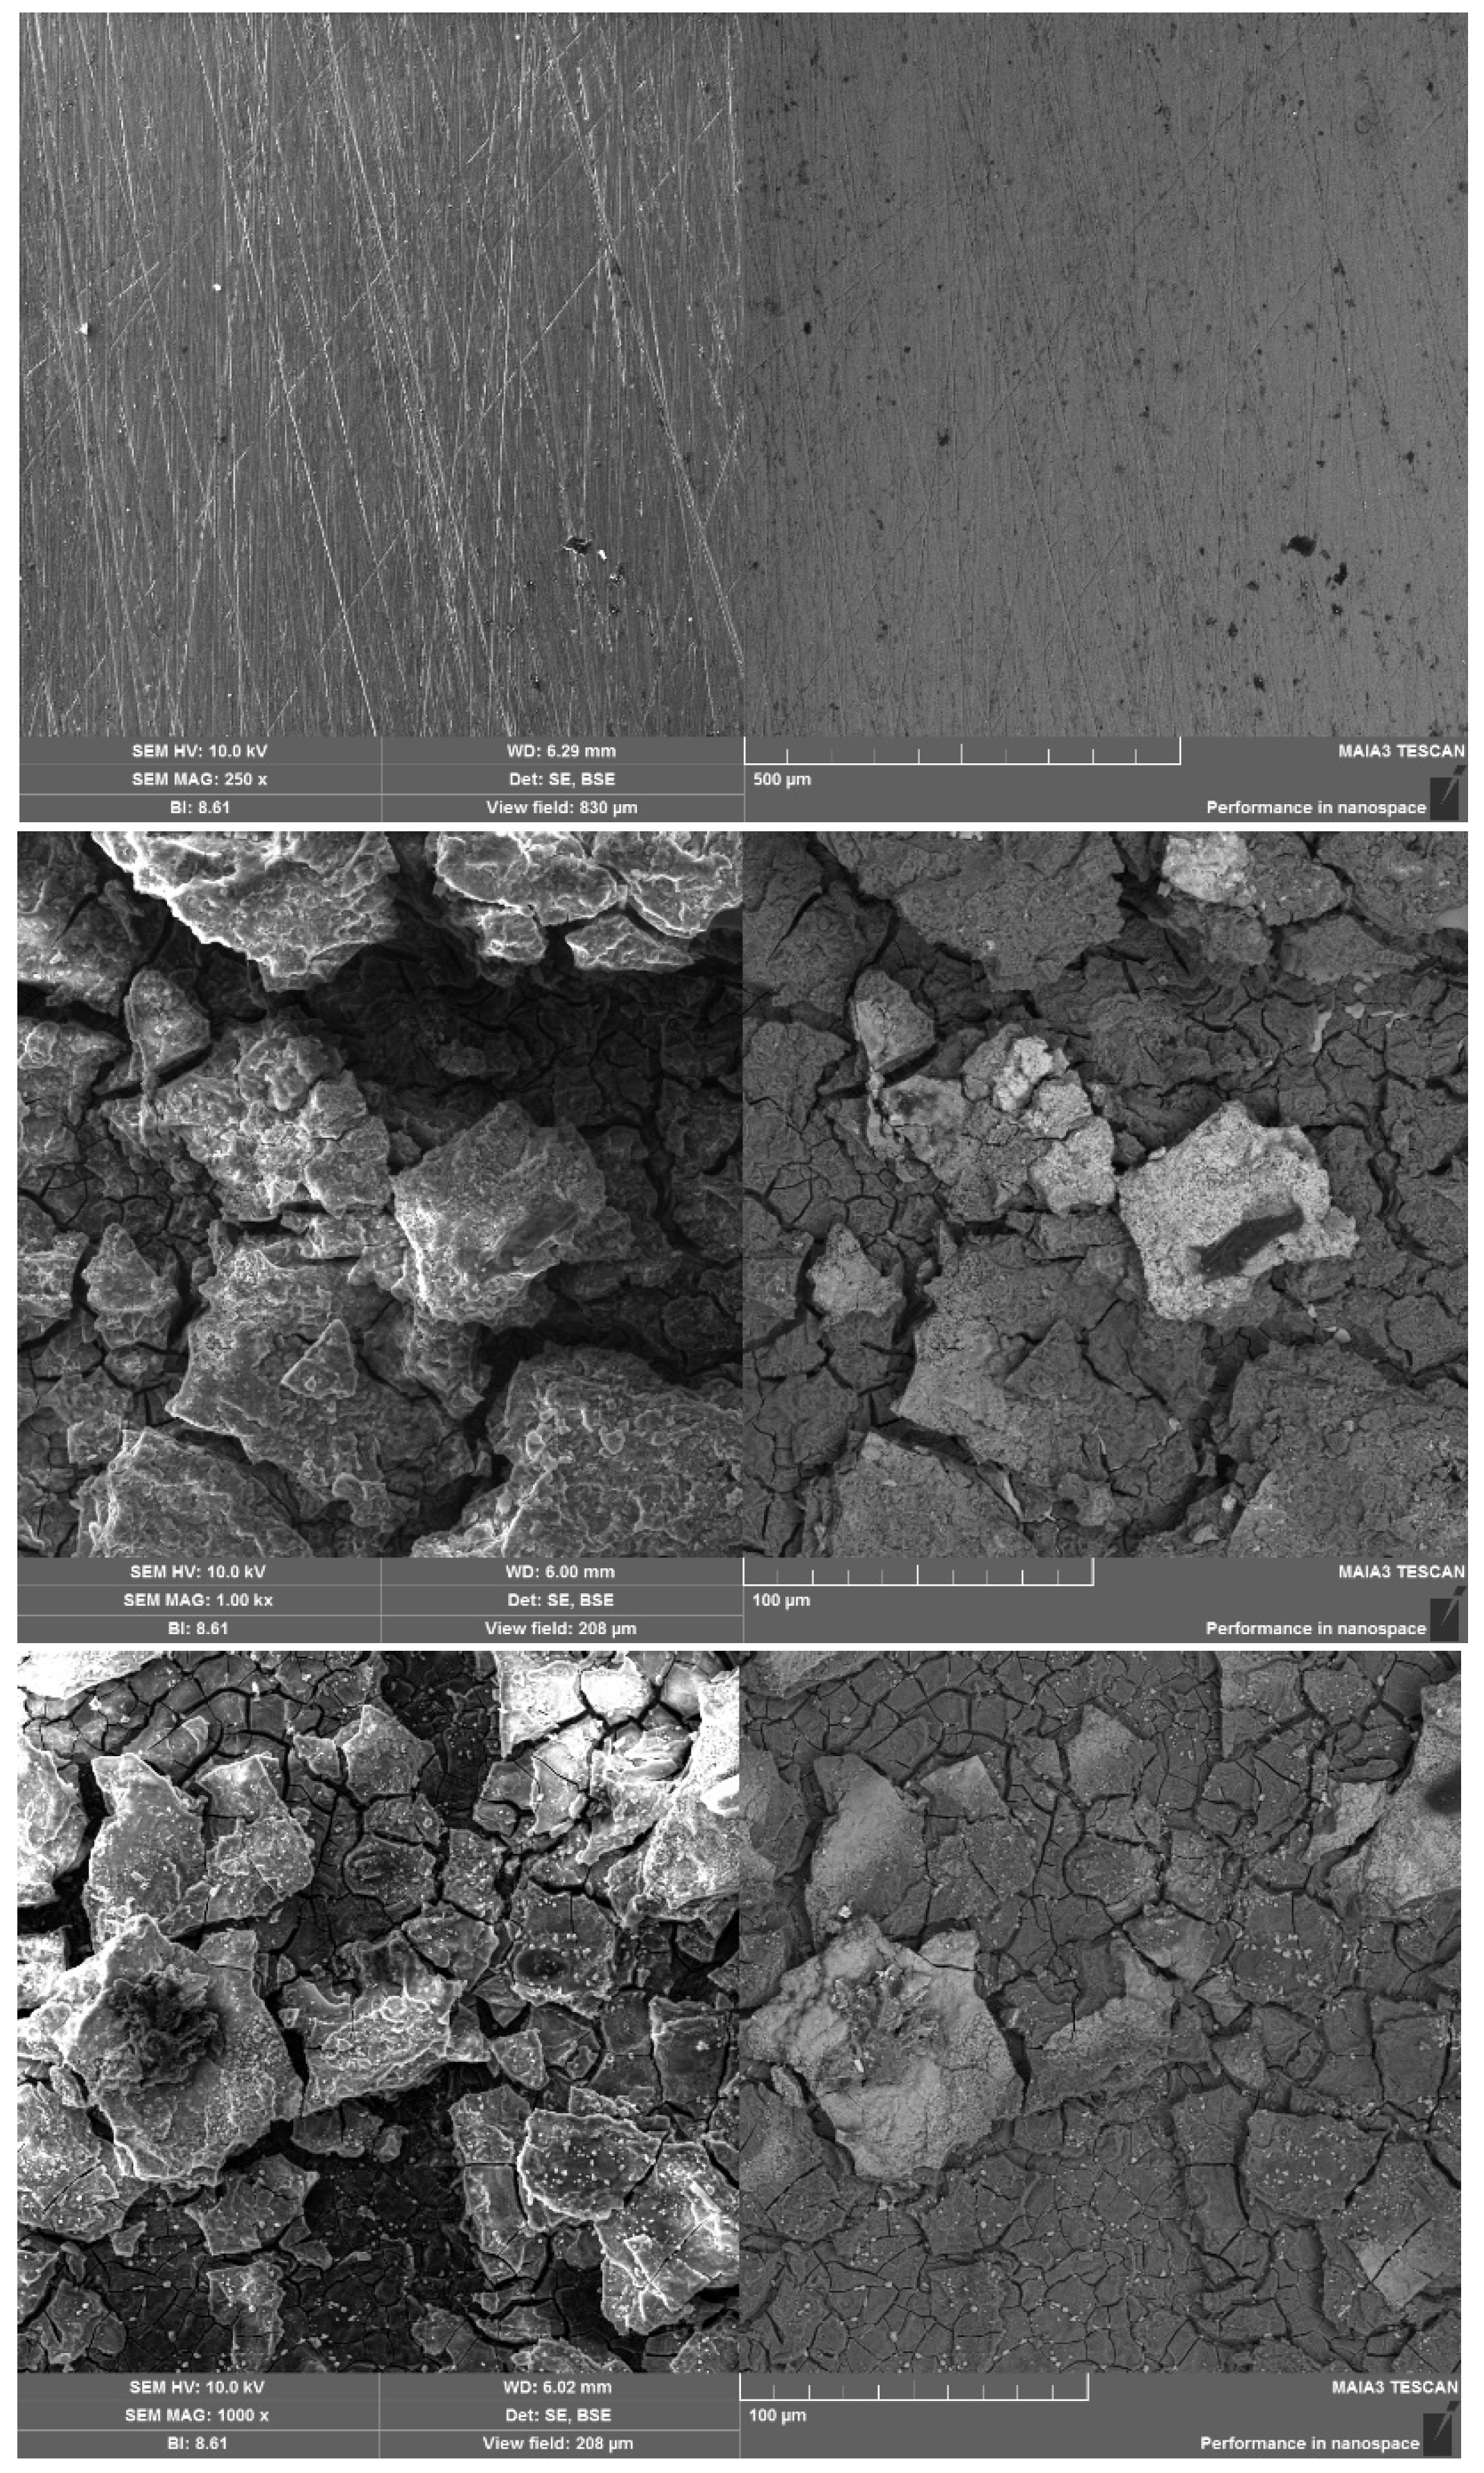
Figure 5.
On the left: EDS spectrum and atomic percentage of elements on the surface of AM50 coated with Zn containing TiO2. On the right: an EDS mapping image of Ti distribution on the surface of the specimen.
Figure 5.
On the left: EDS spectrum and atomic percentage of elements on the surface of AM50 coated with Zn containing TiO2. On the right: an EDS mapping image of Ti distribution on the surface of the specimen.
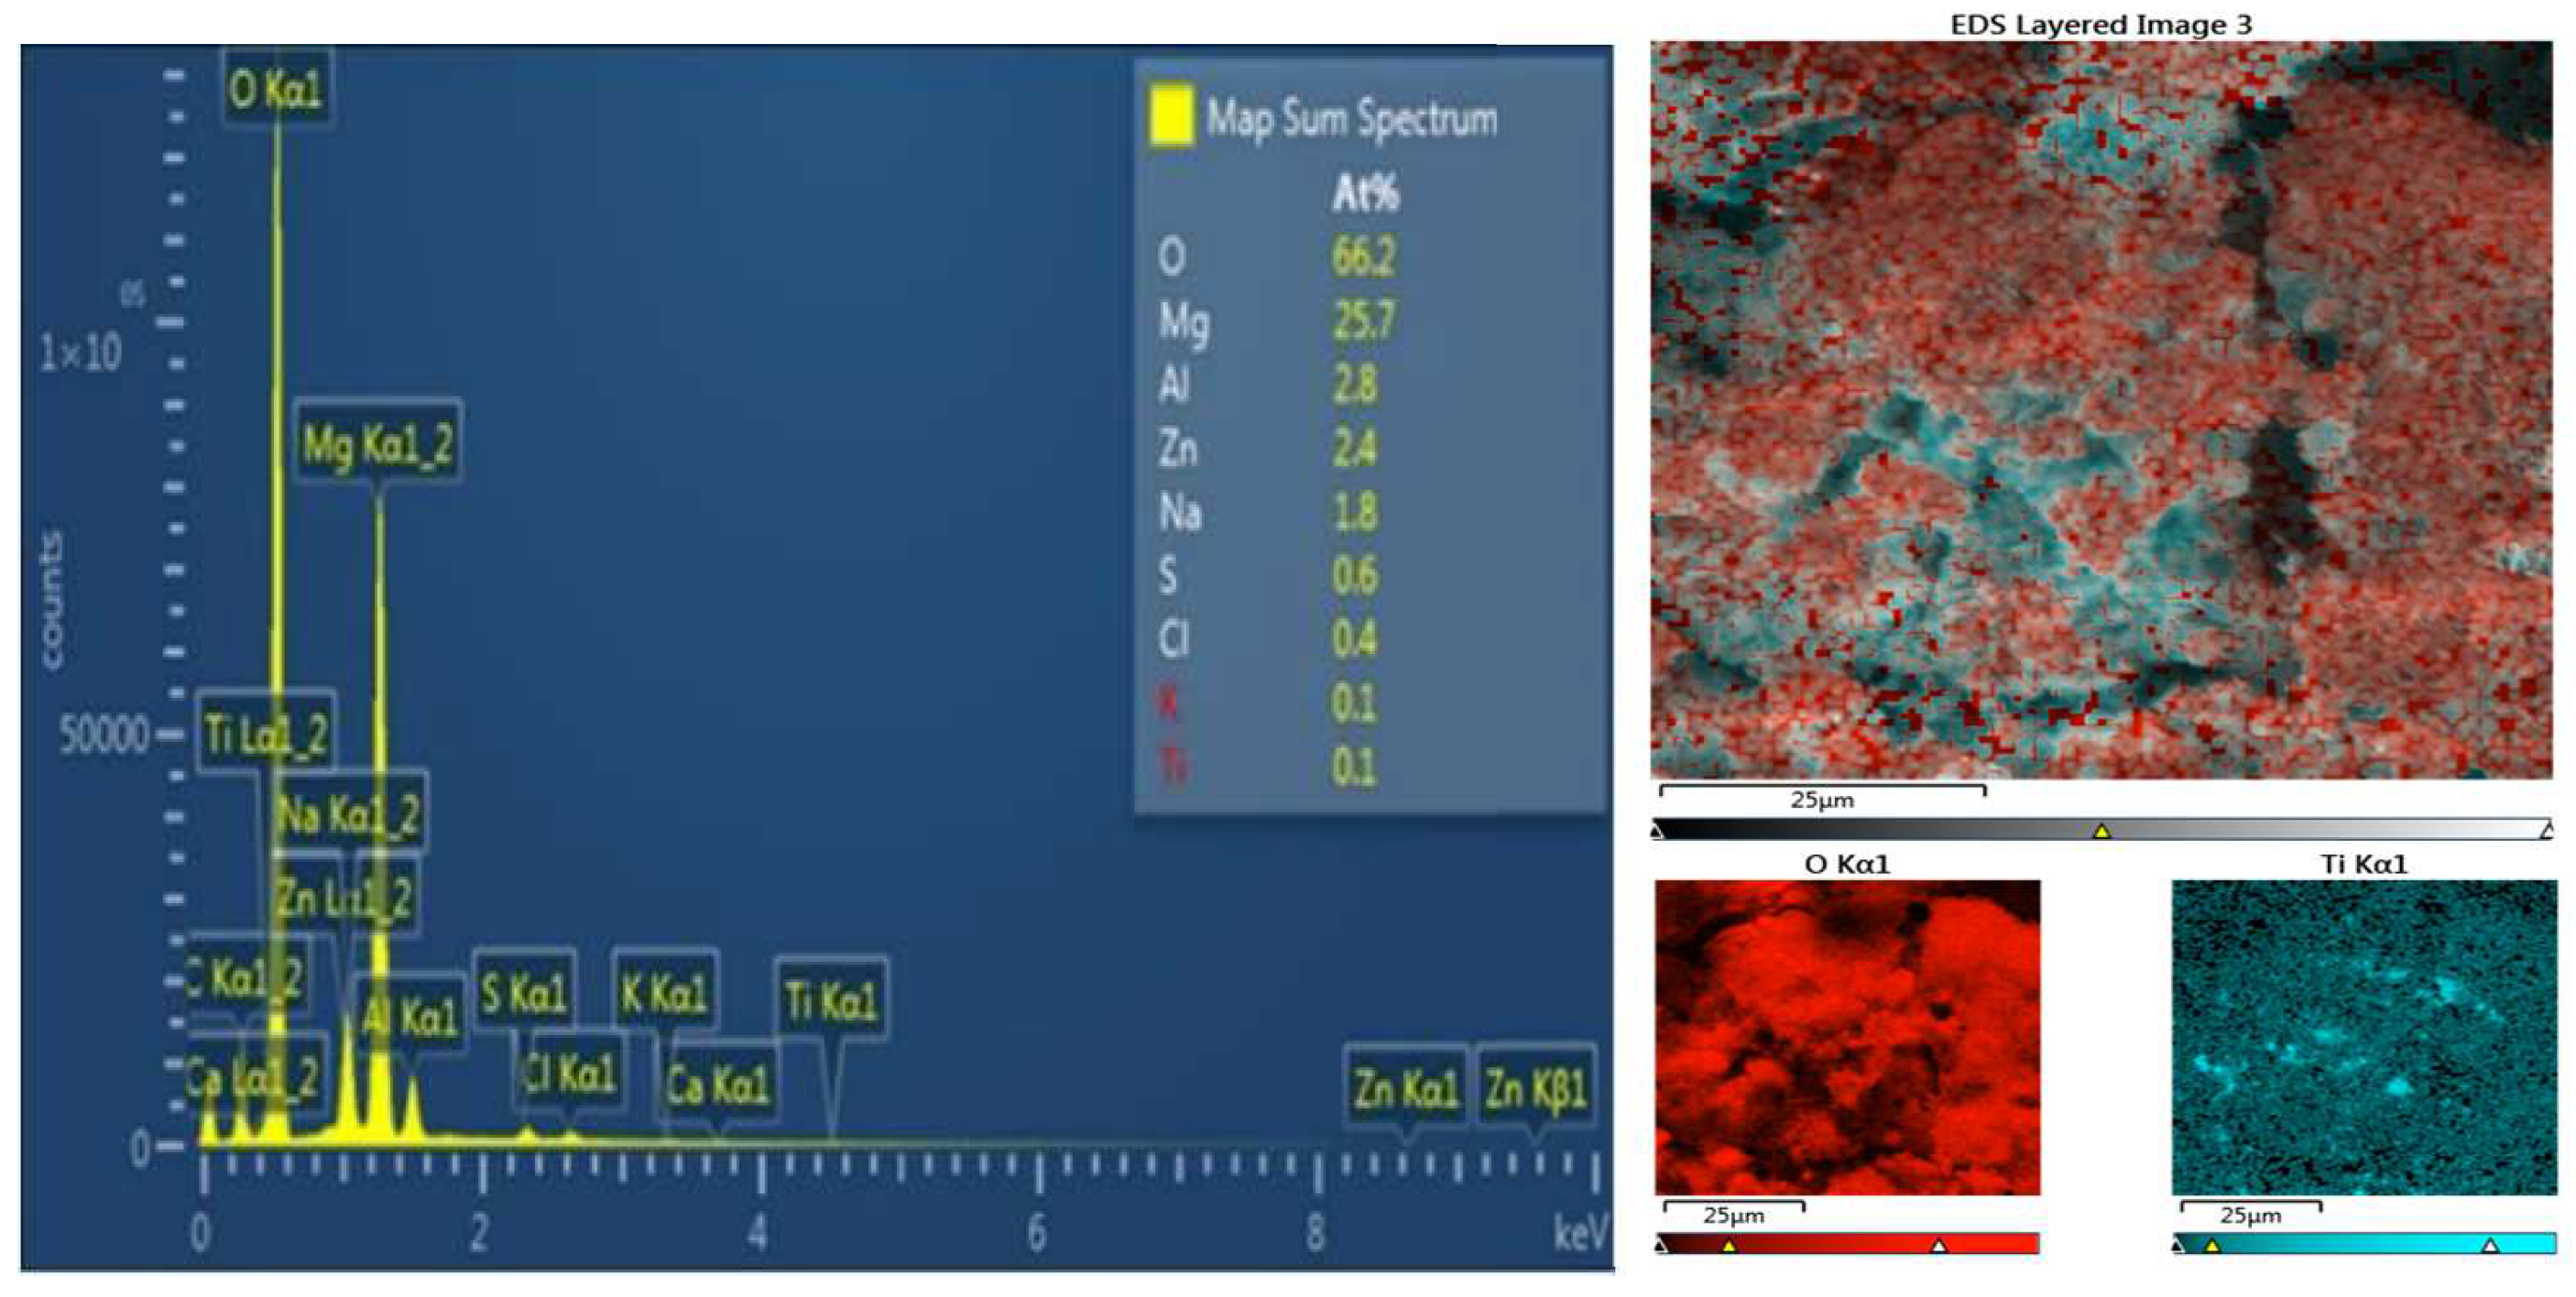
Figure 6.
On the left: EDS analysis of zinc-coated AZ91 magnesium alloy containing titanium dioxide. The right side: an EDS elemental map specifically showing how titanium was distributed across the specimen surface.
Figure 6.
On the left: EDS analysis of zinc-coated AZ91 magnesium alloy containing titanium dioxide. The right side: an EDS elemental map specifically showing how titanium was distributed across the specimen surface.
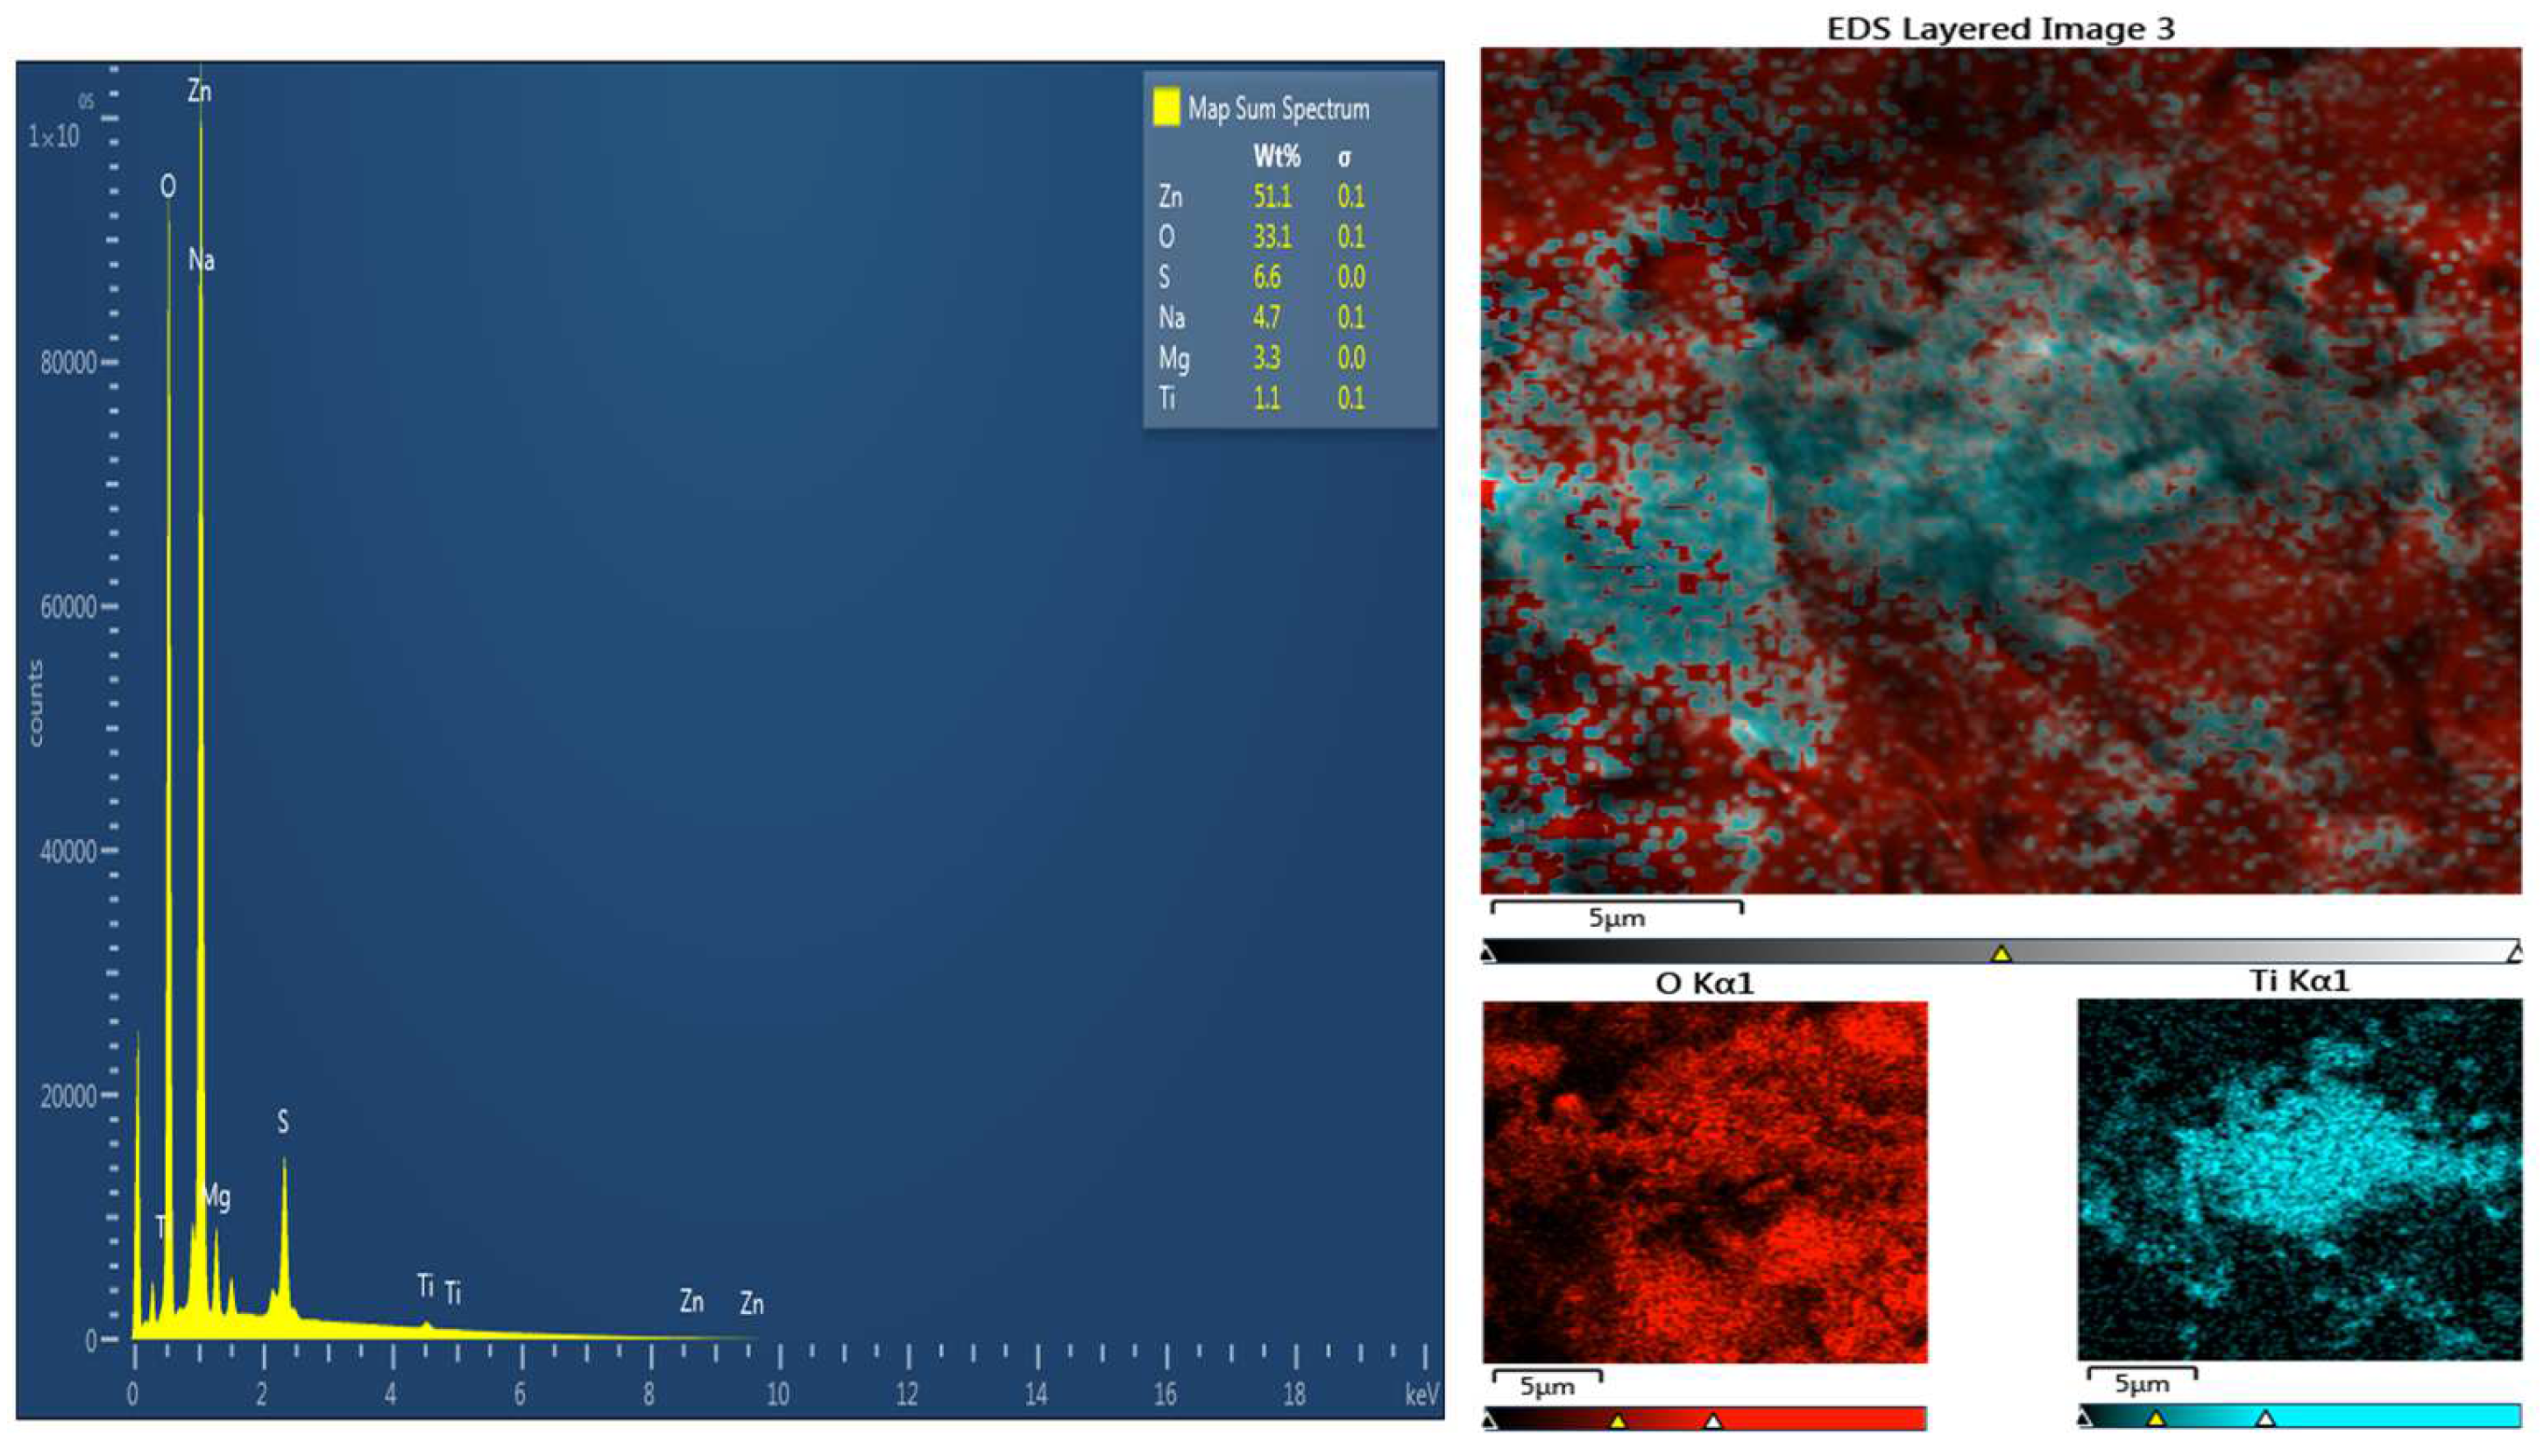
Figure 7.
SEM images. AM50 after coating. SEM image and scattering scattering of titanium particles. (a) and (c) before corrosion, (b) and (d) after corrosion in NaCl 3% (Wt). Comparison of dispersion and corrosion rate
Figure 7.
SEM images. AM50 after coating. SEM image and scattering scattering of titanium particles. (a) and (c) before corrosion, (b) and (d) after corrosion in NaCl 3% (Wt). Comparison of dispersion and corrosion rate
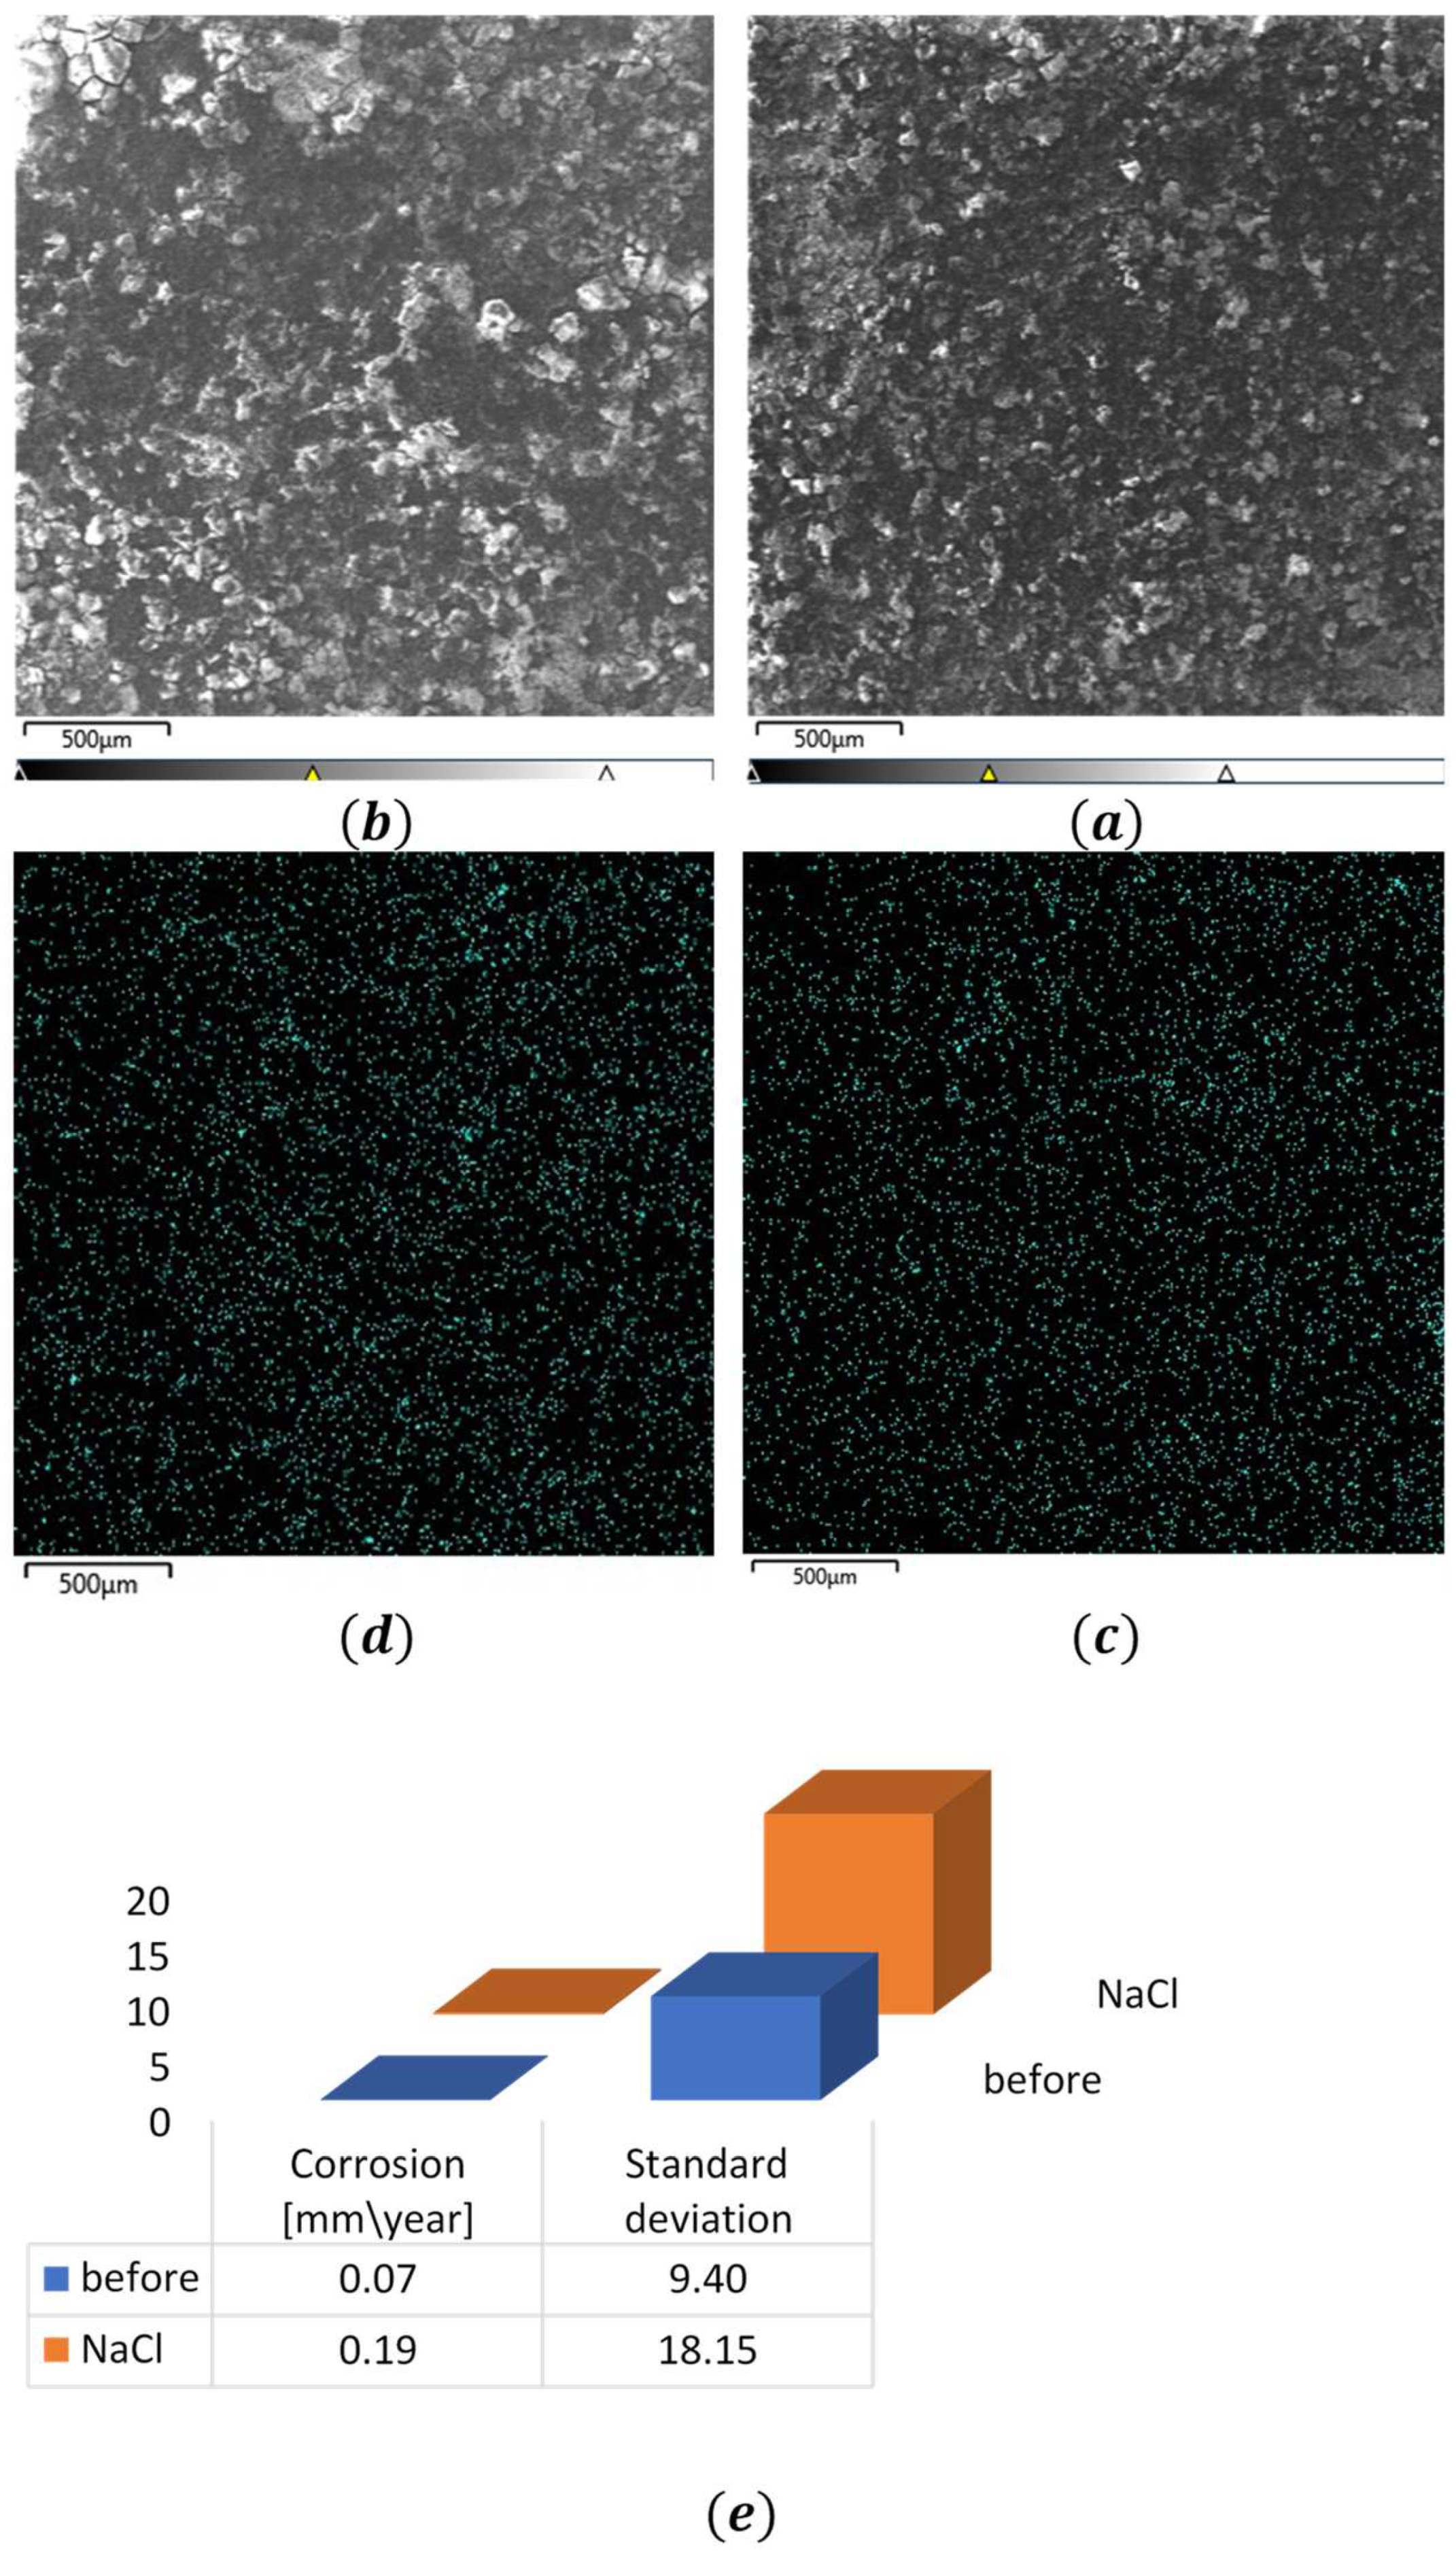
Figure 8.
XRD patterns of AM50 coated with Zn and TiO2 (top), and uncoated AM50 alloy (bottom).
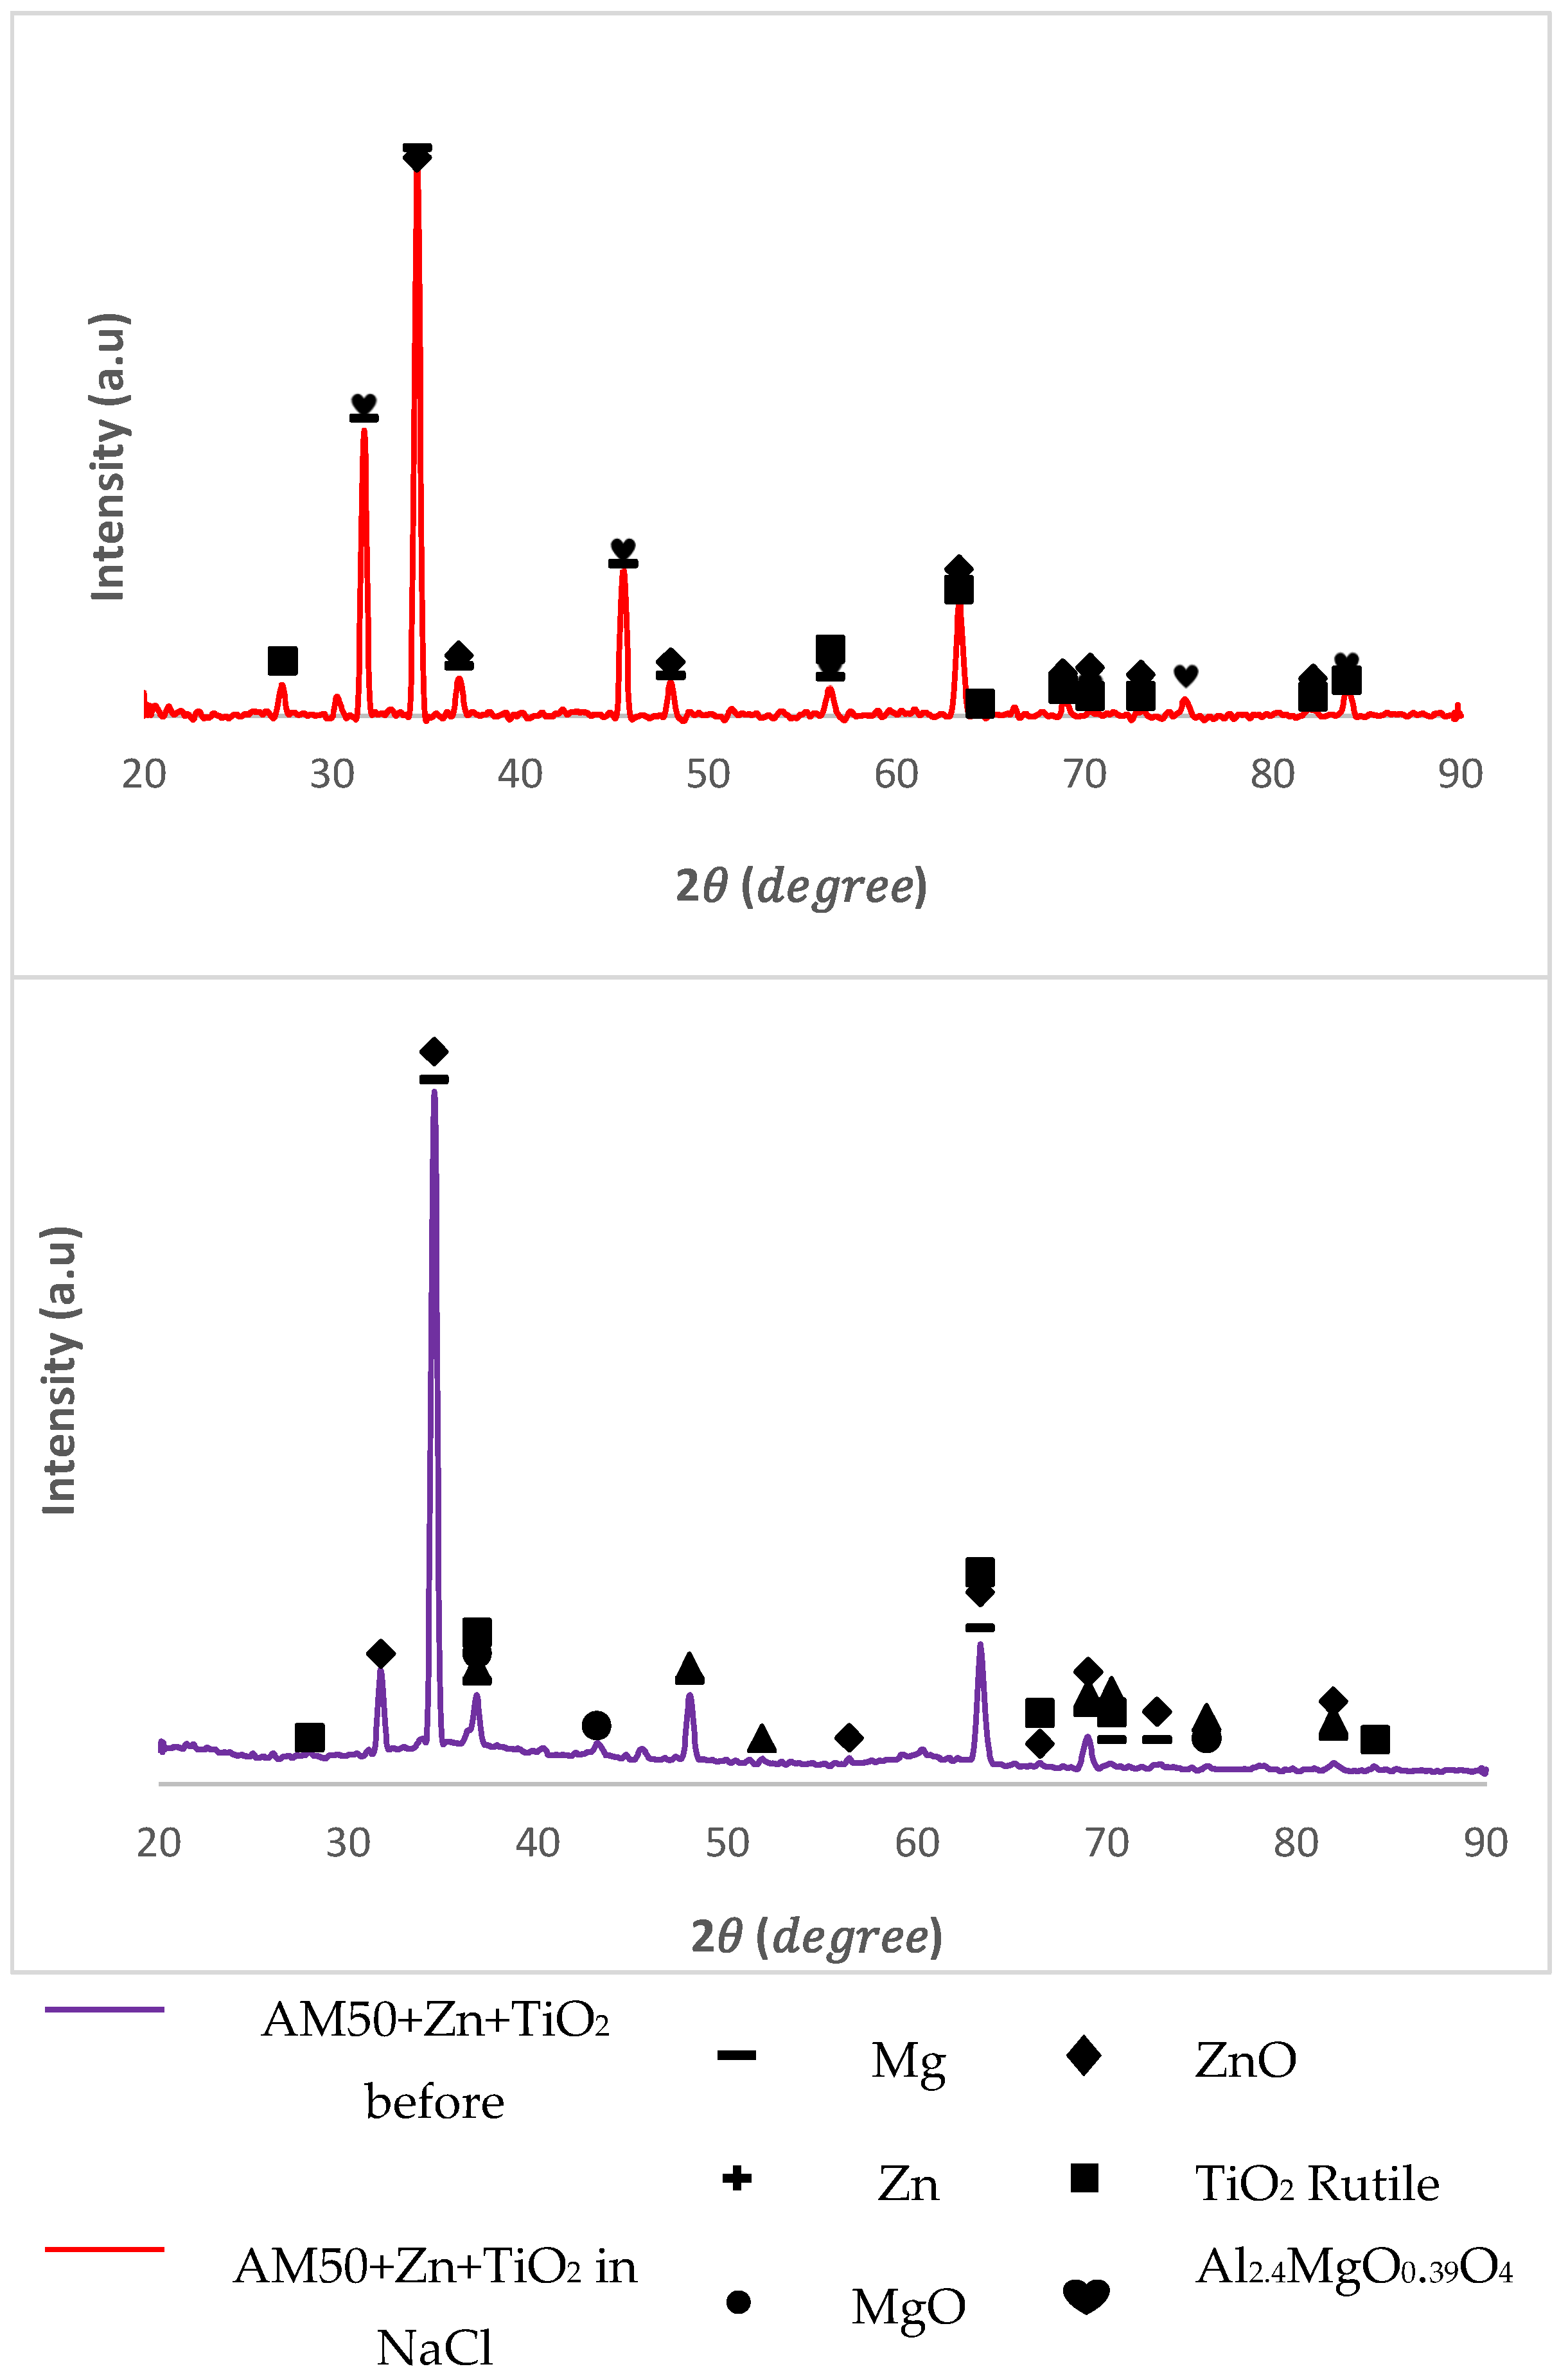
Figure 9.
XRD patterns of AZ91 coated with Zn and TiO2 (top), and uncoated AZ91 alloy (bottom).
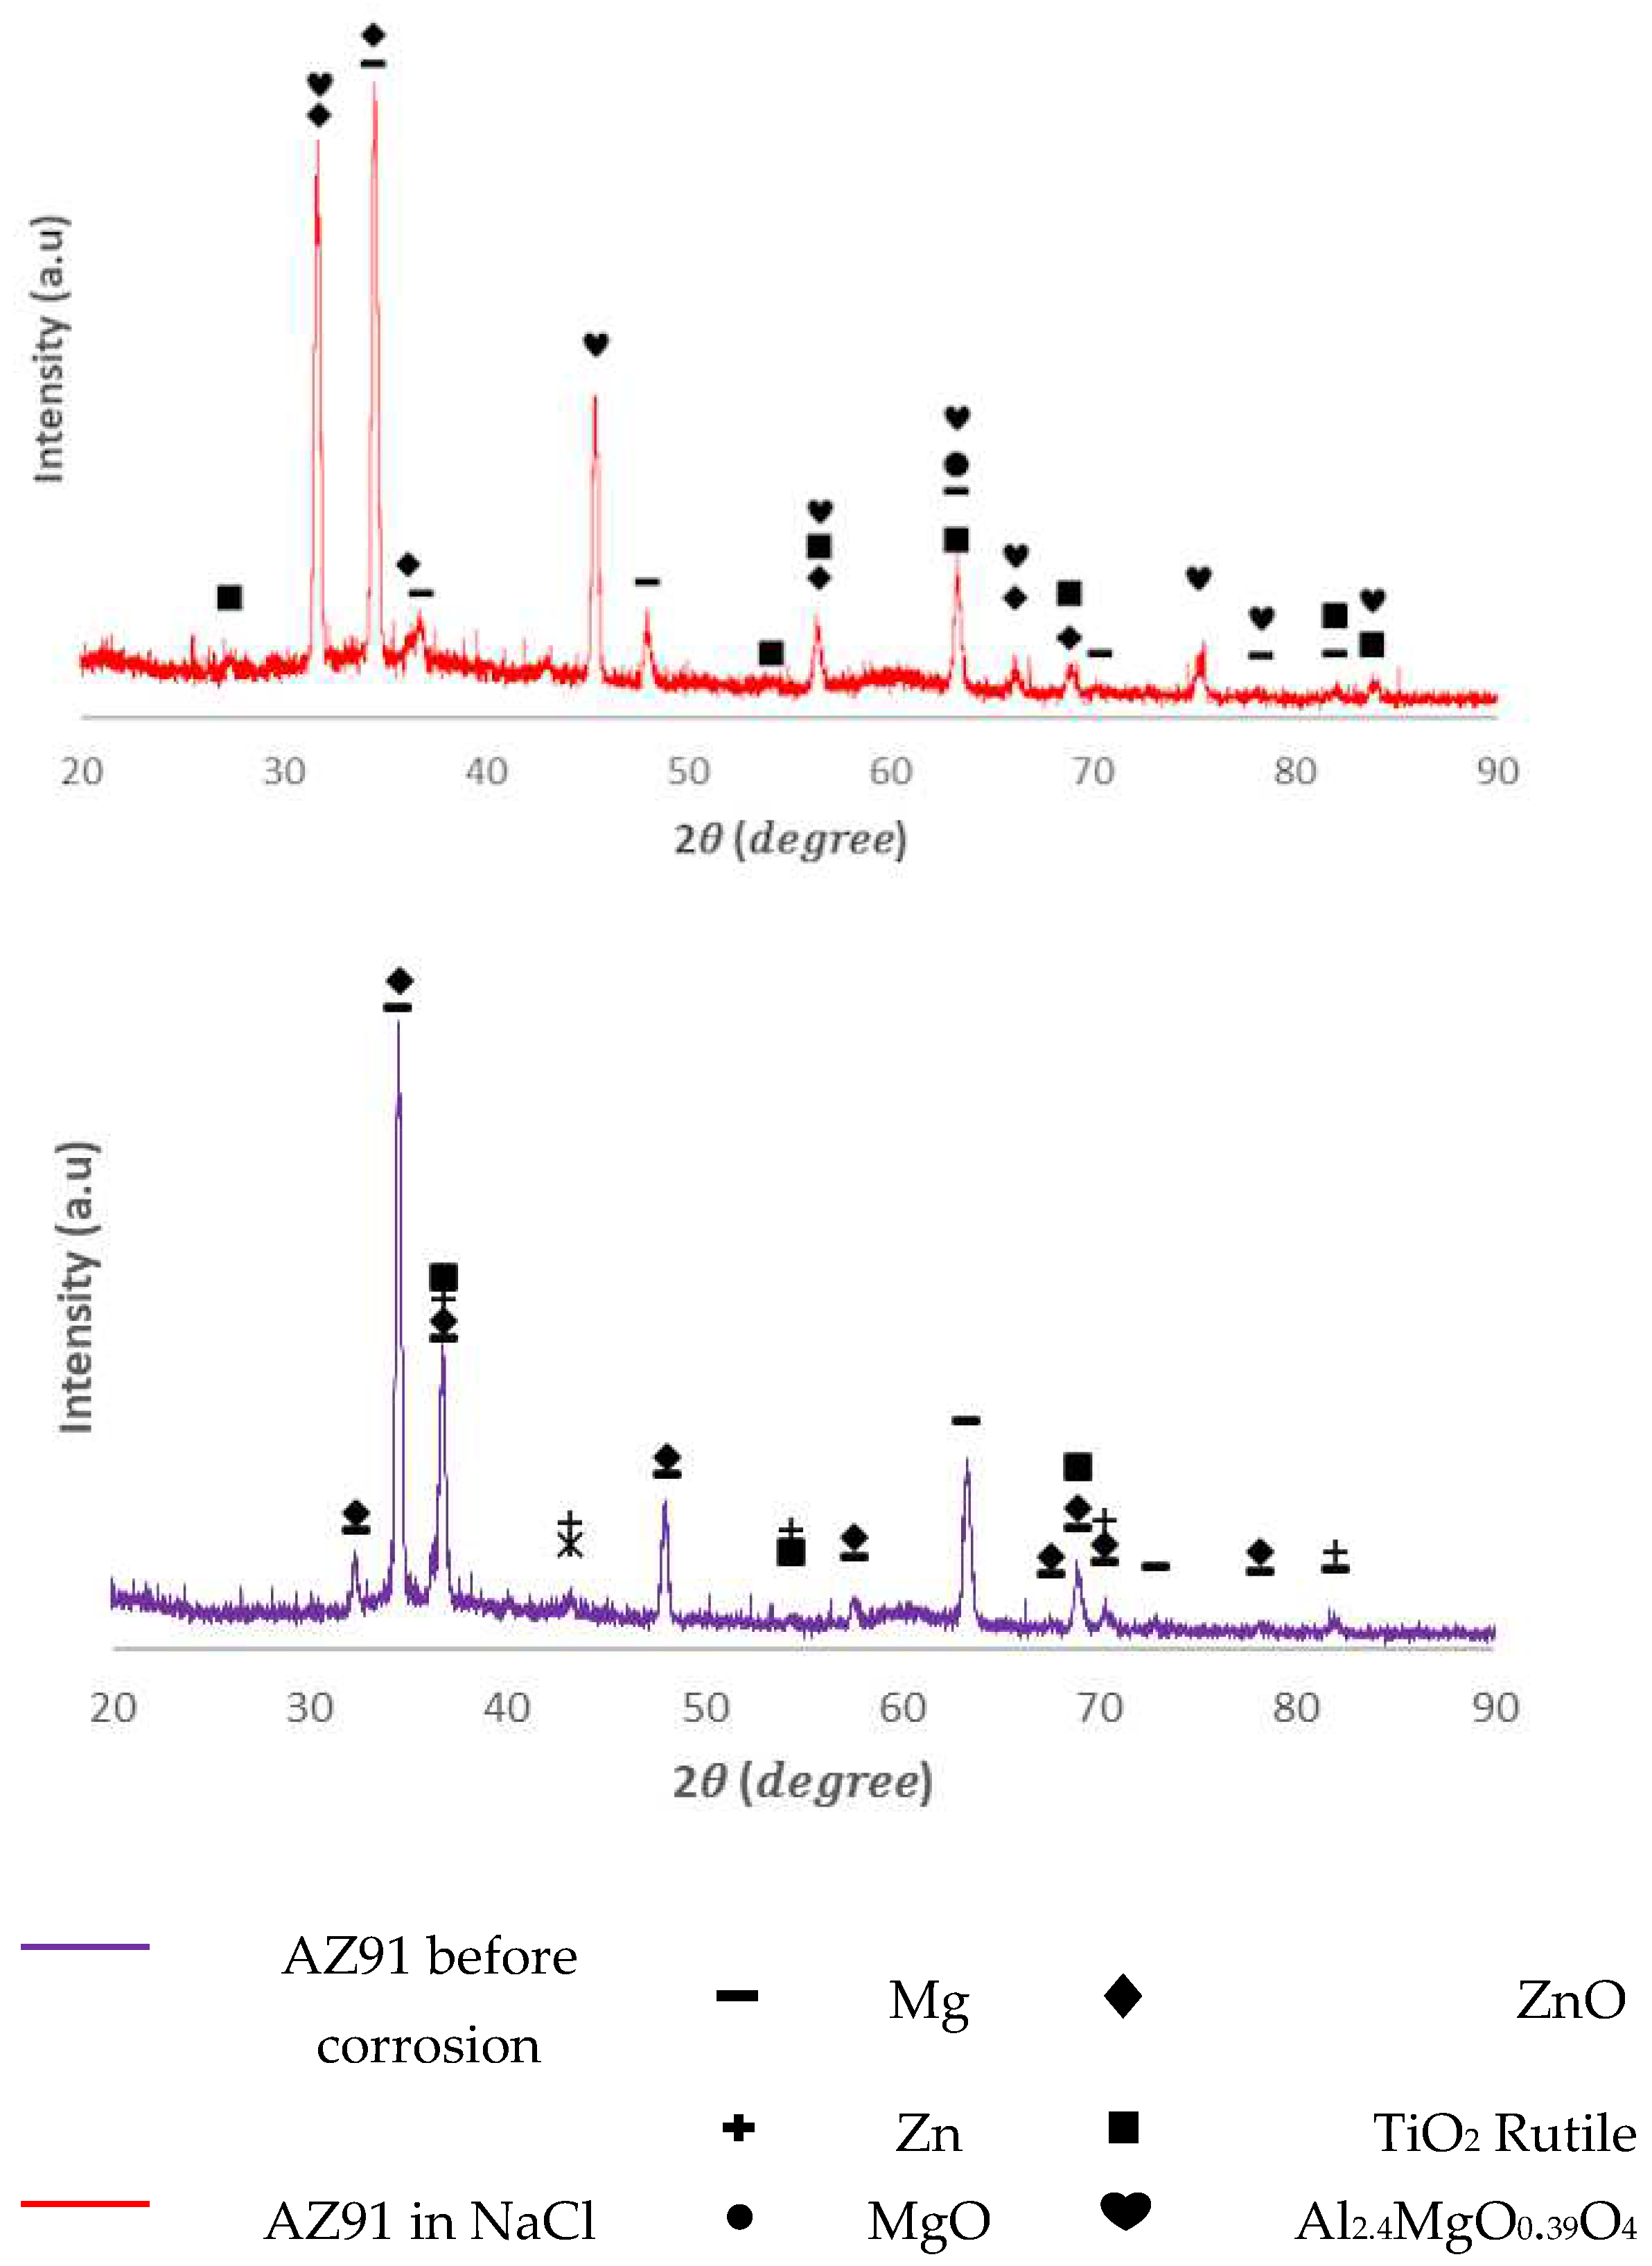
Figure 10.
Polarization curves of AM50 alloy with and without coatings in 3 wt. % NaCl.
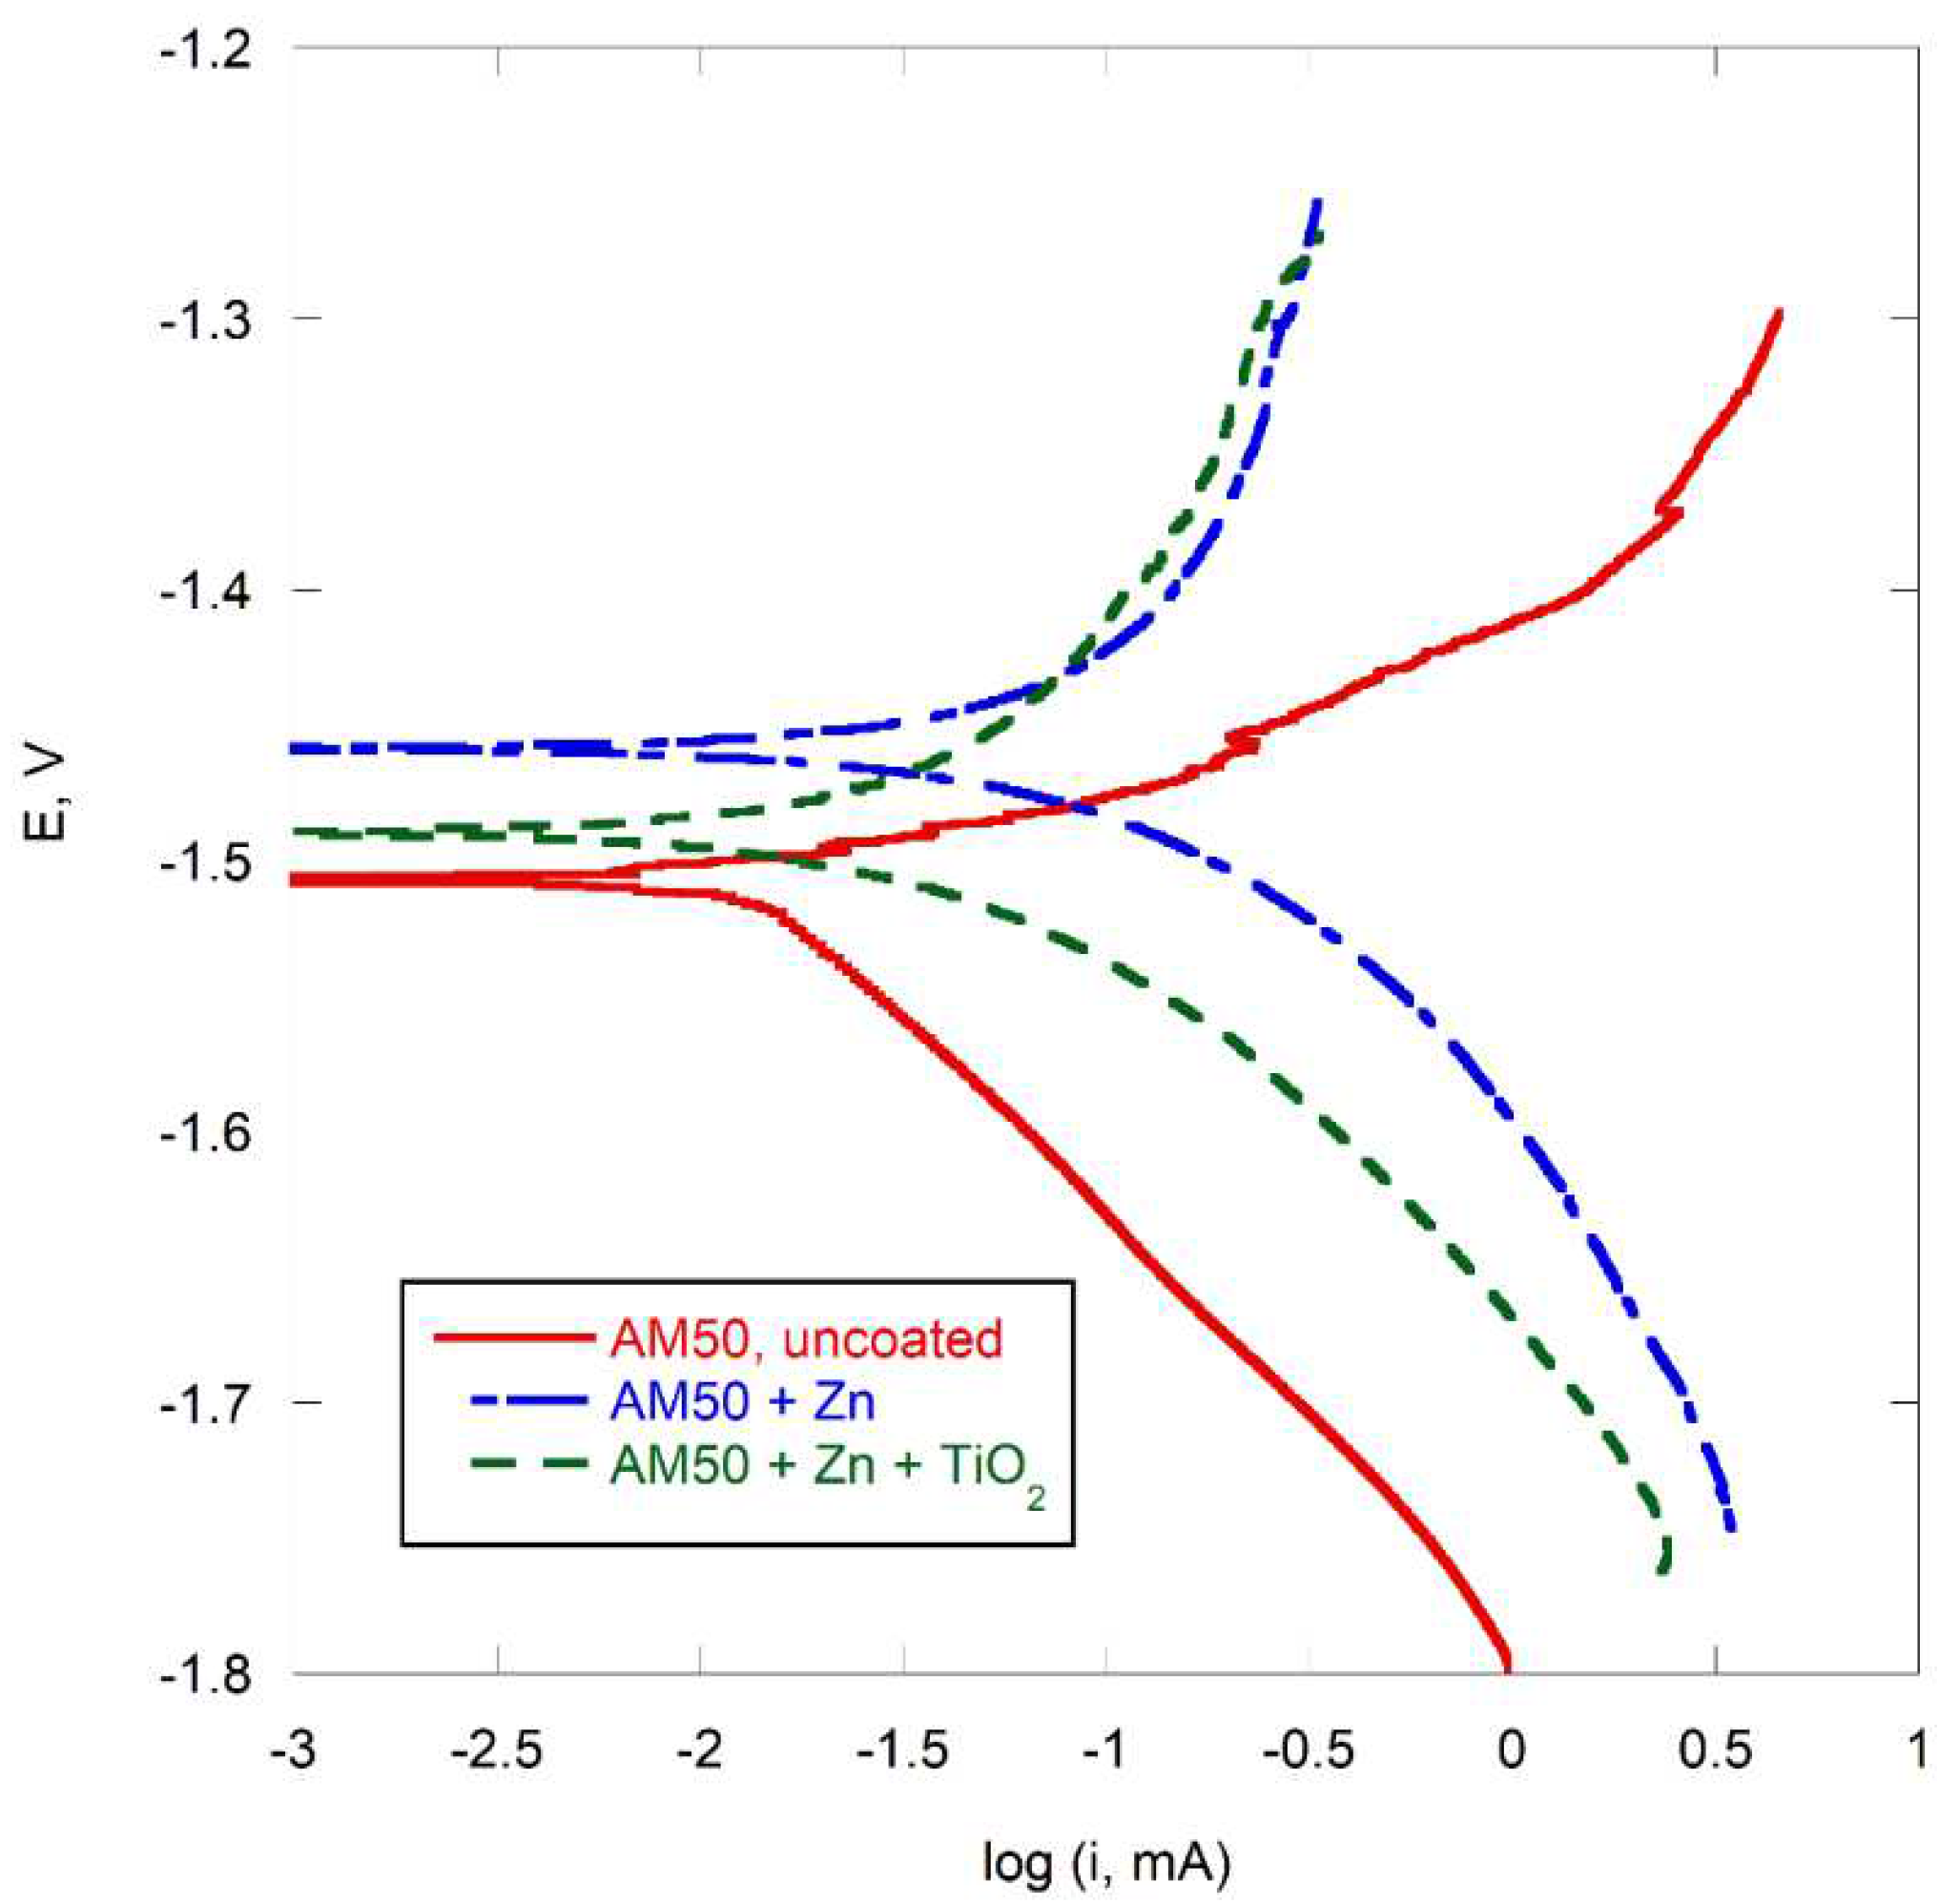
Figure 11.
Linear polarization resistance (LPR) plots of AM50 alloy, with and without coatings, in 3 wt. % NaCl.
Figure 11.
Linear polarization resistance (LPR) plots of AM50 alloy, with and without coatings, in 3 wt. % NaCl.
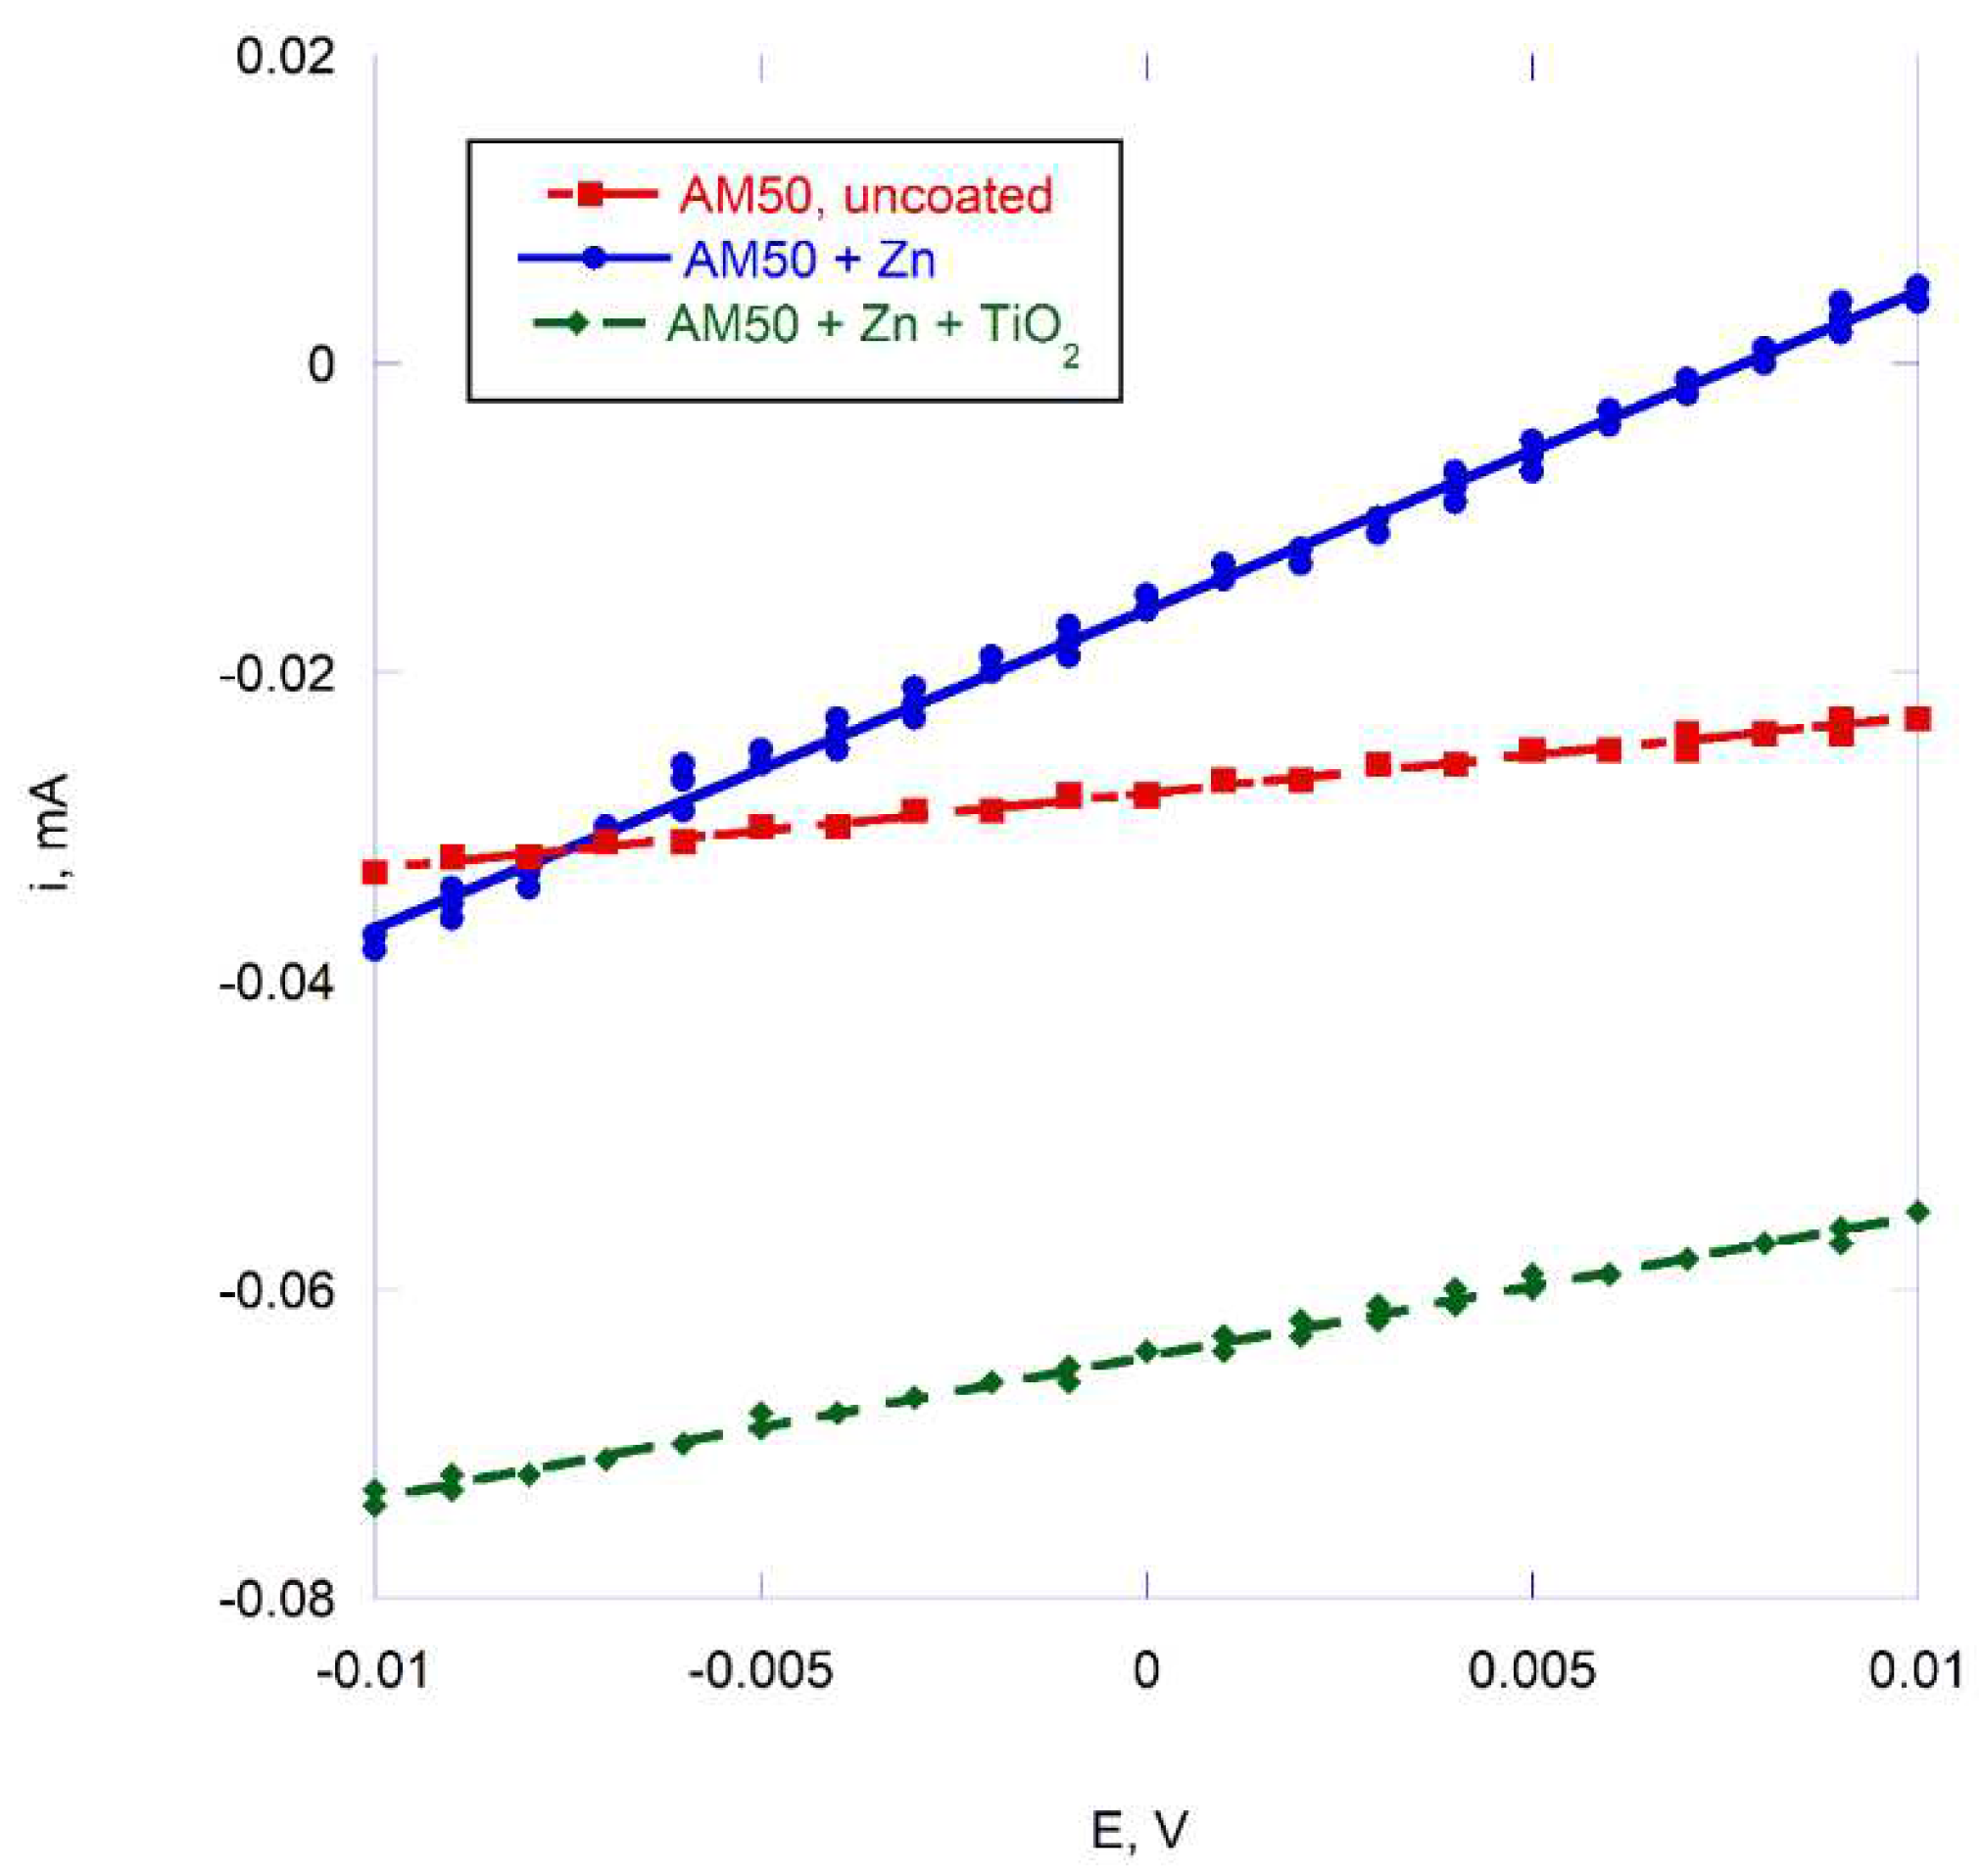
Figure 12.
Polarization curves of AZ91 alloy, with and without coatings, in 3 wt. % NaCl.
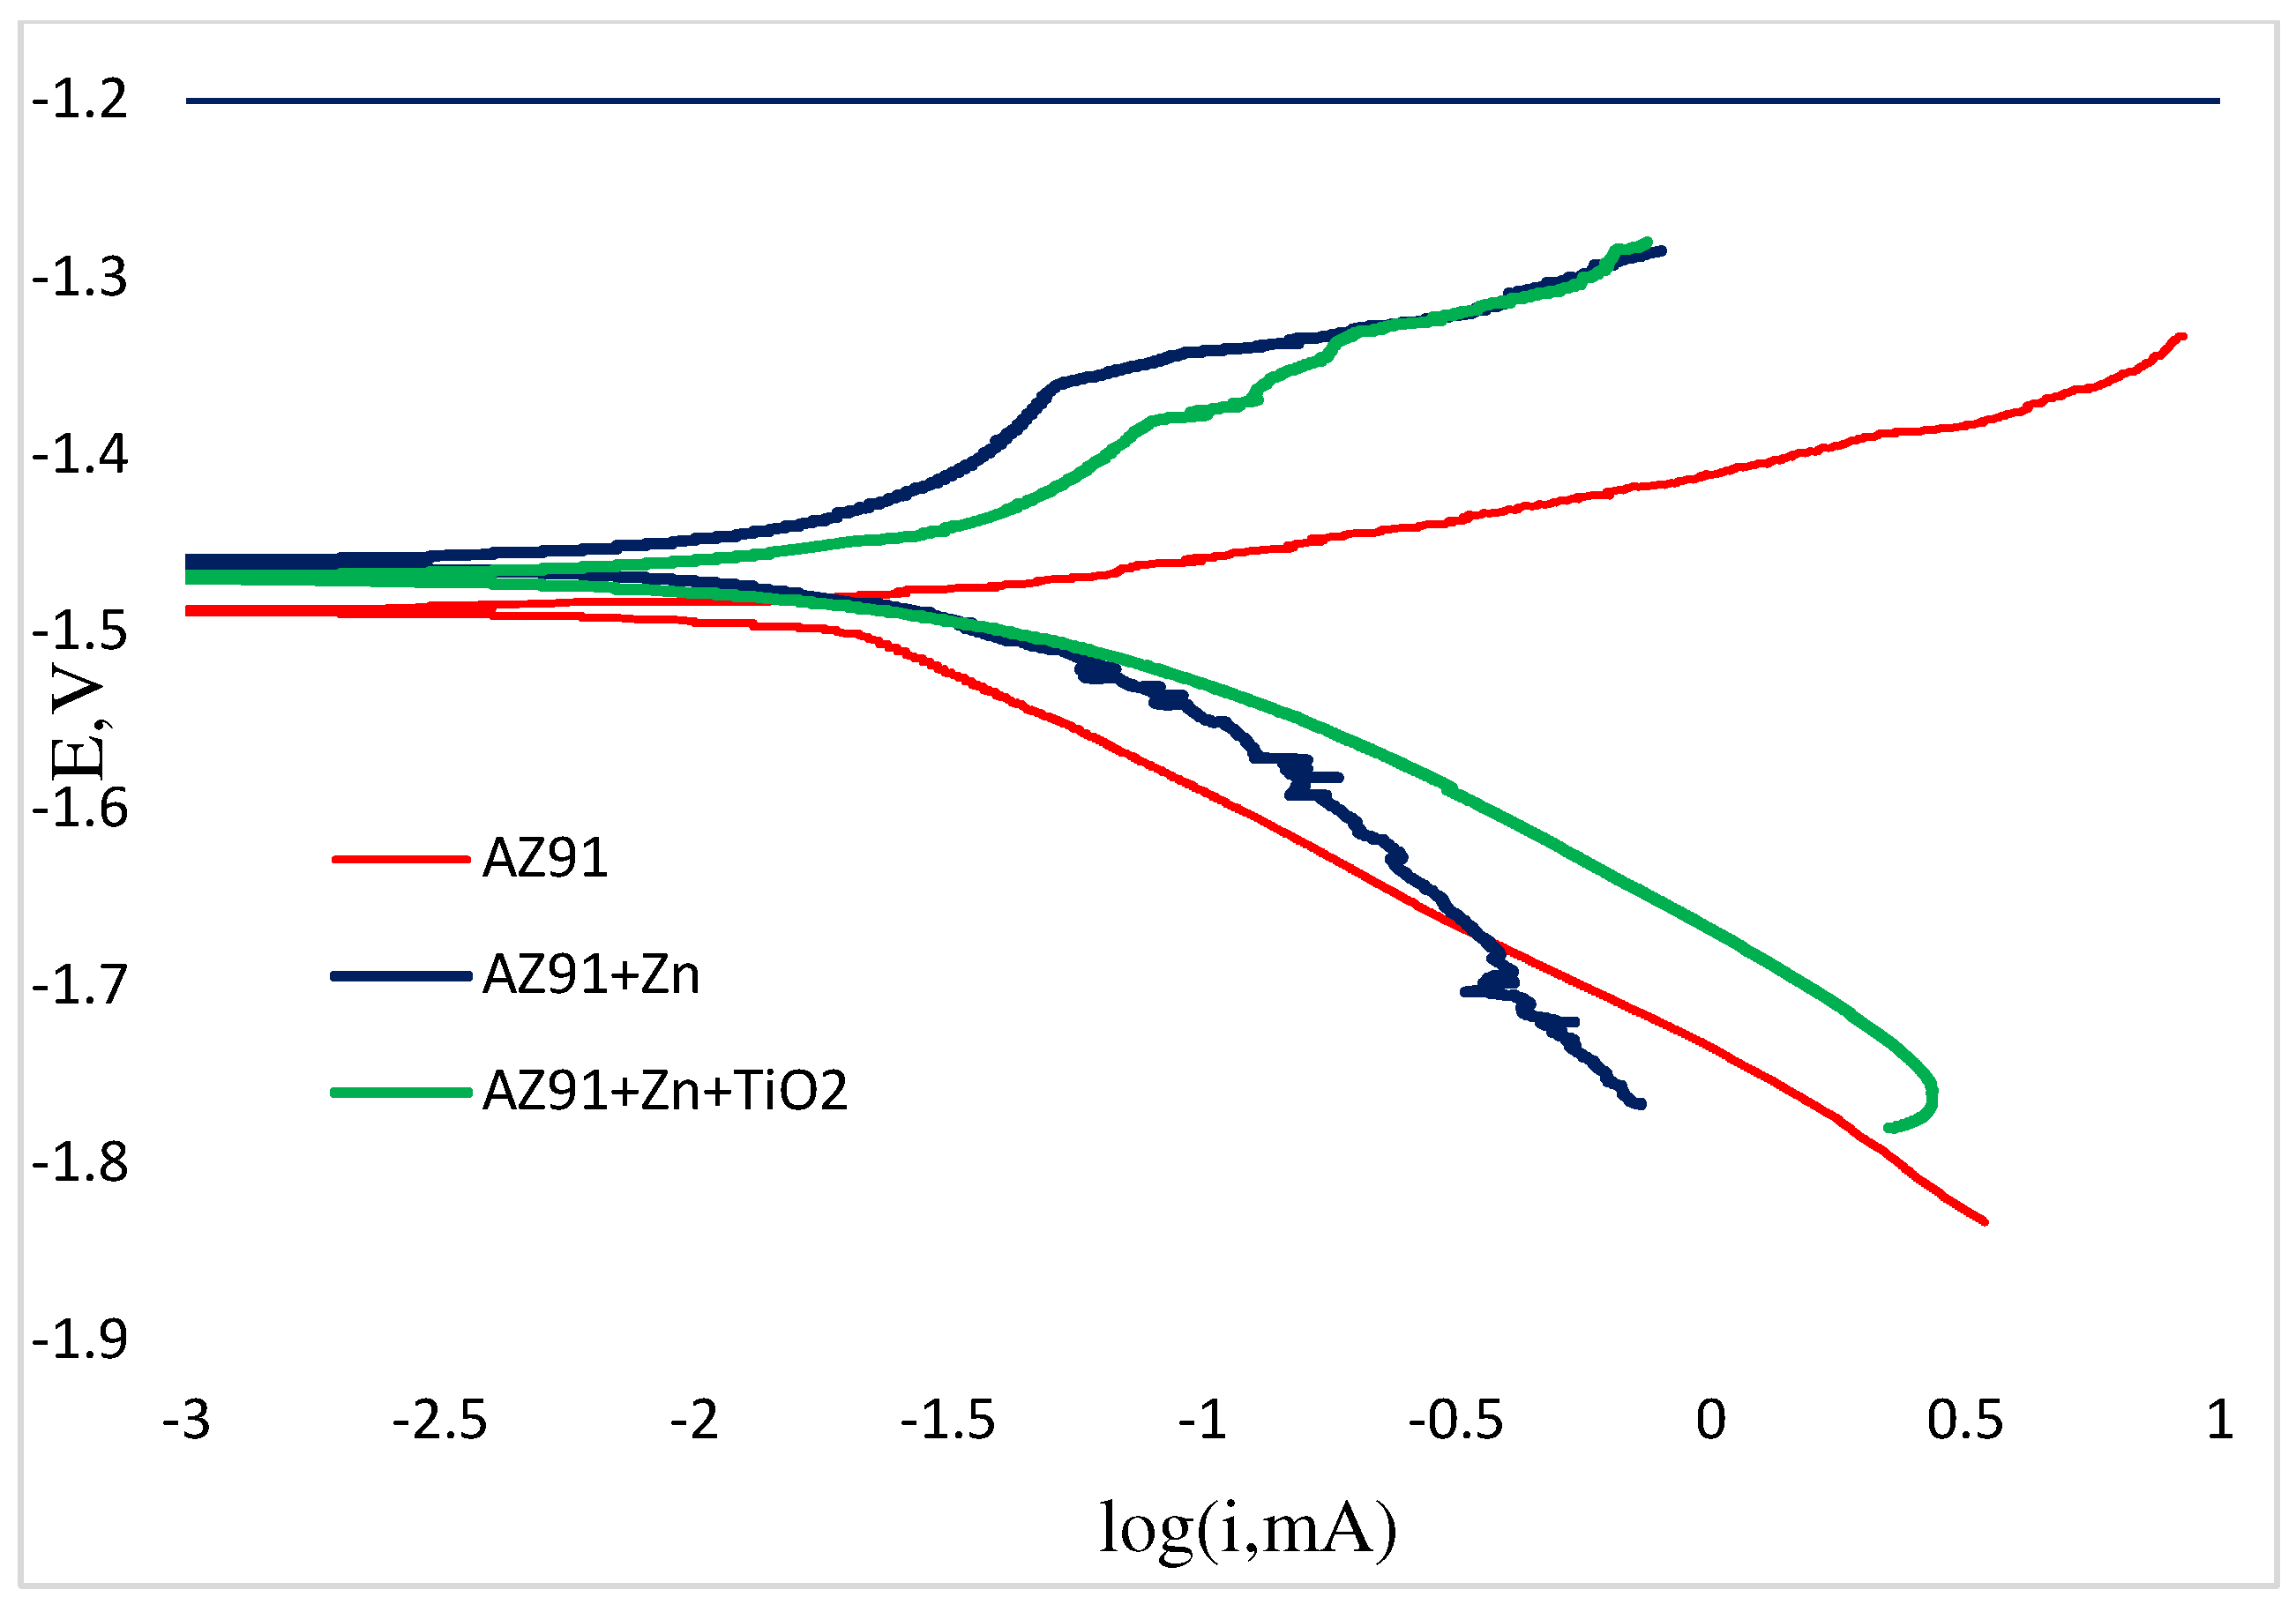
Figure 13.
Linear polarization resistance (LPR) plots of AZ91 alloy, with and without coatings, in 3 wt. % NaCl.
Figure 13.
Linear polarization resistance (LPR) plots of AZ91 alloy, with and without coatings, in 3 wt. % NaCl.
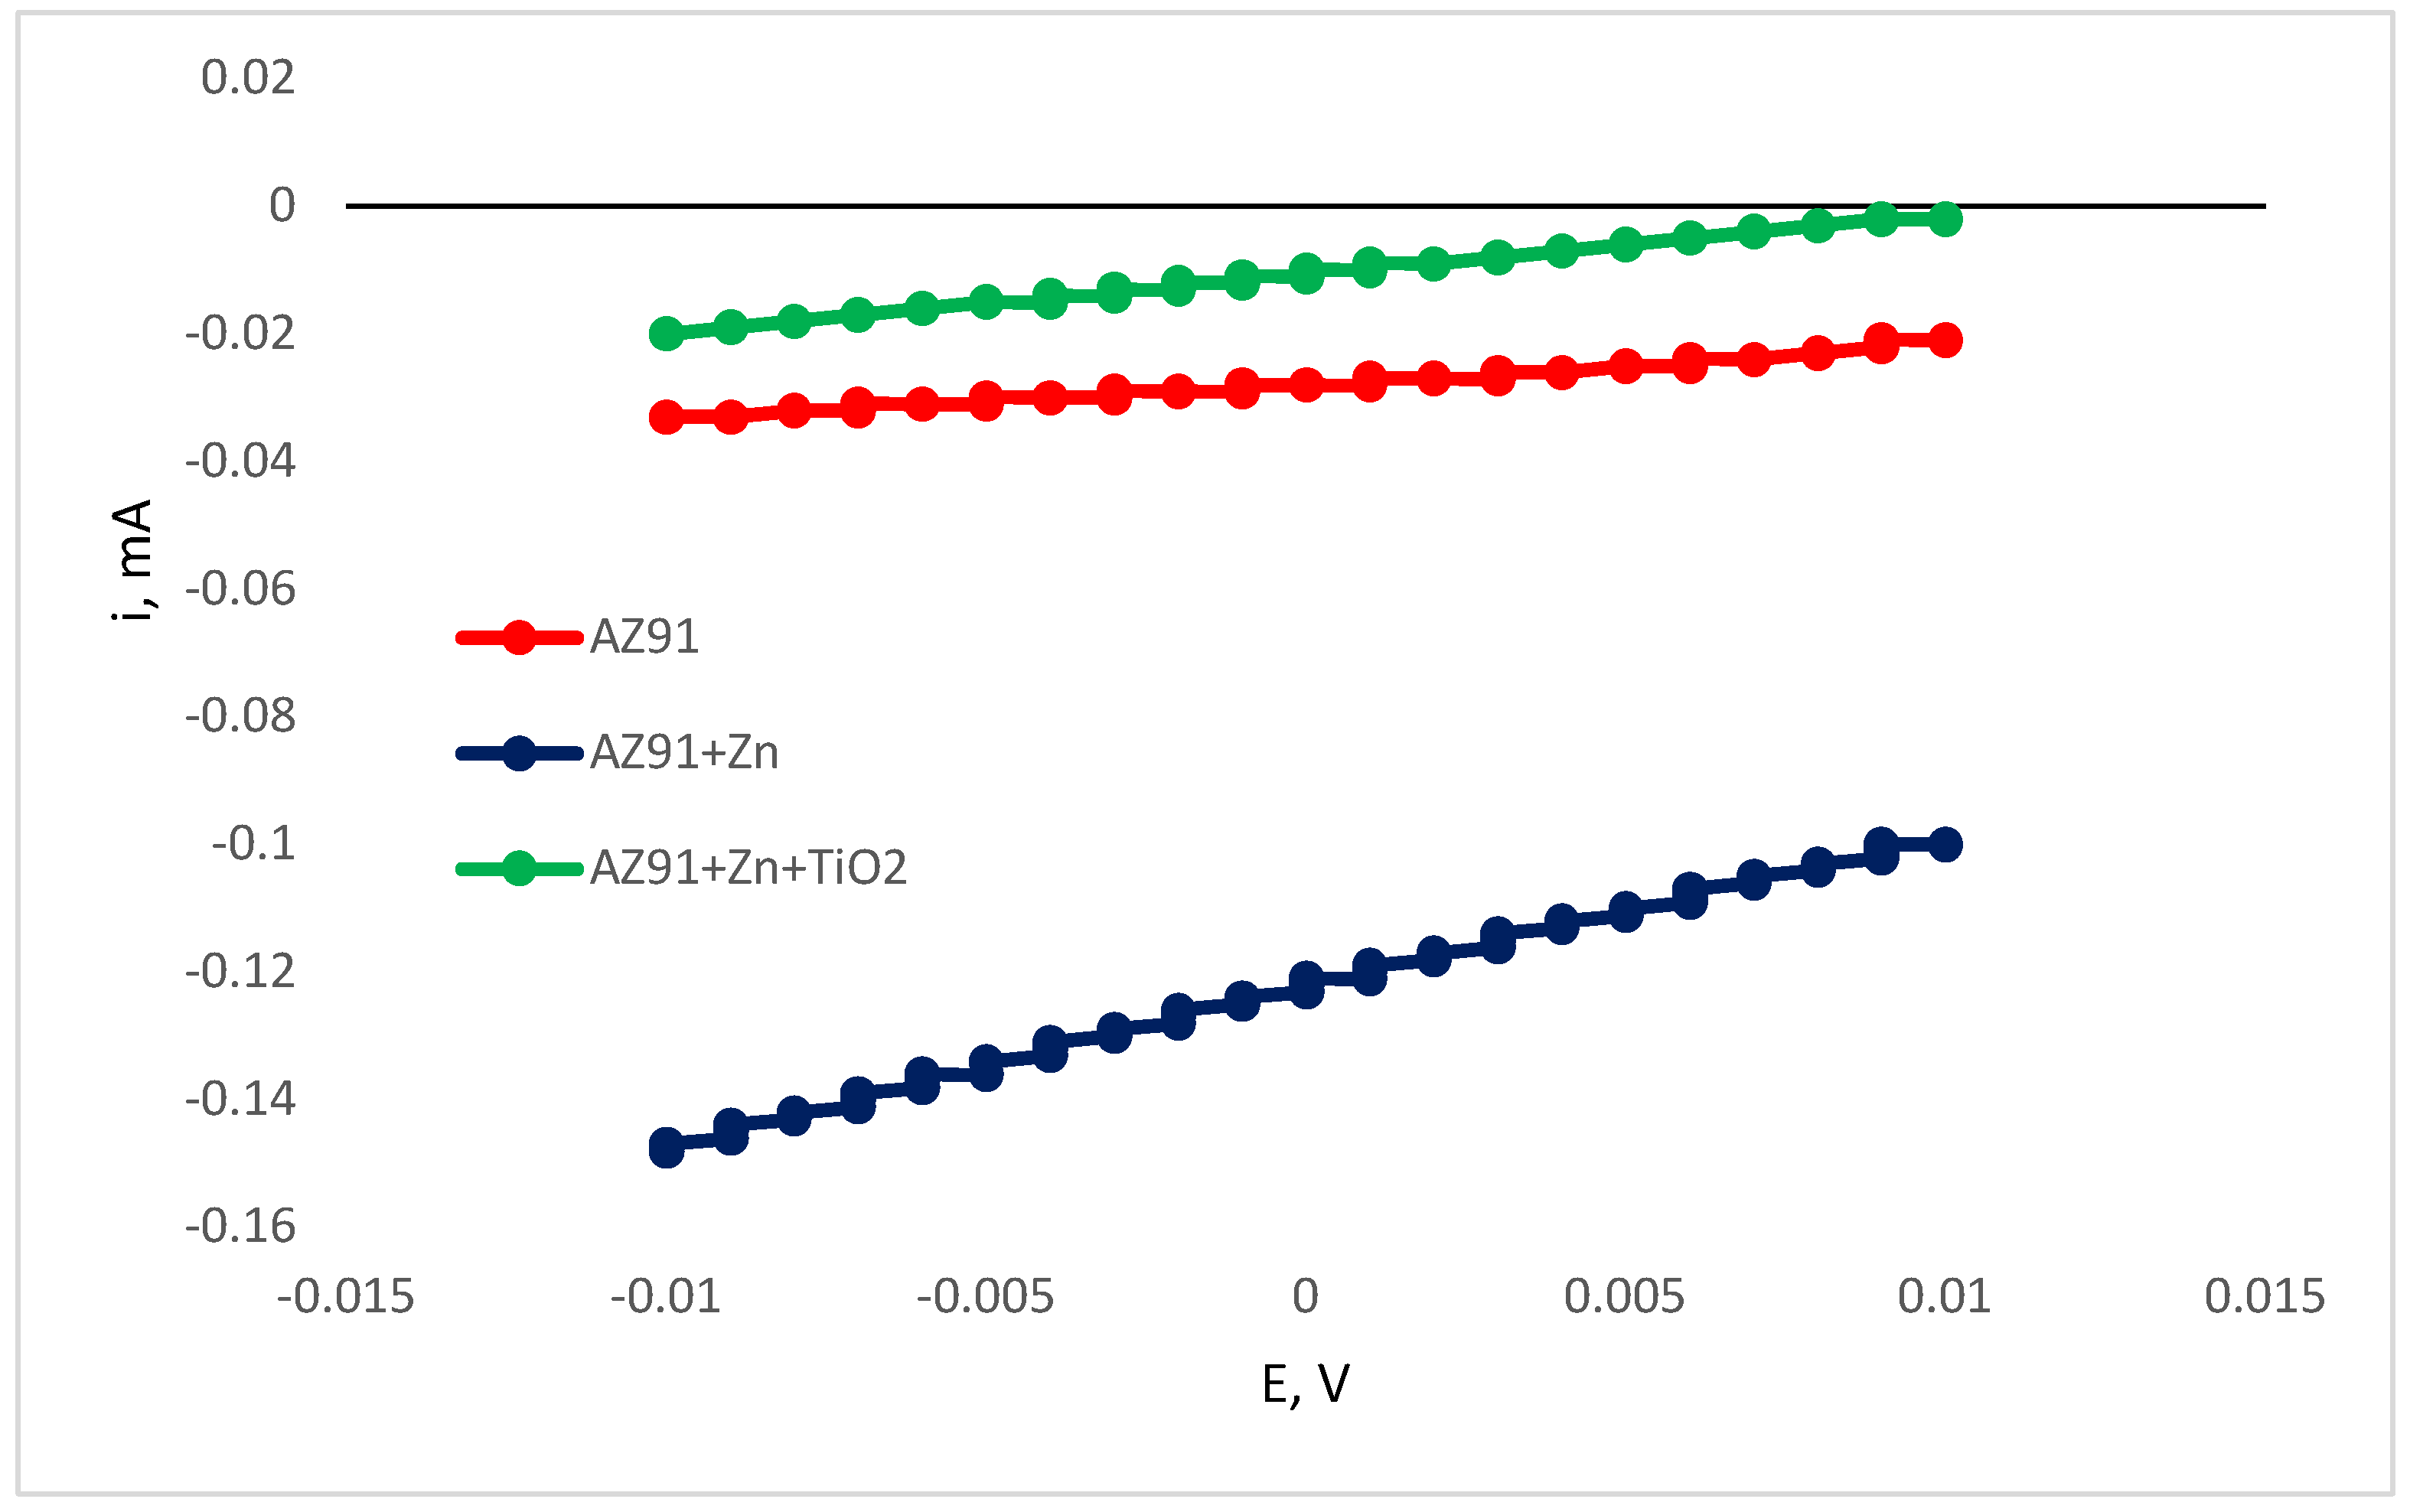

Table 1.
Python results table – for AM50 and AZ91 alloys before corrosion measurement, after corrosion measurement in 3%(Wt) NaCl solution
Table 1.
Python results table – for AM50 and AZ91 alloys before corrosion measurement, after corrosion measurement in 3%(Wt) NaCl solution
| AM50-before | AM50- after | AZ91- before | AZ91- after | |
| Average of the dispersion | 68.22 | 104.03 | 65.58 | 98.28 |
| Standard deviation | 9.40 | 14.22 | 8.29 | 10.03 |
| The amount of titanium dioxide particles on the selected surface in % | 86.22% | 86.33% | 87.36% | 89.79% |
Table 2.
Corrosion potentials and currents measured by OpenShift Container Platform monitoring (OCP), Tafel slope extrapolation (Tafel) and linear polarization resistance (LPR) for AM50 alloy with and without coatings in 3 wt. % NaCl.
Table 2.
Corrosion potentials and currents measured by OpenShift Container Platform monitoring (OCP), Tafel slope extrapolation (Tafel) and linear polarization resistance (LPR) for AM50 alloy with and without coatings in 3 wt. % NaCl.
| ECOR, V | ICOR, µA | |||
|---|---|---|---|---|
| OCP | Tafel | Tafel | LPR | |
| AM50 | - 1.551 | - 1.511 | 15.7 | 24.4 |
| AM50 + Zn | - 1.490 | - 1.465 | 47 | 52 |
| AM50 + Zn + TiO2 | - 1.540 | - 1.465 | 36.8 | 45.5 |
Table 3.
Corrosion potentials and currents measured by OCP monitoring (OCP), Tafel slope extrapolation (Tafel) and linear polarization resistance (LPR) for AZ91 alloy, with and without coatings, in 3 wt. % NaCl.
Table 3.
Corrosion potentials and currents measured by OCP monitoring (OCP), Tafel slope extrapolation (Tafel) and linear polarization resistance (LPR) for AZ91 alloy, with and without coatings, in 3 wt. % NaCl.
| ECOR, V | ICOR, µA | |||
|---|---|---|---|---|
| OCP | Tafel | Tafel | LPR | |
| AZ91 | - 1.569 | -1.511 | 67.76 | 66.72 |
| AZ91 + Zn | - 1.612 | - 1.505 | 35.72 | 58.67 |
| AZ91 + Zn + TiO2 | - 1.596 | - 1.469 | 29.09 | 64.83 |
Disclaimer/Publisher’s Note: The statements, opinions and data contained in all publications are solely those of the individual author(s) and contributor(s) and not of MDPI and/or the editor(s). MDPI and/or the editor(s) disclaim responsibility for any injury to people or property resulting from any ideas, methods, instructions or products referred to in the content. |
© 2025 by the authors. Licensee MDPI, Basel, Switzerland. This article is an open access article distributed under the terms and conditions of the Creative Commons Attribution (CC BY) license (http://creativecommons.org/licenses/by/4.0/).
Copyright: This open access article is published under a Creative Commons CC BY 4.0 license, which permit the free download, distribution, and reuse, provided that the author and preprint are cited in any reuse.


