Submitted:
31 December 2024
Posted:
31 December 2024
You are already at the latest version
Abstract
Predicting trends across multiple research topics presents a significant challenge for multivariate time series forecasting. In the temporal dimension, the fluctuation in popularity of individual research topics reveals trend features, while in the spatial dimension, the interdependence among frequently co-occurring research topics reveals correlation features. However, existing methods often overlook this spatial correlation feature or regard it as static and unchanging, leading to suboptimal prediction results. To address these shortcomings, this paper proposes a novel spatio-temporal graph neural network model, the Temporal Graph Attention Network (T-GAT). This model employs temporal convolution to extract the temporal trend features of research topics and utilizes multi-head graph attention to extract the spatial correlation features among these topics. Notably, the graph attention mechanism is capable of dynamically adjusting the weights of neighboring nodes based on the attention scores learned from the data, thereby reducing the risk of over-smoothing. Experiments conducted on the dataset from the Wanfang Academic Journal Database demonstrate that the proposed model outperforms baseline methods.
Keywords:
topic trend prediction
; feature extraction
; graph attention
; temporal convolution
; multivariate time series forecasting
1. Introduction
Predicting trends in research topics from a vast amount of academic literature can significantly enhance scholars' understanding of prospective research directions and facilitate the advance planning of research projects. Furthermore, it can assist journals in formulating publishing strategies and improving the quality of their publications [1,2].
Keywords are considered essential elements for articulating research topics, as the keywords designated by authors reflect the subjects they regard as most relevant to their work [3]. Therefore, utilizing the keywords from papers as a representation of research topics serves as a concise and effective approach. Citation count, recognized as a straightforward metric for quantifying the impact of a paper, has been widely employed as the basis for various scientific impact metrics, including the h-index and impact factor [4]. This article employs the total citation count of papers associated with a specific research topic to assess its popularity. Moreover, in contrast to methods that focus on analyzing historical trends in research topics [5,6], this article focuses on forecasting future trends in research topics [7,8].
Research topic trend prediction is fundamentally a task of time series forecasting. Approaches based on recurrent neural networks, particularly Long Short-Term Memory Networks (LSTM) [9], have been widely adopted to extract temporal trend features. However, these approaches typically extract temporal trend features independently for each research topic, thereby overlooking the interrelatedness among various topics. In reality, research topics often exert mutual influence on one another. For instance, the rising popularity of "graph neural networks" has facilitated their application in processing road topology information for traffic prediction, thereby enhancing the popularity of "intelligent transportation" [10].
Approaches based on spatio-temporal graph neural networks commonly combine Graph Convolutional Networks (GCNs) with Recurrent Neural Networks (RNNs) or Convolutional Neural Networks (CNNs), thereby enabling the extraction of spatial correlation features. Nevertheless, GCNs assume that the influence of neighboring nodes on a central node is static, failing to dynamically adjust the weights of neighboring nodes [11]. This limitation can result in over-smoothing, where the features of nodes converge to similar values after multiple rounds of neighborhood aggregation.
In order to comprehensively extract temporal trend features and spatial correlation features of various research topics, this study conceptualizes these topics as a temporal graph. In this framework, nodes represent individual research topics, with the attribute of each node being a citation count that varies over time, while edges denote the co-occurrence frequencies among these topics. Building on this foundation, we propose a novel spatio-temporal graph neural network, termed the Temporal Graph Attention Network (T-GAT). Within this model, the temporal convolutional layer is utilized to extract temporal trend features of research topics. By stacking multiple layers, the receptive field of the network can expand exponentially, enabling the processing of longer historical information. Furthermore, the multi-head graph attention layer is employed to extract spatial correlation features among research topics, allowing the model to dynamically adjust the weights of neighboring nodes, thereby reducing the risk of over-smoothing. The main contributions of this study are as follows:
- A multi-head graph attention layer based on scaled dot product operation was proposed to extract correlation features among research topics. This approach allows for the dynamic adjustment of weights assigned to neighboring nodes;
- A spatio-temporal graph neural network that integrates graph attention mechanisms with temporal convolution was proposed in order to comprehensively capture both temporal trend features and spatial correlation features of research topics;
- Extensive experiments were conducted on the Wanfang academic paper dataset, and the proposed method was compared with existing methods through statistical analysis and visualization.
2. Related Works
2.1. Time Series Forecasting
Research topic trend prediction is fundamentally a task of time series forecasting. Traditional methodologies predominantly utilize Long Short-Term Memory (LSTM) networks and Gated Recurrent Units (GRU), both of which are variants of Recurrent Neural Networks (RNN). LSTM networks possess short-term memory capabilities due to their gating mechanisms and memory cells, which enable them to effectively learn temporal features while mitigating the gradient vanishing problem commonly associated with traditional RNNs. For instance, Lu et al. employed author-defined keywords as research topics and utilized LSTM to predict keyword frequency within the ACM Digital Library dataset [12], achieving commendable performance in both short-term and medium-term word frequency predictions. Similarly, Taheri et al. assessed trends in research fields by analyzing the number of publications and applied LSTM to forecast the volume of publications across various computer science research domains over the subsequent five years, utilizing the Microsoft Academic Graph dataset [13].
In contrast, GRU simplifies the architecture by reducing the number of gates from three to two, eliminating the additional memory cell to retain only hidden states. This modification results in fewer model parameters and facilitates easier convergence. Chen et al. employed GRU to monitor the evolutionary trends of research topics across multiple artificial intelligence conferences [14].
While these methods primarily concentrate on extracting temporal trend features for individual variables, they often overlook the extraction of spatial correlation features among variables. This oversight can lead to suboptimal performance in multivariate time series forecasting.
2.2. Spatio-Temporal Graph Neural Networks
When predicting trends across multiple research topics concurrently, the task is classified as multivariate time series forecasting. In this context, correlations frequently exist among the variables. The method based on spatio-temporal graph neural networks integrates Graph Convolutional Networks (GCN) with Recurrent Neural Networks (RNN) or Convolutional Neural Networks (CNN), thereby facilitating the extraction of spatial correlation features among the variables.
One approach to effectively processing spatio-temporal features is the integration of GCN with RNN. DCRNN employs graph diffusion convolution to capture spatial dependencies and utilizes GRU to capture temporal dependencies. This architecture combines GCN and GRU within an encoder-decoder framework to analyze traffic flow [15]. T-GCN incorporates GCN into the gating mechanism of GRU, thereby enabling the simultaneous capture of spatio-temporal dependencies in traffic data [16]. Subsequently, AGCRN substitutes the fully connected layer in GRU with GCN to capture fine-grained spatio-temporal correlations in traffic flow, relying on adaptive node embeddings for its graph convolution [17]. ST-MGCN leverages GCN to learn non-Euclidean correlations among regions, while its proposed context-aware gating mechanism enhances the RNN's capacity to reweight historical observations [18]. Nevertheless, RNN-based methods necessitate waiting for the results of the preceding time step for each computation, which renders the training process inefficient.
An alternative approach involves the integration of GCN with CNN to effectively analyze spatio-temporal features. CNN-based methods leverage parallel computing capabilities to enhance training efficiency. STGCN employs a "sandwich" architecture consisting of Gated TCN, GCN, and Gated TCN to address spatio-temporal dependencies in traffic prediction [19]; Gated TCN serves as a variant of CNN specifically designed for time series forecasting. Graph WaveNet combines GCN and Gated TCN into spatio-temporal layers, facilitating the processing of spatiotemporal graph data across varying granularities through the stacking of multiple spatio-temporal layers [20]. In contrast to preceding methods, STSGCN implements multiple spatio-temporal synchronization graph convolution modules tailored for distinct time intervals within spatio-temporal network data, thereby enabling its graph convolution to concurrently capture spatio-temporal correlations [21].
These methods rely on GCN to extract spatial correlation features from time series variables. However, GCNs operate under the assumption that the contributions of neighboring nodes to the central node are static, thereby lacking the ability to dynamically adjust the weights of neighboring nodes according to their significance. Consequently, this limitation renders GCNs susceptible to over-smoothing, a phenomenon in which the features of nodes converge towards uniformity following multiple rounds of neighborhood aggregation.
3. Method
3.1. Problem Definition
In this study, the research topics are represented by the keywords from papers. The research topics are conceptualized as nodes, while the co-occurrence relationships among them are represented as edges. Consequently, the research topics can be modeled as a graph , where is the set of nodes, with the number of nodes , and is the set of edges. The structural representation of the graph is maintained in a weighted adjacency matrix , wherein the element indicates the co-occurrence frequency of research topics and across all keyword lists. In this study, the popularity of a research topic within a specific year is quantified by the aggregate citation count of all papers pertaining to that topic during that year. Let denote the features of node at time ; then the matrix encapsulates the features of all nodes at time . Therefore, the objective of the research topic trend prediction problem is to learn a function capable of forecasting the popularity of each research topic for the subsequent time steps, utilizing the provided research topic graph and the popularity data from the preceding time steps. The mapping relationship is articulated as follows:
Where and .
3.2. Temporal Trend Feature Extraction
In the temporal dimension, fluctuations in the popularity of individual research topics reveal distinct trend features. Inspired by Graph WaveNet [20], this paper employs Temporal Convolutional Networks (TCN) to extract temporal trend features of the research topics. Specifically, the temporal convolution layer proposed in this paper removes the gating mechanism to reduce parameter complexity and implements weight normalization for the weight parameters. This approach mitigates gradient fluctuations during training, thereby facilitating a smoother optimization process and enhancing the model's convergence. Furthermore, residual connections are incorporated following each convolution operation to address the issue of gradient vanishing in deep networks.
TCNs offer significant advantages over Recurrent Neural Network (RNN) s. Firstly, TCNs do not exhibit temporal step dependency when processing time series data, thereby facilitating the use of parallel computing to enhance computational efficiency. Secondly, the dilated causal convolution within TCNs significantly improves the model's ability to capture long-term dependencies.
Figure 1 illustrates the fundamental principle of temporal convolution. The essence of the TCN is rooted in dilated causal convolution. Causal convolution, in particular, guarantees that the convolution operation is influenced solely by the current and preceding time steps, and is not affected by information from future time steps. This characteristic is essential for adhering to the causal requirements inherent in time series data. Dilated causal convolution introduces intervals between the elements of the kernel, thereby enabling the kernel to execute causal convolution over extended time intervals. Specifically, if we denote the feature representation of a research topic at time as , the output of the TCN at time can be mathematically expressed as follows:
Where is the weight of the -th convolution kernel, while is the kernel size, and d is the dilation coefficient. By incrementally doubling the dilation coefficient at each layer, TCN can attain a larger receptive field with fewer layers, thereby effectively capturing long-term temporal dependencies.
3.3. Spatial Correlation Feature Extraction
In the spatial dimension, the popularity of a given research topic is often associated with the popularity of related topics. The precise extraction of this spatial correlation feature is crucial for enhancing prediction accuracy. This paper employs Graph Attention Networks (GAT) to extract spatial correlation features among research topics. Unlike Graph Convolutional Networks (GCN), GAT can dynamically adjust the weights of neighboring nodes based on attention mechanisms, thereby facilitating a more accurate extraction of correlation features between nodes.
Figure 2 illustrates the multi-head graph attention mechanism proposed in this study, which is implemented in a manner distinct from the original GAT. The original GAT utilized additive attention [22], which computes attention scores through linear transformations and pairwise summation. In contrast, the graph attention layer proposed in this paper is founded on scaled dot product attention, a method derived from the Transformer architecture [23]. This approach calculates attention scores via dot product and scaling operations, thereby enhancing computational efficiency. The formula for calculating the scaled dot product attention score is as follows:
where is the feature representation of all nodes, The matrices and represent the linear transformations for the query and key, respectively. The term serves as a scaling factor, where denotes the hidden dimension. This scaling factor is employed to mitigate the numerical instability issues that may arise due to the increase in dimensionality.
In light of the structural information provided by the graph, it is essential to mask the attention scores in accordance with the adjacency matrix :
where is a real number that approaches negative infinity. The objective of this approach is to ensure that the attention scores of non-neighboring nodes are effectively reduced to zero following softmax normalization. This mechanism restricts the model's focus exclusively to neighboring nodes.
Following the normalization of the attention scores through the application of the function, the updated feature representations for all nodes are derived by aggregating the features of neighboring nodes in accordance with the attention scores:
where and represent the linear transformation parameters and biases associated with the value vectors, respectively.
In the multi-head graph attention mechanism, distinct attention heads independently compute attention scores and aggregate the features of neighboring nodes. Subsequently, the outputs of all attention heads are averaged to derive the final feature representation for all nodes.
The multi-head attention graph mechanism not only captures the intricate correlations among research topics but also enhances the model's robustness and generalization capabilities.
3.4. Model Architecture
Figure 3 illustrates the overall architecture of the Temporal Graph Attention Network (T-GAT) proposed in this study, which comprises multiple stacked spatio-temporal feature extraction blocks and an output section. Each spatio-temporal block includes a temporal convolutional layer and a multi-head graph attention layer, which are utilized to extract temporal trend features and spatial correlation features pertinent to various research topics, respectively. The output from each layer undergoes a residual connection to mitigate the issue of gradient vanishing, as well as layer normalization to adjust the data distribution, followed by activation through the ReLU activation function. A 1x1 convolution is employed to align the hidden dimensions of the residuals with the output of the current layer.
It is noteworthy that the weight normalization applied by the temporal convolution layer pertains specifically to the network weight parameters rather than the data itself, thereby facilitating faster convergence of the model. The dilation coefficient of the temporal convolutional layer is doubled with each passage through a spatio-temporal block from the bottom to the top, enabling the lower layers to address short-term trends while the upper layers manage long-term trends. Concurrently, the graph attention layer aggregates the features of various neighboring nodes based on attention scores. Ultimately, the output section is composed of two fully connected layers.
4. Experiments and Discussion
4.1. Dataset
The dataset utilized in this study is derived from the Economics discipline of the Wanfang Academic Journal Database, encompassing a total of 40,254 metadata entries spanning the years 1999 to 2021. Each metadata entry comprises various elements, including the title, abstract, keywords, publication year, and citation count. During the data preprocessing phase, this study initially extracted a comprehensive list of keywords from the entire metadata set. Subsequently, the keywords were organized according to their frequency, with those appearing fewer than 20 times being excluded from further analysis. From the remaining keywords, a random selection of 367 was made to serve as the final research topics. These selected topics not only encapsulate the primary research directions within the field of economics but also ensure a diverse and representative selection of themes.
To establish the graph structure necessary for the model, this study develops an adjacency matrix that reflects the co-occurrence relationships among various research topics. The value of each element within the adjacency matrix indicates the frequency of co-occurrence of the corresponding pair of research topics across all keyword lists from the relevant literature. Furthermore, this paper constructs a multivariate time series that captures the citation counts for each research topic on an annual basis, represented in matrix form. In this matrix, each column corresponds to a specific research topic, each row represents a particular year, and the values within the matrix denote the total number of citations for that topic in the respective year. The constructed graph structure and time series serve as a foundational dataset for subsequent experimental analyses.
4.2. Experimental Setups
In this article, the samples and labels of the dataset are generated by segmenting the original time series data using a sliding window approach. Specifically, an observation window with a time step of 4 and a prediction window with a time step of 1 are employed to traverse the time sequence. The values contained within the observation window serve as samples, while the values within the prediction window are designated as labels. Subsequently, the dataset is divided in chronological order, with 60% allocated for the training set and 40% for the testing set.
During the model training process, it is recommended to set the number of training epochs to 3000 and to implement an early stopping strategy. Specifically, training should be halted if the loss does not exhibit a decrease over 50 consecutive training iterations, thereby mitigating the risk of overfitting. The loss function employed is the Mean Squared Error (MSE), while the Adam optimizer is utilized with a learning rate of 1E-3 and a weight decay of 1E-5. The model's hidden dimension is configured to 32, and the convolution kernel size for the temporal convolutional layer is set to 2. The dilation coefficient is designed to double with each increase in the number of spatio-temporal blocks, commencing from a value of 1. To ensure that the input and output time lengths are equal, padding and truncation operations are applied. Furthermore, the number of attention heads in the multi-head graph attention layer is established at 4.
4.3. Evaluation Metrics
To conduct a thorough assessment of the accuracy of the model's predictions regarding research topic trends, this paper employs several evaluation metrics, including Root Mean Squared Error (RMSE), Mean Absolute Error (MAE), and Coefficient of Determination (R-squared, R²). These metrics provide a multifaceted evaluation of the model's predictive performance, thereby enhancing the comprehensiveness and reliability of the assessment outcomes.
RMSE serves as an indicator of the overall prediction error, with smaller values indicating greater predictive accuracy of the model. The formula is expressed as follows:
where denotes the actual value of the -th sample, while signifies the predicted value of the -th sample. Additionally, represents the number of samples.
MAE quantitatively represents the average discrepancy between predicted values and actual values; thus, a smaller MAE indicates a higher level of predictive accuracy of the model. The formula is expressed as follows:
serves as a metric for assessing the degree of fit between a model and the corresponding data, and is expressed as follows:
Where, is the mean of the actual values. The range of is from to ; a value closer to indicates a stronger explanatory power of the model with respect to the data.
4.4. Results and Discussion
4.4.1. Performance Evaluation
In order to conduct a comprehensive evaluation of the performance of the T-GAT model proposed in this article, this section compares it with several widely utilized methods for time series forecasting and spatio-temporal graph neural networks.
- LSTM: A variant of RNNs designed to capture temporal dependencies through the incorporation of memory cells and gating mechanisms;
- GRU: A variant of RNNs that regulates the transmission and updating of information via gating mechanisms. The structure of GRU is less complex compared to that of LSTM;
- T-GCN [16]: Integrates GCN and GRU to effectively capture both spatial and temporal features of the data simultaneously;
- Graph WaveNet(GWNet)[20]: Integrates GCN and TCN to effectively capture both spatial and temporal features of the data.
Table 1 presents a comparative analysis of the performance of T-GAT and various baseline models in predicting research topic trends on the Wanfang academic dataset. The results indicate that the RMSE of spatio-temporal graph neural networks, including T-GAT, T-GCN, and Graph WaveNet, is significantly lower than that of traditional time series forecasting models such as LSTM and GRU. This finding underscores the importance of extracting spatial correlation features of research topics for enhancing prediction performance. Moreover, the MAE of Graph WaveNet, which employs TCN for the extraction of temporal trend features, is found to be between 6.14 and 14.60 units lower than that of T-GCN, which utilizes GRU for temporal feature extraction. This observation highlights the superior feature extraction capabilities of convolutional architectures in comparison to recurrent architectures. Additionally, the MAE of T-GAT, as proposed in this study, is between 10.60 and 14.63 units lower than that of Graph WaveNet, further demonstrating the advantages of T-GAT in effectively extracting spatio-temporal features of research topics.
Figure 4 illustrates the variation in MAE and R² for each method across different observation time steps. It is evident that as the observation time step increases, the MAE for each model exhibits a downward trend, suggesting that an extended observation history enhances the model's learning capabilities. Specifically, the T-GAT proposed in this study requires only 3 to 5 observation time steps to achieve a significant reduction in the MAE of the predictive outcomes. This finding implies that to forecast the popularity of research topics for the upcoming year, the model necessitates historical data spanning the previous 3 to 5 years to yield satisfactory results. Furthermore, in comparison to other models, the R² value of T-GAT remains more stable across varying time steps, indicating that T-GAT demonstrates superior robustness in data interpretation.
4.4.2. Interpretability Analysis
In order to evaluate the effectiveness of the model proposed in this paper more intuitively, the actual values and the prediction curves of T-GAT and Graph WaveNet (GWNet) for four randomly selected research topics are illustrated in Figure 5. The observation time step is set at 4 years, while the prediction time step is 1 year. The results indicate that the prediction curve of Graph WaveNet is relatively smooth, whereas T-GAT more accurately captures the trends in research topic changes. This discrepancy may be attributed to the over-smoothing phenomenon associated with the GCN utilized in Graph WaveNet, which tends to homogenize node features as the number of network layers increases. In contrast, T-GAT's ability to capture node correlations is grounded in an attention mechanism that dynamically adjusts the weights of different neighboring nodes during each neighborhood aggregation, thereby mitigating the risk of over-smoothing.
Figure 6 illustrates the capacity of the graph attention mechanism to extract correlation features of research topics. Specifically, panel (a) presents the standardized adjacency matrix of the top 50 research topics, panel (b) displays the attention matrix of these topics as learned by the model, and panel (c) provides a comparative analysis of the actual trends across multiple topics. It is noteworthy that the 0th column of the attention matrix indicates that topic 0 possesses a higher weight relative to topics 10, 27, 40, 43, and others. This observation is corroborated in panel (c), where the citation count for topic 0 reached its zenith in 2006, while the corresponding topics 10, 27, 40, and 43 also experienced peak citation counts in the subsequent year. This suggests that the prominence of topic 0 exerts a significant influence on the aforementioned topics. Conversely, the adjacency matrix fails to capture this correlation, thereby highlighting the importance of dynamically adjusting the weights of neighboring nodes through the attention mechanism to more accurately extract the correlation features among research topics.
5. Conclusion
In order to facilitate the prediction of trends in research topics, this paper introduces a research topic graph and proposes a novel spatio-temporal graph neural network termed the Temporal Graph Attention Network (T-GAT). This model employs temporal convolution to extract temporal trend features inherent to the research topics and utilizes multi-head graph attention to capture spatial correlation features among these topics. Notably, the graph attention mechanism is designed to dynamically adjust the weights of neighboring nodes based on the attention scores derived from the data, thereby mitigating the risk of over-smoothing. Experiments on the Wanfang academic paper dataset indicate that the predictive performance of T-GAT surpasses that of existing models. Future research will focus on the extraction of research topics from paper abstracts through the application of topic models to enhance the initial feature set. Additionally, further optimization of the network architecture and parameter configurations will be pursued to investigate the potential applicability of this approach to other multivariate time series prediction tasks.
Author Contributions
Conceptualization, Z.G. and J.H.; methodology, Z.G.; software, Z.G.; validation, Z.G., M.L. and J.H.; formal analysis, J.H.; investigation, Z.G.; resources, J.H.; data curation, Z.G.; writing—original draft preparation, Z.G.; writing—review and editing, M.L. and J.H.; visualization, Z.G.; supervision, M.L. and J.H. All authors have read and agreed to the published version of the manuscript.
Funding
This research received no external funding.
Data Availability Statement
The data presented in this study are available on request from the corresponding author due to privacy concerns.
Conflicts of Interest
The authors declare no conflicts of interest.
References
- Behrouzi, S.; Sarmoor, Z.S.; Hajsadeghi, K.; Kavousi, K. Predicting scientific research trends based on link prediction in keyword networks. Journal of Informetrics 2020, 14, 101079. [Google Scholar] [CrossRef]
- Xu, S.; Hao, L.; An, X.; Yang, G.; Wang, F. Emerging research topics detection with multiple machine learning models. Journal of Informetrics 2019, 13, 100983. [Google Scholar] [CrossRef]
- Lu, W.; Liu, Z.; Huang, Y.; Bu, Y.; Li, X.; Cheng, Q. How do authors select keywords? A preliminary study of author keyword selection behavior. Journal of Informetrics 2020, 14, 101066. [Google Scholar] [CrossRef]
- Wang, J.; Xu, J.; Chen, W.; Zhao, L. When Research Topic Trend Prediction Meets Fact-Based Annotations. Data Science and Engineering 2022, 7, 316–327. [Google Scholar] [CrossRef]
- Hu, Y.-H.; Tai, C.-T.; Liu, K.E.; Cai, C.-F. Identification of highly-cited papers using topic-model-based and bibliometric features: The consideration of keyword popularity. Journal of Informetrics 2020, 14, 101004. [Google Scholar] [CrossRef]
- Behpour, S.; Mohammadi, M.; Albert, M.V.; Alam, Z.S.; Wang, L.; Xiao, T. Automatic trend detection: Time-biased document clustering. Knowledge-Based Systems 2021, 220, 106907. [Google Scholar] [CrossRef]
- Abuhay, T.M.; Nigatie, Y.G.; Kovalchuk, S.V. Towards predicting trend of scientific research topics using topic modeling. Procedia Computer Science 2018, 136, 304–310. [Google Scholar] [CrossRef]
- Katsurai, M.; Ono, S. TrendNets: mapping emerging research trends from dynamic co-word networks via sparse representation. Scientometrics 2019, 121, 1583–1598. [Google Scholar] [CrossRef]
- Siami-Namini, S.; Tavakoli, N.; Namin, A.S. The performance of LSTM and BiLSTM in forecasting time series. In Proceedings of the 2019 IEEE International conference on big data (Big Data); 2019; pp. 3285–3292. [Google Scholar]
- Wu, Z.; Pan, S.; Chen, F.; Long, G.; Zhang, C.; Philip, S.Y. A comprehensive survey on graph neural networks. IEEE transactions on neural networks and learning systems 2020, 32, 4–24. [Google Scholar] [CrossRef] [PubMed]
- Kipf, T.N.; Welling, M. Semi-Supervised Classification with Graph Convolutional Networks. In Proceedings of the International Conference on Learning Representations; 2022. [Google Scholar]
- Lu, W.; Huang, S.; Yang, J.; Bu, Y.; Cheng, Q.; Huang, Y. Detecting research topic trends by author-defined keyword frequency. Information Processing & Management 2021, 58, 102594. [Google Scholar]
- Taheri, S.; Aliakbary, S. Research trend prediction in computer science publications: a deep neural network approach. Scientometrics 2022, 127, 849–869. [Google Scholar] [CrossRef]
- Chen, C.; Wang, Z.; Li, W.; Sun, X. Modeling scientific influence for research trending topic prediction. In Proceedings of the AAAI Conference on Artificial Intelligence; 2018. [Google Scholar]
- Li, Y.; Yu, R.; Shahabi, C.; Liu, Y. Diffusion Convolutional Recurrent Neural Network: Data-Driven Traffic Forecasting. In Proceedings of the International Conference on Learning Representations; 2018. [Google Scholar]
- Zhao, L.; Song, Y.; Zhang, C.; Liu, Y.; Wang, P.; Lin, T.; Deng, M.; Li, H. T-GCN: A temporal graph convolutional network for traffic prediction. IEEE transactions on intelligent transportation systems 2019, 21, 3848–3858. [Google Scholar] [CrossRef]
- Bai, L.; Yao, L.; Li, C.; Wang, X.; Wang, C. Adaptive graph convolutional recurrent network for traffic forecasting. Advances in neural information processing systems 2020, 33, 17804–17815. [Google Scholar]
- Geng, X.; Li, Y.; Wang, L.; Zhang, L.; Yang, Q.; Ye, J.; Liu, Y. Spatiotemporal multi-graph convolution network for ride-hailing demand forecasting. In Proceedings of the AAAI conference on artificial intelligence; 2019; pp. 3656–3663. [Google Scholar]
- Yu, B.; Yin, H.; Zhu, Z. Spatio-temporal graph convolutional networks: a deep learning framework for traffic forecasting. In Proceedings of the 27th International Joint Conference on Artificial Intelligence; 2018; pp. 3634–3640. [Google Scholar]
- Wu, Z.; Pan, S.; Long, G.; Jiang, J.; Zhang, C. Graph wavenet for deep spatial-temporal graph modeling. In Proceedings of the 28th International Joint Conference on Artificial Intelligence; 2019; pp. 1907–1913. [Google Scholar]
- Song, C.; Lin, Y.; Guo, S.; Wan, H. Spatial-temporal synchronous graph convolutional networks: A new framework for spatial-temporal network data forecasting. In Proceedings of the AAAI conference on artificial intelligence; 2020; pp. 914–921. [Google Scholar]
- Veličković, P.; Cucurull, G.; Casanova, A.; Romero, A.; Liò, P.; Bengio, Y. Graph Attention Networks. In Proceedings of the International Conference on Learning Representations; 2018. [Google Scholar]
- Vaswani, A. Attention is all you need. Advances in Neural Information Processing Systems 2017. [Google Scholar]
Figure 1.
Temporal convolution with a kernel size of 2.
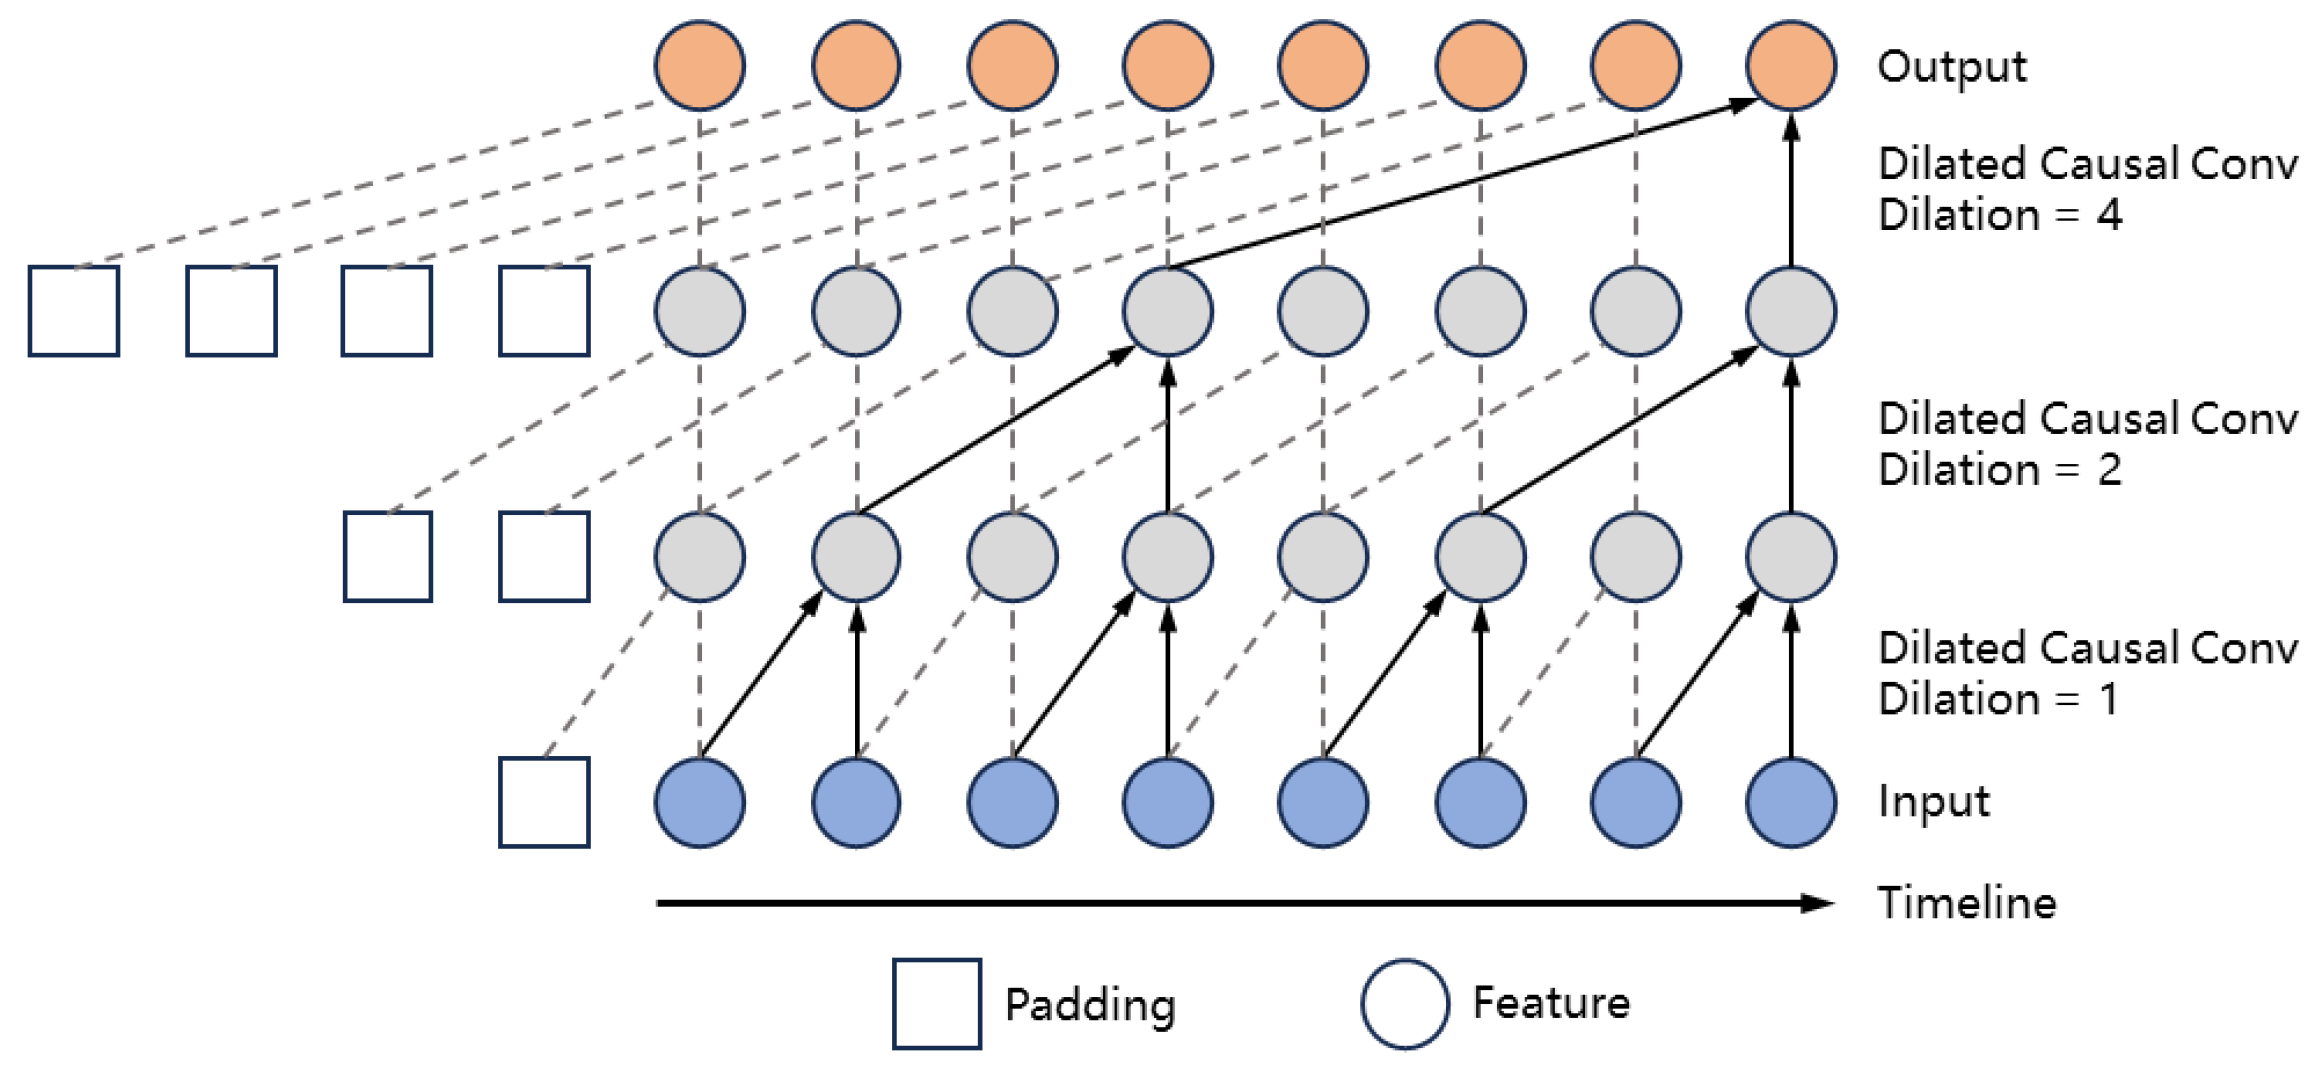
Figure 2.
Multi-head graph attention mechanism based on scaled dot product.
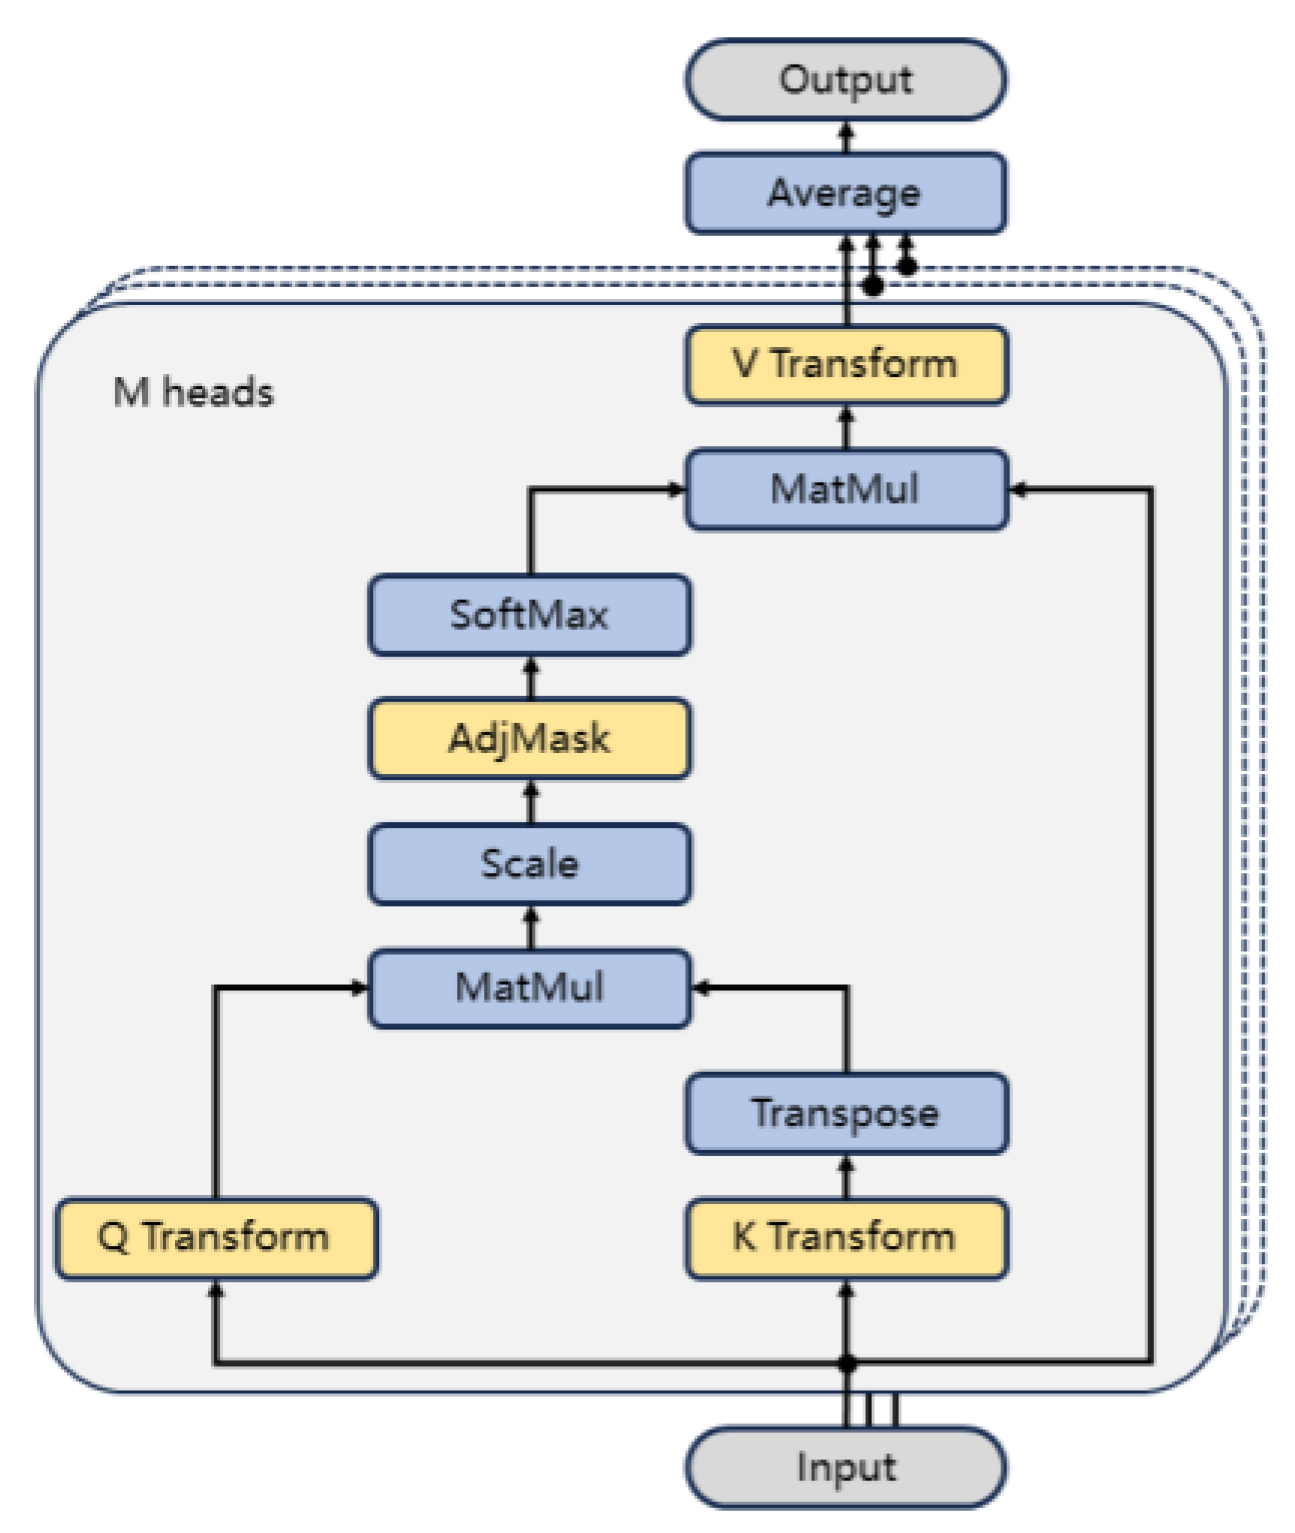
Figure 3.
Architecture of the Temporal Graph Attention Network.
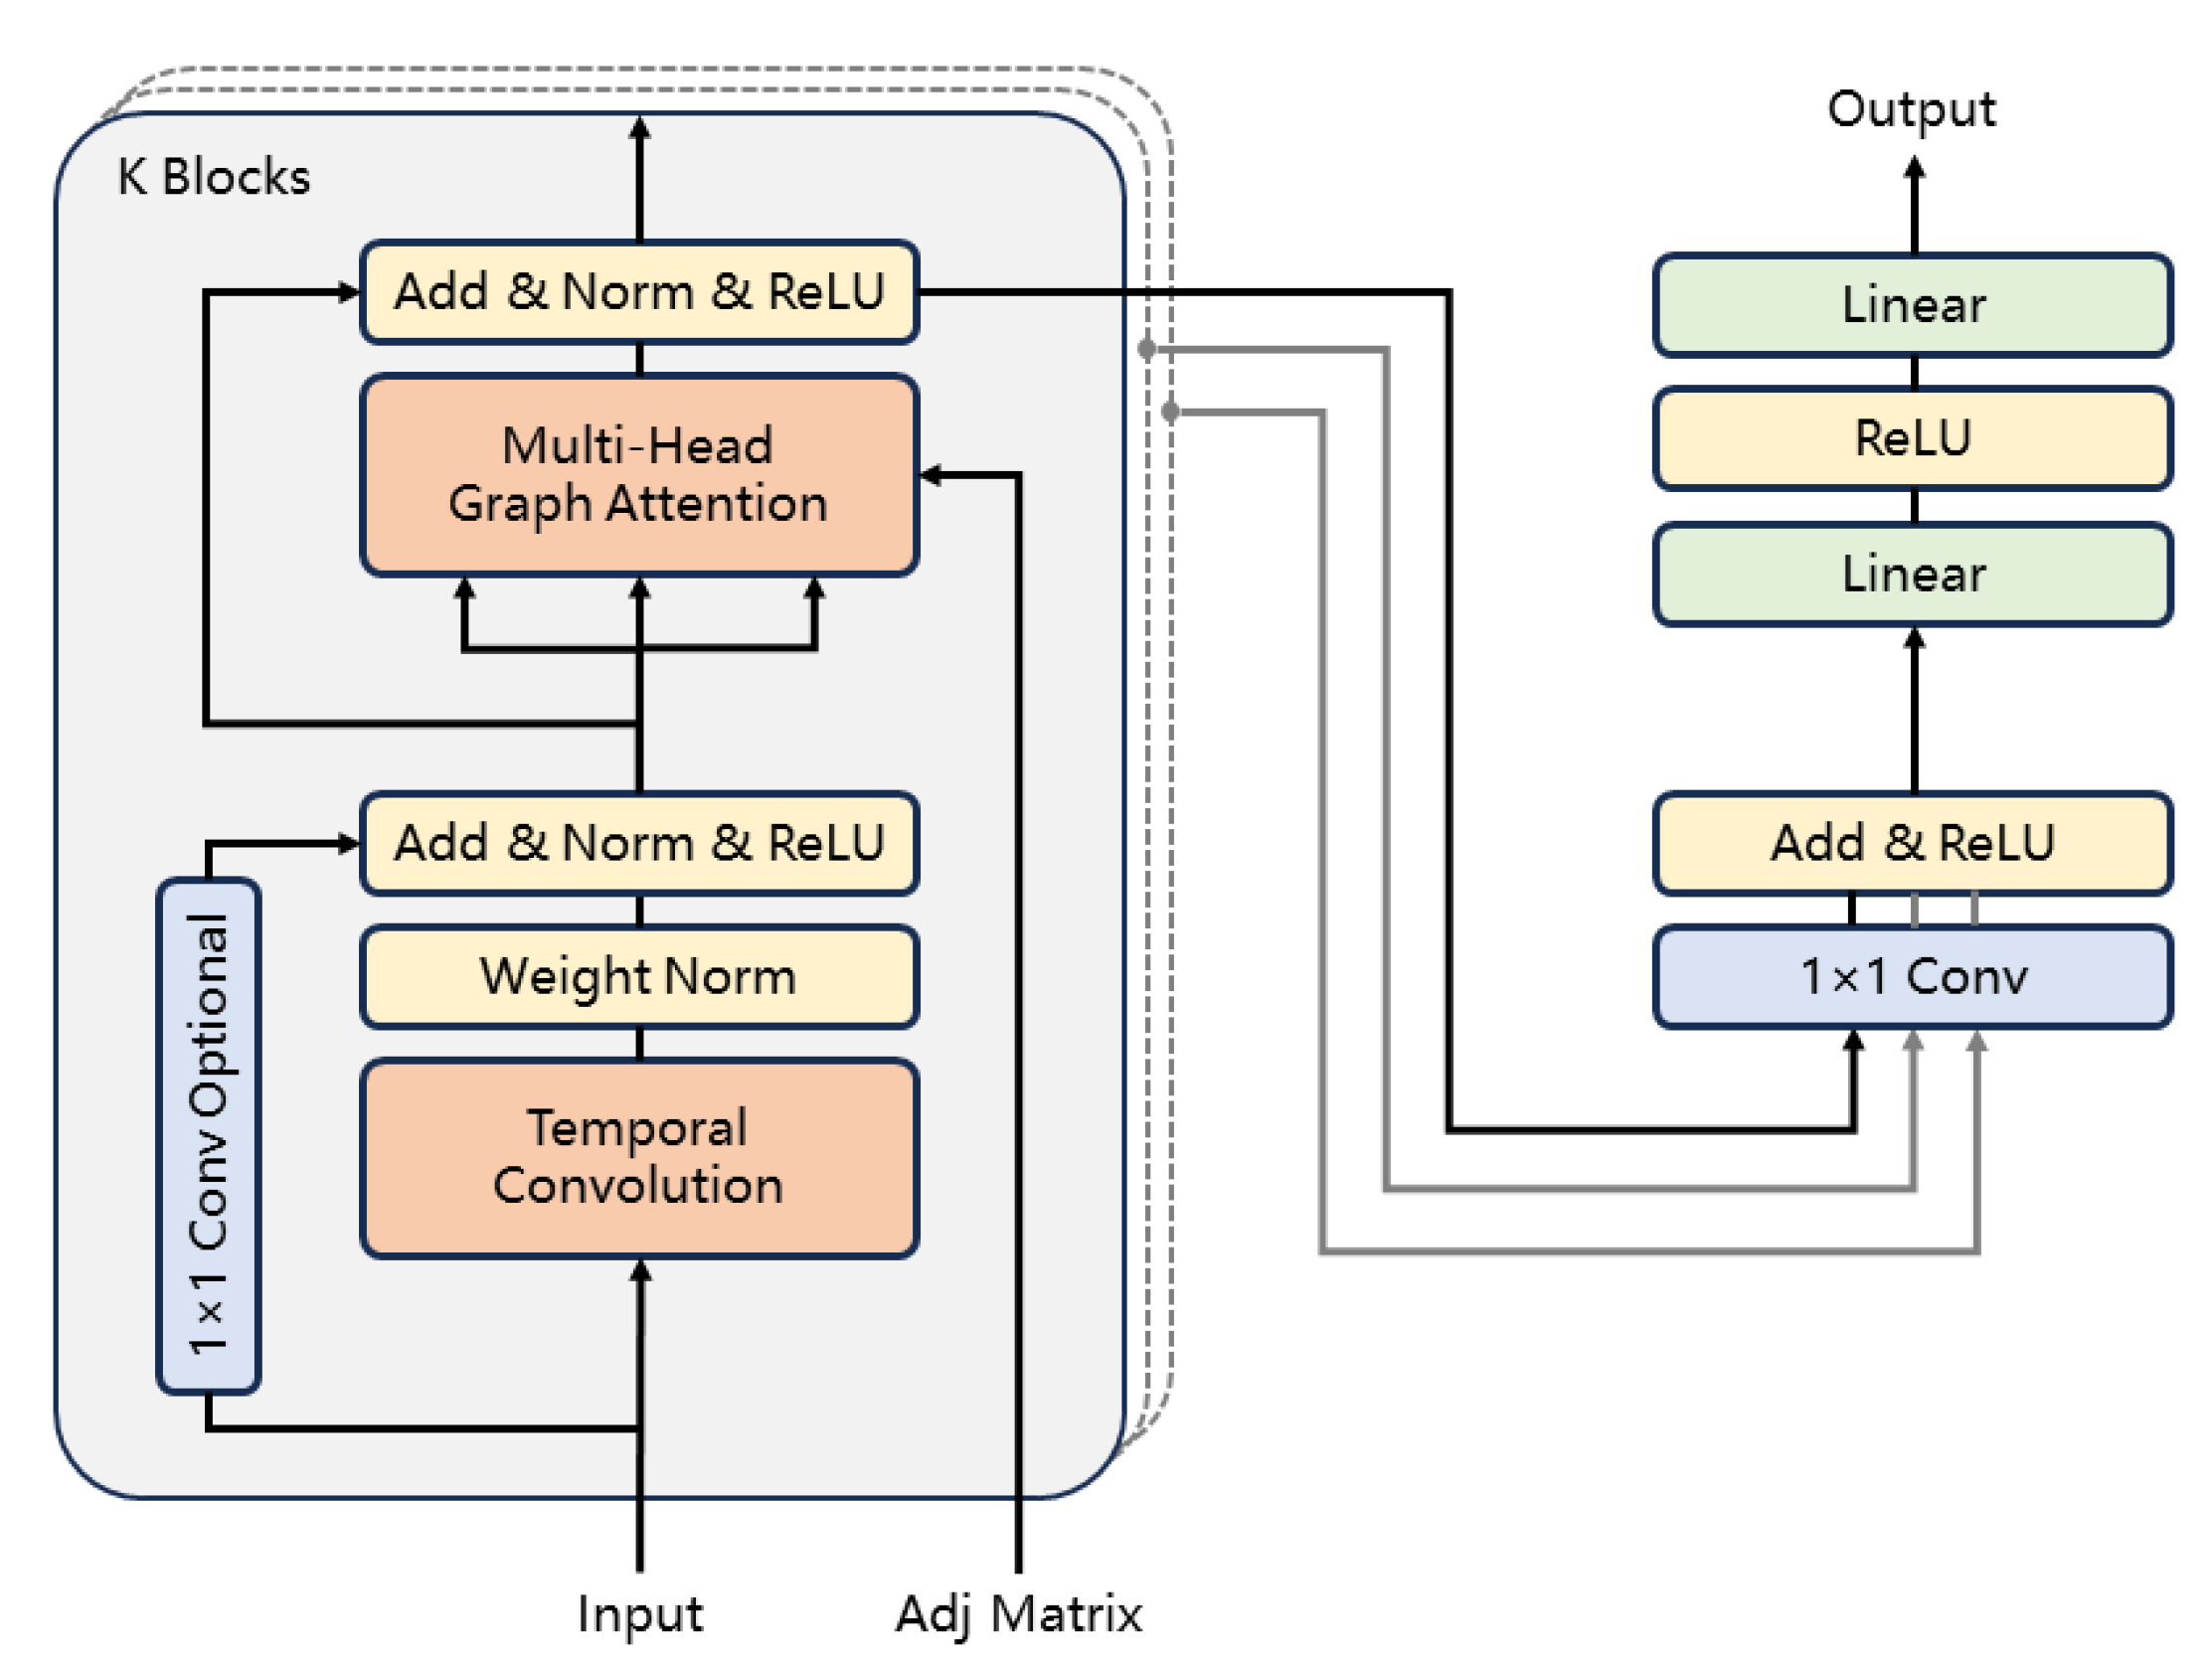
Figure 4.
Performance variation across different observation time steps: (a) Mean Absolute Error; (b) R-squared.
Figure 4.
Performance variation across different observation time steps: (a) Mean Absolute Error; (b) R-squared.
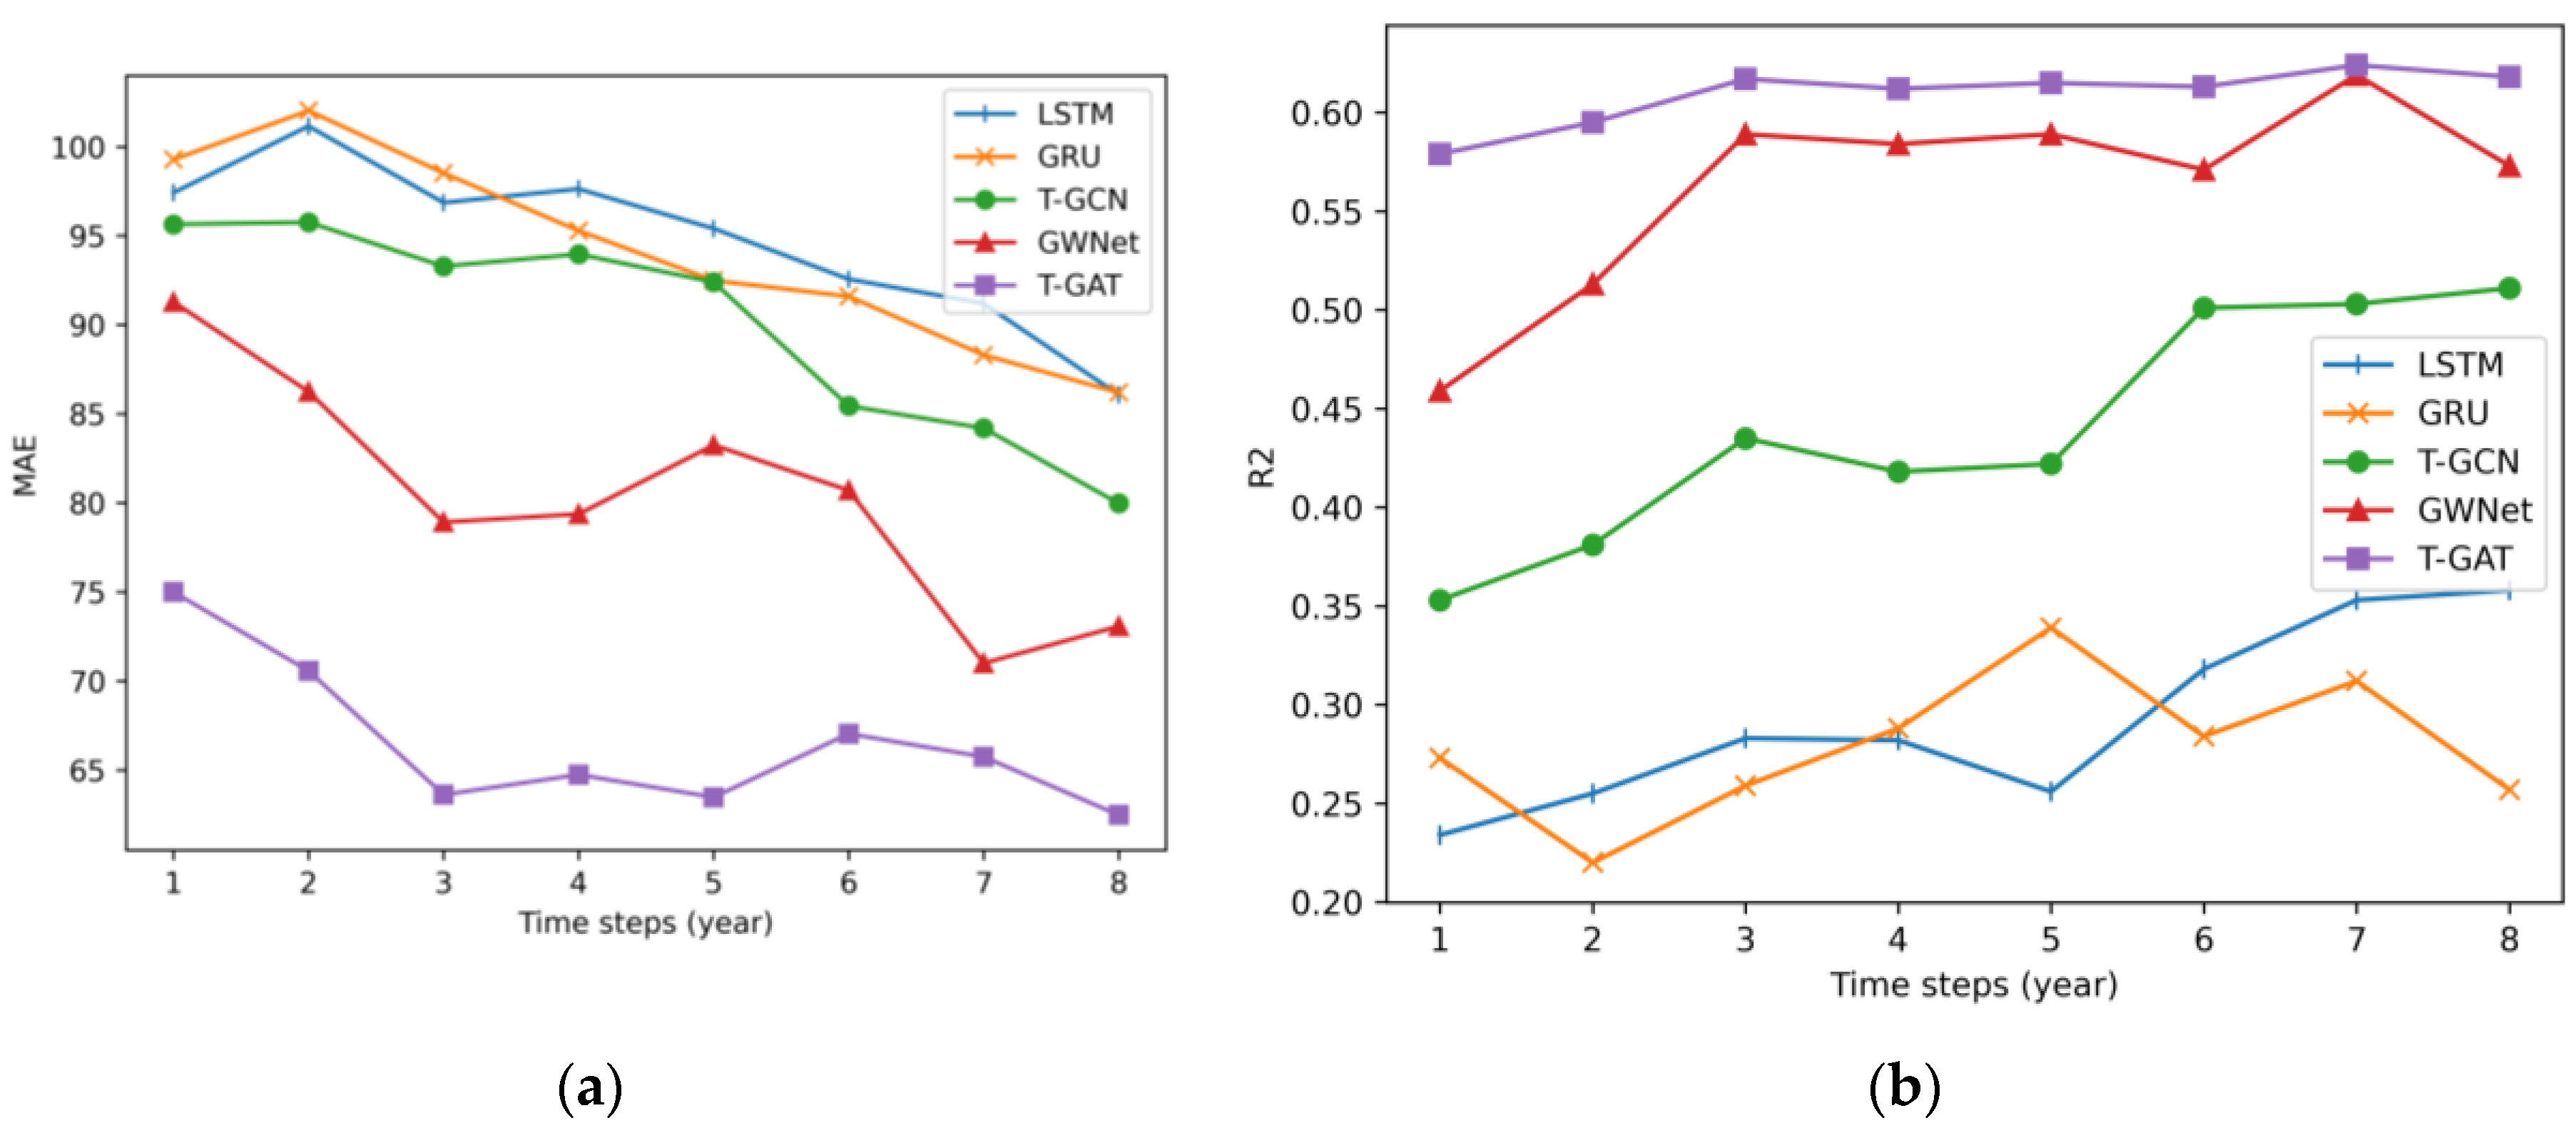
Figure 5.
Comparison of prediction curves between T-GAT and Graph WaveNet for four research topics: (a) Investment in research and development; (b) Supply chain coordination; (c) Earnings management; (d) Organization pattern.
Figure 5.
Comparison of prediction curves between T-GAT and Graph WaveNet for four research topics: (a) Investment in research and development; (b) Supply chain coordination; (c) Earnings management; (d) Organization pattern.

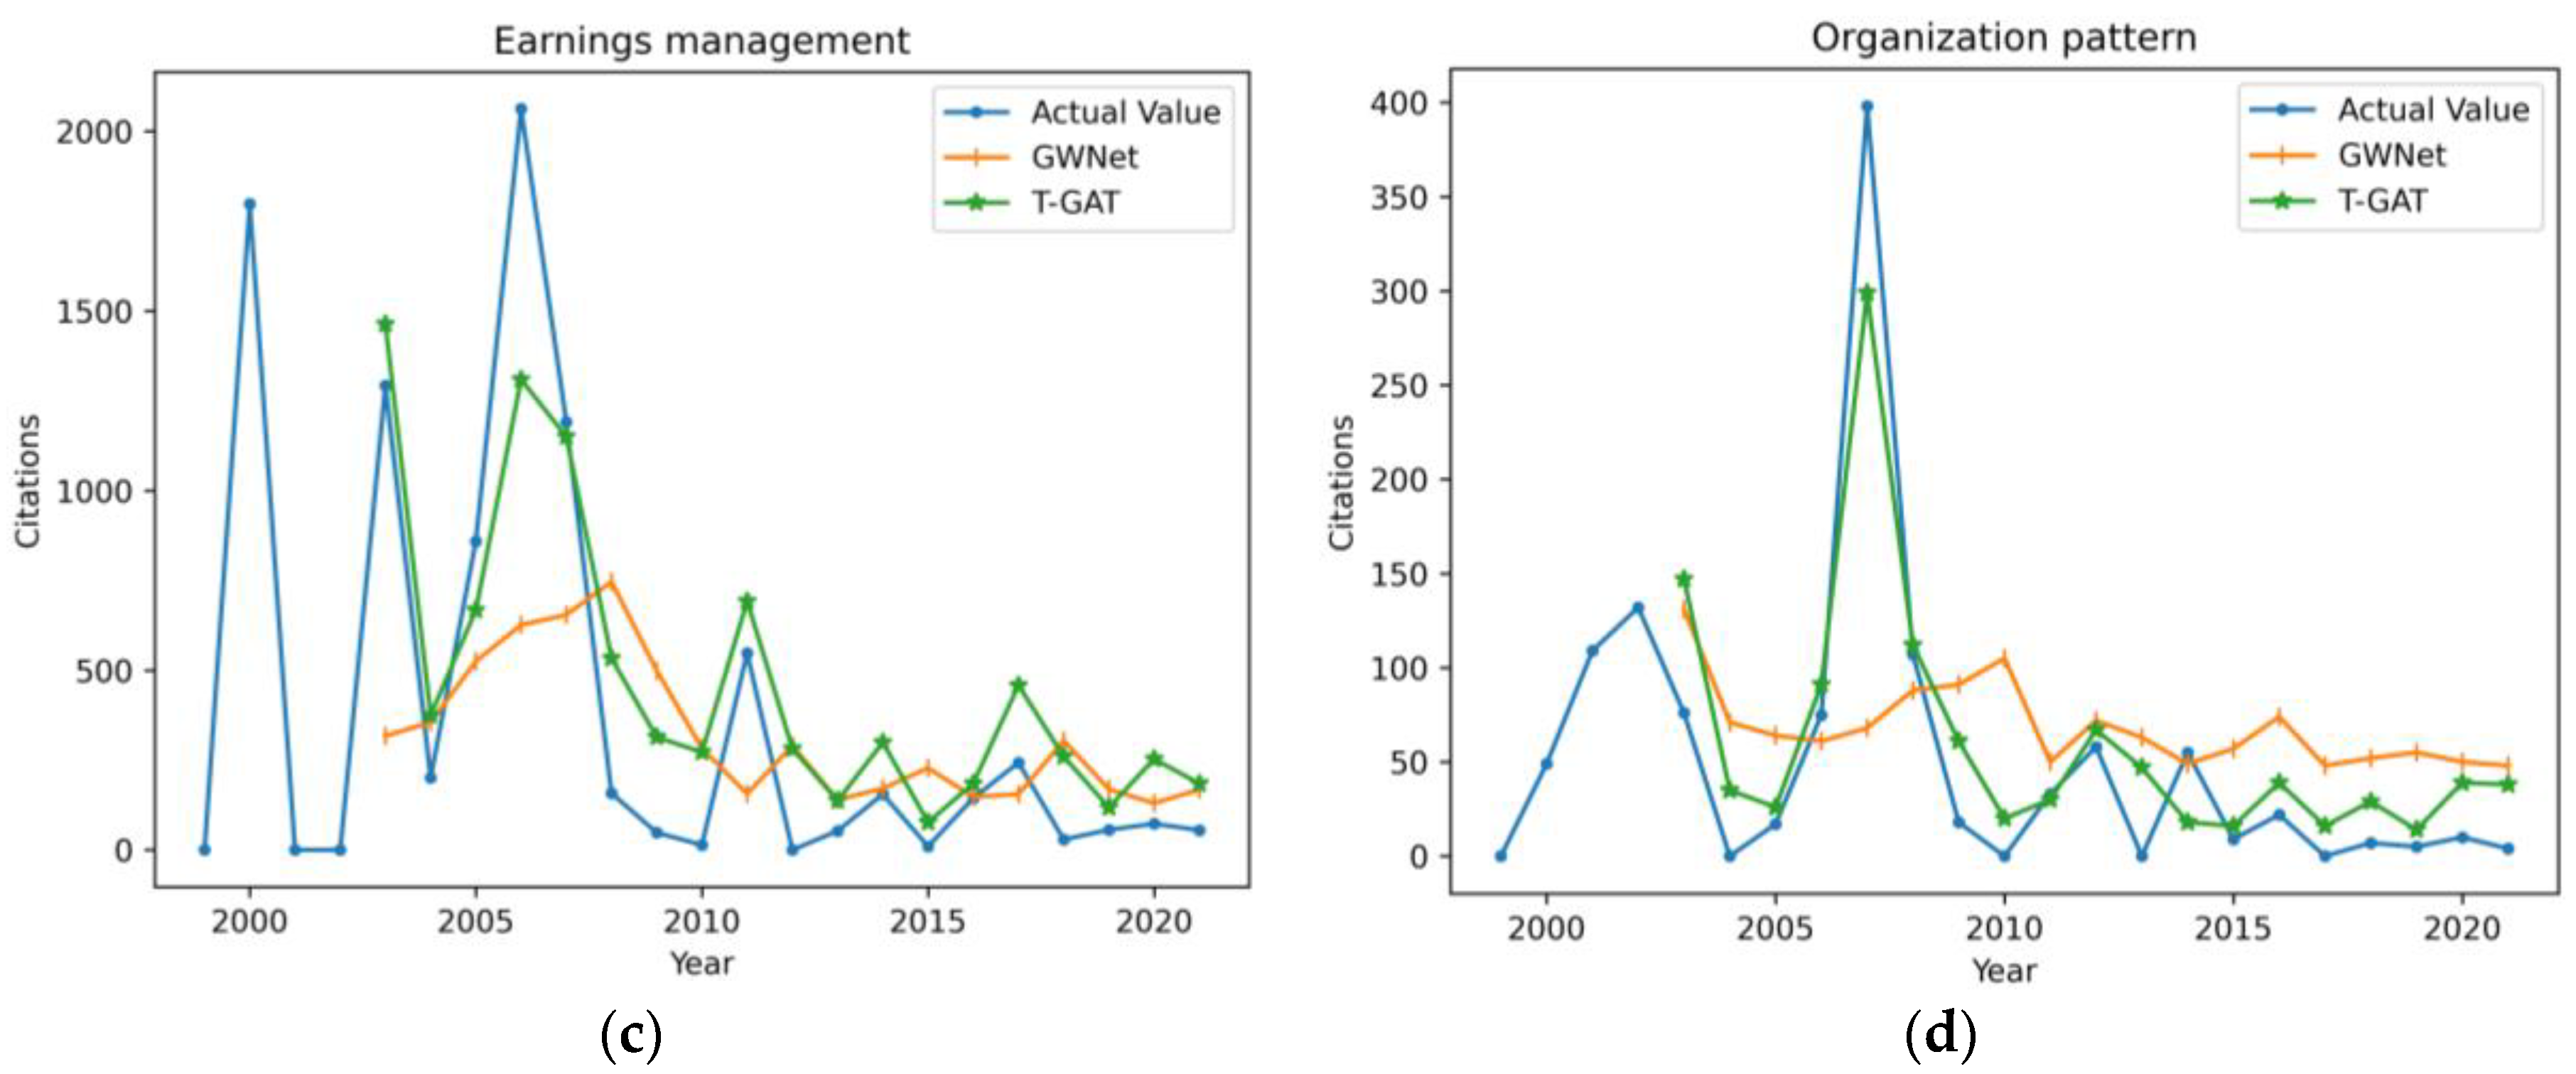
Figure 6.
The correlation features identified by the graph attention mechanism: (a) Heatmap representing the adjacency matrix of the top 50 research topics; (b) Heatmap representing the attention matrix of the top 50 research topics; (c) Actual trends observed across multiple topics.
Figure 6.
The correlation features identified by the graph attention mechanism: (a) Heatmap representing the adjacency matrix of the top 50 research topics; (b) Heatmap representing the attention matrix of the top 50 research topics; (c) Actual trends observed across multiple topics.
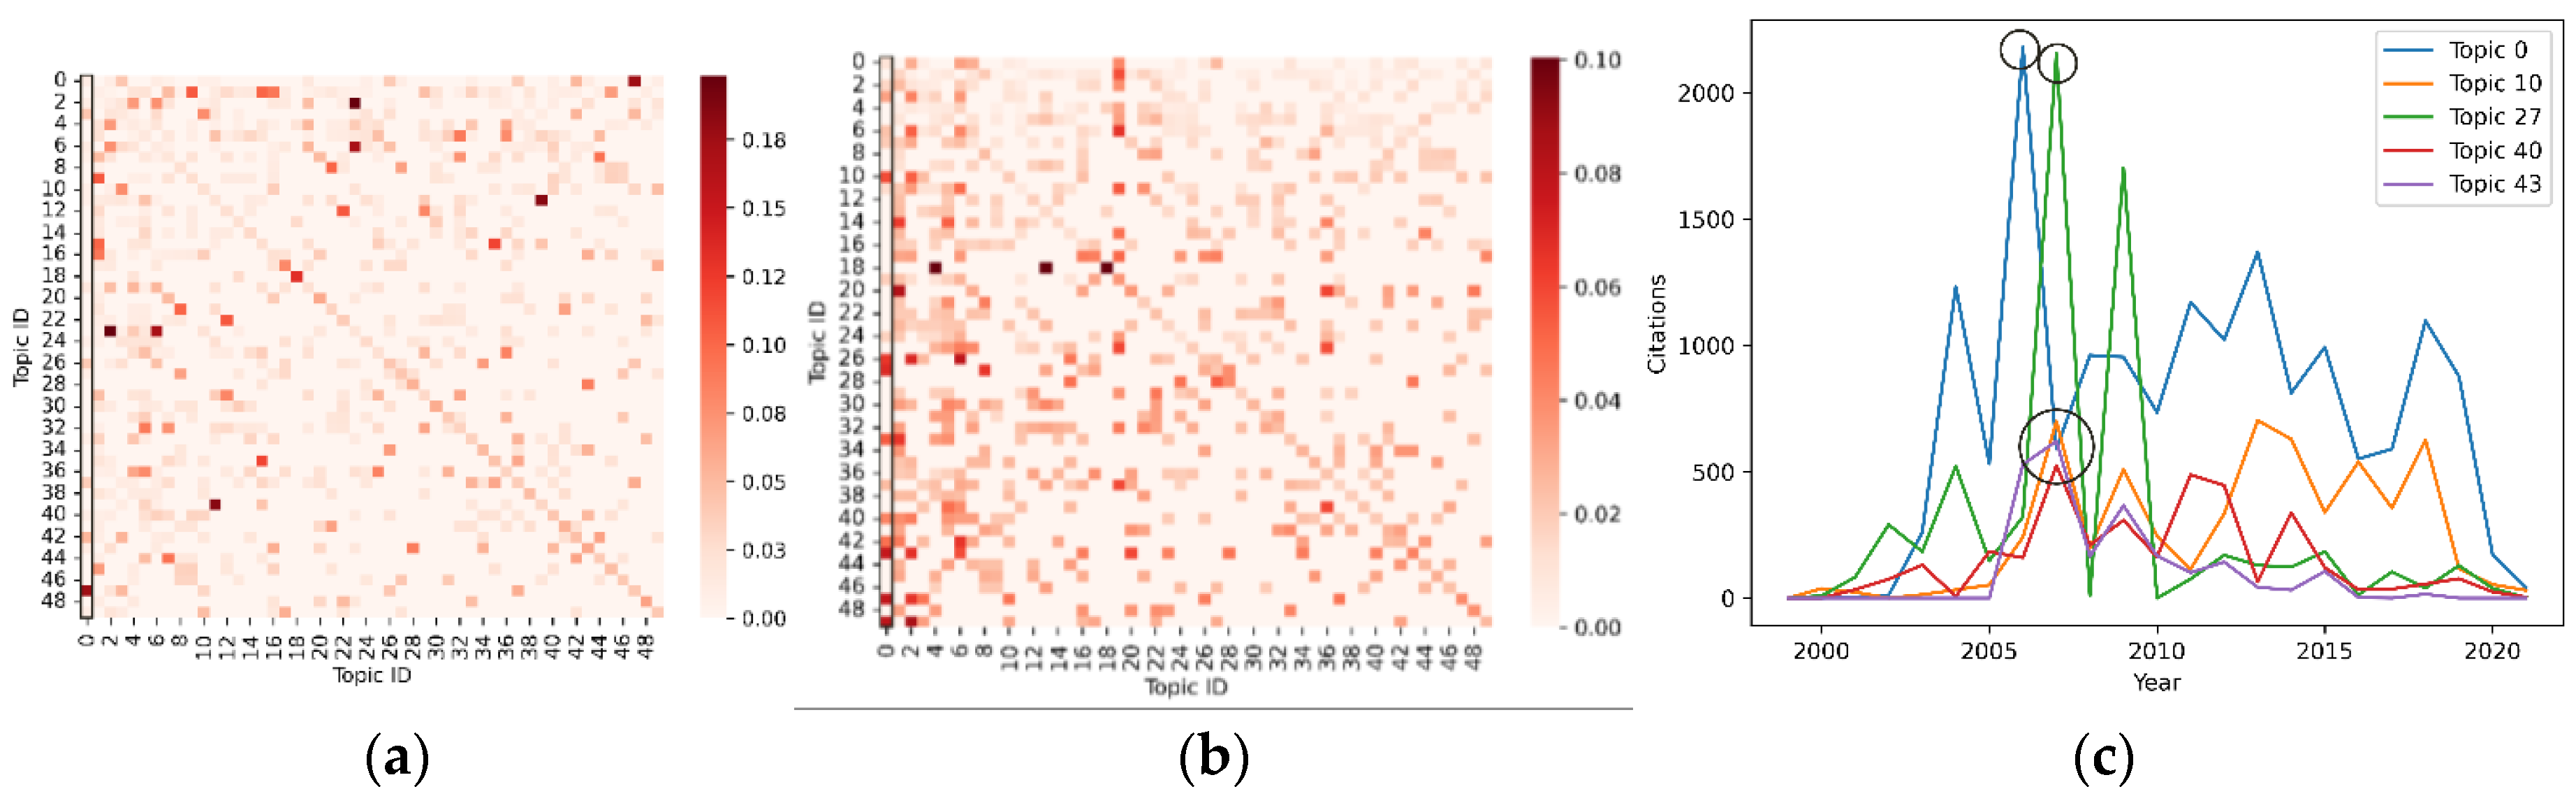

Table 1.
Performance comparison of T-GAT and other baseline models.
| Model | Time steps=4 | Time steps=6 | Time steps=8 | ||||||
|---|---|---|---|---|---|---|---|---|---|
| RMSE | MAE | R² | RMSE | MAE | R² | RMSE | MAE | R² | |
| LSTM | 156.79 | 97.63 | 0.282 | 149.60 | 92.57 | 0.318 | 138.98 | 86.07 | 0.358 |
| GRU | 155.25 | 95.28 | 0.288 | 152.37 | 91.59 | 0.284 | 147.81 | 86.19 | 0.257 |
| T-GCN | 144.15 | 93.97 | 0.418 | 136.60 | 85.45 | 0.501 | 128.65 | 79.97 | 0.511 |
| GWNet | 119.33 | 79.37 | 0.584 | 120.05 | 80.71 | 0.571 | 112.94 | 73.07 | 0.573 |
| T-GAT | 113.63 | 64.74 | 0.612 | 111.54 | 67.04 | 0.613 | 105.32 | 62.47 | 0.618 |
Disclaimer/Publisher’s Note: The statements, opinions and data contained in all publications are solely those of the individual author(s) and contributor(s) and not of MDPI and/or the editor(s). MDPI and/or the editor(s) disclaim responsibility for any injury to people or property resulting from any ideas, methods, instructions or products referred to in the content. |
© 2024 by the authors. Licensee MDPI, Basel, Switzerland. This article is an open access article distributed under the terms and conditions of the Creative Commons Attribution (CC BY) license (http://creativecommons.org/licenses/by/4.0/).
Copyright: This open access article is published under a Creative Commons CC BY 4.0 license, which permit the free download, distribution, and reuse, provided that the author and preprint are cited in any reuse.


