
Submitted:
30 December 2024
Posted:
31 December 2024
You are already at the latest version
Abstract
Tumour cell migration depends on the actin cytoskeleton modified by particular actin binding proteins (ABPs). Overexpression of cofilin or thymosin beta4 (Tß4) has been correlated with an increase or decrease of their migratory activity, respectively. We modulated by transfection the intracellular concentrations of cofilin and Tß4 of two colon (3LNLN and EB3) and one breast carcinoma (MDA-MB-231) cell line and subsequently analysed their migratory activity. Increasing wildtype cofilin did not alter their migratory activity, whereas the constitutively active S3A-cofilin mutant elevated migration. Transfection leading to an up- or downregulation of Tß4 showed that MDA-MB-231 and 3LNLN cells responded with a decrease or increase of migration, respectively. Exposure of MDA-MB-231 and 3LNLN cells to increasing concentrations of extracellular Tβ4 (or His-tagged Tß4) induced a biphasic response of migration being highest around 0.24 µM and decreased at higher extracellular Tß4. Immunostaining of 3LNLN cells exposed to 0.24 µM extracellular His-tagged Tß4 with anti-His antibody indicated its uptake co-localising with integrin-linked kinase at cell attachment points. Furthermore, the exposure to 0.24 µM His-tagged Tß4 led to increased phosphorylation of AKT1/2 and secretion of matrix metalloproteases. These effects and tumour cell migration were abrogated after exposure of 3LNLN cells to 2.8 µM His-Tß4 that in a number of cells induced apoptosis.
Keywords:
Actin
; carcinoma cells
; cofilin
; integrin-linked kinase
; thymosin beta4
1. Introduction
Tumour malignancy defines the ability of tumour cells to metastasize and to form daughter tumours. Metastasis is the main cause of death in cancer patients. Most solid tumours arise from epithelial tissues. After undergoing extensive reprogramming initiated and supported by a multitude of external signals from the tumour micro-environment, tumour cells arise after undergoing the so-called epithelial to mesenchymal transition (EMT) leading to the re-establishment of the ability for active migration. Metastatic tumour cells migrate out from their original organ or tissue as single cells or clusters using either the amoeboid or mesenchymal (or fibroblastic) form of locomotion [1,2]. They traverse multiple barriers of the extracellular matrix (ECM) such as compact basement membranes or net-like structures formed by ECM fibrils in order to invade vessels and finally extravasate in distant organs, where they may form new solid tumours [for reviews see [1,2,3]]. Independent of the mode of migration, metastasis of tumour cells depends on dynamic alterations of their cytoskeleton and in particular on the actin filament system.
Actin itself is a protein of 42 kDa molecular mass and cycles between two main states: the monomeric and filamentous form termed G-actin and F-actin, respectively [4,5]. In quiescent cells about 50% of the actin is maintained in monomeric state stabilised by G-actin binding proteins like thymosin beta4 (Tß4), profilin or transiently by cofilin/ADF [6,7,8,9,10]. During active cell migration, however, the equilibrium between G- and F-actin is shifted towards the filamentous form. Actin filament bundles form the cores of specific protrusions at the cellular fronts to generate protrusive forces: invadopodia (invasive protrusions), filopodia, lamellipodia, and blebs [11,12,13,14,15]. Invadopodia enable tumour cells to also secrete proteolytic enzymes, mostly matrix metalloproteases, which degradate extracellular matrix (ECM) components to facilitate tumour cell migration [14]. Filopodia and lamellipodia are plasma membrane extensions formed in the direction of the movement by cells exhibiting the fibroblastic type of migration, whereas blebs are typical for amoeboid cells migrating through dense ECM networks [16].
The directional movement of metastatic cells is determined by filopodia and lamellipodia. Their propulsive extension is solely achieved by actin treadmilling that depends on the different properties of the actin filament ends [11,13,17]. Their plus ends are attached to the plasma membrane and elongate by addition of new actin subunits, which are simultaneously released from their minus ends [11,13]. Treadmilling generates the forces necessary for the propulsive translocation the plasma membrane of these extensions [17]. These plasma membrane protrusions explore the surrounding of the migrating cell and attach to particular ECM components via integrin receptors [2,18]. Finally, the more stable F-actin networks at the posterior parts of the migrating cell interact with short myosin filaments to generate the forces necessary for the retraction of the trailing cell body [2,18].
In contrast, when cells move through a dense three-dimensional network of extracellular components, they switch to the amoeboid type of movement, which is independent of adhesions to ECM components and characterized by rapid shape changes of the migrating cell and the formation of bleb-like extensions caused by localized disassembly of the sub-membranous cortical F-actin and cytoplasmic pressure generated by force producing acto-myosin interactions [2,19]. The blebs seem to search for spaces within the ECM network allowing a squeezing passage powered by acto-myosin interactions. Many metastatic tumour cells can rapidly switch between these modes of migration [2,19]. Though both modes of metastatic cell migration (amoeboid or fibroblastic) may be differently regulated, they both depend on the basic dynamic behaviour of the actin filament system, whose dis- and re-assembly and treadmilling within the protrusions is regulated by a large number of actin-binding proteins (ABPs) [4,5,20].
The members of the ADF/cofilin protein family stimulate actin cycling by their ability to fragment F-actin (at low relative concentration to F-actin) or promote actin subunit dissociation from the slow-growing minus ends of F-actin leading to stimulation of cell migration [4,21,22]. A number of reports have also shown that the ubiquitous non-muscle cofilin-1 variant is overexpressed in metastatic tumour cells and by severing F-actin it may lead to numerous short actin filaments exposing free plus-ends that induce the formation of new actin filaments [3,23,24].
The beta-thymosins are small peptides of 43 amino acid residues. In aequous solutions Tß4 behaves like an intrinsically unstructured protein, but when bound to G-actin it attains a conformation characterized by N- and C-terminal α-helices connected by a flexible loop allowing it to span from the bottom of the actin subdomain-1 to the top of subdomain-2 [8,25,26]. Polymerization of actin complexed to Tß4 is inhibited, but due the high KD of this complex (about 1 µM) it establishes an equilibrium between F-actin, Tß4-complexed and a “pool” of non-Tß4-complexed and reusable G-actin. Therefore, a reduction of the pool of reusable actin leads to its replenishing either by F-actin disassembly or the re-establishment of the equilibrium between free and Tß4-sequestered actin. Indeed, activated nucleating proteins (like the formins or Arp2/3 complex) that promote actin polymerization will consume and reduce the concentration of “reusable” G-actin and thereby indirectly induce the dissociation of the actin:Tß4 complex in order to maintain an equilibrium between free and Tß4-bound G-actin [27]. If however, a large fraction of actin is sequestered by an increase of Tß4, the reusable actin pool will be diminished and the assembly of new filamentous structures will be reduced or even inhibited. Indeed, it has been demonstrated that HeLa cells overexpressing Tß4 have a reduced rate of migration due to a reduction of the amount of free G-actin necessary for active cycling (treadmilling), whereas cells with a lowered Tß4 content showed a higher rate of cell migration [28].
Conflicting results have been reported about the effect of Tß4 on the migratory activity of carcinoma cells. Thus, it was reported that overexpression of Tß4 correlated for instance with increased metastasis of lung carcinoma cells [29]. Furthermore, thyroid and bladder cancer cells were shown to overexpress Tß10 [30,31], a close relative of Tß4 with identical actin sequestering activity [32]. In contrast, an inverse correlation of Tß4 expression and tumour cell metastasis was reported for colon carcinoma [33,34]. These contradictory results may be due to differing concentrations of cofilin/ADF, since Tß4 cooperates with these proteins during F-actin disassembly [28].
Therefore, we investigated whether a modulation of the intracellular concentration of cofilin-1 (subsequently termed only cofilin) and in particular of Tß4 affected the migratory activity of tumour cells with different metastatic potential, i.e., of cells possessing a different intrinsic potential for active migration. To this end we selected three established tumour cell lines: the MDA-MB-231 cells derived from triple negative breast and the 3LNLN and EB3 lines derived from colon carcinoma [35] possessing high, intermediate and low migratory activity, respectively. These cell lines were analysed by investigating the dependence of their migratory activity before and after modulation of their intracellular cofilin concentration by transfection with wild-type or mutant variants of cofilin. Our data show that overexpression of wild-type cofilin had only a small effect on the migration of the MDA-MB-231, 3LNLN and EB3 cells. Only transfecting the constitutively active S3A-cofilin mutant stimulated migration of the MDA-MB-231 cells.
In contrast, up- or down-regulation of Tß4 by transfection led to reduction or stimulation of tumour cell migration, respectively. Since previous reports indicated that the migratory activity of tumour cells was also modulated by extracellular Tß4, we analysed the effect of extracellular His-tagged-Tß4 and native Tß4 on the migratory activity of the selected tumour cells. Our data showed a biphasic response of their migratory activity when exposed to increasing Tß4: a stimulation of migration up to 0.24 µM Tß4 and an inhibition at higher (2.4 µM) Tß4 concentrations.
Furthermore, we demonstrated by immunostaining the colocalisation of Tß4 with the integrin linked kinase (ILK) that previous data had shown to stimulate the ILK-AKT/PKB (protein kinase B) signalling pathway [36,37]. Indeed, immunostaining of the 3LNLN colon carcinoma cells exposed to 0.24 µM Tß4 for phosphorylated AKT/PKB indicated an increase of P-Ser473-AKT-1 and P-Ser474-AKT-2 immunoreactivities. Activated AKT/PKB kinases are known to stimulate cell migration and the secretion of metalloproteases (MMPs [38]). Indeed, at 0.24 µM extracellular Tß4 we detected increased MMP expression and secretion. In contrast, exposure of 3LNLN cells to 2.8 µM His-tagged-Tß4 led to cell rounding, inhibition of migration, and induction of apoptosis of many cells.
2. Materials and Methods
2.1. Materials
Foetal calf serum (FCS) and media were obtained from Gibco (Deisenhofen/Germany). The monoclonal anti-β-actin antibody (clone AC74) was purchased from Sigma (Poole, Dorset, UK) and FITC-labelled anti-rabbit IgG from Amersham (Amersham Life Science/UK). TRITC-phalloidin was obtained from Molecular Probes (Eugene, Oregon, USA). The specificity of the polyclonal antibody against cofilin generated in rabbits was described previously [39]. The monoclonal anti-Tß4 antibody was generated by standard hybridoma techniques as a commercial product by the BS-Antibody Facility of the TU Braunschweig (Germany) and kindly provided by Prof. Brigitte Jockusch and Mrs. R. Buchmeier (TU Braunschweig, Germany). Its properties have been described previously [28]. Antibodies against integrin-linked kinase (ILK) were from Merck-Millipore (Darmstadt, Germany), antibodies against AKT-1,2 (goat) and phospho-S473-AKT-2 (rabbit) were from Santa Cruz Biotechnology (Heidelberg, Germany), and the antibody against phospho-S474-AKT2 was from SAB Biotherapeutics (Washington, DC, USA). The anti-His antibody (rabbit) was from MicroMol (Karlsruhe, Germany).
The vectors leading to independent overexpression of Tß4 and EGFP (pIRES2-EGFP-Express) and to Tß4 downregulation by Tß4-specific shRNA were described previously [40,41]. Pre-stained molecular mass standard (PageRuler) was obtained from Fermentas (St. Leon-Rot/Germany). Matrigel was obtained from BD Biosciences (Heidelberg, Germany). All other reagents were of analytical grade.
2.2. Cell Lines, Cell Culture and Transfection
Colon adenocarcinoma and the breast cancer MDA-MB-231 cell lines of human origin were included in this study. The derivation of the EB3 and 3LNLN cells is described elsewhere [42,43]. The Caco-2, SW480, LS174t, and HT-29, and MDA-MB-231 cells were from ATCC® (Teddington, UK). The origin of the tumour cells was determined by STR profiling. Culture of tumour cell lines was performed as described previously [43]. Cells grown on sterile glass coverslips in DMEM with added NCS and FCS were fixed with 4% formaldehyde for 20 min, permeabilized with 0.2% Triton X-100 in PBS for 5-10 min or alternatively fixed with ice cold methanol for 5 min and subsequently washed three times in PBS. Cell transfection was performed using vector-coated magnetic beads (MATra, IBA, Göttingen, Germany) using the wild-type, S3A- and S3D-cofilin constructs cloned into the BglII-EcoRI site of the vector pEGFP-C2 (obtained from BD Clontech UK, Basingstroke, UK) as described previously [39]. The bicistronic Tß4-pIRES2-EGFP and the Tß4-shRNA-EGFP constructs were obtained as given in [28]. For Tß4 knockdown we used Tß4-specific (short-hairpin) shRNAs, which were selected to target the following sequences of the human Tß4 mRNA (accession code TMSB4X) starting from position 103 (GAGATCGAGAAATTCGATA), 195 (GCAAGCAGGCGAATCGTAA), 472 (GACGACAGTGAAATCTAGA), or 526 (GTAATGCAGTTTAATCAGA). Oligonucleotides coding for shRNA molecules were produced by Invitrogen (Karlsruhe, Germany) and cloned under control of the H1 or U6 promotor into an EGFP co-expressing vector generated by [43]. To enhance knockdown efficiency, we used in some experiments a mixture of all four vectors for transfection.
2.3. Cell Migration Assays and Immunofluorescence Microscopy
Transwell cell migration of transfected and non-transfected tumour cells was performed by using TranswellTM filters (BD Biosciences, Heidelberg, Germany) as described previously [28]. Briefly, cells starved for six hours were taken up in serum-free medium supplemented with 0.2 mg/ml Matrigel, seeded into a Boyden chamber and subsequently placed into a well, whose bottom had been coated with a mixture composed of 50% (= 5 mg/ml) Matrigel, 20% FCS and 30% medium.
As an alternative procedure to follow cell migration we used the agarose drop assay [44]. For this assay 50,000 cells were mixed with 4 µl of 2% agarose and placed in the middle of a well of a 96 well plate after determination of the percentage of transfection. After 72 h the cells migrating out of the agarose drop were photographed using the confocal microscope. For immunohistochemistry of the migrating cells the agarose drops were placed on glass coverslips coated with 0.5 mg/ml laminin. For immunostaining the cells were fixed for 10 min with 4% paraformaldehyde and subsequently immunostained as detailed previously [28]. Immunofluorescence microscopy was performed by using either a Zeiss Axiophot microscope equipped with an AxioCam HRc digital camera or the confocal Zeiss LSM 510 or 800 microscope (Jena, Germany).
2.4. Protein Preparations and Immunoblotting
Thymosin beta 4 was prepared as described [45] or a commercial product from Bachem (Bubendorf, Switzerland). His-tagged Tß4 and His-tagged scrambled Tß4 (scTß4) were obtained recombinantly as described [46] and purified using a NiNTA-column (Sigma, Munich, Germany). Protein concentrations were determined by the colorimetric assay as described [47]. Western and dot blots for the detection of Tß4, ILK, AKT1/2, and phosphorylated AKT were performed as described [39]. For detection of Tß4 we preferably used dot immunoblots, because comparative data using Western and immunodot analyses indicated that a considerable amount of Tß4 was lost during electro-transfer from SDS-gels to nitrocellulose membranes for Western blotting (wet transfer using a Protean devise from Biorad, Munich, Germany). Thus, the results indicated differences between Western and dot immunoblots even though applying equal protein amounts (50 µg/lane or dot) possibly due to trans-migration of Tß4 through the membrane during the electro-transfer.
2.5. Determination of the Intracellular Beta-Thymosin Content by Reverse-Phase High Performance Liquid Chromatography (HPLC) After Equilibrium Centrifugation
We determined the intracellular beta-thymosin concentration in a number of tumour cells, in particular in MDA-MB-231, 3LNLN, and EB3 cells, by HPLC separation (reverse-phase high performance liquid chromatography) [48,49]. For this determination the intracellular proteins were prepared from 107 to 7 x 10⁷ cells according to the published procedure and analyzed by HPLC. The concentrations of beta-thymosins and fragments were determined as described [43]. Briefly, the top 50 µl from centrifugation assays were mixed with 5 µ1 4 M perchloric acid and incubated for 30 min at 4°C. After centrifugation at 20,000 g for 5 min the supernatant solution was carefully removed. The supernatant solution was adjusted to pH 3-5 with 10 M KOH. After 15 min on ice, the precipitated KClO4 was removed by centrifugation and an aliquot of the supernatant solution was analyzed by HPLC. Chromatographic conditions were; flow rate of 0.75 ml/min; buffer, 0.11 M pyridine plus 0.076 M acetic acid. The peptides were eluted by a linear gradient from 0 to 40% n-propanol in 30 min using a Beckman ODS Ultrasphere column (4.6 mm x 250 mm); post-column derivatization with fluorescamine. Chromatographic conditions were controlled by a Beckman 420 system. The fluorescence of fluorescamine-derivatized peptides was measured by a Kratos FS 950 fluorometer with 365 nm excitation from an FSA 110 lamp with no excitation filter and an FS 426 emission filter with cut-off below 418 nm. The fluorescence signal was registered on an integrator (Merck-Hitachi).
Intracellular ß-thymosin concentrations were calculated from the data obtained by HPLC and by calculating the approximate cell volume according to [50].
3. Results
3.1. The Distribution of Tß4 and Organization of the Actin Cytoskeleton in Tumour Cell Lines
We have previously shown for HeLa cells that Tß4 co-localises with actin filaments at the sites of their attachment to the cell membrane [28]. Here, we analysed by immunohistochemistry the distribution of Tß4 and the organisation of the actin cytoskeleton in a number of human colon carcinoma cell lines (HT-29, LS174t, Caco-2, SW480, EB3, and 3LNLN) and the breast carcinoma cell line MDA-MB-231. Figure 1 shows the distribution of Tß4 in relation to the microfilaments of the MDA-MB-231 and the colon tumour EB3 and 3LNLN cell lines. TRITC-phalloidin staining demonstrated short peripheral stress fibres in MDA-MB-231 and 3LNLN cells, which peripherally converged suggesting the presence of focal adhesion sides (Figure 1A,B). The 3LNLN cells contained numerous but more punctate TRITC-phalloidin positive structures (Figure 1B) like the sessile EB3 cells (Figure 1C), which showed a more dot-like TRITC-phalloidin distribution. Anti-Tß4 staining revealed a more perinuclear concentration in MDA-MB-231 cells (Figure 1A), but an almost even cytoplasmic staining in 3LNLN and EB3 cells (Figure 1B,C). F-actin containing structures were observed in MDA-MB-231 and 3LNLN cells (Figure 1A,B), but appeared absent in EB3 cells (Figure 1C). The anti-Tß4 staining showed Tß4-positive dots along presumed stress fibres in MDA-MB-231 (arrow in Figure 1A) that were more prominent in 3LNLN cells (Figure 1B). Anti-Tß4 stained dots were detected EB3 cells completely filling its cytoplasm, which in some instances coalesced to larger aggregates (arrow in Fig, 1C). The Tß4-positive dots appeared to co-localize in many instances with TRITC-phalloidin positive dots (Figure 1B,C) suggesting the presence of only short or oligomeric actin filaments. In most cases the cell nuclei were free of anti-Tß4 staining.
In addition, we analysed the distribution of F-actin and Tß4 within a number of other colon carcinoma cell lines (Caco-2, SW480, LS174t, and HT-29 cell lines). The data compiled in Supplementary Figure S1 demonstrate a high perinuclear concentration of Tß4 in Caco-2 and SW-480 cells and its even cytoplasmic distribution in LS-174t, and HT-29 cells, whereas TRITC-phalloidin stained F-actin concentrated in the cell periphery of these lines. Microfilaments reaching towards the cell centre were only detected in the Caco-2 cells (Figure S1). These cell lines (Caco-2, SW480, LS174t, and HT-29) showed little migratory behaviour probably due to their apparently high concentration of Tß4 (see later and Table S1). Therefore, we selected the 3LNLN, EB3 and MDA-MB-231 cell lines to analyse the effects of the modulation of Tß4 and cofilin concentration on their migratory activity.
3.2. Effect of Cofilin Overexpression on Tumour Cell Migration
Cell migration depends on constant actin treadmilling, i.e. F-actin disassembly and reassembly. F-actin treadmilling is stimulated by proteins of the ADF/cofilin family, which are F-actin severing and cycling accelerating proteins and secure a constant supply of polymerization-competent monomeric actin [21,22]. Since previous data had indicated for HeLa cells that cofilin and Tß4 cooperate synergistically in the depolymerization of F-actin [28], we first investigated whether the different migration behaviour of the three selected tumour cells was due to different levels of cofilin expression. Immunodot blots of homogenates of the three cell lines, however, showed an almost identical content of cofilin-1 in MDA-MB-231, 3LNLN and EB3 cells (see Figure S2A). Setting the content in MDA-MB-231 cells to 100% then cofilin expression amounted to 113% in 3LNLN and 98% in EB3 cells. These data suggested that the differing migratory activity of these cells was not due to differences in cofilin expression.
Nevertheless, we analysed whether a modulation of the active state of intracellular cofilin concentration modified the migratory activity of these tumour cells. Cofilin activity is intracellularly regulated by phosphorylation of Ser3 by ROCK-dependent LIM kinase resulting in inhibition of its actin binding capacity [51]. Dephosphorylation by for instance the slingshot phosphatase reactivates its actin binding activity [51]. Three constructs N-terminally fused to EGFP [39] were employed: human wt-cofilin, the constitutively active S3A- and inactive S3D-variant. Successful transfection was indicated by EGFP-fluorescence and was about 15% of the total cells employed. The alterations in cofilin expression was analysed 24 h after transfection for the 3LNLN cells by immunoblots using the polyclonal anti-cofilin antibody, which does not discriminate between the different mutant forms. In 3LNLN cells we obtained increases in total cofilin expression of 156% and 198% after transfection with wt- and the S3A-variant, respectively, over the endogenous cofilin, i.e. after transfection with empty EGFP-vector (see Figure S2E). After determination the percentage of EGFP-positive cells 24 h after transfection, they were loaded on a transwell chamber and the number of migrating cells was quantified after further 24 h calculating the migration ratios for the transfected, EGFP-positive cells. The EB3 line did not respond to an overexpression of these cofilin constructs (Figure S2D). Overexpression of wt-cofilin had no effect on the migration of both the MDA-MB-231 and 3LNLN cells, which might be explained by the assumption that the intracellular kinases (such as LIM-kinase [see 50]) rapidly phosphorylated the overexpressed wt-cofilin and thereby re-established the initial equilibrium between the de- and phosphorylated cofilin. In contrast, transfection with the active S3A-cofilin construct clearly stimulated the migratory activity of MDA-MB-231, but had only a small stimulatory effect on 3LNLN and no effect on EB3 cells (Figure S2B–D). Since the constitutively active S3A-cofilin mutant cannot be phosphorylated, its overexpression might have led to an increased F-actin severing activity resulting in an increase in filament ends, which are known to promote cell migration by increasing actin cycling [4,5]. This effect, however, was only observed for the MDA-MB-231cells. In contrast, the 3LNLN and EB3 cell lines may have contained lower amounts of F-actin ready for fragmentation by S3A-cofilin, as neither wt- nor S3A-cofilin transfection of 3LNLN and EB3 cells led to a significant alteration of their migratory behaviour. The constitutively inactive S3D-cofilin had no effect on the migratory activity of all three cell lines (not shown). Thus, these data indicated that an intracellular increase of the constitutively active S3A-cofilin led to an increase of the migratory activity of only the MDA-MB-231 cells, whereas transfection of wt-cofilin had no effect.
Of note, compared to non-transfected 3LNLN cells (set at 100%) transfection with wt-cofilin and S3A-cofilin led to an increase of 123% and 134%, respectively, of their intracellular content of Tß4 as (see Figure S2F) suggesting that the possible increase in the migratory activity was counter-regulated by an increase the Tß4 concentration (see below).
3.4. Effect of Modulating the Intracellular Tß4 Concentration on Tumour Cell Migration Analysed by the Transwell Assay
In order to determine the intracellular concentrations of Tß4 in MDA-MB-231, 3LNLN and EB3 cells, we initially compared Western and immunodot blotting (Figure 2A). As detailed in Materials and methods our data indicated more reliable results using the immnuodot procedure. Densitometric evaluation of the immunodot data (Figure 2A) showed that the endogenous Tß4 content in MDA-MB-231 cells was lowest, i.e. in the cells with the highest migratory activity. When the Tß4 content in MDA-MB-231 cells was set at 100%, then the Tß4 expression was increased to 133% and 156% in 3LNLN and EB3 cells, respectively, over the content in MDA-MB-231 cells (Figure 2A). These data showed considerable differences in the Tß4 expression by these tumour cells and suggested an inverse correlation of Tß4 expression and their migratory activity.
Finally we determined by HLPC the beta-thymosin content of MDA-MB-231, EB3 and 3LNLN cells (see Materials and methods and Supplementary Figure S3). The data summarized in Table 1 indicate that both cell lines contain two variants of beta-thymosin: Tß4 and Tß10. Like Tß4 also Tß10 possesses G-actin sequestering activity and is expressed during embryogenesis in many developing organs [32]. In addition, Tß10 expression is upregulated in many cancer cell types leading to F-actin depolymerizati35on and may be correlated with tumor cell proliferation, apoptosis, metastasis and angiogenesis predicting poor prognosis [30,31]. Preparing and applying defined numbers of cells for the HPLC-analysis, the data allowed to determine the amount of the beta-thymosins in femtogram/cell. Under the assumption that the cell volume of these cells was 3000 µm3 as shown for many tumour cells like HeLa cells [50] the intracellular concentrations of Tß4 and Tß10 were calculated as given in (Table 1), although we are well aware that the volumes of the three cells selected may vary and furthermore change according to their activities as reported for HeLa cells [50] and no correction was made for the nuclear volume. Setting again the content of beta-thymosins in MDA-MB-231 cells to 100%, then the total content of beta-thymosins increased to 144% and 170% in 3LNLN and EB3 cells, respectively, in good agreement with the immunodot data (Figure 2A). Furthermore, this result indicates that the monoclonal anti-Tß4 antibody does not differentiate between Tß4 and Tß10.
Next, we analysed the effect of the intracellular Tß4 concentration on the migratory behaviour of these three tumour cell lines by modulating its intracellular concentration by transfection with constructs, which led to overexpression or down-regulation of Tß4. To this end we employed a bicistronic Tß4-pIRES-EGFP construct [40] leading to an independent overexpression of Tß4 and EGFP, and Tß4-specific shRNA construct that down-regulates Tß4, but induces EGFP expression (Tß4-shRNA-EGFP) [41] allowing in both cases to identify successful transfection. Transfection with the Tß4-pIRES-EGFP construct should have led to an increase in Tß4 expression in the EGFP-positive cells, whereas transfected with Tß4-shRNA-EGFP might have resulted in an intracellular reduction of only Tß4 and not of Tß10. Nevertheless, we observed clear inhibitory and stimulating effects, respectively, on their migratory activity (as summarized in Figure 2E). After transfection, cell migration was tested by two assays: the transwell procedure using a Boyden chamber and the agarose drop assay (see Materials and methods). The migratory activity of the tumour cells was determined 24 h after transfection by calculating the ratios of the number of migrated/applied non-transfected or transfected cells based on the presence or absence of EGFP-fluorescence.
First, we tested the migratory activity of the three selected cell lines using the transwell (Boyden chamber), which also allowed a quantification of the data. The data showed that the MDA-MB-231 cells had the highest, the 3LNLN cells an intermediate, and the EB3 cells the lowest, i.e. practically none, migratory activity (Figure 2B–D) correlating inversely with their intracellular content of Tß4. We also compared for each condition the cell migration for non-transfected and transfected cells. The transwell assay showed in four independent experiments migration through the transwell membrane of 13.78% ± 1.1% for non-transfected and 13.3% ± 1.1% for EGFP-control transfected MDA-MB-231 cells; 3.29% ± 0.37 % of the non-transfected and 3.01% ± 0.1% EGFP-control transfected 3LNLN cells; and 2.1% ± 0.25% of the non-transfected and 0% of the EGFP-control transfected EB3 cells (Figure 2B–D) suggesting only a small inhibitory effect of the transfection procedure.
Next, we determined the effect of modulating the intracellular Tß4 concentration by transfection. The migration ratios were determined for the transfected EGFP-positive cells. Four independent experiments were performed for each condition with about 10% transfection yield. The data obtained indicated that overexpression of Tß4 reduced and its down-regulation increased the migratory activity of these tumour cells when compared to cells transfected with the empty Tß4-pIRES-EFGP-vector as control (Figure 2B–D). Furthermore, the data obtained showed that the tumour cells responded with different extents to the modulation of the intracellular Tß4 concentration. Cell lines with high initial migratory activity were more strongly affected by the decrease or increase in intracellular Tß4 concentration. Overexpression of Tß4 reduced the migratory activity of MDA-MB-231 cells to 4.3% ± 0.23% of the total EGFP-positive transfected cells, i.e. to 32% of the control, whereas down-regulation increased their migratory activity to 38,3% ± 4.23%, i.e., to 288% of control (Figure 2B). Tß4-overexpression in 3LNLN cells had only a small reducing effect (to 98% of control), but down-regulation a large stimulating effect on their migratory activity (660% of control, see Figure 2C). Principally, a similar behaviour was observed for the more sessile EB3 cells: few EB3 cells migrated when not transfected, but no migration was observed after transfection with empty EGFP- or Tß4-pIRES-EGFP vector, whereas after transfection with Tß4-shRNA-EGFP about 1% of the transfected cells migrated though the total number of migrating EB3 cells remained low (Figure 2D). Thus these results indicated that the tumour cells responded to Tß4 down-regulation with an increase and to Tß4 overexpression with a decrease of their migratory activity albeit with different extents suggesting that additional intracellular components or control mechanisms are responsible for their actual migratory activity.
We also tested by the transwell assay the migratory activity of the additionally included colon tumour cells (SW-480, Caco-2, LS174t, and HT-29) under control conditions and after transfection with both vectors. The data obtained (see Table S1) showed very little migratory activity of these cell lines under control conditions. After transfection with Tß4-pIRES-EGFP, the Caco-2, LS174t, and HT-29 cells showed a slight reduction of their migratory activity, whereas the SW-480 hardly responded (Table S1). Transfection with Tß4-shRNA-EGFP vector led to an increase of the migratory activity of all these cells though with very different extents (Table S1). Since we assumed that these cells may contain high amounts of beta-thymosins leading to reduced migration under control conditions, we concentrated in the further analysis on the MDA-MB-231, 3LNLN and EB3 cells, which exhibited high, intermediate and reduced migratory activity as shown by the transwell assay, respectively (Figure 2), aiming to investigate the role of Tß4 for the migration of tumour cells with supposed divergent metastatic activity.
3.5. Cell Migration Analysed by the Agarose Drop Assay
We employed also the so-called agarose drop assay [44] to investigate the migratory behaviour of the tumour cells. In an initial test 50,000 cells transfected with the EGFP-clone alone were included in 4 µl 2% agarose drops and placed in laminin-coated wells of a 98 well plate. After 72 h the number of cells migrating out of the agarose drop was estimated. The percentage of total (non-transfected and transfected) cells migrating out of the drop (Figure 3A-C giving about a quarter of the agarose drops) decreased from MDA-MB-231 (4.4% = 2,200 cells) to 3LNLN (3.7% = 1,850 cells) and EB3 (0.22% = 110 cells) showing a similar behaviour as obtained by the transwell assay.
Next, we concentrated on the 3LNLN cells and investigated their migratory activity after transfection with EGFG-plasmid alone, Tß4-pIRES-EGFP leading to Tß4 overexpression, and Tß4-shRNA-EGFP leading to downregulation of Tß4. Figure 4 shows their migration out of agarose drops, whose borders are marked by a yellow line. It can be seen that Tß4 overexpression (Figure 4C) leads to a reduction and its downregulation to an increase (Figure 4D) of the number of fluorescent cells migrating out of the agarose drop in comparison to control or only EGFP-transfected cells (Figure 4A,B).
We also counterstained the 3LNLN cells transfected with Tß4-pIRES-EGFP and Tß4-shRNA-EGFP having left the agarose drop by TRITC-phalloidin (Figure 3H,I). The Tß4-pIRES-EGFP transfected and EGFP-positive 3LNLN cells showed reduced F-actin content (arrow in Figure 3H’ pointing to two EGFP-positive cells). In contrast, the Tß4-shRNA-EGFP transfected 3LNLN cells showed large lamellipodia-like extensions filled by microfilaments sitting on a strongly TRITC-phalloidin stained rim indicating the formation of more filamentous actin (arrows in Figure 3I’). It was, however, difficult to reliably estimate the number of the fluorescent cells leaving the agarose drops, since they often aggregated or migrated as large groups making an exact cell count impossible (see in particular Figure 4D).
3.6. Influence of Extracellular Tß4 on Tumour Cell Migration
Next, we analysed the effect of externally added Tß4 to tumour cells enclosed in agarose drops on their outwards migratory activity and the organisation of their actin filament system, also because earlier reports had indicated that external Tß4 stimulated the survival and migratory activity of cardiomyocytes and endothelial cells [36]. Assuming internalisation of external Tß4, these published data seemed to contradict our transfection results showing a decrease in migratory activity after upregulation of the intracellular Tß4. Since transient transfection might not lead to a constant alteration of the intracellular Tß4 concentration during the period of observation, we determined the migratory activity of MDA-MB-231 and 3LNLN cells exposed to increasing concentrations of extracellular N-terminally His-tagged-Tß4 by the agarose drop assay. The cells having left the agarose drops were counted after 72 h. Both MDA-MB-231 and 3LNLN cells showed an identical biphasic response of their migratory activity to increasing N-terminally His-tagged-Tß4 (shown for the 3LNLN cells in Figure 4A and for MDA-MB-231 cells in Supplementary Figure S4), i.e., a stimulatory effect up to an extracellular Tß4 concentration of 0.24 µM and thereafter a gradual decrease reaching control value (absence of extracellular Tß4) at about 2.8 µM. Of note, this biphasic behaviour was not observed when applying a scrambled Tß4 version (identical amino acid composition but different sequence; Figure 4B). Identical results were obtained for native Tß4 (not shown) in line with previous data showing that His-tagged-Tß4 inhibited actin polymerization like native Tß4 after increasing the salt concentration [46]. In contrast, the EB3 cells did not display a significant response to alterations of the extracellular His-Tß4 concentrations (not shown).
As control we exposed the cells in an identical manner to His-tagged scrambled Tß4 (His-scTß4; Figure 4B), which was previously shown not to inhibit actin polymerization [46]. His-scTß4 did not elicit any modifying effect on the migratory activity of the MDA-MB-231 and 3LNLN cells (Figure 4A). Thus, the MDA-MB-231 and 3LNLN cells showed a biphasic response of their migratory activity to extracellular Tß4: stimulation up to 0.24 µM His-Tß4 and a gradually increasing inhibition at higher concentrations. At 2.8 µM extracellular Tß4 many of the 3LNLN cells showed a round morphology (Figure 4F) and the number of both MDA-MB-231 and 3LNLN cells migrating out of the agarose drop had returned to the initial value.
In addition, we investigated whether the tumour cells internalized extracellular His-tagged Tß4. Anti-Tß4 and -His staining suggested their uptake by 3LNLN cells (Figure 4C’). Thus after exposure to 0.24 µM His-Tß4, double immunostaining with anti-Tß4 (green) and anti-His (red) indicated the presence of His-Tß4 in the cytoplasm: concentrated at presumed rear regions but reduced in supposed lamellipodial extensions (arrow-heads and arrows in Figure 4C,C’) resulting in a complete colocalization of anti-His (His-Tß4) and anti-Tß4 immunoreactivity (Figure 4C’’). When staining F-actin with TRITC-phalloidin, we observed in 3LNLN cells exposed to 0.24 µM His-Tß4 and after migration out of the agarose drop that most of these cells possessed a well-developed microfilament system terminating in Tß4-positive membrane areas resembling adhesion points (arrow in Figure 4D); also evident in the single cell shown (arrow in Figure 4E).
In addition, we frequently observed cytoplasmic dot-like structures - possibly invadopodia - that were double positive for Tß4 and F-actin (arrow head in Figure 4D’’). Staining the 3LNLN cells exposed to 2.8 µM His-Tß4 with anti-His for His-Tß4 and TRITC-phalloidin (Figure 4F) showed that most of the cells had attained a round morphology and that His-Tß4 was present within the cytoplasm and weakly within the nuclei, whereas F-actin concentrated in the cell periphery. Thus these data suggested that cell exposure to 2.8 µM His-Tß4 had a similar effect as transfection with the pIRES-Tß4 vector except that all cells were affected.
3.7. Effect of Exposure to 2.8 µM Tß4 on 3LNLN Cells
In order to further analyse the actin cytoskeleton of 3LNLN cells exposed to high His-Tß4 leading to reduction of their migratory activity, we incubated these cells with 2.8 µM His-Tß4 for 24 h without inclusion into an agarose drop. Subsequently, we performed immunostaining with anti-Tß4 (Figure 5A) or anti-His (Figure 5B-C) and TRITC-phalloidin. The data showed again that most of the cells had a round morphology (Figure 5A) with an almost even distribution of the anti-His immunoreactivity and a peripheral concentration of the TRITC-phalloidin stain (Figure 5A’). Occasionally, the anti-His stain concentrated within the cell nucleus (Figure 5B), whereas the F-actin often appeared irregularly aggregated within the cytoplasm (Figure 5B’). Phase contrast images showed that these cells had formed bleb-like extensions typical for cells undergoing apoptosis (Figure 5C; see below) that was verified by immunostaining with an anti-active caspase-3 antibody (Figure 5C’). These morphological changes were not observed when 3LNLN cells were exposed to 0.24 µM Tß4. As control, we exposed 3LNLN cells to 2.8 µM His-sc-Tß4 (see sequence comparison in Figure 5B). After 24 h, we did not observe the morphological alterations induced after exposure to 2.8 µM His-Tß4 (Figure 5D), however, the anti-His staining concentrated within the cell nuclei see below) suggested that their uptake was not a sequence nor stereo specific process. The fact that suggesting that in addition to Tß4 alone the His-tag itself possessed nuclear localization activity the His-tag itself possessed nuclear localization activity (Figure 5D). The fact that both His-Tß4 and His-scTß4 were taken up by 3LNLN suggested that their uptake was not a sequence nor stereo-specific process.
Plasma membrane blebbing reminiscent of apoptosis was also detected in 3LNLN cells transfected with the pIRES-Tß4-EGFP construct as shown for only the EGFP-expressing cells (Figure 5E) and by phase-contrast imaging (Figure 5E’’). Immunostaining with anti-active caspase-3 showed positive reactivity for only these cells (Figure 5E’) strongly supporting the notion that overexpression of Tß4 followed by F-actin disassembly induces cell demise by apoptosis.
3.8. Co-Localisation of Tß4 with ILK in the Presence of Extracellular Tß4
Next, we investigated the intracellular effects of the exposure of the colon tumour cells to 0.24 µM extracellular Tß4 leading to the increased migratory activity. This study was prompted by previous data showing that cardiomyocyte progenitor and endothelial cells internalize extracellular Tß4, which subsequently bound to the LIM-domain containing PINCH protein in complex with ILK and parvin [37]. Supposedly, PINCH together with Tß4 stimulates the kinase activity of ILK by mediating its association with integrins assembled in focal adhesions, into which actin filaments terminate. Subsequently, ILK activates threonine/serine kinases of the AKT family (also known as protein kinases B; PKB) by phosphorylation of AKT-kinases at Ser473 (AKT1) or Ser474 (AKT2) leading to stimulation of cell migration and/or survival by inhibiting apoptosis [52,53].
In addition, we investigated by immunostaining the localization of profilin in relation to ILK, because previous reports had suggested that Tß4 in complex with actin translocates towards the plasma membrane, where plasma membrane bound profilin might by its higher affinity to actin dissociate the actin:Tß4 complex [54]. The subsequent binding of liberated Tß4 to PINCH of the PINCH-parvin-ILK complex (“PPI-complex”) supposedly activates the phosphokinase activity of ILK [36,37]. We observed by immunostaining with anti-profilin its presence within the cytoplasm of 3LNLN cells and occasionally at the tips of filopodia-like extrusions, where it co-localized with anti-ILK immunoreactivity (Figure 6G). It is however possible that other cytoskeletal components close to the plasma membrane like actin nucleating proteins (Arp2/3 complex or formins) are better suited to separate the actin:Tß4 complex as shown in biochemical assays [27,28]. Furthermore, the formation of a stable ternary profilin:actin:Tß4 complex has been shown suggesting that Tß4 might not necessarily be dissociated from actin by profilin [54].
3.9. Extracellular Tß4 Increases the Phosphorylation/Activation of AKT/PKB Proteins
Dot-immunoblots indicated a modulation of the expression of ILK by extracellular Tß4 being high in the presence of 0.24 µM Tß4 and decreasing at 2.4 µM Tß4 (Figure 7A, upper row). Using a pan-anti-AKT antibody (recognizing AKT1,2,3) did not indicate a similar response of AKT-proteins to these Tß4 concentrations (Figure 7A, lower row). In contrast, using an antibody against P-Ser474-AKT2 showed a clear increase of phosphorylated AKT2 in homogenates of 3LNLN cells after exposure to 0.24 µM extracellular Tß4 and a decrease at 2.4 µM Tß4 (Figure 87A, middle row). The quantitative densitometric evaluation of the immunodot experiments are given in Table 2.
Immunostaining resting 3LNLN cells with anti-pan-AKT indicated a cytoplasmic distribution of AKT proteins (Figure 7B). Immunostaining 3LNLN cells exposed to 0.24 µM Tß4 with anti-P-Ser473-Akt1 showed an increase of phosphorylated AKT1 and its concentration in peripheral dot-like areas, where it colocalized with Tß4 (Figure 7C). Similar distributions were obtained by staining 3LNLN cells with anti-P-Ser474-Akt2 and TRITC-phalloidin (Figure 7D) when exposed to 0.24 µM Tß4. These 3LNLN cells showed an increase in P-Ser474-Akt2 immunoreactivity that colocalized with F-actin within presumed adhesion areas (arrows in Figure 7D) and additionally showed a strong cytoplasmic P-Ser474-Akt2 immunoreactivity. Thus these results support the notion that Tß4 aided phosphorylation of AKT proteins, also termed phosphokinases B (PKB), by ILK.
In contrast, exposure to 2.4 µM Tß4 led to a decrease of anti-P-Ser474-AKT2 staining, but not to a complete reversal, although migration was inhibited under this condition. Furthermore, peripheral P-Ser474-Akt2-positive contact points were not observed in 3LNLN cells exposed to 2.4 µM Tß4 (Figure 7E). Table 2 summarizes the immunodot data from 3LNLN cell homogenates indicating that exposure of 3LNLN and MDA-MB-231 (not shown) tumour cells to 0.24 µM extracellular Tß4 leads to a stimulation of the ILK-AKT signalling pathway in agreement with previous reports that demonstrated for endothelial and colon tumour cells Ser474-Akt2 phosphorylation after Tß4 binding to ILK [37,55].
Previous data have shown that phosphorylated AKT/PKB proteins (at Ser473 or 474) bind to PIP2 or PIP3 by their pleckstrin-(PH)-domain and thus remain attached to the plasma membrane [53]. Only these membrane-attached AKT/PKB proteins are supposed to possess phosphokinase activity able to phosphorylate target proteins [53]. When however released from these phospho-inositols, they become dephosphorylated and inactivated within the cytosol by the PTEN-phosphatase [53]. Only certain AKT-mutants – often with oncogenic potential - are then still active and able to phosphorylate target proteins. The additional cytoplasmic presence of particularly P-Ser474-AKT2 might therefore suggest that these tumour cells might contain mutated variants of AKT2.
3.10. Expression of Matrix-Metalloproteinases in Non-Stimulated Carcinoma Cells
Active AKT/PKB-proteins phosphorylate a large number of substrate proteins and thereby lead to increased cell survival (by inhibition of apoptosis) and cell migration also of tumour cells. Tumour cell migration is often supported by expression and secretion of proteases, in particular of metalloproteinases (MMPs), which degrade extracellular matrix components, especially those forming structural barriers like basement membranes. Indeed, AKT/PKB-proteins activate the transcriptional activity of the nuclear factor NF-κB by phosphorylation of the inhibiting component κB (IκB) leading to its subsequent degradation [55]. This process finally induces the expression of MMPs [38,56] and the formation of invadopodia as observed for 3LNLN cells (see Figure D).
First, we analysed the expression and secretion of the metalloproteinases MMP2, MMP9, and the tissue inhibitor of metalloproteinase 2 (TIMP2 [57]) by MDA-MB-231, 3LNLN, and EB3 cells before exposure to Tß4. Dot immunoblotting using anti-MMP2 and -TIMP2 showed that under resting conditions the three cell lines already expressed MMP2 and TIMP2 (shown in Figure 8A) and MMP9 (see adjunct Table B). Both MMPs belong to the gelatinase group and play a crucial role during basement membrane disruption necessary for tumour invasion [38,56]. Densitometric evaluation of the dot plots (as shown for MMP2 and TIMP2 in Figure 8A) showed the highest MMP2 and MMP9 expression and secretion into the medium by MDA-MB-231 cells (set at 100%, see Figure 8A and Table B), which also possess the highest migratory activity and invasive potential. Interestingly the amounts of MMP2 and MMP9 in cell homogenates and medium increased from EB3 to 3LNLN and MDA-MB-231 cells (Figure 8A and Table B), i.e., directly correlating with their migratory (invasive) activity; whereby the amounts of MMP2 in cell homogenates and medium appeared almost equal for the migratory MDA-MB-231 and 3LNLN cells (Figure 8A). Furthermore, we analysed the expression of TIMP2 (tissue inhibitor of metalloproteinase), which is known to be an effective inhibitor of MMP2 [57]. Anti-TIMP2 reactivity was lowest in MDA-MB-231 cell homogenate (set at 100%) and increased in 3LNLN cells (to 140%) and further in EB3 cells (to 290%), i.e., inversely correlating with their migratory (invasive) activity.
In addition, we performed in the absence of extracellular Tß4 immunostaining of the three cell lines with anti-MMP2 and TIMP2 (Figure 8C,D and F). The data showed in all three cell lines the presence of both MMP2 and TIMP2 in granular cytoplasmic structures, which showed no clear colocalisation. Indeed, the anti-MPP2 staining indicated in MDA-MB-231 and 3LNLN cells a more peripheral localisation of the anti-MMP2 granules suggesting their transport to possible sites of release into the medium (see also Table B), whereas the granules stained by anti-TIMP2 localised more centrally (Figure 8C,F).
3.11. Exposure to Extracellular Tß4 Increases MMP Expression by the Carcinoma Cells
Next, we investigated by dot immunoblotting whether exposure of 3LNLN cells to 0.24 µM or 2.4 µM extracellular Tß4 affected the expression and secretion of metalloproteinases MMP2 and MMP9 (Figure 8G to I and Table 8F). Setting the amounts of intra- and extracellular amounts of MMP2 and MMP9 of non-exposed cells at 100%, we observed that after Tß4 exposure the amounts of intracellular MMP2 and MMP9 increased (Figure 8E). Intracellularly, MMP2 was found highest at 2.4 µM Tß4, whereas MMP9 was highest at 0.24 µM Tß4. The extracellular amounts of MMP2 and MMP9 continuously increased with the exposure to 2.4 µM Tß4, though MMP9 was absent at zero Tß4 (Figure 8E). These data seem to suggest that the expression of MMP2 and MMP9 are differently regulated. However, it is possible that the higher content of MMP2 and MMP9 in the medium was partially due to cell death as observed after exposure to 2.4 µM Tß4 (see Figure 5C). Nevertheless, these data indicate that modulating the migratory activity of the 3LNLN cells by different Tß4 concentrations also affects the synthesis and secretion of MMPs.
Finally, we performed immunostaining with antibodies against TIMP2 and MMP2 of 3LNLN cells after their exposure to 0.24 µM and 2.4 µM Tß4 (Figure 8G,H). The data obtained suggested an increase of MMP2 in the cytoplasm after exposure to 0.24 µM extracellular Tß4 (Figure 8G,H), whereas the anti-TIMP2 immunoreactivity appeared unaltered (Figure 8G,H). The immunostaining showed a dotted appearance of TIMP2 and also MMP2 within the cytoplasm suggesting their presence in secretory vesicles (Figure 8G). In many vesicular structures both TIMP2 and MMP2 appeared to colocalize that might not be surprising in view of the fact that TIMP2 is known to activate MMP2 [38,57]. After exposure to 2.4 µM Tß4, the whole cytoplasm of 3LNLN cells was strongly stained by anti-TIMP2 and anti-MMP2 (Figure 8H). Of note, many cells and attained a more rounded morphology as described above (see Figure 7F).
Anti-MMP9 staining of 3LNLN cells exposed to 0.24 µM Tß4 gave a strong perinuclear staining and a weak punctate cytoplasmic suggesting its inclusion in secretory vesicles (Figure 8I). The anti-Tß4 staining also showed a strong staining of perinuclear cytoplasm, but also localized prominently underneath the plasma membrane at presumably lamellipodial extensions possibly supporting actin cycling during locomotion (Figure 8I, see also Figure 4E). Thus, these data seem to indicate that migration and MMP synthesis of these tumour cells respond distinctly to different concentrations of extracellular Tß4.
4. Discussion
The metastasis of cancer cells and the subsequent colonization in distant organs depends on cell intrinsic and extrinsic factors and are the main causes of death of cancer patients. Cancer cells originate by trans-differentiation of epithelial to mesenchymal cells (EMT), which after reorganisation of their actin cytoskeleton regain the motility necessary for metastatic invasiveness. However, it has not been possible to define a common trait or genetic signature for the metastatic behaviour of cancer cells [1]. Even tumour cells originating form a particular tumour may contain cell subpopulations with differing metastatic activity. The dynamic rearrangements of the actin cytoskeleton, the transient formation of actin-rich membrane extensions and of attachment points to ECM components are essential intrinsic prerequisites for tumour cell metastasis. The dynamic behaviour of their actin cytoskeleton is regulated by a multitude of actin binding proteins (ABPs) and furthermore be modified by the tumour micro-environment formed by ECM components, cytokines and growth factors [1,58]. Here we investigated under cell culture conditions the effects of cofilin and in particular of the actin binding peptide thymosin ß4 on the migratory behaviour of three established cell lines derived from breast and colorectal cancer possessing different metastatic potential.
Cofilin is a member of the cofilin/ADF (actin depolymerizing factor) family and has been shown to stimulate F-actin severing and/or cycling by promoting actin subunit dissociation from the filament minus ends [21,22]. These activities have been shown to be increased in migrating tumour cells [23]. Though the three selected tumour cells exhibited different migratory activities, they contained almost equal amounts of cofilin suggesting that their varying migratory activity was not due to differing cofilin content. Nevertheless, we investigated by transfection experiments the effects of wild-type, constitutively active or inactive cofilin variants assuming that differences in cofilin’s state activation might be responsible for the differences of their migratory activity. Our data, however, showed that only transfection with the constitutively active S3A-cofilin mutant led to a slight increase in migratory activity, whereas wild-type and the constitutively inactive S3D-cofilin mutant exerted only a small stimulation or no effect, respectively. These data suggested that de- or phosphorylation of the endogenous cofilin might have re-setted the concentration of active cofilin.
In contrast, a completely different effect on the migratory activity of the analysed tumour cells was observed when modulating the intracellular concentration of Tß4 by transfection. The Tß4-shRNA or Tß4-IRES vectors inducing a decrease or increase of intracellular Tß4 led to a clear stimulation or reduction, respectively, of their migratory activity. These results are in agreement with the inverse correlation of their migratory activity and endogenous Tß4 concentrations as determined by immunoblotting and also suggested that intracellular Tß4 is not regulated by post-translational modifications.
It should also be mentioned that the HPLC-analyses of the intracellular concentrations of ß-thymosins showed that these tumour cells contained in addition to Tß4 also Tß10, a closely related variant possessing 65% sequence identity to Tß4 and identical actin sequestering properties [32]. Though no specific properties or activities are known for Tß10, it has been reported to be overexpressed in a number of tumour cells [30,31]. Transfection with the Tß4-shRNA vector might have reduced only the Tß4 isoform, but led to an increase of the migratory activity probably due to a decrease in total ß-thymosin concentration. Thus, the effects obtained after transfection with these vectors seemed to be in full agreement with their G-actin sequestering activities.
Transfection experiments usually affect only a small fraction of the targeted cells. Since previous reports had indicated that extracellular Tß4 supports survival of cardiomyocytes [36] and is even taken up these cells, we exposed the 3LNLN and MDA-MB-231 tumour cells to increasing concentrations of His-tagged-Tß4 (varying from zero to 2.8 µM). The data obtained showed a biphasic response of their migratory activity with maximal stimulation of migration at 0.24 µM and inhibition at 2.8 µM His-Tß4. Immunostaining after His-Tß4 exposure with anti-His demonstrated the intracellular presence of His-Tß4 in all exposed cells indicating either its passive diffusion or active uptake.
The inhibition of 3LNLN (Figure 5) and MDA-MB-231 (Figure S5) cell migration at high extracellular Tß4 (2.4 to 2.8 µM) was most probably due to disassembly of their actin filaments as observed by Tß4 overexpression after Tß4-pIRES transfection. Assuming an intracellular Tß4 concentration of 0.33 µM in 3LNLN cells before His-Tß4 exposure (see Table 1), it appears possible that at 2.4 to 2.8 µM extracellular His-Tß4 its intracellular concentration increased high enough to lead to an almost complete microfilament disassembly and thereby to inhibition of cell migration. Furthermore, we observed cell rounding and occasionally an accumulation of anti-His immunoreactivity in the nuclei of rounded cells (see Figure 5B–D). The presence of Tß4 in cell nuclei has been reported previously [59], however, the presumed accumulation of His-Tß4 in the nuclei and cytoplasm might have led to F-actin depolymerisation in both organelles and led to induction of apoptosis [60].
The stimulatory effect up to 0.24 µM extracellular Tß4 on cell migration appears more difficult to explain, since the stimulating extracellular His-Tß4 concentrations were lower than the intracellular Tß4 (0.33 µM) except an active uptake of extracellular His-Tß4 occurred as observed at 2.8 µM. Indeed, anti-His immunostaining at 0.24 µM extracellular His-Tß4 showed intracellular anti-His immunoreactivity concentrated at presumed focal adhesion points (see Figure 4C). Alternatively, it has been suggested that Tß4 interacted with a putative receptor protein [52], however, a beta-thymosin specific receptor has not yet been identified.
Nevertheless, tumour cell exposure to 0.24 µM extracellular His-Tß4 appeared to initiate the formation of the ILK-Tß4-PINCH-parvin complex leading to activation of the integrin-linked kinase (ILK) that activated the ILK-AKT/PKB pathway by phosphorylation of Ser473 of AKT1 and Ser474 of AKT2 (also termed phosphokinases B; PKBs) as demonstrated by immunostaining phospho-specific anti-AKT antibodies. Their phosphorylation is known to lead to increased cell survival by inhibition of apoptosis, elevated migratory activity and expression and secretion of matrix-metalloproteases (as shown in Figs. 7and 8) further supporting migration [37,38].
Thus, our more system biological approach shows a concentration dependent effect of extracellular Tß4 on cell migration and survival and might explain the divergent reports of the effect of increasing Tß4 concentration of tumour cell migration. Immunohistochemical analyses of biopsy material of colon tumour areas have shown a higher Tß4 immunoreactivity of the tumour cells in comparison to non-transformed cells [30,55]. We assume that these tumour cells corresponded to the tumour cells exposed to 0.24 µM extracellular His-Tß4 in this study. Indeed, stimulation of ILK and AKT/PBK was also shown for the ex-vivo colon tumour cells [30,55].
So far, no reports have given evidence that in vivo tumour cell migration was stimulated by extracellular Tß4. Furthermore, the serum Tß4 concentration was determined to be only about 0.04 mg/ml (= 8 nM) [43], i.e., far below the Tß4 concentration found in this report to stimulate tumour cell migration. However, after blood clotting Tß4 was found to increase to 16.3 mg/ml (= 3.3 µM) [49] that may be due to Tß4 release from platelets and/or during the formation of extracellular traps (NETs) by neutrophils, which possess also a high Tß4 content of Tß4 [61,62]. Therefore, it is possible that under different regimes of chemotherapy neutrophils are induced to form NETs increasing the extracellular concentration of Tß4 to a level that supports tumour cell migration. Recent publications have reported contradictory effects of NETs on tumour cell migration [see reviews 63,64], which might again be due to varying concentrations of the extracellular Tß4 attained by different extents or number of NET-forming neutrophils. Therefore, more investigations are necessary to elucidate the in vivo “dual” role of the beta-thymosins possibly released by neutrophils. In addition, it might be worth considering the possibility to inhibit tumour cell migration/metastasis by applying Tß4 or its active fragments as a therapeutic measure.
Supplementary Materials
The following supporting information can be downloaded at the website of this paper posted on Preprints.org.
Author Contributions
All authors contributed to the study conception and design. AAH performed most of the experiments (cell culture, migration assays and immunoblotting); KC and AJM provided the colon carcinoma cell lines and introduced their cultivation conditions; BBS provided the thymosin beta 4 vectors; EH performed the HPLC determination of beta-thymosins in cell homogenates; AHH and HGM devised the study and continuously discussed the results with all authors. The first draft of the manuscript was written by Hans Georg Mannherz and all authors commented on previous versions of the manuscript. The final manuscript was read, commented and approved for submission to publication by all authors.
Funding
HGM thanks the Deutsche Forschungsgemeinschaft (Bonn-Bad Godesberg, Germany) for financial support (grant numbers: MA 807/14-2 and MA 807/14-3).
Institutional Review Board Statement
Not applicable.
Informed Consent Statement
Not applicable.
Data Availability Statement
The datasets generated during and/or analysed during the current study are not publicly available, but are available from the corresponding author on reasonable request.
Acknowledgments
We thank Prof. Brigitte Jockusch and Mrs. R. Buchmeier (Braunschweig, Germany) for generating and supplying the monoclonal anti-thymosin ß4 antibody.
Conflicts of Interest
The authors have no relevant financial or non-financial interests to disclose.
Abbreviations
| ABP | actin binding protein |
| ADF | actin depolymerizing factor |
| AKT | protein kinase B |
| ECM | extracellular matrix |
| EMT | epithelial-mesenchymal transition |
| F-actin | filamentous actin |
| FCS | foetal calf serum |
| FITC | fluorescein thioisocyanate |
| G-actin | monomeric/globular actin |
| HEPES | 4-(hydroxyethyl)-1-piperazineethanesulfonic acid |
| ILK | integrin-linked kinase |
| shRNA | small hairpin RNA |
| Tß4 | thymosin beta4 |
References
- Steeg, PS. Tumor metastasis: mechanistic insights and clinical challenges. Nat Med. 2006; 12: 895-904.
- Friedl P, Wolf K. Plasticity of cell migration: a multiscale tuning model. J Cell Biol. 2010 Jan 11;188(1):11-9. Epub 2009 Dec 1. PMCID: PMC2812848. [CrossRef] [PubMed]
- Fife CM, McCarroll JA, Kavallaris M. Movers and shakers: cell cytoskeleton in cancer metastasis. B J Pharm. 2013; 171: 5507-5523.
- Pollard TD, Cooper JA. Actin, a central player in cell shape and movement. Science. 2009; 326(5957): 1208-12. [CrossRef] [PubMed] [PubMed Central]
- Kühn S, Mannherz HG. Actin: Structure, Function, Dynamics, and Interactions with Bacterial Toxins. Curr Top Microbiol. Immunol. 2017; 399: 1-34. [CrossRef] [PubMed]
- Safer D, Elzinga M, Nachmias VT. Thymosin beta 4 and Fx, an actin-sequestering peptide, are indistinguishable. J Biol Chem. 1991 Mar 5;266(7):4029-32. [PubMed]
- Cassimeris L, Safer D, Nachmias VT, Zigmond SH. Thymosin ß4 sequesters the majority of G-actin in resting human polymorphonuclear leukocytes. J Cell Biol. 1992; 119: 1261-1270.
- Mannherz HG, Hannappel E. The ß-thymosins: Intracellular and extracellular activities of a versatile actin binding protein family. Cell Motil Cytoskeleton. 2009; 66: 839-851.
- Yeoh S, Pope B, Mannherz HG, Weeds A. Determining the differences in actin binding by human ADF and cofilin. J Mol Biol. 2002; 315(4):911-25. [CrossRef] [PubMed]
- Xue B, Robinson RC. Guardians of the actin monomer. Eur J Cell Biol. 2013; 92(10-11):316-32. Epub 2013 Nov 4. [CrossRef] [PubMed]
- Pollard TD, Borisy GG. Cellular motility driven by assembly and disassembly of actin filaments. Cell. 2003; 112: 453-465.
- Bravo-Cordero JJ, Magalhaes MA, Eddy RJ, Hodgson L, Condeelis J. Functions of cofilin in cell locomotion and invasion. Nat Rev Mol Cell Biol. 2013; 14:405-15.
- Lai FPL, Szczodrak M, Block J, Faix J, Breitsprecher D, Mannherz HG, Stradal TEB, Dunn GA, Small JV, Rottner K. Arp2/3 complex interactions and actin network turnover in lamellipodia. EMBO J. 2008; 27: 982-992.
- Linder S, Cervero P, Eddy R, Condeelis J. Mechanisms and roles of podosomes and invadopodia. Nat Rev Mol Cell Biol. 2023 Feb;24(2):86-106. Epub 2022 Sep 14. [CrossRef] [PubMed]
- Simiczyjew A, Mazur AJ, Ampe C, Malicka-Błaszkiewicz M, van Troys M, Nowak D. Active invadopodia of mesenchymally migrating cancer cells contain both β and γ cytoplasmic actin isoforms. Exp Cell Res. 2016; 339: 206-219.
- Friedl P, Bröcker EB. T cell migration in three-dimensional extracellular matrix: guidance by polarity and sensations. Dev Immunol. 2000; 7(2-4): 249-66. [CrossRef] [PubMed] [PubMed Central]
- Wegner, A. Head to tail polymerization of actin. J Mol Biol. 1976; 108: 139-150.
- Carlier MF, Pernier J, Montaville P, Shekhar S, Kühn S. Control of polarized assembly of actin filaments in cell motility. Cell Mol Life Sci. 2015; 72: 3051-3067.
- Friedl P, Bröcker EB. T cell migration in three-dimensional extracellular matrix: guidance by polarity and sensations. Dev Immunol. 2000; 7(2-4): 249-66. [CrossRef] [PubMed] [PubMed Central]
- dos Remedios CG, Chhabra D, Kekic M, Dedova IV, Tsubakihara M, Berry DA, Nosworthy NJ. Actin binding proteins: regulation of cytoskeletal microfilaments. Physiol Rev. 2003; 83(2):433-73. [CrossRef] [PubMed]
- Carlier MF, Laurent V, Santolini J, Melki R, Didry D, Xia G-X, Hong Y, Chua N-H, Pantaloni D. Actin filament depolymerizing factor (ADF/cofilin) enhances the rate of filament turnover: implication in actin-based motility. J. Cell Biol. 1997; 136: 1307-1323.
- Andrianantoandro E, Pollard TD. Mechanism of actin filament turnover by severing and nucleation at different concentrations of ADF/cofilin. Molec Cell. 2006; 24: 13-23.
- van Rheenen J, Condeelis J, Glogauer M. A common cofilin activity cycle in invasive tumor cells and inflammatory cells. J Cell Sci. 2009; 122(Pt 3):305-11. [CrossRef] [PubMed] [PubMed Central]
- Tania N, Prosk E, Condeelis J, Edelstein-Keshet L. A temporal model of cofilin regulation and the early peak of actin barbed ends in invasive tumor cells. Biophys J. 2011;100(8):1883-92. [CrossRef] [PubMed] [PubMed Central]
- Zarbock J, Oschkinat H, Hannappel E, Kalbacher H, Voelter W, Holak TA. Solution conformation of thymosin beta 4: a nuclear magnetic resonance and simulated annealing study. Biochemistry. 1990; 29(34):7814-21. [CrossRef] [PubMed]
- Ballweber E, Hannappel E, Huff T, Stephan H, Haener M, Taschner N, Stoffler D, Aebi U, Mannherz HG. Polymerisation of chemically cross-linked actin:thymosin beta(4) complex to filamentous actin: alteration in helical parameters and visualisation of thymosin beta(4) binding on F-actin. J Mol Biol. 2022; 315(4):613-25. [CrossRef] [PubMed]
- Mannherz HG, Mazur A, Jockusch BM. Repolymerization of Actin from Actin:Thymosin ß4 complex induced by Diaphanous related formins and Gelsolin. Ann NY Acad Sci. 2010; 1194: 36-43.
- Al Haj A, Mazur AJ, Buchmeier S, App C, Theiss C, Silvan U, Schoenenberger CA, Jockusch BM, Hannappel E, Weeds AG, Mannherz HG. Thymosin beta4 inhibits ADF/cofilin stimulated F-actin cycling and HeLa cell migration: reversal by active Arp2/3 complex. Cytoskeleton (Hoboken). 2014; 71(2):95-107. Epub 2013 Dec 31. [CrossRef] [PubMed]
- Cha HJ, Jeong MJ, Kleinman HK. Role of thymosin beta4 in tumor metastasis and angiogenesis. J Natl. Cancer Inst. 2003; 95: 1674-1680.
- Califano D, Monaco C, Santelli G, Giuliano A, Veronese M L, Berlingieri MT, de Franciscis V, Berger N, Trapasso F, Santoro M. 1998. Thymosin beta-10 gene overexpression correlated with the highly malignant neoplastic phenotype of transformed thyroid cells in vivo and in vitro. Cancer Res. 58: 823-828.
- Wang B, Wang Z, Zhang T, Yang G. Overexpression of thymosin β10 correlates with disease progression and poor prognosis in bladder cancer. Exp Ther Med. 2019 Nov;18(5):3759-3766. Epub 2019 Sep 13. [CrossRef] [PubMed] [PubMed Central]
- Yu FX, Lin SC, Morrison-Bogorad M, Atkinson MA, Yin HL. Thymosin beta 10 and beta 4 are both actin monomer sequestering proteins. J Biol Chem. 1993; 268(1):502-9. [PubMed]
- Yamamoto T, Gotoh M, Kitajima M, Hirohashi S. Thymosin beta-4 expression is correlated with metastatic capacity of colorectal carcinomas. Biochem Biophys Res Commun. 1993; 193(2):706-10. [CrossRef] [PubMed]
- Ricci-Vitiani L, Mollinari C, di Martino S, Biffoni M, Pilozzi E, Pagliuca A, de Stefano MC, Circo R, Merlo D, De Maria R, Garaci E. Thymosin beta4 targeting impairs activity of colon cancer stem cells. FASEB J. 2010; 24(11):4291-301. Epub 2010 Jun 21. [CrossRef] [PubMed]
- Popow-Wozniak A, Mazur AJ, Mannherz HG, Malicka-Blaszkiewicz M, Nowak D. Cofilin affects actin cytoskeleton organization and migration of human colon adenocarcinoma cells. Histochem. Cell Biol. 2012; 138: 725-736.
- Bock-Marquette I, Saxena A, White MD, Dimaio JM, Srivastava D. Thymosin beta4 activates integrin-linked kinase and promotes cardiac cell migration, survival and cardiac repair. Nature. 2004; 432: 466-472.
- Fan Y, Gong Y, Ghosh PK, Graham LM, Fox PL. Spatial coordination of actin polymerization and ILK-Akt2 activity during endothelial cell migration. Dev Cell. 2009: 661-674. [CrossRef] [PubMed] [PubMed Central]
- Niland S, Riscanevo AX, Eble JA. Matrix metalloproteinases shape the tumor microenviron-ment in cancer progression. Int J Molec Sci. 2021; 23(1):146. [CrossRef] [PubMed] [PubMed Central]
- Mannherz HG, Gonsior SM, Gremm D, Wu X, Pope BJ, Weeds AG. Activated cofilin colocalizes with Arp2/3 complex in apoptotic blebs during programmed cell death. Eur J Cell Biol. 2005; 84: 503-515.
- Wirsching H-G, Kretz O, Morosan-Puopolo G, Chernogorova P, Theiss C, Brand-Saberi B.Thymosin ß4 induces folding of the developing optic tectum in the chicken (Gallus domesticus). J Comp Neurol. 2011; 520: 1650-1662.
- Dai F, Yusuf F, Farjah GH, Brand-Saberi B. RNAi-induced targeted silencing of control genes during chicken embryogenesis. Dev Biol. 2005; 285: 80-90.
- Nowak D, Krawczenko A, Duoe D, Malicka-Blaszkiewicz M. Actin in human coloncells with different metastatic potential. Acta Polon. Biochim. 2002; 49: 823-828.
- Popow-Wozniak A, Mazur AJ, Mannherz HG, Malicka-Blaszkiewicz M, Nowak D. Cofilin overexpression affects actin cytoskeleton organization and migration of human colon cells. Histochem Cell Biol. 2012; 138: 725-736.
- Harrington JT Jr, Stastny P. Macrophage migration from an agarose droplet: development of a micromethod for assay of delayed hypersensitivity. J Immunol. 1973; 110(3):752-9. [PubMed]
- Zoubek RE, Hannappel E. Influence of the N terminus and the actin-binding motif of thymosin beta4 on its interaction with G-actin. Ann N Y Acad Sci. 2007; 1112:435-41. Epub 2007 May 10. [CrossRef] [PubMed]
- Röder, B. Biochemische und zellbiologische Untersuchungen des intrinsisch unstrukturierten Proteins Thymosin beta 4. Doctoral thesis, 2012; Ruhr-University Bochum (Germany).
- Bradford, MM. A rapid and sensitive method for the quantitation of microgram quantities of protein utilizing the principle of protein-dye binding. Anal Biochem. 1976; 72:248-54. [CrossRef] [PubMed]
- Hannappel E, Davoust S, Horecker BL. Isolation of peptides from calf thymus. Biochem Biophys Res Commun. 1982; 104(1):266-71. [CrossRef] [PubMed]
- Hannappel E, van Kampen M. Determination of thymosin beta 4 in human blood cells and serum. J Chromatogr. 1987; 397:279-85. [CrossRef] [PubMed]
- Hermoso M, Olivero P, Torres R, Riveros A, Quest AF, Stutzin A. Cell volume regulation in response to hypotonicity is impaired in HeLa cells expressing a protein kinase-C alpha mutant lacking kinase activity. J Biol Chem. 2004; 279(17):17681-9. Epub 2004 Feb 11. [CrossRef] [PubMed]
- Bamburg JR, Bernstein BW. Roles of ADF/cofilin in actin polymerization and beyond. F1000 Biol Rep. 2010; 2:62. [CrossRef] [PubMed] [PubMed Central]
- Bai D, Ueno L, Vogt PK. Akt-mediated regulation of NFkappaB and the essentialness of NF-kappaB for the oncogenicity of PI3K and Akt. Int J Cancer. 2009; 125(12):2863-70. [CrossRef] [PubMed] [PubMed Central]
- Ebner M, Lučić I, Leonard TA, Yudushkin I. PI(3,4,5)P3 Engagement Restricts Akt Activity to Cellular Membranes. Mol Cell. 2017; 65(3):416-431.e6. [CrossRef] [PubMed]
- Yarmola EG, Parikh S, Bubb MR. Formation and implications of a ternary complex of profilin, thymosin beta 4, and actin. J Biol Chem. 2001; 276(49):45555-63. Epub 2001 Sep 28. [CrossRef] [PubMed]
- Piao Z, Hong CS, Jung MR, Choi C, Park YK. Thymosin β4 induces invasion and migration of human colorectal cancer cells through the ILK/AKT/β-catenin signaling pathway. Biochem Biophys Res Commun. 2014; 452(3):858-64. Epub 2014 Sep 10. [CrossRef] [PubMed]
- Hey S, Linder S. Matrix metalloproteinases at a glance. J Cell Sci. 2024; 137(2):jcs261898. Epub 2024 Jan 18. [CrossRef] [PubMed]
- Raeeszadeh-Sarmazdeh M, Do LD, Hritz BG. Metalloproteinases and Their Inhibitors: Potential for the Development of New Therapeutics. Cells. 2020; 9(5):1313. [CrossRef] [PubMed] [PubMed Central]
- Lambert AW, Zhang Y, Weinberg RA. Cell-intrinsic and microenvironmental determinants of metastatic colonization. Nat Cell Biol. 2024;26(5):687-697. Epub 2024 May 7. Erratum in: Nat Cell Biol. 2024;26(7):1225. doi: 10.1038/s41556-024-01458-z. [CrossRef] [PubMed]
- Huff T, Rosorius O, Otto AM, Müller CS, Ballweber E, Hannappel E, Mannherz HG. Nuclear localisation of the G-actin sequestering peptide thymosin beta4. J Cell Sci. 2004; 117(Pt 22):5333-41. Epub 2004 Oct 5. [CrossRef] [PubMed]
- Mannherz HG, Gonsior SM, Wu X, Polzar B, Pope BJ, Wartosch L, Weeds AG. Dualeffects of staurosporine on A431 and NRK cells: microfilament disassembly and uncoordinated lamellipodial activity followed by cell death. Eur J Cell Biol. 2006; 85(8):785-802. Epub 2006 May 11. [CrossRef] [PubMed]
- Cassimeris L, Safer D, Nachmias VT, Zigmond SH. Thymosin beta 4 sequesters the majority of G-actin in resting human polymorphonuclear leukocytes. J Cell Biol. 1992; 119(5):1261-70. [CrossRef] [PubMed] [PubMed Central]
- Mannherz HG, Budde H, Jarkas M, Hassoun R, Malek-Chudzik N, Mazur AJ, Skuljec J, Pul R, Napirei M, Hamdani N. Reorganization of the actin cytoskeleton during the formation of neutrophil extracellular traps (NETs). Eur J Cell Biol. 2024; 103(2):151407. Epub ahead of print. [CrossRef] [PubMed]
- Khan U, Chowdhury S, Billah MM, Islam KMD, Thorlacius H, Rahman M. Neutrophil Extracellular Traps in Colorectal Cancer Progression and Metastasis. Int J Mol Sci. 2021; 22(14):7260. [CrossRef] [PubMed] [PubMed Central]
- Mousset A, Bellone L, Gaggioli C, Albrengues J. NETscape or NEThance: tailoring anti-cancer therapy. Trends Cancer. 2024;10(7):655-667. Epub 2024 Apr 24. [CrossRef] [PubMed]
Figure 1.
Immunostaining of (A) MDA-MB-231, (B) 3LNLN and (C) EB3 cells with anti-Tß4 and TRITC-phalloidin. Bars represent 10 µm.
Figure 1.
Immunostaining of (A) MDA-MB-231, (B) 3LNLN and (C) EB3 cells with anti-Tß4 and TRITC-phalloidin. Bars represent 10 µm.
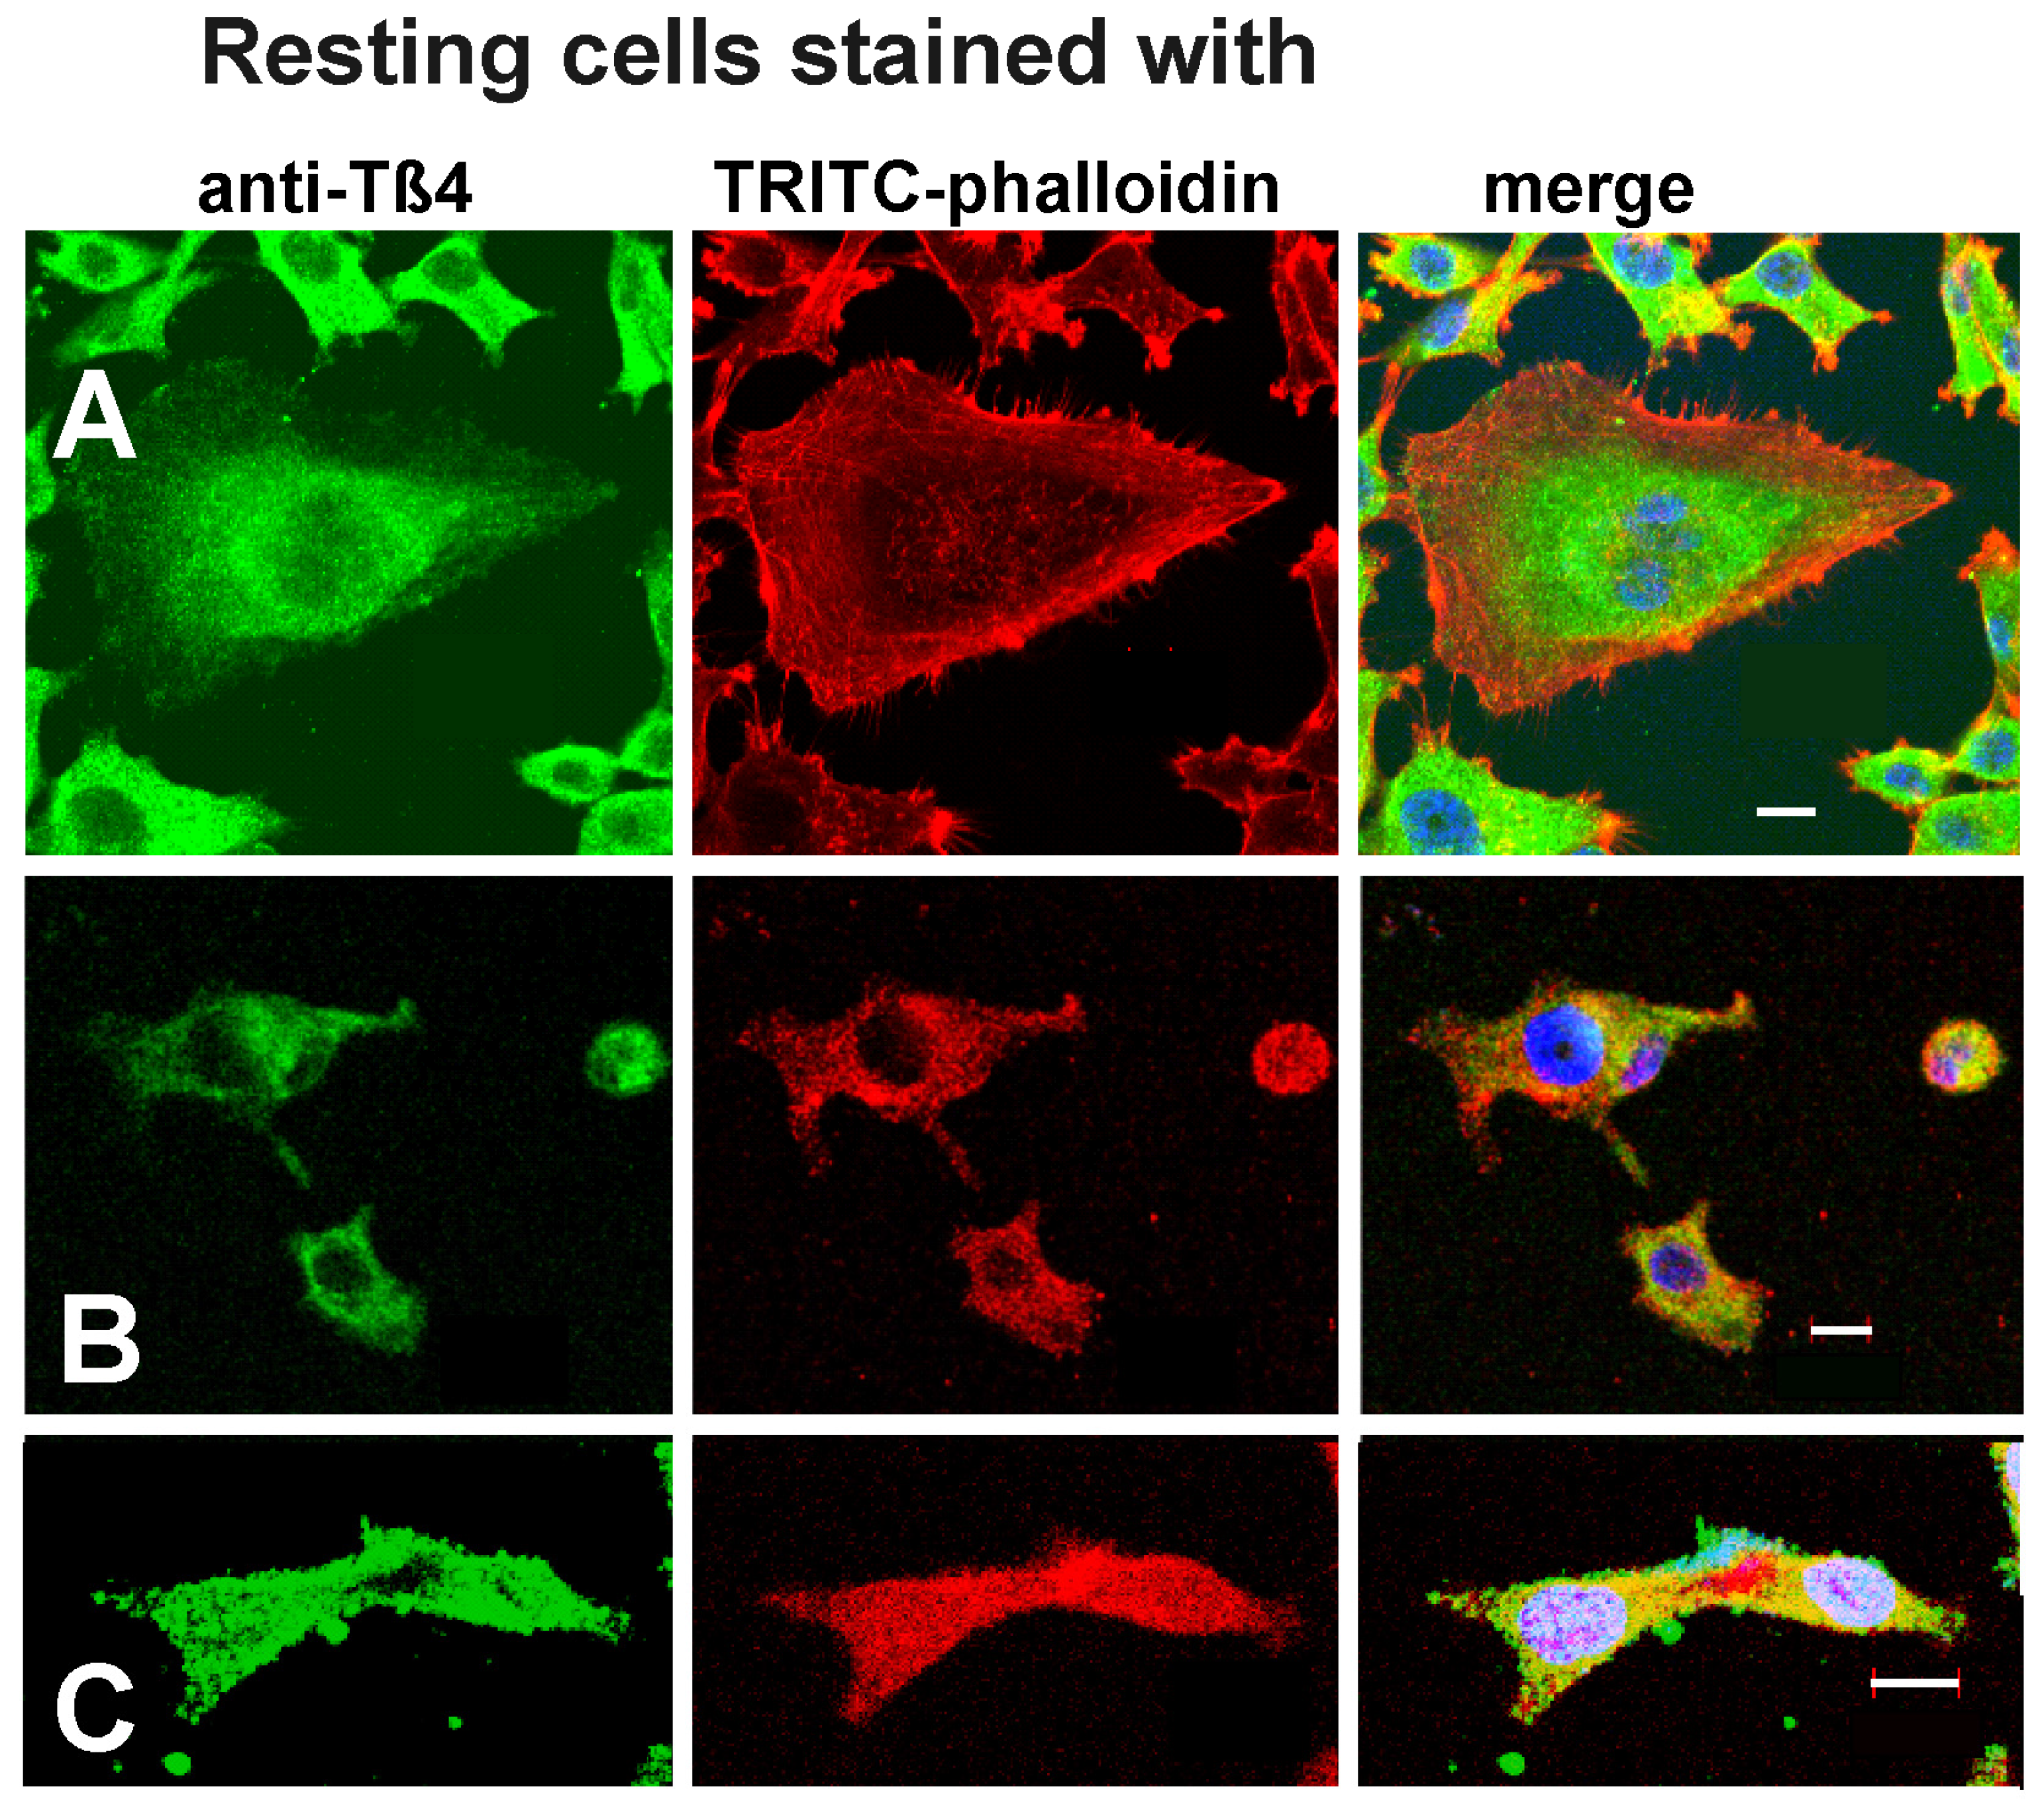
Figure 2.
Effect of the modulation of the Tß4 concentration by transfection on tumour cell migration. (A) Anti-Tß4 Western (boxed) and an immunodot blot using the mouse monoclonal anti-Tß4 of homogenates of the MDA-MB-231, EB 3, and 3LNLN cells (immunodot analysis was repeated five times). Note the differences in immunoreactivity between Western and immunodot blots (for further details see text). (B–D) Quantitation of cell migration of the three tumour cell lines by using the transwell assay (Boyden chamber). Cells were transfected with vectors leading to expression of only EGFP, with pIRES-Tß4 leading to overexpression of Tß4 and with Tß4-specific-siRNA as described in Materials and methods. 24 hours after transfection 50,000 cells were loaded on the transwell insert and further treated as described. After further 24 h the number of cells migrated through the transwell membrane were counted. Transfected cells were identified by EGFP-fluorescence and non-transfected cells by Hoechst 33342 nuclear stain using confocal microscopy. Images give representative areas showing migrated cells: (B) MDA-MB-231 cells; (C) 3LNLN cells and (D) EB3 cells. The percental evaluation (% migrated cells of total number of cells applied: 50,000) together with the standard deviations from four independent experiments of the different conditions is shown in the graphs below the confocal images. Note the different scaling of the ordinates showing percental migration. Note that transfection with a vector leading to expression of only EGFP led only a slight reduction of the migration of control cells. (E) Table compiling the percental migration activity (± standard deviations as given in the figures from four different experiments) of transfected, i.e., EGFP expressing cells.
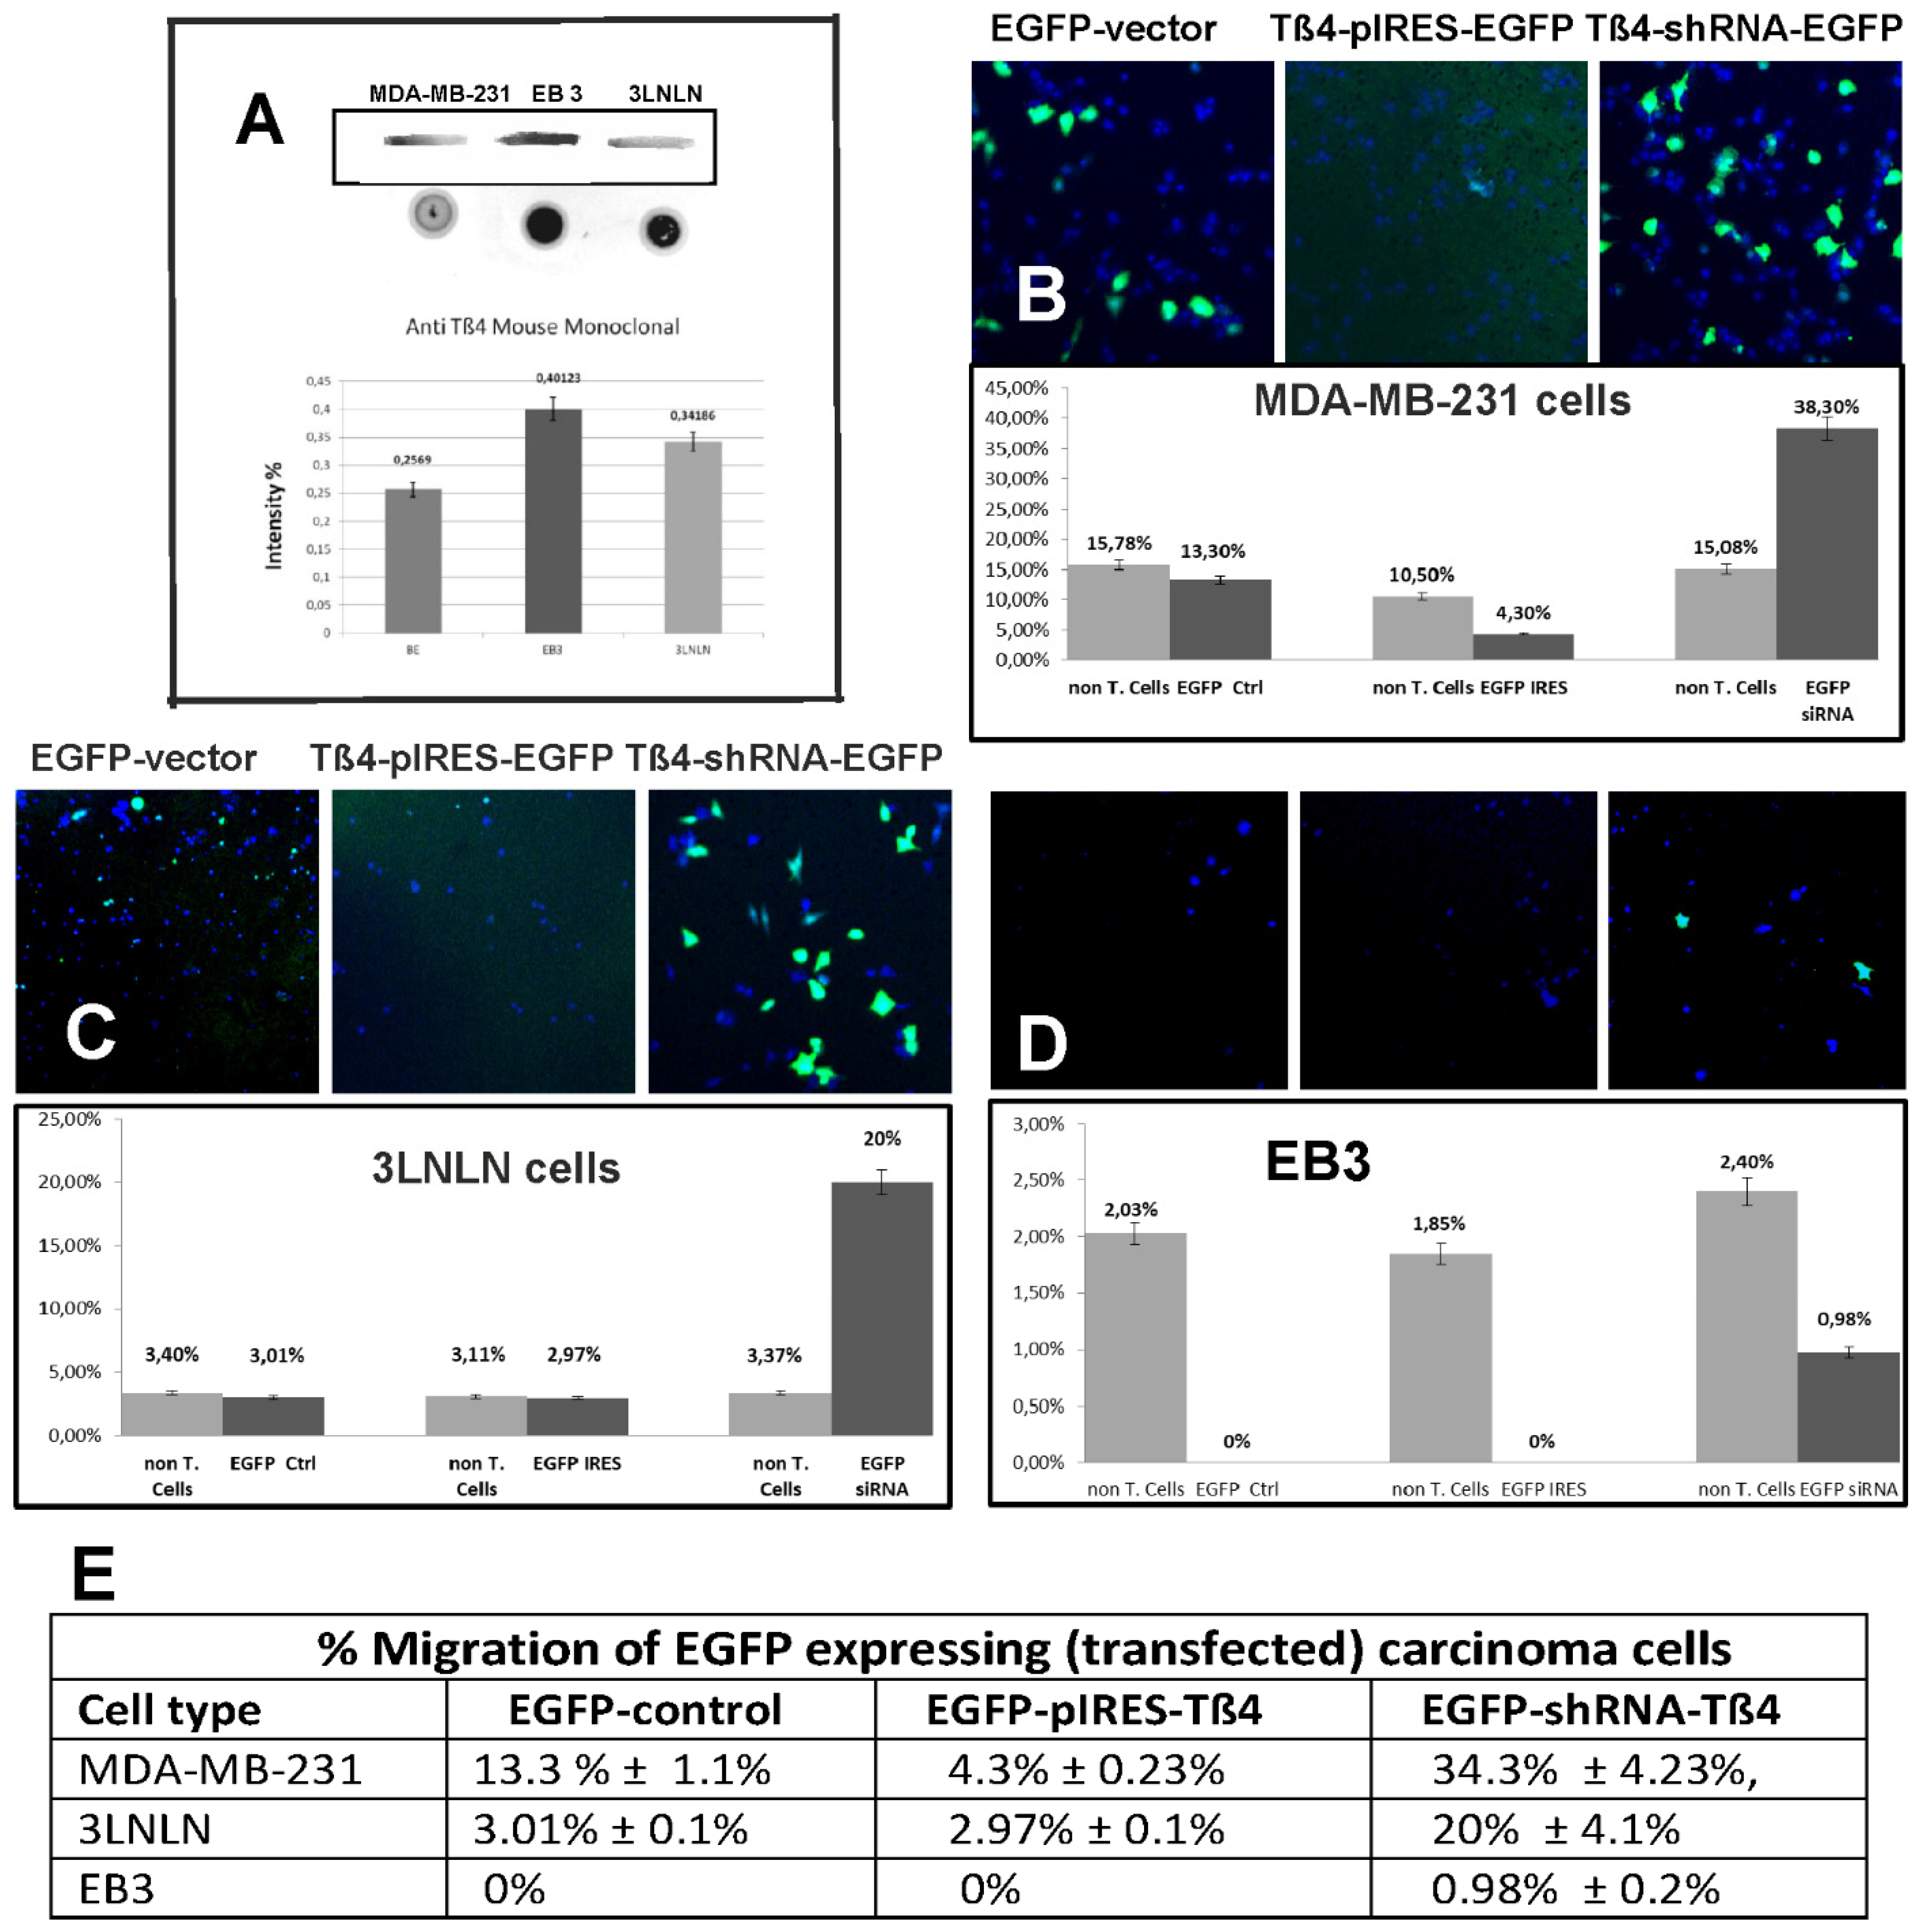
Figure 3.
Migration of the tumour cells after transfection with different Tß4-vectors out the agarose drops. (A) MBA-MB-231, (B) 3LNLN, and (C) EB3 cells after transfection with EGFP-control clone out of agarose drops. For further details see text. Red arrows point to the margin of the agarose drops and yellow arrows to the agarose free zone, into which the cells migrated. These cells were counted either as non-transfected or as transfected identified by their EGFP-fluorescence. (D to G) 50,000 3LNLN cells were included in agarose drops 24 h after transfection with the Tß4-vectors indicated (non-transfected, EGFP-vector, pIRES-EGFP-Tß4, and Tß4-shRNA-EGFP vector) and after further 72 h the cells migrating out the agarose were photographed using the confocal microscopy and counted. Yellow lines give the boundaries of the agarose drops. Yellow arrows point to non-transfected and red arrows to transfected cells. (H,I) Staining of transfected 3LNLN cells that migrated out the agarose with TRITC-phalloidin. (H) 3LNLN cells transfected with pIRES-Tß4 leading to additional expression of EGFP-Tß4 (EGFP-fluorescence). (H’) TRITC-phalloidin staining; note the partial disassembly of the F-actin cytoskeleton in the transfected (EGFP-positive) cells (arrow). (I) 3LNLN cells transfected with Tß4-shRNA-EGFP vector. (I’) TRITC-phalloidin staining; note the broader lamellipodial structure containing densely packed actin filaments (arrows). Merged images give also the nuclear staining with Hoechst 33342. Bars correspond to 20 µm.

Figure 4.
Effect of extracellularly added His-Tß4 or His-scTß4 (scrambled peptide, negative control) on the migration of 3LNLN cells out the agarose drops. (A) Gives the percentages of cells migrated in dependence on the extracellular concentration of His-Tß4 (green bars) and His-scTß4 (red bars). Note the clear biphasic response on His-Tß4, whereas His-scTß4 did not elicit any effect. (B) Gives the sequences of native Tß4 and the scrambled version of Tß4. (C-E) Immunostaining of 3LNLN cells having migrated out of agarose drops at 0.24 µM His-Tß4 with anti-Tß4 (green) and anti-His (red). (C) Note high Tß4 concentration within the cytoplasm and the tailing rear (arrow heads), but a less intense anti-Tß4 immunoreactivity within a lamellipodium. (C’and C’’) Similar anti-His staining, however, localisation clear nuclear presence as also visible in the merged image (arrow heads); arrows point to colocalisation of anti-Tß4 and -His-staining. (D) Anti-Tß4 and TRITC-phalloidin staining shows punctate accumulation of anti-Tß4 staining (arrows) that at least partially colocalize with TRITC-phalloidin staining, which also shows a prominent F-actin cytoskeleton concentrating around the cell periphery. Arrow heads point to presumed areas of cell contacts, which are also Tß4-positive. (E) Merged image of a single cell, which clearly shows peripheral Tß4-immunoreactivity colocalizing with TRITC-phalloidin staining (arrow head). (F) Immunostaining of 3LNLN cells exposed 2.4 µM His-Tß4 with anti-His (green) and TRITC-phalloidin after removal of the agarose drop. Note that most of the cells have become rounded and show an intense cytoplasmic anti-His staining. Within the rounded cells cytoplasmic and possibly nuclear anti-His and phalloidin positive dots (aggregates) are visible. Bars in (C-E) correspond to 20 µm and (F) to 50 µm.
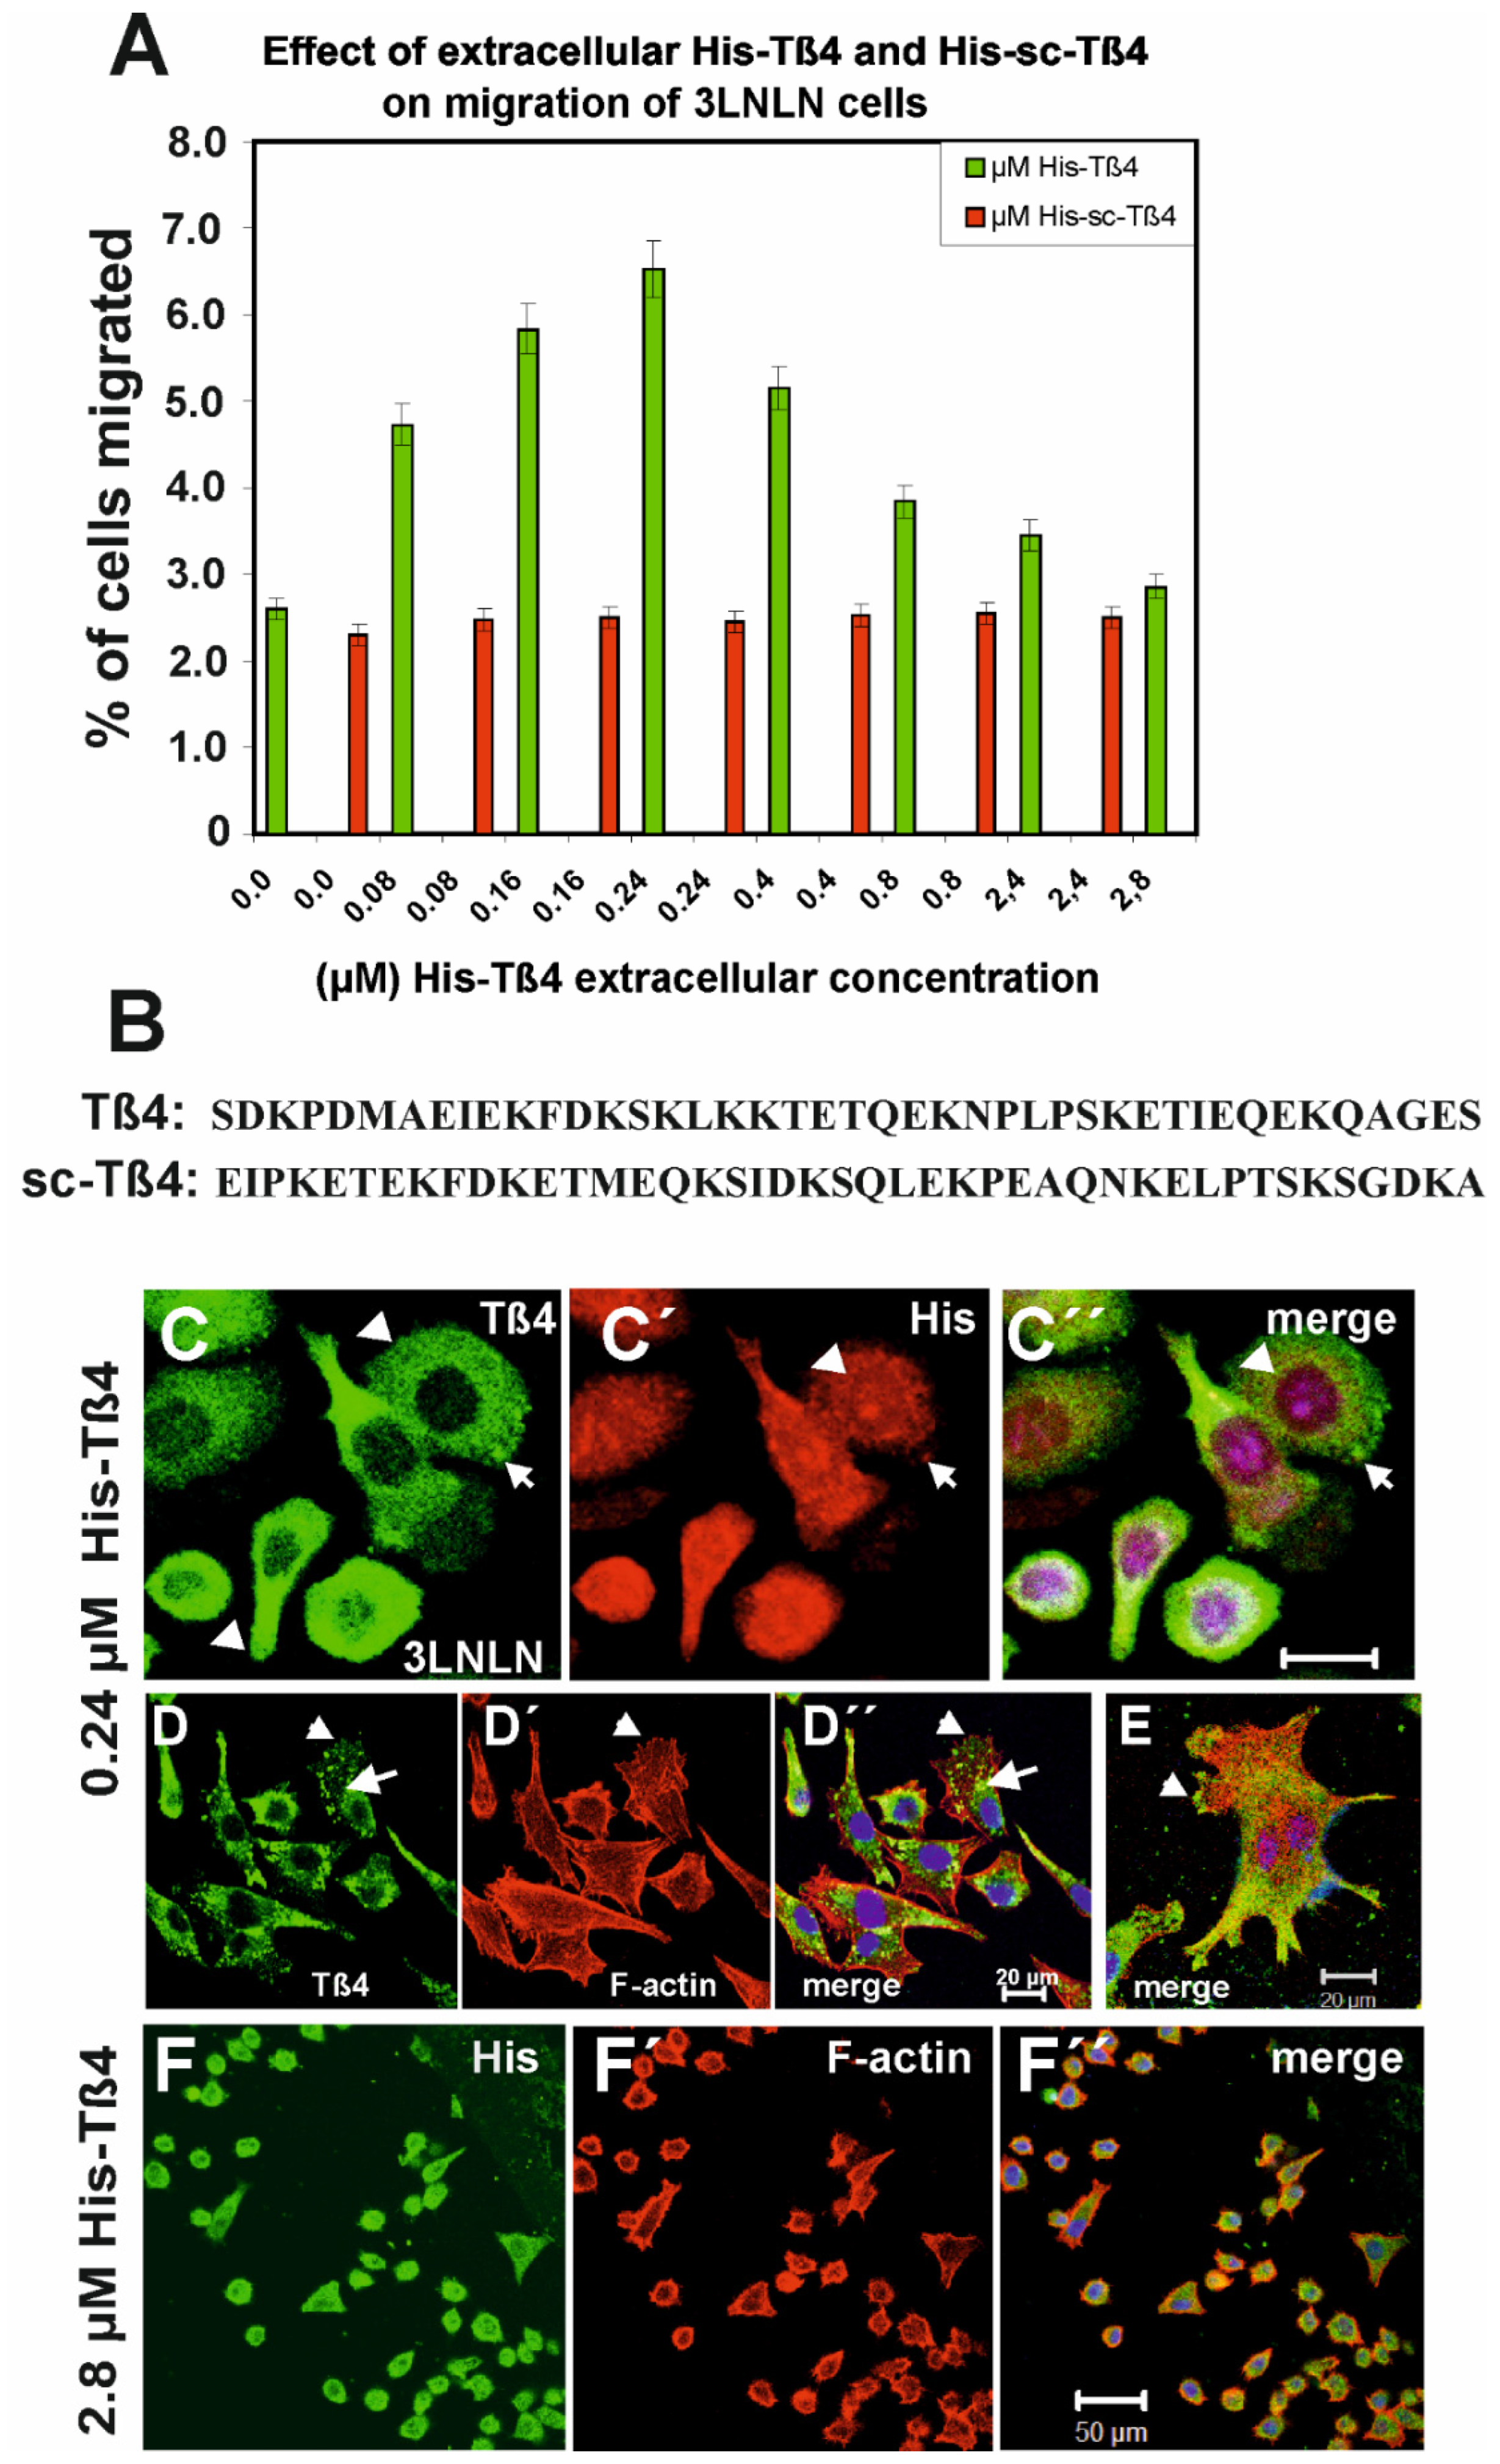
Figure 5.
Imunostaining of 3LNLN cells exposed to 2.8 µM His-Tß4. (A,B) Imunostaining of 3LNLN cells exposed to 2.8 µM His-Tß4 with anti-His (green) and TRITC-.phalloidin. (A) Note that all cells are rounded. (B) Single cell showing aggregated mainly cytoplasmic actin and an accumulation of the anti-His immunoreactivity within the nucleus. (C,C’) Phase contrast image of a single cells with many peripheral membrane blebs reminiscent of apoptosis as verified by anti-active caspase-3 staining (C’). (D) 3LNLN cells identically exposed to 2.8 µM His-sc-Tß4. Note the absence of cell rounding and an intact appearing actin cytoskeleton, but a prominent anti-His staining of the cell nuclei. (E) 3LNLN cells transfected with pIRES-Tß4-EGFP vector leading to overexpression of Tß4. Note that a number of EGFP-Tß4 expressing cells have rounded and formed plasma membrane blebs as also indicated by phase contrast (E’’). These cells are positively stained by anti-active caspase-3 (E’). (E’’’) Gives merged image additionally stained by Hoechst 33342. Bars correspond 10 µm (B), 20 µm (C,E), and 50 µm (A,D).
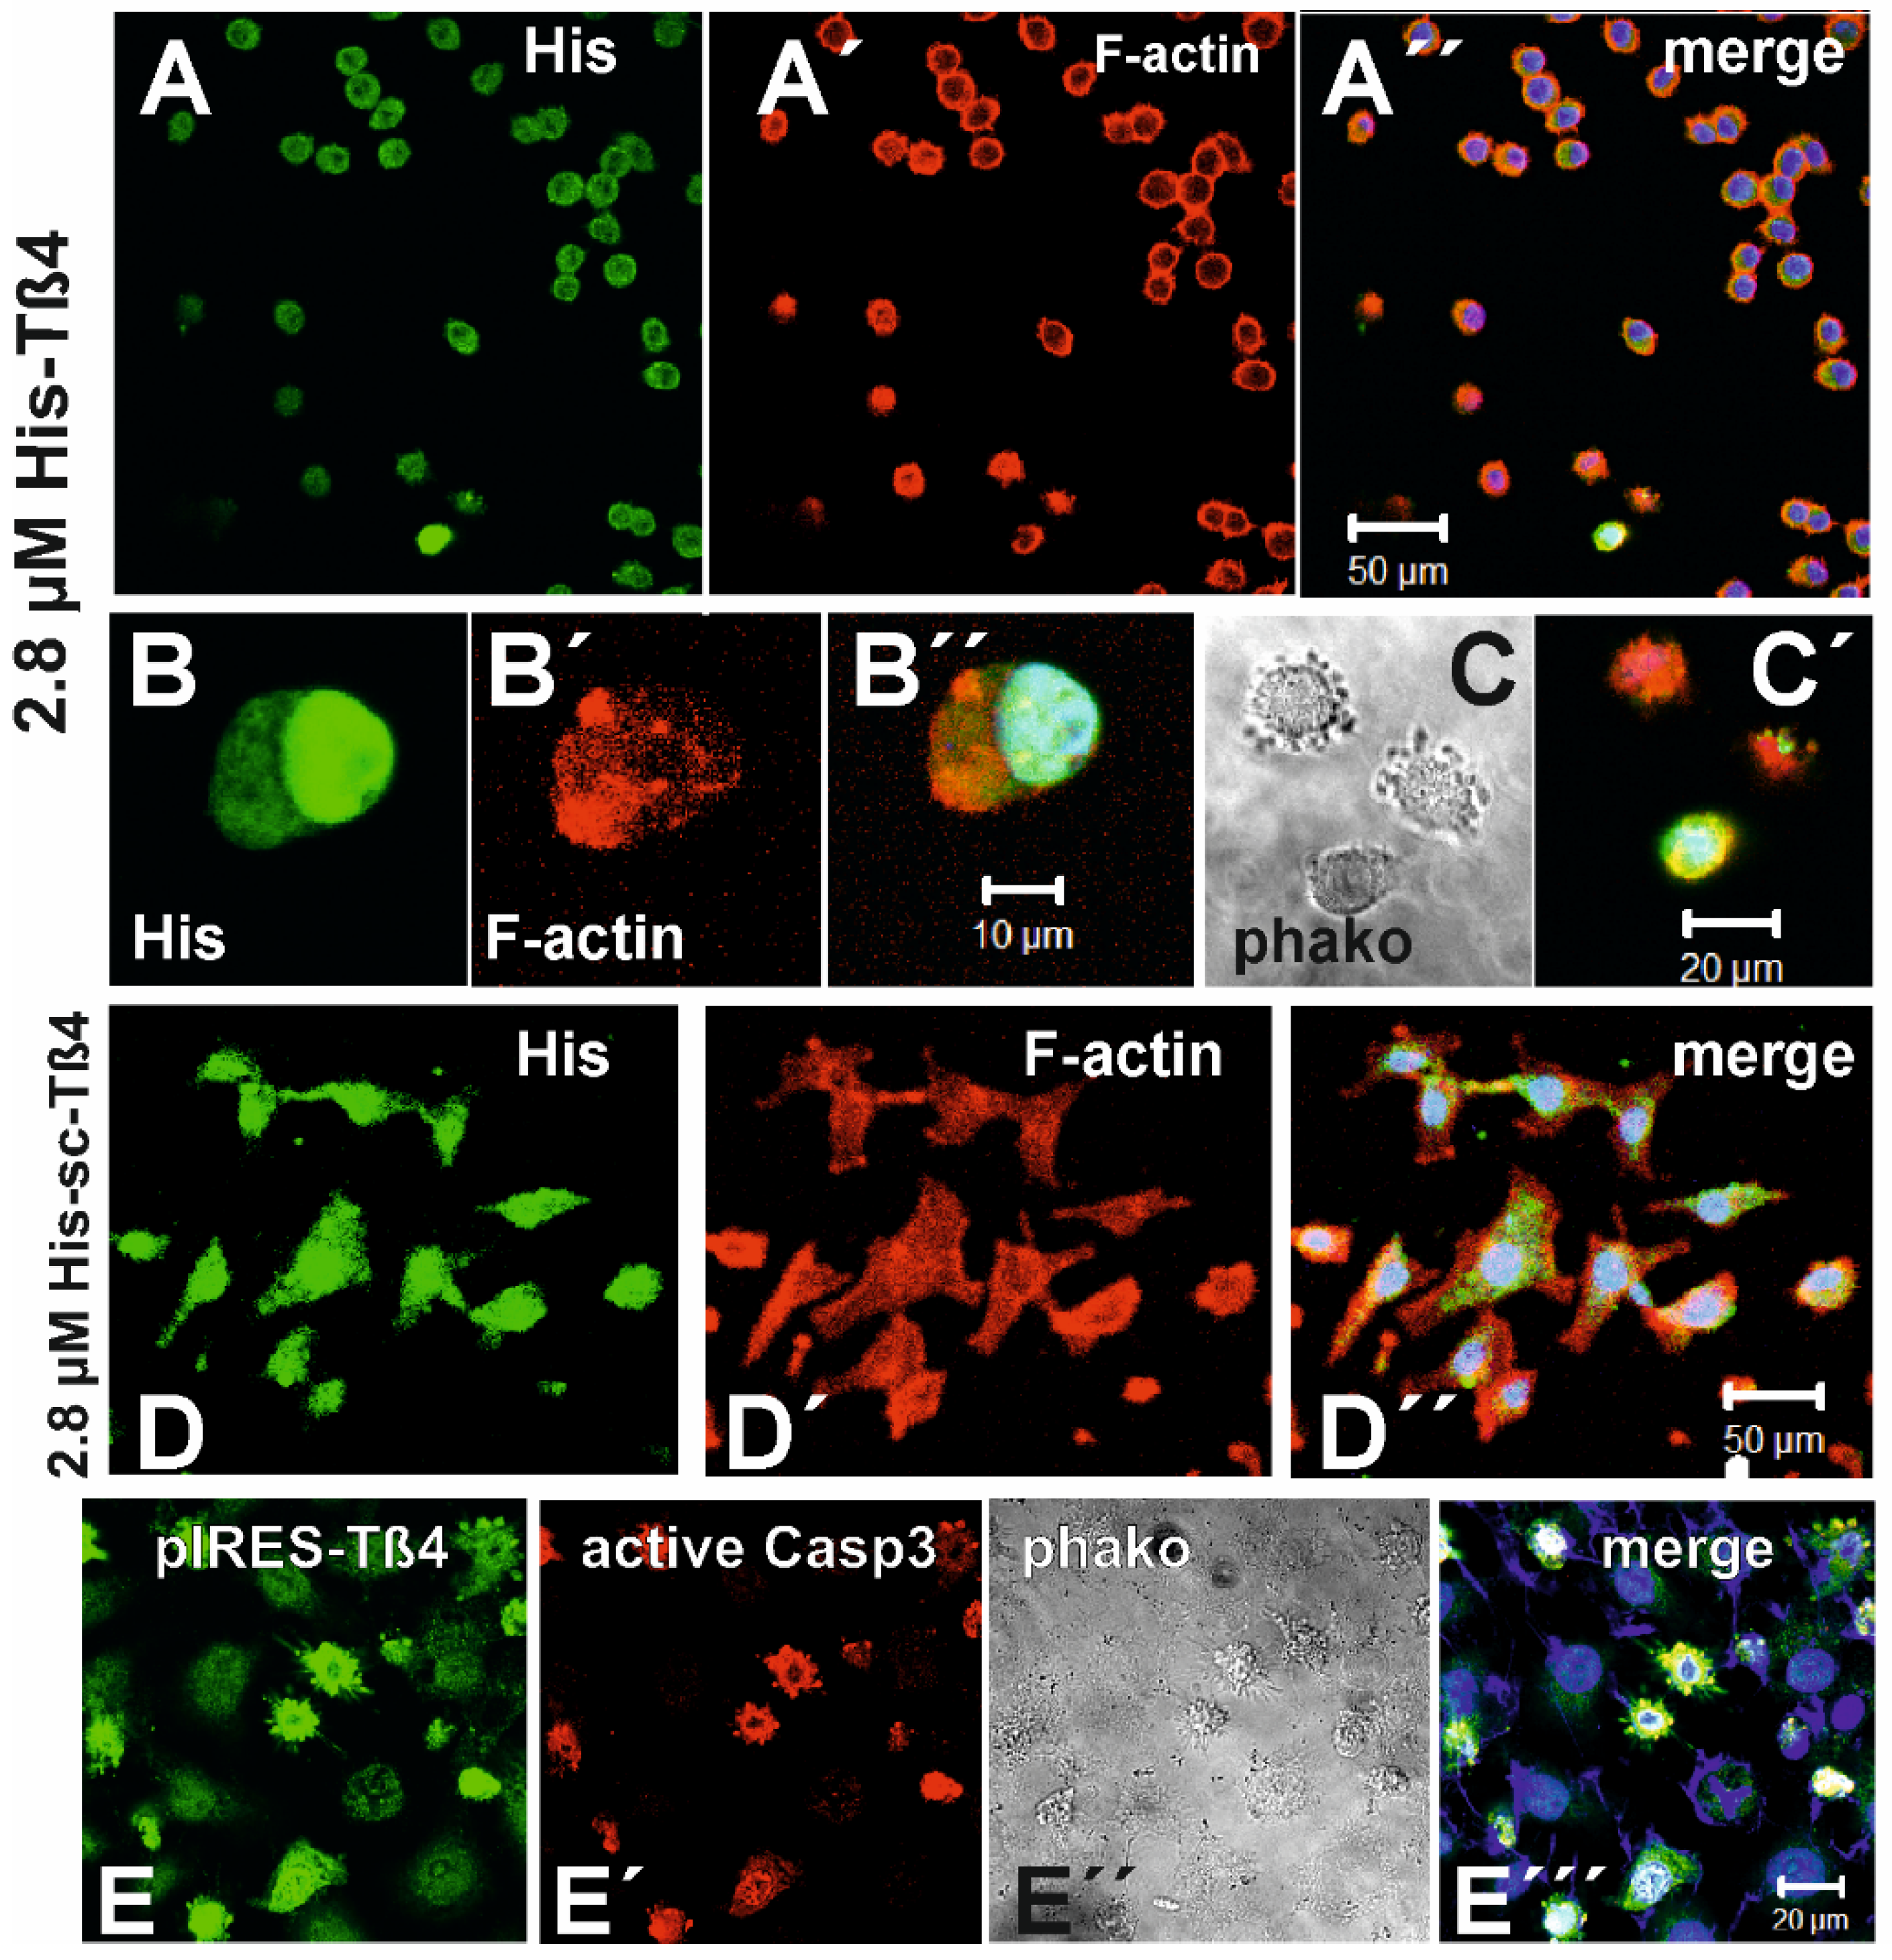
Figure 6.
Immunostaining of 3LNLN cells exposed to 0.24 µM Tß4 with anti-ILK. (A) Control 3LNLN cells immunostained with anti-ILK and anti-Tß4. Note very little peripheral staining of anti-ILK and -Tß4. (B) Western blot of resting 50 µg of 3LNLN, EB3, and MDA-MB-231 cell homogenates with anti-ILK antibody showing a single band at about 55kDa. (C-F) after exposure to 0.24 µM Tß4 for 24 h were immunostained with anti-ILK and together (A,C) with anti-Tß4, (D,E) by TRITC-phalloidin for F-actin, (F) anti-vinculin, and (G) anti-profilin. (B) Western blot of resting 3LNLN, EB3, and MDA-MB-231 cell homogenates with anti-ILK antibody showing a single band at about 55kDa. For further details see text. All bars correspond to 20 µM µm.
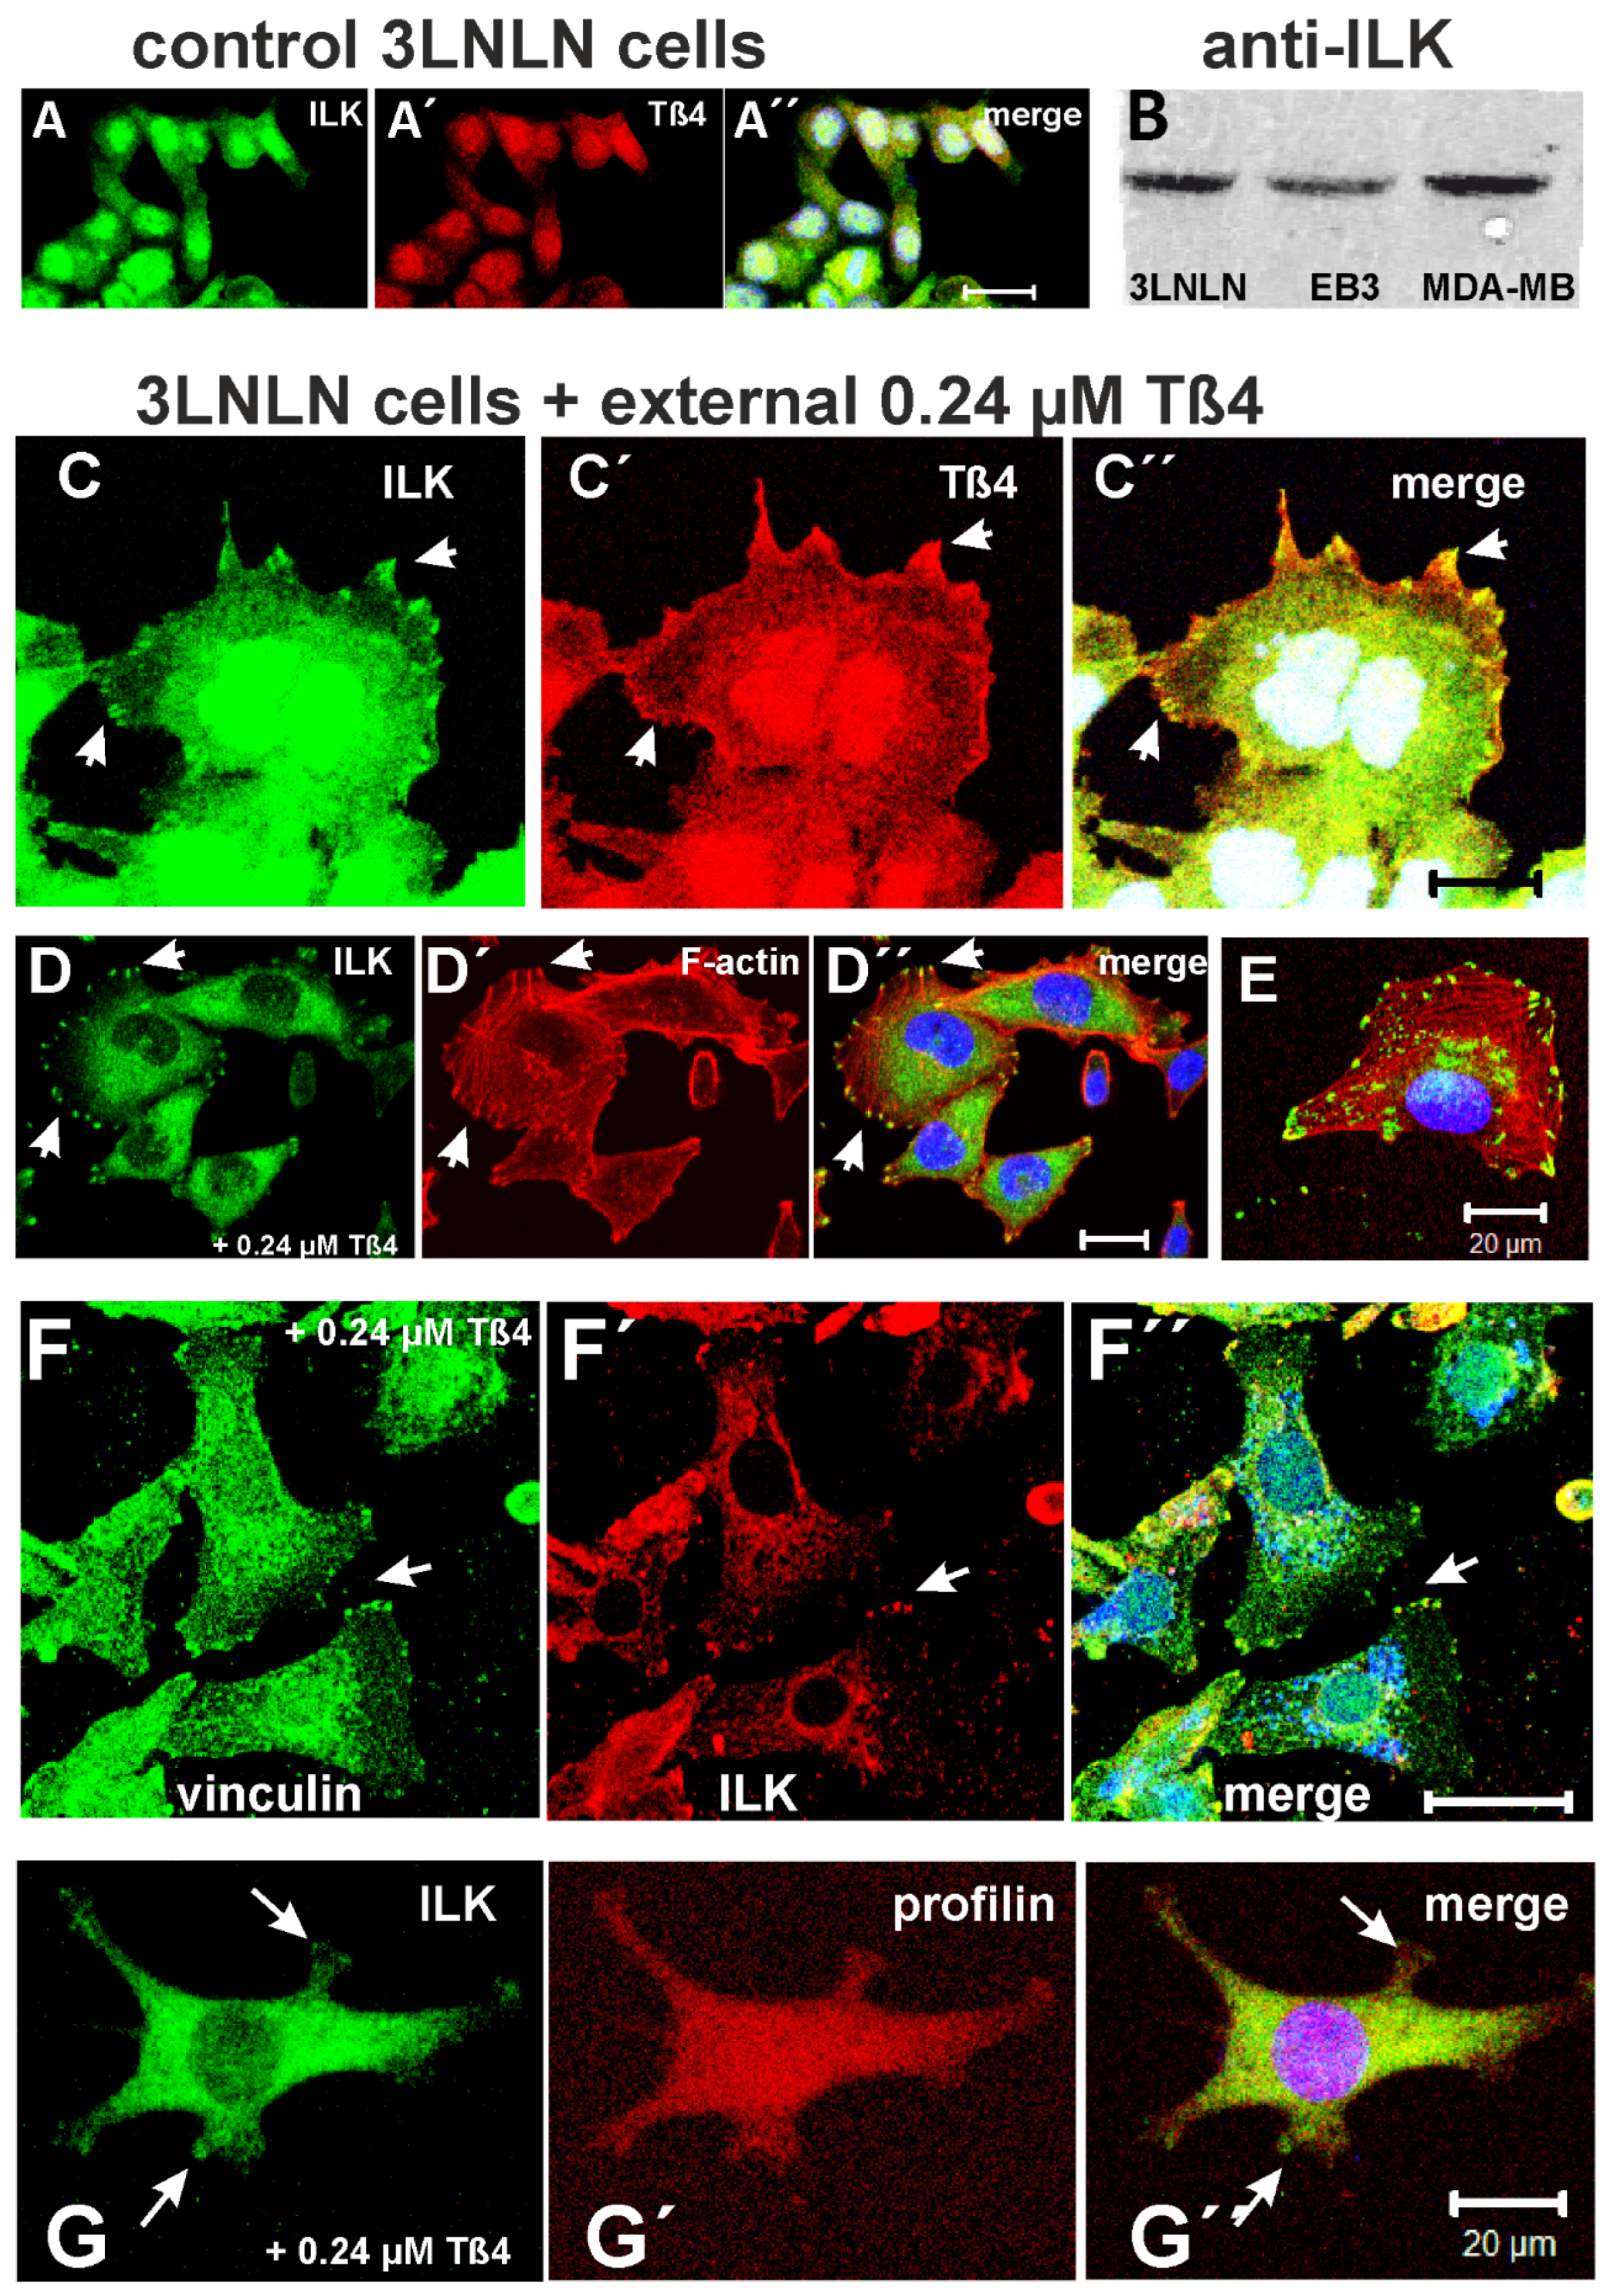
Figure 7.
Phosphorylation of AKT/PKB by exposure to 0.24 µM Tß4. (A) Dot blots of cell homogenates of 3LNLN cells before and after exposure for 24 h to 0.24 µM or 2.4 µM extracellular Tß4 using the anti-ILK antibody, or antibodies specific for P-Ser473-AKT1 or for P-Ser474-AKT2. (B) Immunostaining of control 3LNLN cells with anti-AKT antibody and Hoechst 33342 (see merged image). Note the presence of AKT proteins within the cytoplasm. (C) Double immunostaining of 3LNLN cells exposed to 0.24 µM Tß4 with anti-Tß4 and anti-P-Ser473-AKT1. Note their peripheral colocalisation (also indicated by arrows). (D) Staining of 3LNLN cells exposed to 0.24 µM Tß4 with anti-P-Ser474-AKT2 and with TRITC-phalloidin. Note peripheral colocalisation also indicated by an arrow. (E) Staining of 3LNLN cells exposed to 2.4 µM Tß4 with anti-P-Ser474-AKT2 and with TRITC-phalloidin. Note no clear peripheral AKT-staining, instead dotted AKT-staining within the cytoplasm and weaker peripheral F-actin staining. All bars correspond to 20 µm.
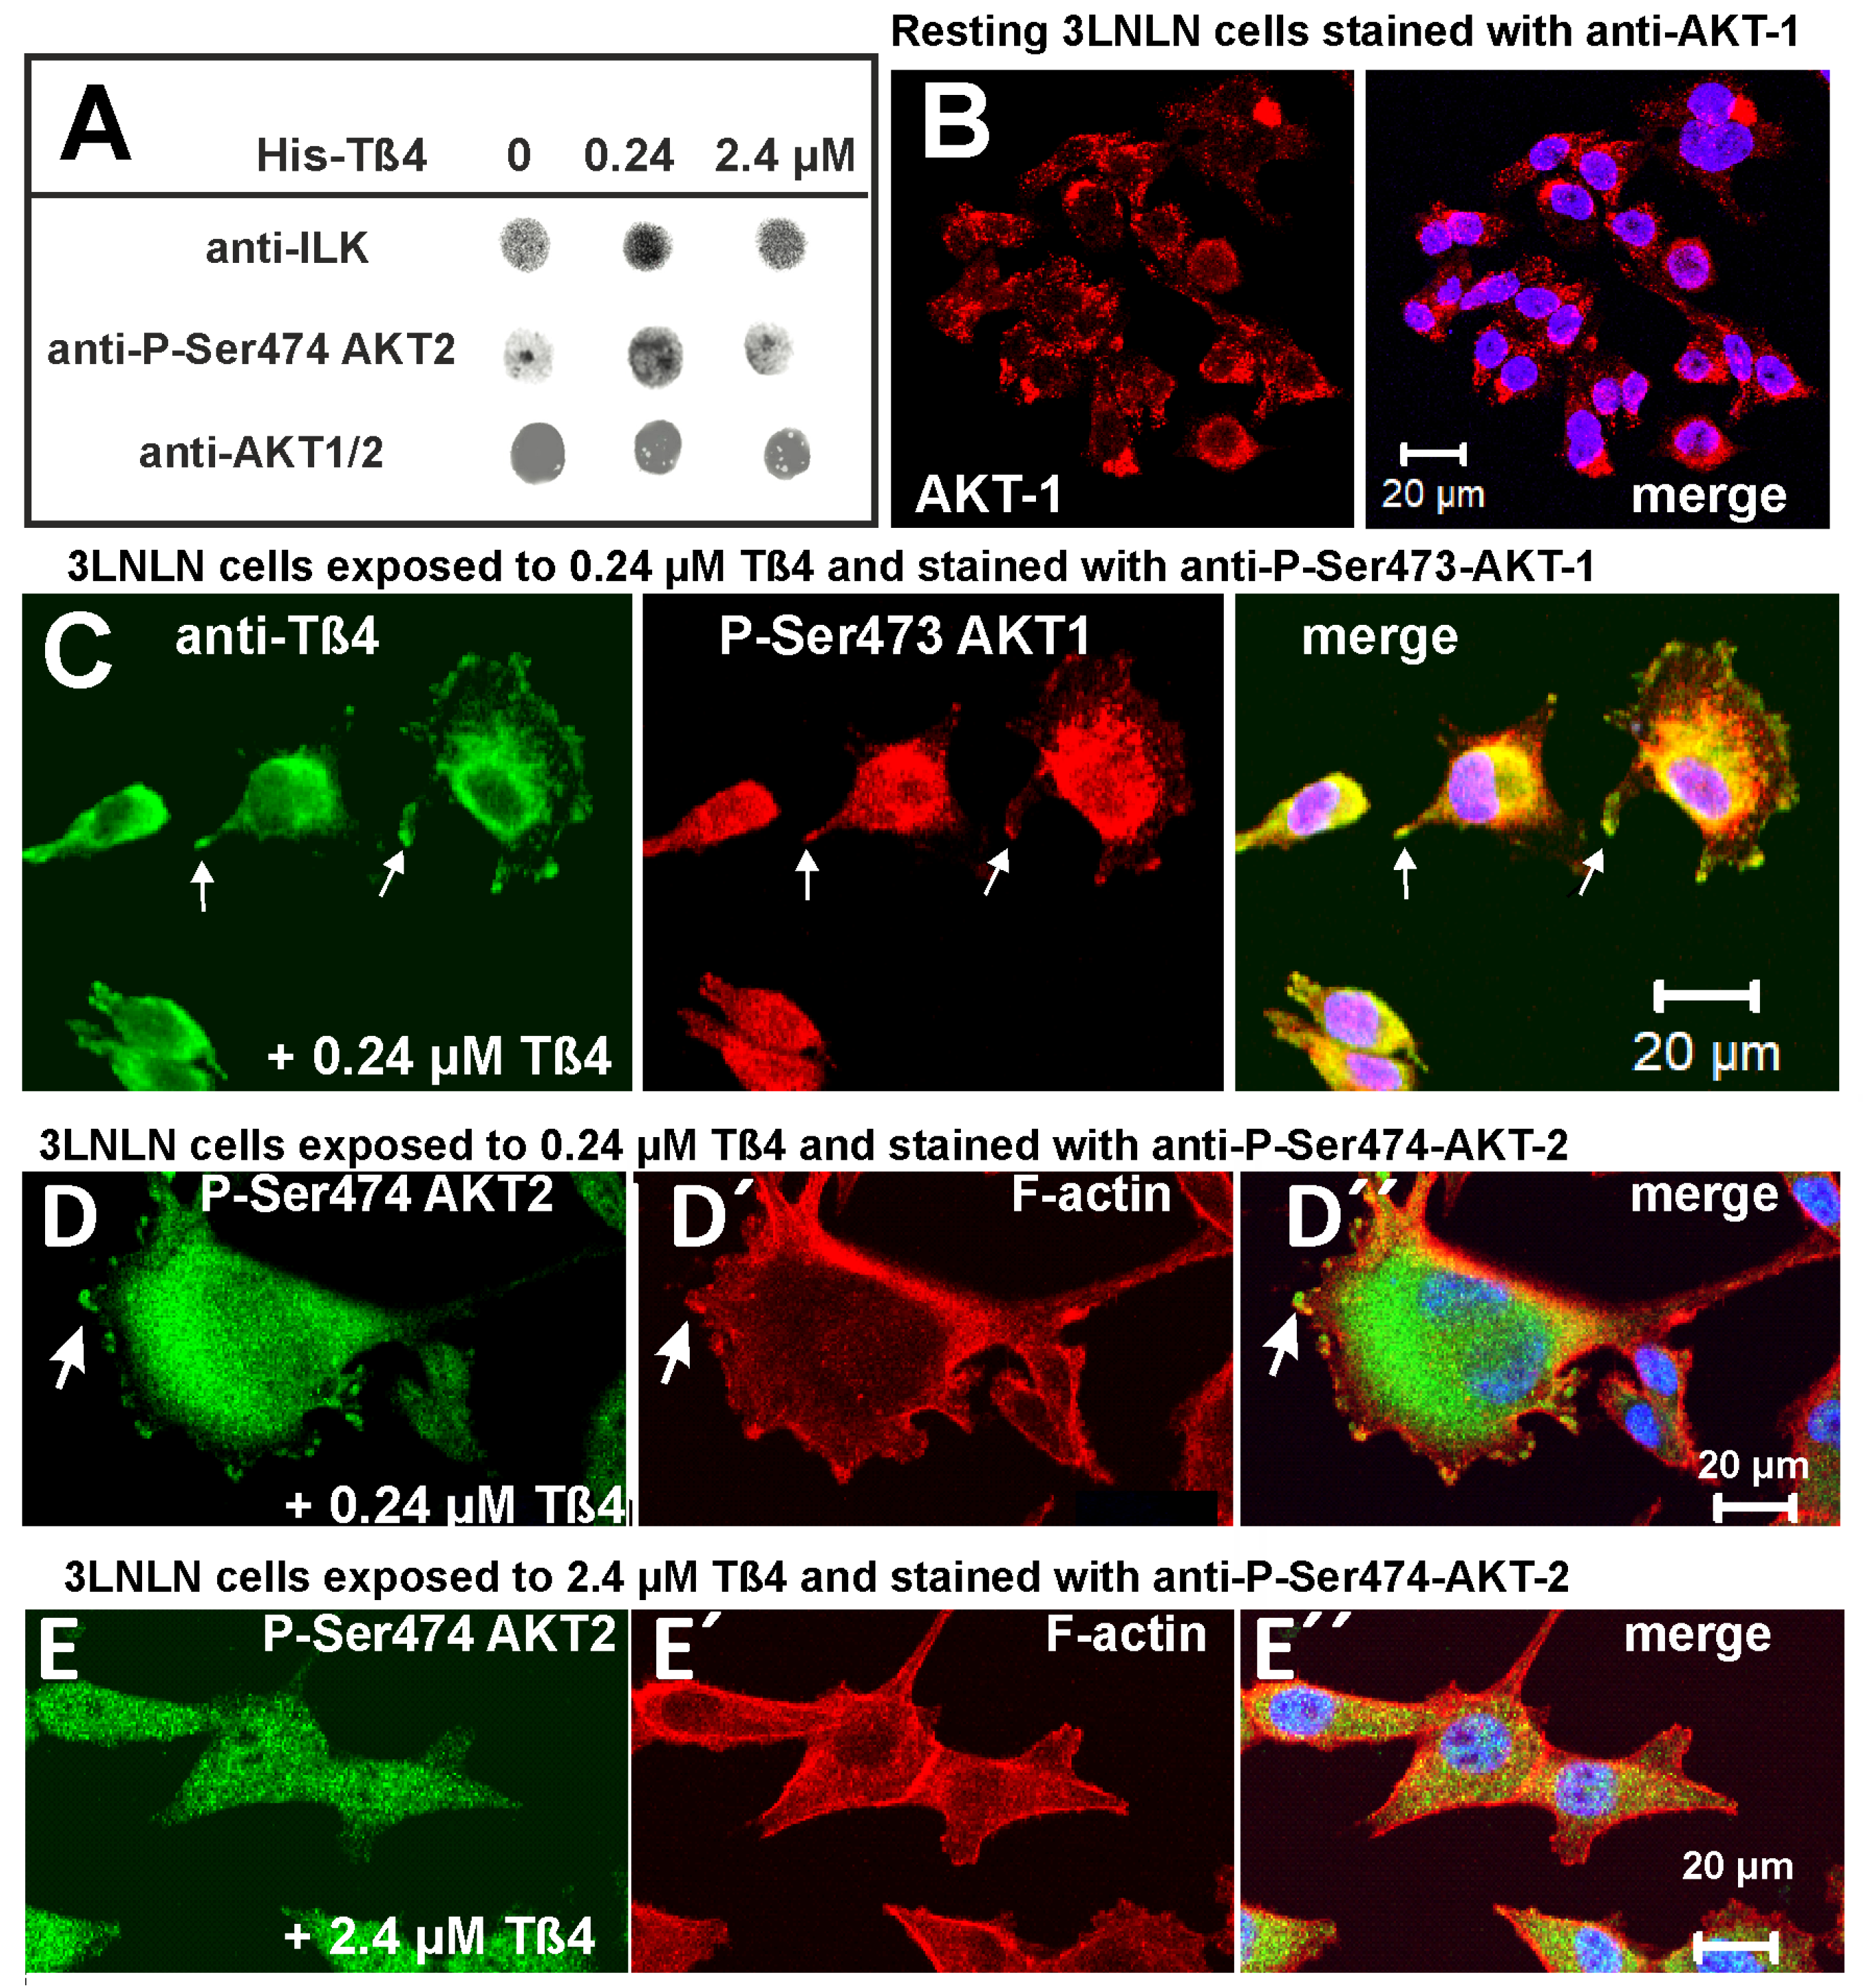
Figure 8.
Expression of TIMP2, MMP2 and MMP9 in the different tumour cell lines in the absence of extracellular Tß4. (A) Dot immunoblots of homogenates and cell medium (50 µg protein/dot) of the three cell lines immunostained with antibodies against MMP2 and TIMP2. (B) Table giving percental evaluation by densitometry (for details see text). (C,D) Double immunostaining of (C) MDA-MB-231 and (D) EB3 cells with anti-TIMP2 and -MMP2. Merged images together with Hoechst 33342 staining (for details see text). All bars correspond to 10 µm. (E to I) Expression of MMP2, MMP9 and TIMP2 by 3LNLN cells exposed to increasing Tß4 concentrations. (E) Table of densitometric evaluation of immunodot blots of 3LNLN cell homogenates and respective culture media stained with anti-MMP2 and -MMP9. The values obtained at zero (no exposure to) Tß4 were set as 100%. Note the intracellular increase in MMP2 and MMP9 expression by exposure to extracellular Tß4. (F to H) Immunostaining of 3LNLN cells with anti-TIMP2 and -MMP2 after exposure to zero Tß4 (F), to 0.24 µM Tß4 (G) and to 2.4 µM Tß4 (H). Merged images with Hoechst 33342 staining. (I) Immunostaining of 3LNLN cells exposed to 0.24 µM Tß4 with anti-Tß4 and -MMP9. Bars correspond to 10 µm.


Table 1.
Calculation of the intracellular beta-thymosin concentrations in the three cell lines as determined by HPLC (mean values from two measurements). For original HPLC data see Supplementary data (Figure S3).
Table 1.
Calculation of the intracellular beta-thymosin concentrations in the three cell lines as determined by HPLC (mean values from two measurements). For original HPLC data see Supplementary data (Figure S3).
| Cell type | MDA-MB-231 | 3LNLN | EB3 |
|---|---|---|---|
| Intracellular Tß4 | 0.306 µM | 0.33 µM | 0.466 µM |
| Intracellular Tß10 | 0.353 µM | 0.62 µM | 0.66 µM |
Table 2.
Changes of the relative concentrations of the proteins indicated in cell homogenates of 3LNLN cells before and after exposure to His-Tß4 as determined by dot immunoblotting (see also Figure 8A).
Table 2.
Changes of the relative concentrations of the proteins indicated in cell homogenates of 3LNLN cells before and after exposure to His-Tß4 as determined by dot immunoblotting (see also Figure 8A).
| Control | 0.24 µM His-Tß4 | 2.4 µM His-Tß4 | |
|---|---|---|---|
| anti-ILK | 100% | 141% | 107% |
| anti-P-Ser474-AKT2 | 100% | 208% | 121% |
| anti-AKT1,2 | 100% | 85% | 72% |
| anti-actin | 100% | 97% | 99% |
| anti-tubulin | 100% | 98% | 98% |
Disclaimer/Publisher’s Note: The statements, opinions and data contained in all publications are solely those of the individual author(s) and contributor(s) and not of MDPI and/or the editor(s). MDPI and/or the editor(s) disclaim responsibility for any injury to people or property resulting from any ideas, methods, instructions or products referred to in the content. |
© 2024 by the authors. Licensee MDPI, Basel, Switzerland. This article is an open access article distributed under the terms and conditions of the Creative Commons Attribution (CC BY) license (https://creativecommons.org/licenses/by/4.0/).
Copyright: This open access article is published under a Creative Commons CC BY 4.0 license, which permit the free download, distribution, and reuse, provided that the author and preprint are cited in any reuse.


