
Submitted:
30 December 2024
Posted:
31 December 2024
You are already at the latest version
Abstract
Analyzing the spatial and temporal trends in cropping patterns and intensity on a larger scale is essential for implementing timely policy decisions and strategies in response to climate change and variability. By converting cropping intensity estimates, we can compute net and gross production values, indirectly indicating food security status in the study region. This study compared the utility of optical (MOD13Q1) and SAR (Sentinel 1A) datasets for determining cropping patterns and associated intensity estimates across multiple agricultural seasons from 2019 to 2023, with spatial resolutions of 250m and 20m, respectively. The analysis revealed that the highest and lowest gross cropped areas using Sentinel 1A data were 55.85 lakh hectares (2022-23) and 52.88 lakh hectares (2019-20), respectively. For MODIS data, the highest and lowest gross cropped areas were 62.07 lakh hectares (2022-23) and 56.87 lakh hectares (2019-20). Similarly, the highest and lowest net sown areas using Sentinel 1A data were 43.71 lakh hectares (2022-23) and 41.76 lakh hectares (2019-20), and for MODIS data, the values were 48.81 lakh hectares (2022-23) and 46.39 lakh hectares (2019-20), respectively. Regardless of the datasets used, the highest gross and net cropped areas were reported in Tiruvannamalai district and the lowest in Kanchipuram district. Thiruvarur district reported the highest cropping intensity, while Sivagangai district had the lowest. Among all seasons, the rabi season accounted for the maximum area, followed by the kharif and summer seasons. The study concluded that single cropping (51%) was the dominant cropping pattern in Tamil Nadu, followed by double cropping (31%) and triple cropping (17%) in both datasets. Sentinel 1A data showed better performance in estimating gross and net cropped areas than optical data, with deviations ranging from 7.02% to 11.01%, regardless of the year and cropping estimates derived. The results indicated that the spatial resolution of the datasets was not a significant factor in determining cropping patterns and intensity on a larger scale. However, this may differ for smaller study areas.
Keywords:
cropping pattern
; cropping intensity
; MODIS
; Sentinel 1A
1. Introduction
Crop area diversification essentially advocates moving away from growing a single crop (food/non-food grains) to several crops in different combinations on the same land. It has been recognized as an effective strategy for achieving the objectives of food and nutritional security, income growth, judicious use of land and water resources, increase in external input use efficiency and thus, sustainable agricultural development and environmental improvement. Rice-based cropping systems are integral to agriculture in Tamil Nadu, Southern India. Several intensive rice-based cropping systems have been identified and are practised by farmers. This unprecedented expansion is happening only at the cost of a significant decline in crop areas from other diversified, low input intensive/and soil-enriching crops like kharif pulses, maize, cotton, millets etc. to gain by rice while grams, rape seed and mustard, vegetables etc. by wheat during rabi season [1].
While intensive agriculture, involving exhaustive high-yielding varieties of rice and other crops, has led to heavy withdrawal of nutrients from the soil, imbalanced and discriminatory use of chemical fertilizers has deteriorated soil health [2]. Suitable rice-based cropping must be evaluated to assess the stability of production. The inclusion of pulse vegetables in the cropping system is more beneficial than cereals after cereals [3]. Rice-Rice-Pulses and Rice-Rice-Sesame are the dominant cropping systems in the Thanjavur district. Continuous cropping results in a rapid decline in soil fertility and thus requires special attention. Therefore, the existing rice-based cropping system has to be diversified by including vegetables, pulses, maize, and oilseed crops in kharif and summer seasons to meet the water and labour scarcity problems and sustain soil health.
Usually, rice is transplanted into puddled soil, and farmers try to maintain ponded water on the surface throughout the crop growth periods. Besides being one of the highest guzzlers of irrigation water, this practice of (lowland) rice production degenerates the soil's physical structure, which may have negative implications for the ensuing aerobic crops [4,5]. Under such circumstances, crop area diversification can overcome these shortfalls associated with the mono-cropped rice production system. The sustainability of cropping systems in an area is governed by agro-physical input parameters (like local climate, physiography, soil, water quantity and quality, existing cropping patterns, prevalent management practices, etc.). Therefore, to suggest/devise a sustainable diversification plan alternative to the existing one, all these factors of production/input parameters must be integrated in a holistic approach. The use of multi-temporal and multi-spectral satellite remote sensing data along with Geographic Information System (GIS) is indeed an exceptional tool to study the existing cropping system as well as in generating alternate diversified cropping system by integrating all these agro-physical information with due consideration to the regional/ local effects in the spatial domain [6].
Further, considering the implications of both optical and microwave satellite datasets, the present study compared the efficiency of the datasets to delineate the existing cropping patterns of the state and analysed them using time series data. Based on the above knowledge, this investigation was conducted to update the spatial database on cropping patterns using Remote Sensing and GIS techniques. The objectives were to map the cropping patterns (single, double, and multiple cropping) and assess the cropping intensity in Tamil Nadu. Additionally, the study aimed to compare the potential of optical and SAR datasets with varying spatial resolutions in evaluating cropping patterns.
2. Study Area
The study area focuses on the entire Tamil Nadu region, which stretches between 8.5° N and 13.35° N latitude and 78.35° E and 80.20° E Longitude and with an area of 130,058 km2, situated in the South Eastern part of India (Figure 1). Tamil Nadu is India's 11th largest state, with about 38 districts and seven agro-climatic zones viz., Cauvery Delta Zone (985 mm), High Altitude and Hilly Zone (2124 mm), High Rainfall Zone (1420 mm), North Eastern Zone (1105 mm), North Western Zone (875 mm), Southern Zone (857 mm) and Western Zone (715 mm). It is bordered on the north by Andhra Pradesh and Karnataka, on the west by Kerala, on the east by the Bay of Bengal and the south by the Indian Ocean. The state has an average annual rainfall of 998 mm. The Southwest monsoon (June to September) and Northeast monsoon (October to December) are the predominant monsoon seasons of the state. Tamil Nadu experiences more rainfall exclusively during the northeast monsoon, whereas other Indian states get higher rain during the southwest monsoon. Forty-seven per cent of the total annual precipitation comes from the northeast monsoon, whereas the southwest monsoon accounts for 35 per cent.
2.1. Cropping Seasons
Tamil Nadu has a diverse agricultural landscape with multiple crop seasons due to its varying climatic conditions. Rainfed agriculture occupies more than 57 per cent of the state's cultivated area. The state experiences the southwest and northeast monsoon, influencing the cropping patterns. Farmers can obtain 2-3 harvests per year due to favourable weather conditions and good groundwater availability for irrigation. Fields smaller than one hectare dominate small-scale agriculture on a large portion of the arable land. According to the Tamil Nadu government, rice, maize, millets (pearl millet, sorghum and minor millets), pulses (black gram, green gram, horse gram, cowpea and red gram) and oil seeds (sesame, groundnut and sunflower), cotton sugarcane, tobacco, vegetable crops and plantation crops are the most significant crops for agricultural output. There are three distinct agricultural seasons: Kharif, Rabi and Summer (Zaid). The Indian southwest monsoon is related to the Kharif season, which runs from June to October. Crops, such as paddy, are grown, and the harvesting season, known as rabi, runs from November through February and is synchronized with the winter rainfall [7]. Rainfed agricultural production is possible during the Rabi season in most of Tamil Nadu due to the abundant rain of winter monsoon. March through May, during the third season, Zaid is the driest cropping month in agricultural production [8]. Furthermore, some crops are grown for extended durations. Usually, sugarcane is planted from November to February and harvested a year later. Generally, irrigation is used during the entire growing season.
3. Materials and Methods
This study utilized NDVI (Normalized Difference Vegetation Index) of the optical data and backscattered coefficient (σ°) in decibels (dB) from Synthetic Aperture Radar (SAR) to assess the cropping pattern (Table 1). Sentinel 1A and MODIS (MOD13Q1) were downloaded from the Copernicus and Earth data repository. Sentinel 1A consists of four standard operational models, of which data obtained from the Interferometric Wide (IW) mode was utilized for the study. The level 1 ground range detected (GRD) products were acquired season-wise at 20 m resolution with VH polarisation from June 2019 to May 2023.
Further, the terra MODIS vegetation indices (MOD13Q1) Version 6.1 generated (Level 3) every 16 days at 250 m spatial resolution was downloaded for the two tiles h25v07 and h25v08 representing the entire study area. The MODIS data was utilized, considering the unavailability of the cloud-free images from the Sentinel 2A data during monsoon season. The downloaded Sentinel 1A and MODIS datasets were subjected to the preprocessing steps depicted in Figure 2. The preprocessed datasets were then utilized for generating the monthly composite images of three seasons (i.e.) Kharif (June to September), Rabi (October to February), and Summer (March to May). The specific level 3 MODIS product of NDVI was downloaded for its utility in effective discrimination of the vegetation structures. The NDVI value ranges from -1 to +1. The positive value indicates thick, dense vegetation, and the negative value indicates water bodies or built-up [9].
Assessing cropping patterns using remote sensing data involves analyzing satellite imagery to identify and classify different types of crops and their spatial distribution over a specific area and period. The methodology adopted to derive the cropping pattern using both the SAR and optical datasets and analyzing cropping intensity over the Tamil Nadu region is discussed in the following subsections.
3.1. Assessing Cropping Pattern Using Time-Series SAR Data
During the study period, SAR data was acquired in season-wise composites. After pre-processing, the dB value was converted from the unitless backscatter coefficient (σ°). A threshold-level-based classification method was followed to estimate the cropped area. The threshold for the discrimination was determined based on expert knowledge and previous research works [5,10,11,12,13,14]. The primary focus was distinguishing between cropped and non-cropped areas/ vegetation during the agricultural seasons. While some pixels may not have been interpreted accurately, an agricultural mask was used to extract the cropped area from seasonal images to ensure precise results. This approach allowed us to focus solely on the pixels representing cropped areas, excluding forest and other land use classes. In this classification, a condition was given whereby a dB value above -13.3 was considered the cropped area, while a dB value below -13.3 was considered the non-cropped area. This given condition was applied to the season-wise composites to segregate them into final classified images of kharif, rabi and summer seasons.
The area was estimated using the raster calculator tool in ArcGIS 10.1 to determine the cropped area for a particular season accurately. Create a condition where pixels within the cropped area were assigned a value of 1, and the fallow land was set at 0. Each respective seasonal image contained a cropped area, non-cropped area or fallow land with the values of 1 and 0, respectively. The gross cropped area was calculated by counting the pixels in the seasonal data for each respective year. Combining all the seasonal cropped areas and excluding the area covered by fallow land resulted in the gross sown area. To determine the net cropped area, sum the kharif, rabi and summer season images by assigning the values 0, 1, 2 and 3 to denote fallow land, single-cropped area, double-cropped area and triple-cropped area, respectively (Figure 3).
3.2. Assessing Cropping Pattern Using Time-Series MODIS Data
The suggested approach for mapping the cropping pattern of Tamil Nadu consists of three primary components, including the extraction of vegetation phenological parameters from time-series MODIS data using TIMESAT software, extraction of cropping seasons to estimate cropped area using phenological parameters, and generation of temporal-spatial cropping pattern maps employing spatial data.
TIMESAT 3.3 software was utilized to analyze time series data. Its primary function is to generate crop seasons based on the dynamic nature of vegetation growth and development. Temporal analysis of vegetation is essential because it reveals both short-term fluctuations and long-term trends. TIMESAT is primarily used to analyze noisy earth observation datasets and generate information about seasonality. This software is capable of handling various temporal datasets. Long-term vegetation analysis of data can reveal information about changes in climatic zones and land use. This software can provide information about 13 parameters (Table 2), as Eklundh and Jönsson [15] outlined. The software can be downloaded as a zip file from the TIMESAT website (https://www.nateko.lu.se/TIMESAT/timesat.asp).
3.2.1. Extraction of Phenological Parameters
NDVI temporal data produced from MODIS imagery is used by TIMESAT software to derive the phenology dynamics of the region. The software is designed to work in a way that ensures that the total number of images is evenly divided by an integer, that each image has the same number of rows and columns and that each image has the exact temporal resolution. The seasonality parameters cannot be written in an image under any other circumstance. Ideally, TIMESAT should be run after the images have been examined. TIMESAT accepts either a text file or an American Standard Code for Information Interchange (ASCII) file containing a list of images and their respective paths. The file names and paths were added chronologically for the study period. An extra seasonal NDVI data of summer 2009 was included as TIMESAT gives seasonality statistics for n-1 seasons.
Additionally, the software cannot read standard spatial data formats like ".tif" and ".img." Therefore, conversion of the 'ENVI DAT' (.dat) format is required for all images. A text file containing a list of all the NDVI images in the ".dat" format and their paths was created. To ensure seamless integration with the software, we compiled a text file that identifies all NDVI images in the ".dat" format, their corresponding paths, and the total number of images at the beginning of the list. Many time series data contain spikes and outliers, so it's crucial to concentrate on pre-processing because any leftover spikes and outliers could substantially impair the final function fits [15]. The seasonal-trend decomposition method based on Loess (STL-decomposition) can separate time-series data into season, trend and remaining components [16].
3.2.2. Extract Cropping Seasons to Estimate the Cropped Area
TIMESAT includes three curve fitting algorithms: Adaptive Savitzky-Golay, Asymmetric Gaussian, and Double Logistic functions. These algorithms use least-square fitting to approximate the upper envelope of the input temporal data. Global functions, which represent the indices over the entire seasonal cycle, are created by merging Local functions. The software interface allows the fitting of time series data from Vegetation Indices into non-linear mathematical functions. In this study, phenological characteristics were derived using the Savitzky-Golay curve fitting method, while the Asymmetric Gaussian model was applied to fit a time series of NDVI images.
Initially, the input parameters were calibrated, and their time series curves were displayed on TIMESAT. The curve fitting parameters were adjusted until satisfactory and then saved to a settings file. These parameters were subsequently used to generate seasonality files for all pixels during the study period. The parameters used in the TIMESAT program to obtain the phenological metrics are presented in Table 3.
The start of the season in the study area may vary across different regions, posing a challenge for season identification. To address this, instead of focusing on the start and end of the season, the images of the middle of the season for the study period were extracted. These files include data for no-season, single-season, and double-season cropping periods. Header files in .hdr format were created to view the seasonality files in GIS software and to export them in .tif format.
3.2.3. Generating Temporal-Spatial Cropping Patterns Maps
The primary focus was delineating cropped areas from non-cropped/forest areas during the kharif, rabi, and summer seasons. An agricultural mask was applied to the seasonal images to extract the cropped areas, eliminating forest and vegetation pixels to ensure accuracy. After extracting the cropped areas, the raster calculator tool in ArcGIS 10.1 software was used to estimate the actual cropped area for each season and convert the projection system of the seasonal files from WGS 1984 to UTM 43N using the project raster tool. Each seasonal file identifies cropped and fallow land with values of 1 and 0, respectively. The gross cropped area was calculated by counting the pixels for the kharif, rabi, and summer seasons (Figure 4). Combining the kharif, rabi, and summer season images determined the net cropped area. The values 0, 1, 2, and 3 denote fallow land, single-cropped area, double-cropped area, and triple-cropped area, respectively.
3.3. Assessing and Mapping of Cropping Intensity
Cropping intensity (CI) refers to the number of crops grown on a particular piece of land within a given time frame, typically a year. It measures how intensively agricultural land is used regarding crop rotations, multiple cropping and the frequency of crop cycles. CI can provide insights into the level of agricultural productivity and land use efficiency, which helps to detect changes in crop types and rotations between different periods. This study aims to estimate and generate spatiotemporal maps of the cropping intensity in Tamil Nadu. CI is defined as the number of crop-growth cycles in a year [17]. It is also defined as the gross and net cropped areas ratio and expressed as a percentage. The calculation of cropping intensity utilized the following formula.
Maps were created to visualize cropping intensity (CI) patterns and changes over time. Categorizing CI values into six distinct categories helps better understand the region's agricultural activity and unique characteristics. The CI classes are as follows: 85–100%, 101–115%, 116–130%, 131–145%, 146–160%, and above 160%.
4. Results
4.1. Assessing and Mapping of Cropping Pattern and Cropping Intensity
The gross cropped area, net cropped area, and cropping intensity were calculated for all districts in Tamil Nadu except for Chennai district, which has more urban areas and is therefore not considered agricultural land. The district and season-wise cropping pattern and intensity estimates that were computed were then presented in the supplementary materials. The overall statistics on the gross cropped area, net cropped area, and cropping intensity of Tamil Nadu are presented in Table 4.
4.1.1. Estimation of Gross Cropped Area of Tamil Nadu Using SAR and MODIS Data
Using SAR data, the analysis showed that in 2019-20, Tamil Nadu's gross cropped area was 52.88 lakh hectares. The rabi season accounted for 27.04 lakh hectares (51.15%), followed by the kharif season with 16.83 lakh hectares (31.82%), and 9.01 lakh hectares (17.03%) were cultivated during the summer. In 2020-21, the gross cropped area increased to 54.57 lakh hectares, with 28.00 lakh hectares (51.32%) during the rabi season, 17.13 lakh hectares (31.39%) during the kharif season, and 9.44 lakh hectares (17.29%) in the summer. For 2021-22, the gross cropped area rose to 55.20 lakh hectares, with 28.28 lakh hectares (51.23%) during the rabi season, 17.30 lakh hectares (31.33%) during the kharif season, and 9.62 lakh hectares (17.44%) in the summer. In 2022-23, the gross cropped area further increased to 55.85 lakh hectares. The rabi season contributed 28.66 lakh hectares (51.31%), the kharif season 17.63 lakh hectares (31.57%), and the summer season 9.56 lakh hectares (17.12%) (Table 4 and supplementary materials). The spatial distribution maps of the gross cropped area, calculated using SAR data for these agricultural years, are depicted in Figure 5.
Furthermore, MODIS data reported that the gross cropped area of Tamil Nadu ranged from 56.87 to 62.07 lakh hectares across different districts. Among the various seasons, the rabi season consistently exhibited the highest gross cropped area, followed by the kharif and summer seasons. Specifically, in 2019-20, the gross cropped area totalled 56.87 lakh hectares, with 27.42 lakh hectares during the rabi season, 17.57 lakh hectares during the kharif season, and 11.88 lakh hectares during the summer season.
In 2020-21, the gross cropped area increased to 60.71 lakh hectares, with 29.90 lakh hectares in the rabi season, 19.11 lakh hectares in the kharif season, and 11.70 lakh hectares in the summer. By 2021-22, the total cultivated area had reached 62.03 lakh hectares, with 31.89 lakh hectares during the rabi season, 19.86 lakh hectares during the kharif season, and 10.46 lakh hectares in the summer. In 2022-23, the gross cropped area increased to 62.07 lakh hectares, comprising 31.55 lakh hectares in the rabi season, 19.55 lakh hectares in the kharif season, and 10.97 lakh hectares in the summer (Table 4 and supplementary materials). The spatial distribution maps of the gross cropped area, computed using optical data for these agricultural years, are depicted in Figure 6.
4.1.2. Estimation of Cropping Pattern and Net Cropped Area of Tamil Nadu Using SAR and MODIS Data
The net sown area derived from Sentinel 1A SAR data was analyzed by adding the cropped areas from single, double, and triple cropping and deducting the fallow areas. The study data for 2019-20 identified a total net sown area of 41.76 lakh hectares, with 21.35 lakh hectares (51.12%) under single cropping, 13.09 lakh hectares (31.35%) under double cropping, and 7.32 lakh hectares (17.53%) under triple cropping. In 2020-21, the net sown area increased to 43.34 lakh hectares, with 22.21 lakh hectares (51.24%) for single cropping, 13.79 lakh hectares (31.82%) for double cropping, and 7.34 lakh hectares (16.94%) for triple cropping. For 2021-22, the total net sown area was 43.59 lakh hectares, with single cropping covering 22.18 lakh hectares (50.90%), double cropping 13.77 lakh hectares (31.58%), and triple cropping 7.64 lakh hectares (17.52%). In 2022-23, the net sown area was 43.71 lakh hectares, with single cropping at 22.43 lakh hectares (51.32%), double cropping at 13.66 lakh hectares (31.24%), and triple cropping at 7.62 lakh hectares (17.44%) (Table 4 and supplementary materials). The spatial distribution maps of single, double, and triple cropping areas using SAR data are shown in Figure 7.
Similarly, the net cropped area derived from MODIS data indicated a total of 46.39 lakh hectares as the net sown area for 2019-20, with 23.44 lakh hectares (50.53%) under single cropping, 14.55 lakh hectares (31.36%) under double cropping, and 8.40 lakh hectares (18.11%) under triple cropping. For 2020-21, the net cropped area was 48.17 lakh hectares, with single cropping covering 24.40 lakh hectares (50.65%), double cropping 15.15 lakh hectares (31.45%), and triple cropping 8.62 lakh hectares (17.90%). In 2021-22, the net cropped area was approximately 48.58 lakh hectares, with 24.71 lakh hectares (50.86%) under single cropping, 15.29 lakh hectares (31.47%) under double cropping, and 8.58 lakh hectares (17.67%) under triple cropping. Finally, in 2022-23, the total net sown area was 48.81 lakh hectares, with single cropping at 24.93 lakh hectares (51.08%), double cropping at 15.38 lakh hectares (31.51%), and triple cropping at 8.50 lakh hectares (17.41%) (Table 4 and supplementary materials). The spatial distribution maps of single, double, and triple cropping areas using optical data are shown in Figure 8.
4.1.3. Estimation of Cropping Intensity of Tamil Nadu Derived Using MODIS and SAR Datasets
Based on the cropping intensity (CI) schema, the CI was calculated for all the agricultural years in Tamil Nadu using both SAR and optical data.
Table 4 shows that the overall cropping intensity of Tamil Nadu ranged from 126% to 128%, regardless of the agricultural year. Similarly, the CI values computed using optical data ranged from 123% to 128%, indicating a strong similarity between the results obtained from both data sources. The spatial categorization of CI values into six categories for both SAR and optical data is depicted in Figure 9 and Figure 10, respectively. Further, the district-wise CI computed data were presented in the supplementary materials.
4.2. Comparison Between SAR and Optical Data
The comparison between the Sentinel 1A and MODIS data during the study period is given in Table 5. The data analysis showed that MODIS data accounted for more cropped areas than the Sentinel 1A data. During 2019-20, a 7.02 and 9.98 per cent deviation of gross and net cropped area of Sentinel 1A data was observed from the MODIS data. A total of 10.11 and 11.01 per cent and 10.03 and 10.27 per cent deviation of gross and net cropped area was recorded during 2020-21 and 2021-22, respectively. A total of 10.02 and 10.45 per cent deviation was identified as the gross and net cropped area during 2022-23, respectively. During the study period, it was observed that MODIS data overestimated the gross and net cropped area than the Sentinel 1A.
4.3. Comparison of the Spatial Estimates with Government Statistics
A comparison was conducted between spatially estimated data (Sentinel 1A and MODIS) and statistical data obtained from the DES (Tamil Nadu Directorate of Economics and Statistics) for the specified study duration. The government statistics indicated an increasing trend, with gross and net cropped areas covering about 59.42 lakh ha and 47.38 lakh ha, respectively, for 2019. Similarly, for 2020, the gross and net cropped areas were 61.13 lakh ha and 48.33 lakh ha, respectively. The 2021 statistics had the highest gross (63.48 lakh ha) and net (49.09 lakh ha) cropped area. On comparing the government statistics and spatially estimated figures, a comprehensive deviation percentage was computed for the respective years (Table 6). Table 6 shows that the gross and net cropped area obtained from the SAR data deviated as 11.01 per cent and 11.86 per cent, respectively, for 2019. However, the MODIS-based gross (4.29 per cent) and net cropped (2.09 per cent) area have only deviated slightly from the actual statistics. For the year 2020, the SAR-based gross (10.74 per cent) and net (10.33 per cent) cropped area deviated mainly from the actual statistics when compared to the deviation per cent obtained for the MODIS data on gross (0.69 per cent) and net (0.34 per cent) cropped area.
5. Discussion
Crop area diversification is a strategy that promotes moving away from cultivating a single crop and growing various crops in different combinations on the same piece of land. This approach has been widely recognized as an effective means to achieve food and nutritional security, judicious use of land and water resources, increase external input use efficiency and sustainable agricultural development. Policymakers and agricultural experts must promote sustainable crop diversification strategies that consider local agroecological conditions, resource availability and market demand. The following discussions were conducted to summarize and support the research findings.
5.1. Estimation of Cropped Area Using SAR Data
The present study estimated the cropped area using SAR data derived from the Google Earth Engine (GEE) algorithm in Tamil Nadu. Amani et al. [18] researched crop mapping and identifying patterns by GEE in Rajasthan, India. Many authors worked on large-scale crop mapping by employing satellite data sets with GEE [19,20,21,22,23]. District-wise, a total gross cropped area of 52.88 to 55.85 lakh ha was recorded. The rabi season recorded the maximum gross cropped area, followed by the kharif and summer seasons. India primarily experienced its highest rainfall from the southwest monsoon.
In contrast, Tamil Nadu received more rain from the northeast monsoon, which significantly impacted food grain production in the region and resulted in the accounting of the maximum cropped area during the monsoon season [24]. Among the districts, Tiruvannamalai and Kanchipuram recorded the highest and lowest gross cropped area during the study period, respectively (Supplementary data). A promising increase of 2.97 lakh ha in the total gross sown area was observed from 2019-20 to 2022-23. There was an increase in the gross cropped area of 1.69 lakh ha from 2019-20 to 2020-21. An area of 0.63 and 0.65 lakh ha increased from 2020-21 to 2021-22 and 2021-22 to 2022-23, respectively. Irrespective of the season and year, the single cropping area recorded the maximum net cropped area, followed by double and triple cropping. This indicates the lack of prominent diversification in the cropping cycle following in Tamil Nadu, which might inadvertently be attributed to the climatic variability, lack of proper crop planning activities, and small land holdings of the farmers.
Qiu et al. [25] and Waha et al. [26] reported that single cropping was the dominant cropland area in Southern Asia, followed by double and triple cropland area. The study area's crop seasons highly depended on rainfall, and nearly 2.45 to 2.57 M ha of the arable land fell under rainfed conditions [27,28]. The major rainfed districts reported are Ramanathapuram, Virudhunagar, Krishnagiri, Dharmapuri, Sivaganga, Thoothukkudi, Dindigul, Pudukkottai, Karur, Madurai, Salem and Tiruchirappalli. Therefore, single cropping was followed in the districts where the rainfed area was dominant and double cropping could not be adopted, which might be due to the scanty rainfall received in the districts mentioned above. Over the study period, a promising increase of 1.94 lakh ha in the total net cultivated area was reported. The net cropped area increased by 1.58 and 0.25 lakh ha from 2019-20 to 2020-21 and 2020-21 to 2021-22, respectively. There was a modest increase of 0.11 lakh ha during 2022-23.
On assessing the single, double and triple-cropped area estimates, it could be concluded that an average of 51, 32 and 18 per cent of the cultivable land in the study area falls under single, double and triple-cropped land areas, respectively. Conversely, Qiu et al. [25] reported that 60, 30 and 10 per cent of the arable land fell under single, double and triple cropping, respectively. The northeast monsoon resulted in extending the water availability period by providing sufficient soil moisture for longer-lasting crops and for the double cropping in high rainfall zones of Tamil Nadu [24]. In the Cauvery Delta Zone, the Rice-Rice-Pulses cropping system was followed in most of the districts. The canal command area was spread over some parts of the study area, resulting in triple cropping by increased groundwater potential. Waha et al. [26] stated that South Asia's dominant multiple cropping systems were primarily centred around rice. Triple cropping with crops cultivated in all three seasons was a practice that was observed on only 3 per cent of India's cropland, primarily concentrated in the eastern and southern states of Kerala, West Bengal, Tamil Nadu, Assam and Bihar. As the threshold level classification was adopted in this study, the crops with low dB values didn't reach the threshold dB value. It resulted in the Estimation of lower gross and net cropped area values compared to the statistical data. In the VH polarization, the dB values of rice [29,30,31], cotton [32], groundnut [30], maize [32,33,34], winter cereals [33] and potato [35] were low as compared to the threshold value. Further, the CI of the study area indicated that the highest CI was observed in Thiruvarur, and the lowest CI was recorded in the Sivaganga districts (Supplementary materials). The findings revealed that the gross and net cropped area and cropping intensity increased over time, supported by Singh and Bera [36].
5.2. Estimation of Cropped Area Using Optical Data
Landsat imagery was a widely employed resource for crop mapping because of its extended historical data archives and comparatively high spatial resolution available at no charge [37]. Numerous past studies conducted at regional and global levels extensively used MODIS data or integrated MODIS with Landsat data to capitalize on the valuable phenological information derived from its high temporal resolution for cropland mapping. Many researchers frequently employed coarse spatial resolution images like MODIS to map extensive cropland areas or identify the distribution of individual crop types, often without considering diverse cropping patterns and multi-crop varieties [38,39,40,41,42]. Nevertheless, delineating the spatial distribution of cropping patterns and various crop types at regional and global scales was imperative for mitigating uncertainty in crop yield estimation and enhancing decision-making in crop planting, with the ultimate goal of ensuring food security. The gross and net cropped area was estimated using MODIS data through TIMESAT software. Many researchers utilized TIMESAT software to identify different cropping patterns of MODIS data [43,44,45,46,47]. Tiruvannamalai and Kanchipuram districts accounted for the highest and lowest gross cropped areas among all the districts, respectively. The study observed a notable increase of 2.97 lakh ha in the total gross sown area from 2019-20 to 2022-23. There was an increase of 1.69 lakh ha in the gross cropped area from 2019-20 to 2020-21. Subsequently, an area expansion of 0.63 lakh hectares was observed during 2020-21 to 2021-22 and an additional 0.65 lakh hectares during 2021-22 to 2022-23.
The net cropped area was calculated by summing the single, double and triple cropping areas, and the single cropping area recorded the highest net cropped area, followed by double cropping and triple cropping. A noteworthy expansion of 1.94 lakh ha in the total cultivated land was reported throughout the study period. Specifically, the net cropped area saw a rise of 1.58 lakh ha between 2019-20 and 2020-21. In contrast, the increase in the net cropped area during 2021-22 and 2022-23 was more modest, at 0.25 and 0.11 lakh ha, respectively. The expansion of irrigated agriculture within the study region directly impacted the overall cultivated land. As a result, there was a notable increase in the net cropped area, and the expansion of irrigated areas often signifies improved agricultural productivity and contributes to higher crop yields and food security in the region. It was a positive development for the local economy and food production [48]. Further, similar to the CI obtained for the SAR datasets, the Thiruvarur district consistently exhibited the highest CI, while Sivaganga reported the lowest CI among all the districts.
5.3. Comparison of Optical and SAR Data Utilized for Cropping Pattern and Intensity Derivation
The comparison study conducted between Sentinel 1A and MODIS data revealed that the MODIS data consistently indicated a higher extent of cropped area than Sentinel 1A data. Throughout the study period, it was consistently noted that MODIS data tended to overestimate gross and net cropped areas compared to Sentinel 1A data. Further, considering the meagre percentage deviations in the estimates, it could also be indicated that the spatial resolution of the datasets might not be an evident constraining factor deriving the spatial estimates of the cropping pattern and intensity, especially in such binary classification scenarios. The findings, derived from satellite data, provide valuable insights into the changing dynamics of cropping patterns over the years. Many researchers stated that SAR data could identify the crops through the distinctive temporal signature of the backscatter coefficient exhibited by the crop [49,50,51]. The results indicated that the MODIS data overestimated the cropped area, resulting in high variability of the findings [52]. These findings were supported by Biradar and Xiao [53], who reported that the computed area was deviated by 6.40 per cent. However, optical data reported a lower deviation percentage for the gross and net cropped area compared to the government data at the district level, showing higher variability, which may be due to the lower spatial resolution of the MODIS data.
6. Conclusions
Sentinel 1A and MODIS satellite data were utilized to analyse and map cropping patterns in Tamil Nadu, acquired at every 12-day and 16-day interval, respectively, from June to May in 2019-20 and 2022-23. Gross and net cropped areas were calculated to determine the cropping intensity of the study region. The gross and net cropped area was calculated using multi-date SAR data varied from 52.88 to 55.86 lakh ha and 41.75 to 48.57 lakh ha during 2019-20 to 2022-23. Similarly, the analysis of optical data concluded that the gross cropped area ranges from 56.86 to 62.07 lakh ha. Similarly, the net cropped area recorded by the MODIS data ranged between 46.39 and 48.57 lakh ha during the study period, indicating almost similar performance of the datasets under binary-based classification. Further, single cropping (51 per cent) was the dominant cropping pattern in the Tamil Nadu region in all of the agricultural years assessed, followed by double (31 per cent) and triple cropping (17 per cent). Such cropping characteristics can impose restrictions on several aspects of land and soil productivity besides the economic risks implicated due to pest and disease infestations. Though the performance of the SAR and MODIS datasets were almost similar, considering the spatial resolution characteristics, the adopted methodology using the SAR datasets can also be regressed to the small farm holdings, which can be difficult using the 250m MODIS data results. Considering the strengths and bottlenecks of the implicated datasets, the study recommends further SAR and optical data fusion to facilitate accurate and reliable real-time crop information.
Author Contributions
Conceptualization, S.P and R.K; Formal analysis, S.P, M.V and M.N; Methodology, S.P, M.V and K.R; Project administration, S.P; Validation, S.P, R.K, S.K and M.K.Y; Visualization, S.P and R.K; Writing – original draft, M.V and R.K; Writing – review & editing, R.K, M.V, M.N, K.R, S.K and M.K.Y. All authors have read and agreed to the pub-lished version of the manuscript.
Funding
This research received external funding from the World Bank, Tamil Nadu Irrigated Agriculture Modernization Project (Grant number IFHRMS DPC No. 2415-01-120-PF30903).
Acknowledgments
The authors would like to thank the Professor and Head and staffs of De-partment of Remote sensing and GIS, TNAU, Coimbatore for providing all facilities during the research. The boundaries, colors, denominations, and other information shown on any map in this work do not imply any judgment on the part of the authors or their institutes concerning the legal status of any territory or the endorsement or acceptance of such boundaries.
Conflicts of Interest
The authors declare no conflict of interest.
References
- Sood, A.; Choudhury, B.U.; Ray, S.S.; Jalota, S.K.; Sharma, P.K.; Panigrahy, S. Impact of cropping pattern changes on the exploitation of water resources: a remote sensing and GIS approach. Journal of the Indian Society of Remote Sensing 2009, 37, 483–491. [Google Scholar] [CrossRef]
- Tripathi, S.; Srivastava, P.; Devi, R.S.; Bhadouria, R. Influence of synthetic fertilizers and pesticides on soil health and soil microbiology. In Agrochemicals detection, treatment and remediation; Elsevier: 2020; pp. 25–54.
- Kumpawat, B.S. Effect of rainy-season crops on production potential of succeeding wheat (Triticum aestivum). Indian Journal of Agronomy 2001, 46, 400–403. [Google Scholar]
- Timsina, J.; Connor, D.J. Productivity and management of rice–wheat cropping systems: issues and challenges. Field crops research 2001, 69, 93–132. [Google Scholar] [CrossRef]
- Choudhury, I.; Chakraborty, M. SAR signature investigation of rice crop using RADARSAT data. International Journal of Remote Sensing 2006, 27, 519–534. [Google Scholar] [CrossRef]
- Ray, S.S.; Sood, A.; Das, G.; Panigrahy, S.; Sharma, P.K.; Parihar, J.S. Use of GIS and remote sensing for crop diversification—a case study for Punjab State. Journal of the Indian Society of Remote Sensing 2005, 33, 181–188. [Google Scholar] [CrossRef]
- Steinhausen, M.J.; Wagner, P.D.; Narasimhan, B.; Waske, B. Combining Sentinel-1 and Sentinel-2 data for improved land use and land cover mapping of monsoon regions. International journal of applied earth observation and geoinformation 2018, 73, 595–604. [Google Scholar] [CrossRef]
- Roy, A.; Rushton, P.J.; Rohila, J.S. The potential of proteomics technologies for crop improvement under drought conditions. Critical reviews in plant sciences 2011, 30, 471–490. [Google Scholar] [CrossRef]
- Rouse, J.W.; Haas, R.H.; Schell, J.A.; Deering, D.W. Monitoring vegetation systems in the Great Plains with ERTS. NASA Spec. Publ 1974, 351, 309. [Google Scholar]
- Li, H.; Fu, D.; Huang, C.; Su, F.; Liu, Q.; Liu, G.; Wu, S. An Approach to High-Resolution Rice Paddy Mapping Using Time-Series Sentinel-1 SAR Data in the Mun River Basin, Thailand. Remote Sensing 2020, 12. [Google Scholar] [CrossRef]
- Sah, S.; Haldar, D.; Chandra, S.; Nain, A.S. Discrimination and monitoring of rice cultural types using dense time series of Sentinel-1 SAR data. Ecological Informatics 2023, 76, 102136. [Google Scholar] [CrossRef]
- Jain, M.; Mondal, P.; DeFries, R.S.; Small, C.; Galford, G.L. Mapping cropping intensity of smallholder farms: A comparison of methods using multiple sensors. Remote Sensing of Environment 2013, 134, 210–223. [Google Scholar] [CrossRef]
- Liew, S.C.; Kam, S.-P.; Tuong, T.-P.; Chen, P.; Minh, V.Q.; Lim, H. Application of multitemporal ERS-2 synthetic aperture radar in delineating rice cropping systems in the Mekong River Delta, Vietnam. IEEE Transactions on Geoscience and Remote Sensing 1998, 36, 1412–1420. [Google Scholar] [CrossRef]
- Pazhanivelan, S.; Geethalakshmi, V.; Tamilmounika, R.; Sudarmanian, N.S.; Kaliaperumal, R.; Ramalingam, K.; Sivamurugan, A.P.; Mrunalini, K.; Yadav, M.K.; Quicho, E.D. Spatial rice yield estimation using multiple linear regression analysis, semi-physical approach and assimilating SAR satellite derived products with DSSAT crop simulation model. Agronomy 2022, 12, 2008. [Google Scholar] [CrossRef]
- Eklundh, L.; Jönsson, P. TIMESAT 3.3 with seasonal trend decomposition and parallel processing Software Manual. Sweden: Lund and Malmo University, 2017. [Google Scholar]
- Wang, Y.; Xue, Z.; Chen, J.; Chen, G. Spatio-temporal analysis of phenology in Yangtze River Delta based on MODIS NDVI time series from 2001 to 2015. Frontiers of Earth Science 2019, 13, 92–110. [Google Scholar] [CrossRef]
- Pan, L.; Xia, H.; Yang, J.; Niu, W.; Wang, R.; Song, H.; Guo, Y.; Qin, Y. Mapping cropping intensity in Huaihe basin using phenology algorithm, all Sentinel-2 and Landsat images in Google Earth Engine. International Journal of Applied Earth Observation and Geoinformation 2021, 102, 102376. [Google Scholar] [CrossRef]
- Amani, M.; Kakooei, M.; Moghimi, A.; Ghorbanian, A.; Ranjgar, B.; Mahdavi, S.; Davidson, A.; Fisette, T.; Rollin, P.; Brisco, B. Application of google earth engine cloud computing platform, sentinel imagery, and neural networks for crop mapping in Canada. Remote Sensing 2020, 12, 3561. [Google Scholar] [CrossRef]
- Dong, T.; Liu, J.; Shang, J.; Qian, B.; Huffman, T.; Zhang, Y.; Champagne, C.; Daneshfar, B. Assessing the impact of climate variability on cropland productivity in the Canadian prairies using time series MODIS FAPAR. Remote Sensing 2016, 8, 281. [Google Scholar] [CrossRef]
- Massey, R.; Sankey, T.T.; Yadav, K.; Congalton, R.G.; Tilton, J.C. Integrating cloud-based workflows in continental-scale cropland extent classification. Remote Sensing of Environment 2018, 219, 162–179. [Google Scholar] [CrossRef]
- Rudiyanto; Minasny, B.; Shah, R.M.; Che Soh, N.; Arif, C.; Indra Setiawan, B. Automated near-real-time mapping and monitoring of rice extent, cropping patterns, and growth stages in Southeast Asia using Sentinel-1 time series on a Google Earth Engine platform. Remote Sensing 2019, 11, 1666.
- Xie, Y.; Lark, T.J.; Brown, J.F.; Gibbs, H.K. Mapping irrigated cropland extent across the conterminous United States at 30 m resolution using a semi-automatic training approach on Google Earth Engine. ISPRS Journal of Photogrammetry and Remote Sensing 2019, 155, 136–149. [Google Scholar] [CrossRef]
- Xiong, J.; Thenkabail, P.S.; Gumma, M.K.; Teluguntla, P.; Poehnelt, J.; Congalton, R.G.; Yadav, K.; Thau, D. Automated cropland mapping of continental Africa using Google Earth Engine cloud computing. ISPRS Journal of Photogrammetry and Remote Sensing 2017, 126, 225–244. [Google Scholar] [CrossRef]
- Samui, R.P.; Kamble, M.V.; Sabale, J.P. Northeast monsoon rainfall and agricultural production in Tamilnadu and Andhra PradeshI-Rainfall variability and its significance in agricultural production. Mausam 2013, 64, 309–316. [Google Scholar] [CrossRef]
- Qiu, J.; Tang, H.; Frolking, S.; Boles, S.; Li, C.; Xiao, X.; Liu, J.; Zhuang, Y.; Qin, X. Mapping single-, double-, and triple-crop agriculture in China at 0.5°× 0.5° by combining county-scale census data with a remote sensing-derived land cover map. Geocarto International 2003, 18, 3–13. [Google Scholar] [CrossRef]
- Waha, K.; Dietrich, J.P.; Portmann, F.T.; Siebert, S.; Thornton, P.K.; Bondeau, A.; Herrero, M. Multiple cropping systems of the world and the potential for increasing cropping intensity. Global Environmental Change 2020, 64, 102131. [Google Scholar] [CrossRef]
- Vasumathi, V.; Kalpana, R.; Pazhanivelan, S.; Kumaraperumal, R.; Priya, M.V. Identification of'Start of Season'in Major Rainfed Crops of Tamil Nadu, India Using Remote Sensing Technology. International Journal of Environment and Climate Change 2022, 12, 327–334. [Google Scholar] [CrossRef]
- Kp, R.; Raman, M.G. Mapping of rainfed areas in Tamil Nadu using Remote Sensing Technology. Madras Agricultural Journal 2019, 106. [Google Scholar]
- Raman, M.G.; Kaliaperumal, R.; Pazhanivelan, S. Rice Area Estimation in Tiruvarur District of Tamil Nadu using VV Polarized Sentinel 1A SAR Data. Indian Journal of Natural Sciences 2017, 8, 12782–12793. [Google Scholar]
- Tamilmounika, R.; Pazhanivelan, S.; Ragunath, K.P.; Sivamurugan, A.P.; Sudarmanian, N.S.; Kumaraperumal, R.; Thirumeninathan, S. Paddy area estimation in Cauvery Delta Region Using Synthetic Aperture Radar. International journal of Environment, Ecology and Conservation 2022, S517–S522. [Google Scholar] [CrossRef]
- Kannan, S.; Kaliaperumal, R.; Pazhanivelan, S.; Kumaraperumal, R.; Sivakumar, K. Rice Area Estimation using Sentinel 1A SAR Data in Cauvery Delta Region. Int. J. Curr. Microbiol. App. Sci 2021, 10, 848–853. [Google Scholar]
- Ashmitha Nihar, M.; Mohammed Ahamed, J.; Pazhanivelan, S.; Kumaraperumal, R.; Ganesha Raj, K. Estimation of cotton and maize crop area in Perambalur district of Tamil Nadu using multi-date sentinel-1A SAR data. The International Archives of the Photogrammetry, Remote Sensing and Spatial Information Sciences 2019, 42, 67–71. [Google Scholar] [CrossRef]
- Vreugdenhil, M.; Wagner, W.; Bauer-Marschallinger, B.; Pfeil, I.; Teubner, I.; Rüdiger, C.; Strauss, P. Sensitivity of Sentinel-1 backscatter to vegetation dynamics: An Austrian case study. Remote Sensing 2018, 10, 1396. [Google Scholar] [CrossRef]
- Venkatesan, M.; Pazhanivelan, S.; Sudarmanian, N.S. Multi-temporal feature extraction for precise maize area mapping using time-series Sentinel 1A SAR data. The International Archives of the Photogrammetry, Remote Sensing and Spatial Information Sciences 2019, 42, 169–173. [Google Scholar] [CrossRef]
- Shorachi, M.; Kumar, V.; Steele-Dunne, S.C. Sentinel-1 SAR backscatter response to agricultural drought in the Netherlands. Remote Sensing 2022, 14, 2435. [Google Scholar] [CrossRef]
- Singh, Y.S.; Bera, B.K. Present scenario of agricultural sector of Manipur. Economic Affairs 2017, 62, 225–232. [Google Scholar] [CrossRef]
- Zheng, B.; Myint, S.W.; Thenkabail, P.S.; Aggarwal, R.M. A support vector machine to identify irrigated crop types using time-series Landsat NDVI data. International Journal of Applied Earth Observation and Geoinformation 2015, 34, 103–112. [Google Scholar] [CrossRef]
- Xiao, X.; Boles, S.; Frolking, S.; Li, C.; Babu, J.Y.; Salas, W.; Moore Iii, B. Mapping paddy rice agriculture in South and Southeast Asia using multi-temporal MODIS images. Remote sensing of Environment 2006, 100, 95–113. [Google Scholar] [CrossRef]
- Thenkabail, P.S.; Wu, Z. An automated cropland classification algorithm (ACCA) for Tajikistan by combining Landsat, MODIS, and secondary data. Remote Sensing 2012, 4, 2890–2918. [Google Scholar] [CrossRef]
- Teluguntla, P.; Thenkabail, P.S.; Oliphant, A.; Xiong, J.; Gumma, M.K.; Congalton, R.G.; Yadav, K.; Huete, A. A 30-m landsat-derived cropland extent product of Australia and China using random forest machine learning algorithm on Google Earth Engine cloud computing platform. ISPRS journal of photogrammetry and remote sensing 2018, 144, 325–340. [Google Scholar] [CrossRef]
- Galford, G.L.; Mustard, J.F.; Melillo, J.; Gendrin, A.; Cerri, C.C.; Cerri, C.E.P. Wavelet analysis of MODIS time series to detect expansion and intensification of row-crop agriculture in Brazil. Remote sensing of environment 2008, 112, 576–587. [Google Scholar] [CrossRef]
- Lobell, D.B.; Asner, G.P. Cropland distributions from temporal unmixing of MODIS data. Remote sensing of Environment 2004, 93, 412–422. [Google Scholar] [CrossRef]
- Li, L.; Friedl, M.A.; Xin, Q.; Gray, J.; Pan, Y.; Frolking, S. Mapping crop cycles in China using MODIS-EVI time series. Remote Sensing 2014, 6, 2473–2493. [Google Scholar] [CrossRef]
- Liu, J.; Zhu, W.; Atzberger, C.; Zhao, A.; Pan, Y.; Huang, X. A phenology-based method to map cropping patterns under a wheat-maize rotation using remotely sensed time-series data. Remote Sensing 2018, 10, 1203. [Google Scholar] [CrossRef]
- Hu, J.; Chen, Y.; Cai, Z.; Wei, H.; Zhang, X.; Zhou, W.; Wang, C.; You, L.; Xu, B. Mapping diverse paddy rice cropping patterns in South China using harmonized Landsat and Sentinel-2 data. Remote Sensing 2023, 15, 1034. [Google Scholar] [CrossRef]
- Tao, J.; Wu, W.; Liu, W. Spatial-temporal dynamics of cropping frequency in hubei province over 2001–2015. Sensors 2017, 17, 2622. [Google Scholar] [CrossRef]
- Wardlow, B.D.; Egbert, S.L. Large-area crop mapping using time-series MODIS 250 m NDVI data: An assessment for the US Central Great Plains. Remote sensing of environment 2008, 112, 1096–1116. [Google Scholar] [CrossRef]
- Ambika, A.K.; Wardlow, B.; Mishra, V. Remotely sensed high resolution irrigated area mapping in India for 2000 to 2015. Scientific data 2016, 3, 1–14. [Google Scholar] [CrossRef]
- Mahlayeye, M.; Darvishzadeh, R.; Nelson, A. Cropping patterns of annual crops: A remote sensing review. Remote Sensing 2022, 14, 2404. [Google Scholar] [CrossRef]
- Panigrahy, S.; Ray, S.S.; Manjunath, K.R.; Pandey, P.S.; Sharma, S.K.; Sood, A.; Yadav, M.; Gupta, P.C.; Kundu, N.; Parihar, J.S. A spatial database of cropping system and its characteristics to aid climate change impact assessment studies. Journal of the Indian Society of Remote Sensing 2011, 39, 355–364. [Google Scholar] [CrossRef]
- Kaliaperumal, R.; Gr, M. Mapping mango area using multi-temporal feature extraction from Sentinel 1A SAR data in Dharmapuri, Krishnagiri and Salem districts of Tamil Nadu. Madras Agricultural Journal 2019, 106. [Google Scholar] [CrossRef]
- De Beurs, K.M.; Henebry, G.M. Trend analysis of the Pathfinder AVHRR Land (PAL) NDVI data for the deserts of Central Asia. IEEE Geoscience and Remote Sensing Letters 2004, 1, 282–286. [Google Scholar] [CrossRef]
- Biradar, C.M.; Xiao, X. Quantifying the area and spatial distribution of double-and triple-cropping croplands in India with multi-temporal MODIS imagery in 2005. International Journal of Remote Sensing 2011, 32, 367–386. [Google Scholar] [CrossRef]
Figure 1.
Locational information of the study area.
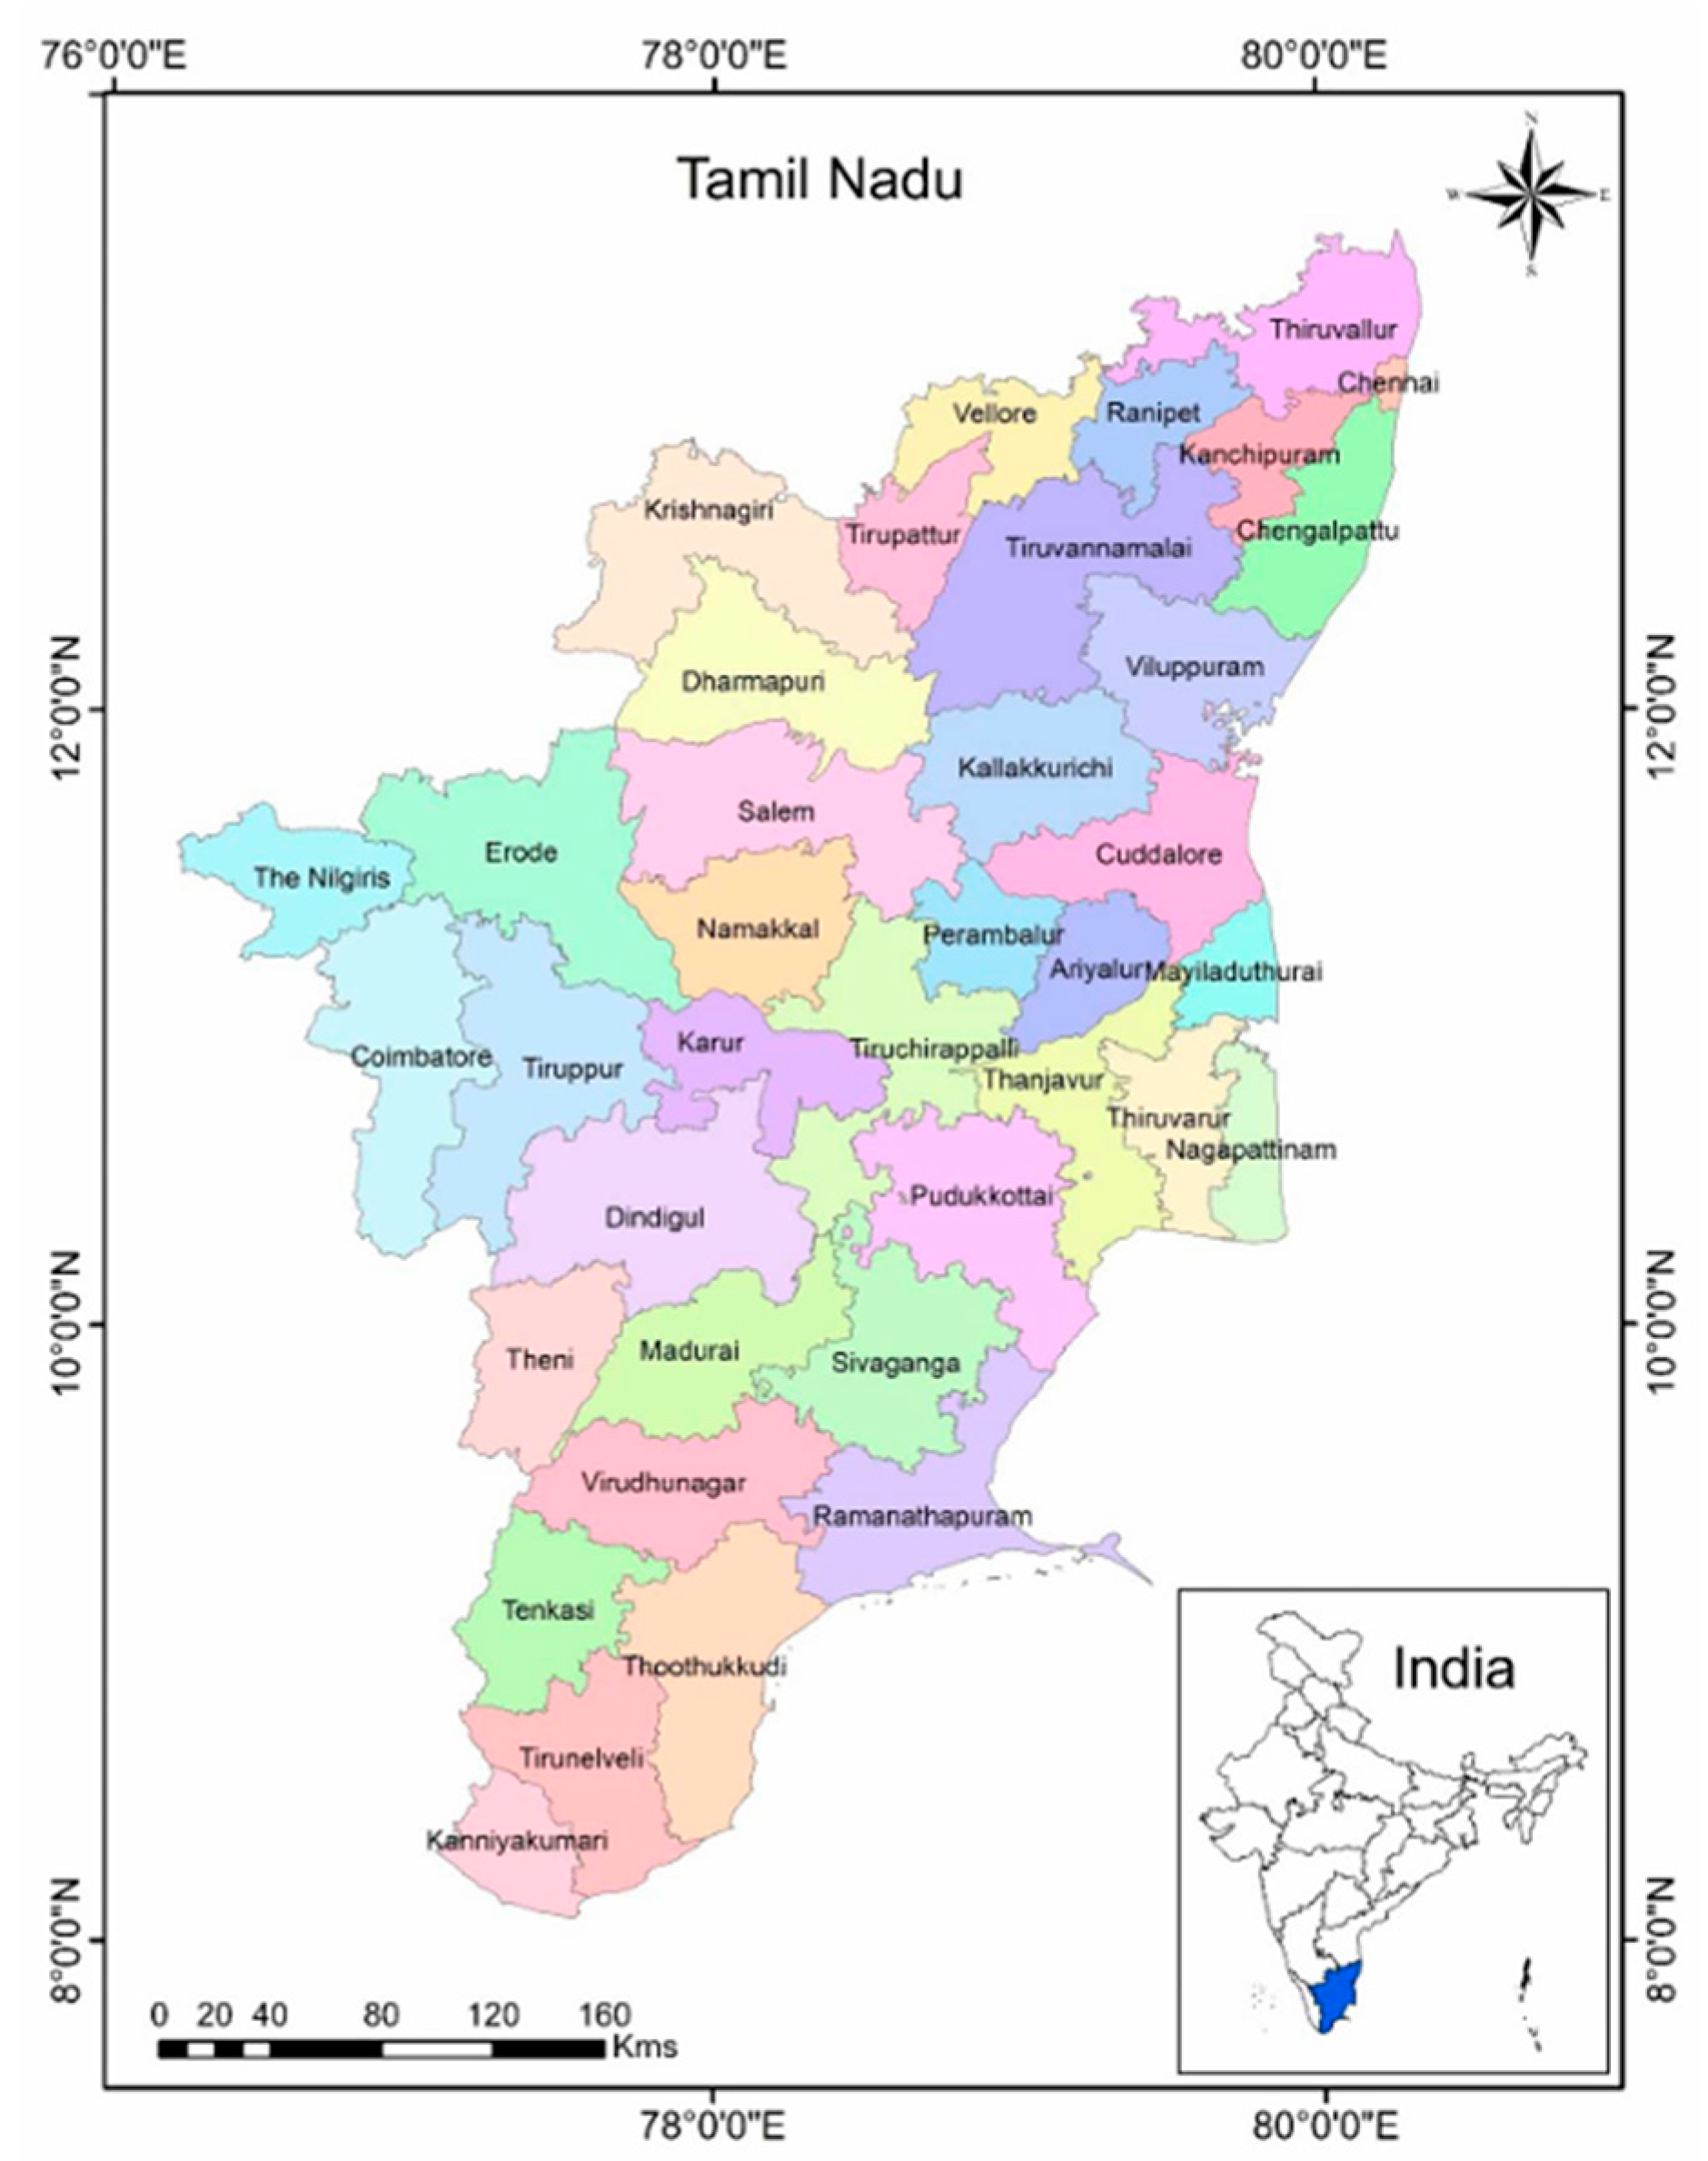
Figure 2.
Pre-processing steps adopted for the SAR (left) and optical datasets (right).
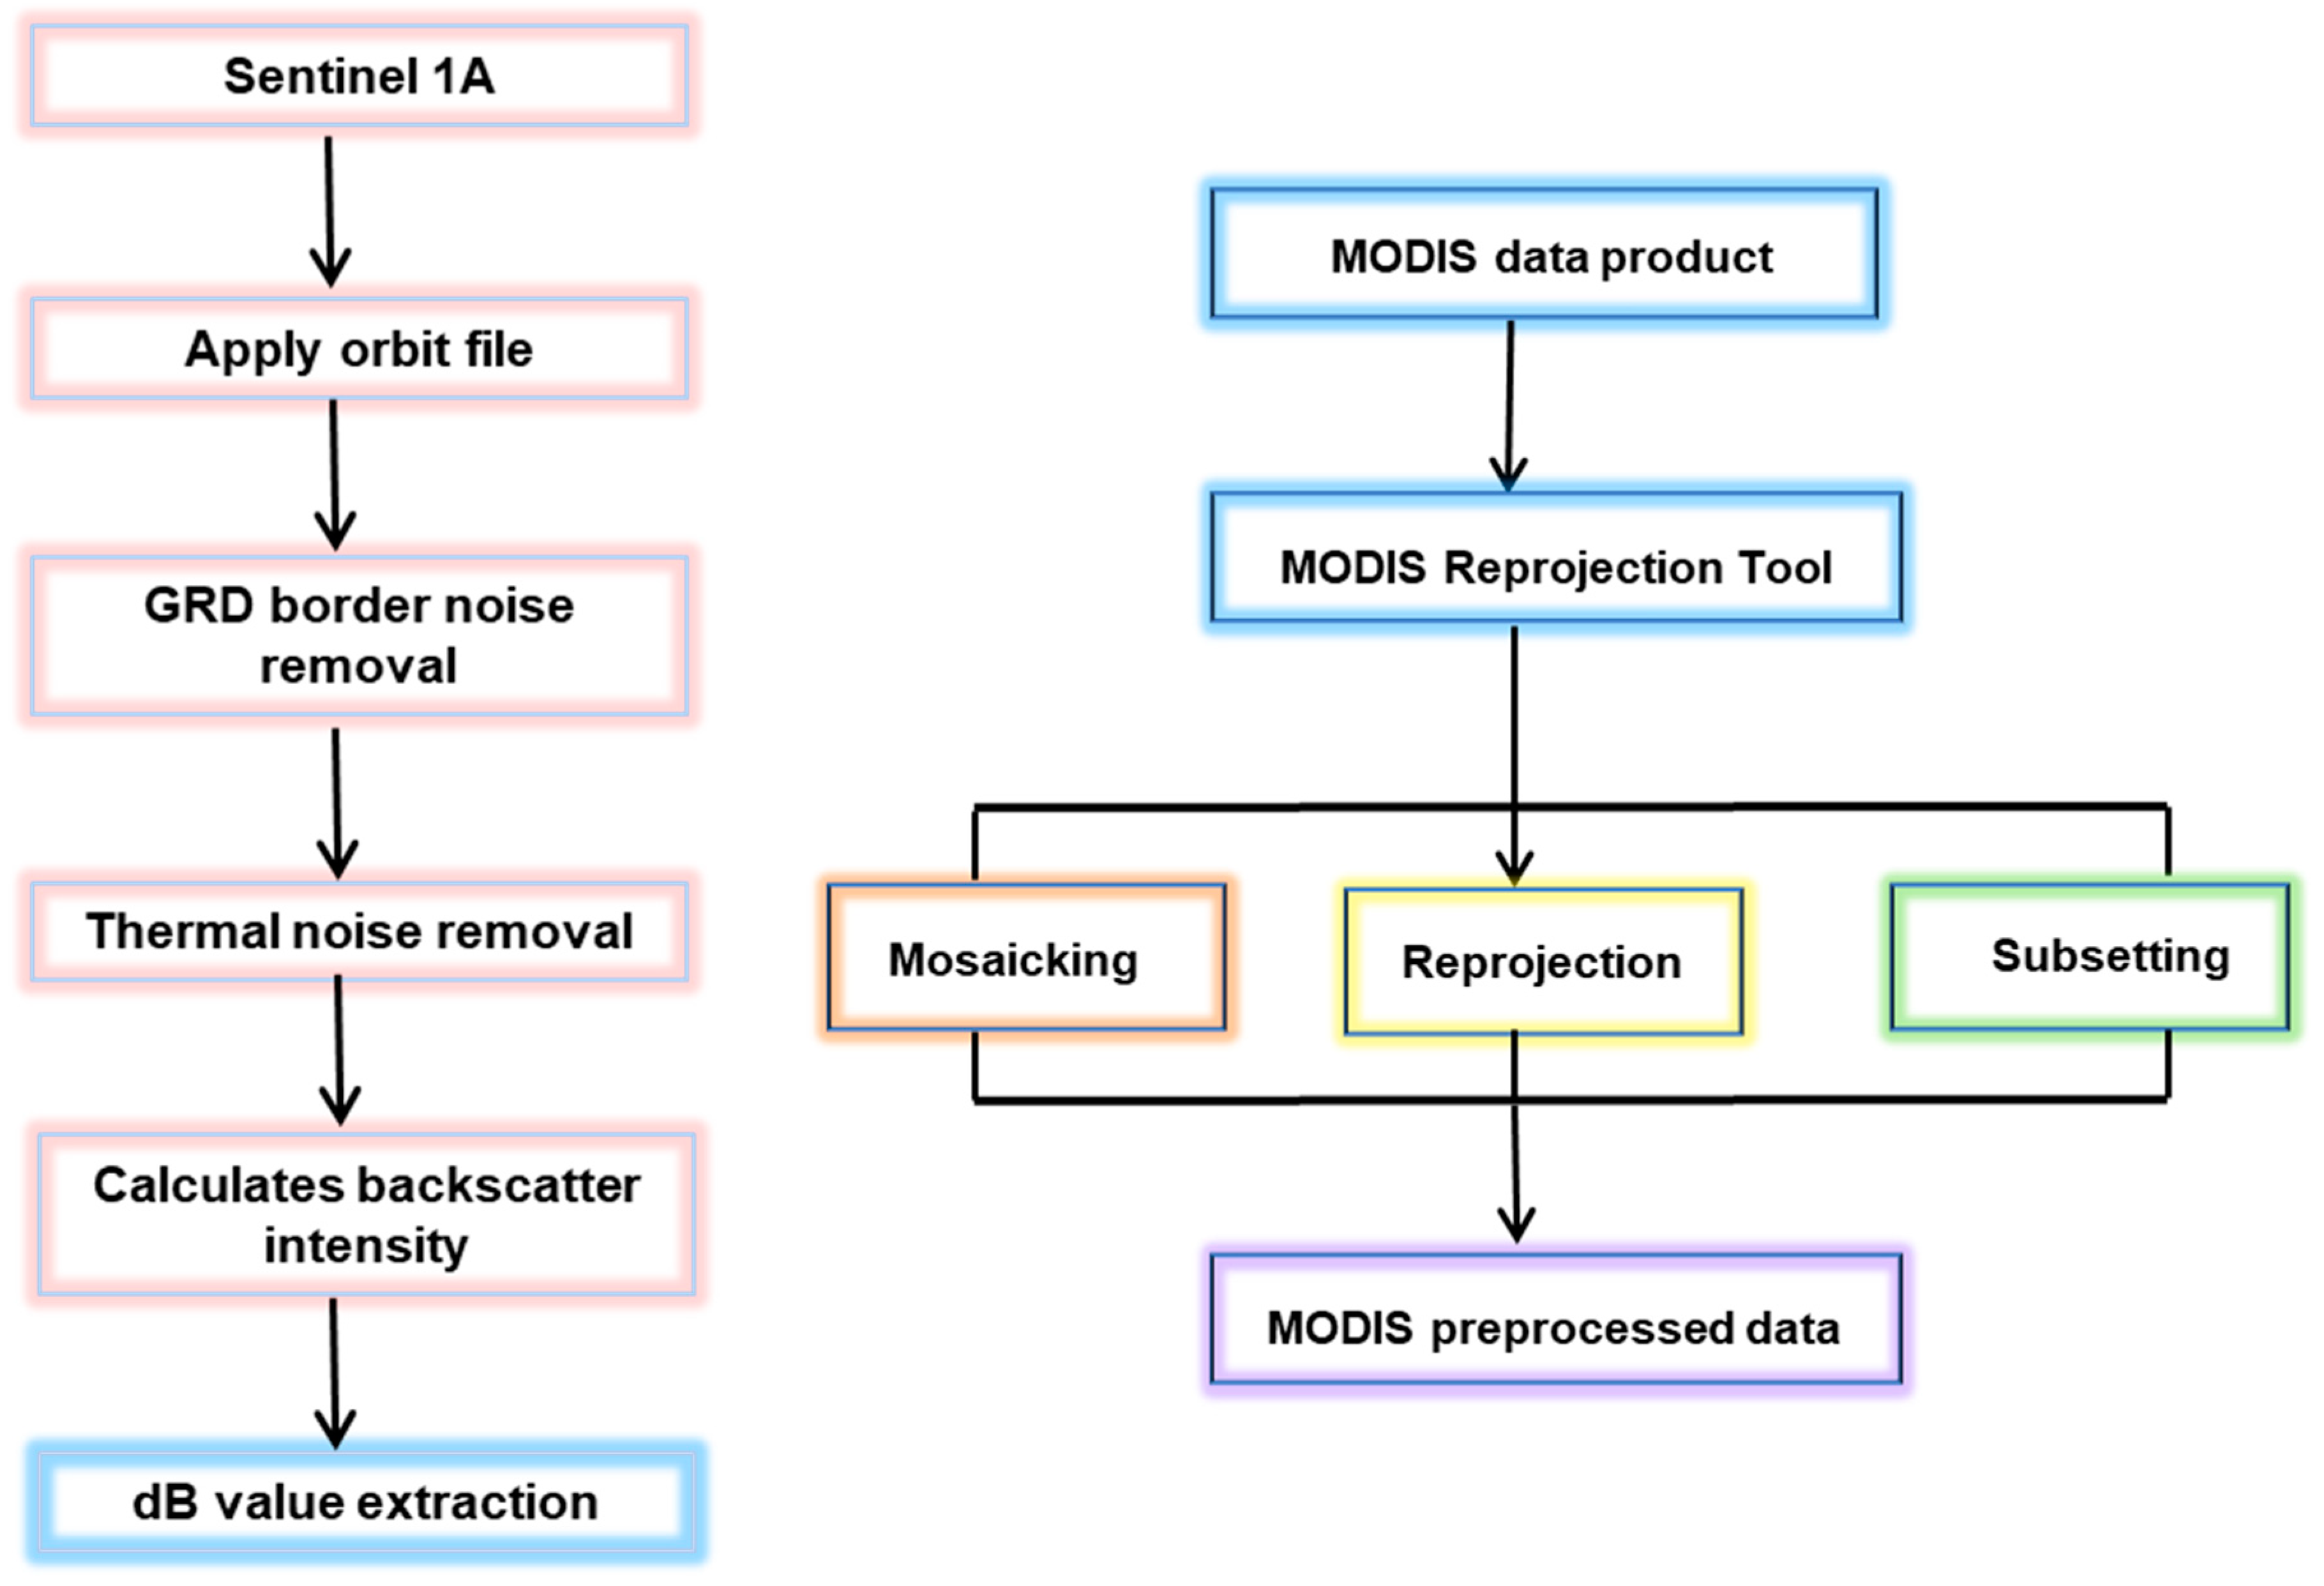
Figure 3.
Flow chart utilizing the methodology of cropped area estimation using Sentinel 1A data.
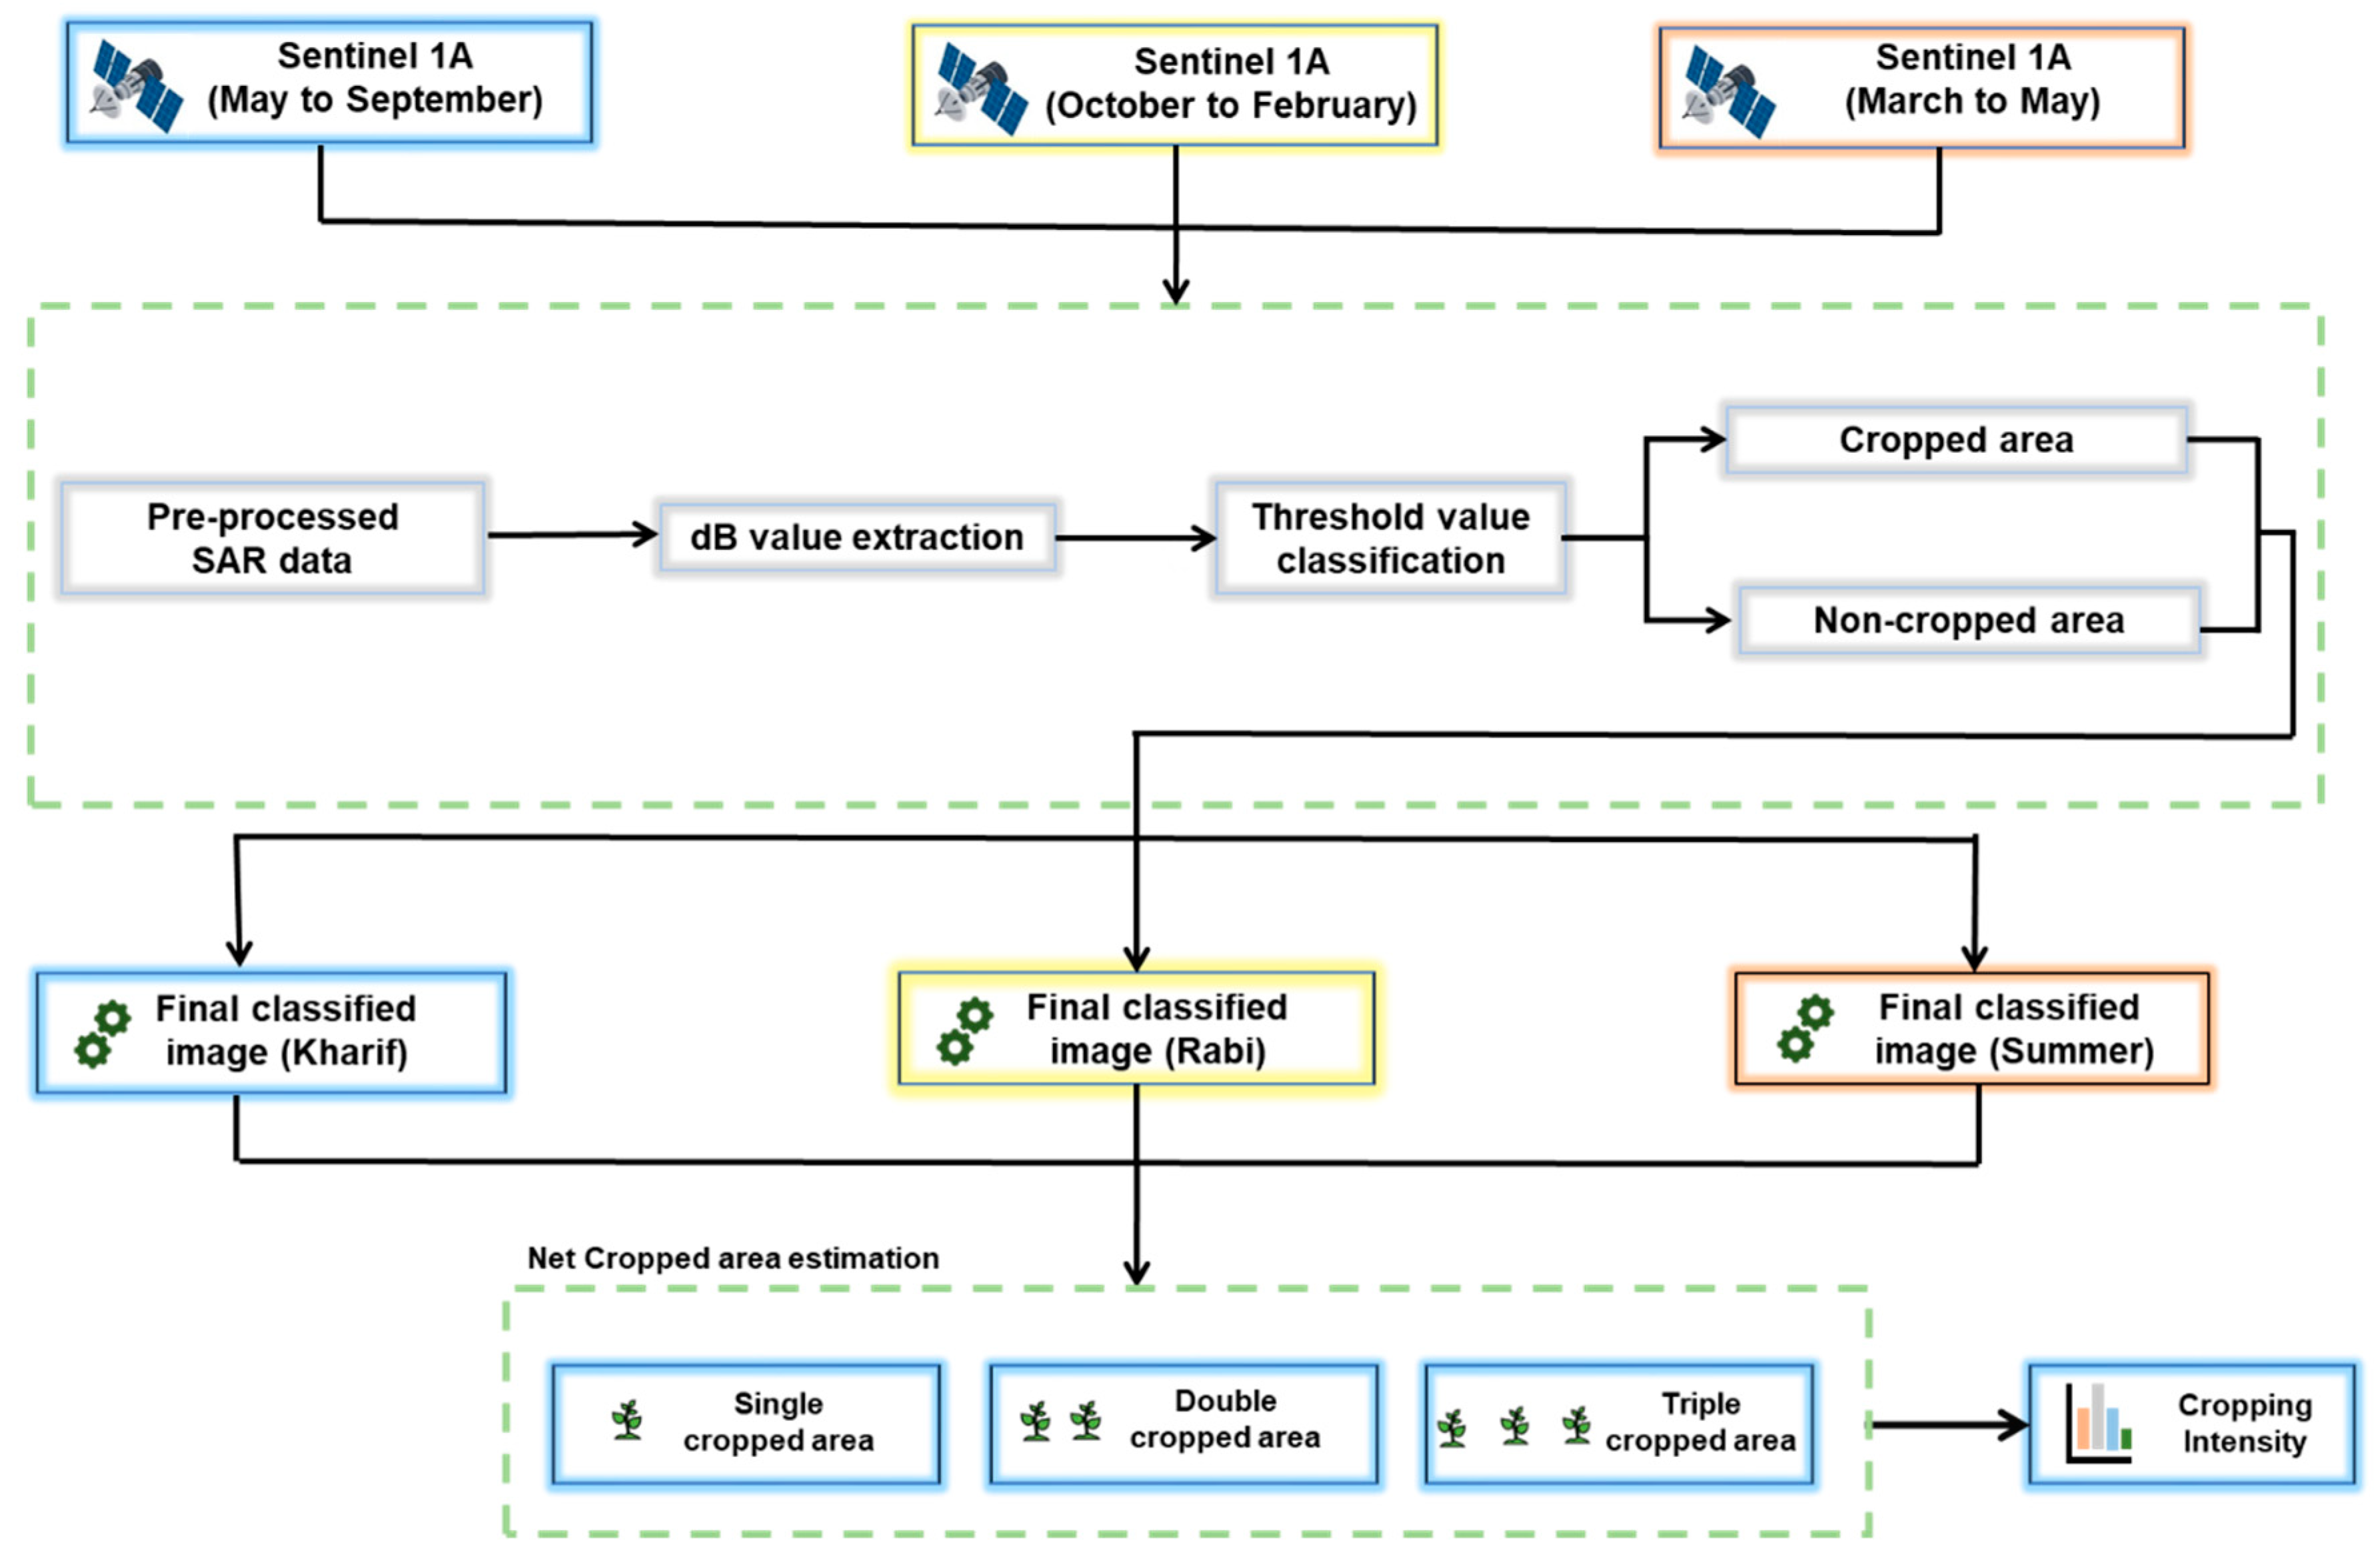
Figure 4.
Flow chart illustrating the methodology of cropped area estimation using MODIS data.
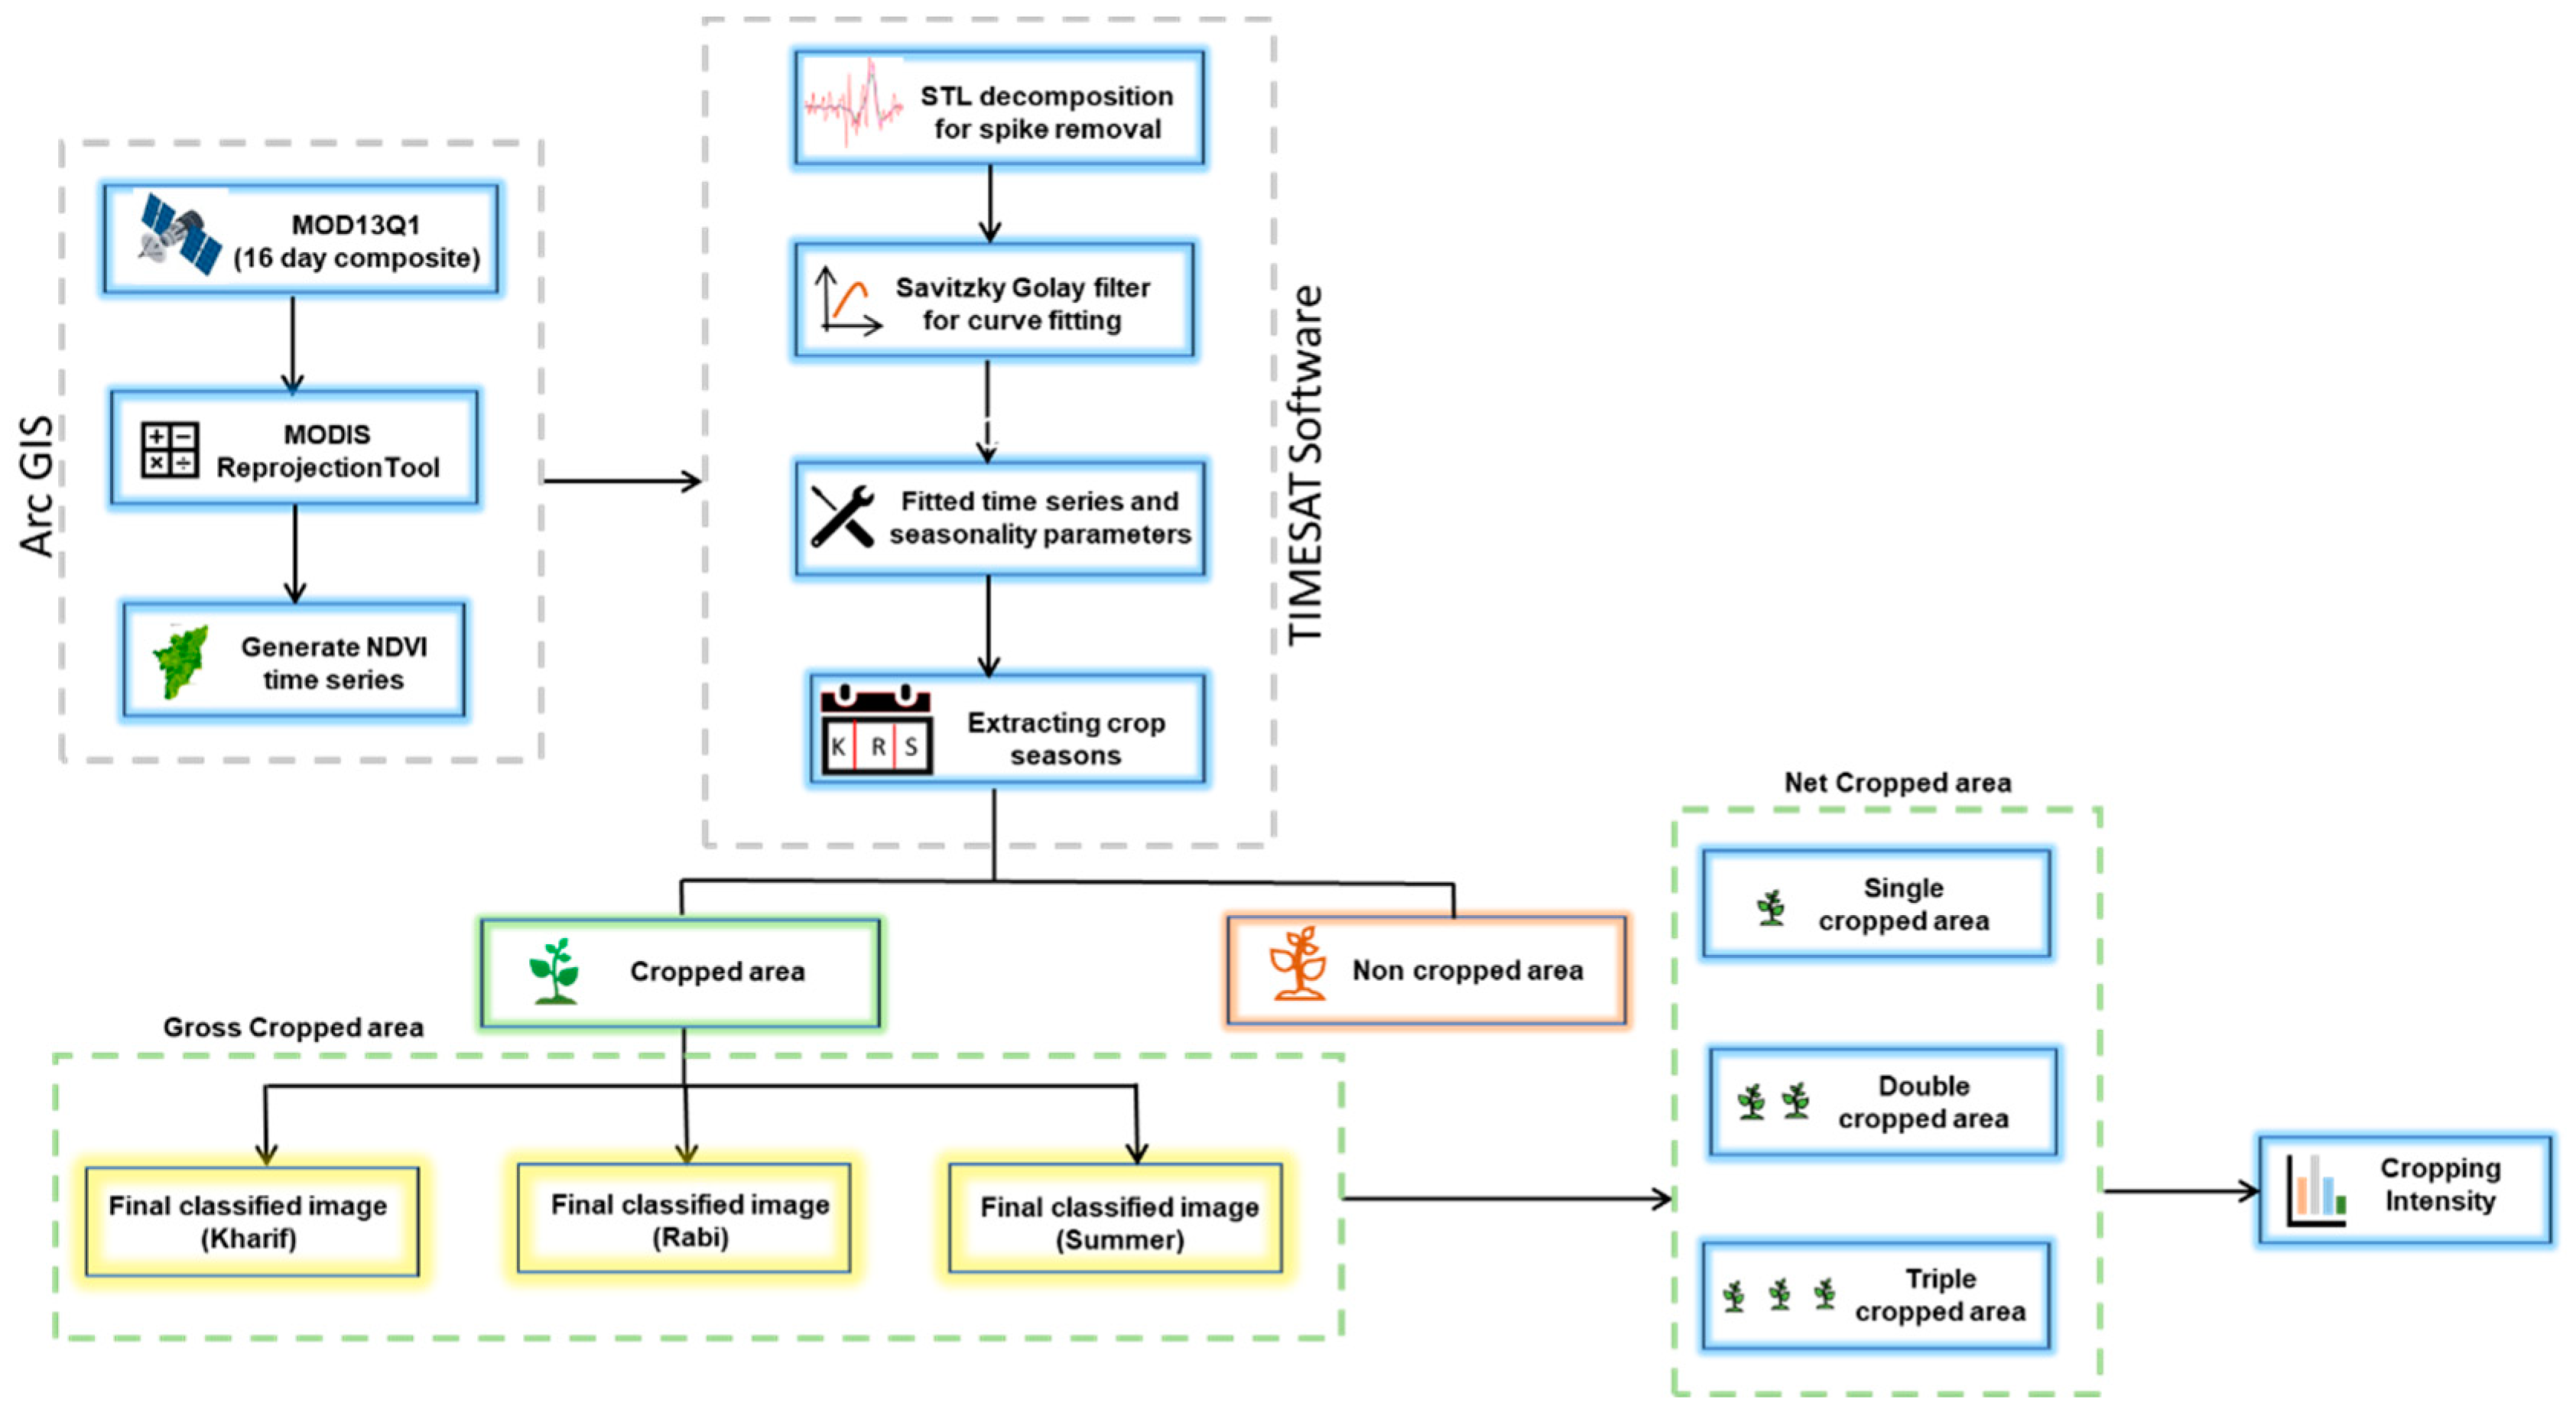
Figure 5.
Spatial distribution maps of gross cropped area computed using SAR data for the agricultural years.
Figure 5.
Spatial distribution maps of gross cropped area computed using SAR data for the agricultural years.
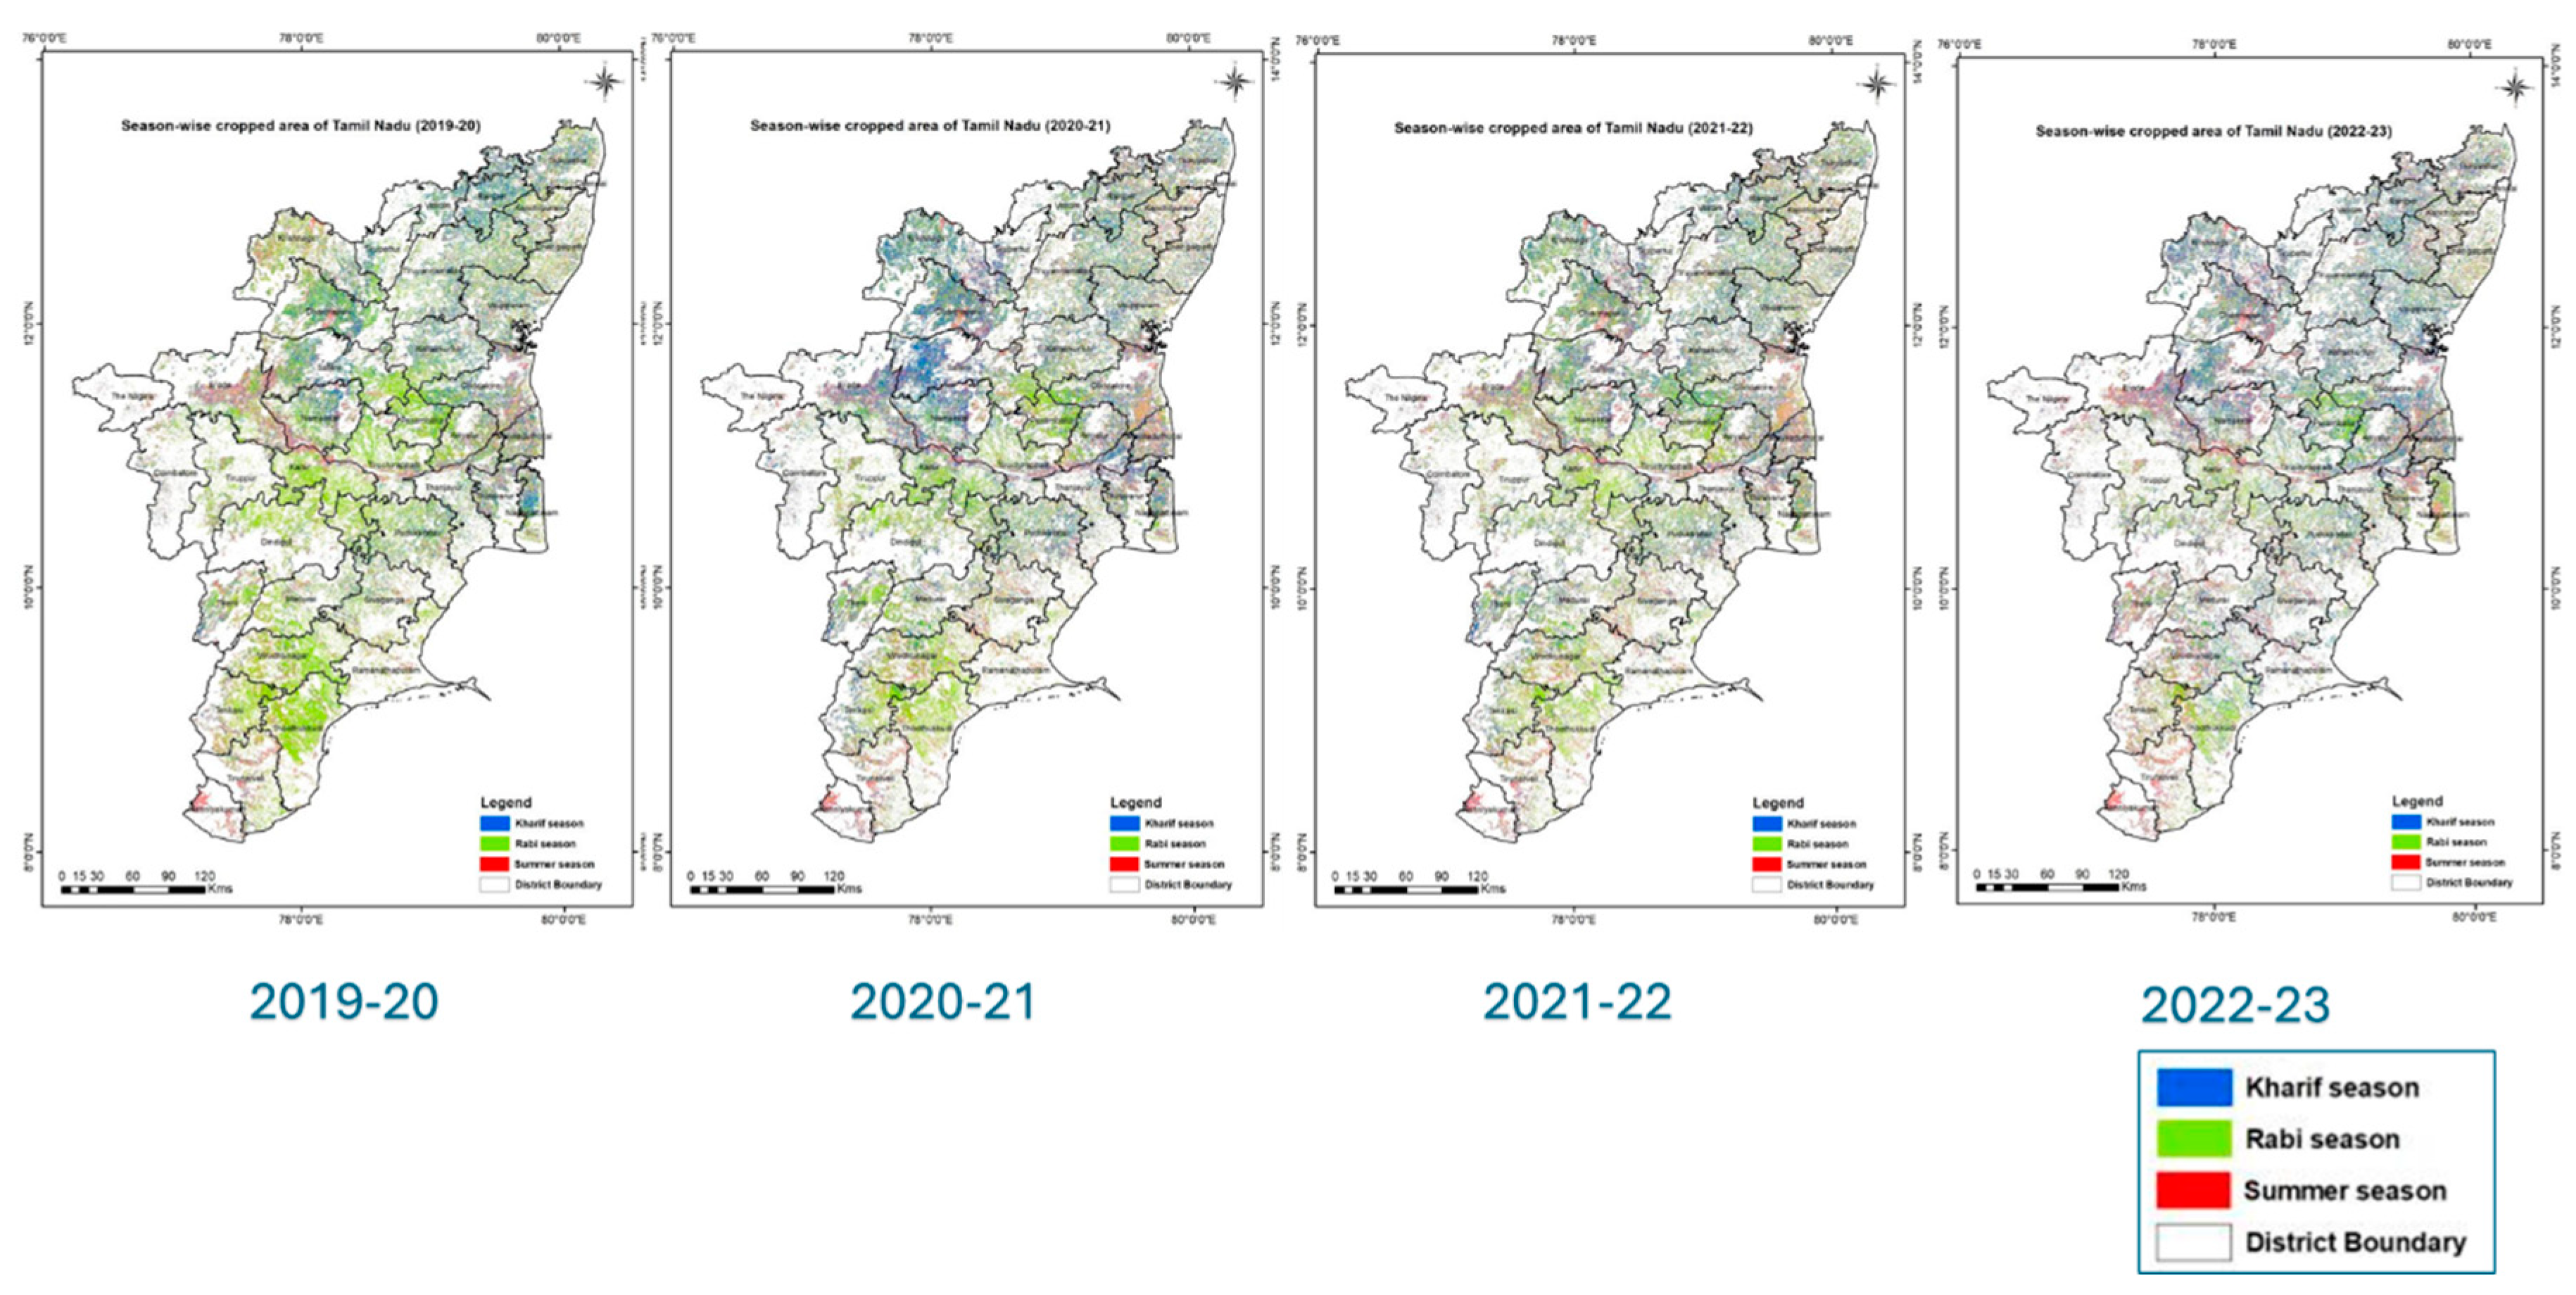
Figure 6.
Spatial distribution maps of gross cropped area computed using Optical data for the agricultural years.
Figure 6.
Spatial distribution maps of gross cropped area computed using Optical data for the agricultural years.
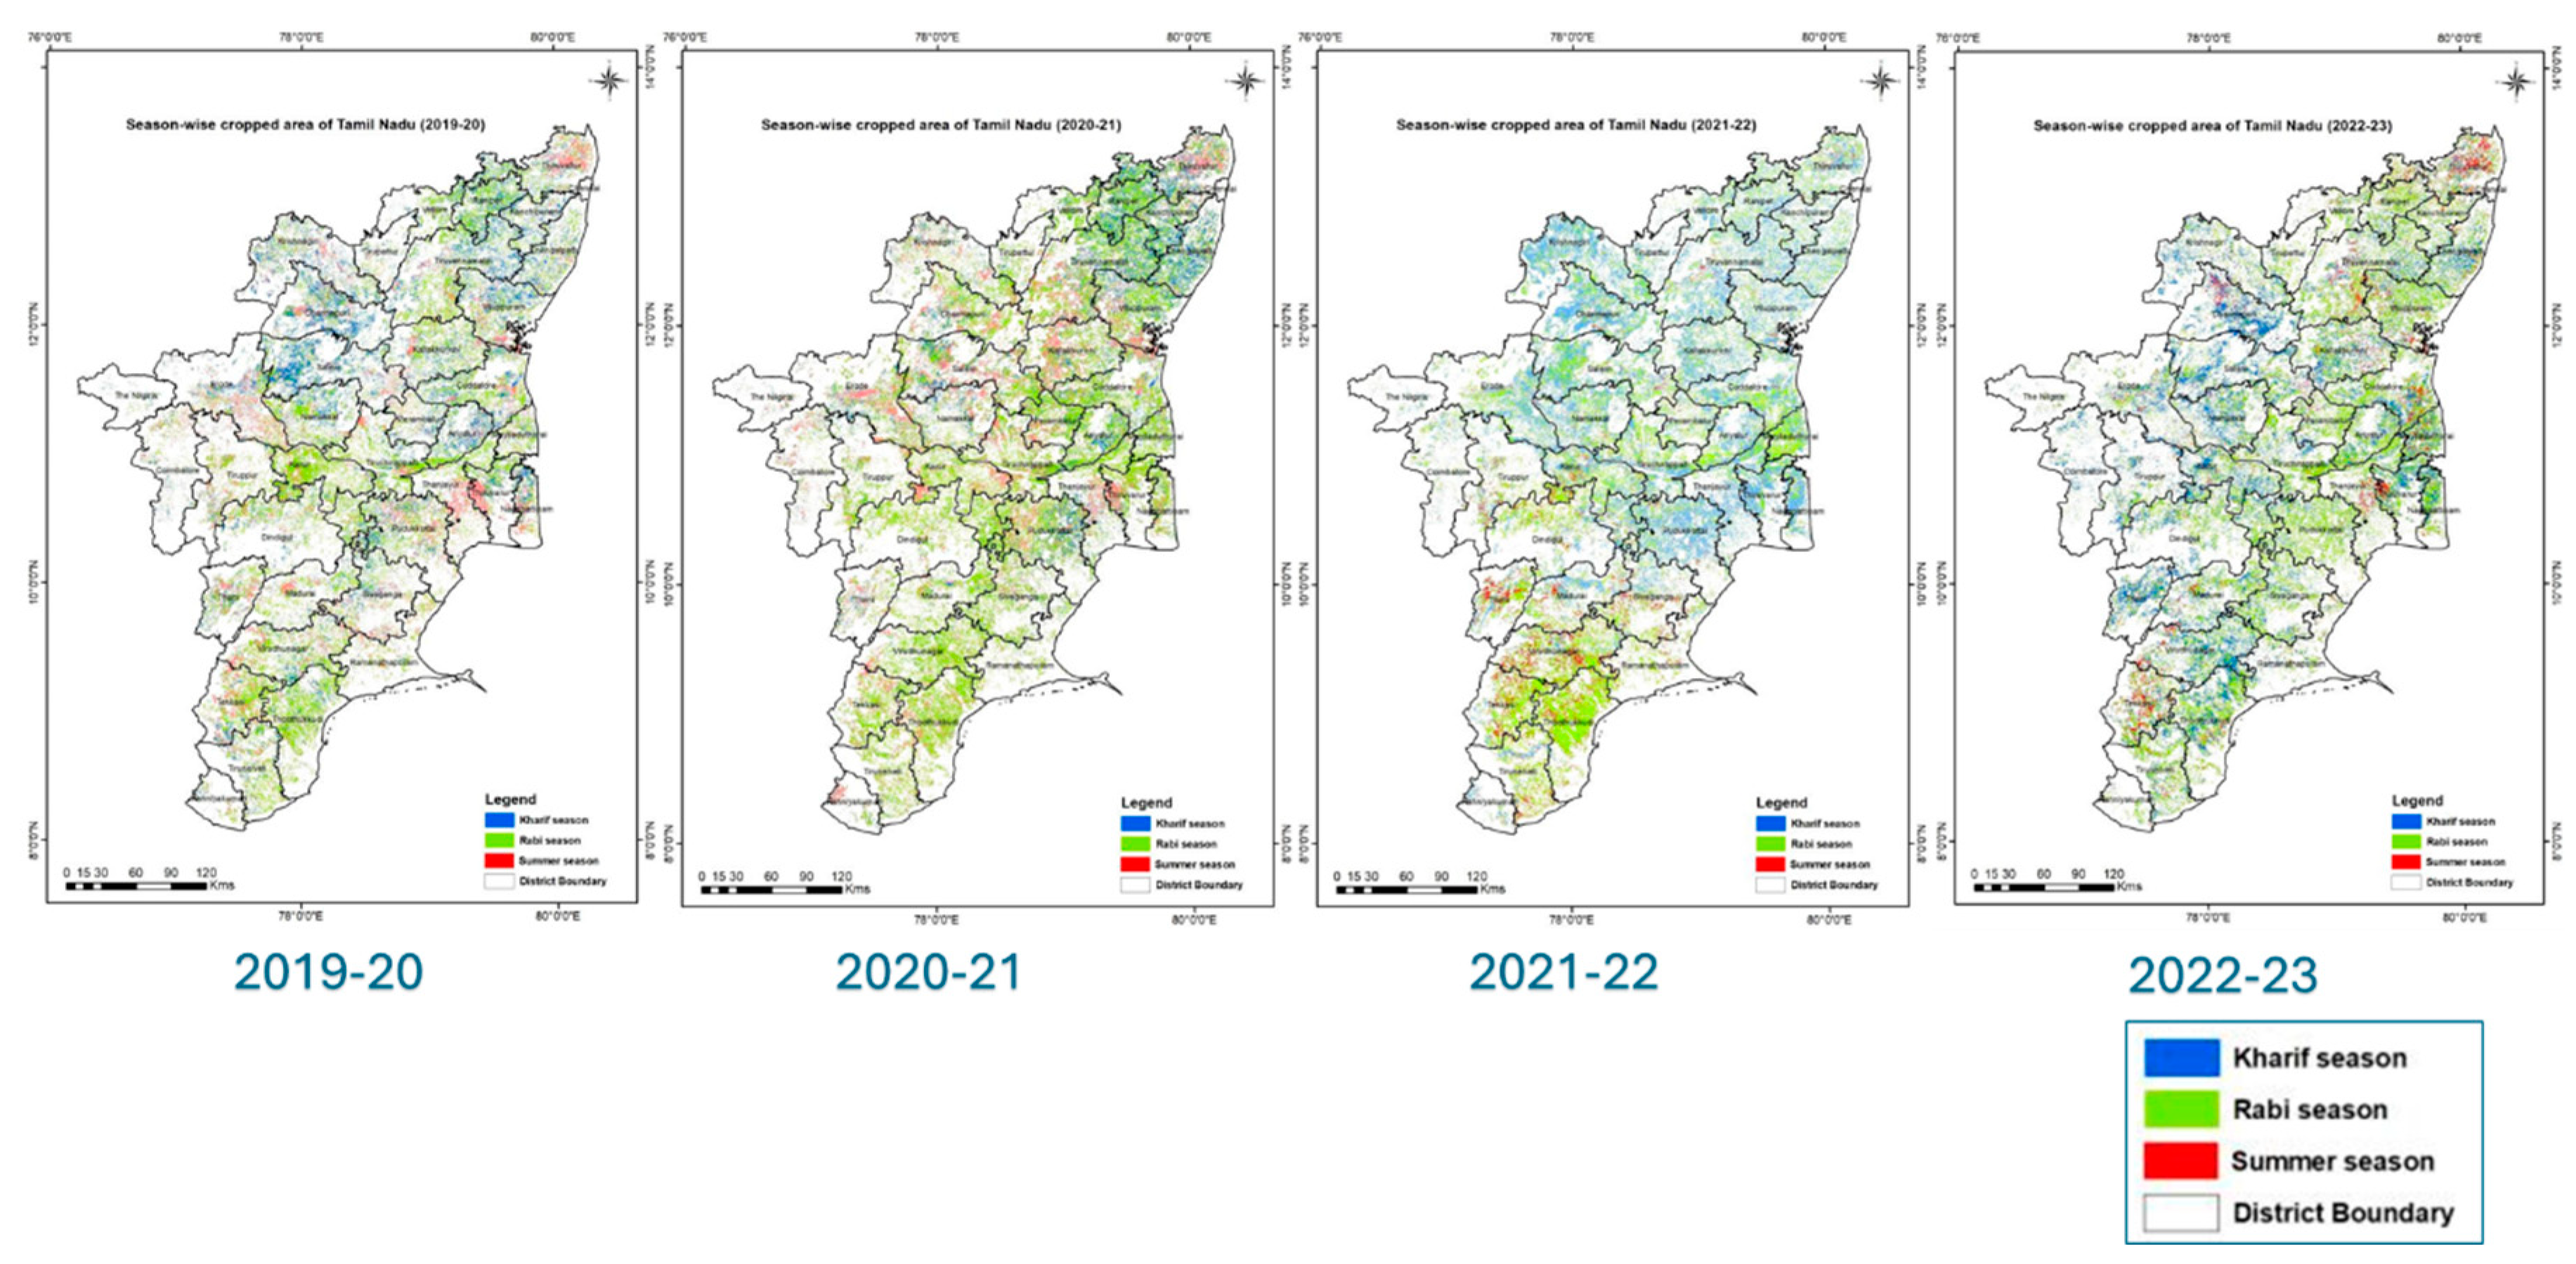
Figure 7.
The spatial distribution maps of the single, double and triple cropping areas discriminated using the SAR data.
Figure 7.
The spatial distribution maps of the single, double and triple cropping areas discriminated using the SAR data.
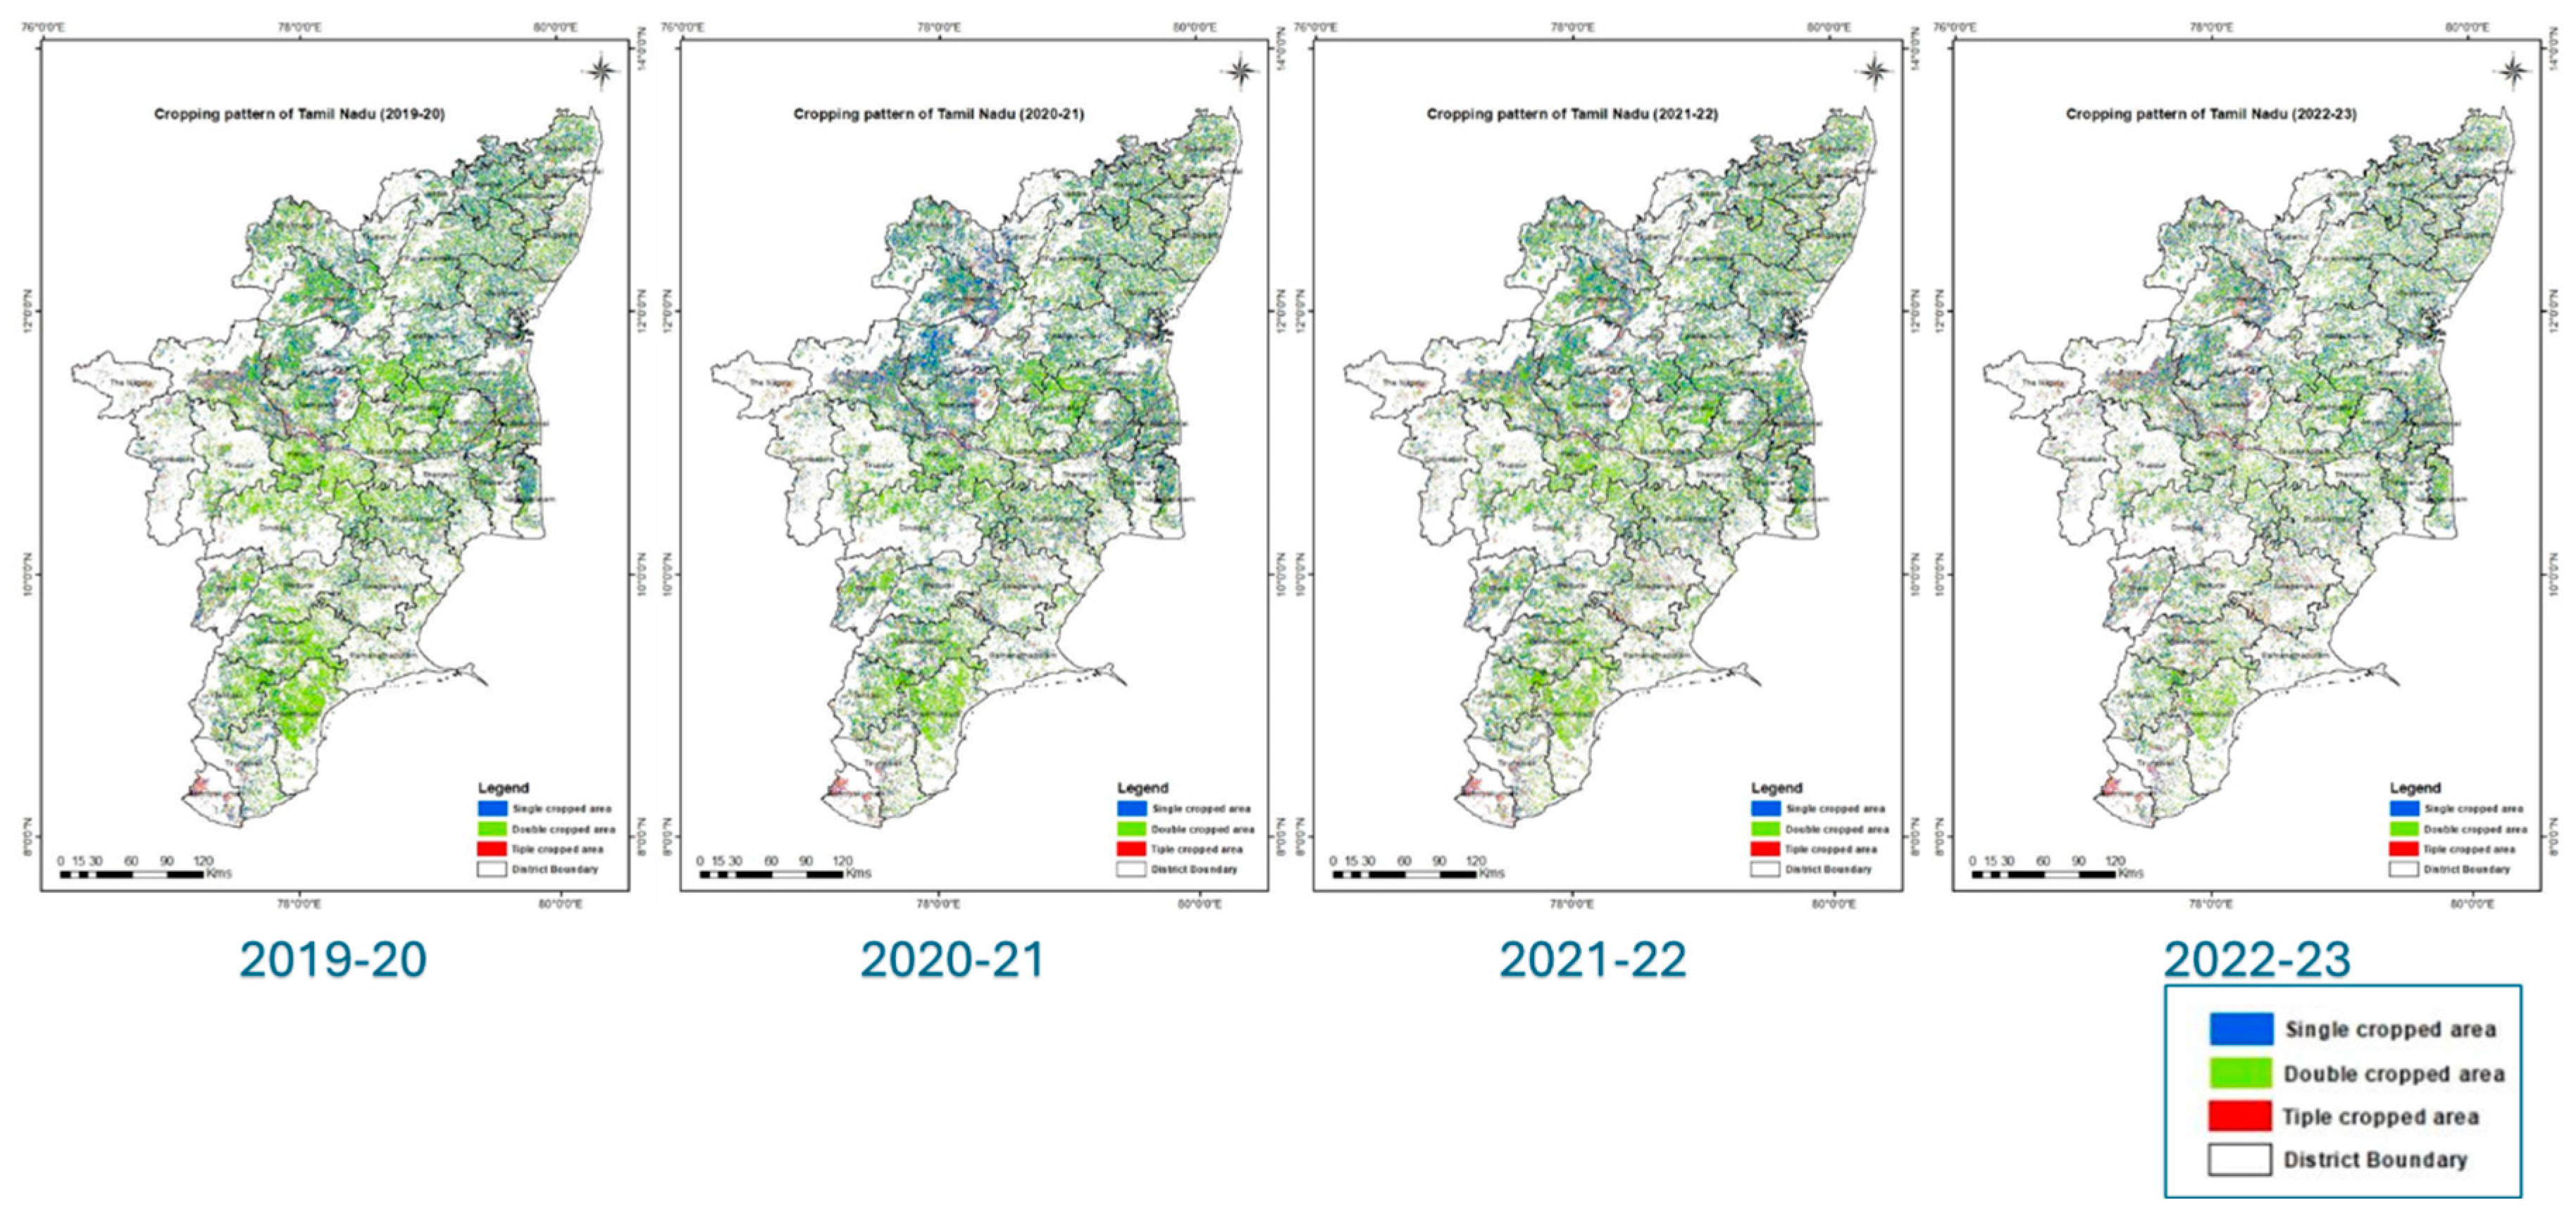
Figure 8.
The spatial distribution maps of the single, double and triple cropping areas discriminated using the Optical data.
Figure 8.
The spatial distribution maps of the single, double and triple cropping areas discriminated using the Optical data.
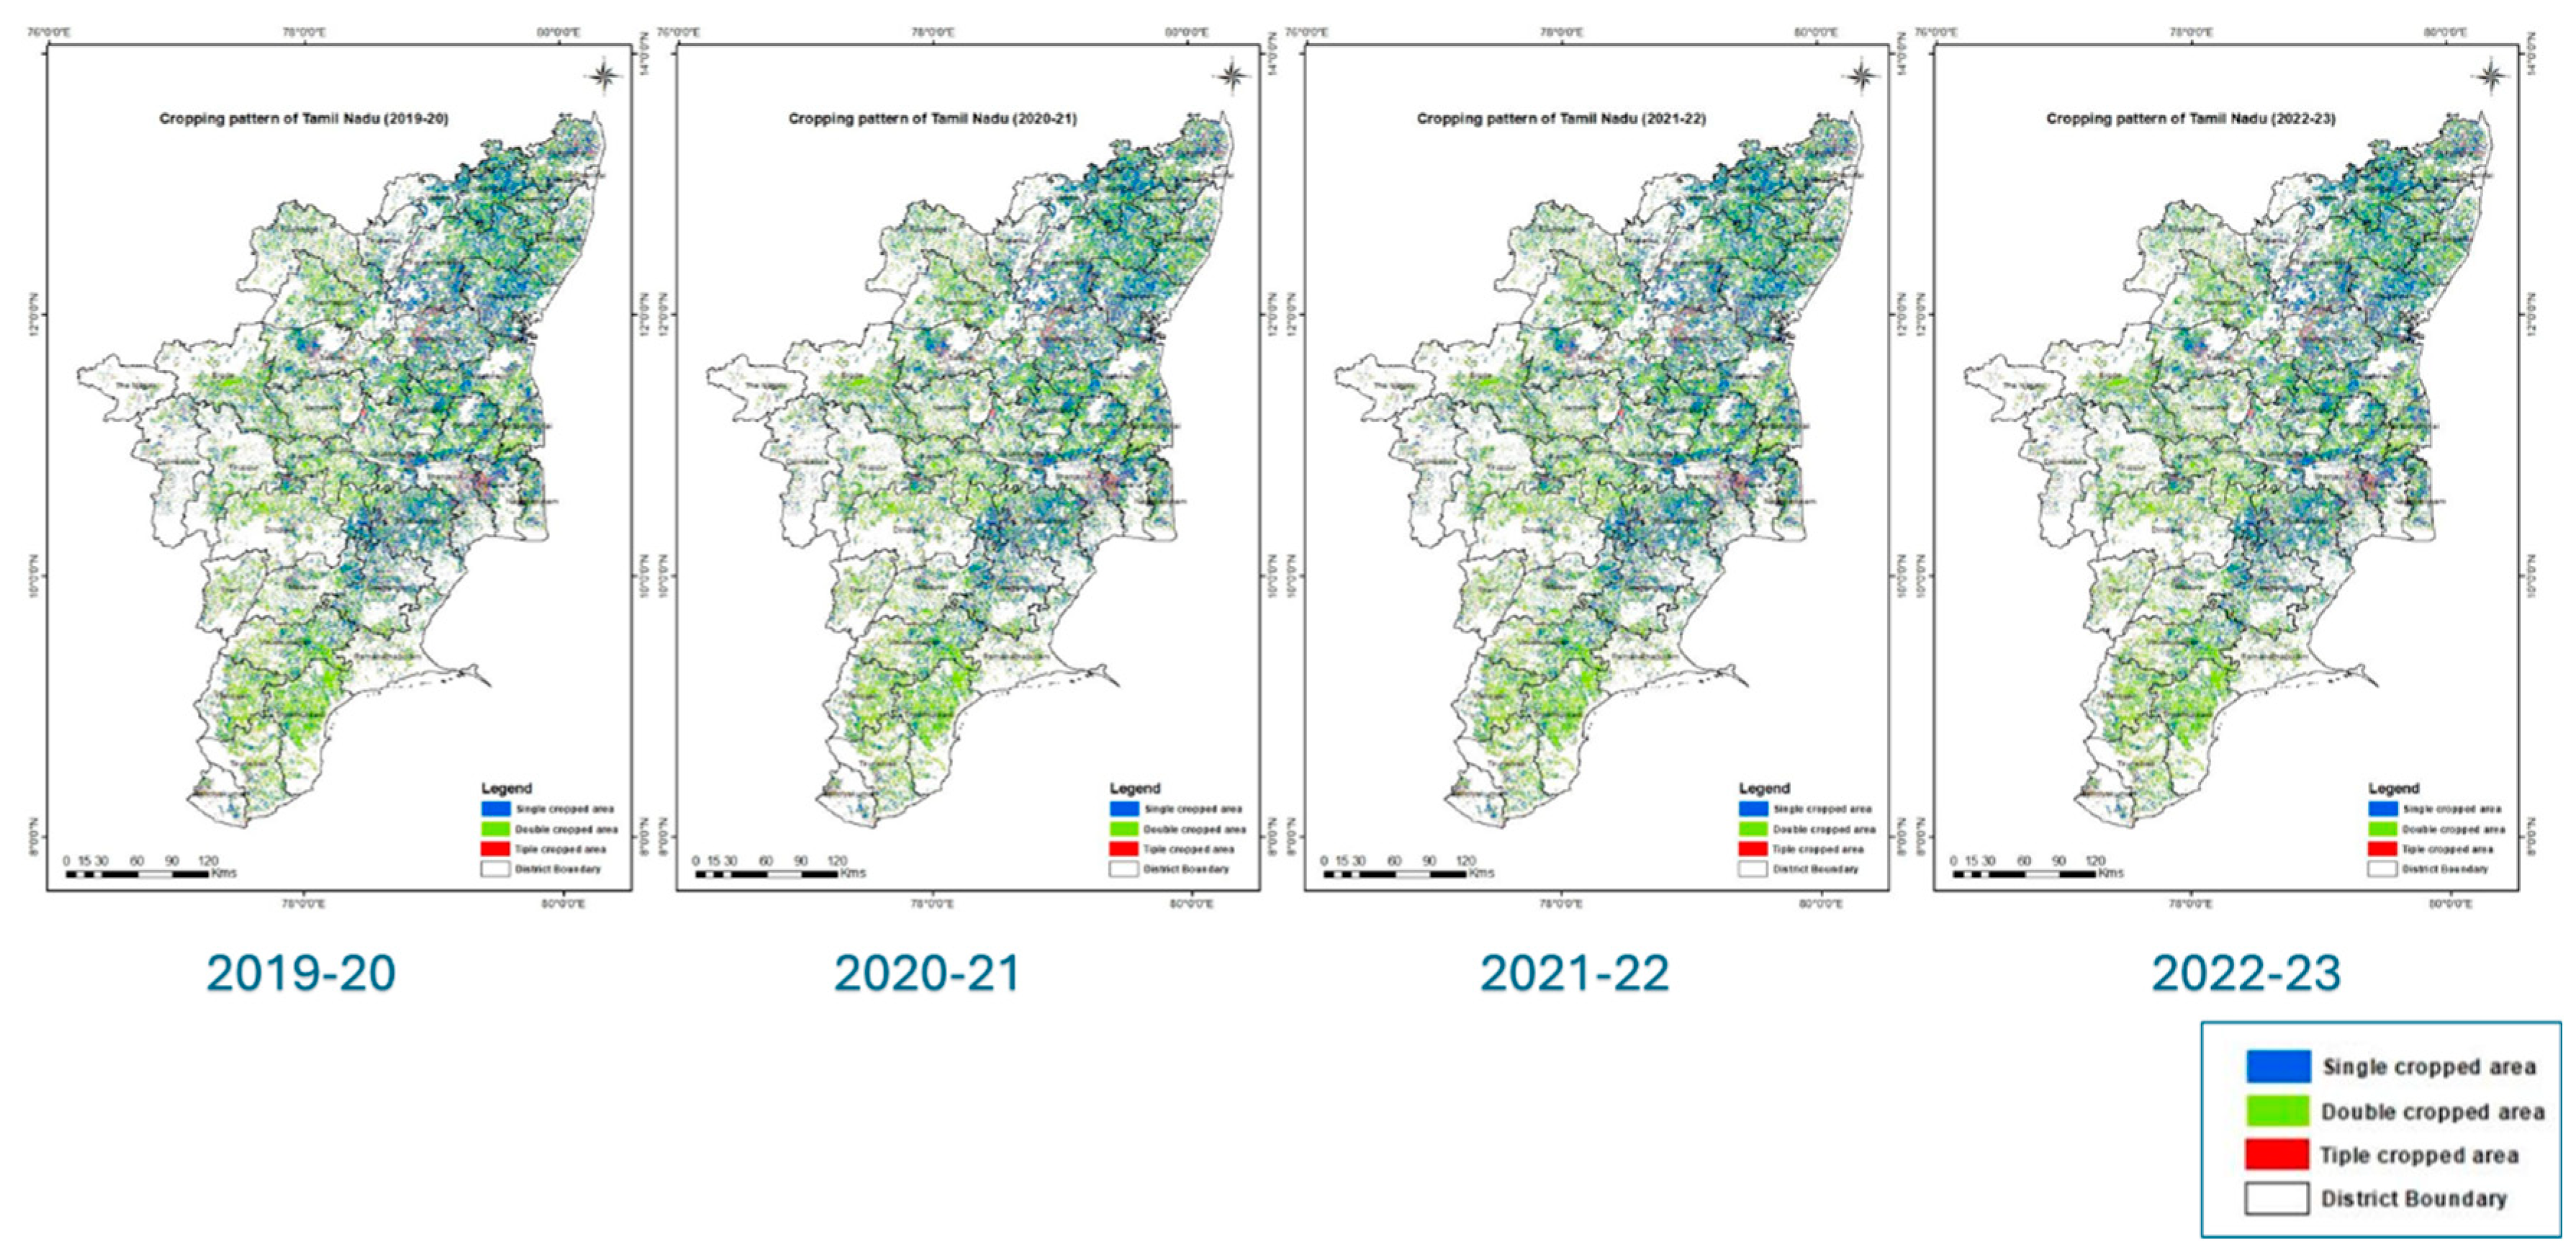
Figure 9.
The spatial distribution maps of the cropping intensity are categorized using the SAR data.
Figure 9.
The spatial distribution maps of the cropping intensity are categorized using the SAR data.
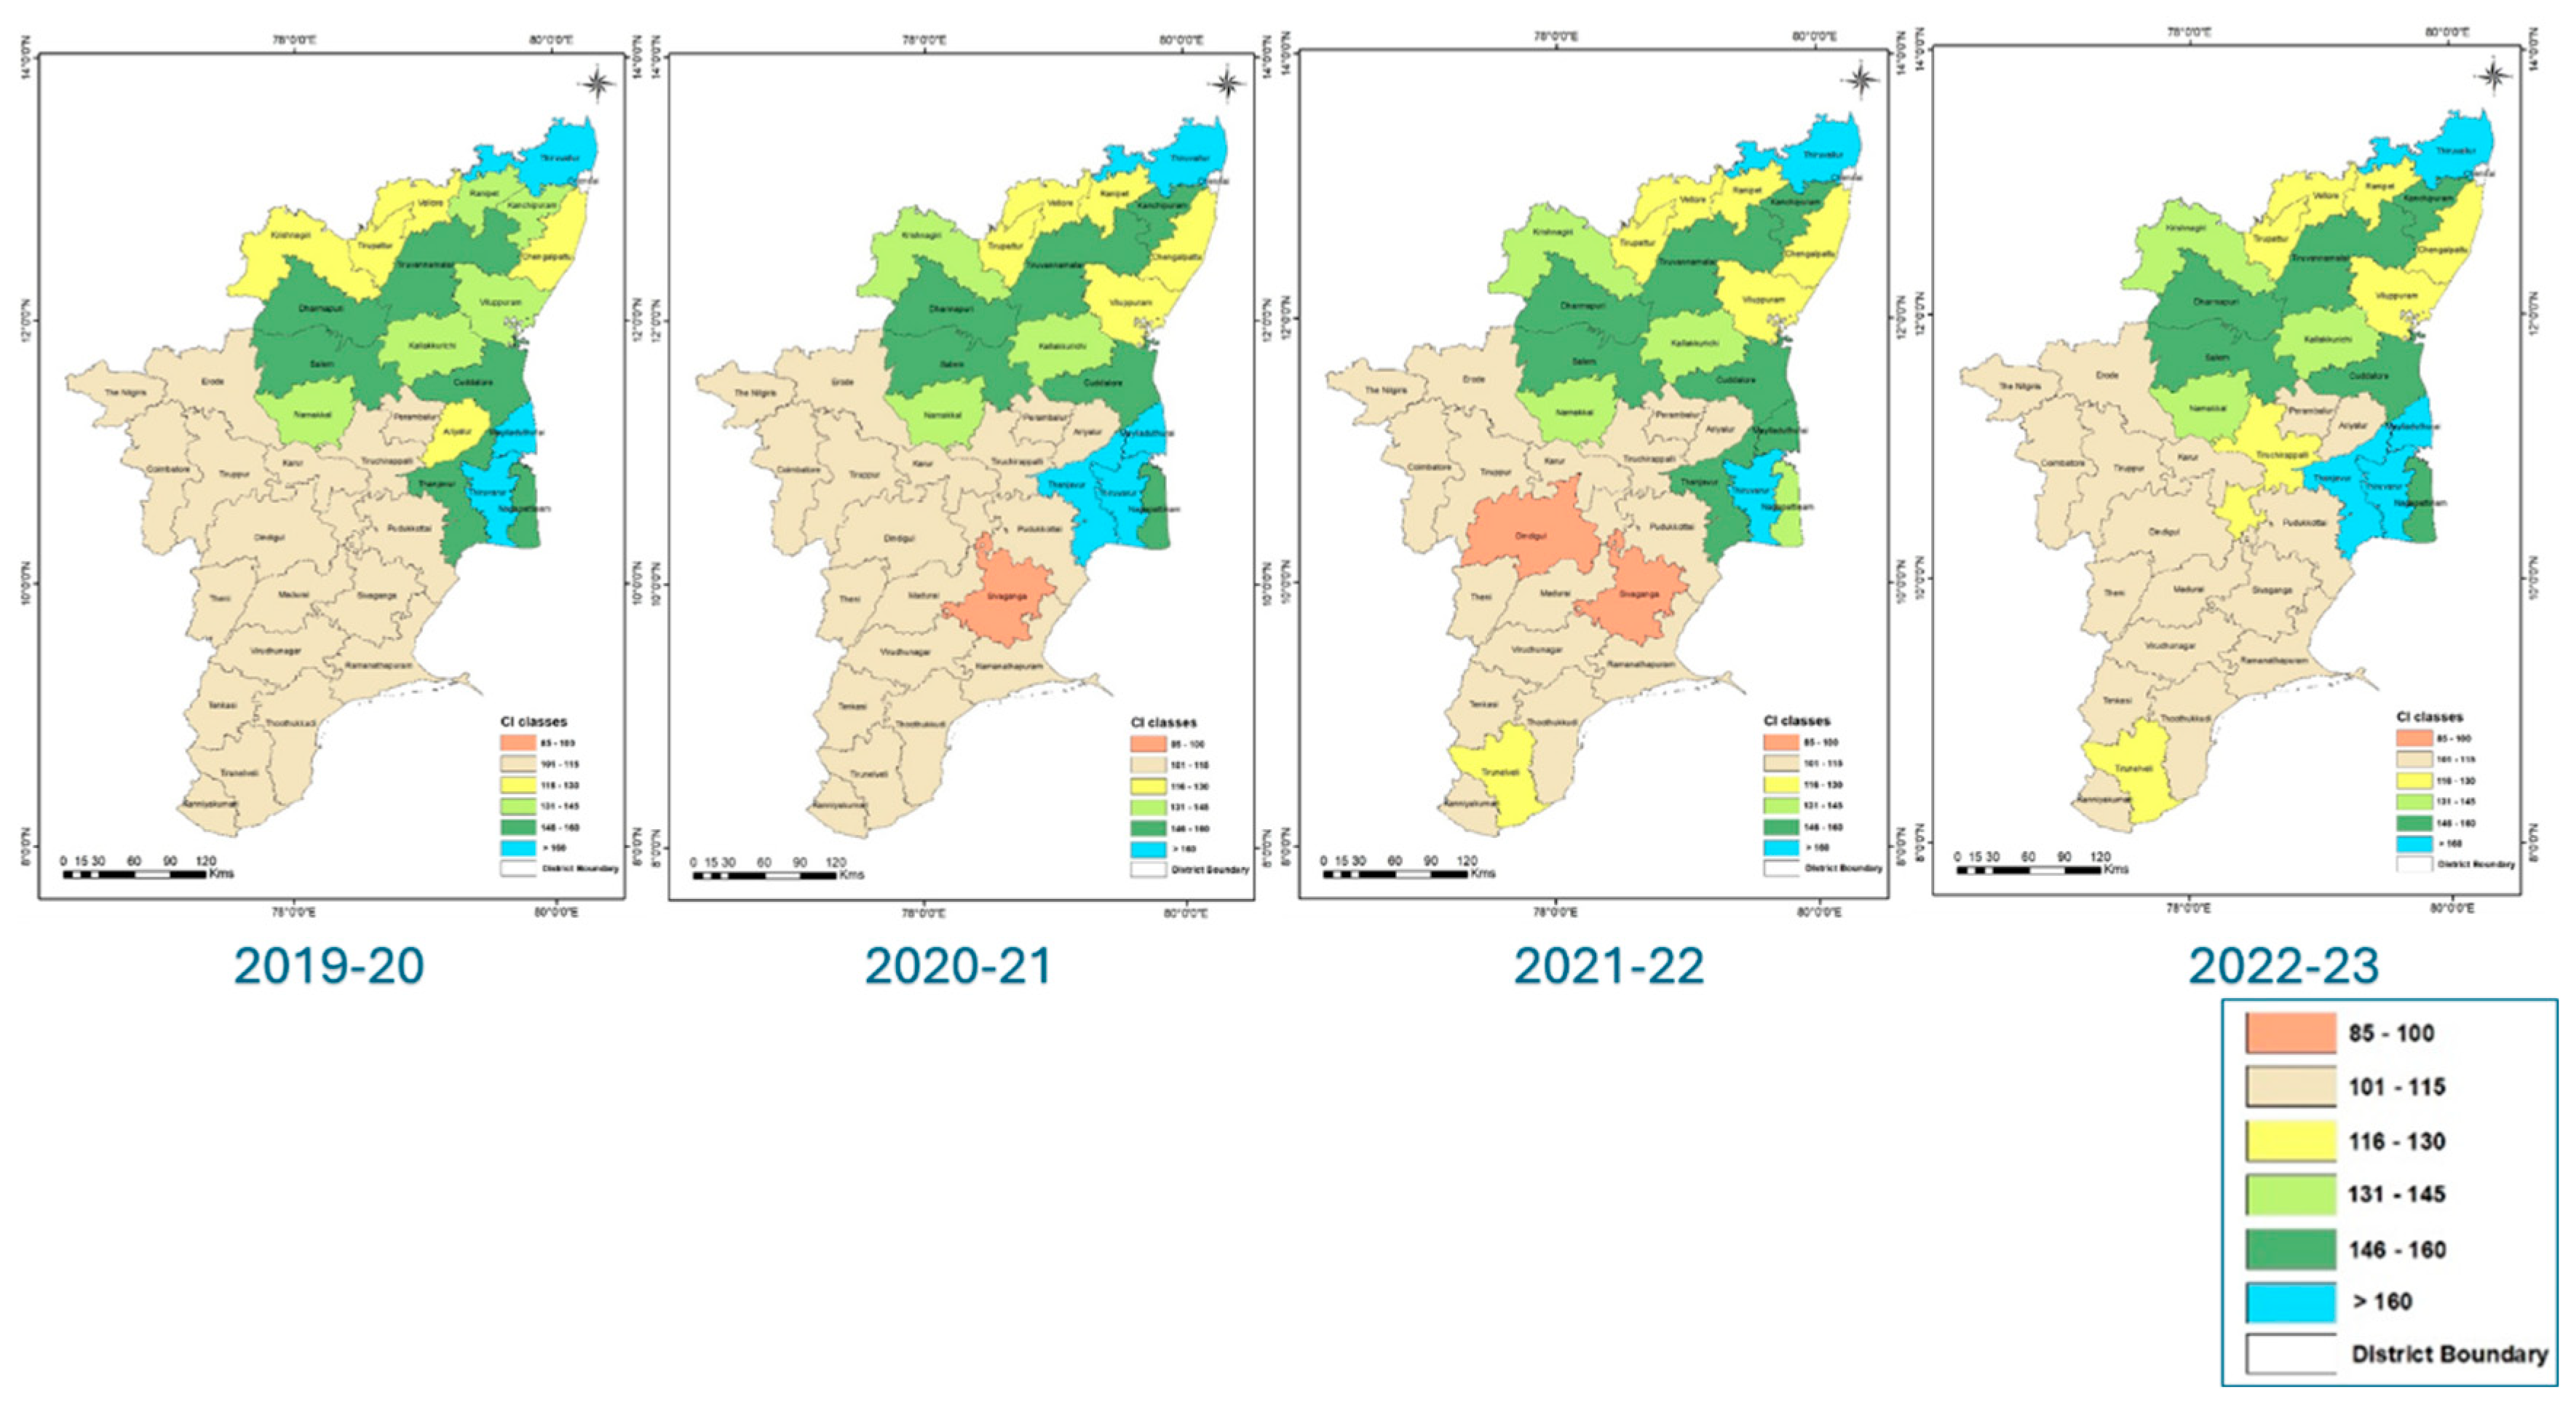
Figure 10.
The spatial distribution maps of the cropping intensity categorized using the Optical data.
Figure 10.
The spatial distribution maps of the cropping intensity categorized using the Optical data.
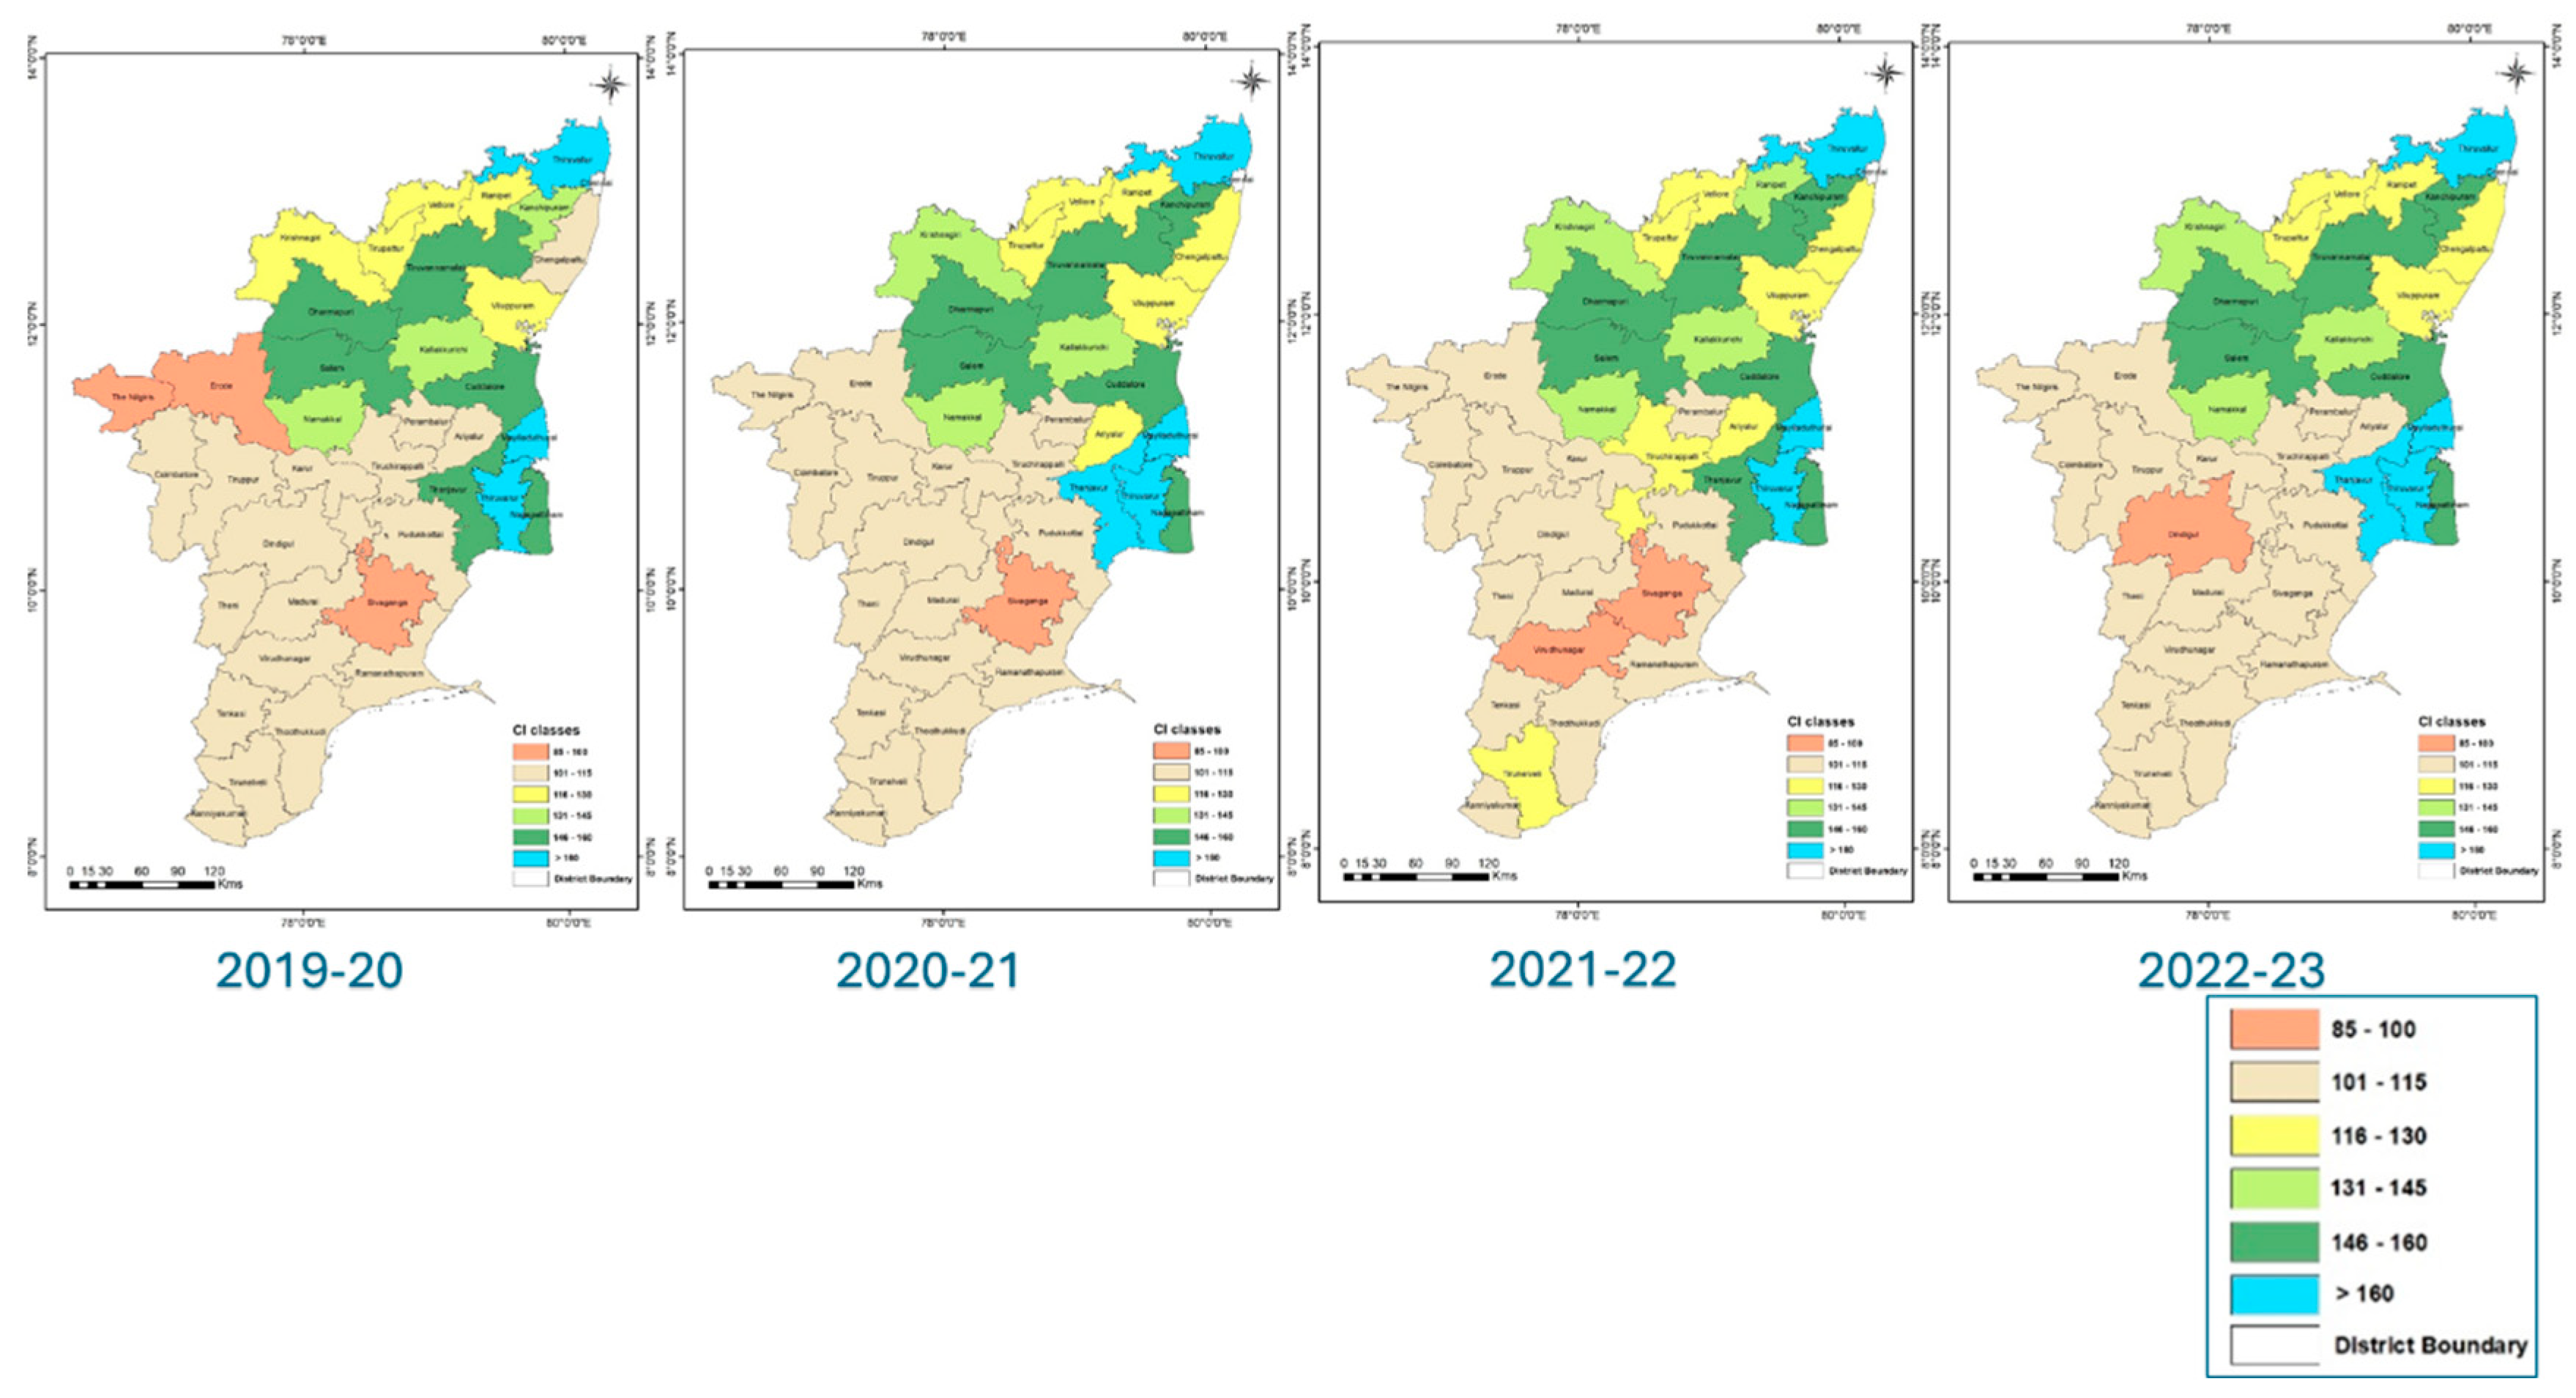

Table 1.
Datasets used for the study.
| Data acquisition | Spatial resolution | Temporal resolution | Time scale | Reference |
|---|---|---|---|---|
| Sentinel 1A | 20 m | 12 days | June 2019 to May 2023 | https://scihub.copernicus.eu/ |
| MOD13Q1 | 250 m | 16 days | June 2019 to May 2023 | https://appeears.earthdatacloud.nasa.gov/ |
Table 2.
Seasonal parameters computed in TIMESAT software.
| S.No. | Parameters |
|---|---|
| 1. | Beginning of season (SoS) |
| 2. | End of season (EoS) |
| 3. | Length of season |
| 4. | Base level |
| 5. | Time of middle of the season |
| 6. | Maximum value |
| 7. | Seasonal amplitude |
| 8. | Rate of decrease at the beginning of the season |
| 9. | Rate of decrease at the end of the season |
| 10. | Large seasonal integral |
| 11. | Small seasonal integral |
| 12. | Value for the start of the season |
| 13. | Value for the end of the season |
Table 3.
Phenological parameters computed from the TIMESAT program.
| Input parameters | Variables | |
|---|---|---|
| Data range | : | 0 to 1 |
| Amplitude value | : | 0 |
| Spike method | : | STL replace |
| STL stiffness value | : | 3 |
| No. of iterations | : | 1 |
| Adaptation strength | : | 1 |
| At the start of the season, the amplitude | : | 0.3 |
| End-of-season amplitude | : | 0.3 |
Table 4.
Consolidated overall statistics of the cropping pattern and intensity estimates of Tamil Nadu were obtained from SAR and optical data.
Table 4.
Consolidated overall statistics of the cropping pattern and intensity estimates of Tamil Nadu were obtained from SAR and optical data.
| Cropping pattern/ intensity estimates | 2019-20 | 2020-21 | 2021-22 | 2022-23 |
|---|---|---|---|---|
| Area (lakh hectares) | ||||
| SAR data (Sentinel 1A) | ||||
| SCA | 21.35 | 22.21 | 22.18 | 22.43 |
| DCA | 13.09 | 13.79 | 13.77 | 13.66 |
| TCA | 7.32 | 7.34 | 7.64 | 7.62 |
| GCA | 52.88 | 54.57 | 55.20 | 55.85 |
| NCA | 41.76 | 43.34 | 43.59 | 43.71 |
| CI (%) | 127 | 126 | 127 | 128 |
| Optical data (MODIS) | ||||
| SCA | 23.44 | 24.40 | 24.71 | 24.93 |
| DCA | 14.55 | 15.15 | 15.29 | 15.38 |
| TCA | 8.40 | 8.62 | 8.58 | 8.50 |
| GCA | 56.87 | 60.71 | 62.03 | 62.07 |
| NCA | 46.39 | 48.17 | 48.58 | 48.81 |
| CI (%) | 123 | 126 | 128 | 127 |
SCA: Single cropped area; DCA: Double cropped area; TCA: Triple cropped area; GCA: Gross cropped area; NCA: Net cropped area and CI: Cropping intensity.
Table 5.
Comparison of estimated gross and net cropped area (L ha) derived from Sentinel 1A and MODIS data.
Table 5.
Comparison of estimated gross and net cropped area (L ha) derived from Sentinel 1A and MODIS data.
| Year | Gross cropped area | Net cropped area | ||||
|---|---|---|---|---|---|---|
| MODIS | Sentinel 1A | Deviation (%) | MODIS | Sentinel 1A | Deviation (%) | |
| 2019 | 56.87 | 52.88 | 7.02 | 46.89 | 41.76 | 9.98 |
| 2020 | 60.71 | 54.57 | 10.11 | 48.17 | 43.34 | 10.03 |
| 2021 | 62.03 | 55.20 | 11.01 | 48.58 | 43.59 | 10.27 |
| 2022 | 62.07 | 55.85 | 10.02 | 48.81 | 43.71 | 10.45 |
Table 6.
Comparison between statistical data and spatially estimated cropped area.
| Year | Government Statistical data | Sentinel 1A | MODIS | |||
|---|---|---|---|---|---|---|
| Area (Lakh hectares) | ||||||
| GCA | NCA | GCA | NCA | GCA | NCA | |
| 2019 | 59.42 | 47.38 | 52.88 (11.01) | 41.76 (11.86) | 56.87 (4.29) | 46.89 (2.09) |
| 2020 | 61.13 | 48.33 | 54.57 (10.74) | 43.34 (10.33) | 60.71 (0.69) | 48.17 (0.34) |
| 2021 | 63.48 | 49.09 | 55.20 (13.04) | 43.59 (11.20) | 62.03 (2.28) | 48.58 (1.04) |
Note: Figures in parentheses indicate the deviation percentage. GCA- Gross cropped area; NCA- Net cropped area.
Disclaimer/Publisher’s Note: The statements, opinions and data contained in all publications are solely those of the individual author(s) and contributor(s) and not of MDPI and/or the editor(s). MDPI and/or the editor(s) disclaim responsibility for any injury to people or property resulting from any ideas, methods, instructions or products referred to in the content. |
© 2024 by the authors. Licensee MDPI, Basel, Switzerland. This article is an open access article distributed under the terms and conditions of the Creative Commons Attribution (CC BY) license (http://creativecommons.org/licenses/by/4.0/).
Copyright: This open access article is published under a Creative Commons CC BY 4.0 license, which permit the free download, distribution, and reuse, provided that the author and preprint are cited in any reuse.


