
Submitted:
29 December 2024
Posted:
31 December 2024
You are already at the latest version
Abstract
The evaluation of long-term rainfall variability and trends in the context of a changing global climate is essential for developing effective adaptation strategies. It is also important to analyze trends using global precipitation products. The objective of the present study was to assess the long-term trends in annual and seasonal rainfall over the Modjo catchment in central Ethiopia by utilizing both observed and satellite precipitation products, CHIRPS and PERSIANN-CDR. The study employed CV and PCI to evaluate the variability and monthly rainfall concentration within the catchment. The Sen Slope Estimator, Mann-Kendall test, and Innovative Trend Analysis were used to assess the trends within the data series. The results indicate that annual and Kiremt rainfall showed low to moderate variability at all stations, whereas the Meher, Bega, and Belg seasons exhibited high variability, with CV values exceeding 30%. The PCI values indicated that the annual rainfall data series exhibited a moderate and irregular distribution, while the seasonal rainfall distribution displayed a highly irregular pattern, with all values exceeding 20. The MK and SSE trend analysis revealed no significant trends (at α = 0.05) in the annual rainfall across all stations; however, significant trend changes were observed in the seasonal rainfall datasets. Additionally, Trend analysis revealed a significant decrease in most Bega season trends (at α = 0.05, α = 0.01), whereas Kiremt and annual seasons showed similar patterns. Conversely, the Meher season showed an increasing trend with no significance at α = 0.05. The ITA shows trends similar to MK and SSE, but with different significance levels. In the analysis, 22% of the data was insignificant, while the rest was significant at a 95% confidence level. The study reveals temporal dynamics in rainfall trends, underscores important implications for climate change adaptation, and offers valuable insights for planning effective adaptation measures.
Keywords:
Climate change
; ITA
; MK trend test
; Precipitation
; Satellite rainfall
; and SSE
1. Introduction
Precipitation is the key component of the hydrological cycle (Aldrees et al., 2023; Saha, 2015) and is a commonly used variable for climate change studies, and even a minor alteration in rainfall could lead to severe and devastating effects on both society, environment and the economy. Rainfall plays a critical role in many environmental and human domains; it is essential to maintaining food security (Affoh et al., 2022; Kinda & Badolo, 2019), controlling land management (Bedane et al., 2022), supporting biodiversity (Muluneh, 2021) and livestock production (Leweri et al., 2021), promoting water supply services (Twisa & Buchroithner, 2019), hydropower generation (Wei et al., 2020), regional flooding (Cheng et al., 2021) and having a substantial influence overall country’s economic growth (Kotz et al., 2022). This confirms that it is a distinctive force that shapes the delicate balance of life on our planet. On the other hand, a variety of types of evidence regarding rainfall trends have come to light recently, revealing the dynamic variability of rainfall patterns (Gedefaw et al., 2018). It is widely accepted that recent climate change has altered annual and seasonal patterns of rainfall along with its spatial distribution (Banerjee et al., 2020). Climate change is currently affecting its amount, frequency, and intensity of rainfall, which results unpredictable flood and longer lasting drought.
Climate change (CC) is an inter-governmental complex challenge globally with its influence over various components of the ecological, environmental, socio-political, and socioeconomic disciplines (Abbass et al., 2022). It is anticipated to increase seasonal variability and uncertainty concerning water availability as well as quantity in nearly all regions (UNESCO & UN-Water, 2020). Sub-Saharan Africa is particularly susceptible to climate change due to the existing environmental conditions, least diversified and poor rural economies, and underdeveloped (but important in the macro-economy) agriculture (Yalew et al., 2018). Flooding and drought are responsible for 80% of disaster-related deaths and 70% of the economic damages in Sub-Saharan Africa (Case & Baylie, 2022). Specifically, the East African region continues to suffer from sustained water insecurity and climate variability over the past decades which have led to massive changes in water levels for sustainable livelihoods. On-going conflicts, widespread poverty, and food insecurity in the region result in a high vulnerability and low coping capacity concerning drought and natural hazards in general (GDO 2022). Ethiopia is a typical example in this regard. The country is susceptible to frequent rainfall variability which has caused significant adverse effects on the country’s economy and society and is expected to become more pronounced in the future under climate change (You & Ringler, 2013). The country follows a rainfall-based agricultural production that is susceptible to the impacts of climate change and risk (Sinore & Wang, 2024). Understanding the trends and future prediction is highly helpful for several reasons, including evaluating the effects of climate change, mitigating risks, and predicting its effects.
Rainfall trends refer to the long-term patterns and changes in precipitation over a specific region or globally (Kumar et al., 2023). Trend analysis is the best technique to study the impacts of climate change to recognize future fluctuations in hydrometeorological elements for risk management, flood and drought monitoring, and water resource planning, design, and management (Jakob & Walland, 2016; Pawar et al., 2023). Rainfall trend analysis can be performed using various methods and techniques. One approach involves employing statistical tests such as the Mann-Kendall (MK) test, Sun Slope, and innovative trend analysis over a specific period. Many researchers used the innovative trend analysis method to analyze the time series data together with the MK method (Gedefaw et al., 2018). These tests help in detecting abrupt change points and determining the direction and significance of the trend in rainfall patterns. Furthermore, spatial-temporal trend analysis can be conducted using geostatistical techniques in an ArcGIS environment, which allows for the mapping of rainfall trend patterns across a specific region or country. These methods and tools enable researchers and meteorologists to gain valuable insights into the changing patterns of rainfall, which is essential for understanding climate variability. However, accurately observing precipitation poses another challenge in numerous parts of the world due to limited gauging stations and their unpredictable variations and incomplete data products.
Obtaining and analyzing precipitation measurements is crucial for comprehending changes in climate patterns and water cycles, enhancing precipitation forecasts, and efficiently managing the Earth's valuable freshwater resources. The latest advancements in remote sensing technology have made it possible to gather previously unprecedented data on precipitation, marking a substantial advancement in the mapping of global precipitation. A multitude of satellite observations yields regional and global precipitation datasets with the different spatial and temporal resolution, including the Precipitation Estimation from Remotely Sensed Information using Artificial Neural Network (PERSIANN-CDR) (Ashouri et al., 2015), Tropical Rainfall Measuring Mission (TRMM) (Kummerow et al., 1998), Climate Prediction Centre Morphing product (CMORPH) (Joyce et al., 2004), Multi-satellite Precipitation Analysis (TMPA) (Huffman et al., 2007), Multi-source Weighted Ensemble Precipitation (MSWEP) (Beck et al., 2017), Integrated Multi-satellite Retrievals for the Global Precipitation Measurement (GPM) mission (IMERG) (Huffman et al., 2019), Climate Hazard Group Infrared Precipitation with Stations (CHIRPS) (Funk et al., 2015), and others. The main objective of the present study is to assess the Long-term spatiotemporal annual and seasonal rainfall trend using observed and satellite precipitation products over the Modjo catchment an area heavily influenced by agricultural activity and highly sensitive to rainfall variability. After conducting some investigations, two precipitation products, namely CHIRPS and PERSIANN-CDR, have been taken into consideration with three station observed precipitation data. These products have demonstrated relatively high efficiency in other catchments in Ethiopia (Adane et al., 2021; Dubache et al., 2021; Gebere et al., 2015; Gebretsadkan et al., 2023). The study gives significant insights regarding the distribution and trend of observed and gridded satellite precipitation data series throughout the catchment.
2. Datasets and Methods
2.1. Study Area Description
The study was carried out in the Modjo catchment of the Awash River basin. This region is located in the central part of Ethiopia, with geographic coordinates extending from 8°20′ to 9°25′ N latitude and 38°30′ to 39°45′ E longitude, and it is part of the Awash River basin as shown in Figure 1. The area coverage is approximately 1193.66 square kilometers. The elevation of the region belongs between 1764 and 3091m. The district receives an average annual rainfall of 671 mm, ranging from 497 mm to a maximum of 1300 mm. The catchment is characterized by undulating topography, deep and wide valleys of small streams, and narrow flat lands in the southern part caused by poor land-use practices, soil erosion, and deposition processes. The Modjo River catchment area plays a vital role in the hydrology of the larger Awash River basin, influencing both the local ecosystems and agricultural activities. This region experiences a subtropical highland climate, marked by distinct wet and dry seasons, which greatly affects the availability of water and the patterns of land use. The area is primarily composed of agricultural land, which is essential for the local economy and supports the livelihoods of many residents through extensive crop cultivation. The typical minimum and maximum monthly temperatures in this area vary from 9.42 °C to 19.16 °C and from 27.15 °C to 34.16 °C, respectively. The dominant soil types in the watershed include Eutric cambisol, Eutric nitosol, and Pellic vertisol.
2.2. Datasets
There are two main data products used in this study: multi-temporal ground station data and global gridded satellite precipitation data sets over the years 1985 to 2020 (Table 1). Satellite imagery is highly effective for capturing and detailing the various geospatial patterns present on the Earth's surface (Regassa et al., 2020). The GEE software was employed to download the global precipitation datasets CHIRPS and PERSIANN-CDR. The CHIRPS dataset is a quasi-global rainfall compilation that spans over 30 years, integrating 0.05-degree resolution satellite imagery with in-situ station data to generate gridded rainfall time series (Funk et al., 2015). PERSIANN-CDR is a daily quasi-global precipitation dataset that covers the timeframe from 1982 to the present, typically experiencing a three-month lag. It offers coverage between 60 degrees South and 60 degrees North latitude, as well as from 0 to 360 degrees longitude, with a spatial resolution of 0.25 degrees (Ashouri et al., 2015). The annual, seasonal, and monthly gridded rainfall products were obtained from the GEE platform using the (ee.ImageCollection) algorithm and a filter command (ee.Filter.calendarRange) to cover the study period from 1985 to 2020. The images (.sum) were utilized to generate the gridded rainfall datasets. To align the spatial information with station data, the nearest pixel rainfall values from both the CHIRPS and PERSIANN-CDR gridded datasets were extracted for the locations of the stations using the GEE platform. The data collected at the stations has undergone quality control and has been consistently located for the past forty years by the National Meteorological Services Agency (NMSA) of Ethiopia. Consequently, the primary considerations in selecting the data were (i) the availability of both recent and long-term datasets, and (ii) a minimal number of data gaps. To mitigate biases in the trend analysis caused by missing data, the study limited the analysis to the period from 1985 to 2020. Ultimately, monthly and annual rainfall data were gathered from three stations: Chefe Donsa, Ejere, and Modjo covering the years 1985 to 2020 from the NMAE.
This research delves into the spatiotemporal trends of precipitation in the Modjo catchment area of Ethiopia, analyzing annual and seasonal variations using observed rainfall data alongside two gridded precipitation datasets. The study examines four distinct seasons: Kiremt, which spans from June to August; Meher, occurring from September to November; Bega, lasting from December to February; and Belg, which takes place from March to May. The same seasonal classification was adopted across different studies (Gedefaw et al., 2018; Worku et al., 2022, 2023). The study employed the ITA, Mann-Kendall, and Sen-slope methods, which together create a robust framework for examining shifts in precipitation patterns. Utilizing Sen's slope estimator in conjunction with the Mann-Kendall test proves invaluable in climate research, allowing us to detect meaningful changes in rainfall over time. These insights are crucial for effective water resource management and the development of climate adaptation strategies. The study rigorously assessed both annual and seasonal trends across three distinct precipitation datasets, ensuring a thorough analysis executed using R Studio software. R software-based methodology is consistent with similar investigations conducted in various regions, underscoring the critical role of such analyses in enhancing water resource management and adapting to climate variability (Chisanga et al., 2023; Seneshaw et al., 2021; Tegegn et al., 2024). The following figure (Figure 2) summarizes the methodology and procedure for the study.
2.3. Variability Assessment
2.3.1. Coefficient of Variation
CV is a statistical measure of the difference between the data points and the mean value of a series (Achite et al., 2021). The coefficients of variation were calculated for both the annual and seasonal series, specifically for rainfall data from all relevant stations and for river runoff at the Modjo station catchment outlet. This analysis provides valuable insights into the variability of precipitation and stream flow, which are essential for understanding hydrological changes associated with climate variability Greater values of CV indicate larger variability and vice versa. The following equation (Eq.(1)) was used for the calculation of the annual CV.
CV represents the coefficient of variation, while σ denotes the standard deviation of annual precipitation, and X signifies the mean of annual precipitation. The coefficient of variation is categorized as follows: a value below 20% is considered less variable, a value between 20% and 30% is regarded as moderately variable, and a value exceeding 30% is classified as highly variable (Bekele et al., 2017).
2.3.2. Precipitation Concentration Index
The Precipitation Concentration Index (PCI) is a powerful metric used to assess the distribution and variability of precipitation within a specific timeframe (Gerardo, 2024; Salameh, 2024). It helps to understand how concentrated or dispersed rainfall is during different seasons. PCI is a valuable indicator for analyzing temporal precipitation distribution and assessing seasonal precipitation changes and a valuable tool in climatology and hydrology for evaluating precipitation patterns and their implications. The value of PCI was calculated using the following equation (Eq.(2)) (De Luis et al., 2011).
Where Pi represents the rainfall in a given month, and n is the total number of months. A higher PCI indicates a more concentrated rainfall pattern, meaning that most of the precipitation occurs in a few months (Zhang et al., 2019). A lower PCI suggests a uniform distribution of rainfall throughout the year
2.4. Trend Analysis
2.4.1. Mann-Kendall Test
Mann-Kendall (MK) test (Kendall, 1948; Mann, 1945) is a nonparametric test that detects monotonic trends in time series data (Mugabe et al., 2024). The MK test is commonly used to identify trends in time series analysis due to its insensitivity to outliers and does not consider any distribution assumptions (Simeon et al., 2024). The MK test is strongly advised for widespread application by the World Meteorological Organization (Sahilu et al., 2024). The MK trend test relies on the relationship between the ranks and the order of a time series. For a specific time series {Xi, i = 1, 2, ..., n}, the null hypothesis H0 posits that the data is distributed independently, while the alternative hypothesis H1 suggests that a monotonic trend is present. The test statistic S is defined as follows (Eq.(3)) (F. Wang et al., 2020):
Where sgn represents the sign function, X denotes the rainfall data values, and n refers to the total count of observations in the time series (Sudarsan & Lasitha, 2023). The data values of each Xi are used as a reference point to compare with the data values of Xj, which is given as (Eq. (4)):
It has been noted that when n is equal to or exceeds eight, the statistic S generally tends to conform to a normal distribution with a defined mean. The mean value of S is E[S] = zero. The Var (S) of S is given by (Eq. (5)) (Mondal et al., 2012):
Where Ti represents the count of data points within the tied group, and m denotes the total number of groups of tied ranks. The standardized test statistic Z is calculated using the following method (Eq. (6)) (Kessabi et al., 2022):
In a two-tailed test, the null hypothesis of ‘no trend’ should be accepted at α significance level for − Z1− α/2 ≤ Z ≤ Z1− α/2, where Z1− α/2 is the standard score (Z score) of the standard normal distribution with the cumulative probability of 1 − α/2. Otherwise, the null hypothesis should be rejected and a monotonic trend has been identified at α significance level. Hence, the positive and negative values of Z show an upward and downward trend, respectively (Edo et al., 2021).
2.4.2. Sen’s Slope Estimator (SSE) Test
The Sen's slope estimator is a non-parametric technique utilized to evaluate trends in time series data, especially valuable in climatology for examining rainfall trends. This nonparametric approach provides a reliable estimation of the trend in the time series and is employed to determine the magnitude of trends in rainfall data (Markos et al., 2023). The trend magnitude is calculated by slope estimator methods (Eq. (7)) (Muia V. K et al., 2024).
Yj and Yi are data values at time j and i (j > i), respectively. If there is only one datum in each period, then N = n(n-1)/ 2, where n is the number of periods. If there are multiple observations in one or more periods, then N < (n (n-1))/2. The N values of Qi are ranked in ascending order, and the median of slope or Sen’s slope estimator is given as (Eq. (8)) (Gocic & Trajkovic, 2013):
Finally, Qmed has been calculated to obtain the trend and slope magnitude with the help of a non-parametric model. When Qi is positive, it implies that there is an increasing trend, while the negative value of Qi reveals a decreasing or downward trend in time series analysis. Similarly, a zero value represents no trend in the data (Aswad et al., 2020). The unit of resultant Qi would be the magnitude of slope in original units per year or percent per year.
2.4.3. Innovative Trend Analysis
The ITA method, proposed by Sen (2012) divides any given hydrometeorological time series into two halves and then sorts both sub-series in ascending order (Y. Wang et al., 2019). The data should be divided into two subs before performing the ITA to any specific time series. Both segments are arranged in ascending order and presented on the X- and Y-axis. The first segment is presented on the horizontal axis (x-axis) while the second segment is presented on the vertical axis (y-axis) in the Cartesian coordinate system (Benzater et al., 2024). The data for each sub-series is then sorted ascending (or descending). Furthermore, the diagram is split into two separate triangles by the 1:1 (45°) axis of no trend which indicates the increasing (area above 1:1 line) and decreasing (area below 1:1 line) time-series data trend (Pastagia & Mehta, 2022). The trend indicator was identified as (Eq. (9)):
Where ɸ = trend indicator, n = number of observations in the subseries, Xi = data series in the first half subseries class, Xj = data series in the second half subseries class, and µ = mean of data series in the first half subseries class. A positive value indicates an increasing trend (Das et al., 2021). A negative value indicates a decreasing trend. However, when the scatter points closest around the 1:1 straight line, it implies the non-existence of a significant trend (Benzater et al., 2021). The following figure (Figure 3) gives more information for the understanding and interpretation of the innovative trend analysis method.
3. Results and Discussions
3.1. Rainfall Pattern Distribution
The precipitation data sourced from the National Meteorological Service Agency, along with gridded data obtained via Google Earth Engine, underwent a comprehensive technical verification to ensure data integrity before analysis. This study employed strict quality control measures, which included the identification and manual correction of potential outliers, such as negative values or those surpassing maximum allowable thresholds, and accurately addressing any missing rainfall data. The analysis indicated that the lowest annual rainfall was recorded in 2002 for the observed data and in 2015 for both the CHIRPS and PERSIANN-CDR datasets. Conversely, the highest rainfall occurred in 2016 for the observed data, in 1998 for CHIRPS, and in 2005 for PERSIANN-CDR. The distribution of total annual rainfall is depicted in Figure 4, offering a detailed overview of the results.
3.2. Rainfall Variability and Concentration
The distribution and variability of precipitation were analyzed using the Precipitation Concentration Index (PCI) and the Coefficient of Variation (CV) across all stations and seasons. The CV indicated that annual and Kiremt season precipitation showed low to moderate variability at all stations. In contrast, the Meher, Bega, and Belg seasons exhibited high variability, with CV values exceeding 30%. The observed precipitation datasets demonstrated greater variability compared to the CHIRPS and PERSIANN-CDR values, which were classified as moderate for the annual and Kiremt seasons, except at the Chefe Donsa station, where values fell below 20%. For CHIRPS and PERSIANN-CDR, all CV values were categorized as low variability during the Kiremt and annual periods across all stations. This suggests that while CHIRPS and PERCIANN-CDR may provide stable data during certain periods. However, the other seasons recorded CV values above 30% at all stations and precipitation products, indicating significant variability. The PCI serves as a significant measure for understanding the distribution of precipitation over time, where higher values reflect a greater concentration of monthly precipitation throughout the year (Salameh, 2024). The results concerning the Precipitation Concentration Index (PCI) revealed that the catchment experienced moderate, irregular, and highly irregular rainfall distribution. Only the annual precipitation data from the PERSIANN-CDR exhibited a moderate monthly distribution, with values ranging from 10 to 16. In contrast, the annual data series for both observed and gridded precipitation products showed irregular monthly rainfall concentration, with values between 16 and 20. Additionally, the seasonal rainfall patterns displayed a strongly irregular distribution across all stations. This variable and strongly irregular rainfall leads to unpredictable water availability, influencing agriculture and natural water systems. This irregularity increases the risk of flooding and drought, posing challenges for water management, affecting crop yields, and complicating water resource allocation. All the values are summarized in the following table (Table 2).
3.3. Trend Analysis
3.3.1. Mann-Kendall and Sen Slope Estimator
The value of Z statistics and sun slope indicated the results trend for all stations and seasons. Positive values for MK tau, S, Z, and Sen’s slope indicate an increasing trend. Conversely, negative values for these statistics imply a decreasing trend. The results from the analysis using observed precipitation datasets indicate that most seasons exhibit increasing trends. At the Ejere station, the rainfall trend shows an increasing pattern in all seasons except for the Bega season, which experienced a decreasing trend with Z and Sen’s slope values of -5.1 and -1.065, respectively. The trends for the annual, Kiremt, and Bega seasons at Ejere were significant, with confidence intervals of 95% and 99%, respectively. In contrast, the Chefe Donsa station primarily displayed decreasing trends, with only the Kiremt and Belg seasons showing increasing trends, reflected by Z and Sen’s slope values of 0.858 and 0.074, and 0.101 and 0.009, respectively. Only the trend in the Bega season at this station was significant, with a confidence interval of 99%. At the Modjo station, all seasons demonstrated increasing trends except for Bega, which highlighted a decreasing trend with Z and Sen’s slope values of -0.726 and -0.113, respectively, but without statistical significance. Both the annual and Kiremt seasons showed significant trends at the 95% confidence level.
The PERCIANN CDR Precipitation data exhibited distinct trend distributions compared to the observed and CHIRPS datasets, showing similar phenomena across all stations. Analysis revealed a general decreasing trend at all stations, except during the Meher season, which demonstrated an increasing trend with Z and Sen's slope values of 0.069 and 0.009 at Chefe Donsa, 0.068 and 0.009 at Modjo, and 0.367 and 0.044 at Ejere. Only the results from Modjo and Ejere stations during the Bega season were statistically significant, while other trends lacked significance. In contrast, CHIRPS rainfall data indicated varied trends, with consistent results in the Bega season across all stations, reflecting a significant decreasing trend with Z and Sen's slope values of -2.765 and -0.792 at Chefe Donsa, -2.05 and -0.733 at Modjo, and -2.301 and -0.835 at Ejere. The majority of trends observed during the Bega (dry) season exhibited a significant decreasing trend, likely due to the impacts of climate change and altered precipitation patterns in the catchment. The annual and Kiremt season rainfall trends showed an increasing trend at Chefe Donsa but decreasing trends at Modjo and Ejere, all without statistical significance. Both the Meher and Belg seasons exhibited increasing trends at each station. Similar to other precipitation datasets, only the trend during the Bega season demonstrated significance, while no significant trends were observed at the other stations indicating a potential shift in seasonal weather.
The analysis revealed that the most consistent outcome trend was observed during the Bega season. Across all analyses encompassing all stations and types of precipitation, the rainfall trend for the Bega season exhibited a decreasing trend. Notably, only the trend derived from observed precipitation data at the Modjo station did not show significance, while all other analyses indicated a significant decreasing trend. In contrast, no significant trends were observed for the Meher and Belg seasons. Additionally, except for the analysis using observed precipitation, all other trends during the Kiremt season also demonstrated a decreasing trend. The trends for the annual and Kiremt seasons were nearly identical, differing only in the analysis at the Modjo station when using observed precipitation data. The trends in annual rainfall and Kiremt (rainy) season rainfall frequently align because the Kiremt season usually contributes a substantial share of the total annual rainfall in the areas where it takes place. Studies have shown that understanding the dynamics of the Kiremt season can provide valuable insights into predicting annual rainfall trends, as the two are closely linked through the region's climatic systems and hydrological cycles (Ademe et al., 2020; Bewket et al., 2024; Feleke & Abera, 2020; Weldesenbet, 2019). Overall, most annual precipitation analyses indicated a decreasing trend, although without statistical significance. This suggests that there are more abrupt changes occurring in seasonal precipitation patterns compared to annual trends. The analysis of seasonal and annual rainfall trend values, including Sen’s slope, MK tau, the calculated Z-value, and ITA s, along with their corresponding trend detection values for all stations and precipitation datasets, is summarized in the following table (Table 3).
The ITA method is a robust statistical approach designed to identify and quantify trends in time series data, particularly in the context of environmental and climatic studies. By employing this method, the study aims to uncover significant patterns in seasonal and annual rainfall trends across various stations and compare the results with those obtained from the Mann-Kendall (MK/mMK) and Sen’s Slope Estimator (SSE) trend values. The results of the Innovative Trend Analysis (ITA) for all rainfall datasets at each station are presented with a 95% confidence level. According to the ITA methodology, when the slope value is situated between the defined lower and upper limits, it indicates that there is no significant trend present (Alifujiang et al., 2021; Esit, 2023; Sanusi et al., 2021). This suggests that the data does not show a reliable increase or decrease over time, reflecting a stable pattern of rainfall at the stations being analyzed. The graphical representations for all datasets and stations are shown in Figure 4, Figure 5 and Figure 6. A bisector line at a 1:1 ratio divides the graph into two equal triangles. When data points align with the 1:1 line, it indicates no trend in the data. If the data points are located in the upper triangle, this suggests an increasing trend. Most of the ITA findings align closely with the results from the Mann-Kendall (MK) and Sen's Slope Estimator (SSE), although discrepancies were noted in certain analyses, such as the Bega season of observed data at the Modjo station and the Belg season of CHIRPS data at Chefe Donsa, among others. Additionally, significant differences in values across all methods were observed, a finding also noted in a study by (Aswad et al., 2020; Gedefaw et al., 2018). The graphical representations for each analysis reveal that there are both increasing and decreasing data points, which are positioned both above and below the trend lines. The ITA slopes indicate that most of the analysis using each dataset across all stations show statistical significance at the 95% confidence level except for the majority of results from the PERSIANN-CDR dataset. In the ITA analysis, 22% of the data showed insignificance, while the remaining data exhibited significance at a 95% confidence level. Specifically, the PERSIANN results for the following stations and seasons show no significant trends: Chefe Donsa Annual, Chefe Donsa Kiremt, Chefe Donsa Bega, Ejere Meher, Ejere Belg, Mojo Annual, Mojo Meher, Mojo Belg, Mojo Bega, and Mojo Kiremt. This suggests that the PERSIANN-CDR data may not consistently reflect significant trends across these specific datasets. Overall, the trends identified were found to be insignificant in the Mann-Kendall (MK) and Sen's Slope Estimator (SSE) methods, while several significant trends were detected using the Innovative Trend Analysis (ITA). However, some analyses revealed significant increasing or decreasing trends in both the MK and SSE methods as well. The present study analyzing long-term rainfall data reveals significant shifts in seasonal rainfall distribution.
3.4. Comparison with other studies
The findings of a study should be compared with other studies, especially those conducted within the same basins and under similar geo-environmental conditions. In the present study, the assessment of distribution and variability revealed that the annual and Kiremt rainfall data series exhibited low variability and moderate precipitation concentration, while the other seasons displayed high variability and strong monthly concentration. This finding aligns closely with the results of various other studies (Abebe et al., 2022; Abegaz, 2020; Dawit et al., 2019; Leta & Author, 2023). The study reveals that the majority of trends observed during the Bega season exhibited a significant decreasing trend. This finding is further supported by various studies conducted across Ethiopia (Birara et al., 2018; Hailu et al., 2024). One of the other significant findings of the study is the increasing trend in the Meher season (September, October, and November) observed across all stations. This finding is further supported by various studies conducted in different regions of Ethiopia, including the Awash River basin (Kerebo et al., 2024; Mulugeta et al., 2019; Shigute et al., 2023; Temam et al., 2019). The study indicates that the trends observed during the Kiremt and annual seasons are largely similar, a finding that is evident across each dataset. This similarity may be attributed to the fact that the Kiremt rainy season is the primary contributor to the annual rainfall totals. These results also align well with other similar studies (Moshe & Beza, 2024)(Belay et al., 2021). Despite some discrepancies, the results from the datasets utilizing gridded precipitation products generally demonstrate a degree of agreement with the observed precipitation data in trend prediction (Ahmad et al., 2023; Okirya & Du Plessis, 2024; Perera et al., 2022). These findings are consistent with studies that have conducted trend analyses using both satellite and ground observation data. From all datasets, the PERSIANN-CDR data series demonstrated a decreasing trend across all periods, except at the Bega station. This observation is consistent with findings from other studies (Sobral et al., 2020). This consistent finding of the study, which aligns with research conducted in other catchments regarding rainfall variability and trends, suggests that similar patterns of rainfall behavior may be prevalent across different regions. This reinforces the importance of understanding local climatic conditions and their implications for water resource management and agricultural practices.
3.5. Implications for climate change adaptation
Assessing rainfall trends and variability is crucial for understanding the impacts of climate change and developing effective adaptation strategies. Based on the three data series, the Modjo catchment has experienced substantial irregularity in concentration and dynamics, with the exception of the annual and Kiremt seasons. Additionally, there are varied trend phenomena observed across the catchment, excluding the trends in the Bega and Meher seasons. The findings indicate that the catchment experiences significant variability and irregular monthly precipitation distribution during the Meher, Bega, and Belg seasons, contrasting with the more stable patterns observed in the Annual and Kiremt seasons. This variability poses challenges for water resource management and agricultural planning, as it can lead to unpredictable water availability, affecting crop yields and ecosystem health. Varied trends across the Modjo catchment highlight the diverse impacts of climate change, creating uneven vulnerabilities among regions. Some areas may face increased flood risks due to rising rainfall, while others could struggle with drought and water scarcity. The study consistently reveals that the majority of trends observed during the Bega (dry) season exhibited a significant decreasing trend, which has unique implications for agricultural sustainability and water resource management in affected regions. This decline in rainfall during a typically dry period could exacerbate water scarcity, leading to increased stress on crops and livestock that rely on limited moisture availability. As farmers face the challenges of reduced precipitation, there may be a heightened risk of crop failure and food insecurity, necessitating urgent adaptations in farming practices and water conservation strategies. Additionally, this trend may indicate broader climatic shifts, prompting policymakers to prioritize resilience-building measures to mitigate the adverse effects of prolonged dry spells on both the environment and local economies. The observed increasing trend in the Meher season across all stations has a unique implication for regional water resource management and ecosystem health in the context of climate change. This increase in rainfall during the Meher season could lead to enhanced water availability for various uses, such as domestic consumption, industry, and ecosystem maintenance. However, it also necessitates a reevaluation of water management strategies to ensure that the increased runoff does not lead to flooding or erosion, which could disrupt local habitats and infrastructure. Therefore, it is essential to consider these implications, as they are crucial for developing effective climate change adaptation strategies.
4. Conclusion and recommendation for future works
This research aimed to evaluate the long-term patterns of yearly and seasonal precipitation in the Modjo catchment area of central Ethiopia by employing both observed data and satellite-derived precipitation products, namely CHIRPS and PERSIANN-CDR. The study employed the coefficient of variation (CV) and Precipitation Concentration Index (PCI) to evaluate the variability and monthly rainfall concentration within the catchment. The Sen Slope Estimator, Mann-Kendall test, and Innovative Trend Analysis were employed to evaluate the trends present in the dataset. The findings reveal that both annual and Kiremt (June to August) rainfall exhibited low to moderate variability across all monitoring stations. In contrast, the Meher (September to November), Bega (December to February), and Belg (March to May) seasons demonstrated high variability, with Coefficient of Variation (CV) values surpassing 30%. The Precipitation Concentration Index (PCI) values suggested that the annual rainfall data series had a moderate and irregular distribution, while the seasonal rainfall distribution was characterized by a highly irregular pattern, with all values exceeding 20. The trend analysis indicated no significant trends (at α = 0.05) in annual rainfall across all stations; however, notable trend changes were detected in the seasonal rainfall datasets. The PERSIANN-CDR rainfall data generally exhibited a decreasing trend across the stations, except during the Meher season, which showed an increasing trend (significant at the Modjo and Ejere stations). The CHIRPS data indicated a consistent and significant decreasing trend during the Bega season across all stations. The trends for annual and Kiremt rainfall were mixed and not statistically significant. The Meher and Belg seasons displayed increasing trends, though without statistical significance across the stations. Furthermore, the trend analysis highlighted a significant decrease in most Bega season trends (at α = 0.05, α = 0.01), while the Kiremt and annual seasons exhibited similar patterns. Conversely, the Meher season demonstrated an increasing trend. The ITA trend test uses a 1:1 bisector line to identify data trends. Most ITA findings align with MK and SSE results, though some seasonal discrepancies exist. Most analyses are significant at the 95% confidence level, except for many PERSIANN-CDR results, which show no significant trends. Overall, ITA identified several significant trends, while MK and SSE mostly indicated insignificant trends. The findings of this study demonstrate a moderate variability and concentration in annual rainfall, coupled with high and very high variability in seasonal rainfall patterns. Furthermore, a significant trend of both increases and decreases was observed, which carries profound implications for climate change adaptation. It is imperative for relevant stakeholders to consider the results of this study, conduct further investigations, and implement effective adaptation strategies to address the potential adverse implications.
Funding
This research received no external funding.
CRediT Authorship Contribution Statement
Bereket Abera Bedada: Conceptualization, original draft writing, review and editing, visualization, software development, methodology, data analysis, and data curation. Wakjira Takakla Dibaba: Conceptualization, review & editing, Analyzed and interpreted, Supervision and Validation.
Declaration of Interests
None
Availability of Data and Materials
The data that support the findings of this study are available from the corresponding author, upon reasonable request.
Additional Information
No additional information is available for this paper.
References
- Abbass, K., Qasim, M. Z., Song, H., Murshed, M., Mahmood, H., & Younis, I. (2022). A review of the global climate change impacts, adaptation, and sustainable mitigation measures. Environmental Science and Pollution Research, 29(28), 42539–42559. [CrossRef]
- Abebe, B. A., Grum, B., Degu, A. M., & Goitom, H. (2022). Spatio-temporal rainfall variability and trend analysis in the Tekeze-Atbara river basin, northwestern Ethiopia. Meteorological Applications, 29(2), 1–17. [CrossRef]
- Abegaz, W. B. (2020). Rainfall Variability and Trends over Central Ethiopia. International Journal of Environmental Sciences & Natural Resources, 24(4). [CrossRef]
- Achite, M., Caloiero, T., Wałęga, A., Krakauer, N., & Hartani, T. (2021). Analysis of the spatiotemporal annual rainfall variability in the Wadi Cheliff Basin (Algeria) over the period 1970 to 2018. Water (Switzerland), 13(11), 1–9. [CrossRef]
- Adane, G. B., Hirpa, B. A., Lim, C. H., & Lee, W. K. (2021). Evaluation and comparison of satellite-derived estimates of rainfall in the diverse climate and terrain of central and northeastern Ethiopia. Remote Sensing, 13(7). [CrossRef]
- Ademe, F., Kibret, K., Beyene, S., Mitike, G., & Getinet, M. (2020). Rainfall analysis for rain-fed farming in the Great Rift Valley basins of Ethiopia. Journal of Water and Climate Change, 11(3), 812–828. [CrossRef]
- Affoh, R., Zheng, H., Dangui, K., & Dissani, B. M. (2022). The Impact of Climate Variability and Change on Food Security in Sub-Saharan Africa: Perspective from Panel Data Analysis. Sustainability (Switzerland), 14(2). [CrossRef]
- Ahmad, K., Banerjee, A., Rashid, W., Xia, Z., Karim, S., & Asif, M. (2023). Assessment of Long-Term Rainfall Variability and Trends Using Observed and Satellite Data in Central Punjab, Pakistan. Atmosphere, 14(1), 1–19. [CrossRef]
- Aldrees, A., Hasan, M. S. U., Rai, A. K., Akhtar, M. N., Khan, M. A., Saif, M. M., Ahmad, N., & Islam, S. (2023). On the Precipitation Trends in Global Major Metropolitan Cities under Extreme Climatic Conditions: An Analysis of Shifting Patterns. Water (Switzerland), 15(3). [CrossRef]
- Alifujiang, Y., Abuduwaili, J., & Ge, Y. (2021). Trend analysis of annual and seasonal river runoff by using innovative trend analysis with significant tests. Water (Switzerland), 13(1). [CrossRef]
- Ashouri, H., Hsu, K. L., Sorooshian, S., Braithwaite, D. K., Knapp, K. R., Cecil, L. D., Nelson, B. R., & Prat, O. P. (2015). PERSIANN-CDR: Daily precipitation climate data record from multi-satellite observations for hydrological and climate studies. Bulletin of the American Meteorological Society, 96(1), 69–83. [CrossRef]
- Aswad, F., Yousif, A., & Ibrahim, S. (2020). Trend Analysis Using Mann-Kendall and Sen’s Slope Estimator Test for Annual And Monthly Rainfall for Sinjar District, Iraq. The Journal of the University of Duhok, 23(2), 501–508. [CrossRef]
- Banerjee, A., Chen, R., Meadows, M. E., Singh, R. B., Mal, S., & Sengupta, D. (2020). An analysis of long-term rainfall trends and variability in the Uttarakhand himalaya using Google Earth engine. Remote Sensing, 12(4). [CrossRef]
- Beck, H. E., Van Dijk, A. I. J. M., Levizzani, V., Schellekens, J., Miralles, D. G., Martens, B., & De Roo, A. (2017). MSWEP: 3-hourly 0.25° global gridded precipitation (1979-2015) by merging gauge, satellite, and reanalysis data. Hydrology and Earth System Sciences, 21(1), 589–615. [CrossRef]
- Bedane, H. R., Beketie, K. T., Fantahun, E. E., Feyisa, G. L., & Anose, F. A. (2022). The impact of rainfall variability and crop production on vertisols in the central highlands of Ethiopia. Environmental Systems Research, 11(1). [CrossRef]
- Bekele, F., Mosisa, N., & Terefe, D. (2017). Analysis of Current Rainfall Variability and Trends over Bale-Zone, South Eastern Highland of Ethiopia. SciFed Journal of Global Warming, 1(2), 1–7.
- Belay, A., Demissie, T., Recha, J. W., Oludhe, C., Osano, P. M., Olaka, L. A., Solomon, D., & Berhane, Z. (2021). Analysis of climate variability and trends in Southern Ethiopia. Climate, 9(6), 1–17. [CrossRef]
- Benzater, B., Elouissi, A., Dabanli, I., & Harkat, S. (2021). A new approach to detect trends in extreme rain categories by the ITA method in northwest Algeria ARTICLE HISTORY. Hydrological Sciences Journal, 66(16), 2298–2311. [CrossRef]
- Benzater, B., Elouissi, A., Łupikasza, E., Bao, Q., & Abdelkader, P. (2024). Application of the ITA approach to analyze spatiotemporal trends in monthly maximum rainfall categories in the Vu Gia - Thu Bon ,. Theoretical and Applied Climatology, 1467–1491. [CrossRef]
- Bewket, W., Tibebe, D., Teferi, E., & Degefu, M. A. (2024). Changes in mean and extreme rainfall indices over a problem scope in central Ethiopia. Environmental Challenges, 15(December 2023), 100883. [CrossRef]
- Birara, H., Pandey, R. P., & Mishra, S. K. (2018). Trend and variability analysis of rainfall and temperature in the Tana Basin region, Ethiopia. Journal of Water and Climate Change, 9(3), 555–569. [CrossRef]
- Case, F. A., & Baylie, M. M. (2022). Decision Analysis of the Adaptation of Households to Extreme Floods Using an Extended Protection Motivation.
- Cheng, Y., Sang, Y., Wang, Z., Guo, Y., & Tang, Y. (2021). Effects of Rainfall and Underlying Surface on Flood Recession—The Upper Huaihe River Basin Case. International Journal of Disaster Risk Science, 12(1), 111–120. [CrossRef]
- Chisanga, C. B., Nkonde, E., Phiri, E., Mubanga, K. H., & Lwando, C. (2023). Trend analysis of rainfall from 1981-2022 over Zambia. Heliyon, 9(11), e22345. [CrossRef]
- Das, J., Mandal, T., Rahman, A. T. M. S., & Saha, P. (2021). Spatio-temporal characterization of rainfall in Bangladesh: an innovative trend and discrete wavelet transformation approaches. Theoretical and Applied Climatology, 143(3–4), 1557–1579. [CrossRef]
- Dawit, M., Halefom, A., Teshome, A., Sisay, E., Shewayirga, B., & Dananto, M. (2019). Changes and variability of precipitation and temperature in the Guna Tana watershed, Upper Blue Nile Basin, Ethiopia. Modeling Earth Systems and Environment, 5(4), 1395–1404. [CrossRef]
- De Luis, M., González-Hidalgo, J. C., Brunetti, M., & Longares, L. A. (2011). Precipitation concentration changes in Spain 1946-2005. Natural Hazards and Earth System Science, 11(5), 1259–1265. [CrossRef]
- Dubache, G., Asmerom, B., Ullah, W., Ogwang, B. A., Amiraslani, F., Weijun, Z., & Gul, C. (2021). Testing the accuracy of high-resolution satellite-based and numerical model output precipitation products over Ethiopia. Theoretical and Applied Climatology, 146(3–4), 1127–1142. [CrossRef]
- Edo, A., Boru, N., & Behulu, F. (2021). Spatial-temporal rainfall trend and variability assessment in the Upper Wabe Shebelle River Basin, Ethiopia : Application of innovative trend analysis method Journal of Hydrology : Regional Studies Spatial-temporal rainfall trend and variability assessment. Journal of Hydrology: Regional Studies, 37(September), 100915. [CrossRef]
- Esit, M. (2023). Investigation of innovative trend approaches (Ita with significance test and ipta) comparing to the classical trend method of monthly and annual hydrometeorological variables: A case study of Ankara region, Turkey. Journal of Water and Climate Change, 14(1), 305–329. [CrossRef]
- Feleke, A. G., & Abera, M. (2020). Analysis of Rainfall and Temperature Trends and Variability in Semi-arid North-eastern Ethiopia. International Journal of Environmental Monitoring and Analysis, 8(4), 75. [CrossRef]
- Funk, C., Peterson, P., Landsfeld, M., Pedreros, D., Verdin, J., Shukla, S., Husak, G., Rowland, J., Harrison, L., Hoell, A., & Michaelsen, J. (2015). The climate hazards infrared precipitation with stations - A new environmental record for monitoring extremes. Scientific Data, 2, 1–21. [CrossRef]
- Gebere, S. B., Alamirew, T., Merkel, B. J., & Melesse, A. M. (2015). Performance of high-resolution satellite rainfall products over data-scarce parts of eastern Ethiopia. Remote Sensing, 7(9), 11639–11663. [CrossRef]
- Gebretsadkan, K. N., Tamrie, M. B., & Desta, H. B. (2023). Performance evaluation of multi-satellite rainfall products in the Gidabo catchment, Rift Valley Basin, Ethiopia. Journal of Water and Climate Change, 14(11), 3950–3966. [CrossRef]
- Gedefaw, M., Yan, D., Wang, H., Qin, T., Girma, A., Abiyu, A., & Batsuren, D. (2018). Innovative trend analysis of annual and seasonal rainfall variability in Amhara Regional State, Ethiopia. Atmosphere, 9(9). [CrossRef]
- Gerardo, N. (2024). Brazil's Daily Precipitation Concentration Index ( CI ) Using Alternative Fitting Equation and Ensemble Data. Ci.
- Gocic, M., & Trajkovic, S. (2013). Analysis of changes in meteorological variables using Mann-Kendall and Sen's slope estimator statistical tests in Serbia. Global and Planetary Change, 100, 172–182. [CrossRef]
- Hailu, D., Woldetsadik, M., & Ayal, D. Y. (2024). Trends and variability in annual and seasonal rainfall amount and timing in Wereilu district, Northeastern Highlands of Ethiopia. Environmental Challenges, 17(October), 101055. [CrossRef]
- Huffman, G. J., Adler, R. F., Bolvin, D. T., Gu, G., Nelkin, E. J., Bowman, K. P., Hong, Y., Stocker, E. F., & Wolff, D. B. (2007). The TRMM Multisatellite Precipitation Analysis (TMPA): Quasi-global, multiyear, combined-sensor precipitation estimates at fine scales. Journal of Hydrometeorology, 8(1), 38–55. [CrossRef]
- Huffman, G. J., Bolvin, D. T., Braithwaite, D., Hsu, K., Joyce, R., Kidd, C., Nelkin, E. J., Sorooshian, S., Stocker, E. F., Tan, J., Wolff, D. B., & Xie, P. (2019). Integrated Multi-satellitE Retrievals for the Global Precipitation Measurement (GPM) mission (IMERG) (pp. 1–23). NASA/GSFC Earth Science Division.
- Jakob, D., & Walland, D. (2016). Variability and long-term change in Australian temperature and precipitation extremes. Weather and Climate Extremes, 14(February), 36–55. [CrossRef]
- Joyce, R. J., Janowiak, J. E., Arkin, P. A., & Xie, P. (2004). CMORPH: A method that produces global precipitation estimates from passive microwave and infrared data at high spatial and temporal resolution. Journal of Hydrometeorology, 5(3), 487–503. [CrossRef]
- Kendall, M. G. (1948). Rank correlation methods.
- Kerebo, K. A., Bizuneh, Y. K., Mekonnen, A. G., & Mohammed, Y. (2024). The trends and spatiotemporal variability of temperature and rainfall in Hulbarag district, Silte Zone, Ethiopia. Heliyon, 10(11), e31646. [CrossRef]
- Kessabi, R., Hanchane, M., Krakauer, N. Y., Aboubi, I., El Kassioui, J., & El Khazzan, B. (2022). Annual, Seasonal, and Monthly Rainfall Trend Analysis through Non-Parametric Tests in the Sebou River Basin (SRB), Northern Morocco. Climate, 10(11). [CrossRef]
- Kinda, S. R., & Badolo, F. (2019). Does rainfall variability matter for food security in developing countries ? Cogent Economics and Finance, 7(1), 1–16. [CrossRef]
- Kotz, M., Levermann, A., & Wenz, L. (2022). The effect of rainfall changes on economic production. Nature, 601(7892), 223–227. [CrossRef]
- Kumar, A., Kumar, S., Rautela, K. S., Shekhar, S., Ray, T., & Thangavel, M. (2023). Assessing seasonal variation and trends in rainfall patterns of Madhya Pradesh, Central India. Journal of Water and Climate Change, 14(10), 3692–3712. [CrossRef]
- Kummerow, C., Barnes, W., Kozu, T., Shiue, J., & Simpson, J. (1998). The Tropical Rainfall Measuring Mission (TRMM) sensor package. Journal of Atmospheric and Oceanic Technology, 15(3), 809–817. [CrossRef]
- Leta, T., & Author, C. (2023). Seasonal and Annual Rainfall Variability and Trends in Metekele Zone North Western Ethiopia. Journal of Climatology & Weather Forecasting, 11(3), 1–8. [CrossRef]
- Leweri, C. M., Msuha, M. J., & Treydte, A. C. (2021). Rainfall variability and socio-economic constraints on livestock production in the Ngorongoro Conservation Area, Tanzania. SN Applied Sciences, 3(1), 1–10. [CrossRef]
- Mann, H. B. (1945). Nonparametric tests against trend. Econometrica: Journal of the Econometric Society, 245–259.
- Markos, D., Worku, W., & Mamo, G. (2023). Spatio-temporal variability and rainfall trends affect the seasonal calendar of maize production in the southern central Rift Valley of Ethiopia. PLOS Climate, 2(6), e0000218. [CrossRef]
- Mondal, A., Kundu, S., & Mukhopadhyay, A. (2012). Case Study rainfall trend analysis by mann-kendall test : a case study of the North-Eastern part of Cuttack District, Orissa School of Oceanographic Studies, Jadavpur University, Kolkata-700032 * Author for Correspondence Case Study Trend Analysis. International Journal of Geology, Earth and Environmental Sciences, 2(1), 70–78.
- Moshe, A., & Beza, M. (2024). Temporal Dynamics and Trend Analysis of Areal Rainfall in Muger Subwatershed, Upper Blue Nile, Ethiopia. Advances in Meteorology, 2024. [CrossRef]
- Mugabe, P., Kipkulei, H., Sieber, S., Mhache, E., & Löhr, K. (2024). Examining climate trends and patterns and their implications for agricultural productivity in Bagamoyo District, Tanzania. Frontiers in Climate, 6(May). [CrossRef]
- Muia V. K, Opere A.O, Ndunda E, & Amwata D.A. (2024). Rainfall and Temperature Trend Analysis using Mann-Kendall and Sen’s Slope Estimator Test in Makueni County, Kenya. J. Mater. Environ. Sci, 15(3), 349–367. http://www.jmaterenvironsci.com.
- Mulugeta, S., Fedler, C., & Ayana, M. (2019). Analysis of long-term trends of annual and seasonal rainfall in the Awash River Basin, Ethiopia. Water (Switzerland), 11(7). [CrossRef]
- Muluneh, M. G. (2021). Impact of climate change on biodiversity and food security: a global perspective—a review article. Agriculture and Food Security, 10(1), 1–25. [CrossRef]
- Okirya, M., & Du Plessis, J. A. (2024). Trend and Variability Analysis of Annual Maximum Rainfall Using Observed and Remotely Sensed Data in the Tropical Climate Zones of Uganda. Sustainability (Switzerland), 16(14). [CrossRef]
- Pastagia, J., & Mehta, D. (2022). Application of innovative trend analysis on rainfall time series over Rajsamand district of Rajasthan state. Water Supply, 22(9), 7189–7196. [CrossRef]
- Pawar, U., Hire, P., Gunathilake, M. B., & Rathnayake, U. (2023). Spatiotemporal Rainfall Variability and Trends over the Mahi Basin, India. Climate, 11(8), 1–22. [CrossRef]
- Perera, H., Gunathilake, M. B., Panditharathne, R., Al-Mahbashi, N., & Rathnayake, U. (2022). Statistical Evaluation and Trend Analysis of ANN-Based Satellite Products (PERSIANN) for the Kelani River Basin, Sri Lanka. Applied Computational Intelligence and Soft Computing, 2022. [CrossRef]
- Regassa, B., Kassaw, M., & Bagyaraj, M. (2020). Analysis of Urban Expansion and Modeling of LULC Changes Using Geospatial Techniques: The Case of Adama City. Remote Sensing of Land, 4(1–2), 40–58. [CrossRef]
- Report, G. D. O. A. (2022). Drought in East Africa August 2022. August. [CrossRef]
- Saha, G. C. (2015). Climate change-induced precipitation effects on water resources in the peace region of British Columbia, Canada. Climate, 3(2), 264–282. [CrossRef]
- Sahilu, M., Tekalign, S., Mohammed, Y., Sishaw, T., Kedir, H., & Asfaw, S. (2024). Spatiotemporal trends and variability of rainfall across agroecologies in East Guji Zone, Southeast Ethiopia. PLOS Climate, 3(3), e0000361. [CrossRef]
- Salameh, A. A. M. (2024). Using the precipitation concentration index for characterizing the rainfall distribution in the Levant. Journal of Water and Climate Change, 15(4), 1945–1960. [CrossRef]
- Sanusi, W., Abdy, M., & Sulaiman. (2021). Innovative trend analysis of annual maximum precipitation in Gowa regency. Journal of Physics: Conference Series, 1899(1). [CrossRef]
- Seneshaw, Y., Li, M., & Pun, I. (2021). Trend and change-point detection analyses of rainfall and temperature over the Awash River basin of Ethiopia. Heliyon, 7(9), e08024. [CrossRef]
- Shigute, M., Alamirew, T., Abebe, A., Ndehedehe, C. E., & Kassahun, H. T. (2023). Analysis of rainfall and temperature variability for agricultural water management in the upper Genale river basin, Ethiopia. Scientific African, 20. [CrossRef]
- Simeon, M., Wana, D., & Woldu, Z. (2024). Spatiotemporal dynamics of ecosystem services in response to climate variability in Maze National Park and its environs, southwestern Ethiopia. PLoS ONE, 19(7 JULY), 1–28. [CrossRef]
- Sinore, T., & Wang, F. (2024). Impact of climate change on agriculture and adaptation strategies in Ethiopia: A meta-analysis. Heliyon, 10(4), e26103. [CrossRef]
- Sobral, B. S., de Oliveira-Júnior, J. F., Alecrim, F., Gois, G., Muniz-Júnior, J. G., de Bodas Terassi, P. M., Pereira-Júnior, E. R., Lyra, G. B., & Zeri, M. (2020). PERSIANN-CDR based characterization and trend analysis of annual rainfall in Rio De Janeiro State, Brazil. Atmospheric Research, 238(October 2019). [CrossRef]
- Sudarsan, G., & Lasitha, A. (2023). Rainfall Trend analysis using Mann-Kendall and Sen’s slope test estimation-A case study. E3S Web of Conferences, 405, 1–8. [CrossRef]
- Tegegn, M. G., Berlie, A. B., & Utallo, A. U. (2024). Spatiotemporal variability and trends of intra-seasonal rainfall and temperature in the drought-prone districts of Northwestern Ethiopia. Discover Sustainability, 5(1). [CrossRef]
- Temam, D., Uddameri, V., Mohammadi, G., Hernandez, E. A., & Ekwaro-Osire, S. (2019). Long-term drought trends in Ethiopia with implications for dryland agriculture. Water (Switzerland), 11(12), 1–24. [CrossRef]
- Twisa, S., & Buchroithner, M. F. (2019). Seasonal and annual rainfall variability and their impact on rural water supply services in the Wami River Basin, Tanzania. Water (Switzerland), 11(10). [CrossRef]
- UNESCO, & UN Water. (2020). United nations world water development report 2020: water and climate change. In Unesco. https://aquadocs.org/handle/1834/42227%0Ahttps://unesdoc.unesco.org/ark:/48223/pf0000372985/PDF/372985eng.pdf.multi.
- Wang, F., Shao, W., Yu, H., Kan, G., He, X., Zhang, D., Ren, M., & Wang, G. (2020). Re-evaluation of the Power of the Mann-Kendall Test for Detecting Monotonic Trends in Hydrometeorological Time Series. Frontiers in Earth Science, 8(February), 1–12. [CrossRef]
- Wang, Y., Xu, Y., Tabari, H., Wang, J., Wang, Q., Song, S., & Hu, Z. (2019). Innovative trend analysis of annual and seasonal rainfall in the Yangtze River Delta, eastern China. Atmospheric Research, 231(4), 527–534. [CrossRef]
- Wei, L., Jiheng, L., Junhong, G., Zhe, B., Lingbo, F., & Baodeng, H. (2020). The Effect of Precipitation on Hydropower Generation Capacity: A Perspective of Climate Change. Frontiers in Earth Science, 8(September), 1–13. [CrossRef]
- Weldesenbet, G. A. (2019). Analysis of Rainfall Variability for Mekelle Meteorological Station, Northern Ethiopia (1960-2009). Civil and Environmental Research, 11(9). [CrossRef]
- Worku, M. A., Feyisa, G. L., & Beketie, K. T. (2022). Climate trend analysis for a semi-arid Borana zone in southern Ethiopia during 1981 – 2018. Environmental Systems Research, 7. [CrossRef]
- Worku, M. A., Feyisa, G. L., Beketie, K. T., & Garbolino, E. (2023). Spatiotemporal dynamics of vegetation in response to climate variability in the Borana rangelands of southern Ethiopia. Frontiers in Earth Science, 11(January), 1–15. [CrossRef]
- Yalew, A. W., Hirte, G., Lotze-Campen, H., & Tscharaktschiew, S. (2018). Climate change, agriculture, and economic development in Ethiopia. Sustainability (Switzerland), 10(10). [CrossRef]
- You, G. J., & Ringler, C. (2013). Hydro-economic modeling of climate change impacts in Ethiopia IFPRI Discussion Paper 00960 Hydro-Economic Modeling of Climate Change Impacts in Ethiopia Gene Jiing-Yun You Environment and Production Technology Division. January 2010.
- Zhang, K., Yao, Y., Qian, X., & Wang, J. (2019). Various characteristics of precipitation concentration index and its cause analysis in China between 1960 and 2016. International Journal of Climatology, 39(12), 4648–4658. [CrossRef]
Figure 1.
Study Region.
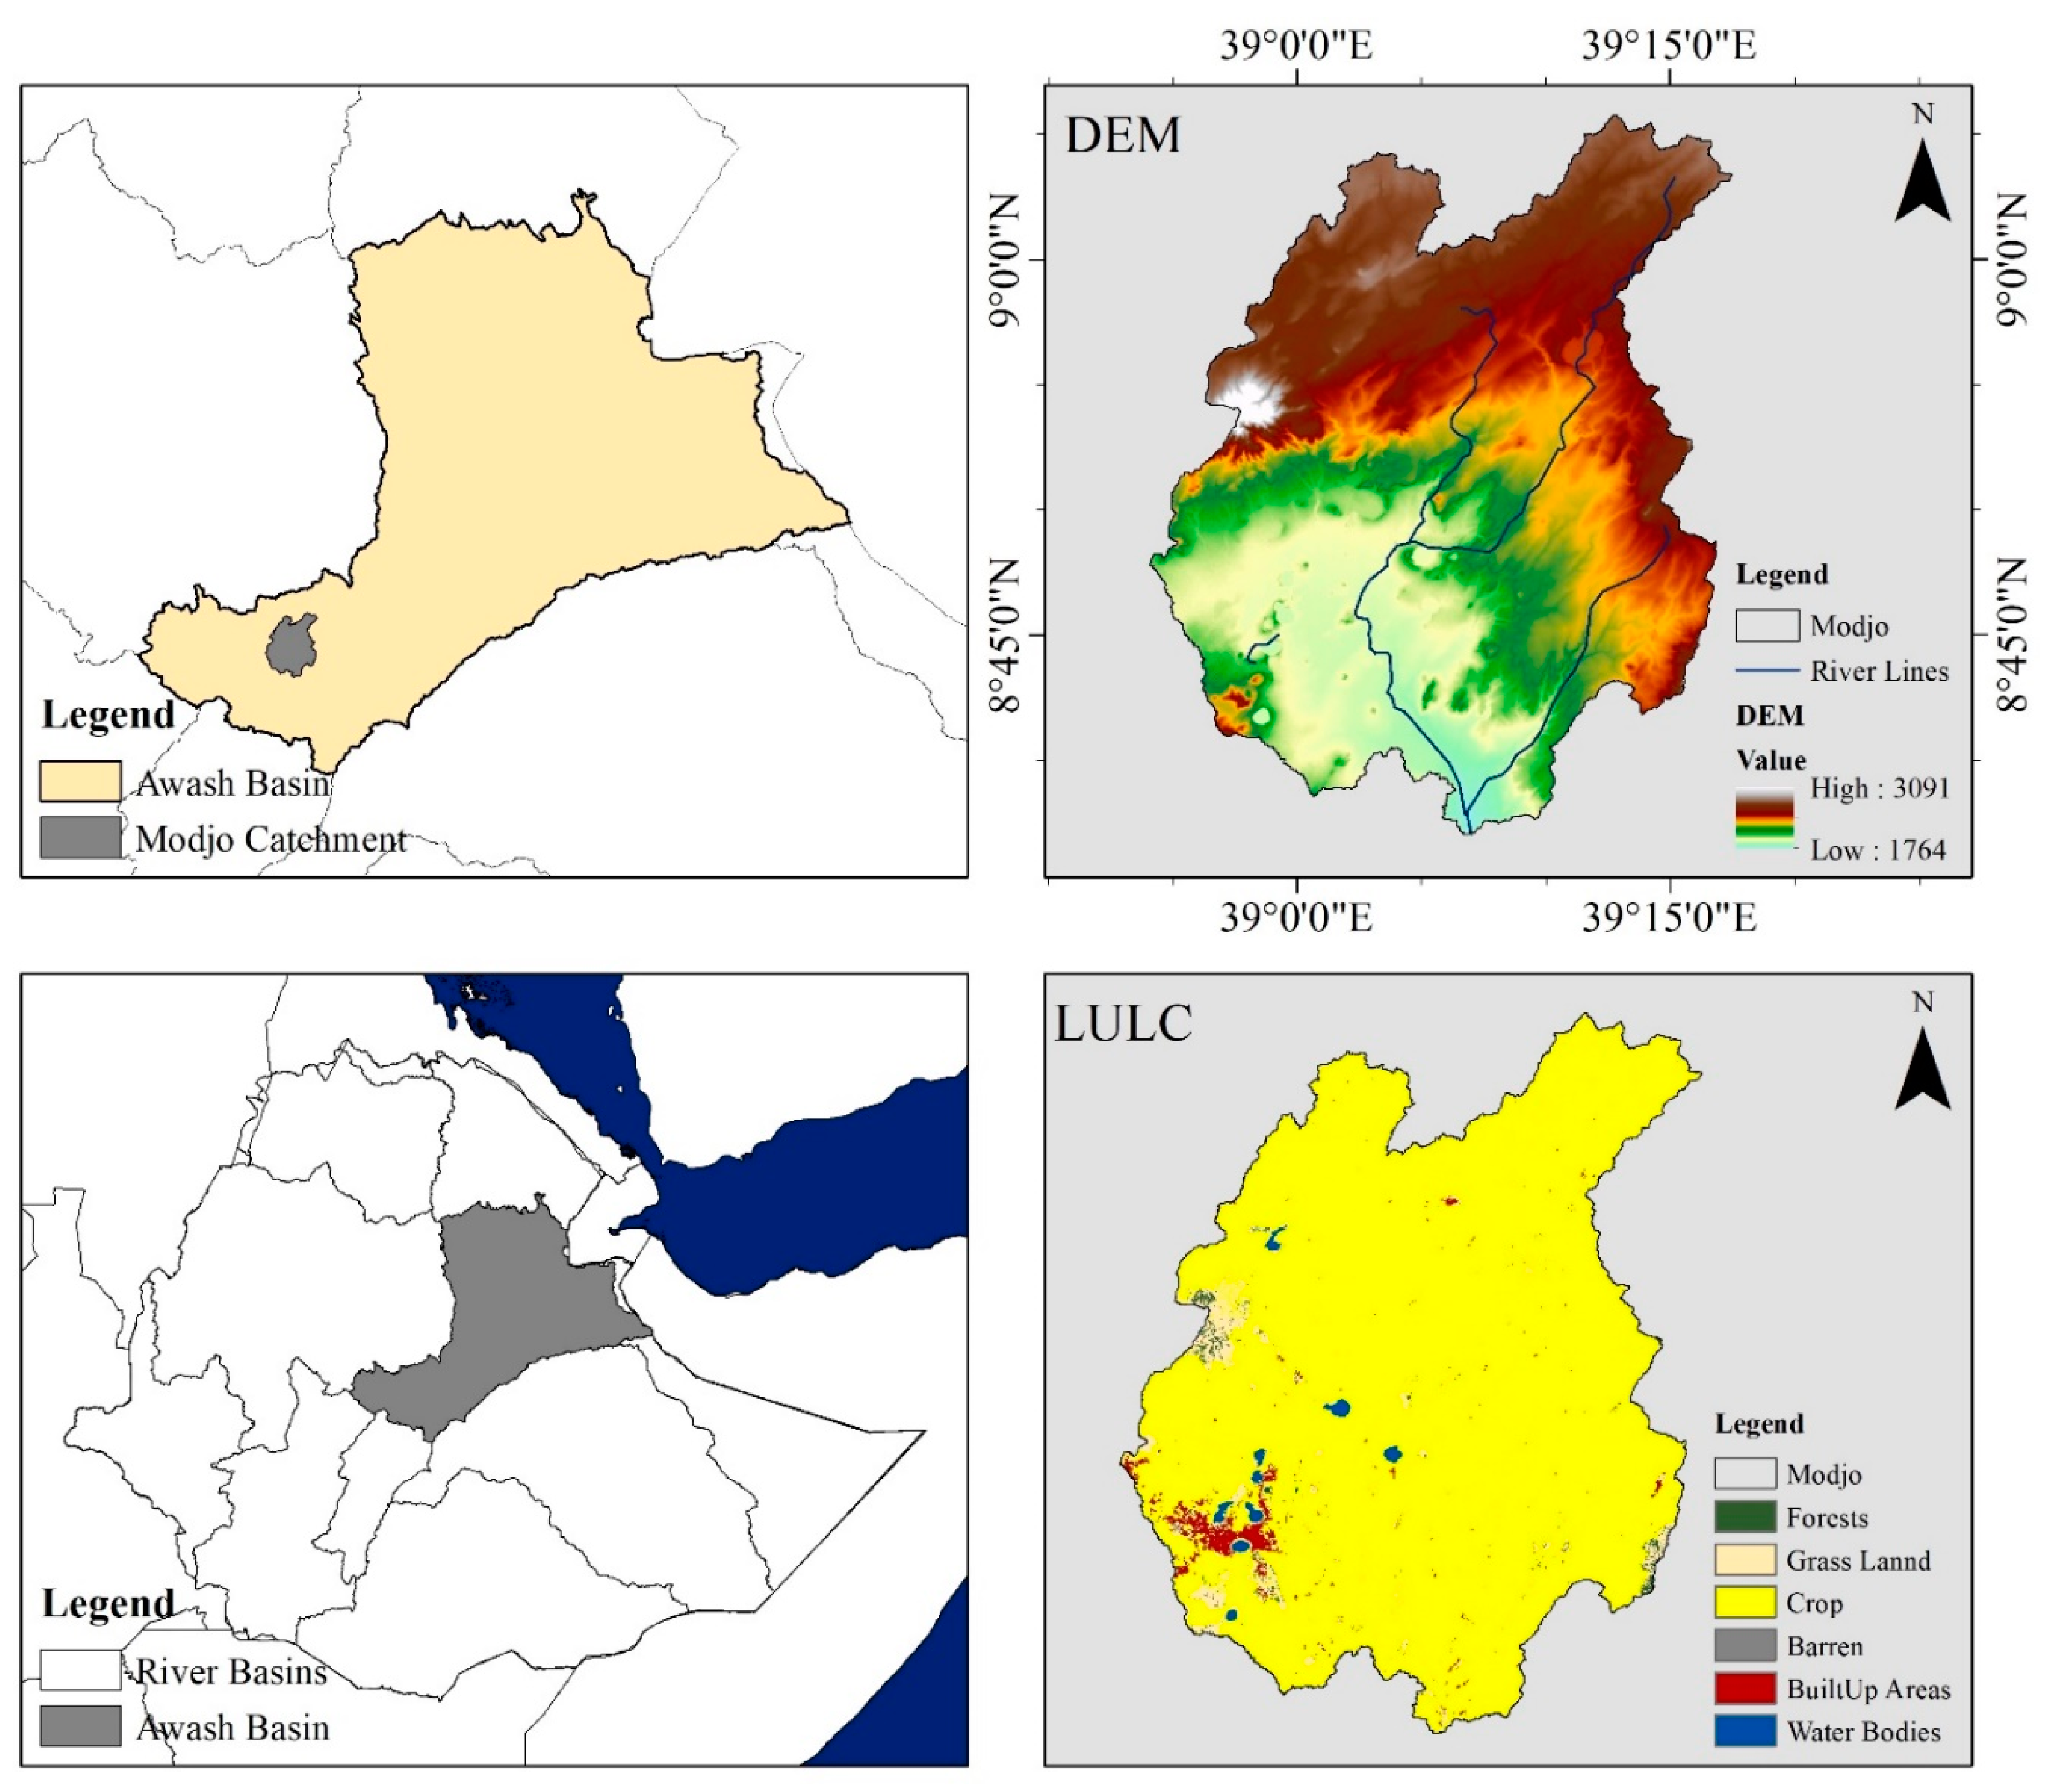
Figure 2.
A schematic diagram of the proposed methodology.
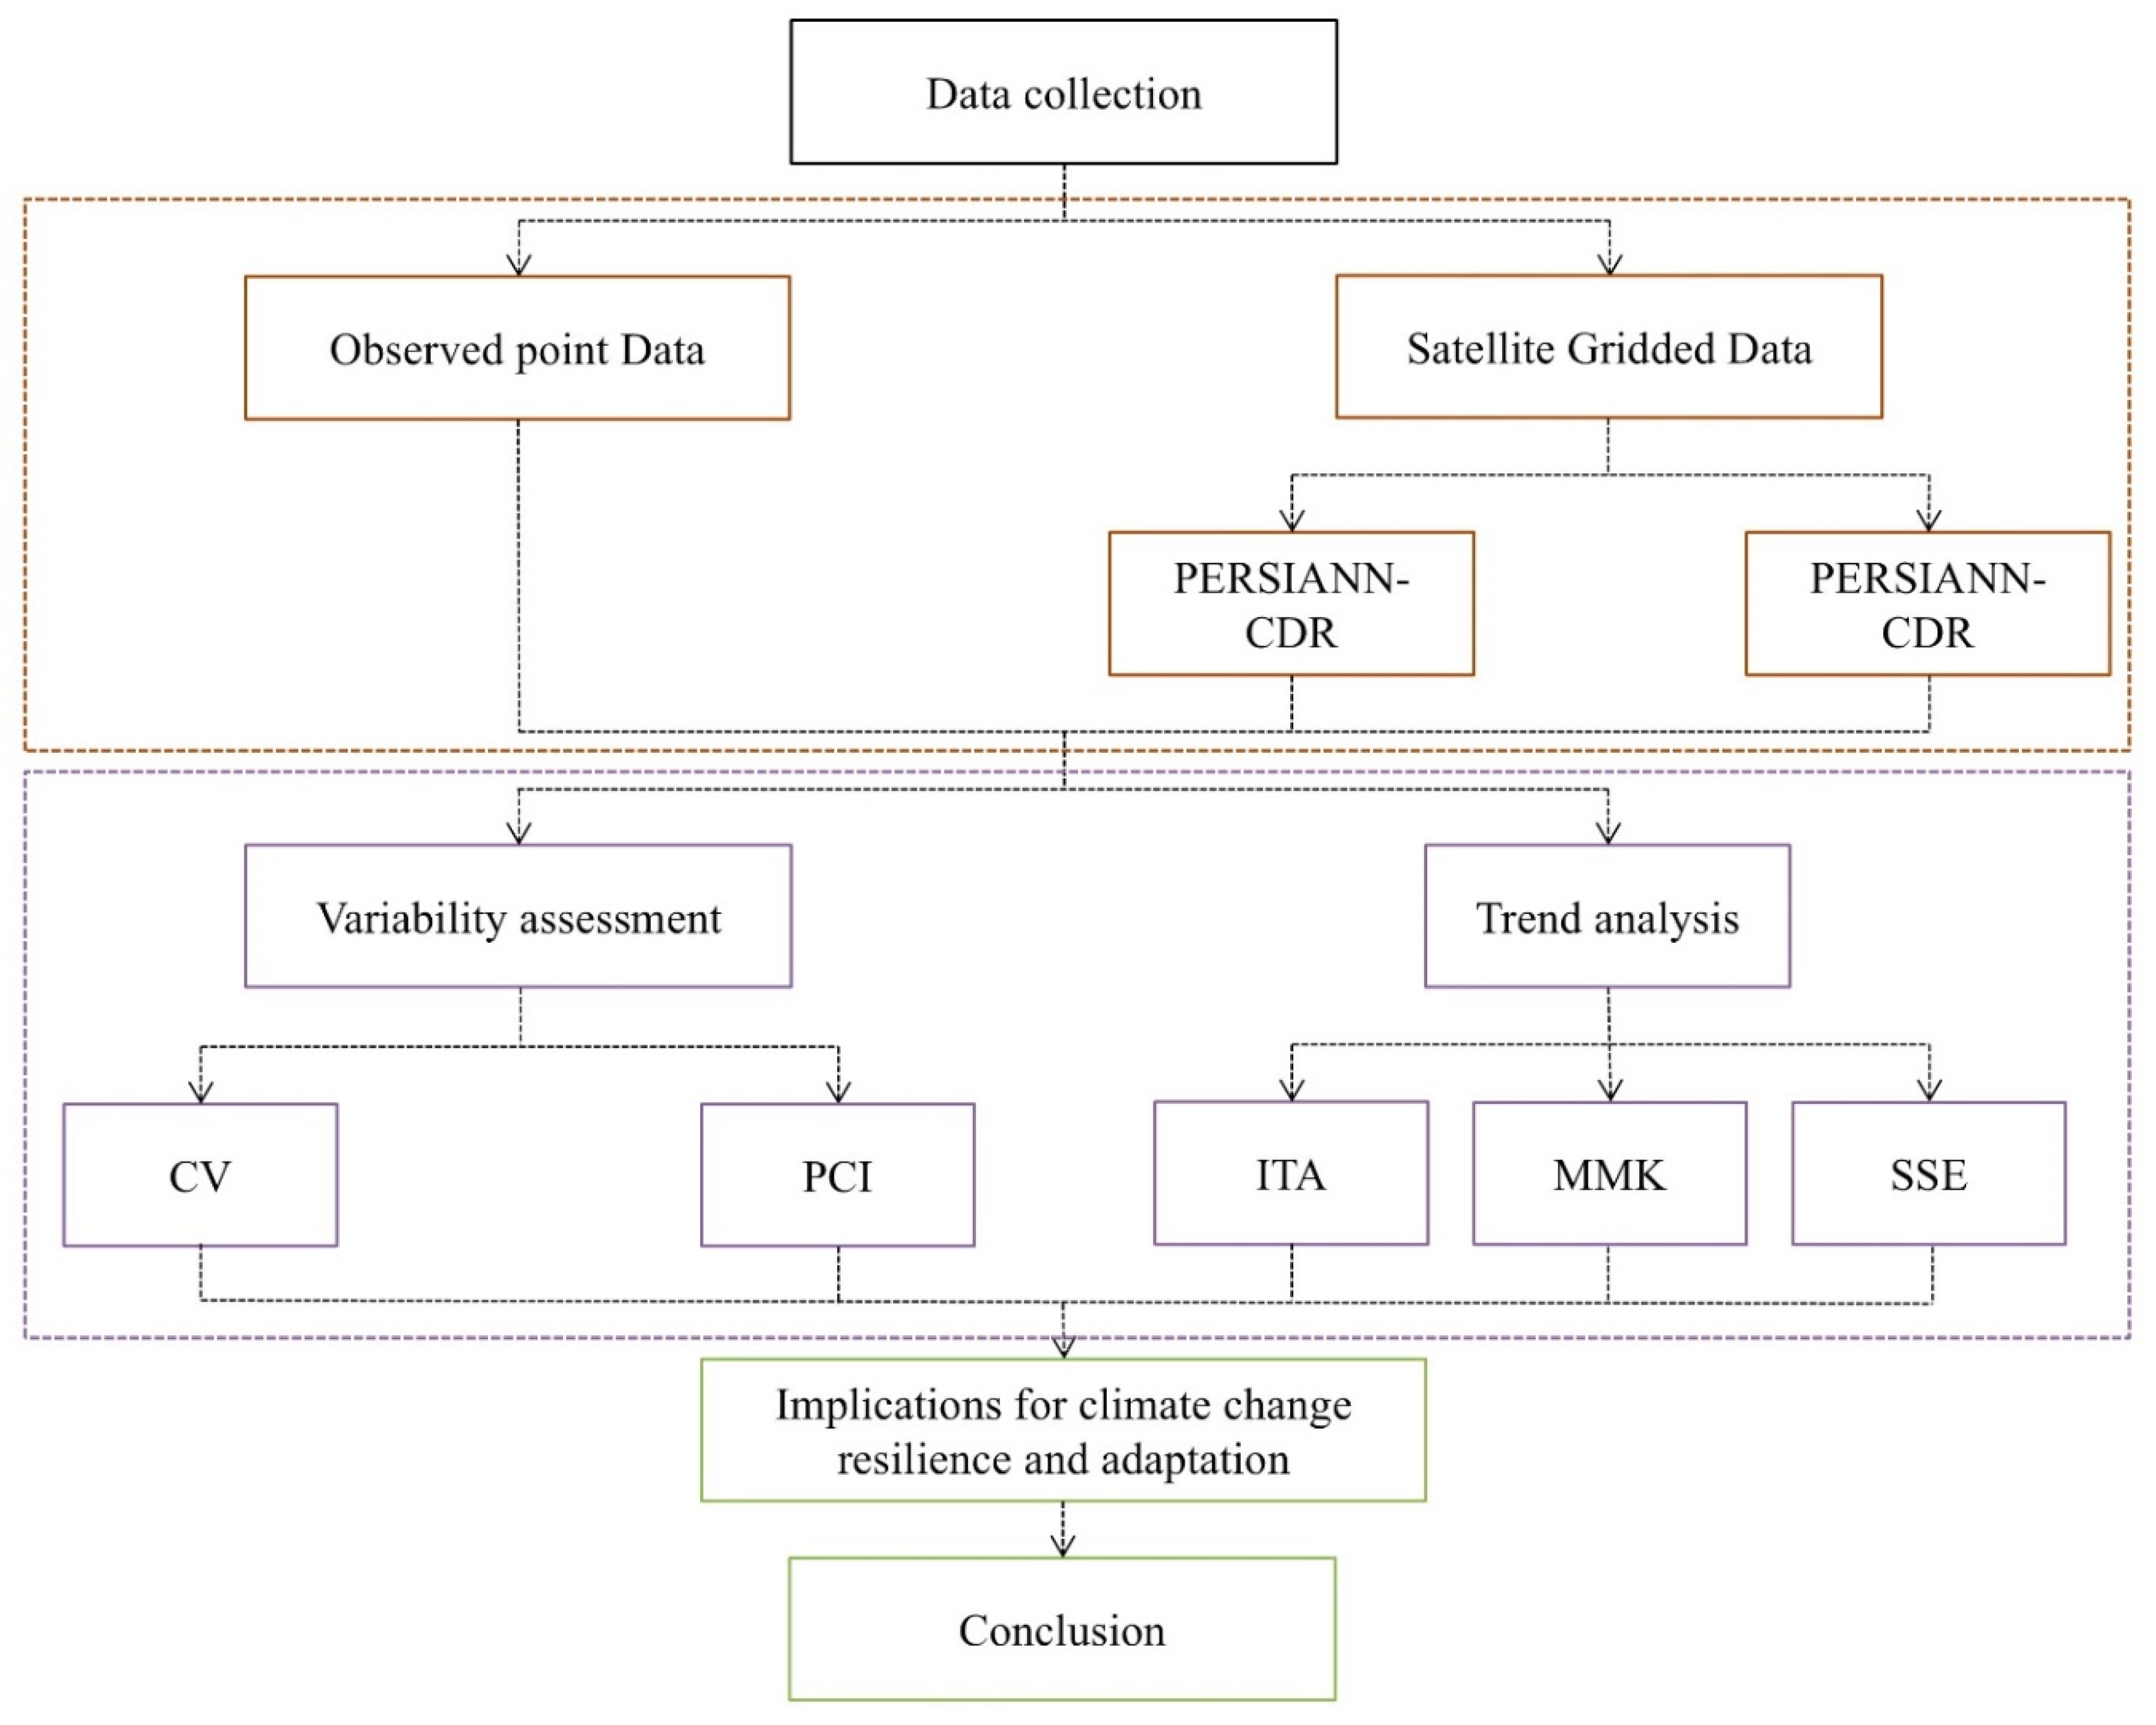
Figure 3.
Description of Innovative Trend Analysis.
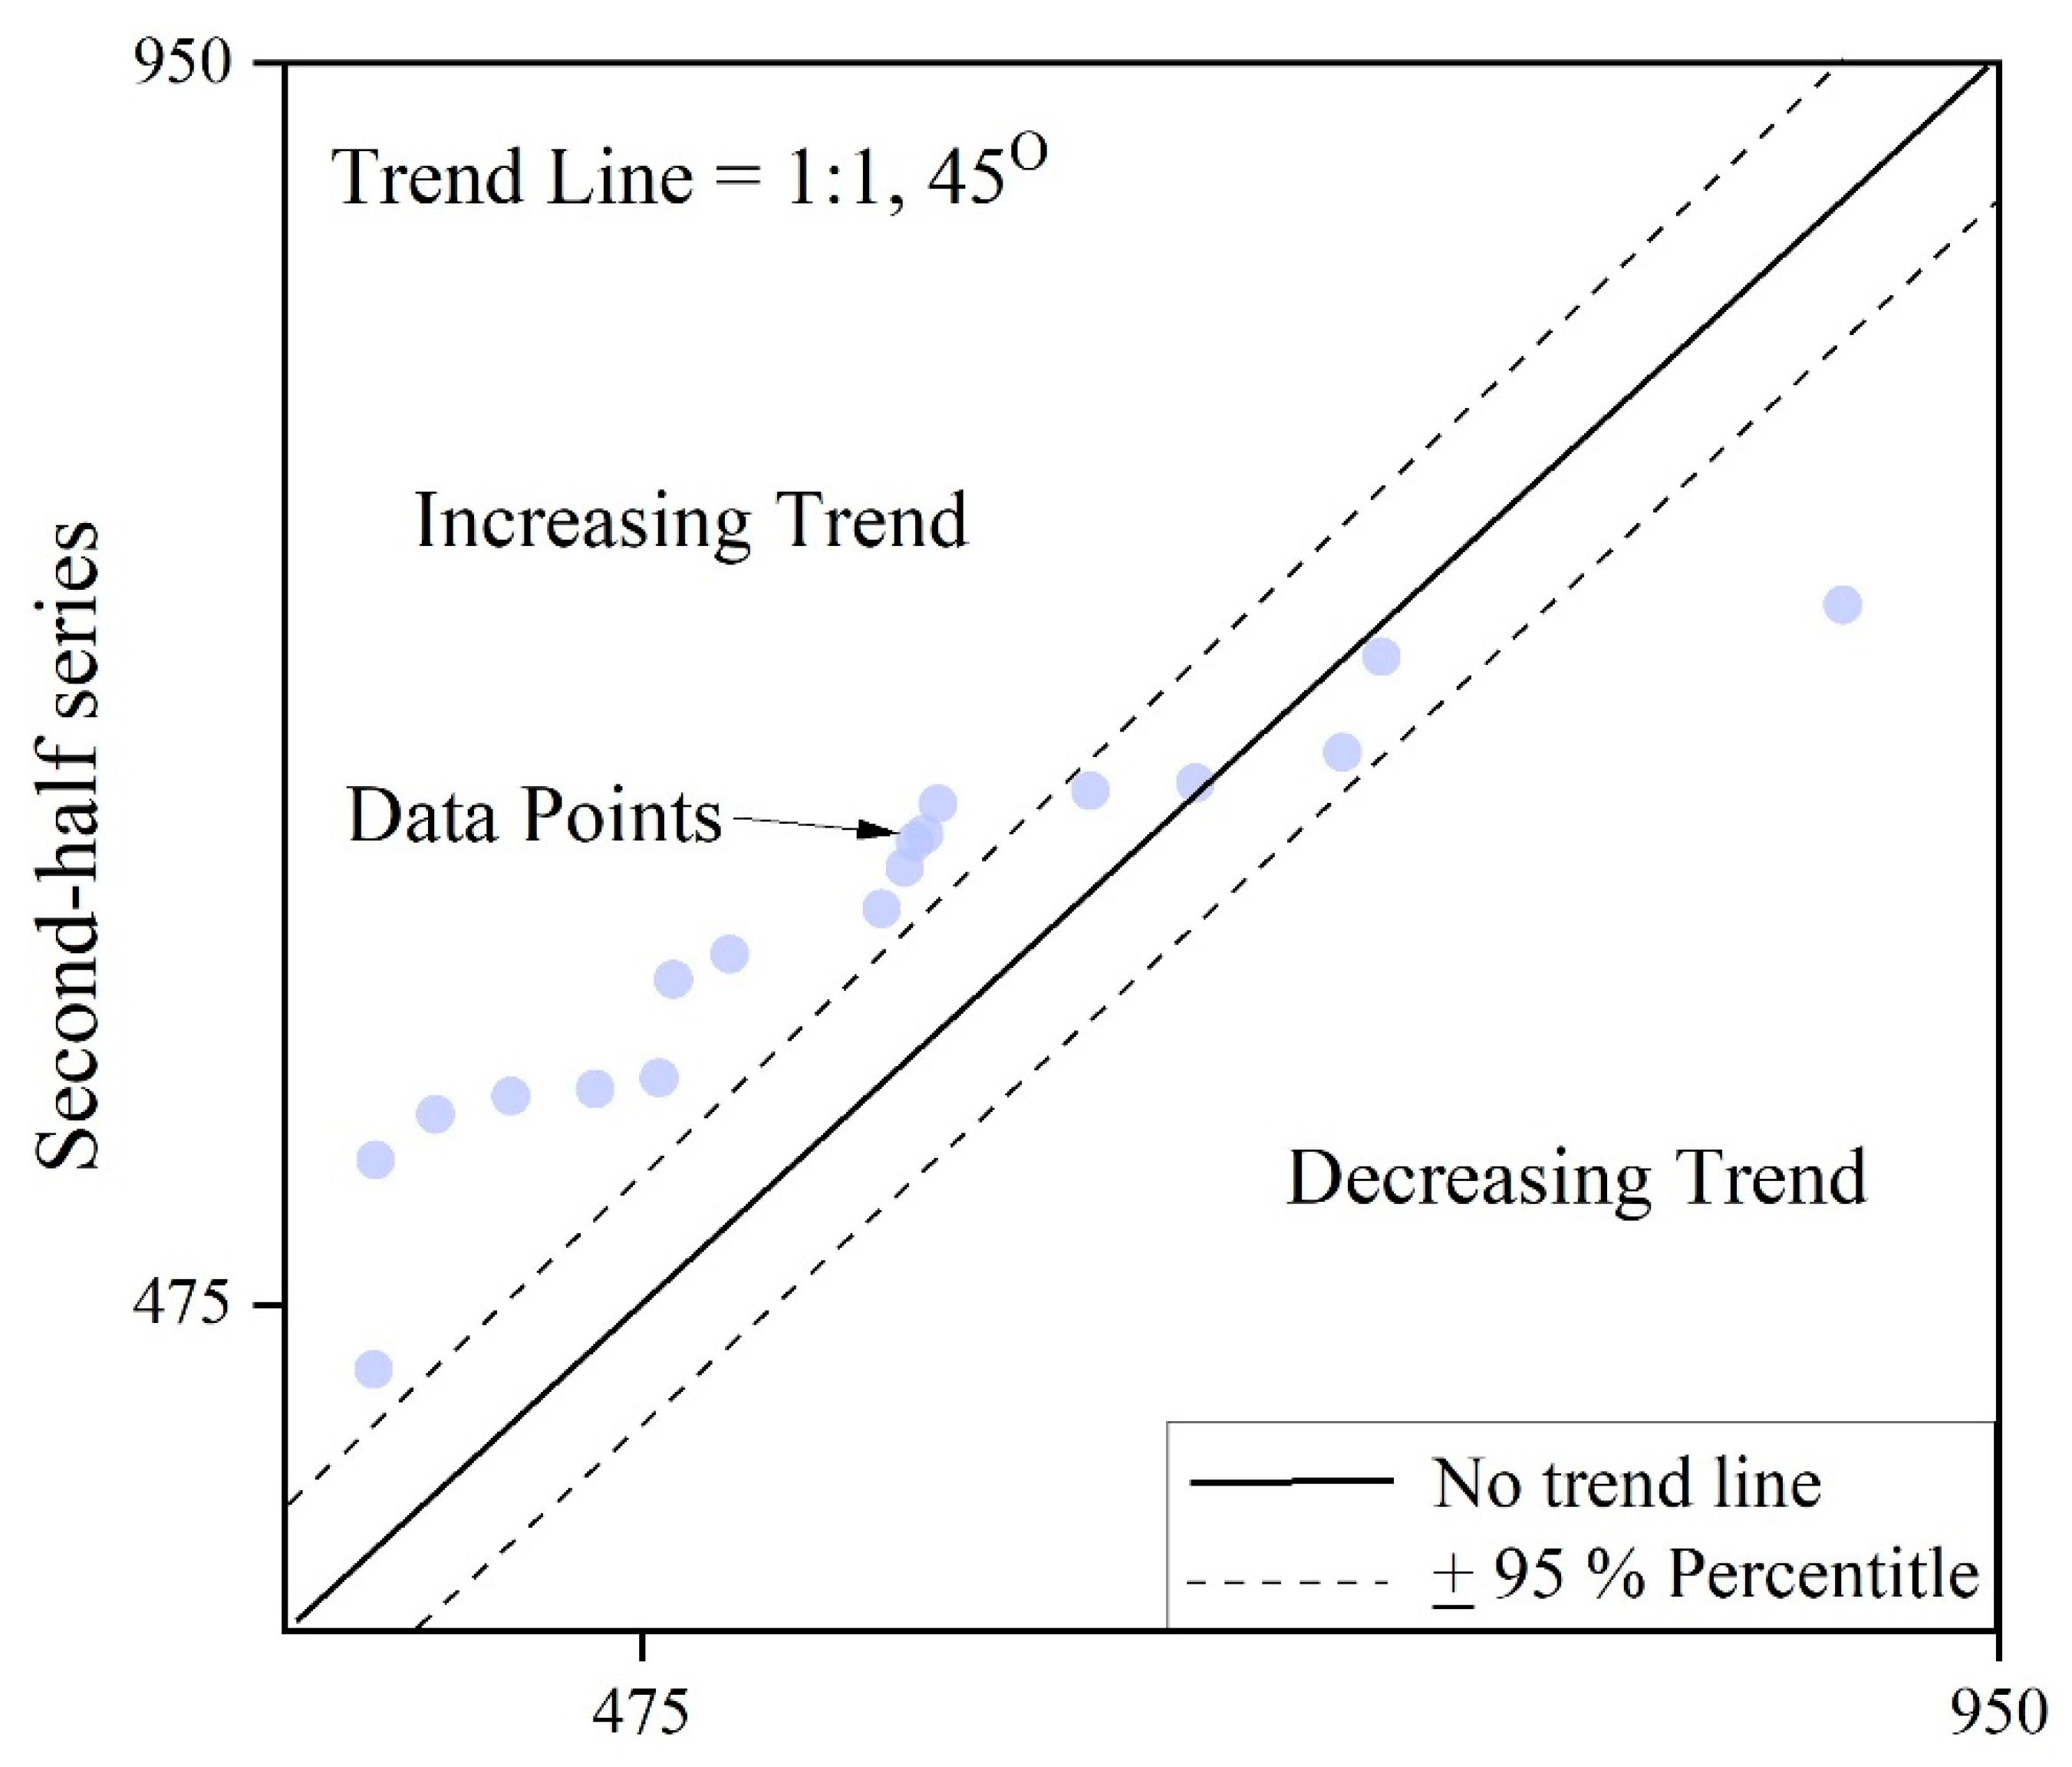
Figure 4.
Total annual rainfall distribution over the years.
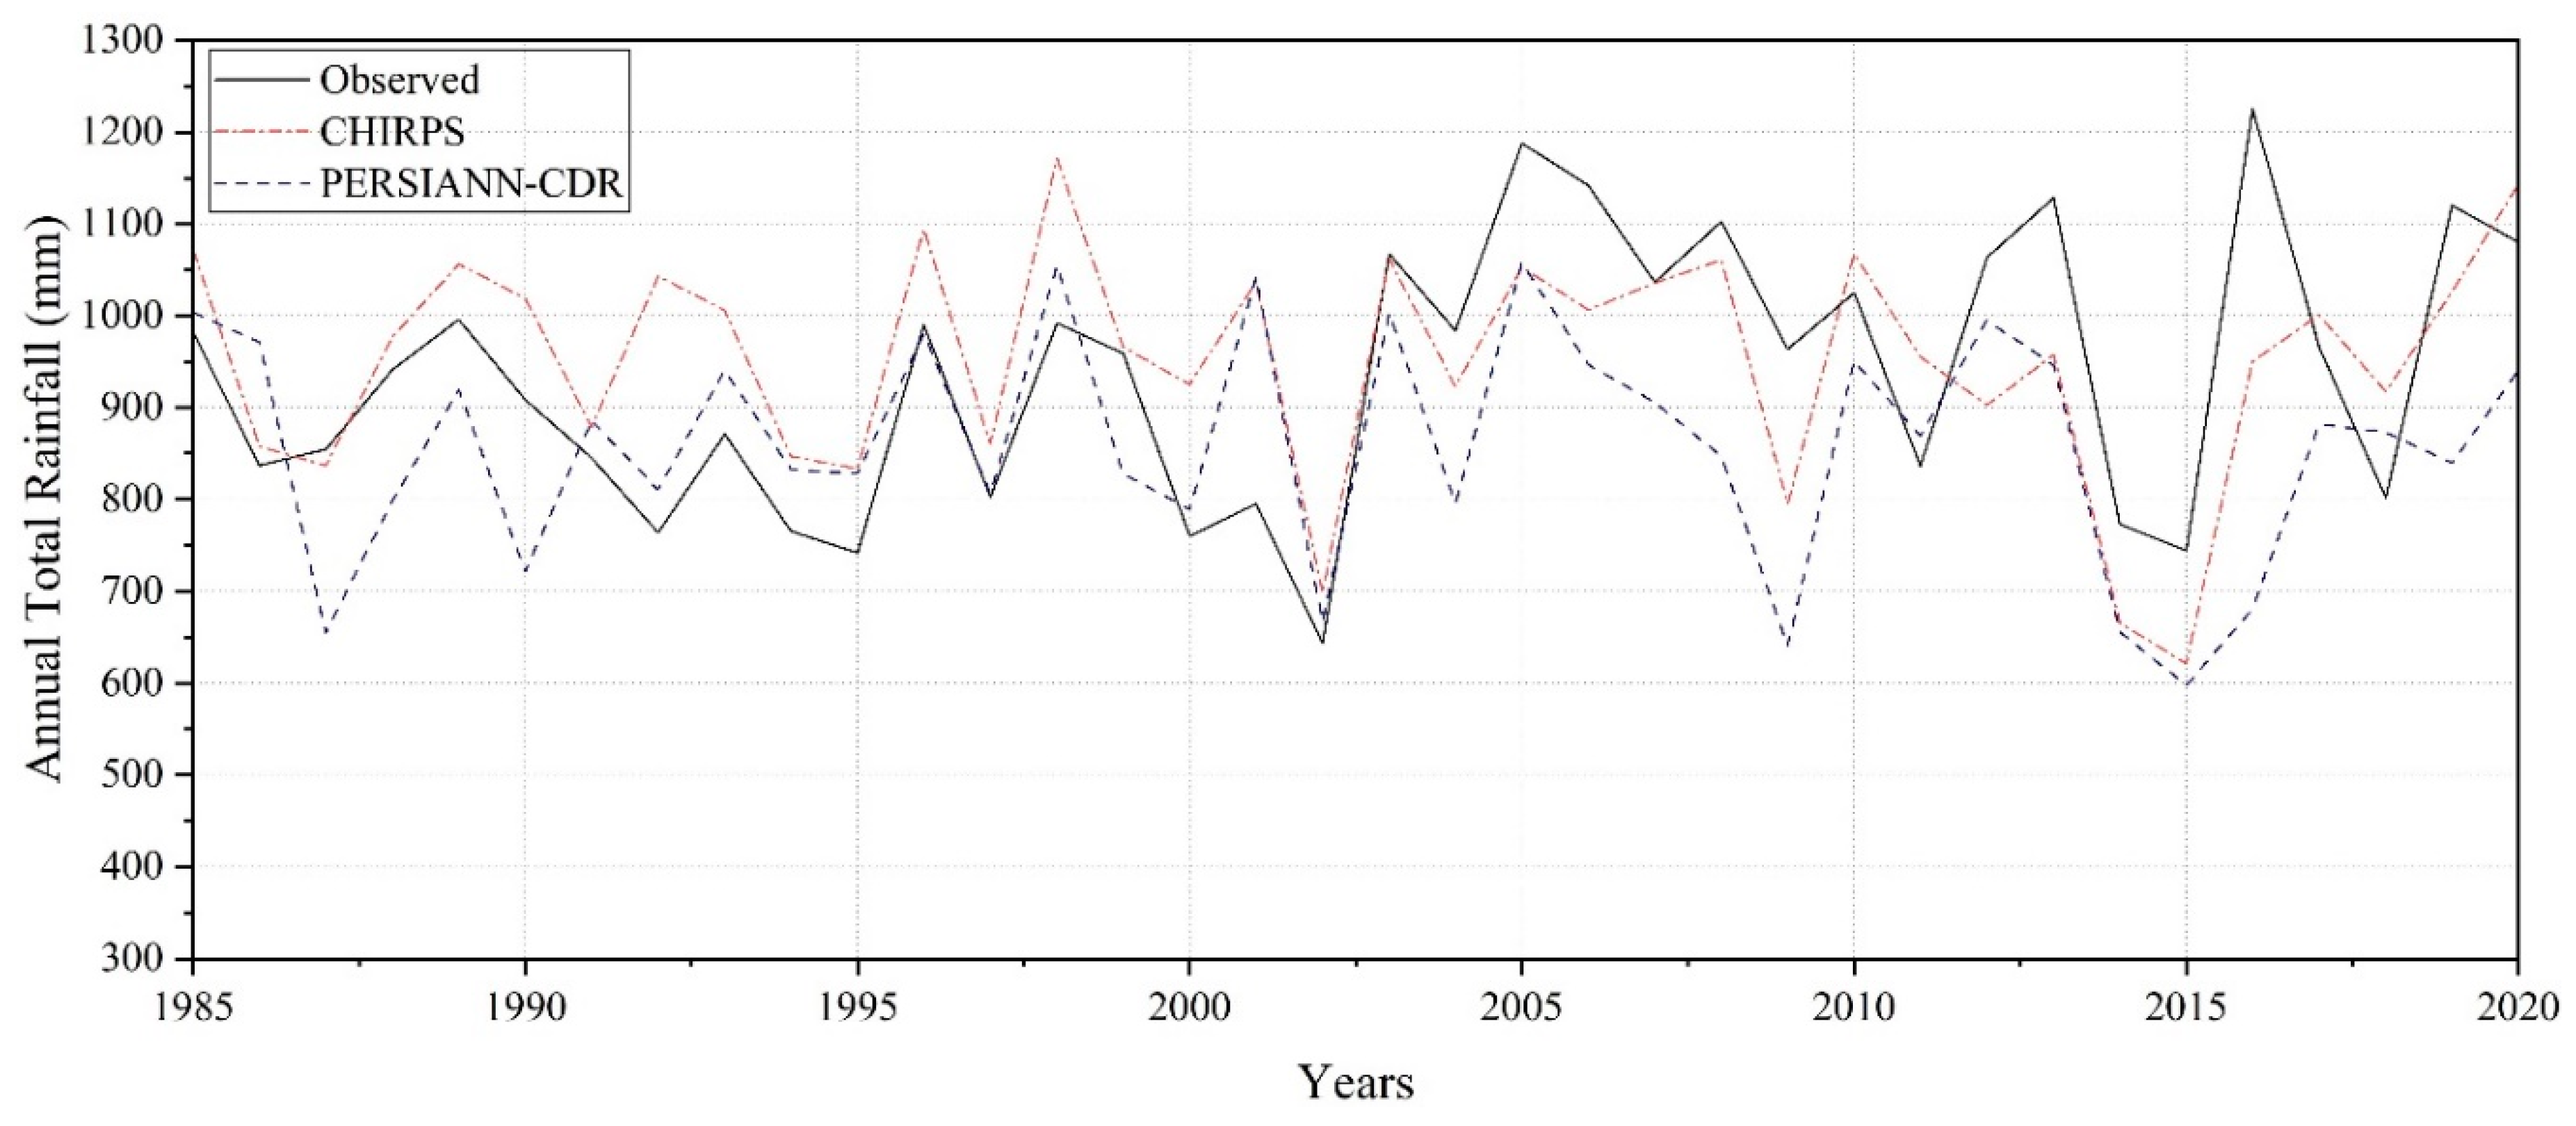
Figure 5.
Annual and seasonal trend of rainfall at Chefe Donsa station.
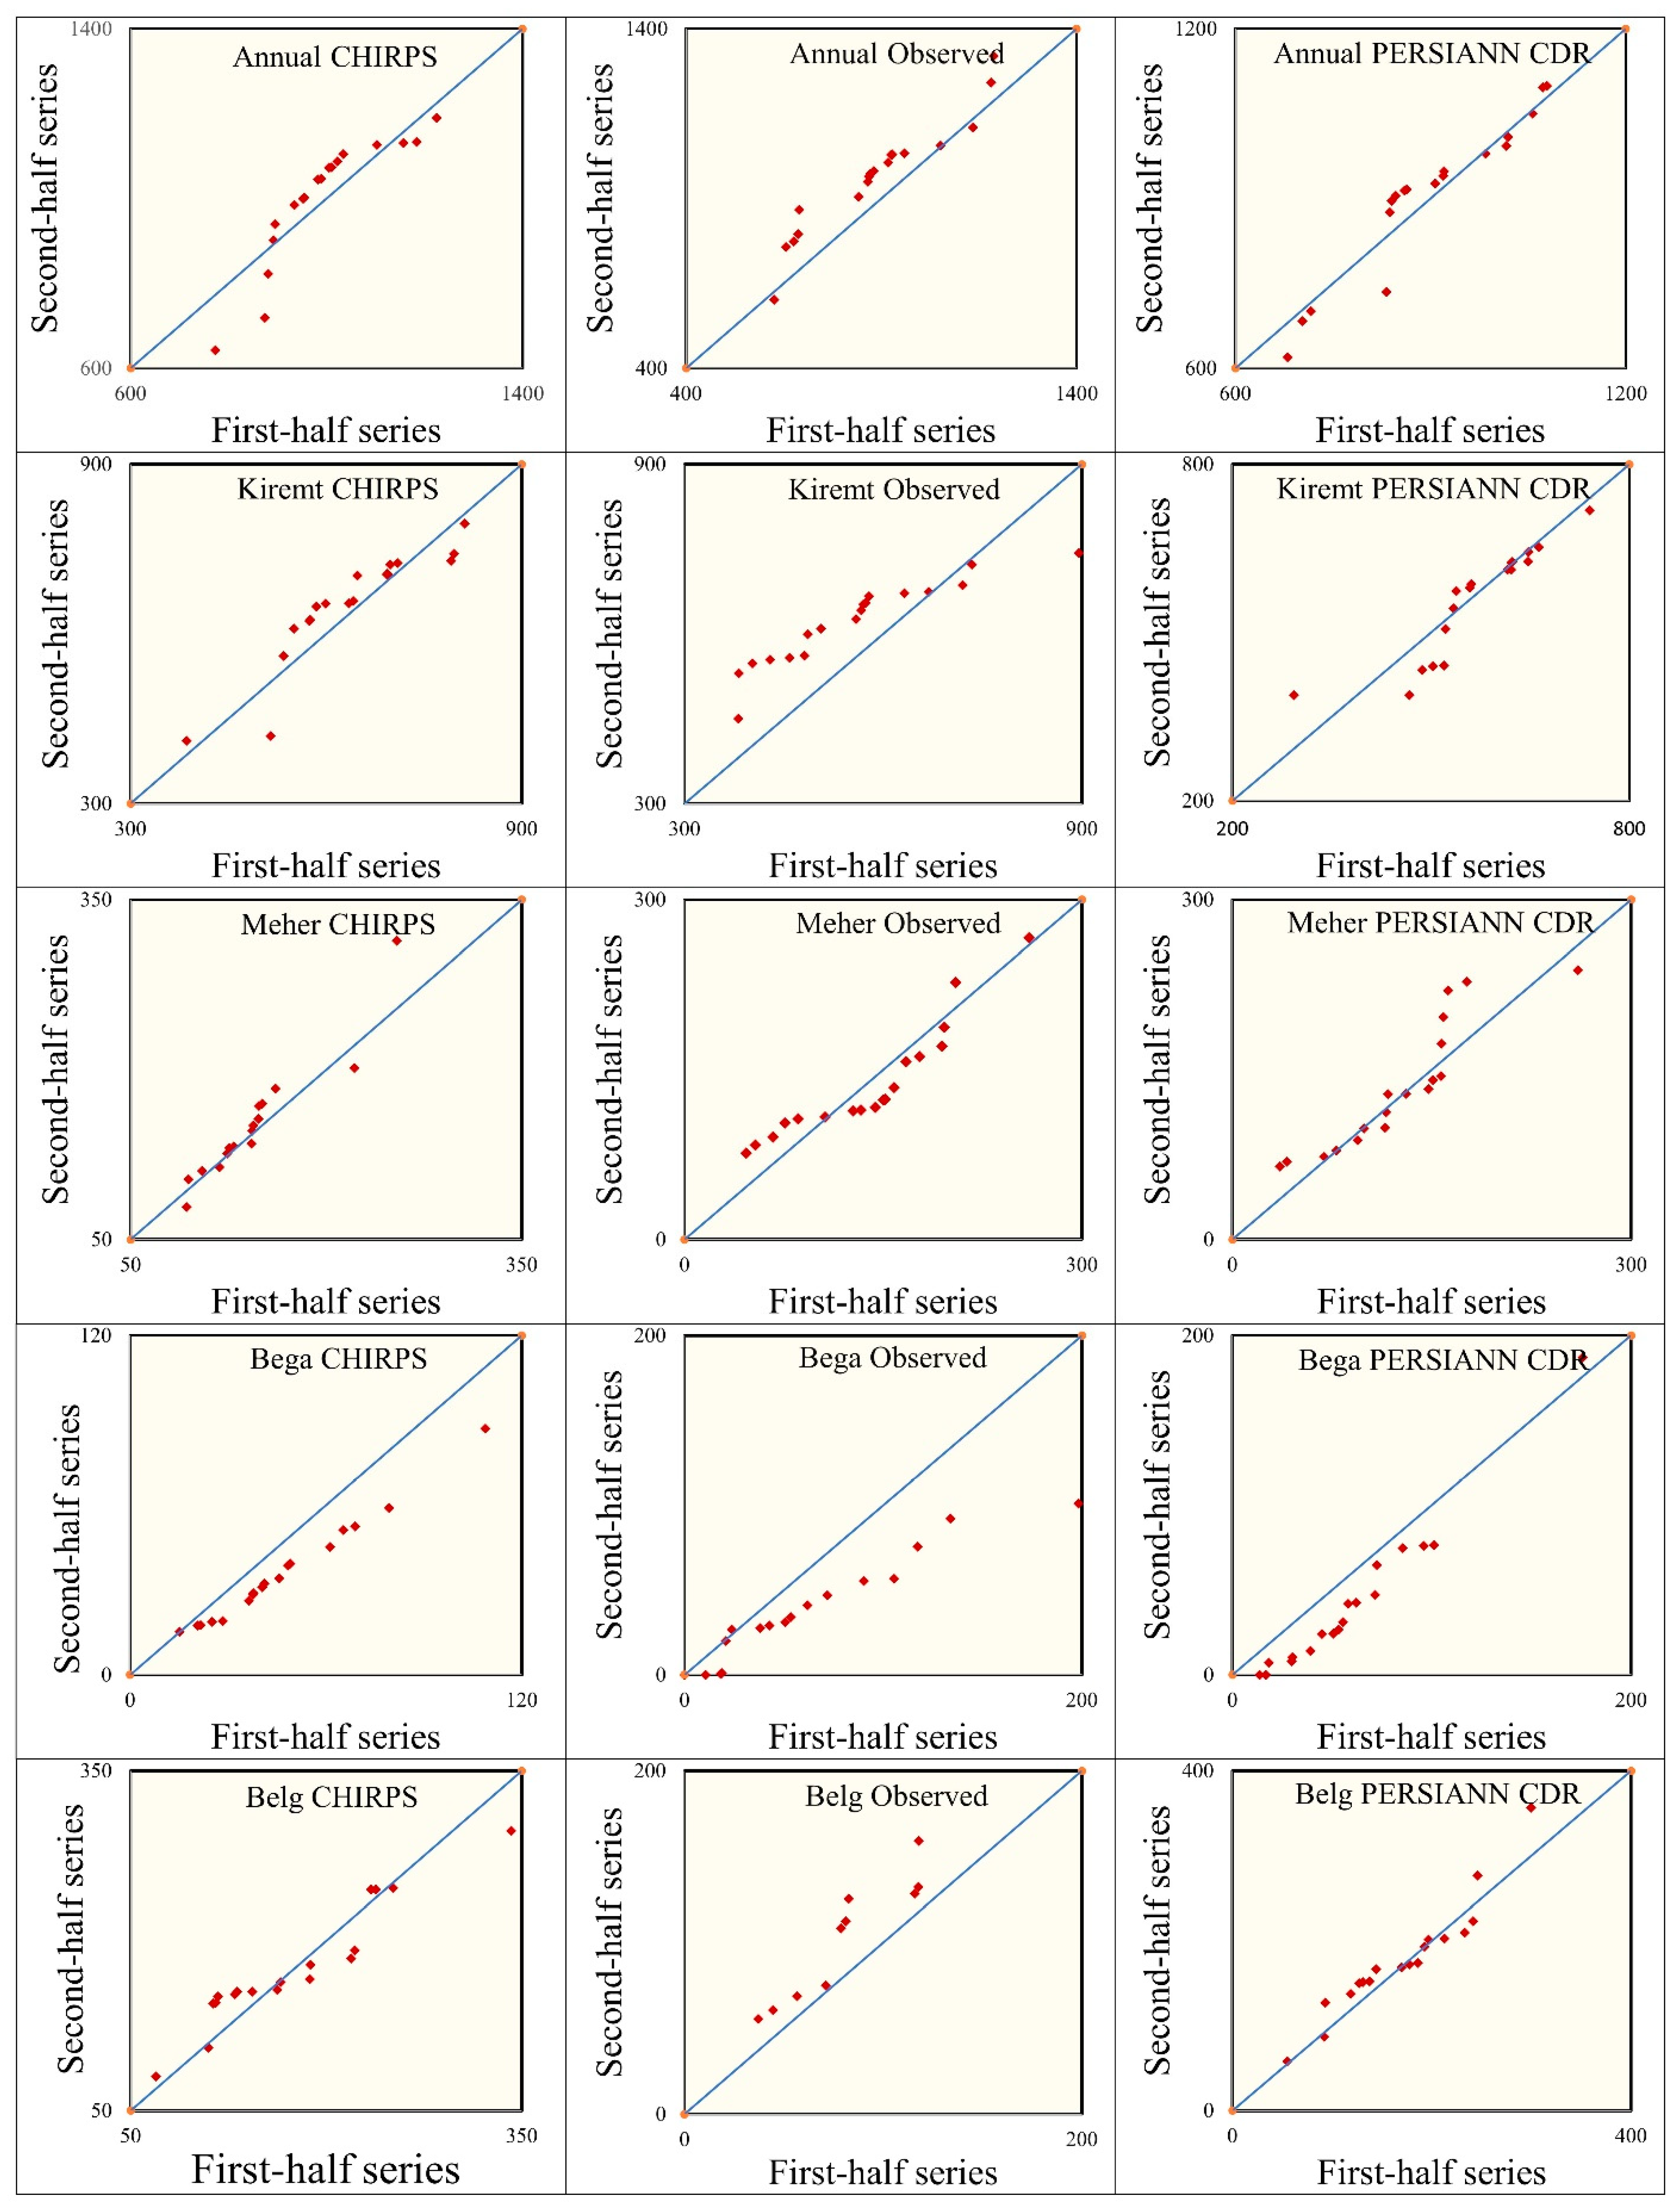
Figure 6.
Annual and seasonal trend of rainfall at Ejere station.
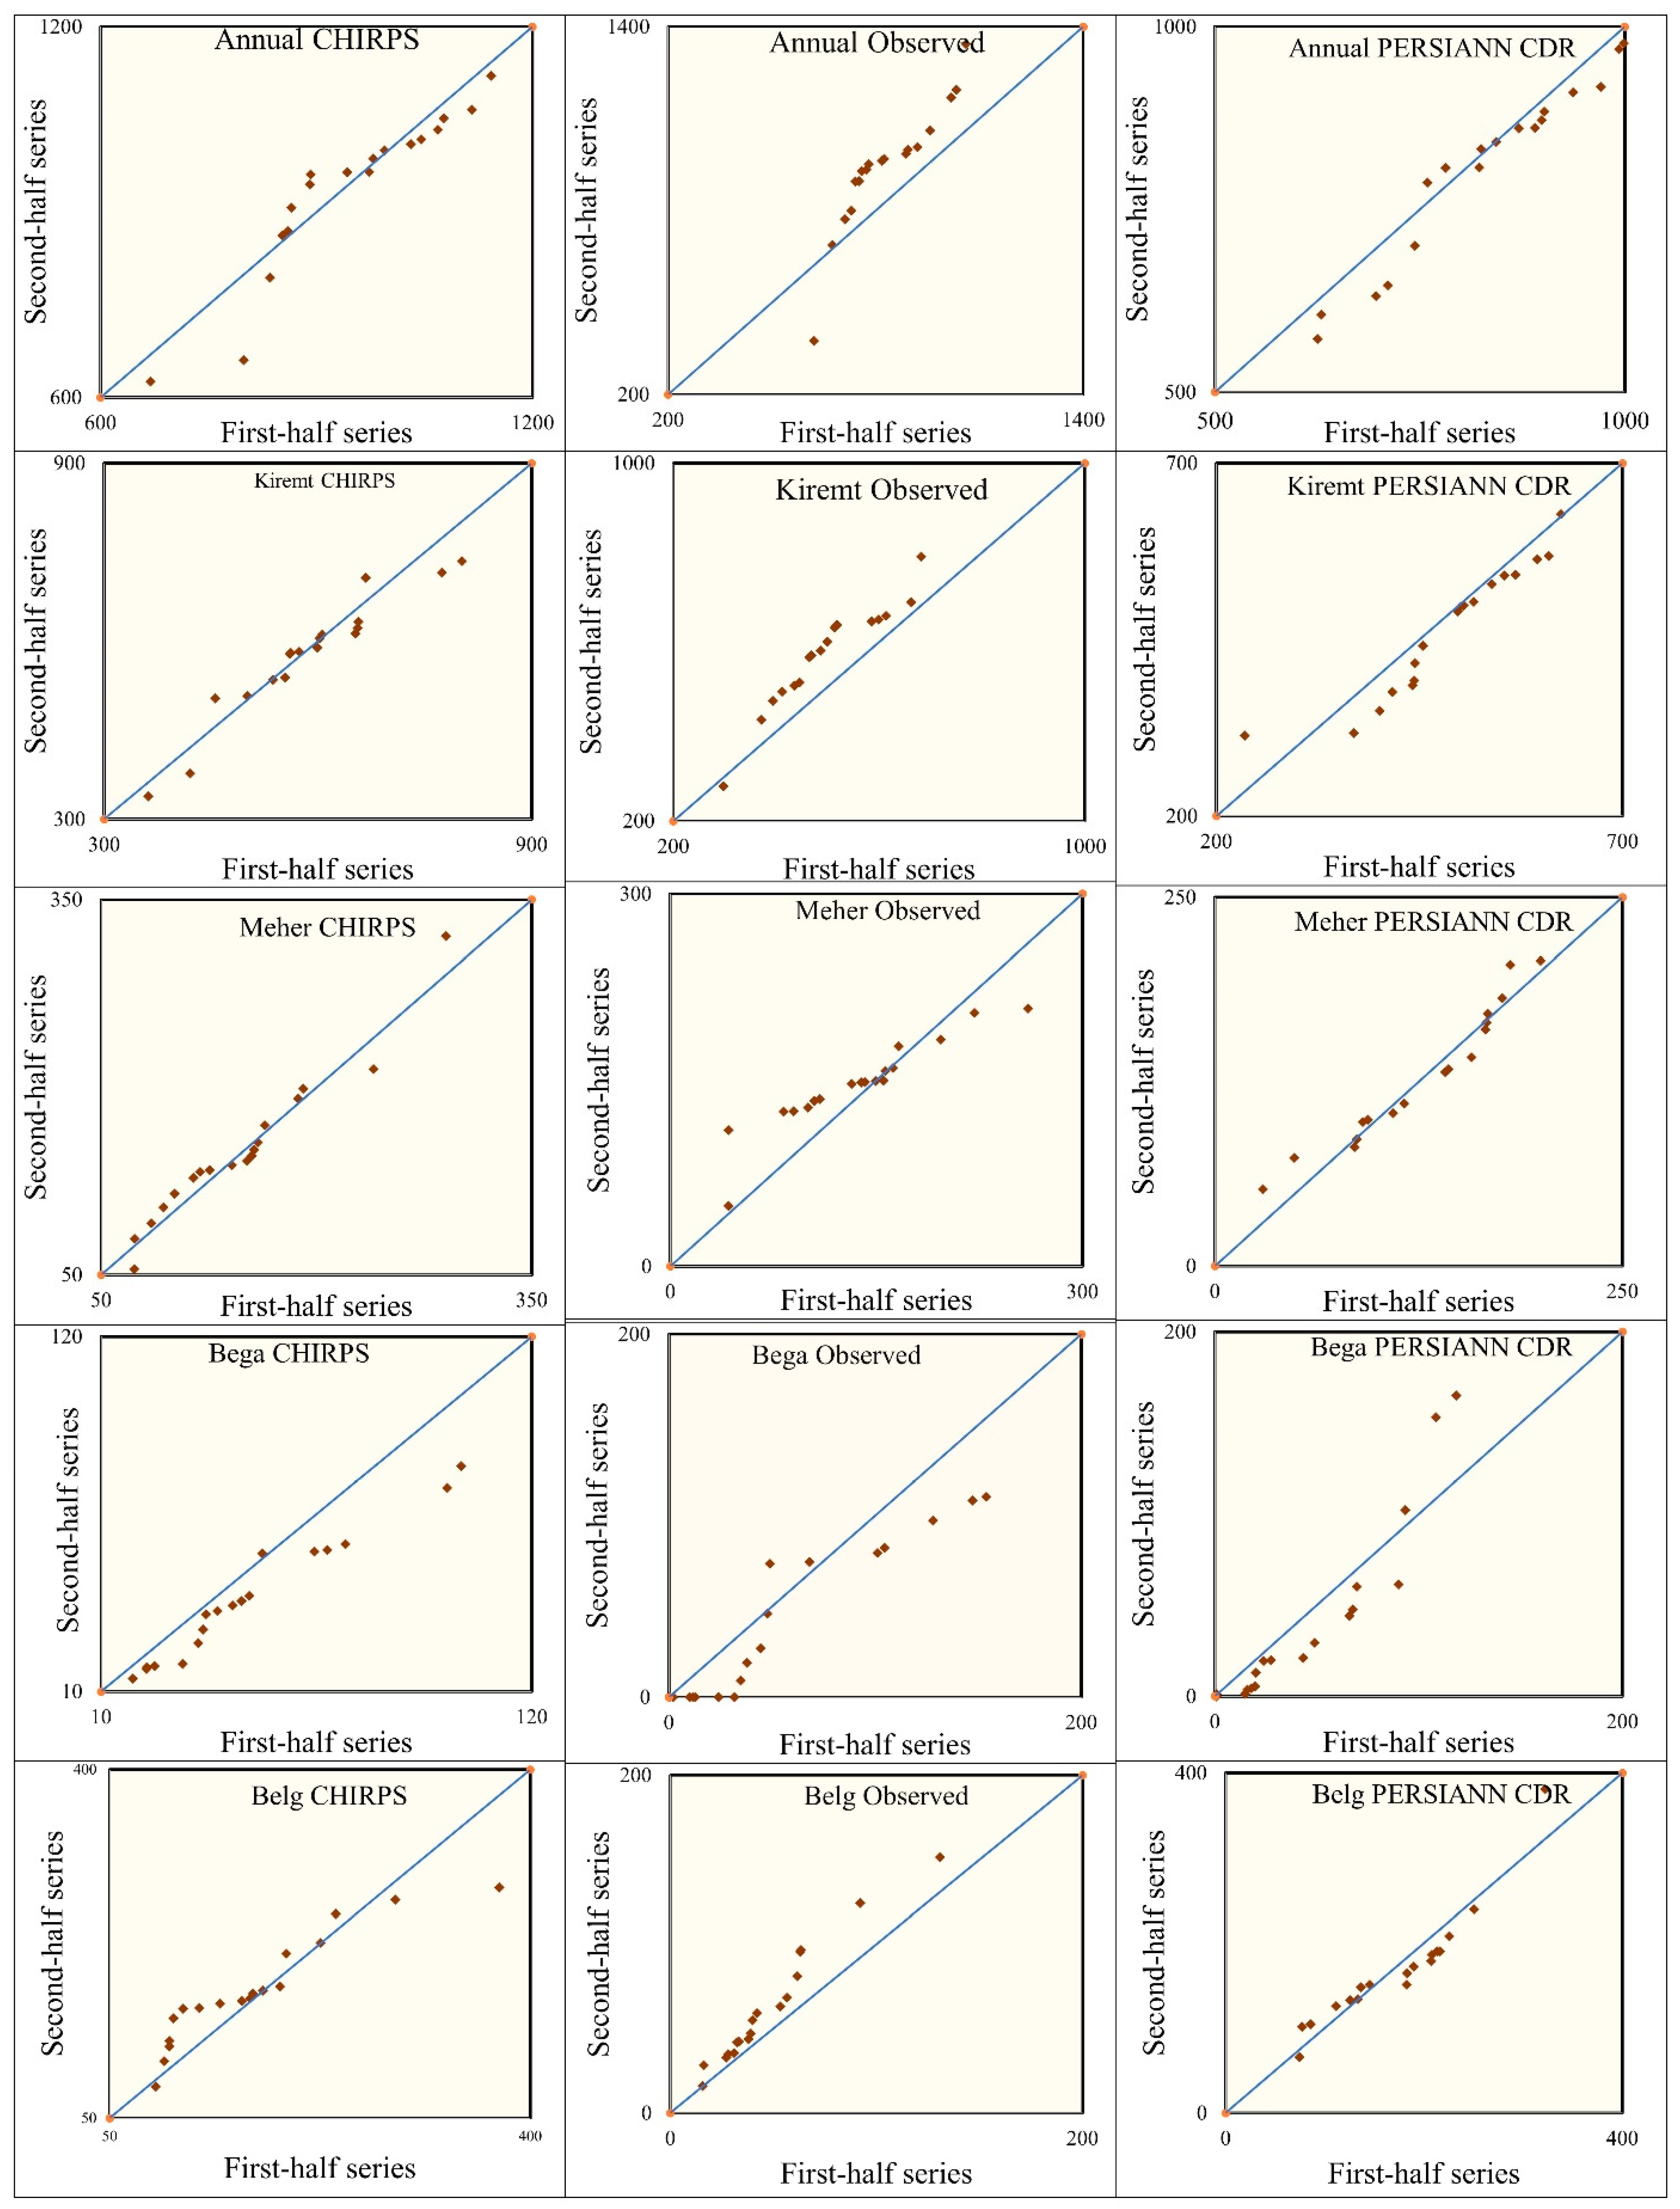
Figure 7.
Annual and seasonal precipitation trend at Modjo station.
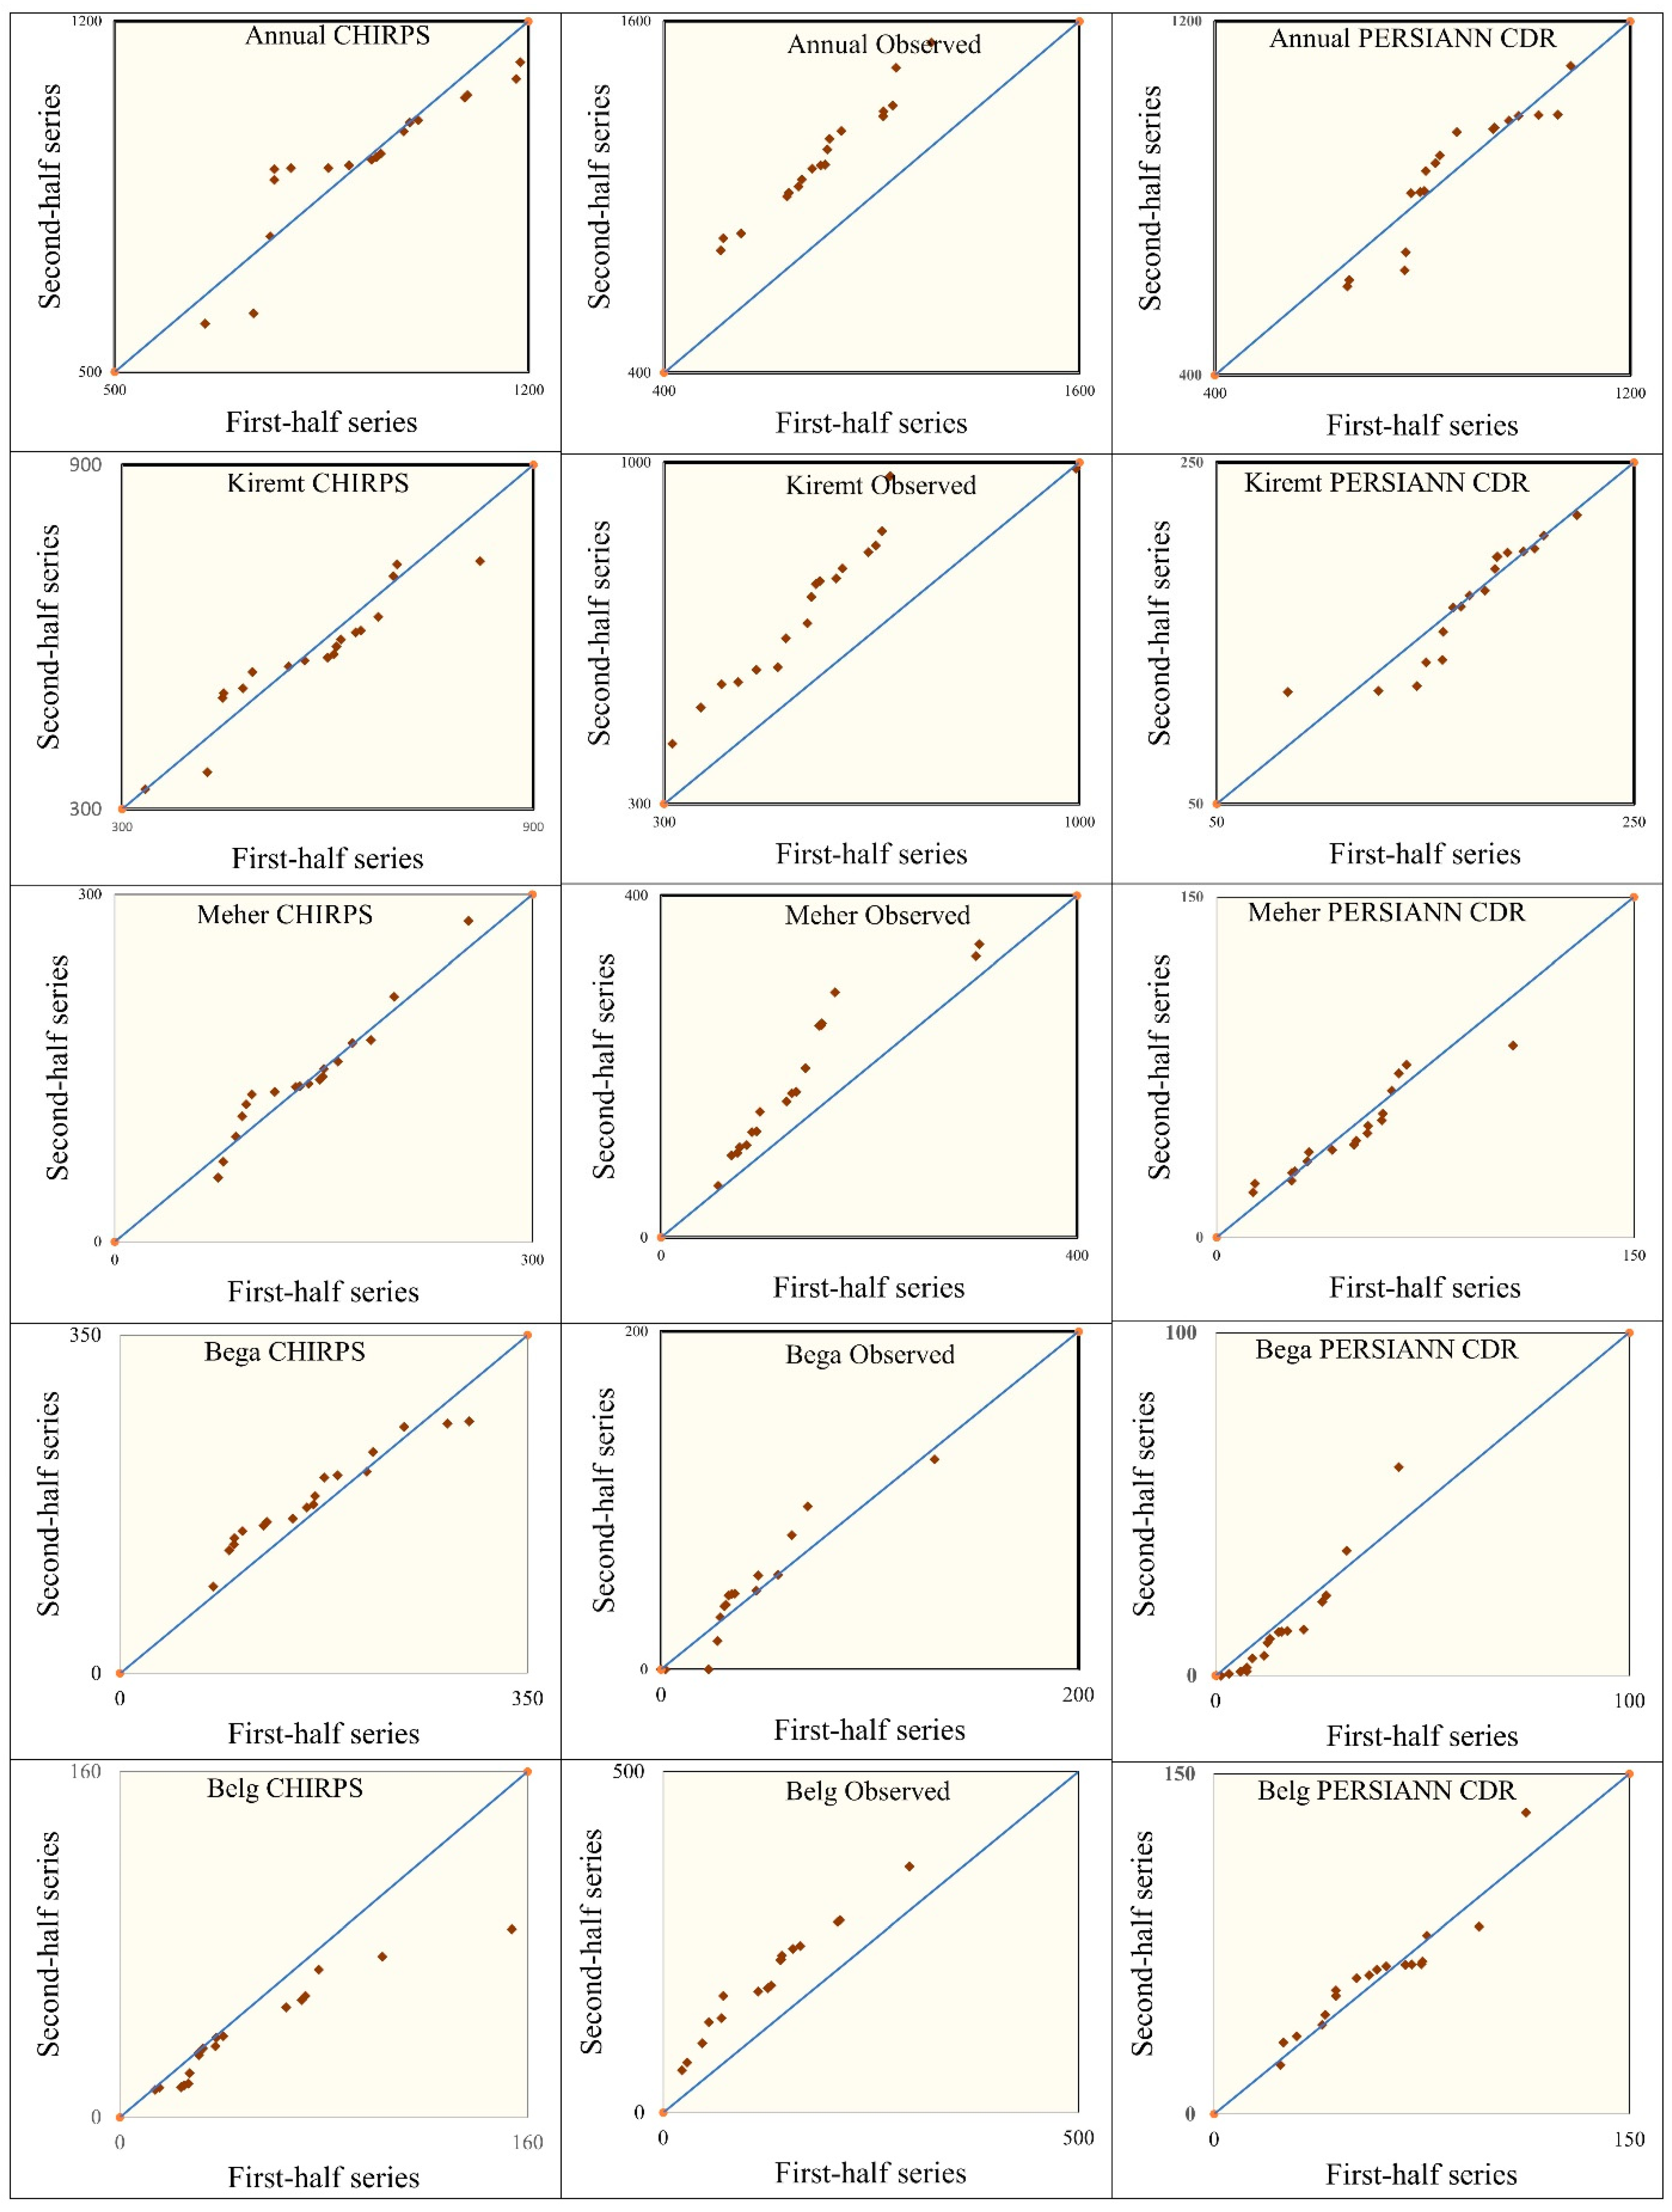

Table 1.
Description of data used.
| Ground observatory point data | ||||||||
| Station | Longitude (E) | Latitude (N) | Source | Period | Date of acquisition | |||
| Modjo | 8.622 | 39.114 | NMSA | 1989 - 2023 | 04/03/2024 | |||
| Ejere | 8.778 | 39.261 | ||||||
| Chefe Donsa | 8.972 | 39.128 | ||||||
| Gridded data | ||||||||
| Data Type | Extractor | period | Source | Resolution | Date of acquisition | |||
| CHIRPS | GEE | 1985 - 2020 | CHG | 0.05 | 13/03/2024 | |||
| PERSIANN-CDR | UCSB | 0.25 | ||||||
Table 2.
PCI and CV values for all precipitation datasets.
| Observed | ||||||||||
| Station | Annual | Kiremt | Meher | Bega | Belg | |||||
| CV | PCI | CV | PCI | CV | PCI | CV | PCI | CV | PCI | |
| CD | 18.98 | 17.96 | 18.9 | 37.74 | 38.8 | 73.27 | 112 | 47.32 | 63.3 | 34.36 |
| EJ | 20.27 | 17.16 | 21.3 | 38.99 | 33.35 | 62.14 | 143.21 | 43.94 | 58.87 | 34.29 |
| MJ | 22.91 | 17.96 | 27.19 | 38.3 | 55.19 | 59.61 | 106.63 | 47.46 | 59.39 | 33.64 |
| CHIRPS | ||||||||||
| Station | Annual | Kiremt | Meher | Bega | Belg | |||||
| CV | PCI | CV | PCI | CV | PCI | CV | PCI | CV | PCI | |
| CD | 13.21 | 18.63 | 16.26 | 38.89 | 34.88 | 67.42 | 68.26 | 46.17 | 34.13 | 33.83 |
| EJ | 13.44 | 17.6 | 18.17 | 39.07 | 39.14 | 60.71 | 69.56 | 44.56 | 37.51 | 33.51 |
| MJ | 15.89 | 17.05 | 19.63 | 37.49 | 34.68 | 62.43 | 76.31 | 49.22 | 39.95 | 33.71 |
| PERCIANN-CDR | ||||||||||
| Station | Annual | Kiremt | Meher | Bega | Belg | |||||
| CV | PCI | CV | PCI | CV | PCI | CV | PCI | CV | PCI | |
| CD | 14.45 | 17.32 | 17.39 | 37.94 | 41.73 | 64.63 | 123.42 | 40.52 | 36.82 | 33.89 |
| EJ | 14.59 | 15.79 | 19.08 | 37.15 | 40.3 | 62.9 | 136.09 | 35.28 | 38.69 | 33.75 |
| MJ | 15.78 | 15.95 | 19.04 | 36.45 | 44.64 | 65.52 | 130.46 | 38.07 | 40.19 | 33.94 |
Table 3.
MMK and value SSE value.
| Station | Period | Z-Statistics | MK Tau | Sun's Slope | ITAɸ | ITA Detection | |||
| Observed Precipitation | Chefe Donsa | Annual | -0.158 | -0.025 | -0.947 | 4.440 | Increasing | ||
| Kiremt | 0.858 | 0.101 | 2.450 | 3.474 | Increasing | ||||
| Meher | -0.558 | -0.066 | -0.708 | -0.099 | Decreasing | ||||
| Bega | -4.77(***) | -0.196 | -1.034 | -1.280 | Decreasing | ||||
| Belg | 0.074 | 0.009 | 0.157 | 2.523 | Increasing | ||||
| Ejere | Annual | 1.743 (**) | 0.204 | 4.817 | 6.078 | Increasing | |||
| Kiremt | 1.757 (**) | 0.206 | 3.250 | 4.231 | Increasing | ||||
| Meher | 1.403 | 0.165 | 4.817 | 0.577 | Increasing | ||||
| Bega | -3.67 (**) | -0.242 | -1.065 | -0.870 | Decreasing | ||||
| Belg | 0.610 | 0.073 | 0.240 | 0.785 | Increasing | ||||
| Modjo | Annual | 2.547 (**) | 0.298 | 9.530 | 15.356 | Increasing | |||
| Kiremt | 2.270 (**) | 0.266 | 6.980 | 8.420 | Increasing | ||||
| Meher | 1.620 | 0.190 | 1.430 | 2.731 | Increasing | ||||
| Bega | -0.726 | -0.085 | -0.113 | 0.185 | Increasing | ||||
| Belg | 1.484 | 0.175 | 2.264 | 4.020 | Increasing | ||||
| CHIRPS Precipitation products | Chefe Donsa | Annual | 0.395 | 0.047 | 0.976 | 0.468 | Increasing | ||
| Kiremt | 1.306 | 0.1206 | 1.4 | 0.778 | Increasing | ||||
| Meher | 0.095 | 0.012 | 0.094 | 0.299 | Increasing | ||||
| Bega | -2.765 (**) | -0.323 | -0.792 | -0.696 | Decreasing | ||||
| Belg | -0.068 | -0.009 | -0.115 | 0.07 | Increasing | ||||
| Modjo | Annual | -0.053 | -0.006 | -0.188 | -0.192 | Decreasing | |||
| Kiremt | -0.34 | -0.041 | -0.877 | -0.522 | Decreasing | ||||
| Meher | 0.204 | 0.025 | 0.176 | 0.219 | Increasing | ||||
| Bega | -2.05 (**) | -0.241 | -0.733 | -0.63 | Decreasing | ||||
| Belg | 0.595 | 0.057 | 0.524 | 0.739 | Increasing | ||||
| Ejere | Annual | -0.503 | -0.06 | -1.24 | -0.601 | Decreasing | |||
| Kiremt | -0.286 | -0.034 | -0.888 | -0.526 | Decreasing | ||||
| Meher | 0.367 | 0.044 | 0.4 | 0.13 | Increasing | ||||
| Bega | -2.301 (**) | -0.269 | -0.835 | -0.659 | Decreasing | ||||
| Belg | 0.204 | 0.0253 | 0.221 | 0.441 | Increasing | ||||
| PERSIANN CDR precipitation products | Chefe Donsa | Annual | -0.105 | -0.015 | -0.281 | 0.407 | Increasing | ||
| Kiremt | -0.531 | -0.063 | -0.786 | -0.522 | Decreasing | ||||
| Meher | 0.068 | 0.009 | 0.091 | 0.459 | Increasing | ||||
| Bega | -1.743 | -0.204 | -1.197 | -0.264 | Decreasing | ||||
| Belg | -0.045 | -0.006 | -0.060 | 0.482 | Increasing | ||||
| Modjo | Annual | -0.103 | -0.015 | -0.401 | -0.123 | Decreasing | |||
| Kiremt | -0.340 | -0.047 | -0.803 | -0.282 | Decreasing | ||||
| Meher | 0.068 | 0.009 | 0.080 | -0.255 | Decreasing | ||||
| Bega | -13.6(***) | -0.185 | -0.665 | -0.009 | Decreasing | ||||
| Belg | -0.137 | -0.015 | -0.154 | 0.344 | Increasing | ||||
| Ejere | Annual | -0.562 | -0.079 | -1.629 | -1.270 | Decreasing | |||
| Kiremt | -0.694 | -0.082 | -0.967 | -1.120 | Decreasing | ||||
| Meher | 0.367 | 0.044 | 0.295 | -0.020 | Decreasing | ||||
| Bega | -0.803 (**) | -0.095 | -0.366 | 0.537 | Increasing | ||||
| Belg | -0.443 | -0.047 | -0.529 | -0.182 | Increasing | ||||
(**) Trend is significant at a 95% confidence level, and (***) Trend is significant at a 99% confidence level.
Disclaimer/Publisher’s Note: The statements, opinions and data contained in all publications are solely those of the individual author(s) and contributor(s) and not of MDPI and/or the editor(s). MDPI and/or the editor(s) disclaim responsibility for any injury to people or property resulting from any ideas, methods, instructions or products referred to in the content. |
© 2024 by the authors. Licensee MDPI, Basel, Switzerland. This article is an open access article distributed under the terms and conditions of the Creative Commons Attribution (CC BY) license (http://creativecommons.org/licenses/by/4.0/).
Copyright: This open access article is published under a Creative Commons CC BY 4.0 license, which permit the free download, distribution, and reuse, provided that the author and preprint are cited in any reuse.


